147
Extending > LEADERSHIP < Creating > VALUE 2013 Annual Report
| Date post: | 09-Jul-2016 |
| Category: |
Documents |
| Upload: | late-artist |
| View: | 231 times |
| Download: | 3 times |

Extending > LE A DERSH IP < Creating > VA LuE 2013 Annual Report

(in thousands, except per share data) 2013 2012 2011
Service Revenues $3,808,340 $3,692,298 $3,294,966
Adjusted Income from Operations 504,098 445,430 398,420
Adjusted Net Income 268,940 208,931 191,005
Free Cash Flow1 305,024 264,365 85,274
Diluted Adjusted Net Income Per Share $2.10 $1.77 $1.62
Diluted Weighted Average Common Shares 127,862 117,796 117,936
1 Calculated as Cash Provided from Operating Activities ($397,370 in 2013, $335,701 in 2012 and $160,953 in 2011) less Capital Expenditures ($92,346 in 2013, $71,336 in 2012, and $75,679 in 2011).
See inside back cover for reconciliation of GAAP to Non-GAAP metrics for Adjusted Income from Operations and Adjusted Net Income.
Financial Highlights
Quintiles Financial Highlights
1 Adjusted service revenues excludes service revenues of $64,198 in 2010 for the deconsolidation of PharmaBio.2 See inside back cover for reconciliation of net income to adjusted EBITDA.3 Book-to-bill is calculated as net new business divided by adjusted service revenues.
Adjusted Service Revenues (1) ’10 – ’13 CAGR = 8.3%
2010 2011 2012 2013
Backlog and Book-to-Bil l (1,3 )
$ M
illi
on
s
1.19x1.23x 1.22x
1.29x
$9,855
$8,705$7,973
$7,115
10,000
8,000
6,000
4,000
2,000
02010 2011 2012 2013
0
Net New Business ’10 – ’13 CAGR = 11.3%
$3,552
$4,044
$4,501
$4,899
1,000
2,000
3,000
4,000
5,000
$ M
illi
on
sAdjusted EBITDA (2)
’10 – ’13 CAGR = 9.7%
2010 2011 2012 2013
$ M
illi
on
s
0
800
700
$463$490
$544
$612
200
400
600
500
300
100
$ M
illi
on
s
4,000
3,000
2,000
1,000
02010 2011 2012 2013
$2,997$3,295
$3,692 $3,808
500
1,500
2,500
3,500

I am pleased to write to you regarding Quintiles’ first year as a public company and our prospects
for the future. 2013 was a strong year, and we have entered 2014 with good momentum.
Founded in 1982, Quintiles leverages investments and innovation put into place years prior,
while continuing to reinvent practices and competitive advantages. For instance, the company’s
foresight to enter Japan in 1993, and both India and China in 1997, provides a depth of capabil-
ity and knowledge for multinationals and local organizations today that is unmatched among
our competitors. Our history of consistent investment in innovation and anticipation, such as our
Quintiles Infosario® technology platform of services, has resulted in a set of competitive advan-
tages in an industry founded on the need for change.
My deep belief is that if we serve our customers exceptionally well and we anticipate and deliver
against their needs and increase their probability of success, we will deliver meaningful returns
and serve all our stakeholders well, including investors, our employees and the patients who
ultimately benefit from our customers’ success.
2013 demonstrated that our philosophy of improving customers’ probability of success drives
business success. Our backlog increased by 13.2%, giving investors a strong view of future
revenues. Our adjusted net income growth for the year was 28.7% with adjusted income
from operations margin that expanded by 110 basis points. The deep and diverse customer
relationships we have built certainly are a source of pride. In 2013, we had over 500 biopharma-
ceutical customers, 10 from whom we earned at least $100 million in service revenues. This
level of spend is a reflection of their confidence in us.
Our success enables us to attract the industry’s top talent and win many accolades. We
received more than 330,000 employment applications last year, hiring more than 7,000
people around the world.
After receiving nine individual Great Place to Work® awards in 2013, Quintiles was again recognized as one of the world’s “Best Multinational Workplaces” by Great Place to Work®.
We have been named to the InformationWeek 500 five times for our innovative use of technology.
Quintiles has been named “Best CRO” by SCRIP and received the Eagle Award from the Society
for Clinical Research Sites. We have exceptional people focused on customers’ success deliver-
ing quantifiable results. In the next few pages, I provide a deeper view of your company.
By the NumbersQuintiles’ industry leadership was demonstrated financially in 2013:
Net New Business—We finished the year with $4.9 billion of net new business which generated a
13.2% increase in our backlog across the business, to a record $9.9 billion dollars. Our book-to-bill
ratio, which is a measure of net new business growth compared to adjusted service revenues,
represented the highest book-to-bill ratio in the past six years at 1.29 times adjusted service
revenues compared to our historical five-year average of 1.23 times adjusted service revenues.
Dear Fellow Investors:
QUINTILES AR 2013
1
2013 Performance
Backlog of $9.9 billion
Service Revenues of $3.8 billion
28.7% growth of Adjusted Net Income
1.29 Book-to-bill ratio

Revenues—For the year, our service revenues finished at $3.8 billion representing constant
currency growth of 5.1%. This growth was achieved despite the wind down of our largest clinical
project ever and a large consulting services rescue project. Finishing the year, we saw nice
momentum in the fourth quarter as we exceeded the $1 billion quarterly service revenue mark
for the first time in the history of our company.
Margins—We improved our “best in industry” adjusted operating margins delivering adjusted
net income of $268.9 million, growth of 28.7%. Contributing to adjusted net income growth was
the expansion of adjusted income from operations margin, foreign currency tail winds, a reduction
in the current-year effective income tax rate and reduced interest expense due to lower interest
rates and reduced debt levels.
Earnings Per Share—For the year, diluted adjusted earnings per share grew 18.6% to $2.10 per
share compared with $1.77 per share in 2012.
Cash Flow—Our cash balance was $778.1 million at the end of 2013 compared to $567.7 million
at the end of 2012. We ended 2013 with $305.0 million in free cash flow, a 15.4% improvement
over 2012.
Geographic Distribution—We have the broadest global reach in our industry as evidenced
by the diversification of our service revenues with the North America and Latin America region
representing 40%; the Europe, Middle East, and Africa region representing 39%; and the Asia
Pacific region representing 21% of our total consolidated service revenues.
Leadership in Growing MarketsThe healthcare landscape is becoming increasingly integrated and complex at its core. New
collaborative models are emerging, and there is increasing demand for evidence to improve
decision making from early go or no-go decisions through regulatory approval and beyond to
payer decisions. Within our core biopharmaceutical customers, the lines between R&D and
Commercial are blurring. There is greater collaboration between biopharmaceuticals, payers and
providers. At the same time, scientific and therapeutic advances offer the hope of new treatments
for patients and the medical community alike, and must be available at a price that individuals
and society can afford. The way the industry is unfolding plays to our strengths.
The markets in which we operate are growing as customers seek new ways to improve their
probability of success. Given the combination of growth of R&D spending and increased out-
sourcing penetration, we believe the market for development services is growing between 6–8%
per year. Based on our new business growth, we believe Quintiles is capturing a disproportionately
large share of that estimated $93 billion market. The market for commercial services is similarly
sized at over $90 billion. While it is difficult to estimate growth in this segment, we believe it is
also growing at a similar rate.
In addition to our leadership position in each of our segments, Quintiles’ ability to bring commercial realities into development approaches and our ability to bring thera peutic expertise into our commercial solutions sets us apart.
Diversified Customer Base
51% of 2013 net new business came
from outside the top-20 pharmaceutical
companies.
No single customer represented 10%
or greater of our service revenues.

Product DevelopmentOur Product Development segment, when measured as a contract research organization
(CRO), is the largest as ranked by reported 2013 service revenues. The segment focuses pri-
marily on Phase II–IV clinical trials and associated laboratory, analytical and data management
activities. Organic growth is the focus, but selected acquisitions, such as Novella Clinical in
2013, supplement the capabilities of this business.
In fact, as the industry leader, we believe Quintiles is much more than a CRO. Our Product
Development segment provides services and expertise that allow biopharmaceutical companies
to improve and deliver the clinical development process from first-in-man trials to post-launch
monitoring. Our focus comes after pre-clinical testing, bringing the ability to consult, design and
execute strategies for drug development and the collection of evidence for approval and reim-
bursement of drug therapies and medical devices.
Quintiles’ comprehensive service offerings provide the expertise and delivery necessary at each
stage of development, as well as the systems and analytical capabilities to help our customers
optimize product development. We can provide services or manage the entire clinical develop-
ment process.
Our scale and investments have provided us significant advantages. We have a greater amount
of drug development expertise than competitors, and our technology has consistently been
recognized for its innovation in the clinical space, including the Computerworld Data+ Editor’s
Choice Award for our Quintiles Infosario® platform.
I’m really proud of our strong net new business for Product Development with a 2013 book-to-bill
ratio of 1.29 during a period which saw Quintiles sign a number of sole-provider and other
strategic deals. In some instances, we were informed that we were the only company with the
breadth and depth to partner in this way.
The future looks strong with total company backlog of approximately $9.9 billion.
Pricing remains a challenge in many areas of this segment, but in our view, has neither improved
nor deteriorated. Hence, we continue to look to price where we are differentiated, but also
implement strategies to improve our operating costs to remain competitive.
Product Development accounted for 77% of Quintiles’ service revenues in 2013, three percent-
age points greater than in 2012. For the year, Product Development’s income from operations
growth was 17.7%, increasing to $562.3 million. The income from operations margin for the year
finished at 19.3%, representing 180 basis points of margin improvement.
QUINTILES AR 2013
3

Integrated Healthcare Services Quintiles’ Integrated Healthcare Services (IHS) segment primarily partners with biopharmaceutical
and healthcare customers focused on real world evidence gathering, commercialization and
effective prescribing of approved treatments. It is the world’s leading commercial pharmaceutical
sales and service organization, and provides world-class, real-world/late-phase capabilities.
IHS performs a wide range of commercial services such as contract pharmaceutical sales in
key geographic markets and market access. Additional services include consulting, evidence
gathering and signal detection services for the broader biopharmaceutical sector in connection
with support for post-approval evaluation as well as payer and provider needs.
In this segment, our teams are renowned for their combination of expertise and “feet on the
street.” We have literally written the book on research around comparative effectiveness, provide
leading software for creating registries, and we provide resources that not only detail to doctors,
but help both doctors and patients understand medical solutions and assist with adherence.
This segment is undergoing what I call “transformation”—we are creating service offerings that
yield greater value for customers.
Phase I Phase II Phase III Phase IV
Commercial Healthcare Delivery
Product Development Services 93% of Operating Profit
Integrated Healthcare Services (“IHS”) 7% of Operating Profit
Commercial Focused Services
Late Phase / Observational
Consulting Market Access
Other Healthcare Solutions
Project Management & Clinical Monitoring
Clinical Trial Support (Central Lab, Biostatistics,
Data Management, Technology etc.)
Product Development Consulting (Strategic Planning & Design)
Late Phase Interventional
Product Development Approval Integrated Healthcare Services

We had very strong net new business in the second half of 2013, creating a strong book-to-bill
ratio of 1.27 for the year, a six-year high. During 2013, IHS service revenues declined 2.9% at
constant currency to $888.6 million. IHS service revenues in 2013 were impacted by low new-
business wins in the first half of the year, and negative scope modifications and cancellations
from fourth quarter 2012 and second quarter 2013. This was partially offset by revenue growth
in excess of 20% from our Real World and Late Phase Research unit.
Our 2013 IHS service revenues growth and margin performance were not where we wanted them
to be. Still, we are optimistic for IHS in 2014 as our net new business from 2013 exceeded our
plans for the year, positioning us well with a number of important wins.
Leadership AdvantagesWe draw on strong competitive advantages which include the deepest and most comprehensive
medical and therapeutic expertise, including more than 950 medical doctors. Our scientific and
mathematical expertise includes over 900 Ph.D. holders. We have industry-leading technology
where we leverage a first-mover advantage from investments begun in the last decade.
Quintiles’ global workforce can deliver with an effectiveness and cost that is unmatched among our competitors.
More than 3,000 of our 28,000+ employees have authored professional papers or books. We
have profound experience in our field, the ability to conduct business in more than 100 countries,
and the advanced technologies necessary to automate processes globally and analyze moun-
tains of healthcare data. Of the new molecular entities and new biologic applications approved
from 2004 through 2012, we have helped develop or commercialize 97% of the central nervous
system drugs, 93% of the oncology drugs and 89% of the cardio vascular drugs.
Our strategic agenda keeps us focused and includes:
•Investinginofferingsandassetsthatleverageourscaleandcreatevaluefor
our customers
•Leadingwithworld-class,customerrelationshipmanagement
•Focusandmetricsaroundquality,productivityand“proactive”deliverymanagement
•Investinginourpeopleforleadershipdevelopmentandahigh-performanceworkforce
2013 was a remarkable year for Quintiles in many ways. We underscored our position as the
industry leader—we are 1.6 times the size of the next-largest publicly traded competitor based
on reported 2013 consolidated service revenues. Quintiles has a leadership team in place to
guide the company in the future, benefiting from a deep bench of skilled executives, each with
at least 25 years of experience. This team executes our strategy on a day-to-day basis while
working tirelessly to deliver value to customers.
Improving Customers’
Success
We have provided services in connec-
tion with the development or commer-
cialization of the top-50 best-selling
biopharmaceutical products and the
top-50 best-selling biologic products
in the world.
QUINTILES AR 2013
5

Before leaving this section, I would be remiss if I did not mention the strength and opportunity
around the company’s selling, general and administrative expenses (SG&A). We invest in, and
have, the strongest sales capability in our industry. This group generates a strong pipeline of
opportunities, not only in response to customer requests, but also proactively. In addition, our
functional and operational executives are driving a series of initiatives aimed at reducing SG&A
as a percentage of service revenues, and making us more competitive from a cost standpoint. In
the global services industry, this focus is critical for our value proposition, so we drive it.
Positioned for Growth by Increasing Customers’ Probability of SuccessLooking to the future, I am pleased with our position. Our markets are growing as our customers
transform. We believe we are capturing an outsized share of new business. We have the most
advanced offerings and capabilities in our industry and strong initiatives to improve operations
and SG&A. We are well positioned to leverage our scale and cultural strengths.
The key to capturing above-market growth—to increasing our addressable market—and gener-
ating improved profitability lies in increasing the probability of our customers’ success. When
they succeed, we succeed. More importantly, patients will benefit.
Our underlying motivation is to make our own dent in the global burden of disease. It is reflected in our vision, “We bring people and knowledge together for a healthier world.”
I believe that culture can create a sustainable, competitive advantage, pairing intellect and
innovation with practical application. Quintiles is a special organization with such a culture. Our
opportunities abound, and we are committed to making good on the promise we make each
day to customers, employees, patients and you.
TOM PIkE
CHIEF ExECUTIVE OFFICER

STRONG FREE CASH FLOW: Allows for continued investment
LONG-TERM, CONSISTENT FINANCIAL PERFORMANCE: Stable, known quantity
BEST-IN-INDUSTRY OPERATING MARGINS: Make Quintiles an even better partner
FORWARD-LOOkING REVENUE VISIBILITY: Largest backlog in industry
DEEP AND DIVERSE CUSTOMER RELATIONSHIPS: With no customer contributing 10% or more of service revenues
GEOGRAPHICALLY DIVERSIFIED REVENUE BASE: Not dependent on any single region
MARkET LEADER IN PRODUCT DEVELOPMENT SERVICES: 1.6x the size of our nearest publicly traded competitor
FIRST-MOVER ADVANTAGE: With Clinical Development Informatics technology in the CRO industry
SERVE AN ATTRACTIVE & GROWING MARkET: Prospects for continued growth are strong
Strong Leadership Position
QUINTILES AR 2013
7

Board of Directors (pictured below)
Dennis Gillings, CBE, Ph.D., Executive Chairman
Thomas H. Pike, Chief Executive Officer
Fred E. Cohen, M.D., D.Phil., F.A.C.P.,(3) Partner, TPG
John P. Connaughton,(2) Managing Director, Bain Capital
Jonathan J. Coslet,(2) Senior Partner and
Chief Investment Officer, TPG
Michael J. Evanisko, Chair of Compensation and Talent Development
Committee,(1)(2)(3)(4) Chairman, PARx Solutions, Inc.
Mireille Gillings, Ph.D.,(3) Chief Executive Officer, President,
Director, HUYA
Christopher R. Gordon,(3) Managing Director, Bain Capital
Jack M. Greenberg, Chair of Audit Committee,(1)(2)(4) Chairman,
The Western Union Company
Richard Relyea,(2)(3) 3i North American Private Equity
Leonard D. Schaeffer, Chair of Governance, Quality and Nominating
Committee,(1)(3)(4) Senior Advisor, TPG
Corporate Governance
Legend
(1) Audit Committee
(2) Compensation and Talent Development Committee
(3) Governance, Quality and Nominating Committee
(4) Independent Director
Executive Officers
Dennis Gillings, CBE, Ph.D., Executive Chairman
Thomas H. Pike, Chief Executive Officer
kevin k. Gordon, Executive Vice President and Chief Financial Officer
Michael I. Mortimer, Executive Vice President, Human Resources and Corporate Administration
Derek M. Winstanly, MBChB, Executive Vice President, Chief Customer and Governance Officer
James H. Erlinger III, Executive Vice President, General Counsel and Secretary
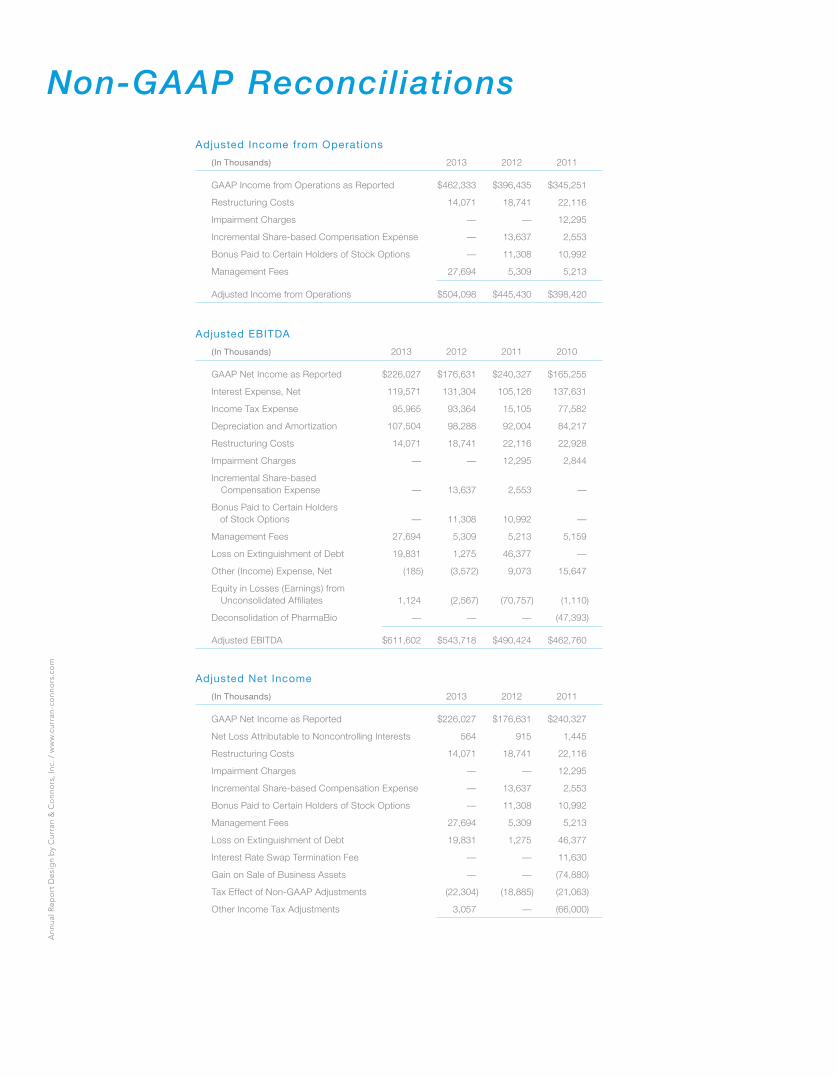
Adjusted Income from Operations
Adjusted EBITDA
Adjusted Net Income
(In Thousands) 2013 2012 2011
GAAP Income from Operations as Reported $462,333 $396,435 $345,251
Restructuring Costs 14,071 18,741 22,116
Impairment Charges — — 12,295
Incremental Share-based Compensation Expense — 13,637 2,553
Bonus Paid to Certain Holders of Stock Options — 11,308 10,992
Management Fees 27,694 5,309 5,213
Adjusted Income from Operations $504,098 $445,430 $398,420
(In Thousands) 2013 2012 2011 2010
GAAP Net Income as Reported $226,027 $176,631 $240,327 $165,255
Interest Expense, Net 119,571 131,304 105,126 137,631
Income Tax Expense 95,965 93,364 15,105 77,582
Depreciation and Amortization 107,504 98,288 92,004 84,217
Restructuring Costs 14,071 18,741 22,116 22,928
Impairment Charges — — 12,295 2,844
Incremental Share-based Compensation Expense — 13,637 2,553 —
Bonus Paid to Certain Holders of Stock Options — 11,308 10,992 —
Management Fees 27,694 5,309 5,213 5,159
Loss on Extinguishment of Debt 19,831 1,275 46,377 —
Other (Income) Expense, Net (185) (3,572) 9,073 15,647
Equity in Losses (Earnings) from Unconsolidated Affiliates 1,124 (2,567) (70,757) (1,110)
Deconsolidation of PharmaBio — — — (47,393)
Adjusted EBITDA $611,602 $543,718 $490,424 $462,760
(In Thousands) 2013 2012 2011
GAAP Net Income as Reported $226,027 $176,631 $240,327
Net Loss Attributable to Noncontrolling Interests 564 915 1,445
Restructuring Costs 14,071 18,741 22,116
Impairment Charges — — 12,295
Incremental Share-based Compensation Expense — 13,637 2,553
Bonus Paid to Certain Holders of Stock Options — 11,308 10,992
Management Fees 27,694 5,309 5,213
Loss on Extinguishment of Debt 19,831 1,275 46,377
Interest Rate Swap Termination Fee — — 11,630
Gain on Sale of Business Assets — — (74,880)
Tax Effect of Non-GAAP Adjustments (22,304) (18,885) (21,063)
Other Income Tax Adjustments 3,057 — (66,000)
Non-GAAP ReconciliationsA
nnua
l Re
po
rt D
esi
gn
by
Cur
ran
& C
onn
ors
, Inc
. / w
ww
.cur
ran
-co
nno
rs.c
om

Corporate InformationQuintiles Transnational Holdings Inc.
4820 Emperor Boulevard
Durham, North Carolina 27703
Telephone: 919.998.2000
Securities InformationThe Company’s common stock began trading on
May 9, 2013, on the New York Stock Exchange
under the ticker symbol “Q.”
SEC Form 10-K Available to ShareholdersA copy of the Company’s Form 10-K and addi-
tional investor materials may be obtained on the
U.S. Securities and Exchange Commission (SEC)
website at www.sec.gov.
Investor Relations919.998.2590
Email: [email protected]
Investor Relations materials for Quintiles
Transnational Holdings Inc. can be obtained
online at www.quintiles.com/investor.
Transfer Agent American Stock Transfer & Trust Company, LLC
6201 15th Avenue
Brooklyn, New York 11219
Telephone: 800.937.5449 or 718.921.8124
www.amstock.com
Independent Registered Public AccountantsPricewaterhouseCoopers L.L.P.
Raleigh, North Carolina
Legal CounselSmith, Anderson, Blount, Dorsett, Mitchell
& Jernigan, L.L.P.
Raleigh, North Carolina
Forward-Looking Statements This report contains certain “forward-looking statements” concerning projected future financial performance and expected plans for future operations to assist investors
in gaining a better understanding of Quintiles. For a discussion of factors which could cause results to differ materially from such statements, please refer to the section
entitled “Risk Factors” in Quintiles’ 2013 Form 10-K.

UNITED STATESSECURITIES AND EXCHANGE COMMISSION
Washington, D.C. 20549
FORM 10-K(Mark One)
È ANNUAL REPORT PURSUANT TO SECTION 13 OR 15(d) OF THESECURITIES EXCHANGE ACT OF 1934
For the fiscal year ended December 31, 2013or
‘ TRANSITION REPORT PURSUANT TO SECTION 13 OR 15(d) OF THESECURITIES EXCHANGE ACT OF 1934
For the transition period from to .Commission File Number: 001-35907
QUINTILES TRANSNATIONAL HOLDINGS INC.(Exact name of registrant as specified in its charter)
North Carolina 27-1341991(State or other jurisdiction of
incorporation or organization)(I.R.S. Employer
Identification Number)4820 Emperor Blvd., Durham, North Carolina 27703
(Address of principal executive offices and Zip Code)(919) 998-2000
(Registrant’s telephone number, including area code)
Securities registered pursuant to Section 12(b) of the Act:Title of Each Class: Name of Each Exchange on which Registered
Common Stock, par value $0.01 per share New York Stock ExchangeSecurities registered pursuant to Section 12(g) of the Act: None
Indicate by check mark if the registrant is a well-known seasoned issuer, as defined in Rule 405 of the SecuritiesAct. Yes ‘ No È
Indicate by check mark if the registrant is not required to file reports pursuant to Section 13 or section 15(d) of the ExchangeAct. Yes ‘ No È
Indicate by check mark whether the registrant (1) has filed all reports required to be filed by Section 13 or 15(d) of the SecuritiesExchange Act of 1934 during the preceding twelve months (or for such shorter period that the registrant was required to file such reports),and (2) has been subject to such filing requirements for the past 90 days. Yes È No ‘
Indicate by check mark whether the registrant has submitted electronically and posted on its corporate Web site, if any, everyInteractive Data File required to be submitted and posted pursuant to Rule 405 of Regulation S-T during the preceding 12 months (or forsuch shorter period that the registrant was required to submit and post such files). Yes È No ‘
Indicate by check mark if disclosure of delinquent filers pursuant to Item 405 of Regulation S-K is not contained herein, and will not becontained, to the best of registrant’s knowledge, in definitive proxy or information statements incorporated by reference in Part III of thisForm 10-K or any amendment to this Form 10-K. È
Indicate by check mark whether the Registrant is a large accelerated filer, an accelerated filer, a non-accelerated filer or a smallerreporting company. See definition of “accelerated filer”, “large accelerated filer” and “smaller reporting company” in Rule 12b-2 of theExchange Act.Large accelerated filer ‘ Accelerated filer ‘
Non-accelerated filer È (Do not check if a smaller reporting company) Smaller reporting company ‘
Indicate by check mark whether the registrant is a shell company (as defined in Rule 12b-2 of the Exchange Act). Yes ‘ No È
The aggregate market value of the voting and non-voting common stock held by non-affiliates of the registrant, based upon the closingsale price as reported on the New York Stock Exchange on June 28, 2013, the last business day of the registrant’s most recently completedsecond quarter, was approximately $1,419,937,239.
Indicate the number of shares outstanding of each of the issuer’s classes of Common Stock, as of the latest practicable date.Class Number of Shares Outstanding
Common Stock $0.01 par value 129,842,707 shares outstanding as of February 6, 2014Portions of the registrant’s Proxy Statement for the 2014 Annual Meeting of Shareholders are incorporated herein by reference in
Part III of this Annual Report on Form 10-K to the extent stated herein. Such proxy statement will be filed with the Securities and ExchangeCommission within 120 days of the registrant’s fiscal year ended December 31, 2013.

QUINTILES TRANSNATIONAL HOLDINGS INC.FORM 10-K
TABLE OF CONTENTS
Item Page
PART I1. Business . . . . . . . . . . . . . . . . . . . . . . . . . . . . . . . . . . . . . . . . . . . . . . . . . . . . . . . . . . . . . . . . . . . . . . . . . . 41A. Risk Factors . . . . . . . . . . . . . . . . . . . . . . . . . . . . . . . . . . . . . . . . . . . . . . . . . . . . . . . . . . . . . . . . . . . . . . . 251B. Unresolved Staff Comments . . . . . . . . . . . . . . . . . . . . . . . . . . . . . . . . . . . . . . . . . . . . . . . . . . . . . . . . . . 422. Properties . . . . . . . . . . . . . . . . . . . . . . . . . . . . . . . . . . . . . . . . . . . . . . . . . . . . . . . . . . . . . . . . . . . . . . . . . 423. Legal Proceedings . . . . . . . . . . . . . . . . . . . . . . . . . . . . . . . . . . . . . . . . . . . . . . . . . . . . . . . . . . . . . . . . . . 424. Mine Safety Disclosures . . . . . . . . . . . . . . . . . . . . . . . . . . . . . . . . . . . . . . . . . . . . . . . . . . . . . . . . . . . . . 42
PART II5. Market for Registrant’s Common Equity, Related Stockholder Matters and Issuer Purchases of
Equity Securities . . . . . . . . . . . . . . . . . . . . . . . . . . . . . . . . . . . . . . . . . . . . . . . . . . . . . . . . . . . . . . . . . 436. Selected Financial Data . . . . . . . . . . . . . . . . . . . . . . . . . . . . . . . . . . . . . . . . . . . . . . . . . . . . . . . . . . . . . . 467. Management’s Discussion and Analysis of Financial Condition and Results of Operations . . . . . . . . . 487A. Quantitative and Qualitative Disclosures About Market Risk . . . . . . . . . . . . . . . . . . . . . . . . . . . . . . . . 688. Financial Statements and Supplementary Data . . . . . . . . . . . . . . . . . . . . . . . . . . . . . . . . . . . . . . . . . . . . 709. Changes in and Disagreements with Accountants on Accounting and Financial Disclosure . . . . . . . . . 1179A. Controls and Procedures . . . . . . . . . . . . . . . . . . . . . . . . . . . . . . . . . . . . . . . . . . . . . . . . . . . . . . . . . . . . . 1179B. Other Information . . . . . . . . . . . . . . . . . . . . . . . . . . . . . . . . . . . . . . . . . . . . . . . . . . . . . . . . . . . . . . . . . . 117
PART III10. Directors, Executive Officers and Corporate Governance . . . . . . . . . . . . . . . . . . . . . . . . . . . . . . . . . . . 11811. Executive Compensation . . . . . . . . . . . . . . . . . . . . . . . . . . . . . . . . . . . . . . . . . . . . . . . . . . . . . . . . . . . . . 11812. Security Ownership of Certain Beneficial Owners and Management and Related Stockholder
Matters . . . . . . . . . . . . . . . . . . . . . . . . . . . . . . . . . . . . . . . . . . . . . . . . . . . . . . . . . . . . . . . . . . . . . . . . . 11813. Certain Relationships and Related Transactions and Director Independence . . . . . . . . . . . . . . . . . . . . 11814. Principal Accountant Fees and Services . . . . . . . . . . . . . . . . . . . . . . . . . . . . . . . . . . . . . . . . . . . . . . . . . 118
PART IV15. Exhibits and Financial Statement Schedules . . . . . . . . . . . . . . . . . . . . . . . . . . . . . . . . . . . . . . . . . . . . . 119
Signatures . . . . . . . . . . . . . . . . . . . . . . . . . . . . . . . . . . . . . . . . . . . . . . . . . . . . . . . . . . . . . . . . . . . . . . . . 120Exhibit Index . . . . . . . . . . . . . . . . . . . . . . . . . . . . . . . . . . . . . . . . . . . . . . . . . . . . . . . . . . . . . . . . . . . . . . 128
2

FORWARD-LOOKING STATEMENTS
This Annual Report on Form 10-K contains forward-looking statements within the meaning of Section 27Aof the Securities Act of 1933, as amended, or the Securities Act, and Section 21E of the Securities Exchange Actof 1934, as amended, or the Exchange Act. Such forward-looking statements reflect, among other things, ourcurrent expectations and anticipated results of operations, all of which are subject to known and unknown risks,uncertainties and other factors that may cause our actual results, performance or achievements, market trends, orindustry results to differ materially from those expressed or implied by such forward-looking statements.Therefore, any statements contained herein that are not statements of historical fact may be forward-lookingstatements and should be evaluated as such. Without limiting the foregoing, the words “anticipates,” “believes,”“estimates,” “expects,” “intends,” “may,” “plans,” “projects,” “should,” “targets,” “will” and the negative thereofand similar words and expressions are intended to identify forward-looking statements. These forward-lookingstatements are subject to a number of risks, uncertainties and assumptions, including those described in “RiskFactors” in Part I, Item 1A of this report. Unless legally required, we assume no obligation to update any suchforward-looking information to reflect actual results or changes in the factors affecting such forward-lookinginformation.
3

PART I
Item 1. Business
Overview
We are the world’s largest provider of biopharmaceutical development services and commercial outsourcingservices. We are positioned at the intersection of business services and healthcare and generated $3.8 billion ofservice revenues in 2013, conduct business in approximately 100 countries and have approximately 28,200employees. We use the breadth and depth of our service offerings, our global footprint and our therapeutic,scientific and analytics expertise to help our biopharmaceutical customers, as well as other healthcare customers,to be more successful in an increasingly complex healthcare environment.
Since our founding more than 30 years ago, we have grown to become a leader in the development andcommercialization of new pharmaceutical therapies. Our Product Development segment is the world’s largestcontract research organization, or CRO, as ranked by 2013 reported service revenues, and is focused primarily onPhase II-IV clinical trials and associated laboratory and analytical activities. Our Integrated Healthcare Servicessegment includes one of the leading global commercial pharmaceutical sales and service organizations.Integrated Healthcare Services provides a broad array of services, including commercial services, such asproviding contract pharmaceutical sales forces in key geographic markets, as well as a growing number ofhealthcare business services for the broader healthcare sector, such as outcome-based, consulting and real-worldresearch and other healthcare solutions. Product Development contributed approximately 77% and IntegratedHealthcare Services contributed approximately 23% to our 2013 service revenues. Additional informationregarding our segments is presented in Note 21 to our audited consolidated financial statements includedelsewhere in this Annual Report on Form 10-K.
Our global scale and capabilities enable us to work with the leading companies in the biopharmaceuticalsector that perform trials and market their products all around the world. During each of the last 11 years, wehave worked with the 20 largest biopharmaceutical companies ranked by 2012 reported revenues. We haveprovided services in connection with the development or commercialization of the top 50 best-sellingbiopharmaceutical products and the top 50 best-selling biologic products, from 2012 as measured by reportedsales. Of the new molecular entities, or NMEs, and new biologic applications, or BLAs, approved from 2004through 2012, we helped develop or commercialize 97% of the central nervous system drugs, 93% of theoncology drugs and 89% of the cardiovascular drugs.
We have extensive scientific and therapeutic expertise, including more than 950 employees globally who aremedical doctors with experience across a number of fields. We also have substantial statistical, quantitative,analytical and applied technology skills, with more than 900 employees possessing a Ph.D. or equivalent. Ourexperts enable us to add sophisticated statistical, process development and advanced technology applications intoour clinical development services to meet the needs of the broader healthcare industry for appropriate endpoints,adaptive trials, drug therapy analysis, outcomes and real-world research and evidence-based medicine. Ourscientific and medical expertise allows us to conduct biomarker discovery, perform gene sequencing andexpression analysis, create assays that can be duplicated on a global scale and support the evolving fields oftranslational science and personalized medicine. Moreover, our flexible business solutions and commitment toour customers’ objectives enable us to provide our customers with customized operational delivery models tomeet their particular needs.
In 2013, our service revenues were $3.8 billion and our net income attributable to our shareholders was$226.6 million. In addition, our 2013 net new business was $4.9 billion, and we ended the year with $9.9 billionin backlog. See Part I, Item 1 “Business—Net New Business Reporting and Backlog” for more detail. Duringeach of the last six years, we have had at least eight customers from whom we earned more than $100 million inservice revenues. No single customer represented more than 10% of our 2013 revenues.
4

Our Markets
The market served by Product Development consists primarily of biopharmaceutical companies, includingmedical device and diagnostics companies, that are seeking to outsource clinical trials and other productdevelopment activities. We estimate that total biopharmaceutical spending on drug development wasapproximately $93 billion in 2013, of which we estimate that our addressable market (clinical developmentspending excluding preclinical spending) was approximately $51 billion. The portion of this $51 billion that wasoutsourced in 2013, based on our estimates, was approximately $19 billion. We estimate that the potential marketfor Product Development’s services will experience a compound annual growth rate, or CAGR, of 6%-8% from2013 through 2016 as a result of increased research and development, or R&D, spending by biopharmaceuticalcompanies and the increased outsourcing of this spending as compared to 2012. In addition, many compounds inthe global product development pipeline relate to the therapeutic areas of oncology, central nervous system andcardiovascular diseases and disorders, which are our largest therapeutic areas as measured by service revenues.
Integrated Healthcare Services primarily addresses markets related to the use of approved biopharmaceuticalproducts. We estimate that total spending related to approved drugs, including biopharmaceutical spending oncommercialization of these drugs and expenditures by participants in the broader healthcare market on real-worldresearch and evidence-based medicine, exceeded $94 billion in 2013. Integrated Healthcare Services linksproduct development to healthcare delivery. This segment’s services include commercial services such asrecruiting, training, deploying and managing a global sales force, channel management, patient engagementservices, market access consulting, brand communication, consulting and medical education. In addition,Integrated Healthcare Services offers outcome-based services such as observational studies, comparativeeffectiveness studies and product and disease registry services which are intended to help increase the quality andcost-effectiveness of healthcare and provider payer solutions. We believe that a combination of cost pressure inhealthcare systems around the world and the increasing focus on the value and efficacy of pharmaceuticaltherapy provide us many opportunities to grow our revenues and expand our service offerings by improving thecost-effectiveness of drug therapies.
We believe that we are well-positioned to benefit from current trends in the biopharmaceutical andhealthcare industries that affect our markets, including:
Trends in R&D Spending. We estimate that R&D spending was approximately $137 billion in 2013 and willgrow to approximately $145 billion in 2016, with development accounting for approximately 68% of totalexpenditures. R&D spending trends are impacted as a result of several factors, including majorbiopharmaceutical companies’ efforts to replenish revenues lost from the so-called “patent cliff” of recent years,increased access to capital by the small and midcap biotechnology industry, and recent increases inpharmaceutical approvals by regulatory authorities. In 2013, there were approximately 4,060 drugs in the PhaseI-III pipeline, an increase of 19% since 2008, and there were 27 NME approvals by the United States Food andDrug Administration, or FDA, in 2013 which for the two year period of 2012 to 2013 showed the highest numberof approvals since the late 1990’s. We believe that further R&D spending, combined with the continued need forcost efficiency across the healthcare landscape, will create new opportunities for biopharmaceutical servicescompanies, particularly those with a global reach and broad service offerings, to help biopharmaceuticalcompanies with their pre- and post-launch product development and commercialization needs.
Growth in Outsourcing. We estimate that clinical development spending outsourced to CROs in Phases I-IVin 2013 was approximately $19 billion and will grow to approximately $23 billion by 2016. We expectoutsourced clinical development to CROs to grow 6%-8% annually during this period. Of this annual growth, webelieve that up to 2% will be derived from increased R&D expenditures, with the remainder coming fromincreased outsourcing penetration. We estimate that overall outsourcing penetration in 2013 was 37%. Themarket served by Integrated Healthcare Services is diverse, which makes it difficult to estimate the currentamount of outsourced integrated healthcare services and the expected growth in such services. However, basedon our knowledge of these markets we believe that, while the rate of outsourcing penetration varies by marketwithin Integrated Healthcare Services, the current outsourcing penetration of the estimated $94 billion
5

addressable market is not more than 20%. As business models continue to evolve in the healthcare sector, webelieve that the growth rate for outsourcing across the Integrated Healthcare Services markets will be similar tothe growth in clinical development.
Over the longer term, we believe that we are well positioned for the future evolution of the healthcare sectoras increasing demand from governments and other payers around the world for quality, accountability and valuefor money drive biopharmaceutical companies, providers and other healthcare organizations to transform theirvalue chain away from a vertically integrated model and focus on their core competencies. In order to do this, webelieve that healthcare organizations will need to move towards variable cost structures to lower risk andimprove returns. In particular, we believe that the following trends will result in increased outsourcing to globalbiopharmaceutical services companies, of which we are the largest and most global:
• Maximizing Productivity and Lowering Costs. Declining R&D productivity, increased developmentcosts and diminished returns on marketing and sales have negatively impacted biopharmaceuticalcompanies’ margins and short-term earnings. We believe that the need for biopharmaceuticalcompanies to maximize productivity and lower costs in their product development and commercialoperations will cause them to look to partners as they enter into outsourcing arrangements to improveefficiency, increase sales force utilization and effectiveness, improve clinical success rates and turnfixed costs into variable costs across their R&D and commercial operations.
• Managing Complexity. Biopharmaceutical companies face environments in which it has becomeincreasingly difficult to operate. Improved standards of care in many therapeutic areas and the emergence ofnew types of therapies, such as biologics, genetically targeted therapies, gene and stem cell therapies, andother treatment modalities have led to more complex development and regulatory pathways, such as recentlyreleased guidelines in the United States and Europe for the development of “biosimilar” products. Webelieve that companion diagnostics, genomics and biomarker expertise will become a more critical part ofthe development process as biopharmaceutical companies require more customized clinical trials and seek todevelop treatments that are more tailored to an individual’s genetic profile or a disease’s profile. Asbiopharmaceutical companies are increasingly devoting a larger percentage of their R&D budgets andresources to the development of personalized medicines, we believe they will need to partner with serviceproviders that can apply data and analytics expertise, particularly in the planning stages, and provide highlyproductive and reliable delivery solutions that integrate more sophisticated approaches to managingcomplexity. We believe that our global clinical development capabilities, including our expertise inbiomarkers and genomics and our global laboratory network, position us well to help biopharmaceuticalcompanies manage the complexities inherent in an environment where this type of expertise is important.
• Providing Enhanced Value for Patients. As healthcare costs rise globally, governments and third-partypayers have looked for ways both to control healthcare expenditures and increase the quality, safetyand effectiveness of drug therapies. Governments and regulatory bodies have adopted, and maycontinue to adopt, healthcare legislation and regulations that may significantly impact the healthcareindustry by demanding more value for money spent and financial accountability for patient outcomes.Such legislation and regulations may tie reimbursement to the demonstrated clinical efficacy of atherapy, require payers and providers to demonstrate efficacy in the delivery of healthcare services andrequire more evidence-based decisions, all of which we believe will increase the demand for innovativeand cost-effective commercialization strategies and outcome research and data analytics services.
• Increased Importance of Product Development in Local Markets. Increasingly, regulators require trialsinvolving local populations as part of the process for approving new pharmaceutical products,especially in certain Asian and emerging markets. Understanding the epidemiological andphysiological differences in different ethnic populations and being able to conduct trials locally incertain geographies will be important to pharmaceutical product growth strategies, both formultinational and local/regional biopharmaceutical companies. We believe that our global clinicaldevelopment capabilities and unmatched presence in Asia make us a strong partner forbiopharmaceutical companies managing the complexities of international drug development.
6

• Increasing Number of Phase II-IV Clinical Trials. Biopharmaceutical companies are devotingincreasing resources to Phase II-IV trials. Based on the current and expected composition of the globaldrug development pipeline, we believe that spending on Phase II-IV clinical trials will continue toincrease. As the number of large Phase II-IV trials increases, especially those that focus on rarediseases or that continue to require large numbers of patients with very specific disease conditions, trialsponsors will increasingly seek to recruit patients on a global basis. We believe that this increasedspending and the demand for global patient recruitment will favor the limited number ofbiopharmaceutical services companies that have both the capabilities to administer large, complexglobal clinical trials and relationships with thought-leading investigators and trial sites around theworld. In addition, as these drugs come to market, we believe that biopharmaceutical companies willalso seek to outsource an increasing amount of the commercial and other integrated healthcare servicesnecessary to effectively launch and market these drugs, including integrated channel management,contract sales (including recruiting, training, deploying and managing field based resources and e-detailing), branding of products, medical science liaisons, nurse educators, observational research andpatient registries.
Increase in Strategic Collaborations. Larger CROs are able to provide a greater variety of services of valueto the biopharmaceutical community. Biopharmaceutical companies are continuing to enter into long-termstrategic collaborations with global service providers that enable them to utilize flexible business models andintegrated end to end solutions to deliver on their strategic priorities. We believe that biopharmaceuticalcompanies have historically preferred, and will continue to prefer, financially sound, global service providerswith broad therapeutic and functional expertise such as our company when selecting strategic providers.
Our Competitive Strengths
We believe that we are positioned to be the partner of choice to biopharmaceutical companies worldwideand a key resource to other healthcare industry participants who are looking to improve operational, therapeuticand patient outcomes. We differentiate ourselves from others in our industry through our competitive strengths,which include:
Leadership and Global Scale. We believe that our industry leading size, global scale and significanttechnology and process capabilities differentiate us by enabling us to effectively manage increasingly complex andglobal clinical trials with continuous clinical data monitoring and niche pools of patients from around the world.Based on reported 2013 consolidated service revenues, we are nearly 1.6 times the size of our closest public CROcompetitor. We have earned a reputation as an industry and thought leader, which is reflected in our financial andoperational performance. We believe we have the largest share of the outsourced global clinical andcommercialization markets. With our broad geographic diversification, represented by operations in approximately100 countries, we are able to deliver services to our customers in each of the most significant biopharmaceuticalmarkets in the world. Based on our public competitors’ 2013 reported service revenues, we believe we are themarket leader in the United States, Japan and Europe, the three largest biopharmaceutical markets in the world. In2013, we had revenues of approximately $774 million in the Asia-Pacific region, where we have had a presencesince 1993. In addition, as of December 31, 2013, we had approximately 28,200 employees with the majoritylocated outside the United States, including significant numbers in Japan and Europe. We also have a significantpresence in emerging markets, such as Brazil, Russia, India and China, or BRIC, markets. Our scale allows us toleverage our global capabilities while maintaining customer confidentiality, and our significant technology andprocess capabilities enable the seamless transfer of data between global trials running simultaneously to allocateresources, reduce costs and speed the time to market. For more information regarding the geographic scope of ourbusiness, see Note 20 to our audited consolidated financial statements included elsewhere in this Annual Report onForm 10-K. For more information regarding our employee base, see “Employees.”
Broad, Deep and Diverse Relationships. Our customer, investigator and other provider relationshipscontribute to our industry leading position in the biopharmaceutical services market. During each of the last 11years, we have worked with the 20 largest biopharmaceutical companies, as measured by their respective 2012
7

reported revenues. In 2013, we had ten customers from whom we earned at least $100 million in servicerevenues. During each of the last six years, we have had at least eight customers from whom we earned morethan $100 million in service revenues. We also work with over 500 small, mid-size and other biopharmaceuticalcompanies outside the 20 largest by revenues. These customers accounted for approximately 51% of our net newbusiness in 2013. In 2013, we provided services across both our Product Development and Integrated HealthcareServices segments to all of our top 25 key customers. Under our global prime site and partner programs, we alsohave broad, deep and diverse relationships with clinics, large hospitals and health systems through which wehave access to thousands of investigators and other providers worldwide.
Therapeutic and Scientific Expertise. We have continued to invest in developing world-class scientificcapabilities to help our customers leverage rapidly changing science to better understand disease causality,develop drugs and diagnostics, and deliver safer, more effective therapies. Underpinning our investments andservice delivery is a focus on delivering consistent, high-quality services to our customers across all businessgroups throughout the world, including a centralized ethics and compliance office dedicated to facilitatingadherence to quality standards and ethical behavior. We have created 14 therapeutic centers of excellence in ourcompany that are designed to bring together the scientific expertise across our service lines as needed to achievean optimal therapeutic solution for our customers. These capabilities, coupled with our biomarker developmentresearch labs and assay development and validation services, provide a comprehensive set of services to supportthe development of drug therapies across the therapeutic spectrum, including the emerging field of personalizedmedicine. We have employees with substantial scientific, quantitative, analytical and applied technology skillsand substantial expertise in numerous therapeutic areas, with over 2,100 Ph.D.s, medical doctors and statisticianson our staff worldwide. We have product development capabilities across a range of therapeutic areas, with afocus on oncology, cardiovascular, central nervous system, diabetes and internal medicine. These five therapeuticareas represented more than 50% of the total biopharmaceutical product pipeline in 2013 and are generally morecomplex and require significant scientific expertise and global scale.
Integrated Services to Enable Better Decision-making in the Broader Healthcare Market. Our core marketis product development, and we have deep and global expertise across the phases of this market from first-in-mantrials through post-marketing studies. Our services are designed to provide integrated solutions that address thecomplex challenges faced by a broad range of healthcare industry participants. We believe that our significantcapabilities in analytics, clinical science and real-world data, combined with our broad commercial, consultingand post-launch expertise, will enable us to meet the research and analytical needs of healthcare industryparticipants from the development and commercialization organizations within traditional and emergingbiopharmaceutical companies to payers, providers and other stakeholders. As the healthcare market continues todemand greater accountability for outcomes and value for money, we intend to increasingly deploy ourcapabilities in the broader healthcare market to help healthcare industry participants rapidly assess the viability ofnew drugs, cost-effectively accelerate development of the most promising drugs, launch and promote drugs to themarket effectively, evaluate their impact on healthcare, and make better reimbursement and prescriptiondecisions.
Experienced, Highly Trained Management and Staff. Our senior management team includes executives withexperience from inside and outside the biopharmaceutical and biopharmaceutical services industries who usetheir decades of experience to serve our customers and grow our company. Our founder, Dennis Gillings, CBE,Ph.D., a pioneer of the biopharmaceutical services industry, continues to serve as our Executive Chairman.Thomas H. Pike, our Chief Executive Officer, joined us with 30-plus years of strategic and operationalexperience in healthcare and technology, much of it gained in leadership positions at Accenture. Each of ourother executive officers has more than 25 years of experience in large, multinational organizations. Ourmanagement and staff are comprised of approximately 28,200 employees worldwide, of whom more than 950 aremedical doctors and more than 900 possess a Ph.D. or equivalent. Our employees contribute to a company-wideculture focused on delivering services and information that meet or exceed the quality standards demanded bycustomers, doctors, patients and regulatory authorities. At this time, we have over 5,600 contract medical salesrepresentatives, a sales force that is comparable in size to the sales forces of many large biopharmaceutical
8
companies. In support of our growth, we regularly review our capabilities and make adjustments to ourworkforce to ensure we have the right mix of expertise to meet the demand for our services. During the pastseveral years we have continued to hire employees in many areas to enhance our capabilities and expertise, evenas we have implemented restructuring plans, including targeted workforce reductions, to respond to the evolvingnature of our industry, make our service delivery more efficient and ultimately help further our businessobjectives and improve shareholder returns. Our recent restructuring activities have included plans approved byour Board of Directors, or our Board, that we initiated in February 2013, May 2012 and July 2011, with approvedcosts of up to approximately $15.0 million, $20.0 million and $25.3 million, respectively. We strive to maintain aculture that reinforces collaboration, motivation and innovation which is consistent with our core values andCode of Conduct: Doing the Right Thing. To that end, in 2013, we were named as one of the 25 bestmultinational places to work by the Great Place to Work® Institute for the third consecutive year.
Technology Solutions and Process/Data Capabilities. For over 30 years, we have been devoted to advancing stateof the art technology, processes and analytics to optimize our service offerings and provide our customers with theinformation they need to quickly make critical decisions regarding the development and commercialization of theirproducts. We have focused on investment in quality data, including de-identified electronic health records, or EHR,and we currently have access to EHR data representing more than 60 million patient lives. In addition, we haveestablished a substantial digital network of registered users with whom we communicate regularly. More than 3 millionpeople are registered users of these digital services that provide opportunities to seek information and participate inclinical trials and observational studies. Because data are only as good as the analytics used to analyze them, we havealso invested heavily in data analytics products, services and professionals. As part of this investment, we created ourproprietary data integration tool, Quintiles Infosario®, which is a suite of services that integrates data from acrossmultiple source systems to provide us and our customers with current, quality and comprehensive informationregarding clinical trials, allowing decisions to be made quickly and efficiently. In addition, we have developed aplanning and design platform and other software solutions to enable improvements to the drug development processand to demonstrate the value of biopharmaceutical products in the real world. We have obtained or applied for morethan 60 patents in connection with the development of our proprietary technology, systems and processes.
Our Growth Strategy
The key elements of our growth strategy across Product Development and Integrated Healthcare Servicesinclude:
Leverage Our Leadership Position and Scale. We are the global market leader in providing drugdevelopment, commercialization and outcome analytics services, and we have substantially larger servicerevenues and more employees around the world than reported by any of our public CRO competitors. We plan tocontinue to grow organically and through selected acquisitions to expand our services and capabilities. Webelieve our portfolio of services enables us to provide a wide range of solutions for customers by taking anintegrated view of the healthcare landscape. We intend to leverage our global scale from our scientific andtherapeutic expertise, global investigator network, central laboratory and data library to help our customersreduce costs, improve efficiency and effectiveness, and deliver better healthcare outcomes.
Build Upon Our Customer Relationships. We believe that the breadth and depth of our global operations, serviceofferings, therapeutic expertise, analytics experience and technology, combined with our existing relationships withparticipants across the healthcare industry, position us well to capture a significant share of the large “untapped”biopharmaceutical spending not historically available to biopharmaceutical services companies. For example, over thepast several years, we have built dedicated customer relationship teams around each of our largest customers, allowingus to proactively help them identify additional ways our services can enable them to further improve their R&Dproductivity and focus on variable cost structures. In addition, we continue to evolve our relationships with small, mid-size and other biopharmaceutical customers outside the 20 largest by revenues, of which we have over 500 around theworld. The breadth and depth of our service offerings allow us to develop relationships with key decision makersthroughout our customers’ organization. We intend to leverage our strong customer relationships to further penetratenew opportunities as our customers seek to reduce and variabalize their cost structures.
9

Continue to Enable Innovative and Flexible Business Solutions. We use our extensive scope of services todesign innovative and flexible solutions tailored for our customers’ needs in an increasingly complexenvironment. We believe that sustainable and growing revenue can be achieved through differentiation ofservices, coupled with deeper and broader relationships and a commitment to structuring flexible and innovativesolutions to meet the diversified and changing needs of the healthcare industry. For example, in 2013, we enteredinto a first-of-its kind sole provider strategic collaboration for development and clinical trial execution withMerck KGaA, known as Merck Serono. This new model is designed to leverage the knowledge and insights fromboth organizations and will span the full spectrum of clinical development from Phase I through to post-marketing approvals. We also have a historical track record of innovative solutions as demonstrated by analliance with Eisai Pharmaceuticals, or Eisai, to conduct 11 proof-of-concept studies on six oncology compounds,resulting in a relationship that helped Eisai extend its capacity and accelerate the development of thesecompounds at half of Eisai’s original budgeted cost. We leverage our people, processes and technologies toprovide significant value to our customers through customized outsourcing, shifting more of the responsibilityfor managing development to us and other arrangements that can save our customers time and money andcontribute to our profitable growth.
Use Our Therapeutic, Scientific and Domain Expertise to Improve Outcomes. We believe our deepscientific, therapeutic and domain expertise enables us to help customers deliver and demonstrate enhanced valuefor patients and solve the complex challenges inherent in drug development and commercialization. For example,we recently undertook a study with the participation of United States Oncology, supported by McKessonSpecialty Health and The US Oncology Network, to explore the operational feasibility and clinical benefits of anupfront approach to the genomic sequencing of tumors from metastatic colorectal cancer patients. The study willinvestigate how pre-profiling and genomic sequencing data may support physician treatment decisions, includingthe identification of appropriate clinical trials for patients. We also believe that the breadth of our expertise, fromexpert consulting to data-driven planning and design, enables us to help biopharmaceutical companies improveoperational efficiency and outcomes by transforming processes. Our thought and scientific leadership in the areaof observational research is demonstrated by our leadership role in the Good ReseArch for ComparativeEffectiveness (GRACE) initiative, which is developing a core set of good practice principles to address thedesign, conduct, analysis and reporting of observational studies of comparative effectiveness. We use ourtherapeutic, scientific and domain expertise to help our customers reach optimal outcomes in the ever-changinghealthcare landscape. For example, we implemented a program for a large biopharmaceutical company toeducate over 670,000 patients and staff to increase patient compliance with a customer’s diabetes drug. Ourability to link observational research, patient education and compliance data in diabetes is one example of ourability to connect clinical data to improve outcomes for our customers. We leverage our scientific expertise andinnovative technologies to improve value for our customers.
Leverage Our Global Footprint and Presence in Significant Emerging Markets. We have some of thebroadest global capabilities in the biopharmaceutical services industry, with a presence in all of the majorbiopharmaceutical markets, including the United States, Japan, Europe and each of the BRIC countries. Ourextensive global footprint provides us substantial local expertise in multinational patient populations andregulatory schemes that allows us to effectively serve customers worldwide. We believe there is a significantopportunity to increase our penetration and grow our revenues in both developed and developing markets as weadapt to meet the evolving needs of the biopharmaceutical industry as it seeks to serve the needs of an expandingand aging global population. Our business model allows us to react quickly to the unique market needs ofmultinational biopharmaceutical companies as well as regional and local market participants. For example, weare able to support our customers in the Asia-Pacific region as well as our global customers with, we believe, thelargest regional workforce which has significant healthcare domain expertise. Further, our revenues in the Asia-Pacific region have increased 10% from 2011 to 2013. We are also able to use our global footprint to helpbiopharmaceutical companies in developed markets leverage their costs. For example, we implemented a globalmonitoring solution based in Bangalore, India, for a United States biopharmaceutical company to providemonitoring for over 1,000 products. We intend to continue to leverage our global footprint to deliver servicesbroadly and effectively as the needs of our customers evolve.
10
Capitalize on Emerging Growth Opportunities in the Broader Healthcare Market. We believe thathealthcare stakeholders, such as regulatory authorities, payers, providers and patients, are transforming thedelivery of healthcare by increasingly seeking evidence to support drug approval, reimbursement, prescribingand consumption decisions in a manner that will afford us opportunities to use our competitive strengths in newmarkets, including other healthcare services. We believe that in the new healthcare landscape payers andproviders will increasingly need to measure the value of services and patient outcomes. We plan to leverage ourdeep experience in interventional Phase IIIb/IV trials, our broad array of consulting expertise and ourobservational research capabilities to help meet the increasing need for real-world and late phase research toassist our customers in monitoring safety, proving efficacy, evaluating benefit-risk, demonstrating effectivenessand gaining market access. We also plan to continue to focus on integrating data to enable more successfuldevelopment of compounds and solutions. We intend to utilize our existing capabilities to expand our reach intoadjacent market opportunities that are complementary to our historical focus.
Our History
We were founded in 1982 by Dr. Gillings, who was a biostatistics professor at the University of NorthCarolina at Chapel Hill. Dr. Gillings and his cofounder pioneered the use of sophisticated statistical algorithms toimprove the quality of data used to determine the efficacy of various drug therapies. We expanded internationallyinto Europe in 1987 and into Asia in 1993. In 1994, we had grown to over $90 million in revenues and completedan initial public offering, or IPO, through Quintiles Transnational Corp., or Quintiles Transnational, our whollyowned subsidiary through which we conduct our operations. As a public company, we grew both organically andthrough acquisitions, adding a variety of new capabilities. By the end of 1996, we significantly expanded ourservice offerings by acquiring companies that added commercial and consulting capabilities to our business. InSeptember 2003, we completed a going private transaction, with Quintiles Transnational becoming owned by agroup of investors that included Dr. Gillings.
In January 2008, Quintiles Transnational engaged in what we refer to as the Major ShareholderReorganization, which resulted in our ownership by Dr. Gillings (and his affiliates), funds advised by BainCapital Partners, LLC, together with their affiliates, Bain Capital, affiliates of TPG Global, LLC, or the TPGFunds (we refer to TPG Global, LLC as “TPG Global” and together with its affiliates, “TPG”), affiliates of 3iCorporation, or 3i, and certain other shareholders who participated in the going private transaction, and variousmembers of our management.
In December 2009, we completed what we refer to as the Holding Company Reorganization, whereby we formedQuintiles Transnational Holdings Inc., or Quintiles Holdings, as the parent company of Quintiles Transnational. InMay 2013, we returned to the public markets by completing an IPO on the New York Stock Exchange, or NYSE.
Services
We address the needs of healthcare industry participants by providing product development and integratedhealthcare services to help our customers navigate the complex healthcare environment and improve outcomes.We can support our biopharmaceutical customers from first-in-man trials through patent expiration, from strategythrough planning and execution. We also offer a growing number of services designed to address the outcomesand analytical needs of the broader healthcare industry. The broad scope of our services allows us to help ourcustomers rapidly assess the viability of a growing number of potential new therapies, cost-effectively acceleratedevelopment of the most promising ones, launch new products to the market quickly, and evaluate their impactand appropriate use on patients.
11

We offer our services through two reportable segments: Product Development and Integrated HealthcareServices. The figure below displays the range of our services across both of our segments.
Product Development Services Integrated Healthcare Services
Project Management & ClinicalMonitoring:
Strategic Planning & Design: Commercial Services:
Communications & EngagementServices:
Real-World and Late PhaseResearch:
Other Healthcare Solutions
Consulting Services:
Clinical Trial Support Services:
• Study Design & Operational Planning
• Personalized Medicine • Contract Sales• Market Entry / Market Exit• Integrated Channel Management• Patient Engagement Services• Market Access & Commercialization Consulting• Medical Education
• Digital Patient Services
• Observational Studies• Product and Disease Registries• Comparative Effectiveness Studies
• Brand & Scientific Communications
• Model Based Drug Development• Planning & Design• Regulatory Affairs Services
• Product Development Strategy Consulting• Regulatory & Compliance Consulting• Process & IT Implementation Consulting
• Clinical Data Management• Biostatistical Services• Central Laboratories• Bioanalytical Laboratories • Genomic Laboratory • Cardiac Safety & ECG Services • Safety & Pharmacovigilance Operations • Phase I Units
• Site & Regulatory Start Up• Patient Recruitment• Clinical Monitoring• Project Management• Late Phase Interventional
• Investigator/Site Recruitment
Product Development
Product Development provides services and expertise that enable biopharmaceutical companies to outsourcethe clinical development process from first-in-man trials to post-launch monitoring. Our comprehensive serviceofferings provide the support and functional expertise necessary at each stage of development, as well as thesystems and analytical capabilities to help our customers improve product development efficiency andeffectiveness. We plan to continue to add to and change our service offerings, both organically and throughtargeted acquisitions, as the product development and associated clinical trial processes continue to evolve. Forexample, we acquired Novella Clinical Inc., or Novella, in September 2013 to enhance our smallbiopharmaceutical, oncology and medical device offerings.
Product Development is comprised of Clinical Solutions & Services and Consulting. Clinical Solutions &Services provides services necessary to develop biopharmaceutical products, including project management andclinical monitoring functions for conducting multi-site trials (generally Phase II-IV) and clinical trial supportservices that improve clinical trial decision making and data management and strategic planning and designservices that improve decisions and performance. Consulting provides strategy and management consultingservices based on deep life science expertise and advanced analytics as well as regulatory and complianceconsulting services.
Clinical Solutions & Services
Project Management and Clinical Monitoring
Drawing upon our 30 years of experience, our site databases, our site relationships and our highly trainedstaff, Clinical Solutions & Services enables the efficient conduct and coordination of multi-site trials (generallyPhase II-IV). To assist our customers with Phase IIIb clinical trials, we deliver cost-effective solutions throughmultidisciplinary, data-driven trial design and recruitment approaches, flexible delivery models and provenprocesses, dedicated, specially trained late phase project managers and experts in health outcomes, epidemiology,biostatistics and post-marketing regulations. Our Phase IV services provide additional trials to further evaluatethe effectiveness, side effects and cost effectiveness of a drug following regulatory approval. ClinicalSolutions & Services’ service offerings include protocol design, feasibility and operational planning, site start up,patient recruitment, project management and monitoring of the investigator sites and data from patient visits.
12

Study Design and Operational Planning. We assist our customers in preparing the study protocol, designingclinical report forms and identifying appropriate patients, sites and the optimal country mix to meet theirobjectives, among other key upfront decisions. The study protocol defines the medical hypotheses to beexamined, the number of patients required to produce statistically valid results, the period of time over whichthey must be tracked, the frequency and dosage of drug administration and the study procedures.
Investigator/Site Recruitment. During clinical trials, the drug is administered to patients by physicians,referred to as investigators, at hospitals, clinics or other sites. The quality of a clinical trial is dependent on thequality of the investigators who perform the trials. Through our global prime site and partner programs, we haveestablished relationships with thousands of investigators who conduct our clinical trials worldwide. We provideour investigators the resources and tools they need to effectively conduct the trials.
Site and Regulatory Start Up. The process of identifying, training and contracting with sites while alsosecuring regulatory and ethics approval is a complex and time-consuming aspect of clinical trials. We have adedicated unit that draws upon our experience from participating in trials globally across multiple therapeuticareas for the last 30 years. We utilize technology and analytics to simplify and streamline this process, reducingtime to first patient in and laying the groundwork for successful trial execution.
Patient Recruitment. We assist our customers in recruiting patients for clinical trials through investigatorrelationships, media advertising, use of web-based techniques and other methods. We also help to ensure patientsare retained for the duration of the trials. We use informatics tools and media-based recruitment methods toidentify, reach and recruit the appropriate patients. Our patient recruitment system includes informatics tools andmedia-based recruitment methods to provide broad pools of prescreened patients as well as an efficientenrollment process and a call center. Through our global prime site programs, in which we form researchpartnerships with large hospitals and health systems, we are capable of enrolling thousands of patients in clinicaltrials each year. We have enrolled on average over 100,000 patients in clinical trials annually during the last sixyears.
Clinical Monitoring. We deploy and manage clinical research associates, or CRAs, to work with andmonitor sites to assure the quality of the data, which we gather according to Good Clinical Practice, or GCP, andInternational Conference on Harmonization, or ICH, regulations and guidelines, and to meet the customers’ andregulatory authorities’ requirements according to the study protocol. CRAs also assist with site initiation,training, patient enrollment and retention. Regulatory authorities are encouraging the use of innovativeapproaches in trial monitoring, and we have deployed targeted, data-driven, risk-based, monitoring techniques toimprove monitoring efficiency and effectiveness, focusing on the areas most likely to impact the quality of thedata and safety of the patients in their particular trial. To support more efficient approaches to monitoring, wehave established a project coordination center, which performs remote monitoring activities.
Project Management. Our project managers help customers navigate the complexity of the clinical trialprocess and coordinate all of the various activities, data streams and timelines associated therewith. Aligned bytherapeutic experience, our project managers highlight risks before they become issues, while managing budgetsand timelines. As trials become more complex, project managers are becoming increasingly important inensuring trials are completed successfully.
Clinical Trial Support Services
Each clinical trial requires a number of concurrent services and data streams. We offer a broad range offunctional services and consultation to support clinical trials through specialized expertise that help customersefficiently collect, analyze and report the quality data and evidence they need to gain regulatory approval. Ourclinical trial support services include:
Clinical Data Management. With almost 30 years of experience, our data management services providesupport for the collection, organization, validation and analysis of clinical data. Data used can be captured via
13

electronic data capture, or EDC, or from paper. These databases include customized databases to meet customer-specific formats, integrated databases to support regulatory submissions to numerous regulatory authoritiesaround the world, including, for example, to the FDA to support new drug applications, or NDAs, BLAs, andpremarket approval applications, or PMAs, for medical devices.
Biostatistical Services. We provide statistical analyses of scientific databases for all phases of the drugdevelopment process. Biostatistics is at the core of every clinical trial, and we have been pioneering the use ofbiostatistics since our founding in 1982. We have more than 600 biostatisticians around the world, of whom morethan 50% have advanced degrees. We use biostatistics to assist our customers in speeding drug development,staying current with evolving best practices, navigating regulatory requirements and developing and qualifyingbiomarkers.
Central Laboratories. We support the laboratory testing and reporting needs inherent in all phases of clinicaltrials, offering globally harmonized safety and efficacy biomarker testing through the world’s largest, whollyowned network of central laboratories with individual College of American Pathologists accreditations. Servicesinclude assay development and validation, the provision of protocol-specific trial materials, customized labreport design, and specimen management and archival. We support trials anywhere in the world through whollyowned facilities in the United States, the United Kingdom, South Africa, India, China, Singapore and Japan, anda tightly coordinated network of affiliated laboratories in Argentina and Brazil. Our global processes andharmonization scheme are designed to help ensure the standardization of laboratory test results and integrated,comparable data collection, management and transfer, including providing direct electronic integration oflaboratory data into safety and efficacy reports for NDA submissions. To this end, each of our centrallaboratories in the United States is Clinical Laboratory Improvement Amendments, or CLIA, certified, and wehave designed the protocols for each of our central laboratories around the world to adhere to the CLIArequirements.
Genomic Laboratory. Originating with our August 2012 acquisition of Expression Analysis, Inc., orExpression Analysis, we provide a broad range of solutions in support of our customers’ clinical trial andresearch efforts, including experiment design, sample analysis, nucleic acid isolation, gene expression profiling,genotyping, next generation sequencing and advanced bioinformatics. Our services include whole genome tofocused set gene expression profiling and genotyping assays along with DNA and RNA sequencings services,sequence enrichment technologies and bioinformatics support. Our quality system is designed to adhere toClinical and Laboratory Standards Institute guidelines, and our CLIA-certified laboratory supports GLPcompliance.
Bioanalytical Laboratories. Originating with our November 2011 acquisition of Advion BioServices, Inc.(now Quintiles BioSciences, Inc.), or Quintiles BioSciences, we offer our customers a broad range of GoodLaboratory Practice, or GLP, and non-GLP bioanalytical testing to support pharmacokinetic/pharmacodynamic,or PK/PD, studies, and absorption, distribution, metabolism and elimination, or ADME, studies in the earlyphases of clinical testing. Utilizing our global Phase I network, we can provide our customers with a rapidturnaround of bioanalytical/PK data to support the efficient completion of Phase I trials. By combining our globalcentral laboratories and our Phase I networks, we believe that we can help biopharmaceutical companies makebetter decisions faster.
Cardiac Safety and ECG Laboratory Services. Our centralized electrocardiogram, or ECG, laboratory inIndia provides continuous global collection and analysis of ECGs by trained cardiologists as part of clinicaltrials. Our laboratory logs, tracks and analyzes ECGs from around the world, and stores and transmits reports innear real time. We believe that integrating our ECG laboratory capabilities into clinical trials helps customersidentify and adjust to cardiac safety signals earlier in the drug development process.
Safety and Pharmacovigilance Operations. Conducting clinical trials requires a dedicated, separate processto collect, analyze and report safety events. We have extensive experience, scale and geographic coverage for
14

case management services. Our safety management system combines our expertise, standard operatingprocedures and best practices derived from thousands of projects. Underpinned by this technology, we helpcustomers efficiently manage fluctuating case loads, streamline global operations and compliance, and gainbetter insights into clinical trial operations. The system offers advanced data intelligence features that integratemultiple data sets to help identify and understand trends more quickly and manage safety risks more proactively.We customize our lifecycle safety suite of services to monitor drug safety, including managing case reports,performing safety risk profiling and improving operational efficiency, quality and regulatory compliance.
Phase I Clinical Pharmacology Services. Phase I trials often involve testing a new drug on a limited numberof volunteers and patients. For such Phase I trials, we own and operate three clinical pharmacology units (Phase Iclinics) where we perform the core clinical functions related to these trials, with support from the specializedexpertise and functions from other members of Clinical Solutions & Services. Our Phase I trial capabilitiesinclude dose ranging, bioavailability/bioequivalence studies, PK/PD modeling, first administration to humans,multiple dose tolerance, dose effect relationship and metabolism studies. Our global Phase I network includes190 beds with operations in Overland Park, Kansas (United States) and London, United Kingdom.
Strategic Planning and Design
Through our strategic planning and design services, we offer consultation services to improve decisions andperformance including portfolio, program and protocol planning and design, biomarker consultation, benefit-riskmanagement, regulatory affairs, biostatistics, modeling and simulation, and personalized medicine.
Biomarkers, Genomics and Personalized Medicine. Personalized medicine is an emerging practice ofmedicine that uses information about a person’s genes, proteins and environment to prevent, diagnose and treatdisease. We have focused heavily over the past several years on developing world-class capabilities in the areasof biomarker and genomics research, testing and analysis. In August 2012, we acquired Expression Analysis,which provides whole genome to focused-set gene expression and genotyping assays, along with next-generationsequencing services, sequence enrichment technologies and bioinformatics support. In addition, in January 2012,we helped form and entered into a strategic alliance to develop biomarkers using a proprietary DNA- and protein-based assay technology platform to enhance the development, placement, conduct and analysis of early phaseoncology clinical trials. In November 2011, we acquired Quintiles BioSciences, which provides laboratorysolutions and technical expertise in drug bioanalytical, immunogenicity, immunoassays and in vitro ADMEstudies. We believe that our investments in biomarker, genomics and personalized medicine capabilities willenable our customers to access leading science expertise to better understand diseases, develop drugs anddiagnostics, and deliver safer, more effective therapies based on an individual’s genetic makeup.
Through these investments and the addition of key industry experts, we support biopharmaceuticalcompanies with deep expertise in these complex and groundbreaking efforts with a comprehensive suite ofservices, including biomarker discovery and development, assay development and validation, genomics, digitalpathology and consultation on the use of biomarkers to improve patient selection for clinical trials.
Model-Based Drug Development. We have extensive capabilities in the development and use of modelingand simulation techniques to improve decision-making through scenario analysis at key points in the drugdevelopment process. Services include population PK/PD modeling and simulation to identify the concentration-response relationship and best doses to pursue in later testing, and clinical trial simulation to test various trialdesign options simulated on computers before performing the actual trial.
Planning and Design. Our Center for Integrated Drug Development is developing an innovative approach tostrategic clinical research planning with a design platform that includes a modeling and simulation process forscenario planning and risk assessment to support portfolio, program development and protocol planning.
Regulatory Affairs Services. We provide comprehensive medical and regulatory affairs services for ourbiopharmaceutical customers. Our medical services include medical oversight of trials, review and interpretation
15

of adverse experiences, medical writing of reports and trial protocols and strategic planning of drug developmentprograms. Regulatory services for product registration include regulatory strategy design, document preparation,publishing, consultation and liaison with various regulatory authorities. Our regulatory affairs professionals helpto define the steps necessary to obtain registration as quickly as possible. Our depth of services, scale andgeographic coverage, including the key regions of focus for biopharmaceutical companies, enables us to meetcustomers’ needs to launch products in multiple countries simultaneously.
Consulting Services
We offer our customers consulting services based on our experience with the product life cycle. Byoperating at the intersection of three core capabilities—strategy, data and analytics—and by providing access tothe deep domain expertise offered by our various service lines, we can develop pragmatic solutions that helpbiopharmaceutical companies anticipate and address their myriad challenges and opportunities.
Product Development Strategy Consulting. Our expert consultants support biopharmaceutical customers toimprove the effectiveness and efficiency of their product development operations. We provide objective, industryvetted recommendations to help customers bring safer, differentiated products to market faster and more costeffectively. We begin in the conceptualization phase of development with strategic market research to bring acommercially minded approach to clinical design. Through a combination of secondary data and clinicalanalytics, we support customers in making informed development decisions. Additionally, we assist customers inoptimizing their product development processes through best practices and new development models.
Regulatory and Compliance Consulting. We supply regulatory and compliance consulting services to thebiopharmaceutical industry related to Good Manufacturing Practice, or GMP, GCP and GLP, global regulatoryaffairs, and quality systems engineering and validation. We assist customers in preparing for interactions with theFDA and foreign regulatory authorities or agencies, including inspections and resolution of enforcement actions,and complying with current GMP, and quality systems regulations, meeting process and software validationrequirements and bringing new medical devices to market.
Process and IT Implementation Consulting. Realizing that strategy is only as good as how effectively it isimplemented, we both design highly executable strategies and help implement them. Our consultants helpcustomers optimize clinical and business processes to accelerate timelines and eliminate waste. Changemanagement experts help implement new processes and organizational initiatives. Finally, we developtechnology and information technology, or IT, strategies and help ensure their successful implementation.
Integrated Healthcare Services
Integrated Healthcare Services provides the healthcare industry with both broad geographic presence andcommercial capabilities. Our customized commercialization services are designed to accelerate the commercialsuccess of biopharmaceutical and other health-related products by promoting, delivering and proving value.When integrated with our product development services, our commercialization services enable solutions acrossthe full lifecycle of a product.
Commercial Services
Contract Sales. Skilled primary care, specialty and multi-channel integrated sales teams provide ourcustomers with a flexible resource that is able to respond quickly and effectively to the changing marketplace.We provide our customers with a variety of staffing options, including direct hire, flexible work arrangements,leave of absence and “strike force” arrangements (in which a team is deployed to a particular territory tocapitalize on a market niche opportunity) in both full-time and flex-time solutions. We can supplement our salesforces with remote e-detailing capabilities. We use a proprietary review process and a variety of techniques,including extensive computerized databases and candidate referrals, to recruit candidates for our contract sales
16

teams. Our training and development services integrate traditional, distance-learning and web-based services.Our contract sales unit helps customers design or revamp their existing sales training programs to meetmarketplace demands. This service includes not only design, but also delivery and strategic meeting planning.
Market Entry/Market Exit. Market entry services help biopharmaceutical companies quickly and successfullylaunch products in new markets (including the high-growth BRIC markets) before or in lieu of establishing a long-term commercial infrastructure. Market exit services help biopharmaceutical companies manage the regulatory,quality and governance issues that arise when exiting unprofitable or less profitable markets. Market entry andmarket exit services are integrated solutions that can include assistance with regulatory compliance, market access,brand strategy, import and distribution logistics, and sales and marketing programs.
Integrated Multichannel Management. Integrated multichannel solutions leverage market-based analytics tohelp biopharmaceutical companies optimize channel mix (including sales force mix) so that the sales andmarketing strategy for individual drugs can be effectively executed across multiple channels, including the use ofsales representatives, e-detailing, video, mail, call center, webinars and online portals. Our integratedmultichannel management services allow our customers to access key healthcare stakeholders and tailor thechannels used to optimize results.
Patient Engagement Services. Our health management services professionals offer customized clinical andeducational solutions to bridge the gap between the clinical and commercial phases of product development andprovide expertise across a broad range of pre-launch, launch and post-launch opportunities. We providecustomers with solutions in a broad-based spectrum, from patient adherence programs to clinical trial educatorsthat assist in recruitment, education and retention of patients in clinical trials. We assist biopharmaceuticalcompanies in evaluating the therapy from the perspective of the patient, not just the prescriber, supporting patientcompliance and product dosing compliance therapy adherence and patient retention, which we believe canincrease commercial success. Patients are increasingly involved in decisions regarding healthcare in general anddrug therapy in particular. Our professionals assist in the process of developing patient-centric strategies andimplementing them for or side by side with customers. We believe that our clinical and promotional expertise,commercial orientation and international experience enable us to tailor these programs to meet the diverse needsof the global biopharmaceutical industry across a wide range of disciplines and local market conditions. Whilebroad-based in experience, we have specific expertise in oncology, multiple sclerosis, diabetes, neurology andpain management.
Market Access and Commercialization Consulting. Market access services support biopharmaceuticalcustomers in the development and execution of a strategy for bringing products into the market based on value.Once a product proceeds from large scale clinical trials to commercialization, our consultants help customers createproduct positioning, pricing and formulary access and reimbursement strategies based on extensive primaryresearch with providers, patients, payers and other decision-makers. In support of product marketing at launch, weconduct multi-stakeholder research to assist in developing go-to-market plans and drive payer usage throughdeployment of our key account managers, supporting this decision-making with health economic models and healthtechnology assessments to justify price to formulary decision-makers. Finally, post-launch, we track actual productcosts and outcomes through medical claims data analysis, comparative effectiveness research, medical records andpatient interviews. The combination of these services provides our customers with the marketing, economic andreimbursement support they need to help maximize commercial potential throughout the entire product lifecycle.
Medical Education. We have a dedicated medical education team that assists the healthcare industry inproviding appropriate continuing medical education to a diverse group of healthcare professionals. Our educationprofessionals design programs to address medical needs, based on the approaches that will work best withclinicians in specific therapeutic areas. They incorporate the latest advances in outcomes measurement todemonstrate how each program improves physician competencies and behavior and the quality of patient care.
17
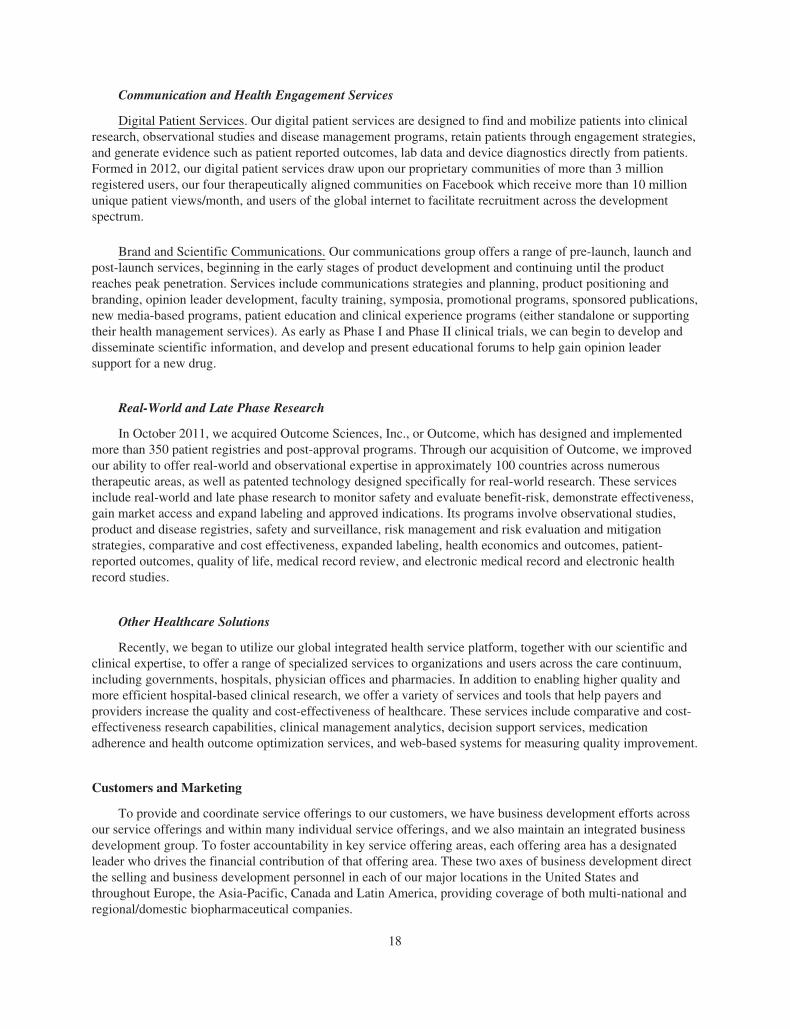
Communication and Health Engagement Services
Digital Patient Services. Our digital patient services are designed to find and mobilize patients into clinicalresearch, observational studies and disease management programs, retain patients through engagement strategies,and generate evidence such as patient reported outcomes, lab data and device diagnostics directly from patients.Formed in 2012, our digital patient services draw upon our proprietary communities of more than 3 millionregistered users, our four therapeutically aligned communities on Facebook which receive more than 10 millionunique patient views/month, and users of the global internet to facilitate recruitment across the developmentspectrum.
Brand and Scientific Communications. Our communications group offers a range of pre-launch, launch andpost-launch services, beginning in the early stages of product development and continuing until the productreaches peak penetration. Services include communications strategies and planning, product positioning andbranding, opinion leader development, faculty training, symposia, promotional programs, sponsored publications,new media-based programs, patient education and clinical experience programs (either standalone or supportingtheir health management services). As early as Phase I and Phase II clinical trials, we can begin to develop anddisseminate scientific information, and develop and present educational forums to help gain opinion leadersupport for a new drug.
Real-World and Late Phase Research
In October 2011, we acquired Outcome Sciences, Inc., or Outcome, which has designed and implementedmore than 350 patient registries and post-approval programs. Through our acquisition of Outcome, we improvedour ability to offer real-world and observational expertise in approximately 100 countries across numeroustherapeutic areas, as well as patented technology designed specifically for real-world research. These servicesinclude real-world and late phase research to monitor safety and evaluate benefit-risk, demonstrate effectiveness,gain market access and expand labeling and approved indications. Its programs involve observational studies,product and disease registries, safety and surveillance, risk management and risk evaluation and mitigationstrategies, comparative and cost effectiveness, expanded labeling, health economics and outcomes, patient-reported outcomes, quality of life, medical record review, and electronic medical record and electronic healthrecord studies.
Other Healthcare Solutions
Recently, we began to utilize our global integrated health service platform, together with our scientific andclinical expertise, to offer a range of specialized services to organizations and users across the care continuum,including governments, hospitals, physician offices and pharmacies. In addition to enabling higher quality andmore efficient hospital-based clinical research, we offer a variety of services and tools that help payers andproviders increase the quality and cost-effectiveness of healthcare. These services include comparative and cost-effectiveness research capabilities, clinical management analytics, decision support services, medicationadherence and health outcome optimization services, and web-based systems for measuring quality improvement.
Customers and Marketing
To provide and coordinate service offerings to our customers, we have business development efforts acrossour service offerings and within many individual service offerings, and we also maintain an integrated businessdevelopment group. To foster accountability in key service offering areas, each offering area has a designatedleader who drives the financial contribution of that offering area. These two axes of business development directthe selling and business development personnel in each of our major locations in the United States andthroughout Europe, the Asia-Pacific, Canada and Latin America, providing coverage of both multi-national andregional/domestic biopharmaceutical companies.
18

We take a holistic customer-oriented view toward business development. Our integrated businessdevelopment group is responsible for assessing our customers’ current and future needs and helping to define theright service offerings to be delivered at the right time. This group includes dedicated customer teams that delivercustomized solutions from the full breadth and depth of our service offerings for the world’s leadingbiopharmaceutical companies. In addition, we continue to evolve our relationships with our small, mid-size andother biopharmaceutical customers outside the 20 largest biopharmaceutical companies based on 2012 reportedrevenues.
In 2013, we earned service revenues of over $100 million in seven countries in North America, Europe andAsia. Please refer to Note 20 to our audited consolidated financial statements included elsewhere in this AnnualReport on Form 10-K for further details regarding our foreign and domestic operations in 2013, 2012 and 2011.For a discussion of risks attendant to our foreign operations, see “Risk Factors—Our business is subject tointernational economic, political and other risks that could negatively affect our results of operations andfinancial condition.”
Our service revenues were attributed to our segments as follows:
Year EndedDecember 31,
2013 2012 2011
Product Development . . . . . . . . . . . . . . . . . . . . . . . . . . . . . . . . . . . . . . . . . . . . . . . . . . . . . . 76.7% 73.9% 74.0%Integrated Healthcare Services . . . . . . . . . . . . . . . . . . . . . . . . . . . . . . . . . . . . . . . . . . . . . . . 23.3 26.1 26.0
Total . . . . . . . . . . . . . . . . . . . . . . . . . . . . . . . . . . . . . . . . . . . . . . . . . . . . . . . . . . . . . . . . . . . 100.0% 100.0% 100.0%
Additional information regarding our segments is presented in Note 21 to our audited consolidated financialstatements included elsewhere in this Annual Report on Form 10-K.
No single customer accounted for 10.0% or more of our consolidated service revenues in 2013, 2012 or2011. In the past, we have derived, and may in the future derive, a significant portion of our service revenuesfrom a relatively limited number of major projects or customers. As biopharmaceutical companies continue tooutsource large projects and/or functions to fewer providers, this concentration of business could increase.
Competition
The market for our product development services is highly competitive, and we compete against traditionalCROs, the in-house R&D departments of biopharmaceutical companies, universities and teaching hospitals.Among the traditional CROs, there are several-hundred small, limited-service providers, several medium-sizedfirms and only a few full-service companies with global capabilities. Consolidation among CROs likely willresult in greater competition among the larger CROs for customers, clinical personnel and acquisition candidates.Product Development’s primary competitors include Covance, Inc., Pharmaceutical Product Development, Inc.,PAREXEL International Corporation, ICON plc, inVentiv Health, Inc., or inVentiv, INC Research and PRAInternational, among others. Competitive factors for product development services include:
• previous experience and relationships;
• medical and scientific experience in specific therapeutic areas;
• the quality of contract research;
• speed to completion;
• the ability to organize and manage large scale trials on a global basis;
• the ability to manage large and complex medical databases;
• the ability to provide statistical, regulatory and consulting services;
19

• the ability to recruit investigators and patients expeditiously;
• the ability to deploy and integrate IT systems to improve the efficiency of contract research;
• risk and reward sharing;
• the ability to form strategic alliances;
• a global presence with strategically located facilities and breadth of service offerings;
• financial strength and stability; and
• price.
Integrated Healthcare Services competes in the post-approval and commercialization arenas. In the post-approval arena our solutions compete against real-world and late phase research providers including boutiquefirms, divisions of biopharmaceutical companies and divisions of traditional CRO’s (noted above). Ourcommercial solutions compete against the in-house sales and marketing departments of biopharmaceuticalcompanies, other contract pharmaceutical sales and service organizations and consulting firms. IntegratedHealthcare Services’ primary commercial competitors in the United States include inVentiv, PDI, Inc. andPublicis Selling Solutions. Outside of the United States, Integrated Healthcare Services commercial teamstypically compete against single country or more regionally focused commercial service providers, such asUnited Drug plc, inVentiv, EPS Corporation and CMIC HOLDINGS Co., Ltd in Japan. The primary competitivefactors affecting Integrated Healthcare Services are breadth of service offering and ability to deploy in anintegrated manner, quality and track record, i.e. the proven ability to quickly assemble, train and manage largequalified commercial teams on a global footprint and price.
Notwithstanding these competitive factors, we believe that the synergies arising from integrating productdevelopment services with commercial services, supported by global operations, data analysis and the ability toform long term strategic alliances with biopharmaceutical companies, differentiate us from our competitors.
Government Regulation
Good Clinical Practice
GCP regulations and guidelines contain the industry standards for the conduct of clinical trials with respectto the integrity of the data and safety of the research subjects. The FDA, the European Medicines Agency, orEMA, and many other regulatory authorities require that study results and data submitted to such authorities bebased on trials conducted in accordance with GCP provisions. Records for clinical trials must be maintained forspecified periods for inspection by the FDA and other regulators. Significant non-compliance with GCPrequirements can result in the disqualification by regulators of data collected during the clinical trial.
Our standard operating procedures related to clinical trials are written in accordance with regulations andguidelines appropriate to the region where they are used, thus helping to ensure compliance with GCP. FDAregulations and guidelines serve as a basis for our North American standard operating procedures. WithinEurope, we perform our work subject to the EMA’s Note for Guidance “Good Clinical Practice for Trials onMedicinal Products in the European Community.” All clinical trials (other than those defined as “non-international”) to be submitted to the EMA must meet the requirements of the International Conference onHarmonisation GCP standards. Our offices in the Asia-Pacific region and in Latin America have developedstandard operating procedures in accordance with their local requirements and in harmony with our NorthAmerican and European operations.
Regulation of Drugs, Biologics and Medical Devices
In the United States, pharmaceutical, biological and medical device products are subject to extensiveregulation by the FDA. The Federal Food, Drug, and Cosmetic Act, or the FDC Act, the Public Health Service
20

Act, or the PHS Act, and other federal and state statutes and regulations, govern, among other things, theresearch, development, testing, manufacture, storage, recordkeeping, approval, labeling, promotion andmarketing, distribution, post-approval monitoring and reporting, sampling, and import and export ofpharmaceutical, biological and medical device products. Failure to comply with applicable United Statesrequirements may subject a company to a variety of administrative or judicial sanctions, such as FDA refusal toapprove a pending New Drug Application (NDA) for a new drug, a Biological License Application (BLA) for anew biological product, or Premarket Approval (PMA) or clearance for a new medical device, warning oruntitled letters, product recalls, product seizures, total or partial suspension of production or distribution,injunctions, fines, civil penalties, and criminal prosecution.
Before a new drug or biologic may be marketed, it must undergo extensive testing and regulatory review todetermine that it is safe and effective and be approved by the FDA or other regulatory authority. Even afterapproval, a new PMA or PMA supplement may be required in the event of a modification to the device, itslabeling or its manufacturing process.
Regulation of Patient Information
Our information management services relate to the diagnosis and treatment of disease and are, therefore,subject to substantial governmental regulation. In addition, the confidentiality of patient-specific information andthe circumstances under which such patient-specific records may be released for inclusion in our databases orused in other aspects of our business is heavily regulated. Federal, state and foreign governments arecontemplating or have proposed or adopted additional legislation governing the possession, use anddissemination of personal data, such as personal health information and personal financial data, as well assecurity breach notification rules for loss or theft of such data. Additional legislation or regulation of this typemight, among other things, require us to implement new security measures and processes or bring within thelegislation or regulation de-identified health or other personal data, each of which may require substantialexpenditures or limit our ability to offer some of our services.
In particular, personal health-related information is recognized in many countries such as the United Statesand the European Union as a special, sensitive category of personal information, subject to additional mandatoryprotections. Violations of data protection regulations are subject to administrative penalties, civil moneypenalties and criminal prosecution, including corporate fines and personal liability.
In order to comply with these evolving laws and regulations, we may need to implement new dataprotection, privacy and data security measures, which may require us to make substantial expenditures or causeus to discontinue or limit the products and services we offer. In addition, if we violate applicable laws,regulations, contractual commitments or other duties relating to the use, privacy or security of health information,we could be subject to regulatory sanctions, civil liability or criminal prosecution or suffer reputational harm, andit may be necessary to modify our business practices.
Regulation of Promotion, Marketing and Distribution of Pharmaceutical Products and Medical Devices
Our integrated healthcare services are subject to detailed and comprehensive regulation in each geographicmarket in which we operate. Such regulation relates, among other things, to the distribution of drug samples, themarketing and promotion of approved products, the qualifications of sales representatives and the use ofhealthcare professionals in sales functions.
In the United States, our integrated healthcare services are subject to numerous federal and state lawspertaining to promotional activities involving pharmaceutical products and medical devices, such as the FDA’sregulations against “off-label promotion,” which require sales representatives to restrict promotion of theapproved product they are detailing to the approved labeling for the product, and the Prescription DrugMarketing Act which imposes licensing, personnel record keeping, packaging, labeling, product handling and
21

facility storage and security requirements. Other federal and state laws prohibit manufacturers, suppliers andproviders from offering, giving or receiving kickbacks or other remuneration in connection with ordering orrecommending the purchase or rental of healthcare items and services. The sale or distribution of pharmaceuticalproducts and devices is also governed by the United States Federal Trade Commission Act and state consumerprotection laws. We are subject to similar regulations currently in effect in the other countries where we offerintegrated healthcare services.
We are also subject to various laws and regulations that may apply to certain drug and device promotionalpractices, including, among others, various aspects of the Medicare program. Violations of these laws andregulations may result in criminal and/or civil penalties, including possibly as an “aider and abettor.”
Regulation of Laboratories
Our United States laboratories are subject to licensing and regulation under federal, state and local lawsrelating to hazard communication and employee right-to-know regulations, and the safety and health oflaboratory employees. Additionally, our United States laboratories are subject to applicable federal and state lawsand regulations and licensing requirements relating to the handling, storage and disposal of hazardous waste,radioactive materials and laboratory specimens, including the regulations of the Environmental ProtectionAgency, the Nuclear Regulatory Commission, the Department of Transportation, the National Fire ProtectionAgency and the United States Drug Enforcement Administration, or DEA. The use of controlled substances intesting for drugs with a potential for abuse is regulated in the United States by the DEA and by similar regulatorybodies in other parts of the world. Our United States laboratories using controlled substances for testing purposesare licensed by the DEA. The regulations of the United States Department of Transportation, Public HealthService and Postal Service apply to the surface and air transportation of laboratory specimens. Our laboratoriesalso are subject to International Air Transport Association regulations, which govern international shipments oflaboratory specimens. Furthermore, when the materials are sent to a foreign country, the transportation of suchmaterials becomes subject to the laws, rules and regulations of such foreign country. Our laboratories outside theUnited States are subject to applicable national laws governing matters such as licensing, the handling anddisposal of medical specimens, hazardous waste and radioactive materials, as well as the health and safety oflaboratory employees.
In addition to its comprehensive regulation of safety in the workplace, the United States OccupationalSafety and Health Administration has established extensive requirements relating to workplace safety forhealthcare employers whose workers may be exposed to blood-borne pathogens such as HIV and the hepatitis Bvirus. Although we believe that we are currently in compliance in all material respects with such federal, stateand local laws, failure to comply with such laws could subject us to denial of the right to conduct business, fines,criminal penalties and other enforcement actions.
Further, laboratories that analyze human blood or other biological samples for the diagnosis and treatmentof clinical trial subjects must comply with CLIA, as well as requirements established by various states. Thefailure to meet these requirements may result in civil penalties and suspension or revocation of the CLIAcertification.
Intellectual Property
We develop and use a number of proprietary methodologies, analytics, systems, technologies and otherintellectual property in the conduct of our business. We rely upon a combination of confidentiality policies,nondisclosure agreements, invention assignments and other contractual arrangements to protect our trade secrets,and patent, copyright and trademark laws to protect other intellectual property rights. We have obtained orapplied for more than 60 patents in connection with the development of our proprietary technology, systems andprocesses. We have also registered or applied for trademarks and service marks in the United States and anumber of foreign countries, and our trademark “Quintiles®” is of material importance to us. Although the
22
duration of trademark and service mark registrations varies from country to country, trademarks and servicemarks generally may be renewed indefinitely so long as they are in use and/or their registrations are properlymaintained, and so long as they have not been found to have become generic. Although we believe the ownershipof our patents, trademarks and service marks is an important factor in our business and that our success doesdepend in part on the ownership thereof, we rely primarily on the innovative skills, technical competence andmarketing abilities of our employees. Other than our Quintiles® trademark, we do not have any material patents,trademarks, service marks, licenses, franchises or concessions.
Net New Business Reporting and Backlog
Net new business is the value of services awarded during the period from projects under signed contracts,letters of intent and, in some cases, pre-contract commitments, which are supported by written communicationsand adjusted for contracts that were modified or canceled during the period. Net new business under soleprovider arrangements are recorded over the life of the arrangement as projects are awarded. Under sole providerarrangements, we are considered the exclusive provider for the contracted service or services.
Consistent with our methodology for calculating net new business during a particular period, backlogrepresents, at a particular point in time, future service revenues from work not yet completed or performed undersigned contracts, letters of intent and, in some cases, pre-contract commitments that are supported by writtencommunications. Once work begins on a project, service revenues are recognized over the duration of the project.Included within backlog at December 31, 2013 is approximately $6,342 million of backlog that we do not expectto generate revenue in the next 12 months.
Backlog was as follows:
December 31,
2013 2012
(in millions)
Backlog . . . . . . . . . . . . . . . . . . . . . . . . . . . . . . . . . . . . . . . . . . . . . . . . . . . . . . . . . . . . . . . . . . . . . $9,855 $8,704
Net new business was as follows:
Year Ended December 31,
2013 2012 2011
(in millions)
Product Development . . . . . . . . . . . . . . . . . . . . . . . . . . . . . . . . . . . . . . . . . . . . . . . . . . . $3,772 $3,474 $3,040Integrated Healthcare Services . . . . . . . . . . . . . . . . . . . . . . . . . . . . . . . . . . . . . . . . . . . . 1,127 1,027 1,004
Total . . . . . . . . . . . . . . . . . . . . . . . . . . . . . . . . . . . . . . . . . . . . . . . . . . . . . . . . . . . . . . . . $4,899 $4,501 $4,044
We believe that backlog and net new business may not be consistent indicators of future revenues becausethey have been and likely will be affected by a number of factors, including the variable size and duration ofprojects, many of which are performed over several years, cancellations, and changes to the scope of work duringthe course of projects. Additionally, projects may be terminated or delayed by the customer or delayed byregulatory authorities. Projects that have been delayed remain in backlog, but the timing of the revenue generatedmay differ from the timing originally expected. If a customer cancels an order, we may be reimbursed for thecosts we have incurred. Typically, however, we have no contractual right to the full amount of the revenuereflected in our backlog or net new business contracts in the event of cancellation. Revenue recognition occursover extended periods of time and is subject to unanticipated delays. Fluctuations in our reported backlog and netnew business levels also result from the fact that we may receive a small number of relatively large orders in anygiven reporting period that may be included in our backlog and net new business. Because of these large orders,our backlog and net new business in that reporting period may reach levels that may not be sustained insubsequent reporting periods. As we increasingly compete for and enter into large contracts that are more global
23

in nature, we expect the rate at which our backlog and net new business convert into revenue to increase, orlengthen. For more details regarding risks related to our backlog, see “Risk Factors—The relationship of backlogto revenues varies over time.” Projects that have been delayed remain in backlog, but the timing of the revenuegenerated may differ from the timing originally expected. Accordingly, historical indications of the relationshipof backlog and net new business to revenues may not be indicative of the future relationship.
Employees
As of December 31, 2013, we had approximately 28,200 full-time equivalent employees in approximately60 countries, comprised approximately of 10,400 in the Americas, 9,600 in the Europe and Africa region and8,200 in the Asia-Pacific region, with at least 500 employees in 10 countries around the world. As ofDecember 31, 2013, Product Development and Integrated Healthcare Services had approximately 19,400 and7,200 full-time equivalent employees, respectively. In addition, our centralized operations/corporate office hadapproximately 1,600 full-time equivalent employees.
The success of our business depends upon our ability to attract and retain qualified professional, scientificand technical staff. The level of competition among employers in the United States and overseas for skilledpersonnel, particularly those with Ph.D., M.D. or equivalent degrees or training, is high. We believe that ourbrand recognition and our multinational presence, are an advantage in attracting qualified candidates. In addition,we believe that the wide range of clinical trials in which we participate allows us to offer broad experience toclinical researchers. None of our employees are covered by a collective bargaining agreement or are representedby a labor union. Employees in some of our non-United States locations are represented by works councils asrequired by local laws. We believe that our relations with our employees are good.
Available Information
Our website address is www.quintiles.com, and our investor relations website is located at http://investor.quintiles.com. Information on our website is not incorporated by reference herein. Copies of our annualreports on Form 10-K, quarterly reports on Form 10-Q, current reports on Form 8-K and our Proxy Statementsfor our annual meetings of shareholders, and any amendments to those reports, as well as Section 16 reports filedby our insiders, are available free of charge on our website as soon as reasonably practicable after we file thereports with, or furnish the reports to, the Securities and Exchange Commission, or the SEC. Our SEC filings arealso available for reading and copying at the SEC’s Public Reference Room at 100 F Street, NE, Washington,D.C. 20549. Information on the operation of the Public Reference Room may be obtained by calling the SEC at1-800-SEC-0330. In addition, the SEC maintains an Internet site (http://www.sec.gov) containing reports, proxyand information statements, and other information regarding issuers that file electronically with the SEC.
24
Item 1A. Risk Factors
RISK FACTORS
We operate in a rapidly changing environment that involves a number of risks, some of which are beyondour control. You should consider carefully the risks and uncertainties described below together with the otherinformation included in this Annual Report on Form 10-K, including our consolidated financial statements andrelated notes included elsewhere in this Annual Report on Form 10-K, in evaluating our company. Theoccurrence of any of the following risks may materially and adversely affect our business, financial condition,results of operations and future prospects.
Risks Relating to Our Business
The potential loss or delay of our large contracts or of multiple contracts could adversely affect our results.
Most of our customers can terminate our contracts upon 30 to 90 days notice. Our customers may delay,terminate or reduce the scope of our contracts for a variety of reasons beyond our control, including but notlimited to:
• decisions to forego or terminate a particular trial;
• lack of available financing, budgetary limits or changing priorities;
• actions by regulatory authorities;
• production problems resulting in shortages of the drug being tested;
• failure of products being tested to satisfy safety requirements or efficacy criteria;
• unexpected or undesired clinical results for products;
• insufficient patient enrollment in a trial;
• insufficient investigator recruitment;
• shift of business to a competitor or internal resources;
• product withdrawal following market launch; or
• shut down of manufacturing facilities.
As a result, contract terminations, delays and alterations are a regular part of our business. In the event oftermination, our contracts often provide for fees for winding down the project, but these fees may not besufficient for us to maintain our margins, and termination may result in lower resource utilization rates. Inaddition, we may not realize the full benefits of our backlog of contractually committed services if our customerscancel, delay or reduce their commitments under our contracts with them, which may occur if, among otherthings, a customer decides to shift its business to a competitor or revoke our status as a preferred provider. Thus,the loss or delay of a large contract or the loss or delay of multiple contracts could adversely affect our servicerevenues and profitability. We believe the risk of loss or delay of multiple contracts potentially has greater effectwhere we are party to broader partnering arrangements with global biopharmaceutical companies.
Our financial results may be adversely affected if we underprice our contracts, overrun our cost estimates orfail to receive approval for or experience delays in documenting change orders.
Most of our contracts are either fee for service contracts or fixed-fee contracts. Our past financial resultshave been, and our future financial results may be, adversely impacted if we initially underprice our contracts orotherwise overrun our cost estimates and are unable to successfully negotiate a change order. Change orderstypically occur when the scope of work we perform needs to be modified from that originally contemplated byour contract with the customer. Modifications can occur, for example, when there is a change in a key trial
25
assumption or parameter or a significant change in timing. Where we are not successful in convertingout-of-scope work into change orders under our current contracts, we bear the cost of the additional work. Suchunderpricing, significant cost overruns or delay in documentation of change orders could have a material adverseeffect on our business, results of operations, financial condition or cash flows.
The relationship of backlog to revenues varies over time.
Backlog represents future service revenues from work not yet completed or performed under signedcontracts, letters of intent and, in some cases, pre-contract commitments that are supported by writtencommunications. Once work begins on a project, revenue is recognized over the duration of the project. Projectsmay be terminated or delayed by the customer or delayed by regulatory authorities for reasons beyond ourcontrol. To the extent projects are delayed, the timing of our revenue could be affected. In the event that acustomer cancels a contract, we typically would be entitled to receive payment for all services performed up tothe cancellation date and subsequent customer-authorized services related to terminating the canceled project.Typically, however, we have no contractual right to the full amount of the revenue reflected in our backlog in theevent of a contract cancellation. The duration of the projects included in our backlog, and the related revenuerecognition, range from a few weeks to many years. Our backlog may not be indicative of our future revenues,and we may not realize all the anticipated future revenue reflected in our backlog. A number of factors mayaffect backlog, including:
• the size, complexity and duration of the projects;
• the cancellation or delay of projects; and
• change in the scope of work during the course of a project.
Our backlog at December 31, 2013 was $9,855 million compared to backlog of $8,704 million atDecember 31, 2012. Although an increase in backlog will generally result in an increase in revenues to berecognized over time (depending on the level of cancellations), an increase in backlog at a particular point intime does not necessarily correspond directly to an increase in revenues during a particular period. The extent towhich contracts in backlog will result in revenue depends on many factors, including but not limited to deliveryagainst projected schedules, the need for scope changes (change orders), contract cancellations and the nature,duration, size, complexity and phase of the contracts, each of which factors can vary significantly from time totime. Our $9,855 million of backlog at December 31, 2013 included approximately $6,342 million of backlogthat we do not expect to generate revenue in 2014 as compared to our $8,704 million of backlog at December 31,2012, which included approximately $5,601 million of backlog that we did not expect to generate revenue in2013.
The rate at which our backlog converts to revenue may vary over time for a variety of reasons. The revenuerecognition on larger, more global projects could be slower than on smaller, less global projects for a variety ofreasons, including but not limited to an extended period of negotiation between the time the project is awarded tous and the actual execution of the contract, as well as an increased timeframe for obtaining the necessaryregulatory approvals. Additionally, delayed projects will remain in backlog, unless otherwise canceled by thecustomer, and will not generate revenue at the rate originally expected. Thus, the relationship of backlog torealized revenues may vary over time.
26

Our business depends on the continued effectiveness and availability of our information systems, includingthe information systems we use to provide our services to our customers, and failures of these systems maymaterially limit our operations.
Due to the global nature of our business and our reliance on information systems to provide our services, weintend to increase our use of web-enabled and other integrated information systems in delivering our services.We also provide access to similar information systems to certain of our customers in connection with the serviceswe provide them. As the breadth and complexity of our information systems continue to grow, we willincreasingly be exposed to the risks inherent in the development, integration and ongoing operation of evolvinginformation systems, including:
• disruption, impairment or failure of data centers, telecommunications facilities or other keyinfrastructure platforms;
• security breaches of, cyber attacks on and other failures or malfunctions in our critical applicationsystems or their associated hardware; and
• excessive costs, excessive delays or other deficiencies in systems development and deployment.
The materialization of any of these risks may impede the processing of data, the delivery of databases andservices, and the day-to-day management of our business and could result in the corruption, loss or unauthorizeddisclosure of proprietary, confidential or other data. While we have disaster recovery plans in place, they mightnot adequately protect us in the event of a system failure. Despite any precautions we take, damage from fire,floods, hurricanes, power loss, telecommunications failures, computer viruses, break-ins and similar events at ourvarious computer facilities could result in interruptions in the flow of data to our servers and from our servers toour customers. Corruption or loss of data may result in the need to repeat a trial at no cost to the customer, but atsignificant cost to us, the termination of a contract or damage to our reputation. Additionally, significant delaysin system enhancements or inadequate performance of new or upgraded systems once completed could damageour reputation and harm our business. Finally, long-term disruptions in the infrastructure caused by events suchas natural disasters, the outbreak of war, the escalation of hostilities and acts of terrorism, particularly involvingcities in which we have offices, could adversely affect our businesses. Although we carry property and businessinterruption insurance, our coverage might not be adequate to compensate us for all losses that may occur.
Unauthorized disclosure of sensitive or confidential data, whether through systems failure or employeenegligence, fraud or misappropriation, could damage our reputation and cause us to lose customers. Similarly, wehave been and expect that we will continue to be subject to attempts to gain unauthorized access to or throughour information systems or those we develop for our customers, whether by our employees or third parties,including a cyber attack by computer programmers and hackers who may develop and deploy viruses, worms orother malicious software programs. To date these attacks have not had a material impact on our operations orfinancial results. Nonetheless, successful attacks in the future could result in negative publicity, significantremediation costs, legal liability and damage to our reputation and could have a material adverse effect on ourresults of operations. In addition, our liability insurance might not be sufficient in type or amount to cover usagainst claims related to security breaches, cyber attacks and other related breaches.
We may be adversely affected by customer or therapeutic concentration.
Although we did not have any customer that represented 10% or more of our service revenues in 2013, 2012or 2011, we derive the majority of our revenues from a number of large customers. If any large customerdecreases or terminates its relationship with us, our business, results of operations or financial condition could bematerially adversely affected.
Additionally, conducting multiple clinical trials for different customers in a single therapeutic classinvolving drugs with the same or similar chemical action has in the past and may in the future adversely affectour business if some or all of the trials are canceled because of new scientific information or regulatoryjudgments that affect the drugs as a class or if industry consolidation results in the rationalization of drug
27

development pipelines. Similarly, marketing and selling drugs for different biopharmaceutical companies withsimilar chemical actions subjects us to risk if new scientific information or regulatory judgment prejudices thedrugs as a class, which may lead to compelled or voluntary prescription limitations or withdrawal of some or allof such drugs from the market.
Our business is subject to international economic, political and other risks that could negatively affect ourresults of operations and financial condition.
We have significant operations in foreign countries that may require complex arrangements to deliverservices on global contracts for our customers. Additionally, we have established operations in locations remotefrom our most developed business centers. As a result, we are subject to heightened risks inherent in conductingbusiness internationally, including the following:
• conducting a single trial across multiple countries is complex, and issues in one country, such as afailure to comply with local regulations or restrictions, may affect the progress of the trial in the othercountries, for example, by limiting the amount of data necessary for a trial to proceed, resulting indelays or potential cancellation of contracts, which in turn may result in loss of revenue;
• foreign countries could enact legislation or impose regulations or other restrictions, includingunfavorable labor regulations or tax policies, which could have an adverse effect on our ability toconduct business in or expatriate profits from those countries;
• foreign countries are expanding or may expand their regulatory framework with respect to patientinformed consent, protection and compensation in clinical trials, which could delay or inhibit ourability to conduct trials in such jurisdictions;
• the regulatory or judicial authorities of foreign countries may not enforce legal rights and recognizebusiness procedures in a manner in which we are accustomed or would reasonably expect;
• changes in political and economic conditions may lead to changes in the business environment inwhich we operate, as well as changes in foreign currency exchange rates;
• potential violations of local laws or anti-bribery laws, such as the United States Foreign CorruptPractices Act, may cause difficulty in staffing and managing foreign operations;
• customers in foreign jurisdictions may have longer payment cycles, and it may be more difficult tocollect receivables in foreign jurisdictions; and
• natural disasters, pandemics or international conflict, including terrorist acts, could interrupt ourservices, endanger our personnel or cause project delays or loss of trial materials or results.
These risks and uncertainties could negatively impact our ability to, among other things, perform large,global projects for our customers. Furthermore, our ability to deal with these issues could be affected byapplicable United States laws and the need to protect our assets. Any such risks could have an adverse impact onour financial condition and results of operations.
If we are unable to successfully develop and market new services or enter new markets, our growth, results ofoperations or financial condition could be adversely affected.
A key element of our growth strategy is the successful development and marketing of new services orentering new markets that complement or expand our existing business. As we develop new services or enter newmarkets, including services targeted at participants in the broader healthcare industry, we may not have oradequately build the competencies necessary to perform such services satisfactorily, may not receive marketacceptance for such services or may face increased competition. If we are unable to succeed in developing newservices, entering new markets or attracting a customer base for our new services or in new markets, we will beunable to implement this element of our growth strategy, and our future business, reputation, results of operationsand financial condition could be adversely affected.
28

Upgrading the information systems that support our operating processes and evolving the technology platformfor our services pose risks to our business.
Continued efficient operation of our business requires that we implement standardized global businessprocesses and evolve our information systems to enable this implementation. We have continued to undertakesignificant programs to optimize business processes with respect to our services. Our inability to effectivelymanage the implementation and adapt to new processes designed into these new or upgraded systems in a timelyand cost-effective manner may result in disruption to our business and negatively affect our operations.
We have entered into agreements with certain vendors to provide systems development and integrationservices that develop or license to us the IT platform for programs to optimize our business processes. If suchvendors fail to perform as required or if there are substantial delays in developing, implementing and updatingthe IT platform, our customer delivery may be impaired, and we may have to make substantial furtherinvestments, internally or with third parties, to achieve our objectives. Additionally, our progress may be limitedby parties with existing or claimed patents who seek to enjoin us from using preferred technology or seek licensepayments from us.
Meeting our objectives is dependent on a number of factors which may not take place as we anticipate,including obtaining adequate technology-enabled services, creating IT-enabled services that our customers willfind desirable and implementing our business model with respect to these services. Also, increased IT-relatedexpenditures may negatively impact our profitability.
If we fail to perform our services in accordance with contractual requirements, regulatory standards andethical considerations, we could be subject to significant costs or liability and our reputation could be harmed.
We contract with biopharmaceutical companies to perform a wide range of services to assist them inbringing new drugs to market. Our services include monitoring clinical trials, data and laboratory analysis,electronic data capture, patient recruitment and other related services. Such services are complex and subject tocontractual requirements, regulatory standards and ethical considerations. For example, we must adhere toregulatory requirements such as the FDA and current GCP, GLP and GMP requirements. If we fail to performour services in accordance with these requirements, regulatory agencies may take action against us for failure tocomply with applicable regulations governing clinical trials or sales and marketing practices. Such actions mayinclude sanctions, such as injunctions or failure of such regulatory authorities to grant marketing approval ofproducts, delay, suspension or withdrawal of approvals, license revocation, product seizures or recalls,operational restrictions, civil or criminal penalties or prosecutions, damages or fines. Customers may also bringclaims against us for breach of our contractual obligations and patients in the clinical trials and patients takingdrugs approved on the basis of those trials may bring personal injury claims against us for negligence. Any suchaction could have a material adverse effect on our results of operations, financial condition and reputation.
Such consequences could arise if, among other things, the following occur:
Improper performance of our services. The performance of clinical development services is complex andtime-consuming. For example, we may make mistakes in conducting a clinical trial that could negatively impactor obviate the usefulness of the trial or cause the results of the trial to be reported improperly. If the trial resultsare compromised, we could be subject to significant costs or liability, which could have an adverse impact on ourability to perform our services. As examples:
• non-compliance generally could result in the termination of ongoing clinical trials or sales andmarketing projects or the disqualification of data for submission to regulatory authorities;
• compromise of data from a particular trial, such as failure to verify that informed consent was obtainedfrom patients, could require us to repeat the trial under the terms of our contract at no further cost toour customer, but at a substantial cost to us; and
• breach of a contractual term could result in liability for damages or termination of the contract.
29

Large clinical trials can cost hundreds of millions of dollars, and while we endeavor to contractually limitour exposure to such risks, improper performance of our services could have an adverse effect on our financialcondition, damage our reputation and result in the cancellation of current contracts by or failure to obtain futurecontracts from the affected customer or other customers.
Interactive Response Technology malfunction. Cenduit LLC, our joint venture with Thermo FisherScientific Inc., or Cenduit, provides Interactive Response Technology, or IRT, services. IRT enables therandomization of patients in a given clinical trial to different treatment arms and regulates the supply of aninvestigational drug, all by means of interactive voice response and interactive web response systems. If IRTmalfunctions and, as a result, patients are incorrectly randomized or supplied with an incorrect drug during thecourse of the clinical trials, then any such event would create a risk of liability to Cenduit, which could have anadverse impact on the value of our investment in Cenduit, and could also result in a contractual claim against usfor failure to properly perform the clinical trial. Furthermore, negative publicity associated with an IRTmalfunction could have an adverse effect on our business and reputation. Additionally, errors in randomizationmay require us to repeat the trial at no further cost to our customer, but at a substantial cost to us.
Investigation of customers. From time to time, one or more of our customers are audited or investigated byregulatory authorities or enforcement agencies with respect to regulatory compliance of their clinical trials,programs or the marketing and sale of their drugs. In these situations, we have often provided services to ourcustomers with respect to the clinical trials, programs or activities being audited or investigated, and we arecalled upon to respond to requests for information by the authorities and agencies. There is a risk that either ourcustomers or regulatory authorities could claim that we performed our services improperly or that we areresponsible for clinical trial or program compliance. If our customers or regulatory authorities make such claimsagainst us and prove them, we could be subject to damages, fines or penalties. In addition, negative publicityregarding regulatory compliance of our customers’ clinical trials, programs or drugs could have an adverse effecton our business and reputation.
Insufficient customer funding to complete a clinical trial. As noted above, clinical trials can cost hundreds ofmillions of dollars. There is a risk that we may initiate a clinical trial for a customer, and then the customerbecomes unwilling or unable to fund the completion of the trial. In such a situation, notwithstanding thecustomer’s ability or willingness to pay for or otherwise facilitate the completion of the trial, we may be ethicallybound to complete or wind down the trial at our own expense.
Our research and development services could subject us to potential liability that may adversely affect ourresults of operations and financial condition.
Our business involves the testing of new drugs on patients in clinical trials and, if marketing approval isgranted, the availability of these drugs to be prescribed to patients. Our involvement in the clinical trials anddevelopment process creates a risk of liability for personal injury to or death of patients, particularly those withlife-threatening illnesses, resulting from adverse reactions to the drugs administered during testing or afterproduct launch, respectively. For example, we have from time to time been sued and may be sued in the future byindividuals alleging personal injury due to their participation in clinical trials and seeking damages from us undera variety of legal theories. Although we maintain the types and amounts of insurance customary in the industriesand countries in which we operate, if we are required to pay damages or incur defense costs in connection withany personal injury claim that is outside the scope of indemnification agreements we have with our customers, ifany indemnification agreement is not performed in accordance with its terms or if our liability exceeds theamount of any applicable indemnification limits or available insurance coverage, our financial condition, resultsof operations and reputation could be materially and adversely affected. Currently, we maintain professionalliability insurance, including products liability for completed operations coverage, with annual aggregate limitsin excess of $50.0 million. In the future, we may not be able to get adequate insurance for these types of risks atreasonable rates.
30

We also contract with physicians to serve as investigators in conducting clinical trials. If the investigatorscommit errors or make omissions during a clinical trial that result in harm to trial patients or after a clinical trialto a patient using the drug after it has received regulatory approval, claims for personal injury or productsliability damages may result. Additionally, if the investigators engage in fraudulent behavior, trial data may becompromised, which may require us to repeat the clinical trial or subject us to liability. We do not believe we arelegally responsible for the medical care rendered by such third-party investigators, and we would vigorouslydefend any claims brought against us. However, it is possible we could be found liable for claims with respect tothe actions of third-party investigators.
Some of our services involve direct interaction with clinical trial subjects or volunteers and operation of PhaseI clinical facilities, which could create potential liability that may adversely affect our results of operationsand financial condition.
We operate two facilities where Phase I clinical trials are conducted, which ordinarily involve testing aninvestigational drug on a limited number of healthy individuals, typically 20 to 80 persons, to determine suchdrug’s basic safety. Failure to operate such a facility in accordance with applicable regulations could result in thatfacility being shut down, which could disrupt our operations. Additionally, we face risks associated with adverseevents resulting from the administration of such drugs to healthy volunteers and the professional malpractice ofmedical care providers. Occasionally, physicians employed at our Phase I clinical facilities act as principalinvestigators in later-phase trials at those same facilities. We also directly employ nurses and other trainedemployees who assist in implementing the testing involved in our clinical trials, such as drawing blood fromhealthy volunteers. Any professional malpractice or negligence by such investigators, nurses or other employeescould potentially result in liability to us in the event of personal injury to or death of a healthy volunteer inclinical trials. This liability, particularly if it were to exceed the limits of any indemnification agreements andinsurance coverage we may have, may adversely affect our financial condition, results of operations andreputation.
Our commercial services could result in liability to us if a drug causes harm to a patient. While we aregenerally indemnified and insured against such risks, we may still suffer financial losses.
When we market drugs under contract for a biopharmaceutical company, we could suffer liability for harmallegedly caused by those drugs, either as a result of a lawsuit against the biopharmaceutical company to whichwe are joined, a lawsuit naming us or any of our subsidiaries or an action launched by a regulatory body. Whilewe are indemnified by the biopharmaceutical company for the action of the drugs we market on its behalf, andwe carry insurance to cover harm caused by our negligence in performing services, it is possible that we couldnonetheless incur financial losses, regulatory penalties or both. In particular, any claim could result in potentialliability for us if the claim is outside the scope of the indemnification agreement we have with thebiopharmaceutical company, the biopharmaceutical company does not abide by the indemnification agreement asrequired or the liability exceeds the amount of any applicable indemnification limits or available insurancecoverage. Such a finding could have an adverse impact on our financial condition, results of operations andreputation. Furthermore, negative publicity associated with harm caused by drugs we helped to market couldhave an adverse effect on our business and reputation.
Our insurance may not cover all of our indemnification obligations and other liabilities associated with ouroperations.
We maintain insurance designed to provide coverage for ordinary risks associated with our operations andour ordinary indemnification obligations with annual aggregate limits in excess of $50.0 million. The coverageprovided by such insurance may not be adequate for all claims we may make or may be contested by ourinsurance carriers. If our insurance is not adequate or available to pay liabilities associated with our operations,or if we are unable to purchase adequate insurance at reasonable rates in the future, our profitability may beadversely impacted.
31
If we are unable to attract suitable investigators and patients for our clinical trials, our clinical developmentbusiness might suffer.
The recruitment of investigators and patients for clinical trials is essential to our business. Investigators aretypically located at hospitals, clinics or other sites and supervise the administration of the investigational drug topatients during the course of a clinical trial. Patients generally include people from the communities in which theclinical trials are conducted. Our clinical development business could be adversely affected if we are unable toattract suitable and willing investigators or patients for clinical trials on a consistent basis. For example, if we areunable to engage investigators to conduct clinical trials as planned or enroll sufficient patients in clinical trials,we might need to expend additional funds to obtain access to resources or else be compelled to delay or modifythe clinical trial plans, which may result in additional costs to us.
If we lose the services of key personnel or are unable to recruit experienced personnel, our business could beadversely affected.
Our success substantially depends on the collective performance, contributions and expertise of our seniormanagement team and other key personnel including qualified management, professional, scientific and technicaloperating staff and qualified sales representatives for our contract sales services. There is significant competitionfor qualified personnel, particularly those with higher educational degrees, such as a medical degree, a Ph.D. oran equivalent degree, in the biopharmaceutical and biopharmaceutical services industries. The departure of anykey executive, or our inability to continue to identify, attract and retain qualified personnel or replace anydeparted personnel in a timely fashion, may impact our ability to grow our business and compete effectively inour industry and may negatively affect our ability to meet financial and operational goals.
Exchange rate fluctuations may affect our results of operations and financial condition.
In 2013, approximately 37.8% of our service revenues were denominated in currencies other than the UnitedStates dollar. Because a large portion of our service revenues and expenses are denominated in currencies otherthan the United States dollar and our financial statements are reported in United States dollars, changes in foreigncurrency exchange rates could significantly affect our results of operations and financial condition. Exchangerate fluctuations between local currencies and the United States dollar create risk in several ways, including:
Foreign Currency Translation Risk. The revenue and expenses of our foreign operations are generallydenominated in local currencies and translated into United States dollars for financial reporting purposes.Accordingly, exchange rate fluctuations will affect the translation of foreign results into United States dollars forpurposes of reporting our consolidated results.
Foreign Currency Transaction Risk. We are subject to foreign currency transaction risk for fluctuations inexchange rates during the period of time between the consummation and cash settlement of a transaction. Weearn revenue from our service contracts over a period of several months and, in some cases, over several years.Accordingly, exchange rate fluctuations during this period may affect our profitability with respect to suchcontracts.
We may limit these risks through exchange rate fluctuation provisions stated in our service contracts, or wemay hedge our transaction risk with foreign currency exchange contracts or options. We have not, however,hedged 100% of our foreign currency transaction risk, and we may experience fluctuations in financial resultsfrom our operations outside the United States and foreign currency transaction risk associated with our servicecontracts.
Disruptions in the credit and capital markets and unfavorable general economic conditions could negativelyaffect our business, results of operations and financial condition.
Disruptions in the credit and capital markets could have negative effects on our business that may bedifficult to predict or anticipate, including the ability of our customers, vendors, contractors and financingsources to meet their contractual obligations. Although we are unable to quantify the impact it has had on us, we
32

are aware of a limited number of instances during the past several years where cancellations, changes in scopeand failure to pay timely were attributable, at least in part, to difficulty in our customers’ ability to obtainfinancing. In the future such actions by our customers could, if they involve a significant amount of business withus, have a material adverse effect on our results of operations.
Our effective income tax rate may fluctuate, which may adversely affect our operations, earnings andearnings per share.
Our effective income tax rate is influenced by our projected profitability in the various taxing jurisdictionsin which we operate. Changes in the distribution of profits and losses among taxing jurisdictions may have asignificant impact on our effective income tax rate, which in turn could have an adverse effect on our net incomeand earnings per share. Factors that may affect our effective income tax rate include, but are not limited to:
• the requirement to exclude from our quarterly worldwide effective income tax calculations losses injurisdictions where no income tax benefit can be recognized;
• actual and projected full year pre-tax income;
• the repatriation of foreign earnings to the United States;
• changes in tax laws in various taxing jurisdictions;
• audits by taxing authorities; and
• the establishment of valuation allowances against deferred income tax assets if we determined that it ismore likely than not that future income tax benefits will not be realized.
These changes may cause fluctuations in our effective income tax rate that could adversely affect our resultsof operations and cause fluctuations in our earnings and earnings per share.
We have only a limited ability to protect our intellectual property rights, and these rights are important to oursuccess.
Our success depends, in part, upon our ability to develop, use and protect our proprietary methodologies,analytics, systems, technologies and other intellectual property. Existing laws of the various countries in whichwe provide services or solutions offer only limited protection of our intellectual property rights, and theprotection in some countries may be very limited. We rely upon a combination of trade secrets, confidentialitypolicies, nondisclosure, invention assignment and other contractual arrangements, and patent, copyright andtrademark laws, to protect our intellectual property rights. These laws are subject to change at any time andcertain agreements may not be fully enforceable, which could further restrict our ability to protect ourinnovations. Our intellectual property rights may not prevent competitors from independently developingservices similar to or duplicative of ours. Further, the steps we take in this regard might not be adequate toprevent or deter infringement or other misappropriation of our intellectual property by competitors, formeremployees or other third parties, and we might not be able to detect unauthorized use of, or take appropriate andtimely steps to enforce, our intellectual property rights. Enforcing our rights might also require considerable time,money and oversight, and we may not be successful in enforcing our rights.
Depending on the circumstances, we might need to grant a specific customer greater rights in intellectualproperty developed in connection with a contract than we otherwise generally do. In certain situations, we mightforego all rights to the use of intellectual property we create, which would limit our ability to reuse thatintellectual property for other customers. Any limitation on our ability to provide a service or solution couldcause us to lose revenue-generating opportunities and require us to incur additional expenses to develop orlicense new or modified solutions for future projects.
33

Our relationships with existing or potential customers who are in competition with each other may adverselyimpact the degree to which other customers or potential customers use our services, which may adverselyaffect our results of operations.
The biopharmaceutical industry is highly competitive, with biopharmaceutical companies each seeking topersuade payers, providers and patients that their drug therapies are better and more cost-effective thancompeting therapies marketed or being developed by competing firms. In addition to the adverse competitiveinterests that biopharmaceutical companies have with each other, biopharmaceutical companies also haveadverse interests with respect to drug selection and reimbursement with other participants in the healthcareindustry, including payers and providers. Biopharmaceutical companies also compete to be first to market withnew drug therapies. We regularly provide services to biopharmaceutical companies who compete with eachother, and we sometimes provide services or funding to such customers regarding competing drugs indevelopment. Our existing or future relationships with our biopharmaceutical customers may therefore deterother biopharmaceutical customers from using our services or may result in our customers seeking to place limitson our ability to serve other biopharmaceutical industry participants. In addition, our further expansion into thebroader healthcare market may adversely impact our relationships with biopharmaceutical customers, and suchcustomers may elect not to use our services, reduce the scope of services that we provide to them or seek to placerestrictions on our ability to serve customers in the broader healthcare market with interests that are adverse totheirs. Any loss of customers or reductions in the level of revenues from a customer could have a materialadverse effect on our results of operations, business and prospects.
If we are unable to successfully identify, acquire and integrate existing businesses, services and technologies,our business, results of operations and financial condition could be adversely impacted.
We anticipate that a portion of our future growth may come from acquiring existing businesses, services ortechnologies. The success of any acquisition will depend upon, among other things, our ability to effectivelyintegrate acquired personnel, operations, products and technologies into our business and to retain the keypersonnel and customers of our acquired businesses. In addition, we may be unable to identify suitableacquisition opportunities or obtain any necessary financing on commercially acceptable terms. We may alsospend time and money investigating and negotiating with potential acquisition targets but not complete thetransaction. Any future acquisition could involve other risks, including, among others, the assumption ofadditional liabilities and expenses, difficulties and expenses in connection with integrating the acquiredcompanies and achieving the expected benefits, issuances of potentially dilutive securities or interest-bearingdebt, loss of key employees of the acquired companies, transaction costs, diversion of management’s attentionfrom other business concerns and, with respect to the acquisition of foreign companies, the inability to overcomedifferences in foreign business practices, language and customs. Our failure to identify potential acquisitions,complete targeted acquisitions and integrate completed acquisitions could have a material adverse effect on ourbusiness, financial condition and results of operations.
Investments in our customers’ businesses or drugs and our related commercial rights strategies could have anegative impact on our financial performance.
We may enter into arrangements with our customers or other drug companies in which we take on some ofthe risk of the potential success or failure of their businesses or drugs, including making strategic investments inour customers or other drug companies, providing financing to customers or other drug companies or acquiringan interest in the revenues from customers’ drugs or in entities developing a limited number of drugs. As ofDecember 31, 2013, we had approximately $42.0 million of such arrangements, and we were also committed toinvest an additional $34.2 million in the NovaQuest Pharma Opportunities Fund III, L.P., or the Fund, a privateequity fund that seeks to enter into similar risk-based arrangements. Our financial results would be adverselyaffected if these investments or the underlying drugs result in losses or do not achieve the level of success that weanticipate and/or our return or payment from the drug investment or financing is less than our direct and indirectcosts with respect to these arrangements.
34

Our results of operations may be adversely affected if we fail to realize the full value of our goodwill andintangible assets.
As of December 31, 2013, we had goodwill and net intangible assets of $707.7 million, which constitutedapproximately 23.1% of our total assets at the end of this period. We assess the realizability of our indefinite-lived intangible assets and goodwill annually and conduct an interim evaluation whenever events or changes incircumstances, such as operating losses or a significant decline in earnings associated with the acquired businessor asset, indicate that these assets may be impaired. Our ability to realize the value of the goodwill and indefinite-lived intangible assets will depend on the future cash flows of the businesses we have acquired, which in turndepend in part on how well we have integrated these businesses into our own business. If we are not able torealize the value of the goodwill and indefinite-lived intangible assets, we may be required to incur materialcharges relating to the impairment of those assets. Such impairment charges could materially and adversely affectour operating results and financial condition.
We face risks arising from the restructuring of our operations.
From time to time, we have adopted restructuring plans to improve our operating efficiency through variousmeans such as reduction of overcapacity, elimination of non-billable support roles or other realignment ofresources. For example, in February 2013, our Board approved a restructuring plan of up to $15.0 million that isexpected to result in a reduction of approximately 400 positions. We recognized approximately $14.2 million oftotal restructuring costs related to this plan in 2013. In May 2012, our Board approved a restructuring plan of upto $20.0 million that resulted in the reduction of approximately 280 positions, primarily in Europe. Restructuringpresents significant potential risks of events occurring that could adversely affect us, including a decrease inemployee morale, the failure to achieve targeted cost savings and the failure to meet operational targets andcustomer requirements due to the loss of employees and any work stoppages that might occur.
We depend on third parties for critical support services.
We depend on third parties for support services vital to our business. Such support services include, but arenot limited to, third-party transportation providers, suppliers of drugs for patients participating in clinical trials,suppliers of kits for use in our central laboratory business, suppliers of reagents for use in our testing equipmentand providers of maintenance contracts for our equipment. The failure of any of these third parties to adequatelyprovide the critical support services could have a material adverse effect on our business.
Risks Relating to Our Industry
The biopharmaceutical services industry is highly competitive.
The biopharmaceutical services industry is highly competitive. We often compete for business with otherbiopharmaceutical services companies, internal discovery departments, development departments, and sales andmarketing departments within our customers, some of which could be considered large biopharmaceuticalservices companies in their own right with greater resources than ours. We also compete with universities andteaching hospitals. If we do not compete successfully, our business will suffer. The industry is highlyfragmented, with numerous smaller specialized companies and a handful of full-service companies with globalcapabilities similar to ours. Increased competition has led to price and other forms of competition, such asacceptance of less favorable contract terms, that could adversely affect our operating results. As a result ofcompetitive pressures, in recent years our industry has experienced consolidation and “going private”transactions. This trend is likely to produce more competition from the resulting larger companies, and oneswithout the cost pressures of being public, for both customers and acquisition candidates. In addition, there arefew barriers to entry for smaller specialized companies considering entering the industry. Because of their sizeand focus, these companies might compete effectively against larger companies such as us, which could have amaterial adverse impact on our business.
35

Outsourcing trends in the biopharmaceutical industry and changes in aggregate spending and R&D budgetscould adversely affect our operating results and growth rate.
Economic factors and industry trends that affect biopharmaceutical companies affect our business.Biopharmaceutical companies continue to seek long-term strategic collaborations with global CROs withfavorable pricing terms. Competition for these collaborations is intense and we may decide to forego anopportunity or we may not be selected, in which case a competitor may enter into the collaboration and ourbusiness with the customer, if any, may be limited. In addition, if the biopharmaceutical industry reduces itsoutsourcing of clinical trials and sales and marketing projects or such outsourcing fails to grow at projected rates,our operations and financial condition could be materially and adversely affected. We may also be negativelyimpacted by consolidation and other factors in the biopharmaceutical industry, which may slow decision makingby our customers or result in the delay or cancellation of clinical trials. Our commercial services may be affectedby reductions in new drug launches and increases in the number of drugs losing patent protection. All of theseevents could adversely affect our business, results of operations or financial condition.
We may be affected by healthcare reform and potential additional reforms.
In March 2010, the United States Congress enacted healthcare reform legislation intended to expand, overtime, health insurance coverage and impose health industry cost containment measures. This legislation maysignificantly impact the biopharmaceutical industry. In addition, numerous government bodies are considering orhave adopted various healthcare reforms and may undertake, or are in the process of undertaking, efforts tocontrol growing healthcare costs through legislation, regulation and voluntary agreements with medical careproviders and biopharmaceutical companies. We are uncertain as to the effects of these recent reforms on ourbusiness and are unable to predict what legislative proposals, if any, will be adopted in the future. If regulatorycost containment efforts limit the profitability of new drugs, our customers may reduce their R&D spending orpromotional, marketing and sales expenditures, which could reduce the business they outsource to us. Similarly,if regulatory requirements are relaxed or simplified drug approval procedures are adopted, the demand for ourservices could decrease.
Government bodies may also adopt healthcare legislation or regulations that are more burdensome thanexisting regulations. For example, product safety concerns and recommendations by the Drug Safety OversightBoard could change the regulatory environment for drug products, and new or heightened regulatoryrequirements may increase our expenses or limit our ability to offer some of our services. Additionally, new orheightened regulatory requirements may have a negative impact on the ability of our customers to conductindustry-sponsored clinical trials, which could reduce the need for our services.
Actions by government regulators or customers to limit a prescription’s scope or withdraw an approved drugfrom the market could adversely affect our business and result in a loss of revenues.
Government regulators have the authority, after approving a drug, to limit its scope of prescription orwithdraw it from the market completely based on safety concerns. Similarly, customers may act to voluntarilylimit the scope of prescription of drugs or withdraw them from the market. In the past, we have provided serviceswith respect to drugs that have been limited and/or withdrawn. If we are providing services to customers fordrugs that are limited or withdrawn, we may be required to narrow the scope of or terminate our services withrespect to such drugs, which would prevent us from earning the full amount of service revenues anticipated underthe related service contracts with negative impacts to our financial results.
Current and proposed laws and regulations regarding the protection of personal data could result in increasedrisks of liability or increased cost to us or could limit our service offerings.
The confidentiality, collection, use and disclosure of personal data, including clinical trial patient-specificinformation, are subject to governmental regulation generally in the country that the personal data were collectedor used. For example, United States federal regulations under the Health Insurance Portability and AccountabilityAct of 1996, or HIPAA, require individuals’ written authorization, in addition to any required informed consent,
36

before Protected Health Information may be used for research and such regulations specify standards fordeidentifications and for limited data sets. We are both directly and indirectly affected by the privacy provisionssurrounding individual authorizations because many investigators with whom we are involved in clinical trialsare directly subject to them as a HIPAA “covered entity” and because we obtain identifiable health informationfrom third parties that are subject to such regulations. Because of amendments to the HIPAA data security andprivacy rules that were promulgated on January 25, 2013 and effective March 26, 2013, there are some instanceswhere we are a HIPAA “business associate” of a “covered entity”, so that we will be directly liable formishandling protected health information. These amendments will subject us to HIPAA’s enforcement scheme,which, as amended, can yield up to $1.5 million in annual civil penalties for each HIPAA violation.
In the European Union, or EU, personal data includes any information that relates to an identified oridentifiable natural person with health information carrying additional obligations, including obtaining theexplicit consent from the individual for collection, use or disclosure of the information. In addition, we aresubject to EU rules with respect to cross-border transfers of such data out of the EU. The United States, the EUand its member states, and other countries where we have operations, such as Japan, continue to issue newprivacy and data protection rules and regulations that relate to personal data and health information. Failure tocomply with certain certification/registration and annual re-certification/registration provisions associated withthese data protection and privacy regulations and rules in various jurisdictions, or to resolve any serious privacycomplaints, could subject us to regulatory sanctions, criminal prosecution or civil liability. Federal, state andforeign governments are contemplating or have proposed or adopted additional legislation governing thecollection, possession, use or dissemination of personal data, such as personal health information, and personalfinancial data as well as security breach notification rules for loss or theft of such data. Additional legislation orregulation of this type might, among other things, require us to implement new security measures and processesor bring within the legislation or regulation de-identified health or other personal data, each of which may requiresubstantial expenditures or limit our ability to offer some of our services. Additionally, if we violate applicablelaws, regulations or duties relating to the use, privacy or security of personal data, we could be subject to civilliability or criminal prosecution, be forced to alter our business practices and suffer reputational harm. In the nextfew years, the European data protection framework may be revised as a generally applicable data regulation. Thetext has not yet been finalized, but it contains new provisions specifically directed at the processing of healthinformation, sanctions of up to 5% of worldwide gross revenue and extra-territoriality measures intended to bringnon-EU companies under the proposed regulation.
If we do not keep pace with rapid technological changes, our services may become less competitive or obsolete.
The biopharmaceutical industry generally, and drug development and clinical research more specifically, aresubject to rapid technological changes. Our current competitors or other businesses might develop technologiesor services that are more effective or commercially attractive than, or render obsolete, our current or futuretechnologies and services. If our competitors introduce superior technologies or services and if we cannot makeenhancements to remain competitive, our competitive position would be harmed. If we are unable to competesuccessfully, we may lose customers or be unable to attract new customers, which could lead to a decrease in ourrevenue and financial condition.
The biopharmaceutical industry has a history of patent and other intellectual property litigation, and we mightbe involved in costly intellectual property lawsuits.
The biopharmaceutical industry has a history of intellectual property litigation, and these lawsuits will likelycontinue in the future. Accordingly, we may face patent infringement suits by companies that have patents forsimilar business processes or other suits alleging infringement of their intellectual property rights. Legalproceedings relating to intellectual property could be expensive, take significant time and divert management’sattention from other business concerns, regardless of the outcome of the litigation. If we do not prevail in aninfringement lawsuit brought against us, we might have to pay substantial damages, and we could be required tostop the infringing activity or obtain a license to use technology on unfavorable terms.
37

Risks Relating to Our Indebtedness
Our substantial debt could adversely affect our financial condition.
As of December 31, 2013, we had $3.067 billion in total assets, $3.734 billion in total liabilities and ashareholders’ deficit of $667 million. Included within total liabilities was $2.046 billion of total indebtedness,excluding $300.0 million of additional available borrowings under our revolving credit facility. Our substantialindebtedness could adversely affect our financial condition and thus make it more difficult for us to satisfy ourobligations with respect to our credit facilities. If our cash flow is not sufficient to service our debt andadequately fund our business, we may be required to seek further additional financing or refinancing or disposeof assets. We may not be able to influence any of these alternatives on satisfactory terms or at all. Our substantialindebtedness could also:
• increase our vulnerability to adverse general economic and industry conditions;
• require us to dedicate a substantial portion of our cash flows from operations to payments on ourindebtedness, thereby reducing the availability of our cash flows to fund working capital, investments,acquisitions, capital expenditures, R&D efforts and other general corporate purposes;
• limit our ability to make required payments under our existing contractual commitments, including ourexisting long-term indebtedness;
• limit our flexibility in planning for, or reacting to, changes in our business and the industry in which weoperate;
• place us at a competitive disadvantage compared to our competitors that have less debt;
• cause us to incur substantial fees from time to time in connection with debt amendments orrefinancings;
• increase our exposure to rising interest rates because a portion of our borrowings is at variable interestrates; and
• limit our ability to borrow additional funds or to borrow on terms that are satisfactory to us.
Despite our level of indebtedness, we are able to incur more debt and undertake additional obligations.Incurring such debt or undertaking such additional obligations could further exacerbate the risks to ourfinancial condition.
Although our credit agreement, which governs the Quintiles Transnational senior credit facilities, containsrestrictions on the incurrence of additional indebtedness, these restrictions are subject to a number ofqualifications and exceptions and the indebtedness incurred in compliance with these restrictions could increase.We have approximately $300.0 million available for borrowing under our senior secured revolving credit facility.
While the credit agreement also contains restrictions on our and our restricted subsidiaries’ ability to makeloans and investments, these restrictions are subject to a number of qualifications and exceptions, and theinvestments incurred in compliance with these restrictions could be substantial.
If we do not comply with the covenants governing our credit facilities, we may not have the funds necessary topay all of our indebtedness that could become due.
The credit agreement governing our credit facilities requires us to comply with certain covenants. Inparticular, our credit agreement prohibits us from incurring any additional indebtedness, except in specifiedcircumstances, or amending the terms of agreements relating to certain existing junior indebtedness, if any, in amanner materially adverse to the lenders under our credit agreement, without lender approval. Further, our creditagreement contains customary covenants, including covenants that restrict our ability to acquire and dispose ofassets, engage in mergers or reorganizations, pay dividends or make investments. In addition, our credit
38
agreement requires us to make mandatory principal prepayments in certain circumstances, including with aportion of our excess cash flow if Quintiles Transnational’s total leverage ratio (as defined in the creditagreement) exceeds certain levels. A violation of any of these covenants could cause an event of default underour credit agreement.
If we default on our credit agreement as a result of our failure to pay principal or interest when due, ourmaterial breach of any representation, warranty or covenant, or any other reason, all outstanding amounts couldbecome immediately due and payable. In such case, we may not have sufficient funds to repay all the outstandingamounts. In addition, or in the alternative, the lenders under our credit agreement could exercise their rightsunder the security documents entered into in connection with the credit agreement. Any acceleration of amountsdue under the credit agreement governing our outstanding indebtedness or the substantial exercise by the lendersof their rights under the security documents would likely have a material adverse effect on us.
Interest rate fluctuations may affect our results of operations and financial condition.
Because we have variable rate debt, fluctuations in interest rates affect our business. We attempt tominimize interest rate risk and lower our overall borrowing costs through the utilization of derivative financialinstruments, primarily interest rate swaps. We have entered into interest rate swaps with financial institutions thathave reset dates and critical terms that match those of our term loan credit facility. Accordingly, any change inmarket value associated with the interest rate swaps is offset by the opposite market impact on the related debt.As of December 31, 2013, we had approximately $2.061 billion of total indebtedness with variable interest at thegreater of the three month LIBOR or 1.25%, plus 2.50%, or 3.75% at December 31, 2013, of which $945.0million, or 45.9%, was hedged at a fixed rate of 2.55%, leaving approximately $1.116 billion of unhedgedvariable rate debt. Because we do not attempt to hedge all of our variable rate debt, we may incur higher interestcosts for the portion of our variable rate debt which is not hedged. Each quarter-point increase or decrease in thevariable interest rate would result in our interest expense changing by approximately $2.8 million per year underour unhedged variable rate debt.
Risks Relating to Ownership of Our Common Stock
The parties to the Shareholders Agreement have significant influence over us, including control overdecisions that require the approval of our shareholders, which could limit your ability to influence theoutcome of matters submitted to shareholders for a vote.
We and certain of our shareholders are party to a shareholders agreement dated January 22, 2008, asamended, or the Shareholders Agreement. The shareholders party to the Shareholders Agreement beneficiallyowned approximately 65% of our common stock as of February 6, 2014. The Shareholders Agreement, amongother things, requires such shareholders to vote in favor of certain nominees to our Board. As long as this groupowns or controls at least a majority of our outstanding voting power, it has the ability to exercise substantialcontrol over all corporate actions requiring shareholder approval, irrespective of how our other shareholders mayvote, including:
• the election and removal of directors and the size of our Board;
• any amendment of our articles of incorporation or bylaws; or
• the approval of mergers and other significant corporate transactions, including a sale of substantially allof our assets.
39

We are a “controlled company” within the meaning of the NYSE rules and, as a result, qualify for, and relyon, exemptions from certain corporate governance requirements. Our shareholders do not have the sameprotections afforded to shareholders of companies that are subject to such requirements.
The parties to the Shareholders Agreement control a majority of the voting power of our outstandingcommon stock. As a result, we are a “controlled company” within the meaning of the corporate governancestandards of the NYSE. Under these rules, a company of which more than 50% of the voting power for theelection of directors is held by an individual, group or another company is a “controlled company” and may electnot to comply with certain corporate governance requirements, including the requirements that, within one yearof the date of the listing of our common stock:
• we have a board that is composed of a majority of “independent directors,” as defined under the rulesof such exchange;
• we have a compensation committee that is composed entirely of independent directors; and
• we have a nominating and corporate governance committee that is composed entirely of independentdirectors.
Because we utilize these exemptions, we do not have a majority of independent directors on our Board. Inaddition, our Compensation and Talent Development Committee and our Governance, Quality and NominatingCommittee do not consist entirely of independent directors and are not subject to annual performanceevaluations. Accordingly, our shareholders do not have the same protections afforded to shareholders ofcompanies that are subject to all of the corporate governance requirements of the NYSE.
Provisions of our corporate governance documents could make an acquisition of our company more difficultand may prevent attempts by our shareholders to replace or remove our current management, even ifbeneficial to our shareholders.
Provisions of our articles of incorporation and our bylaws may discourage, delay or prevent a merger,acquisition or other change in control of our company that shareholders may consider favorable, includingtransactions in which you might otherwise receive a premium for your shares. These provisions could also limitthe price that investors might be willing to pay in the future for shares of our common stock, thereby depressingthe market price of our common stock. In addition, these provisions may frustrate or prevent any attempts by ourshareholders to replace or remove our current management by making it more difficult for shareholders toreplace members of our Board. Because our Board is responsible for appointing the members of our managementteam, these provisions could in turn affect any attempt to replace current members of our management team.Among others, these provisions include (1) our ability to issue preferred stock without shareholder approval,(2) the requirement that our shareholders may not act without a meeting, (3) requirements for advancenotification of shareholder nominations and proposals contained in our bylaws, (4) the absence of cumulativevoting for our directors, (5) requirements for shareholder approval of certain business combinations and (6) thelimitations on director nominations contained in our Shareholders Agreement.
Our operating results and share price may be volatile, which could cause the value of our shareholders’investments to decline.
Our quarterly and annual operating results may fluctuate in the future, and such fluctuations may besignificant. In addition, securities markets worldwide have experienced, and are likely to continue to experience,significant price and volume fluctuations. This market volatility, as well as general economic, market or politicalconditions, could subject the market price of our shares to wide price fluctuations regardless of our operatingperformance. Our operating results and the trading price of our shares may fluctuate in response to variousfactors, including:
• market conditions in the broader stock market;
• actual or anticipated fluctuations in our quarterly and annual financial and operating results;
40

• introduction of new products or services by us or our competitors;
• issuance of new or changed securities analysts’ reports or recommendations;
• sales, or anticipated sales, of large blocks of our stock;
• additions or departures of key personnel;
• regulatory or political developments;
• litigation and governmental investigations;
• changing economic conditions; and
• exchange rate fluctuations.
These and other factors, many of which are beyond our control, may cause our operating results and themarket price for our shares to fluctuate substantially. While we believe that operating results for any particularquarter are not necessarily a meaningful indication of future results, fluctuations in our quarterly operating resultscould limit or prevent investors from readily selling their shares and may otherwise negatively affect the marketprice and liquidity of our shares. In addition, in the past, when the market price of a stock has been volatile,holders of that stock have sometimes instituted securities class action litigation against the company that issuedthe stock. If any of our shareholders brought a lawsuit against us, we could incur substantial costs defending thelawsuit. Such a lawsuit could also divert the time and attention of our management from our business, whichcould significantly harm our profitability and reputation.
There may be sales of a substantial amount of our common stock by our current shareholders, and these salescould cause the price of our common stock to fall.
As of February 6, 2014, there were 129,842,707 shares of common stock outstanding. Approximately 65%of our outstanding common stock is held by parties to the Shareholders Agreement.
Sales of substantial amounts of our common stock in the public market, or the perception that such saleswill occur, could adversely affect the market price of our common stock and make it difficult for us to raise fundsthrough securities offerings in the future.
Shareholders that are a party to an amended and restated registration rights agreement, or the RegistrationRights Agreement, may require us to register their shares for resale under the federal securities laws. Under theRegistration Rights Agreement, we are required to pay the registration expenses associated with the registrationof such shares, not including the underwriting discounts, commissions and transfer taxes. Registration of thoseshares would allow those shareholders to immediately resell their shares in the public market. Any such sales orthe anticipation of such sales may cause the market price of our common stock to decline.
Since we have no current plans to pay regular cash dividends on our common stock, shareholders may notreceive any return on investment unless they sell their common stock for a price greater than that which theypaid for it.
Although we have previously declared dividends to our shareholders, we do not currently anticipate payingany regular cash dividends on our common stock. Any decision to declare and pay dividends in the future will bemade at the discretion of our Board and will depend on, among other things, our results of operations, financialcondition, cash requirements, contractual restrictions and other factors that our Board may deem relevant. Inaddition, our ability to pay dividends is, and may be, limited by covenants of existing and any future outstandingindebtedness we or our subsidiaries incur, including under our existing credit facilities. Therefore, any return oninvestment in our common stock is solely dependent upon the appreciation of the price of our common stock onthe open market, which may not occur. See Part II, Item 5 “Market for Registrant’s Common Equity, RelatedStockholder Matters and Issuer Purchases of Equity Securities—Policy” for more detail.
41

Our amended and restated articles of incorporation contain a provision renouncing any interest andexpectancy in certain corporate opportunities identified by certain of our affiliates, even if such corporateopportunities are ones that we might reasonably be deemed to have pursued or had the ability or desire topursue.
Our amended and restated articles of incorporation provide for the allocation of certain corporateopportunities between us, on the one hand, and certain of our shareholders, on the other hand. As set forth in ouramended and restated articles of incorporation, neither such shareholders, nor any director, officer, shareholder,member, manager, or employee of such shareholders, have any fiduciary duty or any other duty to refrain fromengaging, directly or indirectly, in the same business activities or similar business activities or lines of businessin which we operate. To the full extent permitted by applicable law, we have renounced any interest orexpectancy in, or in being offered an opportunity to participate in, business opportunities that are from time totime presented to certain of our shareholders, even if the opportunity is one that we might reasonably deem tohave pursued or had the ability or desire to pursue, if granted, the opportunity to do so, and each suchshareholders shall have no duty to communicate or offer such business opportunity to us and, to the fullest extentpermitted by applicable law, shall not be liable to us or, to the extent applicable, any of its or their shareholders,for breach of any fiduciary or other duty, as a director or officer or otherwise, by reason of the fact that suchshareholders pursues or acquires such business opportunity, directs such business opportunity to another personor fails to present such business opportunity, or information regarding such business opportunity, to us.Therefore, a director or officer of our company who also serves as a director, officer, member, manager, oremployee of such shareholders may pursue certain business opportunities, including acquisitions, that may becomplementary to our business and, as a result, such opportunities may not be available to us. These potentialconflicts of interest could have a material adverse effect on our business, financial condition, results ofoperations, or prospects if attractive corporate opportunities are allocated by such shareholders to themselves ortheir other affiliates instead of to us.
Item 1B. Unresolved Staff Comments
None.
Item 2. Properties
As of December 31, 2013, we had approximately 120 offices located in approximately 60 countries. Ourexecutive headquarters is located adjacent to Research Triangle Park, North Carolina. We maintain substantialoffices serving Product Development in Durham, North Carolina; Marietta, Georgia; Reading, England; WestLothian, Scotland; Centurion, South Africa; Tokyo, Japan; Bangalore, India; and Singapore. We also maintainsubstantial offices serving Integrated Healthcare Services in Parsippany, New Jersey; Hawthorne, New York;Reading, England; and Tokyo, Japan. We own facilities in Gotemba City, Japan and Barcelona, Spain that serveProduct Development and Integrated Healthcare Services. The facility in Barcelona, Spain is subject tomortgages. All of our other offices are leased. None of our leases is individually material to our businessoperations. Many of our leases have an option to renew, and we believe that we will be able to successfullyrenew expiring leases on terms satisfactory to us. We believe that our facilities are adequate for our operationsand that suitable additional space will be available if needed.
Item 3. Legal Proceedings
We are party to legal proceedings incidental to our business. While the outcome of these matters coulddiffer from management’s expectations, we do not believe that the resolution of these matters is reasonably likelyto have a material adverse effect on our financial statements.
Item 4. Mine Safety Disclosures
Not applicable.
42

PART II
Item 5. Market for Registrant’s Common Equity, Related Stockholder Matters and Issuer Purchases ofEquity Securities
Market Information for Common Stock
On May 9, 2013, our common stock began trading on the NYSE under the symbol “Q”. Prior to that time,there was no public market for our common stock. The following table sets forth the high and low sales pricesper share of our common stock as reported by the NYSE for the periods indicated.
High Low
Fiscal Year 2013Fourth Quarter . . . . . . . . . . . . . . . . . . . . . . . . . . . . . . . . . . . . . . . . . . . . . . . . . . . . . . . . . . . . $46.75 $40.10Third Quarter . . . . . . . . . . . . . . . . . . . . . . . . . . . . . . . . . . . . . . . . . . . . . . . . . . . . . . . . . . . . . $47.50 $42.25Second Quarter (from May 9, 2013) . . . . . . . . . . . . . . . . . . . . . . . . . . . . . . . . . . . . . . . . . . . $46.50 $41.50
Holders of Record
On February 6, 2014, we had approximately 205 common stock holders of record. This number does notinclude beneficial owners for whom shares are held by nominees in street name.
Dividend Policy
We do not currently intend to pay dividends on our common stock. However, we expect to reevaluate ourdividend policy on a regular basis and may, subject to compliance with the covenants contained in our creditfacilities and other considerations, determine to pay dividends in the future. The declaration, amount andpayment of any future dividends on shares of our common stock will be at the sole discretion of our Board,which may take into account general and economic conditions, our financial condition and results of operations,our available cash and current and anticipated cash needs, capital requirements, contractual, legal, tax andregulatory restrictions, the implications of the payment of dividends by us to our shareholders or by oursubsidiaries to us, and any other factors that our Board may deem relevant. Our long-term debt arrangementscontain usual and customary restrictive covenants that, among other things, place limitations on our ability todeclare dividends. For additional information regarding these restrictive covenants, see Part II, Item 7“Management’s Discussion and Analysis of Financial Condition and Results of Operations—Liquidity andCapital Resources” and Note 10 to our audited consolidated financial statements included elsewhere in thisAnnual Report on Form 10-K.
In October 2012, our Board declared a $2.09 per share dividend to shareholders of record on October 24,2012. The dividend totaled approximately $241.7 million and was paid on November 1, 2012. In February 2012,our Board declared a $2.82 per share dividend to shareholders of record on February 29, 2012. The dividendtotaled approximately $326.1 million and was paid on March 9, 2012. No dividends were declared or paid in2013.
Recent Sales of Unregistered Securities
There were no unregistered sales of equity securities in 2013 that have not been previously reported in aQuarterly Report on Form 10-Q.
As contemplated in the prospectus filed pursuant to Rule 424(b) under the Securities Act with the SEC onMay 9, 2013, or the Prospectus, we used the net proceeds from the IPO as follows: (1) $308.9 million to pay allamounts outstanding under the $300.0 million term loan we obtained in February 2012, including accruedinterest and related fees and expenses, (2) $50.0 million to repay indebtedness under our senior secured creditfacilities, and (3) $25.0 million to pay a one-time fee to terminate our management agreement with
43
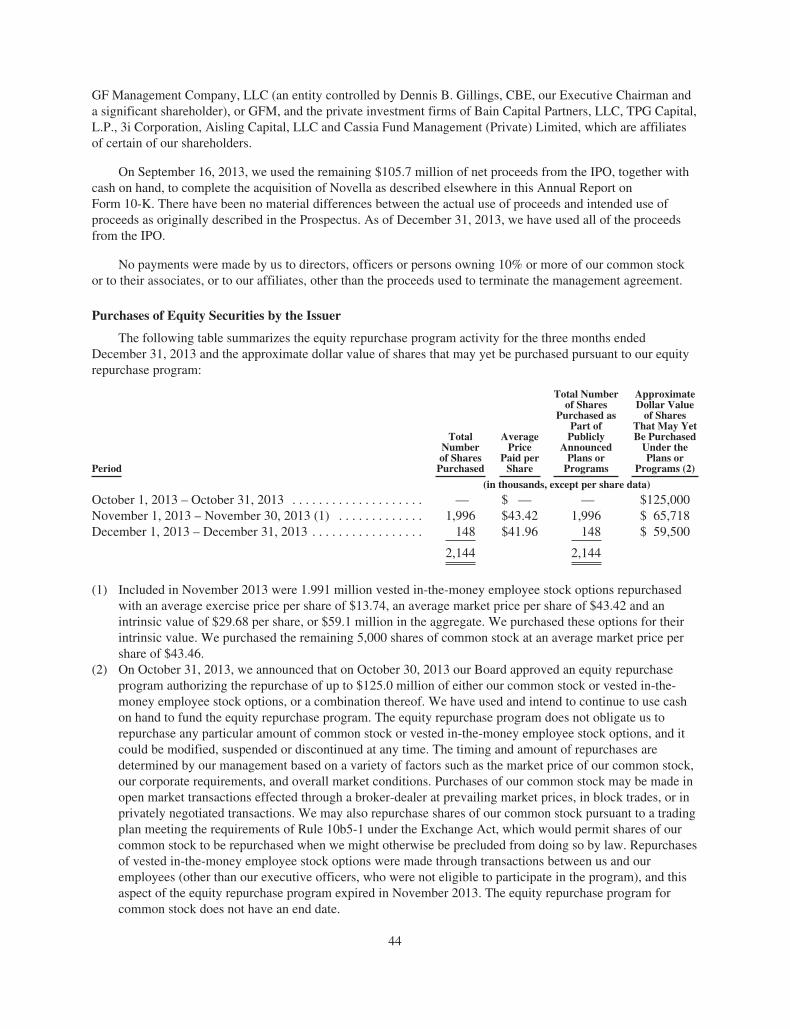
GF Management Company, LLC (an entity controlled by Dennis B. Gillings, CBE, our Executive Chairman anda significant shareholder), or GFM, and the private investment firms of Bain Capital Partners, LLC, TPG Capital,L.P., 3i Corporation, Aisling Capital, LLC and Cassia Fund Management (Private) Limited, which are affiliatesof certain of our shareholders.
On September 16, 2013, we used the remaining $105.7 million of net proceeds from the IPO, together withcash on hand, to complete the acquisition of Novella as described elsewhere in this Annual Report onForm 10-K. There have been no material differences between the actual use of proceeds and intended use ofproceeds as originally described in the Prospectus. As of December 31, 2013, we have used all of the proceedsfrom the IPO.
No payments were made by us to directors, officers or persons owning 10% or more of our common stockor to their associates, or to our affiliates, other than the proceeds used to terminate the management agreement.
Purchases of Equity Securities by the Issuer
The following table summarizes the equity repurchase program activity for the three months endedDecember 31, 2013 and the approximate dollar value of shares that may yet be purchased pursuant to our equityrepurchase program:
Period
TotalNumberof Shares
Purchased
AveragePrice
Paid perShare
Total Numberof Shares
Purchased asPart of
PubliclyAnnounced
Plans orPrograms
ApproximateDollar Value
of SharesThat May YetBe Purchased
Under thePlans or
Programs (2)
(in thousands, except per share data)
October 1, 2013 – October 31, 2013 . . . . . . . . . . . . . . . . . . . . — $ — — $125,000November 1, 2013 – November 30, 2013 (1) . . . . . . . . . . . . . 1,996 $43.42 1,996 $ 65,718December 1, 2013 – December 31, 2013 . . . . . . . . . . . . . . . . . 148 $41.96 148 $ 59,500
2,144 2,144
(1) Included in November 2013 were 1.991 million vested in-the-money employee stock options repurchasedwith an average exercise price per share of $13.74, an average market price per share of $43.42 and anintrinsic value of $29.68 per share, or $59.1 million in the aggregate. We purchased these options for theirintrinsic value. We purchased the remaining 5,000 shares of common stock at an average market price pershare of $43.46.
(2) On October 31, 2013, we announced that on October 30, 2013 our Board approved an equity repurchaseprogram authorizing the repurchase of up to $125.0 million of either our common stock or vested in-the-money employee stock options, or a combination thereof. We have used and intend to continue to use cashon hand to fund the equity repurchase program. The equity repurchase program does not obligate us torepurchase any particular amount of common stock or vested in-the-money employee stock options, and itcould be modified, suspended or discontinued at any time. The timing and amount of repurchases aredetermined by our management based on a variety of factors such as the market price of our common stock,our corporate requirements, and overall market conditions. Purchases of our common stock may be made inopen market transactions effected through a broker-dealer at prevailing market prices, in block trades, or inprivately negotiated transactions. We may also repurchase shares of our common stock pursuant to a tradingplan meeting the requirements of Rule 10b5-1 under the Exchange Act, which would permit shares of ourcommon stock to be repurchased when we might otherwise be precluded from doing so by law. Repurchasesof vested in-the-money employee stock options were made through transactions between us and ouremployees (other than our executive officers, who were not eligible to participate in the program), and thisaspect of the equity repurchase program expired in November 2013. The equity repurchase program forcommon stock does not have an end date.
44

Stock Performance Graph
This performance graph shall not be deemed “filed” for purposes of Section 18 of the Exchange Act, orincorporated by reference into any filing of Quintiles Transnational Holdings Inc. under the Exchange Act orunder the Securities Act, except as shall be expressly set forth by specific reference in such filing.
The following graph shows a comparison from May 9, 2013 (the date our common stock commencedtrading on the NYSE) through December 31, 2013 of the cumulative total return for our common stock, theStandard & Poor’s 500 Stock Index, or S&P 500 Index, and the Standard & Poor’s Healthcare Sector Index, orS&P 500 Healthcare. The graph assumes that $100 was invested at the market close on May 9, 2013 in thecommon stock of Quintiles Transnational Holdings Inc., the S&P 500 Index and the S&P 500 Healthcare, andassumes reinvestments of dividends, if any. The stock price performance of the following graph is not necessarilyindicative of future stock price performance.
$0.00
$20.00
$40.00
$60.00
$80.00
$100.00
$120.00
$140.00
Pric
e Re
turn
s
Q S&P 500 Healthcare S&P 500 Index
45

Item 6. Selected Financial Data
We have derived the following consolidated statement of income data for 2013, 2012 and 2011 andconsolidated balance sheet data as of December 31, 2013 and 2012 from our audited consolidated financialstatements included elsewhere in this Annual Report on Form 10-K. We have derived the following consolidatedstatement of income data for 2010 and 2009 and consolidated balance sheet data as of December 31, 2011, 2010and 2009 from our audited consolidated financial statements not included in this Annual Report on Form 10-K.You should read the consolidated financial data set forth below in conjunction with our consolidated financialstatements and related notes included elsewhere in this Annual Report on Form 10-K and the information underPart II, Item 7, “Management’s Discussion and Analysis of Financial Condition and Results of Operations.” Ourhistorical results are not necessarily indicative of the results we may achieve in any future period.
Year Ended December 31,
2013 2012 2011 2010 2009
(in thousands, except per share data)
Statement of Income Data:Service revenues . . . . . . . . . . . . . . . . . . . . . . . . . . $3,808,340 $3,692,298 $3,294,966 $3,060,950 $3,010,793Reimbursed expenses . . . . . . . . . . . . . . . . . . . . . . 1,291,205 1,173,215 1,032,782 863,070 888,795
Total revenues . . . . . . . . . . . . . . . . . . . . . . . . 5,099,545 4,865,513 4,327,748 3,924,020 3,899,588Costs, expenses and other:Costs of revenue, service costs . . . . . . . . . . . . . . . 2,471,426 2,459,367 2,153,005 1,941,767 1,894,796Costs of revenue, reimbursed expenses . . . . . . . . 1,291,205 1,173,215 1,032,782 863,070 888,795Selling, general and administrative . . . . . . . . . . . . 860,510 817,755 762,299 698,406 684,466Restructuring costs . . . . . . . . . . . . . . . . . . . . . . . . 14,071 18,741 22,116 22,928 (141)Impairment charges (1) . . . . . . . . . . . . . . . . . . . . . — — 12,295 2,844 15,453
Income from operations . . . . . . . . . . . . . . . . 462,333 396,435 345,251 395,005 416,219Interest expense, net . . . . . . . . . . . . . . . . . . . . . . . 119,571 131,304 105,126 137,631 106,037Loss on extinguishment of debt . . . . . . . . . . . . . . 19,831 1,275 46,377 — —Other (income) expense, net . . . . . . . . . . . . . . . . . (185) (3,572) 9,073 15,647 9,622
Income before income taxes and equity in(losses) earnings of unconsolidatedaffiliates . . . . . . . . . . . . . . . . . . . . . . . . . . . 323,116 267,428 184,675 241,727 300,560
Income tax expense . . . . . . . . . . . . . . . . . . . . . . . . 95,965 93,364 15,105 77,582 88,253
Income before equity in (losses) earnings ofunconsolidated affiliates . . . . . . . . . . . . . . 227,151 174,064 169,570 164,145 212,307
Equity in (losses) earnings of unconsolidatedaffiliates (2) . . . . . . . . . . . . . . . . . . . . . . . . . . . . (1,124) 2,567 70,757 1,110 (2,729)
Net income . . . . . . . . . . . . . . . . . . . . . . . . . . 226,027 176,631 240,327 165,255 209,578Net loss (income) attributable to noncontrolling
interests . . . . . . . . . . . . . . . . . . . . . . . . . . . . . . . 564 915 1,445 (4,659) 485
Net income attributable to QuintilesTransnational Holdings Inc. . . . . . . . . . . . $ 226,591 $ 177,546 $ 241,772 $ 160,596 $ 210,063
Earnings per share attributable to commonshareholders:
Basic . . . . . . . . . . . . . . . . . . . . . . . . . . . . . . . $ 1.83 $ 1.53 $ 2.08 $ 1.38 $ 1.80Diluted . . . . . . . . . . . . . . . . . . . . . . . . . . . . . . $ 1.77 $ 1.51 $ 2.05 $ 1.36 $ 1.79
Cash dividends declared per common share . . . . . $ — $ 4.91 $ 2.48 $ 0.58 $ 4.57Weighted average common shares outstanding:
Basic . . . . . . . . . . . . . . . . . . . . . . . . . . . . . . . 124,147 115,710 116,232 116,418 116,499Diluted . . . . . . . . . . . . . . . . . . . . . . . . . . . . . . 127,862 117,796 117,936 118,000 117,509
46

Year Ended December 31,
2013 2012 2011 2010 2009
(in thousands)
Statement of Cash Flow Data:Net cash provided by (used in):
Operating activities . . . . . . . . . . . . . . . $ 397,370 $ 335,701 $ 160,953 $ 378,160 $ 484,474Investing activities . . . . . . . . . . . . . . . . (240,175) (132,233) (224,838) (141,434) (90,465)Financing activities . . . . . . . . . . . . . . . 70,957 (146,873) (59,309) (153,081) (270,189)
Other Financial Data:Capital expenditures . . . . . . . . . . . . . . . . . . . $ (92,346) $ (71,336) $ (75,679) $ (80,236) $ (85,932)Cash dividends paid to common
shareholders . . . . . . . . . . . . . . . . . . . . . . . — (567,851) (288,322) (67,493) (532,327)Net new business (3) . . . . . . . . . . . . . . . . . . 4,898,851 4,501,200 4,044,100 3,551,500 3,641,400
As of December 31,
2013 2012 2011 2010 2009
(in thousands)
Balance Sheet Data:Cash and cash equivalents . . . . . . . . . . . . . . $ 778,143 $ 567,728 $ 516,299 $ 646,615 $ 565,774Investments in debt, equity and other
securities . . . . . . . . . . . . . . . . . . . . . . . . . 40,349 35,951 22,106 1,557 61,713Trade accounts receivable and unbilled
services, net . . . . . . . . . . . . . . . . . . . . . . . 924,205 745,373 691,038 570,160 584,200Property and equipment, net . . . . . . . . . . . . 199,578 193,999 185,772 184,494 199,415Total assets . . . . . . . . . . . . . . . . . . . . . . . . . . 3,066,797 2,499,153 2,322,917 2,064,887 2,112,734Total long-term liabilities . . . . . . . . . . . . . . 2,252,035 2,549,200 2,109,879 1,841,537 1,920,030Total debt and capital leases (4) . . . . . . . . . 2,060,994 2,444,886 1,990,196 1,704,896 1,876,607Total shareholders’ deficit . . . . . . . . . . . . . . (667,485) (1,359,044) (969,596) (900,359) (907,515)Other Financial Data:Backlog (3) . . . . . . . . . . . . . . . . . . . . . . . . . . $9,855,428 $ 8,704,500 $7,972,900 $7,115,300 $6,494,400
(1) We incurred other than temporary losses on marketable and non-marketable equity securities of $4.4 millionand $9.4 million, respectively, and an impairment of a long-lived asset of $1.7 million in 2009. We incurredother than temporary losses on equity securities of $2.8 million in 2010. Refer to our audited financialstatements included elsewhere in this Annual Report on Form 10-K for information on other than temporarylosses and long-lived asset impairments in 2013, 2012 and 2011.
(2) In November 2011, we sold our investment in Invida Pharmaceutical Holdings Pte. Ltd., or Invida, forapproximately $103.6 million of net proceeds resulting in gain of approximately $74.9 million.
(3) Net new business is the value of services awarded during the period from projects under signed contracts,letters of intent and, in some cases, pre-contract commitments that are supported by writtencommunications, adjusted for contracts that were modified or canceled during the period. Consistent withour methodology for calculating net new business during a particular period, backlog represents, at aparticular point in time, future service revenues from work not yet completed or performed under signedcontracts, letters of intent and, in some cases, pre-contract commitments that are supported by writtencommunications.
(4) Excludes $15.0 million, $22.9 million, $18.3 million, $8.3 million and $10.4 million of unamortizeddiscounts as of December 31, 2013, 2012, 2011, 2010 and 2009, respectively. 2010 and 2009 include $7.5million and $164.9 million, respectively, of debt related to activities in our former Capital Solutionssegment, which primarily consisted of our former subsidiary PharmaBio Development Inc., or PharmaBio,that was deconsolidated in 2010.
47

Item 7. Management’s Discussion and Analysis of Financial Condition and Results of Operations
You should read the following discussion and analysis of our financial condition and results of operationstogether with our consolidated financial statements and the related notes included elsewhere in this Annual Reporton Form 10-K. Some of the information contained in this discussion and analysis or set forth elsewhere in thisAnnual Report, including information with respect to our plans and strategy for our business, includes forward-looking statements that involve risks and uncertainties. You should read the “Risk Factors” section of this AnnualReport for a discussion of important factors that could cause actual results to differ materially from the resultsdescribed in or implied by the forward-looking statements contained in the following discussion and analysis.
Overview
Our business is currently organized in two reportable segments, Product Development and IntegratedHealthcare Services.
Product Development
Product Development provides services and expertise that allow biopharmaceutical companies to outsourcethe clinical development process from first-in-man trials to post-launch monitoring. Our comprehensive serviceoffering provides the support and functional expertise necessary at each stage of development, as well as thesystems and analytical capabilities to help our customers improve product development efficiency andeffectiveness. Product Development is comprised of clinical solutions and services and consulting. Clinicalsolutions and services provides services necessary to develop biopharmaceutical products. These services includeproject management and clinical monitoring functions for conducting multi-site trials (generally Phase II-IV)(collectively “core clinical”). These also include clinical trial support services that improve clinical trial decision-making, such as global laboratories, data management, biostatistical, safety and pharmacovigilance, early clinicaldevelopment trials (generally Phase I), and strategic planning and design services, which help improve decisionsand performance. Consulting provides strategy and management consulting services based on life scienceexpertise and advanced analytics, as well as regulatory and compliance consulting services.
On September 16, 2013, we completed the acquisition of Novella for approximately $146.6 million in cash(net of approximately $26.2 million of acquired cash) plus potential earn-out payments totaling up to $21.0million contingent upon the achievement of certain revenue and net new business targets for approximately threeyears following closing.
Integrated Healthcare Services
Integrated Healthcare Services provides the healthcare industry with both broad geographic presence andcommercial capabilities. Our customized commercialization services are designed to accelerate the commercialsuccess of biopharmaceutical and other health-related products. Integrated Healthcare Services provides a broadarray of services including commercial services, such as providing contract pharmaceutical sales forces in keygeographic markets, as well as a growing number of healthcare business services for the broader healthcare sector.Service offerings include commercial services (sales representatives, strategy, marketing communications and otherareas related to commercialization), outcome research (drug therapy analysis, real-world research and evidence-based medicine, including research studies to prove a drug’s value) and other healthcare services (comparative andcost-effectiveness research capabilities, clinical management analytics, decision support services, medicationadherence and health outcome optimization services, and web-based systems for measuring quality improvement).
Industry Outlook
The potential of the CRO market served by Product Development is primarily a function of two variables:biopharmaceutical R&D spending and the proportion of this spending that is outsourced (outsourcingpenetration). Despite continued softness in the economy and concern about global credit markets, we expect
48
outsourced clinical development to CROs to grow 6%-8% annually from 2013 to 2016. Of this annual growth,we believe that up to 2% will be derived from increased R&D expenditures, with the remainder coming fromincreased outsourcing penetration. We estimate that overall outsourcing penetration in 2013 was 37%. Webelieve that our customers will continue to outsource a greater part of their activities to transform their valuechain away from a vertically integrated model and focus on their core competencies to lower risk and improvereturn, with a focus on selecting outsourcing partners that are able to demonstrate the ability to provide flexibleand efficient delivery models that leverage patient data to help biopharmaceutical companies deliver moreeffective patient outcomes. We believe that increased demand will create new opportunities forbiopharmaceutical services companies, particularly those with a global reach.
Integrated Healthcare Services historically has focused on biopharmaceutical companies seeking tocommercialize their products. The total market served by Integrated Healthcare Services is diverse, which makesit difficult to estimate the current amount of outsourced integrated healthcare services and the expected growth insuch services. However, based on our knowledge of these markets we believe that, while the rate of outsourcingpenetration varies by market within Integrated Healthcare Services, the overall outsourcing penetration of theestimated $94 billion addressable market is not more than 20%. We believe that the market for real-world andlate phase research and other healthcare services will evolve and expand, and as a result, there will beopportunities to grow our revenues and expand our service offerings, including to payers who are looking toimprove the cost-effectiveness of drug therapies and providers who are looking to make evidence-baseddecisions regarding treatment decisions. As business models continue to evolve in the healthcare sector, webelieve that the growth rate for outsourcing across the Integrated Healthcare Services markets will be similar tothe growth in clinical development.
Acquisitions
We completed a number of acquisitions in 2011, 2012 and 2013 to enhance our capabilities and offerings incertain areas. In October 2011, we acquired Outcome, for approximately $164.9 million (net of approximately$12.1 million of acquired cash) to strengthen our late phase research offerings and VCG&A, Inc. and its whollyowned subsidiary, VCG BIO, Inc., or collectively VCG, for $8.7 million to strengthen our commercial services.In November 2011, we acquired Advion BioServices, Inc., for $54.9 million to enhance our biomarker and otheradvanced testing capabilities. In August 2012, we acquired Expression Analysis for $39.7 million to enhance ourgenetic sequencing and advanced bioinformatics expertise. In September 2013, we acquired Novella forapproximately $146.6 million (net of approximately $26.2 million of acquired cash) (with contingentconsideration of up to $21.0 million) to complement our clinical service offerings through its focus on emergingcompanies and by adding expertise in oncology and medical devices. See Note 14 to our audited consolidatedfinancial statements found elsewhere in this Annual Report on Form 10-K for additional information with respectto these acquisitions. The results of operations of acquired businesses have been included since the date ofacquisition and were not significant to our consolidated results of operations.
Sources of Revenue
Total revenues are comprised of service revenues and revenues from reimbursed expenses. Service revenuesprimarily include the revenue we earn from providing product development and commercialization services toour customers, with Product Development services representing 76.7% of our 2013 service revenues andcommercialization services representing 22.2% of our 2013 service revenues. Our service revenues also include,or have historically included, product sales and commercial rights and royalties revenues. Product sales, whichare approximately 1% or less of consolidated service revenues for all periods presented, represent sales ofpharmaceutical products pursuant to distribution agreements. Reimbursed expenses are comprised principally ofpayments to physicians (investigators) who oversee clinical trials and travel expenses for our clinical monitorsand sales representatives. Reimbursed expenses may fluctuate from period-to-period due, in part, to where we arein the lifecycle of the many contracts that are in progress at a particular point in time. For instance, these pass-through costs tend to be higher during the early phases of clinical trials as a result of patient recruitment efforts.
49

As reimbursed expenses are pass-through costs to our customers with little to no profit and we believe that thefluctuations from period to period are not meaningful to our underlying performance, we do not provide analysisof the fluctuations in these items or their impact on our financial results.
Costs and Expenses
Our costs and expenses are comprised primarily of our costs of revenues and selling, general andadministrative expenses.
Our costs of revenues consist of service costs and reimbursed expenses. Service costs include compensationand benefits for billable employees, depreciation of assets used in generating revenue and other expenses directlyrelated to service contracts such as courier fees, laboratory supplies, professional services, travel expenses andthe cost of products sold under distribution agreements. As noted above, reimbursed expenses are comprisedprincipally of payments to physicians (investigators) who oversee clinical trials and travel expenses for ourclinical monitors and sales representatives.
Selling, general and administrative expenses include costs related to administrative functions includingcompensation and benefits, travel, professional services, training and expenses for advertising, IT, facilities anddepreciation and amortization.
Foreign Currency Fluctuations
The impact from foreign currency fluctuations and constant currency information assumes constant foreigncurrency exchange rates based on the rates in effect for the comparable prior-year period were used in translation.We believe that providing the impact of fluctuations in foreign currency rates on certain financial results canfacilitate analysis of period-to-period comparisons of business performance.
Results of Operations
Year ended December 31, 2013 compared to the year ended December 31, 2012 and the year endedDecember 31, 2012 compared to the year ended December 31, 2011
Backlog and Net New Business
We began 2013 with backlog in place at the beginning of the year of $8,704 million, which was 9% higherthan at the beginning of 2012.
Net new business (as defined under “Net New Business Reporting and Backlog” in Part I, Item 1 of thisreport) grew 9% in 2013 to $4,899 million from $4,501 million in 2012, driven by growth in both ProductDevelopment and Integrated Healthcare Services. Product Development’s net new business increased 9% to$3,772 million in 2013 as compared to $3,474 million in 2012, led by increases in core clinical in North Americaand Europe (including projects awarded under two sole provider arrangements signed in 2013) and datamanagement services (which benefited from functional resourcing and the sole provider arrangements signedduring 2013). Integrated Healthcare Services’ net new business grew 10% in 2013 to $1,127 million from $1,027million in 2012 due to an increase in North America and Europe.
Net new business grew 11% in 2012 to $4,501 million, of which $1,507 million was generated in the fourthquarter, from $4,044 million in 2011, with the growth driven by Product Development. Product Development’snet new business increased 14% to $3,474 million in 2012, of which $1,088 million was generated in the fourthquarter, as compared to $3,040 million in 2011, led by increases in core clinical in Europe and North Americaand increases in our late phase, global laboratory and consulting service offerings. Factors contributing toProduct Development’s net new business growth in 2012 included increases in our core clinical service offeringsin Europe and North America resulting from overall growth in those markets, our ability to leverage our
50

expanding breadth of service offerings in late phase as well as global laboratories due in part to acquisitionsmade in 2011 and 2012, and net new business for consulting services related to assisting a customer on aregulatory compliance project. These increases were partially offset by lower net new business in the Asia-Pacific and Latin America and from our early clinical development service offerings. Integrated HealthcareServices’ net new business was $1,027 million and $1,004 million in 2012 and 2011, respectively.
Our backlog at December 31, 2013 was $9,855 million compared to backlog of $8,704 million atDecember 31, 2012. Although an increase in backlog will generally result in an increase in revenues to berecognized over time (depending on the level of contract modifications), an increase in backlog at a particularpoint in time does not necessarily correspond directly to an increase in revenues during a particular period. Theextent to which contracts in backlog will result in revenue depends on many factors, including but not limited todelivery against projected schedules, the need for scope changes (change orders), contract cancellations and thenature, duration, size, complexity and phase of the contracts, each of which factors can vary significantly fromtime to time. Our $9,855 million of backlog at December 31, 2013 included approximately $6,342 million ofbacklog that we do not expect to generate revenue in 2014 as compared to our $8,704 million of backlog atDecember 31, 2012, which included approximately $5,601 million of backlog that we did not expect to generaterevenue in 2013. Our ability to grow revenues in the near term at rates comparable to our recent historical resultswill depend on many factors, including but not limited to the factors affecting the rate at which revenues arederived from backlog, continued growth in net new business that will generate revenue and factors not within ourcontrol such as economic conditions and trends in the industry in which we do business.
Service Revenues
Change
Year Ended December 31, 2013 vs. 2012 2012 vs. 2011
2013 2012 2011 $ % $ %
(dollars in thousands)
Service revenues . . . . . . . . . . . . . . $3,808,340 $3,692,298 $3,294,966 $116,042 3.1% $397,332 12.1%
In 2013, our service revenues increased $116.0 million, or 3.1%, as compared to 2012. This increase iscomprised of constant currency revenue growth of approximately $186.6 million, or 5.1%, partially offset by anegative impact of approximately $70.6 million from the effects of foreign currency fluctuations. The constantcurrency revenue growth, which includes the impact from business combinations completed in 2012 and 2013, iscomprised of a $214.6 million increase in Product Development, partially offset by a decrease of $28.0 million inIntegrated Healthcare Services.
In 2012, our service revenues increased $397.3 million, or 12.1%, as compared to 2011. This increase iscomprised of constant currency revenue growth of approximately $459.0 million, or 13.9%, partially offset by anegative impact of approximately $61.7 million from the effects of foreign currency fluctuations. The constantcurrency revenue growth resulted from a $328.6 million increase in Product Development and a $130.4 millionincrease in Integrated Healthcare Services.
Service Costs
Year Ended December 31,
2013 2012 2011
(dollars in thousands)
Service costs . . . . . . . . . . . . . . . . . . . . . . . . . . . . . . . . . . . . . . . . . . . . . . . $2,471,426 $2,459,367 $2,153,005% of service revenues . . . . . . . . . . . . . . . . . . . . . . . . . . . . . . . . . . . . . . . . 64.9% 66.6% 65.3%
When compared to 2012, service costs in 2013 increased $12.1 million. The increase included a constantcurrency increase in expenses of approximately $85.1 million, or 3.5%, partially offset by a positive impact of
51

approximately $73.0 million from the effects of foreign currency fluctuations. The constant currency servicecosts growth was due to annual merit increases in compensation and related expenses, partially offset by costefficiencies gained from restructuring actions taken in prior years, as well as incremental costs resulting from thebusiness combinations completed in 2012 and 2013. These increases were partially offset by a decline in otherexpenses directly related to our service contracts, as well as by a reduction of an accrual for statutory profitsharing of approximately $5.4 million as a result of guidance handed down by an administrative court in France.
When compared to 2011, service costs in 2012 increased $306.4 million. The increase included a constantcurrency increase in expenses of approximately $375.1 million, or 17.4%, partially offset by a positive impact ofapproximately $68.8 million from the effects of foreign currency fluctuations. The constant currency servicecosts growth was due to an increase in compensation and related expenses and other expenses directly related toour service contracts, as well as incremental costs resulting from the business combinations completed in 2011and 2012. The increase in compensation and related expenses was primarily as a result of a growth-relatedincrease in billable headcount, annual merit increases and an increase in incentive compensation. Alsocontributing to the increase in costs of service revenues was a $16.7 million reduction in the benefit from R&Dgrants received from France and Austria, an increase in third party costs, primarily related to a new agreement todistribute pharmaceutical products in Italy, and various other individually insignificant factors.
Selling, General and Administrative Expenses
Year Ended December 31,
2013 2012 2011
(dollars in thousands)
Selling, general and administrative expenses . . . . . . . . . . . . . . . . . . . . . . . . . . . $860,510 $817,755 $762,299% of service revenues . . . . . . . . . . . . . . . . . . . . . . . . . . . . . . . . . . . . . . . . . . . . . 22.6% 22.1% 23.1%
The $42.8 million increase in selling, general and administrative expenses in 2013 was caused by a constantcurrency increase of $59.1 million, or 7.2%, partially offset by a decrease of $16.3 million from a positiveforeign currency impact. The constant currency increase was primarily due to (1) expenses incurred related to a$25.0 million fee paid in connection with the termination of our management agreement with affiliates of certainof our shareholders, and a $1.5 million fee paid in connection with the modification of an agreement for thebusiness usage of an airplane owned by GFM, (2) severance accruals of approximately $10.0 million related tooverhead cost reduction programs to be carried out in 2014, (3) executive separation costs of approximately $5.3million, (4) the impact from the business combinations completed in 2012 and 2013, (5) increases incompensation and related expenses resulting primarily from annual merit increases, and (6) growth relatedincreases in facilities costs and depreciation and amortization. These increases were partially offset by lowertravel costs, lower share-based compensation and the fact that 2012 included expenses related to a bonus paid tocertain option holders in connection with dividends paid to our shareholders (totaling $11.3 million), which didnot recur in 2013. The lower share-based compensation was as a result of the fact that expense from recent stockoption grants was more than offset by a $13.6 million decline in expense related to the repricing of certain stockoptions in 2012 that did not recur in 2013.
The $55.5 million increase in selling, general and administrative expenses in 2012 was caused by(1) incremental costs resulting from the business combinations completed in the fourth quarter of 2011 and thethird quarter of 2012, (2) increased spending on business development and IT costs (including higherdepreciation and amortization expense related to an increase in assets in service) and (3) expenses related to therepricing of certain stock options in connection with dividends paid to our shareholders (resulting in incrementalshare-based compensation expense of $13.6 million) and a bonus paid to certain option holders (totaling $11.3million). The remaining increase was primarily the result of increases in compensation and related expensesincluding the impact of merit increases, an increase in headcount and higher incentive compensation. Theseincreases were partially offset by a positive foreign currency impact of approximately $17.9 million and areduction in facility costs due to a consolidation of offices in Europe (including lower depreciation andamortization expense due to fewer assets in service).
52

Restructuring Costs
Year Ended December 31,
2013 2012 2011
(in thousands)
Restructuring costs . . . . . . . . . . . . . . . . . . . . . . . . . . . . . . . . . . . . . . . . . . . . . . . . . . $14,071 $18,741 $22,116
We recognized $14.1 million of restructuring charges, net of reversals for changes in estimates, in 2013,which was primarily related to our February 2013 restructuring plan to migrate the delivery of services and toreduce anticipated overcapacity in selected areas. These actions are expected to result in severance forapproximately 400 positions. We believe that this plan will result in annual cost savings of approximately $15.0to $20.0 million.
We recognized $18.7 million of restructuring charges, net of reversals for changes in estimates, in 2012,which was primarily related to our May 2012 restructuring plan to reduce staffing overcapacity and to rationalizenon-billable support roles. This restructuring action has resulted in the elimination of approximately 280positions, primarily in Europe. We believe that this plan has resulted in annual cost savings of approximately$15.0 to $25.0 million.
We recognized $22.1 million of restructuring charges, net of immaterial reversals for changes in estimates,in 2011, primarily related to our July 2011 restructuring plan to reduce staffing overcapacity and to rationalizenon-billable support roles. As part of our July 2011 plan, approximately 290 positions were eliminated, primarilyin North America and Europe.
Impairment Charges
Year Ended December 31,
2013 2012 2011
(in thousands)
Impairment charges . . . . . . . . . . . . . . . . . . . . . . . . . . . . . . . . . . . . . . . . . . . . . . . $— $— $12,295
In 2011, we recognized a $12.2 million impairment on long-lived assets used in our early clinicaldevelopment services due to a decline in revenue as well as overcapacity in the market for early clinicaldevelopment services. Refer to the related disclosure in our audited consolidated financial statements, includedelsewhere in this Annual Report on Form 10-K, for more information on this impairment.
Interest Income and Interest Expense
Year Ended December 31,
2013 2012 2011
(in thousands)
Interest income . . . . . . . . . . . . . . . . . . . . . . . . . . . . . . . . . . . . . . . . . . . . . . . . . . $ (3,937) $ (3,067) $ (3,939)Interest expense . . . . . . . . . . . . . . . . . . . . . . . . . . . . . . . . . . . . . . . . . . . . . . . . . $123,508 $134,371 $109,065
Interest income includes interest received from bank balances and investments in debt securities.
Interest expense for 2013 was lower than 2012 primarily due to a decrease in the average debt outstandingin 2013 compared to 2012 resulting from the repayment of the $300.0 million term loan, which QuintilesTransnational Holdings Inc. obtained in February 2012 and paid in full in May 2013, or the Holdings Term Loan,the pay down of $50.0 million of outstanding indebtedness under our senior secured credit facilities in May 2013,and the mandatory prepayment of $33.8 million of outstanding indebtedness under our senior secured creditfacilities in the first quarter of 2013, offset by the increase that resulted from the $175.0 million Term Loan B-1,which our wholly-owned subsidiary, Quintiles Transnational, obtained under the credit agreement governing our
53
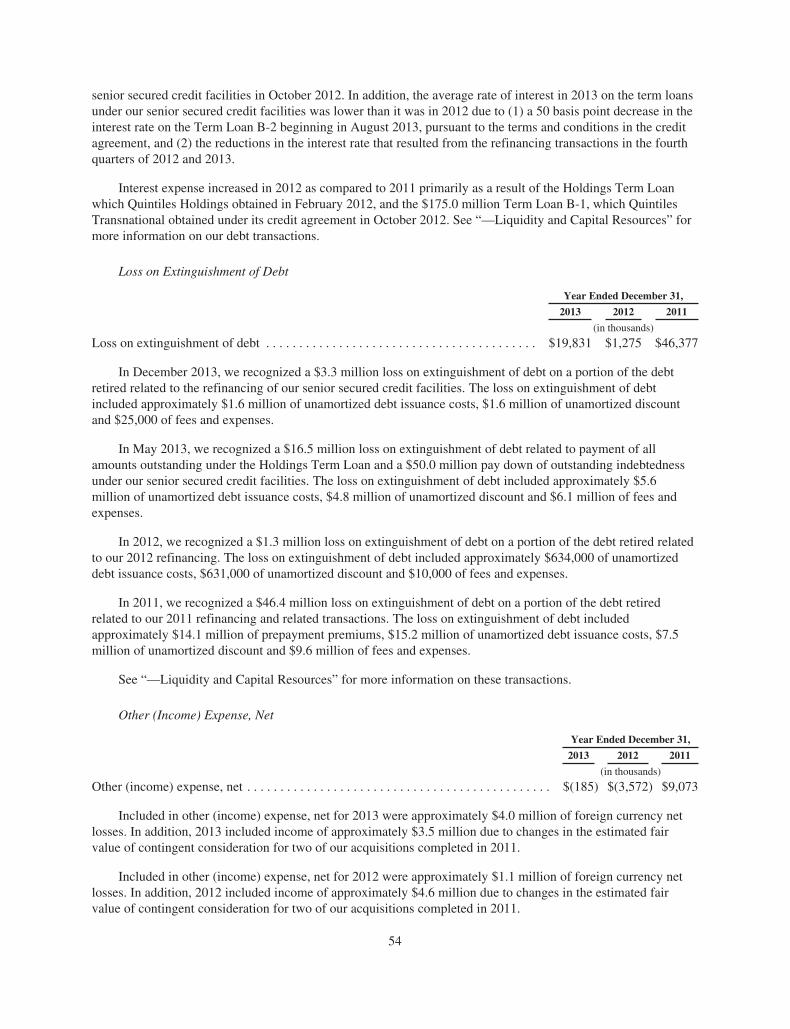
senior secured credit facilities in October 2012. In addition, the average rate of interest in 2013 on the term loansunder our senior secured credit facilities was lower than it was in 2012 due to (1) a 50 basis point decrease in theinterest rate on the Term Loan B-2 beginning in August 2013, pursuant to the terms and conditions in the creditagreement, and (2) the reductions in the interest rate that resulted from the refinancing transactions in the fourthquarters of 2012 and 2013.
Interest expense increased in 2012 as compared to 2011 primarily as a result of the Holdings Term Loanwhich Quintiles Holdings obtained in February 2012, and the $175.0 million Term Loan B-1, which QuintilesTransnational obtained under its credit agreement in October 2012. See “—Liquidity and Capital Resources” formore information on our debt transactions.
Loss on Extinguishment of Debt
Year Ended December 31,
2013 2012 2011
(in thousands)
Loss on extinguishment of debt . . . . . . . . . . . . . . . . . . . . . . . . . . . . . . . . . . . . . . . . . $19,831 $1,275 $46,377
In December 2013, we recognized a $3.3 million loss on extinguishment of debt on a portion of the debtretired related to the refinancing of our senior secured credit facilities. The loss on extinguishment of debtincluded approximately $1.6 million of unamortized debt issuance costs, $1.6 million of unamortized discountand $25,000 of fees and expenses.
In May 2013, we recognized a $16.5 million loss on extinguishment of debt related to payment of allamounts outstanding under the Holdings Term Loan and a $50.0 million pay down of outstanding indebtednessunder our senior secured credit facilities. The loss on extinguishment of debt included approximately $5.6million of unamortized debt issuance costs, $4.8 million of unamortized discount and $6.1 million of fees andexpenses.
In 2012, we recognized a $1.3 million loss on extinguishment of debt on a portion of the debt retired relatedto our 2012 refinancing. The loss on extinguishment of debt included approximately $634,000 of unamortizeddebt issuance costs, $631,000 of unamortized discount and $10,000 of fees and expenses.
In 2011, we recognized a $46.4 million loss on extinguishment of debt on a portion of the debt retiredrelated to our 2011 refinancing and related transactions. The loss on extinguishment of debt includedapproximately $14.1 million of prepayment premiums, $15.2 million of unamortized debt issuance costs, $7.5million of unamortized discount and $9.6 million of fees and expenses.
See “—Liquidity and Capital Resources” for more information on these transactions.
Other (Income) Expense, Net
Year Ended December 31,
2013 2012 2011
(in thousands)
Other (income) expense, net . . . . . . . . . . . . . . . . . . . . . . . . . . . . . . . . . . . . . . . . . . . . . . $(185) $(3,572) $9,073
Included in other (income) expense, net for 2013 were approximately $4.0 million of foreign currency netlosses. In addition, 2013 included income of approximately $3.5 million due to changes in the estimated fairvalue of contingent consideration for two of our acquisitions completed in 2011.
Included in other (income) expense, net for 2012 were approximately $1.1 million of foreign currency netlosses. In addition, 2012 included income of approximately $4.6 million due to changes in the estimated fairvalue of contingent consideration for two of our acquisitions completed in 2011.
54

Included in other (income) expense, net for 2011 were approximately $1.9 million of foreign currency netgains. Also included in 2011 was $11.6 million of expense associated with the termination of interest rate swapsin connection with the refinancing that occurred in June 2011 as we deemed it to be unlikely that the previouslyforecasted transactions would occur.
Income Tax Expense
Year Ended December 31,
2013 2012 2011
(dollars in thousands)
Income tax expense . . . . . . . . . . . . . . . . . . . . . . . . . . . . . . . . . . . . . . . . . . . . . . . . . $95,965 $93,364 $15,105Effective income tax rate . . . . . . . . . . . . . . . . . . . . . . . . . . . . . . . . . . . . . . . . . . . . . 29.7% 34.9% 8.2%
The effective income tax rate for 2013 was negatively impacted by the settlement of certain intercompanynotes in 2013 that had previously been considered long term investments, which resulted in $11.1 million ofincome tax expense. In addition, the effective income tax rate for 2013 was positively impacted by our change inassertion regarding the undistributed earnings of most of our foreign subsidiaries that are considered to beindefinitely reinvested outside of the United States. Prior to June 2013, we had not considered the majority of theundistributed earnings of our foreign subsidiaries to be indefinitely reinvested. Accordingly, 2011 and 2012 werenegatively impacted by income taxes provided on most of the earnings of the foreign subsidiaries, as a deferredincome tax liability was recorded each year for the anticipated income tax costs of repatriating those earnings inthe future. We reevaluated this assertion following the IPO, as a portion of the IPO proceeds were used to paydown debt held in the United States as well as the fact we do not anticipate paying dividends in the foreseeablefuture, which had been significant in the past. With this reduction of debt and related interest expense and thechange in approach related to payment of dividends, we expect to be able to support the cash needs of ourdomestic subsidiaries without repatriating cash from the affected foreign subsidiaries. We expect to utilize thecash generated outside of the United States to fund growth outside of the United States. As a result of theassertion change, we recorded an $8.1 million income tax benefit in the second quarter of 2013 to reverse thedeferred income tax liability previously recorded on undistributed foreign earnings prior to 2013 that are nowconsidered indefinitely reinvested outside of the United States.
The favorable rate in 2011 was primarily due to an approximately $48.7 million benefit from the recognitionof foreign tax credits related to prior years due to an increase in projected foreign source income as a result ofimproved operational results and the favorable impact of the 2011 refinancing transaction on future results. Therate was also favorably impacted due to a $16.4 million benefit for the release of foreign uncertain tax positionsdue to the expiration of the statute of limitations. The rate in 2011 was unfavorably impacted by $21.7 million ofincome tax expense related to the gain on the sale of our investment in Invida. For financial reporting purposes,the gain on the sale is included in equity in earnings from unconsolidated affiliates; however, our income tax onthe gain is included in income tax expense.
Equity in (Losses) Earnings of Unconsolidated Affiliates
Year Ended December 31,
2013 2012 2011
(in thousands)
Equity in (losses) earnings of unconsolidated affiliates . . . . . . . . . . . . . . . . . . . . . . $(1,124) $2,567 $70,757
In 2011, we sold our investment in Invida for approximately $103.6 million of net proceeds resulting in again of approximately $74.9 million.
55

Segments
Service revenues and income from operations by segment are as follows (dollars in millions):
Service Revenues Income from Operations Operating Profit Margin
2013 2012 2011 2013 2012 2011 2013 2012 2011
Product Development . $2,919.7 $2,728.7 $2,437.8 $ 562.3 $ 477.9 $ 424.7 19.3% 17.5% 17.4%Integrated Healthcare
Services . . . . . . . . . . 888.6 963.6 857.2 42.1 60.5 58.2 4.7 6.3 6.8
Total segment . . . . . . . 3,808.3 3,692.3 3,295.0 604.4 538.4 482.9 15.9% 14.6% 14.7%General corporate and
unallocated expenses (128.0) (123.3) (103.2)Restructuring costs . . . (14.1) (18.7) (22.1)Impairment charges . . . — — (12.3)
Consolidated . . . . . . . . $3,808.3 $3,692.3 $3,295.0 $ 462.3 $ 396.4 $ 345.3
Certain costs are not allocated to our segments and are reported as general corporate and unallocatedexpenses. These costs primarily consist of share-based compensation and expenses for corporate office functionssuch as senior leadership, finance, human resources, IT, facilities and legal, as well as certain expenses incurredin the second quarter of 2013 including the $25.0 million fee incurred in connection with the termination of themanagement agreement with affiliates of certain shareholders and the $1.5 million fee paid in connection withthe modification of an agreement for the business usage of an airplane owned by GFM.
Product Development
Change
2013 2012 2011 2013 vs. 2012 2012 vs. 2011
(dollars in millions)
Service revenues . . . . . . . . . . . . . . . . . . . . . . . . $2,919.7 $2,728.7 $2,437.8 $191.0 7.0% $290.9 11.9%Costs of revenue, service costs . . . . . . . . . . . . . 1,752.8 1,683.3 1,464.3 69.5 4.1 219.0 15.0
as a percentage of service revenues . . . . . 60.0% 61.7% 60.1%Selling, general and administrative expenses . . 604.6 567.5 548.8 37.1 6.5 18.7 3.4
Segment income from operations . . . . . . . . . . . $ 562.3 $ 477.9 $ 424.7 $ 84.4 17.7% $ 53.2 12.5%
as a percentage of service revenues . . . . . 19.3% 17.5% 17.4%
Service Revenues
2013 compared to 2012
Product Development’s service revenues were $2.9 billion in 2013, an increase of $191.0 million, or 7.0%,over 2012. This increase is comprised of constant currency revenue growth of $214.6 million, or 7.9%, partiallyoffset by a negative impact of approximately $23.6 million due to the effect of foreign currency fluctuations. Theconstant currency service revenues growth was primarily a result of a volume-related increase of $191.4 millionin clinical solutions and services and $52.4 million from businesses acquired in the third quarters of 2012 and2013, which were partially offset by a decrease of $29.2 million from consulting services.
Our clinical solutions and services growth for 2013 was concentrated in Europe and the Americas. Thisgrowth was due largely to growth in the overall market as well as a consistent history of year-over-year growth innet new business, including strong inflow of net new business in 2013. This growth was tempered by a decreasein service revenues from consulting services resulting primarily from the winding down of a project assisting acustomer on a regulatory compliance matter, and from a large clinical solutions project on which we wereexecuting in 2012 and 2013, but that is now nearing completion.
56

2012 compared to 2011
Product Development’s service revenues were $2.7 billion in 2012, an increase of $290.9 million, or 11.9%,over 2011. This increase is comprised of constant currency revenue growth of $328.6 million, or 13.5%, partiallyoffset by a negative impact of approximately $37.7 million due to the effect of foreign currency fluctuations. Theconstant currency service revenues growth was primarily a result of a volume-related increase of $238.5 millionin clinical solutions and services, $55.3 million from consulting services and $34.8 million from businessesacquired in the fourth quarter of 2011 and the third quarter of 2012.
Our clinical solutions and services experienced growth in all regions including the Americas, Europe andthe Asia-Pacific. This growth was due largely to growth in the overall market as well as a consistent history ofyear-over-year growth in net new business that resulted in delivery in 2012 on the higher backlog as we enteredthe year. Also impacting the growth was an increase in global laboratories test volumes and an increase in thedelivery of clinical solutions and services provided on a functional basis, principally due to the expansion ofservices and geographic deployment of resources on existing projects, and from the ramp up of new projects.This growth was partially offset by lower revenues from early clinical development services and was alsotempered by a competitive pricing environment. Service revenues from consulting services increased primarily asa result of approximately $47.3 million of revenue related to assisting a customer with a regulatory complianceproject.
Costs of Service Revenues
2013 compared to 2012
Product Development’s costs of service revenues were higher by approximately $69.5 million in 2013,which was comprised of a $105.9 million constant currency increase, or 6.3%, partially offset by a reduction of$36.4 million from the positive effect of foreign currency fluctuations. The constant currency service costsgrowth was due to increases in compensation and related expenses resulting from an increase in billableheadcount needed to support our higher volume of revenue as well as annual merit increases in compensation,partially offset by cost efficiencies gained from restructuring actions taken in prior years and incremental costsresulting from the business combinations completed in 2012 and 2013. The increase in compensation and relatedexpenses was partially offset by a reduction of an accrual for statutory profit sharing of approximately $5.4million as a result of guidance handed down by an administrative court in France and lower third party and travelcosts. As a percent of service revenues, Product Development’s costs of service revenues were 60.0% and 61.7%in 2013 and 2012, respectively. The decrease in costs of service revenues as a percentage of service revenues wasprimarily a result of a closer alignment of resources with project requirements (including cost efficiencies gainedfrom restructuring actions taken in prior years) as well as the impact related to the profit sharing accrual reversalin Europe.
2012 compared to 2011
Product Development’s costs of service revenues were higher by approximately $219.0 million in 2012, whichwas comprised of a $268.1 million constant currency increase, or 18.3%, partially offset by a reduction of $49.1million from the effect of foreign currency fluctuations. On a constant currency basis, the increase in costs ofservice revenues was primarily due to an increase in compensation and related expenses resulting from an increasein billable headcount needed to support our higher volume of revenue, annual merit increases, an increase inincentive compensation, a $16.7 million reduction in the benefit from R&D grants received from France andAustria, incremental costs from businesses acquired in 2011 and 2012, and various other individually insignificantfactors. As a percent of service revenues, Product Development’s costs of service revenues were 61.7% and 60.1%in 2012 and 2011, respectively, with the increase primarily related to (1) a competitive pricing environment, (2) theincrease in headcount noted above to meet demand as well as to deliver on several large and complex projects,(3) the impact from the decrease in the benefit from R&D grants noted above, (4) investments in equipment andresources in 2012 that have enabled us to expand our global laboratories testing capabilities as well as our globalreach for these services, and (5) overcapacity in the early clinical development services marketplace.
57

Selling, General and Administrative Expenses
2013 compared to 2012
As a percent of service revenues, Product Development’s selling, general and administrative expenses were20.7% and 20.8% in 2013 and 2012, respectively. Product Development’s selling, general and administrativeexpenses increased approximately $37.1 million in 2013 as compared to 2012. This increase was primarilycaused by increases in compensation and related expenses resulting from annual merit increases, facilities costs,depreciation and amortization, incremental costs for severance accruals of approximately $8.4 million related tooverhead cost reduction programs, and the impact from the business combinations completed in 2012 and 2013.These increases were partially offset by a positive foreign currency impact of approximately $11.2 million.
2012 compared to 2011
As a percent of service revenues, Product Development’s selling, general and administrative expenses were20.8% and 22.5% in 2012 and 2011, respectively. Product Development’s selling, general and administrativeexpenses increased approximately $18.7 million in 2012 as compared to 2011. This increase was primarilycaused by (1) incremental costs resulting from the business combinations completed in the fourth quarter of 2011and the third quarter of 2012, and (2) increased spending on business development and IT costs (including higherdepreciation and amortization expense related to an increase in assets in service). The remaining increase wasprimarily the result of increases in compensation and related expenses including the impact of merit increases, anincrease in headcount and higher incentive compensation. These increases were partially offset by (1) a positiveforeign currency impact of approximately $13.9 million and (2) a reduction in facility costs due to aconsolidation of offices in Europe (including lower depreciation and amortization expense due to fewer assets inservice).
Integrated Healthcare Services
Change
2013 2012 2011 2013 vs. 2012 2012 vs. 2011
(dollars in millions)
Service revenues . . . . . . . . . . . . . . . . . . . . . . . . . . . $888.6 $963.6 $857.2 $(75.0) (7.8%) $106.4 12.4%Costs of revenue, service costs . . . . . . . . . . . . . . . . 718.6 776.0 688.7 (57.4) (7.4) 87.3 12.7
as a percentage of service revenues . . . . . . . . 80.9% 80.5% 80.3%Selling, general and administrative expenses . . . . . 127.9 127.1 110.3 0.8 0.7 16.8 15.3
Segment income from operations . . . . . . . . . . . . . . $ 42.1 $ 60.5 $ 58.2 $(18.4) (30.4%) $ 2.3 4.0%
as a percentage of service revenues . . . . . . . . 4.7% 6.3% 6.8%
Service Revenues
2013 compared to 2012
Integrated Healthcare Services’ service revenues were $888.6 million in 2013, a decrease of $75.0 million,or 7.8%, compared to 2012. This decrease was primarily due to a negative impact of approximately $47.0 milliondue to the effect of foreign currency fluctuations coupled with a constant currency revenue decrease of $28.0million, or 2.9%. The decline in constant currency service revenues occurred primarily in commercial services inNorth America as revenues generated from recent strong new business has not yet reached a level sufficient tooffset the impact from scope reductions and cancellations that occurred in prior periods.
2012 compared to 2011
Integrated Healthcare Services’ service revenues were $963.6 million in 2012, an increase of $106.4million, or 12.4%, compared to 2011. This is comprised of constant currency revenue growth of $130.4 million,
58
or 15.2%, which was partially offset by a negative impact of approximately $24.0 million due to the effect offoreign currency fluctuations. The constant currency service revenues growth was related to businesses acquiredin 2011 as well as growth in North America, Europe and Japan. The increase in North America was primarily dueto delivery on higher backlog in place as we entered the year. The increase in Europe was primarily due torevenue from a new agreement to distribute pharmaceutical products in Italy, partially offset by lower non-product related revenues. The modest revenue increase in Japan reflects the competitive market for these servicesin that region.
Costs of Service Revenues
2013 compared to 2012
Integrated Healthcare Services’ costs of service revenues in 2013 were lower by approximately $57.4 millionas compared to 2012. This decrease was comprised of a reduction of $36.6 million from a positive impact of foreigncurrency fluctuations and a $20.8 million constant currency decrease. The constant currency decrease was primarilyrelated to a decrease in compensation and related expenses driven mainly by a decrease in billable headcount.
2012 compared to 2011
Integrated Healthcare Services’ costs of service revenues in 2012 were higher by approximately $87.3million as compared to 2011. This increase was comprised of $107.0 million of constant currency growth, whichwas partially offset by a reduction of $19.7 million from the effect of foreign currency fluctuations. The constantcurrency growth was primarily related to an increase in compensation and related expenses driven mainly by anincrease in billable headcount, annual merit increases and an increase in incentive compensation, as well asincremental costs from businesses acquired in 2011. Also contributing to the constant currency growth were costsrelated to a new agreement to distribute pharmaceutical products in Italy. These impacts were partially offset by adecline in recruiting costs, as we were able to redeploy available resources on new business.
Selling, General and Administrative Expenses
2013 compared to 2012
Integrated Healthcare Services’ selling, general and administrative expenses in 2013 were slightly higher ascompared to 2012 primarily due to higher compensation and related expenses, IT costs, and facility costs as wellas severance of approximately $1.6 million related to overhead cost reduction programs. These increases weremostly offset by lower depreciation and amortization expense and a reduction of approximately $4.1 millionfrom the positive effect of foreign currency fluctuations.
2012 compared to 2011
As a percent of service revenues, Integrated Healthcare Services’ selling, general and administrative costswere 13.2% and 12.9% in 2012 and 2011, respectively. The $16.8 million increase in Integrated HealthcareServices’ selling, general and administrative expenses in 2012 as compared to 2011 was primarily due to $20.0million from businesses acquired in the fourth quarter of 2011, which were partially offset by a reduction of $2.6million from the effect of foreign currency fluctuations.
Liquidity and Capital Resources
Overview
We assess our liquidity in terms of our ability to generate cash to fund our operating, investing andfinancing activities. Our principal source of liquidity is operating cash flows. In addition to operating cash flows,other significant factors that affect our overall management of liquidity include: capital expenditures,acquisitions, debt service requirements, dividends, equity repurchases, adequacy of our revolving credit facility,and access to the capital markets.
59
We manage our worldwide cash requirements by monitoring the funds available among our subsidiaries anddetermining the extent to which those funds can be accessed on a cost effective basis. The repatriation of cashbalances from certain of our subsidiaries could have adverse income tax consequences. In 2013, we changed ourassertion regarding the earnings of most of our foreign subsidiaries and now consider them indefinitely reinvestedoutside of the United States. Making this assertion limits our ability to repatriate cash from our foreign subsidiariesfor the foreseeable future. In making this assertion, we determined that the cash flows expected to be generated inthe United States are expected to be sufficient to fund our operating requirements and debt service obligations in theUnited States and that we expect the cash generated by the affected foreign subsidiaries will be used to fund growthoutside of the United States. A future distribution or change in this assertion could result in additional tax liability.
We had a cash balance of $778.1 million at December 31, 2013 ($320.1 million of which was in the UnitedStates), an increase from $567.7 million at December 31, 2012.
On October 30, 2013, our Board approved an equity repurchase program authorizing the repurchase of up to$125.0 million of either our common stock or vested in-the-money employee stock options, or a combinationthereof. We have used and intend to continue to use cash on hand to fund the equity repurchase program. Theequity repurchase program does not obligate us to repurchase any particular amount of common stock or vestedin-the-money employee stock options, and it could be modified, suspended or discontinued at any time.Repurchases of vested in-the-money employee stock options were made through transactions between us and ouremployees (other than our executive officers, who were not eligible to participate in the program), and this aspectof the equity repurchase program expired in November 2013. The equity repurchase program for common stockdoes not have an end date. Additional information regarding our equity repurchase program is presented in PartII, Item 5 “Market for Registrant’s Common Equity, Related Stockholder Matters and Issuer Purchases of EquitySecurities” and Note 13 to our audited consolidated financial statements included elsewhere in this AnnualReport on Form 10-K.
On May 14, 2013, we completed the IPO of our common stock at a price to the public of $40.00 per share.We issued and sold 13,125,000 shares of common stock in the IPO and received proceeds of approximately$489.6 million, after deducting underwriting discounts, commissions and related expenses.
We used the net proceeds from the IPO as follows: (1) we repaid approximately $358.9 million of debt,including accrued interest and related fees and expenses, (2) we paid a one-time fee of $25.0 million to terminateour management agreement with our private equity sponsors, and (3) we used the remaining portion of the netproceeds, together with cash on hand, to complete the acquisition of Novella for approximately $146.6 million incash (net of approximately $26.2 million of acquired cash).
Based on our current operating plan, we believe that our available cash and cash equivalents, future cashflows from operations and our ability to access funds under our revolving credit facility, will enable us to fundour operating requirements and capital expenditures and meet debt obligations for at least the next 12 months.We regularly evaluate our debt arrangements, as well as market conditions, and from time to time we mayexplore opportunities to modify our existing debt arrangements or pursue additional financing arrangements thatcould result in the issuance of new debt securities by us or our affiliates. We may use our existing cash, cashgenerated from operations or dispositions of assets or businesses and/or proceeds from any new financingarrangements or issuances of debt or equity securities to repay or reduce some of our outstanding obligations, torepurchase shares from our shareholders or for other purposes. While our Board will review our dividend policyfrom time to time, we currently do not intend to pay dividends in the foreseeable future. As part of our ongoingbusiness strategy, we also are continually evaluating new acquisition, expansion and investment possibilities orother strategic growth opportunities, as well as potential dispositions of assets or businesses, as appropriate,including dispositions that may cause us to recognize a loss on certain assets. Should we elect to pursue any suchtransaction, we may seek to obtain debt or equity financing to facilitate those activities. Our ability to enter intoany such potential transactions and our use of cash or proceeds is limited to varying degrees by the terms andrestrictions contained in our senior secured credit facilities. We cannot provide assurances that we will be able tocomplete any such alternative financing arrangements or other transactions on favorable terms or at all.
60

Senior Secured Credit Agreement
Our senior secured credit agreement provides for a $300 million revolving credit facility, due in 2018. Therewere no amounts drawn on this revolving credit facility in 2013.
On December 20, 2013, we entered into an amendment to our senior secured credit agreement to provide anew Term Loan B-3 with a syndicate of banks for an aggregate principal amount of $2.061 billion due in 2018.The proceeds from the Term Loan B-3 were used to repay the then outstanding balances of the Term Loan B-1and Term Loan B-2 and related fees and expenses. The Term Loan B-3 bears interest at the greater of LIBOR or1.25% plus 2.5%, which is 75 and 25 basis points lower than the interest rates that were in effect on the retiredTerm Loan B-1 and Term Loan B-2, respectively. Quarterly principal payments on the Term Loan B-3 are $5.15million, commencing on September 30, 2014 and continuing through March 31, 2018, with the balance of theTerm Loan B-3 to be repaid at final maturity on June 8, 2018. The credit facility arrangements are collateralizedby substantially all of the assets of Quintiles Transnational and the assets of Quintiles Transnational’s domesticsubsidiaries including 100% of the equity interests of substantially all of Quintiles Transnational’s domesticsubsidiaries and 65% of the equity interests of substantially all of the first-tier foreign subsidiaries of QuintilesTransnational and its domestic subsidiaries (in each case other than certain excluded subsidiaries as defined inthe credit agreement). Beginning with fiscal year ending December 31, 2014, we are required to apply 50% ofexcess cash flow (as defined in the credit agreement), subject to a reduction to 25% or 0% depending uponQuintiles Transnational’s total leverage ratio, for prepayment of the Term Loan B-3, with any such prepaymentto be applied, first, in direct order of maturities, pro rata to reduce the Term Loan B-3 principal payments duewithin eight quarters of such prepayment, then on a pro rata basis to reduce the other principal payments dueprior to the maturity date, and then to reduce the principal payments due on the maturity date. The amendmentalso provides additional flexibility for us to enter into certain securitization financing transactions. Other termsand covenants of the Term Loan B-3 are the same as the terms and covenants of our Term Loan B-1 and TermLoan B-2 prior to the amendment. In connection with this amendment to the credit agreement, we recognized a$3.3 million loss on extinguishment of debt which included approximately $1.6 million of unamortized debtissuance costs, approximately $1.6 million of unamortized discount and approximately $25,000 of related feesand expenses.
Restrictive Covenants
The credit agreement governing the Quintiles Transnational senior secured credit facilities contains usualand customary restrictive covenants (subject to significant exceptions) that place limitations on QuintilesTransnational’s ability, and the ability of Quintiles Transnational’s restricted subsidiaries, to incur liens; engagein acquisitions, loans and other investments; incur additional indebtedness; merge, dissolve, liquidate orconsolidate with or into other persons; sell or otherwise dispose of assets; declare dividends, including toQuintiles Holdings, and make other restricted payments; engage in businesses that are not related to QuintilesTransnational’s and its restricted subsidiaries’ existing business; transact with affiliates; enter into agreementsthat restrict subsidiaries from paying intercompany dividends or completing intercompany property transfers orthat restrict the ability to create liens in favor of Quintiles Transnational’s lenders; amend or otherwise modifyorganizational documents or terms and conditions of junior financing documents, if any; change the fiscal year ofQuintiles Transnational; prepay, redeem or purchase junior financing, if any; designate any other indebtedness as“designated senior indebtedness” or “senior secured financing”; and engage in sale and leaseback transactions.The credit agreement also contains one financial covenant, which is a total leverage ratio financial covenant thatprovides for a maximum ratio of consolidated debt, as defined in the credit agreement, to consolidated EBITDA,as defined in the credit agreement, for any period of four consecutive fiscal quarters, measured as of the end ofsuch period, of 5.50 to 1.00 in 2013, 5.25 to 1.00 in 2014, 5.00 to 1.00 in 2015, and 4.75 to 1.00 in 2016 andthereafter, and applies at any time Quintiles Transnational makes a revolving loan borrowing, a swingline loanborrowing or issues a letter of credit, and for so long as any revolving loan, swingline loan, unreimburseddrawing under any letter of credit or undrawn letter of credit remains outstanding. In 2013, 2012 and 2011, webelieve we were in compliance with our debt covenants.
61

See Note 10 to our audited consolidated financial statements included elsewhere in this Annual Report onForm 10-K for additional details regarding our credit arrangements.
Years ended December 31, 2013, 2012 and 2011
Cash Flow from Operating Activities
Year Ended December 31,
2013 2012 2011
(in thousands)
Net cash provided by operating activities . . . . . . . . . . . . . . . . . . . . . . . . . . . . . $397,370 $335,701 $160,953
2013 compared to 2012
Cash provided by operating activities increased by $61.7 million in 2013 as compared 2012. The increase inoperating cash flow reflects lower payments for income taxes ($33.0 million) and interest ($11.6 million) in2013. In addition, net income increased despite including cash expenses totaling $32.5 million for a fee paid inconnection with the termination of our management agreement with affiliates of certain of our shareholders($25.0 million), a fee paid in connection with the modification of an agreement for the business usage of anairplane owned by GFM ($1.5 million), and a termination fee for the repayment of the $300.0 million term loan($6.0 million). These improvements in operating cash flow were partially offset by higher cash used in days salesoutstanding, or DSO ($74.1 million). This higher cash used reflected a five-day increase in DSO in 2013. The netimpact on cash from the increase in DSO resulted from the fact that we have continued to experience a trendtoward longer payment terms on our contracts. DSO can shift significantly at each reporting period depending onthe timing of cash receipts under contractual payment terms relative to the recognition of revenue over a projectlifecycle.
2012 compared to 2011
Cash provided by operating activities increased by $174.7 million in 2012 as compared to 2011. Theincrease in operating cash flow was primarily as a result of the increase in income from operations, animprovement from the impact of the DSO, of ($162.4 million) and $23.7 million less cash used to pay expensesrelated to extinguishing debt in the 2012 compared to the 2011. The improvement in cash flows from DSO is as aresult of a three-day decrease in DSO in 2012 compared to an 11-day increase in DSO in 2011. The net impacton cash from DSO is a result of normal fluctuations in the timing of payments from customers. Although wehave continued to experience a trend toward longer payment terms on our contracts, a strong collection effort andsignificant cash payments late in 2012 on the close out of several large contracts resulted in the timing relateddecrease in DSO. These increases were partially offset by higher cash payments in 2012 for income taxes andinterest of approximately $40.6 million and $26.2 million, respectively.
Cash Flow from Investing Activities
Year Ended December 31,
2013 2012 2011
(in thousands)
Net cash used in investing activities . . . . . . . . . . . . . . . . . . . . . . . . . . . . . . . $(240,175) $(132,233) $(224,838)
2013 compared to 2012
Cash used in investing activities increased by $108.0 million to $240.2 million in 2013, as compared to$132.2 million in 2012. The uses of cash in 2013 consisted primarily of the acquisition of Novella forapproximately $145.0 million, acquisitions of property, equipment and software and cash used to fundinvestments in unconsolidated affiliates.
62
2012 compared to 2011
Cash used in investing activities decreased by $92.6 million to $132.2 million in 2012, as compared to$224.8 million in 2011. The uses of cash in 2012 consisted primarily of acquisitions of businesses, acquisitionsof property, equipment and software and cash used to fund investments in unconsolidated affiliates and thepurchase of equity securities. The cash used for the purchase of equity securities was due to the payment of theremaining commitment to fund our Samsung Group joint venture (approximately $13.2 million). Cash used foracquisitions of businesses includes approximately $39.3 million for the acquisition of Expression Analysis in thethird quarter of 2012 as well as a $3.9 million scheduled payment pursuant to the terms in the purchaseagreement of Outcome, which we acquired in 2011.
Cash Flow from Financing Activities
Year Ended December 31,
2013 2012 2011
(in thousands)
Net cash provided by (used in) financing activities . . . . . . . . . . . . . . . . . . . . . . $70,957 $(146,873) $(59,309)
2013 compared to 2012
Net cash provided by financing activities increased by $217.9 million to $71.0 million in 2013, as comparedto cash used of $146.9 million in 2012. The increase in cash provided by financing activities in 2013 wasprimarily related to 1) the net proceeds of our IPO ($489.6 million), 2) lower cash used for dividends (zero paidin 2013 as compared to $567.9 million paid in 2012) and 3) cash received upon the exercise of stock options($12.2 million). These increases in financing cash flows were partially offset by $822.3 million higher net use ofcash for debt (cash used to pay debt and debt issue costs, less proceeds from the issuance of debt), which was ause of cash of $386.5 million in 2013, as compared to cash provided of $435.8 million in 2012, and $57.1 millionof cash used to repurchase common stock and stock options in 2013 under our Board approved equity repurchaseprogram. The increase in net cash used for debt in 2013 was primarily as a result of repayment of all amountsoutstanding under the $300.0 million term loan (which was issued in 2012) and $83.8 million of repayments onour senior secured credit facilities (including a voluntary pay down of $50.0 million and a mandatory prepaymentof $33.8 million as a result of excess cash flow (as defined in the credit agreement)).
2012 compared to 2011
Net cash used in financing activities increased by $87.6 million to $146.9 million in 2012, as compared tocash used of $59.3 million in 2011. The primary reason for the increase in cash used in financing activities in2012 was related to an increase in dividends paid partially offset by the issuance of additional debt. Dividendspaid on common stock increased by $279.6 million to $567.9 million ($4.91 per share) in 2012 as compared to$288.3 million ($2.48 per share) in 2011. This increase in the use of cash was partially offset by $186.9 millionhigher net proceeds from debt issuance (proceeds from the issuance of debt, net of costs less principal paymentson credit arrangements) which were $435.8 million in 2012, as compared to $248.9 million in 2011.
63

Contractual Obligations and Commitments
Below is a summary of our future payment commitments by year under contractual obligations as ofDecember 31, 2013 (in thousands):
2014 2015-2016 2017-2018 Thereafter Total
Long-term debt, including interest (1) . . . . . . . . . . $ 90,109 $198,957 $2,118,915 $ — $2,407,981Obligations under capital leases . . . . . . . . . . . . . . . 132 106 — — 238Operating leases . . . . . . . . . . . . . . . . . . . . . . . . . . . 98,154 137,749 79,015 99,320 414,238Purchase obligations (2) . . . . . . . . . . . . . . . . . . . . . 4,081 3,388 200 — 7,669Commitments to unconsolidated affiliates (3) . . . . 1,224 — — — 1,224Defined benefit plans (4) . . . . . . . . . . . . . . . . . . . . 13,013 — — — 13,013Uncertain income tax positions (5) . . . . . . . . . . . . . 1,617 — — — 1,617Contingent consideration (6) . . . . . . . . . . . . . . . . . 5,035 7,979 — — 13,014
Total . . . . . . . . . . . . . . . . . . . . . . . . . . . . . . . . . . . . $213,365 $348,179 $2,198,130 $99,320 $2,858,994
(1) Interest payments on floating rate debt are based on the interest rate in effect on December 31, 2013.(2) Purchase obligations are defined as agreements to purchase goods or services that are enforceable and
legally binding and that specify all significant terms, including fixed or minimum quantities to bepurchased, fixed, minimum or variable pricing provisions and the approximate timing of the transactions.
(3) We are currently committed to invest $50.0 million in the Fund. As of December 31, 2013, we have fundedapproximately $15.8 million of this commitment. We have approximately $34.2 million remaining to befunded under this commitment.
(4) We made cash contributions totaling approximately $8.6 million to our defined benefit plans in 2013, andwe estimate that we will make contributions totaling approximately $13.0 million in 2014. Due to thepotential impact of future plan investment performance, changes in interest rates, changes in other economicand demographic assumptions and changes in legislation in foreign jurisdictions, we are not able toreasonably estimate the timing and amount of contributions that may be required to fund our defined benefitplans for periods beyond 2014.
(5) As of December 31, 2013, our liability related to uncertain income tax positions was approximately $47.8million, $46.2 million of which has not been included in the above table as we are unable to predict when theseliabilities will be paid due to the uncertainties in the timing of the settlement of the income tax positions.
(6) Contingent consideration payable in connection with acquisitions.
Application of Critical Accounting Policies
Note 1 to the consolidated financial statements provided elsewhere in this Annual Report on Form 10-Kdescribes the significant accounting policies used in the preparation of the consolidated financial statements. Thepreparation of our consolidated financial statements requires management to make estimates and assumptionsthat affect the reported amounts of assets and liabilities, and the disclosure of contingent assets and liabilities atthe date of the financial statements, as well as the reported amounts of revenues and expenses during the period.Our estimates are based on historical experience and various other assumptions we believe are reasonable underthe circumstances. We evaluate our estimates on an ongoing basis and make changes to the estimates and relateddisclosures as experience develops or new information becomes known. Actual results may differ from thoseestimates.
We believe the following critical accounting policies affect our more significant judgments and estimatesused in the preparation of our consolidated financial statements.
Revenue Recognition
We recognize revenue when all of the following conditions are satisfied: (1) there is persuasive evidence ofan arrangement, (2) the service offering has been delivered to the customer, (3) the collection of fees is probable
64

and (4) the arrangement consideration is fixed or determinable. We do not recognize revenue with respect tostart-up activities including contract and scope negotiation, feasibility analysis and conflict of interest reviewassociated with contracts. The costs for these activities are expensed as incurred. For contracts in which portionsof revenue are contingent upon the occurrence of uncertain future events we recognize the revenue only after ithas been earned and the contingency has been resolved.
The majority of our revenue is recognized based on objective contractual criteria and does not requiresignificant estimates or judgments. However, at any point in time we are working on thousands of active customerprojects, which are governed by individual contracts. Most projects are customized based on the needs of thecustomer, the type of services being provided, therapeutic indication of the drug, geographic locations and othervariables. Project specific terms related to pricing, billing terms and the scope and type of services to be providedare generally negotiated and contracted on a project-by-project basis. Changes in the scope of work are common,especially under long-term contracts, and generally result in a change in contract value. In such situations, we enterinto negotiations for a contract amendment to reflect the change in scope and the related price. Depending on thecomplexity of the amendment, the negotiation process can take from a few weeks for a simple adjustment to severalmonths for a complex amendment. In limited situations, management may authorize the project team to commencework on activities outside the contract scope while we negotiate and finalize the contract amendment. In theselimited cases, if we are not able to obtain a contract amendment from the customer, our profit margin on thearrangement may be impacted. This result occurs because our costs of delivery are expensed as they are incurred,while revenue is not recognized unless the customer has agreed to the changes in scope and renegotiated pricingterms, the contract value is amended and all other revenue recognition criteria are met.
For arrangements that include multiple elements, arrangement consideration is allocated to units ofaccounting based on the relative selling price. The best evidence of selling price of a unit of accounting isvendor-specific objective evidence, or VSOE, which is the price we charge when the deliverable is soldseparately. When VSOE is not available to determine selling price, we use relevant third-party evidence, or TPE,of selling price, if available. When neither VSOE nor TPE of selling price exists, we use our best estimate ofselling price considering all relevant information that is available without undue cost and effort.
Most contracts are terminable upon 30 to 90 days notice by the customer. Our risk of material loss in thesesituations is mitigated as these contracts generally require payment to us for expenses to wind down the trial orproject, fees earned to date and, in some cases, a termination fee or a payment of some portion of the fees orprofits that could have been earned under the contract if it had not been terminated early. In addition, our contractterms provide for payment terms that generally correspond with performance of the services. Termination feesare included in service revenues when realization is assured.
Accounts Receivable and Unbilled Services
Accounts receivable represents amounts billed to customers. Revenues recognized in excess of billings areclassified as unbilled services. The realization of these amounts is based on the customer’s willingness andability to pay us. We have an allowance for doubtful accounts based on management’s estimate of probablelosses we expect to incur resulting from a customer failing to pay us. Our allowance for doubtful accounts, andlosses from customers failing to pay us, have not been material to our results of operations. If any of theseestimates change or actual results differs from expected results, then an adjustment is recorded in the period inwhich the amounts become reasonably estimable. These adjustments could have a material effect on our resultsof operations.
Investments in Unconsolidated Affiliates—Equity Method Investments
We have investments in unconsolidated affiliates that are accounted for under the equity method ofaccounting. Periodically, we review our investments for a decline in value which we believe may be other thantemporary. Should we identify such a decline, we will record a loss through earnings to establish a new cost basisfor the investment. These losses could have a material adverse effect on our results of operations.
65

Income Taxes
Certain items of income and expense are not recognized on our income tax returns and financial statementsin the same year, which creates timing differences. The income tax effect of these timing differences results in(1) deferred income tax assets that create a reduction in future income taxes and (2) deferred income taxliabilities that create an increase in future income taxes. Recognition of deferred income tax assets is based onmanagement’s belief that it is more likely than not that the income tax benefit associated with certain temporarydifferences, income tax operating loss and capital loss carryforwards and income tax credits, would be realized.We recorded a valuation allowance to reduce our deferred income tax assets for those deferred income tax itemsfor which it was more likely than not that realization would not occur. We determined the amount of thevaluation allowance based, in part, on our assessment of future taxable income and in light of our ongoingincome tax strategies. If our estimate of future taxable income or tax strategies changes at any time in the future,we would record an adjustment to our valuation allowance. Recording such an adjustment could have a materialeffect on our financial position.
Income tax expense is based on the distribution of profit before income tax among the various taxingjurisdictions in which we operate, adjusted as required by the income tax laws of each taxing jurisdiction.Changes in the distribution of profits and losses among taxing jurisdictions may have a significant impact on oureffective income tax rate. Beginning in 2013, we consider the undistributed earnings of most of our foreignsubsidiaries to be indefinitely reinvested outside of the United States. Accordingly, we have not provided adeferred income tax liability related to those undistributed earnings.
Business Combinations
We use the acquisition method to account for business combinations, and accordingly, the identifiable assetsacquired, the liabilities assumed and any noncontrolling interest in the acquiree are recorded at their estimatedfair values on the date of the acquisition. We use significant judgments, estimates and assumptions indetermining the estimated fair value of assets acquired, liabilities assumed and noncontrolling interest includingexpected future cash flows; discount rates that reflect the risk associated with the expected future cash flows; andestimated useful lives.
When a business combination involves contingent consideration, we recognize a liability equal to theestimated fair value of the contingent consideration obligation at the date of the acquisition. The estimate of fairvalue of a contingent consideration liability requires subjective assumptions to be made regarding future businessresults including revenues and net new business, discount rates that reflect the risk associated with the expectedfuture cash flows and probabilities assigned to various potential business result scenarios. We periodicallyreassess the estimated fair value of the contingent consideration over the term of the arrangement. Any resultingchanges are recognized in earnings and could have a material effect on our results of operations.
Goodwill, Tangible and Identifiable Intangible Assets
We have recorded and allocated to our reporting units the excess of the cost over the fair value of the netassets acquired, known as goodwill. The recoverability of the goodwill and indefinite-lived intangible assets areevaluated annually for impairment, or if and when events or circumstances indicate a possible impairment.Goodwill and indefinite-lived intangible assets are not amortized. We review the carrying values of otheridentifiable intangible assets if the facts and circumstances indicate a possible impairment. Based upon our 2013annual testing, we believe that the risk of a significant impairment to goodwill or indefinite-lived intangibleassets is currently very low. Other identifiable intangible assets are amortized over their estimated useful lives.
For goodwill, we perform a qualitative analysis to determine whether it is more likely than not that theestimated fair value of a reporting unit is less than its book value. This includes a qualitative analysis ofmacroeconomic conditions, industry and market considerations, internal cost factors, financial performance, fairvalue history and other company specific events. If this qualitative analysis indicates that it is more likely than
66

not that estimated fair value is less than the book value for the respective reporting unit, we apply a two-stepimpairment test in which we determine whether the estimated fair value of the reporting unit is in excess of itscarrying value. If the carrying value of the net assets assigned to the reporting unit exceeds the estimated fairvalue of the reporting unit, we perform the second step of the impairment test to determine the implied estimatedfair value of the reporting unit’s goodwill. We determine the implied estimated fair value of goodwill bydetermining the present value of the estimated future cash flows for each reporting unit and comparing thereporting unit’s risk profile and growth prospects to selected, reasonably similar publicly traded companies. Theinherent subjectivity of applying a discounted cash flow and market comparables approach to valuing our assetsand liabilities could have a significant impact on our analysis. Any future impairment could have a materialadverse effect on our financial condition or results of operations.
For indefinite-lived intangible assets, we perform a qualitative analysis to determine whether it is morelikely than not that the estimated fair value of the indefinite-lived intangible asset is less than its carrying value.If this qualitative analysis indicates that it is more likely than not that the estimated fair value is less than thecarrying value of the indefinite-lived intangible asset, we determine the estimated fair value of the indefinite-lived intangible asset (trade name) by determining the present value of the estimated royalty payments on anafter-tax basis that it would be required to pay the owner for the right to use such trade name. If the carryingamount exceeds the estimated fair value, an impairment loss is recognized in an amount equal to the excess. Anyfuture impairment could have a material adverse effect on our financial condition or results of operations.
We review the carrying values of property and equipment if the facts and circumstances suggest that apotential impairment may have occurred. If this review indicates that carrying values will not be recoverable, asdetermined based on undiscounted cash flows over the remaining depreciation or amortization period, we willreduce carrying values to estimated fair value. The inherent subjectivity of our estimates of future cash flowscould have a significant impact on our analysis. Any future write-offs of long-lived assets could have a materialadverse effect on our financial condition or results of operations.
Share-based Compensation Expense
In accordance with ASC 718, “Stock Compensation,” as modified or supplemented, we measurecompensation cost for most share-based payment awards (stock options and stock appreciation rights) granted toemployees and non-employee directors at fair value using the Black-Scholes-Merton option-pricing model.Share-based compensation expense includes share-based awards granted to employees and non-employeedirectors and has been reported in selling, general and administrative expenses in our consolidated statements ofincome based upon the classification of the individuals who were granted share-based awards.
We calculate the fair value of share-based compensation awards using the Black-Scholes-Merton option-pricing model. The Black-Scholes-Merton option-pricing model requires the use of subjective assumptions,including share price volatility, the expected life of the award, risk-free interest rate and the fair value of theunderlying common shares on the date of grant. In developing our assumptions, we take into account the following:
• As a result of our status as a private company prior to our IPO, we do not have sufficient history toestimate the volatility of our common share price. We calculate expected volatility based on reporteddata for selected reasonably similar publicly traded companies for which the historical information isavailable. We plan to continue to use the guideline peer group volatility information until the historicalvolatility of our common shares is relevant to measure expected volatility for future award grants;
• We determine the risk-free interest rate by reference to implied yields available from United StatesTreasury securities with a remaining term equal to the expected life assumed at the date of grant;
• We estimate the dividend yield to be zero since we do not anticipate paying any future dividendssubsequent to the IPO;
• We estimate the average expected life of the award based on our historical experience; and
• We estimate forfeitures based on our historical analysis of actual forfeitures.
67

Item 7A. Quantitative and Qualitative Disclosures About Market Risk
Market risk is the potential loss arising from adverse changes in market rates and prices, such as foreigncurrency exchange rates, interest rates and other relevant market rate or price changes. In the ordinary course ofbusiness, we are exposed to various market risks, including changes in foreign currency exchange rates, interestrates and equity price changes, and we regularly evaluate our exposure to such changes. Our overall riskmanagement strategy seeks to balance the magnitude of the exposure and the cost and availability of appropriatefinancial instruments. From time to time, we have utilized forward exchange contracts to manage our foreigncurrency exchange rate risk. The following analyses present the sensitivity of our financial instruments tohypothetical changes in interest rates and equity prices that are reasonably possible over a one-year period.
Foreign Currency Exchange Rates
Approximately 37.8% and 38.9% of our service revenues for the years ended December 31, 2013 and 2012,respectively, were denominated in currencies other than the United States dollar. Our financial statements arereported in United States dollars and, accordingly, fluctuations in exchange rates will affect the translation of ourrevenues and expenses denominated in foreign currencies into United States dollars for purposes of reporting ourconsolidated financial results. In 2013 and 2012, the most significant currency exchange rate exposures were theEuro, British pound, Singapore dollar, Indian rupee and South African rand. A hypothetical change of 10% inaverage exchange rates used to translate all foreign currencies to United States dollars would have impactedincome before income taxes for 2013 by approximately $45.0 million. Accumulated currency translationadjustments recorded as a separate component of shareholders’ deficit were ($5.8) million and $19.3 million atDecember 31, 2013 and 2012, respectively. We do not have significant operations in countries in which theeconomy is considered to be highly-inflationary.
We are subject to foreign currency transaction risk for fluctuations in exchange rates during the period oftime between the consummation and cash settlement of a transaction. We earn revenue from our service contractsover a period of several months and, in some cases, over a period of several years. Accordingly, exchange ratefluctuations during this period may affect our profitability with respect to such contracts. We limit our foreigncurrency transaction risk through exchange rate fluctuation provisions stated in our contracts with customers, orwe may hedge our transaction risk with foreign currency exchange contracts. At December 31, 2013, we had 12open foreign exchange forward contracts relating to service contracts with various amounts maturing monthlythrough September 2014 with a notional value totaling approximately $60.8 million. At December 31, 2012, wehad 12 open foreign exchange forward contracts relating to service contracts with various amounts maturingmonthly through September 2013 with a notional value totaling approximately $38.9 million.
Interest Rates
Because we have variable rate debt, fluctuations in interest rates affect our business. We attempt tominimize interest rate risk and lower our overall borrowing costs through the utilization of derivative financialinstruments, primarily interest rate swaps. We have entered into interest rate swaps with financial institutions thathave reset dates and critical terms that match those of our term loan credit facility. Accordingly, any change inmarket value associated with the interest rate swaps is offset by the opposite market impact on the related debt.As of December 31, 2013, we had approximately $2.061 billion of total indebtedness with variable interest at thegreater of the three month LIBOR or 1.25%, plus 2.50%, or 3.75% at December 31, 2013, of which $945.0million, or 45.9%, was hedged at a fixed rate of 2.55%, leaving approximately $1.116 billion of unhedgedvariable rate debt. Because we do not attempt to hedge all of our variable rate debt, we may incur higher interestcosts for the portion of our variable rate debt which is not hedged. Each quarter-point increase or decrease in thevariable interest rate would result in our interest expense changing by approximately $2.8 million per year underour unhedged variable rate debt.
68

Equity Prices
At December 31, 2013 and 2012, we held investments in marketable equity securities. These investmentsare classified as available-for-sale and are recorded at fair value in the financial statements. These securities aresubject to equity price risk. As of December 31, 2013 and 2012, the fair value of these investments was $7.7million and $2.4 million, respectively, based on quoted equity prices. The potential loss in fair value resultingfrom a hypothetical decrease of 10% in quoted equity price was approximately $767,000 and $243,000 atDecember 31, 2013 and 2012, respectively.
69
Item 8. Financial Statements and Supplementary Data
REPORT OF INDEPENDENT REGISTERED PUBLIC ACCOUNTING FIRM
To the Board of Directors and Shareholders ofQuintiles Transnational Holdings Inc.:
In our opinion, the consolidated financial statements listed in the index appearing under Item 15(a)(1) presentfairly, in all material respects, the financial position of Quintiles Transnational Holdings Inc. and its subsidiariesat December 31, 2013 and 2012, and the results of their operations and their cash flows for each of the threeyears in the period ended December 31, 2013 in conformity with accounting principles generally accepted in theUnited States of America. In addition, in our opinion, the financial statement schedules listed in the indexappearing under Item 15(a)(2) present fairly, in all material respects, the information set forth therein when readin conjunction with the related consolidated financial statements. These financial statements and financialstatement schedules are the responsibility of the Company’s management. Our responsibility is to express anopinion on these financial statements and financial statement schedules based on our audits. We conducted ouraudits of these statements in accordance with the standards of the Public Company Accounting Oversight Board(United States). Those standards require that we plan and perform the audit to obtain reasonable assurance aboutwhether the financial statements are free of material misstatement. An audit includes examining, on a test basis,evidence supporting the amounts and disclosures in the financial statements, assessing the accounting principlesused and significant estimates made by management, and evaluating the overall financial statement presentation.We believe that our audits provide a reasonable basis for our opinion.
/s/ PricewaterhouseCoopers LLP
Raleigh, North CarolinaFebruary 13, 2014
70

QUINTILES TRANSNATIONAL HOLDINGS INC. AND SUBSIDIARIESCONSOLIDATED STATEMENTS OF INCOME
Year Ended December 31,
2013 2012 2011
(in thousands, except per share data)
Service revenues . . . . . . . . . . . . . . . . . . . . . . . . . . . . . . . . . . . . . . . . . . . . $3,808,340 $3,692,298 $3,294,966Reimbursed expenses . . . . . . . . . . . . . . . . . . . . . . . . . . . . . . . . . . . . . . . . 1,291,205 1,173,215 1,032,782
Total revenues . . . . . . . . . . . . . . . . . . . . . . . . . . . . . . . . . . . . . . . . . . 5,099,545 4,865,513 4,327,748Costs, expenses and other:Costs of revenue, service costs . . . . . . . . . . . . . . . . . . . . . . . . . . . . . . . . . 2,471,426 2,459,367 2,153,005Costs of revenue, reimbursed expenses . . . . . . . . . . . . . . . . . . . . . . . . . . 1,291,205 1,173,215 1,032,782Selling, general and administrative . . . . . . . . . . . . . . . . . . . . . . . . . . . . . . 860,510 817,755 762,299Restructuring costs . . . . . . . . . . . . . . . . . . . . . . . . . . . . . . . . . . . . . . . . . . 14,071 18,741 22,116Impairment charges . . . . . . . . . . . . . . . . . . . . . . . . . . . . . . . . . . . . . . . . . . — — 12,295
Income from operations . . . . . . . . . . . . . . . . . . . . . . . . . . . . . . . . . . 462,333 396,435 345,251Interest income . . . . . . . . . . . . . . . . . . . . . . . . . . . . . . . . . . . . . . . . . . . . . (3,937) (3,067) (3,939)Interest expense . . . . . . . . . . . . . . . . . . . . . . . . . . . . . . . . . . . . . . . . . . . . . 123,508 134,371 109,065Loss on extinguishment of debt . . . . . . . . . . . . . . . . . . . . . . . . . . . . . . . . 19,831 1,275 46,377Other (income) expense, net . . . . . . . . . . . . . . . . . . . . . . . . . . . . . . . . . . . (185) (3,572) 9,073
Income before income taxes and equity in (losses) earnings ofunconsolidated affiliates . . . . . . . . . . . . . . . . . . . . . . . . . . . . . . . . 323,116 267,428 184,675
Income tax expense . . . . . . . . . . . . . . . . . . . . . . . . . . . . . . . . . . . . . . . . . . 95,965 93,364 15,105
Income before equity in (losses) earnings of unconsolidatedaffiliates . . . . . . . . . . . . . . . . . . . . . . . . . . . . . . . . . . . . . . . . . . . . . 227,151 174,064 169,570
Equity in (losses) earnings of unconsolidated affiliates . . . . . . . . . . . . . . (1,124) 2,567 70,757
Net income . . . . . . . . . . . . . . . . . . . . . . . . . . . . . . . . . . . . . . . . . . . . 226,027 176,631 240,327Net loss attributable to noncontrolling interests . . . . . . . . . . . . . . . . . . . . 564 915 1,445
Net income attributable to Quintiles Transnational Holdings Inc. . . $ 226,591 $ 177,546 $ 241,772
Earnings per share attributable to common shareholders:Basic . . . . . . . . . . . . . . . . . . . . . . . . . . . . . . . . . . . . . . . . . . . . . . . . . $ 1.83 $ 1.53 $ 2.08Diluted . . . . . . . . . . . . . . . . . . . . . . . . . . . . . . . . . . . . . . . . . . . . . . . . $ 1.77 $ 1.51 $ 2.05
Weighted average common shares outstanding:Basic . . . . . . . . . . . . . . . . . . . . . . . . . . . . . . . . . . . . . . . . . . . . . . . . . 124,147 115,710 116,232Diluted . . . . . . . . . . . . . . . . . . . . . . . . . . . . . . . . . . . . . . . . . . . . . . . . 127,862 117,796 117,936
The accompanying notes are an integral part of these consolidated financial statements.
71

QUINTILES TRANSNATIONAL HOLDINGS INC. AND SUBSIDIARIESCONSOLIDATED STATEMENTS OF COMPREHENSIVE INCOME
Year Ended December 31,
2013 2012 2011
(in thousands)
Net income . . . . . . . . . . . . . . . . . . . . . . . . . . . . . . . . . . . . . . . . . . . . . . . . . . . . . $226,027 $176,631 $240,327Unrealized gain (losses) on marketable securities, net of income taxes of
$2,016, $258 and ($37) . . . . . . . . . . . . . . . . . . . . . . . . . . . . . . . . . . . . . 3,225 400 (60)Unrealized gains (losses) on derivative instruments, net of income taxes
of ($751), ($4,392) and ($9,969) . . . . . . . . . . . . . . . . . . . . . . . . . . . . . . 358 (6,306) (16,063)Foreign currency translation, net of income taxes of ($2,465), $2,964
and ($3,851) . . . . . . . . . . . . . . . . . . . . . . . . . . . . . . . . . . . . . . . . . . . . . . (22,663) (8,983) (13,376)Defined benefit plan adjustment, net of income taxes of ($131), ($1,444)
and $27 . . . . . . . . . . . . . . . . . . . . . . . . . . . . . . . . . . . . . . . . . . . . . . . . . . 2,278 (3,172) (1,743)Reclassification adjustments:
Losses on derivative instruments included in net income, net of incometaxes of $4,991, $1,313 and $5,541 . . . . . . . . . . . . . . . . . . . . . . . . . . . . 8,089 2,188 8,354
Amortization of prior service costs and losses included in net income,net of income taxes of $389, $446 and $553 . . . . . . . . . . . . . . . . . . . . . 655 723 762
Foreign currency translation on sale of equity method investment . . . . . . — — (531)
Comprehensive income . . . . . . . . . . . . . . . . . . . . . . . . . . . . . . . . . . . 217,969 161,481 217,670Comprehensive loss attributable to noncontrolling interests . . . . . . . . . . . . . . . 551 889 1,396
Comprehensive income attributable to Quintiles TransnationalHoldings Inc. . . . . . . . . . . . . . . . . . . . . . . . . . . . . . . . . . . . . . . . . . $218,520 $162,370 $219,066
The accompanying notes are an integral part of these consolidated financial statements.
72

QUINTILES TRANSNATIONAL HOLDINGS INC. AND SUBSIDIARIESCONSOLIDATED BALANCE SHEETS
December 31,
2013 2012
(in thousands, except per share data)ASSETS
Current assets:Cash and cash equivalents . . . . . . . . . . . . . . . . . . . . . . . . . . . . . . . . . . . . . . . $ 778,143 $ 567,728Restricted cash . . . . . . . . . . . . . . . . . . . . . . . . . . . . . . . . . . . . . . . . . . . . . . . . 2,712 2,822Trade accounts receivable and unbilled services, net . . . . . . . . . . . . . . . . . . 924,205 745,373Prepaid expenses . . . . . . . . . . . . . . . . . . . . . . . . . . . . . . . . . . . . . . . . . . . . . . 42,801 33,354Deferred income taxes . . . . . . . . . . . . . . . . . . . . . . . . . . . . . . . . . . . . . . . . . . 92,115 69,038Income taxes receivable . . . . . . . . . . . . . . . . . . . . . . . . . . . . . . . . . . . . . . . . 16,171 17,597Other current assets and receivables . . . . . . . . . . . . . . . . . . . . . . . . . . . . . . . 89,541 74,082
Total current assets . . . . . . . . . . . . . . . . . . . . . . . . . . . . . . . . . . . . . . . . 1,945,688 1,509,994
Property and equipment, net . . . . . . . . . . . . . . . . . . . . . . . . . . . . . . . . . . . . . 199,578 193,999Investments in debt, equity and other securities . . . . . . . . . . . . . . . . . . . . . . 40,349 35,951Investments in and advances to unconsolidated affiliates . . . . . . . . . . . . . . . 22,927 19,148Goodwill . . . . . . . . . . . . . . . . . . . . . . . . . . . . . . . . . . . . . . . . . . . . . . . . . . . . 409,626 302,429Other identifiable intangibles, net . . . . . . . . . . . . . . . . . . . . . . . . . . . . . . . . . 298,054 272,813Deferred income taxes . . . . . . . . . . . . . . . . . . . . . . . . . . . . . . . . . . . . . . . . . . 32,864 37,313Deposits and other assets . . . . . . . . . . . . . . . . . . . . . . . . . . . . . . . . . . . . . . . . 117,711 127,506
Total assets . . . . . . . . . . . . . . . . . . . . . . . . . . . . . . . . . . . . . . . . . . . . . . $ 3,066,797 $ 2,499,153
LIABILITIES AND SHAREHOLDERS’ DEFICITCurrent liabilities:
Accounts payable . . . . . . . . . . . . . . . . . . . . . . . . . . . . . . . . . . . . . . . . . . . . . $ 100,616 $ 84,712Accrued expenses . . . . . . . . . . . . . . . . . . . . . . . . . . . . . . . . . . . . . . . . . . . . . 761,189 658,119Unearned income . . . . . . . . . . . . . . . . . . . . . . . . . . . . . . . . . . . . . . . . . . . . . . 538,585 456,587Income taxes payable . . . . . . . . . . . . . . . . . . . . . . . . . . . . . . . . . . . . . . . . . . 35,778 9,639Current portion of long-term debt and obligations held under capital
leases . . . . . . . . . . . . . . . . . . . . . . . . . . . . . . . . . . . . . . . . . . . . . . . . . . . . . 10,433 55,710Other current liabilities . . . . . . . . . . . . . . . . . . . . . . . . . . . . . . . . . . . . . . . . . 35,646 44,230
Total current liabilities . . . . . . . . . . . . . . . . . . . . . . . . . . . . . . . . . . . . . 1,482,247 1,308,997Long-term debt and obligations held under capital leases, less current
portion . . . . . . . . . . . . . . . . . . . . . . . . . . . . . . . . . . . . . . . . . . . . . . . . . . . . 2,035,586 2,366,268Deferred income taxes . . . . . . . . . . . . . . . . . . . . . . . . . . . . . . . . . . . . . . . . . . 37,541 11,616Other liabilities . . . . . . . . . . . . . . . . . . . . . . . . . . . . . . . . . . . . . . . . . . . . . . . 178,908 171,316
Total liabilities . . . . . . . . . . . . . . . . . . . . . . . . . . . . . . . . . . . . . . . . . . . . 3,734,282 3,858,197
Commitments and contingencies (Note 1)Shareholders’ deficit:
Common stock and additional paid-in capital, 300,000 and 150,000 sharesauthorized at December 31, 2013 and 2012, respectively, $0.01 parvalue, 129,652 and 115,764 shares issued and outstanding atDecember 31, 2013 and 2012, respectively . . . . . . . . . . . . . . . . . . . . . . . 478,144 4,554
Accumulated deficit . . . . . . . . . . . . . . . . . . . . . . . . . . . . . . . . . . . . . . . . . . . (1,145,181) (1,371,772)Accumulated other comprehensive (loss) income . . . . . . . . . . . . . . . . . . . . (376) 7,695
Deficit attributable to Quintiles Transnational Holdings Inc.’sshareholders . . . . . . . . . . . . . . . . . . . . . . . . . . . . . . . . . . . . . . . . . . . . (667,413) (1,359,523)
Equity attributable to noncontrolling interests . . . . . . . . . . . . . . . . . . . . . . . . . . . (72) 479
Total shareholders’ deficit . . . . . . . . . . . . . . . . . . . . . . . . . . . . . . . . . . . (667,485) (1,359,044)
Total liabilities and shareholders’ deficit . . . . . . . . . . . . . . . . . . . . . . . $ 3,066,797 $ 2,499,153
The accompanying notes are an integral part of these consolidated financial statements.
73

QUINTILES TRANSNATIONAL HOLDINGS INC. AND SUBSIDIARIESCONSOLIDATED STATEMENTS OF CASH FLOWS
Year Ended December 31,
2013 2012 2011
(in thousands)Operating activities:Net income . . . . . . . . . . . . . . . . . . . . . . . . . . . . . . . . . . . . . . . . . . . . . . $ 226,027 $ 176,631 $ 240,327Adjustments to reconcile net income to cash provided by operating
activities:Depreciation and amortization . . . . . . . . . . . . . . . . . . . . . . . . . . . 107,504 98,288 92,004Amortization of debt issuance costs and discount . . . . . . . . . . . . 21,825 9,237 30,016Share-based compensation . . . . . . . . . . . . . . . . . . . . . . . . . . . . . . 22,826 25,926 14,130Gain on disposals of property and equipment, net . . . . . . . . . . . . (1,153) (541) (1,113)Impairment of long-lived assets . . . . . . . . . . . . . . . . . . . . . . . . . . — — 12,150Loss (earnings) from unconsolidated affiliates . . . . . . . . . . . . . . . 1,004 (2,499) (70,757)(Benefit from) provision for deferred income taxes . . . . . . . . . . . (24,236) 16,595 (73,216)Excess income tax benefits on stock option exercises and
repurchases . . . . . . . . . . . . . . . . . . . . . . . . . . . . . . . . . . . . . . . . (16,204) (465) (41)Change in operating assets and liabilities:
Accounts receivable and unbilled services . . . . . . . . . . . . . . . . . . (151,681) (60,255) (115,748)Prepaid expenses and other assets . . . . . . . . . . . . . . . . . . . . . . . . . (18,759) (26,943) (21,918)Accounts payable and accrued expenses . . . . . . . . . . . . . . . . . . . . 107,047 58,345 67,382Unearned income . . . . . . . . . . . . . . . . . . . . . . . . . . . . . . . . . . . . . . 71,852 54,502 (52,425)Income taxes payable and other liabilities . . . . . . . . . . . . . . . . . . 51,318 (13,120) 40,162
Net cash provided by operating activities . . . . . . . . . . . . . . . 397,370 335,701 160,953Investing activities:
Acquisition of property, equipment and software . . . . . . . . . . . . . (92,346) (71,336) (75,679)Acquisition of businesses, net of cash acquired . . . . . . . . . . . . . . (144,970) (43,197) (227,115)Proceeds from disposition of property and equipment . . . . . . . . . 2,021 2,729 2,976Cash paid to terminate interest rate swaps . . . . . . . . . . . . . . . . . . — — (11,630)Purchase of equity securities . . . . . . . . . . . . . . . . . . . . . . . . . . . . . — (13,204) (16,054)Investments in and advances to unconsolidated affiliates, net of
payments received . . . . . . . . . . . . . . . . . . . . . . . . . . . . . . . . . . . (7,353) (3,646) (17,846)Proceeds from (payments made for) sale of investment in
unconsolidated affiliates . . . . . . . . . . . . . . . . . . . . . . . . . . . . . . 2,335 (577) 109,140Purchase of other investments . . . . . . . . . . . . . . . . . . . . . . . . . . . . — (161) (5,000)Change in restricted cash, net . . . . . . . . . . . . . . . . . . . . . . . . . . . . 78 231 19,152Other . . . . . . . . . . . . . . . . . . . . . . . . . . . . . . . . . . . . . . . . . . . . . . . 60 (3,072) (2,782)
Net cash used in investing activities . . . . . . . . . . . . . . . . . . . (240,175) (132,233) (224,838)Financing activities:
Proceeds from issuance of debt . . . . . . . . . . . . . . . . . . . . . . . . . . . 2,060,755 2,441,017 1,980,000Payment of debt issuance costs . . . . . . . . . . . . . . . . . . . . . . . . . . . (2,607) (9,728) (18,393)Repayment of debt . . . . . . . . . . . . . . . . . . . . . . . . . . . . . . . . . . . . (2,444,600) (1,995,472) (1,712,673)Principal payments on capital lease obligations . . . . . . . . . . . . . . (3,812) (5,407) (7,206)Issuance of common stock . . . . . . . . . . . . . . . . . . . . . . . . . . . . . . 525,000 3,116 —Payment of common stock issuance costs . . . . . . . . . . . . . . . . . . (35,439) — —Exercise of stock options . . . . . . . . . . . . . . . . . . . . . . . . . . . . . . . 12,539 350 1,114Repurchase of common stock . . . . . . . . . . . . . . . . . . . . . . . . . . . . (6,434) (13,363) (14,324)Repurchase of stock options . . . . . . . . . . . . . . . . . . . . . . . . . . . . . (50,649) — —Excess income tax benefits on stock option exercises and
repurchases . . . . . . . . . . . . . . . . . . . . . . . . . . . . . . . . . . . . . . . . 16,204 465 41Investment by noncontrolling interest, net . . . . . . . . . . . . . . . . . . — — 454Dividends paid to common shareholders . . . . . . . . . . . . . . . . . . . — (567,851) (288,322)
Net cash provided by (used in) financing activities . . . . . . . 70,957 (146,873) (59,309)Effect of foreign currency exchange rate changes on cash . . . . . . . . . . (17,737) (5,166) (7,122)Increase (decrease) in cash and cash equivalents . . . . . . . . . . . . . . . . . 210,415 51,429 (130,316)Cash and cash equivalents at beginning of period . . . . . . . . . . . . . . . . 567,728 516,299 646,615Cash and cash equivalents at end of period . . . . . . . . . . . . . . . . . . . . . $ 778,143 $ 567,728 $ 516,299
The accompanying notes are an integral part of these consolidated financial statements.
74

QUINTILES TRANSNATIONAL HOLDINGS INC. AND SUBSIDIARIESCONSOLIDATED STATEMENTS OF SHAREHOLDERS’ DEFICIT
(AccumulatedDeficit)
AccumulatedOther
Comprehensive(Loss) Income
CommonStock
AdditionalPaid-InCapital
NoncontrollingInterests Total
(in thousands, except share data)Balance, December 31, 2010 (116,399,585 shares) . . . . $ (948,830) $ 45,577 $1,164 $ — $ 1,730 $ (900,359)Issuance of common stock (93,322 shares) . . . . . . . . . . . — — 1 1,113 — 1,114Repurchase of common stock (526,766 shares) . . . . . . . (1,539) — (5) (12,780) — (14,324)Share-based compensation . . . . . . . . . . . . . . . . . . . . . . . — — — 14,130 — 14,130Income tax benefit on stock option exercises . . . . . . . . . — — — 41 — 41Cash dividends paid to common shareholders . . . . . . . . (285,818) — — (2,504) — (288,322)Investment by noncontrolling interest . . . . . . . . . . . . . . . — — — — 454 454Net income . . . . . . . . . . . . . . . . . . . . . . . . . . . . . . . . . . . . 241,772 — — — (1,445) 240,327Unrealized loss on marketable securities, net of tax . . . . — (60) — — — (60)Unrealized loss on derivative instruments, net of tax . . . — (16,063) — — — (16,063)Reclassification adjustments, net of tax . . . . . . . . . . . . . — 8,585 — — — 8,585Defined benefit plan adjustment, net of tax . . . . . . . . . . . — (1,743) — — — (1,743)Foreign currency translation, net of tax . . . . . . . . . . . . . . — (13,425) — — 49 (13,376)
Balance, December 31, 2011 (115,966,141 shares) . . . . (994,415) 22,871 1,160 — 788 (969,596)Issuance of common stock (306,025 shares) . . . . . . . . . . — — 3 3,463 — 3,466Repurchase of common stock (508,656 shares) . . . . . . . — — (5) (13,358) — (13,363)Share-based compensation . . . . . . . . . . . . . . . . . . . . . . . — — — 25,774 — 25,774Income tax benefit on stock option exercises . . . . . . . . . — — — 465 — 465Cash dividends paid to common shareholders . . . . . . . . (554,903) — — (12,948) — (567,851)Investment by noncontrolling interest . . . . . . . . . . . . . . . — — — — 580 580Net income . . . . . . . . . . . . . . . . . . . . . . . . . . . . . . . . . . . . 177,546 — — — (915) 176,631Unrealized gain on marketable securities, net of tax . . . . — 400 — — — 400Unrealized loss on derivative instruments, net of tax . . . — (6,306) — — — (6,306)Reclassification adjustments, net of tax . . . . . . . . . . . . . — 2,911 — — — 2,911Defined benefit plan adjustment, net of tax . . . . . . . . . . . — (3,172) — — — (3,172)Foreign currency translation, net of tax . . . . . . . . . . . . . . — (9,009) — — 26 (8,983)
Balance, December 31, 2012 (115,763,510 shares) . . . . (1,371,772) 7,695 1,158 3,396 479 (1,359,044)Issuance of common stock (14,041,620 shares) . . . . . . . — — 141 537,398 — 537,539Stock issuance costs . . . . . . . . . . . . . . . . . . . . . . . . . . . . — — — (35,439) — (35,439)Repurchase of common stock (153,223 shares) . . . . . . . — — (2) (6,432) — (6,434)Repurchase of stock options . . . . . . . . . . . . . . . . . . . . . . — — — (59,064) — (59,064)Share-based compensation . . . . . . . . . . . . . . . . . . . . . . . — — — 20,784 — 20,784Income tax benefit on stock option exercises and
repurchases . . . . . . . . . . . . . . . . . . . . . . . . . . . . . . . . . — — — 16,204 — 16,204Net income . . . . . . . . . . . . . . . . . . . . . . . . . . . . . . . . . . . . 226,591 — — — (564) 226,027Unrealized gain on marketable securities, net of tax . . . . — 3,225 — — — 3,225Unrealized gain on derivative instruments, net of tax . . . — 358 — — — 358Reclassification adjustments, net of tax . . . . . . . . . . . . . — 8,744 — — — 8,744Defined benefit plan adjustment, net of tax . . . . . . . . . . . — 2,278 — — — 2,278Foreign currency translation, net of tax . . . . . . . . . . . . . . — (22,676) — — 13 (22,663)
Balance, December 31, 2013 (129,651,907 shares) . . . . $(1,145,181) $ (376) $1,297 $476,847 $ (72) $ (667,485)
The accompanying notes are an integral part of these consolidated financial statements.
75

QUINTILES TRANSNATIONAL HOLDINGS INC. AND SUBSIDIARIESNotes to Consolidated Financial Statements
1. Summary of Significant Accounting Policies
The Company
Conducting business in approximately 100 countries with approximately 28,200 employees, QuintilesTransnational Holdings Inc. (the “Company”) is a provider of pharmaceutical development services andcommercial outsourcing services that helps its biopharmaceutical customers, as well as customers in the largerhealthcare industry, to make decisions regarding drug development, commercialization and drug therapy choices.The Company also offers a number of services designed to address the outcomes and analytical needs of thebroader healthcare industry.
Initial Public Offering
On May 9, 2013, the Company’s common stock began trading on the New York Stock Exchange (“NYSE”)under the symbol “Q”. On May 14, 2013, the Company completed its initial public offering (“IPO”) of itscommon stock at a price to the public of $40.00 per share. The Company issued and sold 13,125,000 shares ofcommon stock in the IPO. The selling shareholders offered and sold 14,111,841 shares of common stock in theIPO, including 3,552,631 shares that were offered and sold by the selling shareholders pursuant to the fullexercise of the underwriters’ option to purchase additional shares. The IPO raised proceeds to the Company ofapproximately $489.6 million, after deducting underwriting discounts, commissions and related expenses. TheCompany did not receive any of the proceeds from the sale of the shares sold by the selling shareholders.
Reclassifications
Certain prior period amounts have been reclassified to conform to the current period presentation. Thesechanges had no effect on previously reported total revenues, net income, comprehensive income, shareholders’deficit or cash flows.
Principles of Consolidation
The accompanying consolidated financial statements include the accounts and operations of the Companyand its subsidiaries. Amounts pertaining to the noncontrolling ownership interests held in third parties in theoperating results and financial position of the Company’s majority-owned subsidiaries are reported asnoncontrolling interests. Intercompany accounts and transactions have been eliminated in consolidation.
Use of Estimates
The preparation of financial statements in accordance with generally accepted accounting principles in theUnited States of America (“GAAP”) requires management to make estimates and assumptions that affect thereported amounts of assets and liabilities, and the disclosure of contingent assets and liabilities, at the date of thefinancial statements, as well as the reported amounts of revenues and expenses during the period. These estimatesare based on historical experience and various other assumptions believed reasonable under the circumstances.The Company evaluates its estimates on an ongoing basis and makes changes to the estimates and relateddisclosures as experience develops or new information becomes known. Actual results may differ from thoseestimates.
Foreign Currencies
The Company’s financial statements are reported in United States dollars and, accordingly, fluctuations inexchange rates will affect the translation of its revenues and expenses denominated in foreign currencies into
76

United States dollars for purposes of reporting its consolidated financial results. Assets and liabilities recorded inforeign currencies on the books of foreign subsidiaries are translated at the exchange rate on the balance sheetdate. Revenues, costs and expenses are translated at average rates of exchange during the year. Translationadjustments resulting from this process are charged or credited to the accumulated other comprehensive incomecomponent of shareholders’ deficit. The Company is subject to foreign currency transaction risk for fluctuationsin exchange rates during the period of time between the consummation and cash settlement of a transaction. TheCompany earns revenue from its service contracts over a period of several months and, in some cases, over aperiod of several years. Accordingly, exchange rate fluctuations during this period may affect the Company’sprofitability with respect to such contracts. Foreign currency transactions of approximately $4.0 million loss,$1.1 million loss and $1.9 million gain are included in other (income) expense, net in 2013, 2012 and 2011,respectively.
Cash Equivalents, Restricted Cash and Investments
The Company considers all highly liquid investments with an initial maturity of three months or less whenpurchased to be cash equivalents. The Company’s restricted cash primarily consisted of amounts collateralizingstandby letters of credit issued in favor of certain suppliers and health insurance funds. Investments in marketableequity securities are classified as available-for-sale and measured at fair market value with net unrealized gainsand losses recorded in the accumulated other comprehensive income component of shareholders’ deficit untilrealized. The fair market value is based on the closing price as quoted by the respective stock exchange. Inaddition, the Company has investments in equity securities of companies for which there are not readily availablemarket values and for which the Company does not exercise significant influence or control; such investmentsare accounted for using the cost method. Any gains or losses from the sales of investments or other-than-temporary declines in fair value are computed by specific identification.
Equity Method Investments
The Company’s investments in and advances to unconsolidated affiliates are accounted for under the equitymethod if the Company exercises significant influence or has an investment in a limited partnership that isconsidered to be greater than minor. These investments and advances are classified as investments in andadvances to unconsolidated affiliates on the accompanying consolidated balance sheets. The Company records itspro rata share of the earnings, adjusted for accretion of basis difference, of these investments in equity inearnings of unconsolidated affiliates on the accompanying consolidated statements of income. Accretionrecognized in 2013, 2012 and 2011 was approximately $100,000, $183,000 and $1.0 million, respectively. TheCompany reviews its investments in and advances to unconsolidated affiliates for impairment whenever events orchanges in circumstances indicate that the carrying amounts may not be recoverable.
Derivatives
The Company uses derivative instruments to manage exposures to interest rates and foreign currencies. TheCompany also holds freestanding warrants. Derivatives are recorded on the balance sheet at fair value at eachbalance sheet date utilizing pricing models for non-exchange-traded contracts. At inception, the Companydesignates whether or not the derivative instrument is an effective hedge of an asset, liability or firm commitmentwhich is then classified as either a cash flow hedge or a fair value hedge. If determined to be an effective cashflow hedge, changes in the fair value of the derivative instrument are recorded as a component of accumulatedother comprehensive income until realized. We include the impact from these hedges in the same line item as thehedged item on the consolidated statements of cash flows. Changes in fair value of effective fair value hedges arerecorded in earnings as an offset to the changes in the fair value of the related hedged item. Hedgeineffectiveness, if any, is immediately recognized in earnings. Changes in the fair values of derivativeinstruments that are not an effective hedge are recognized in earnings. The Company has entered, and may in thefuture enter, into derivative contracts (swaps, forwards, calls or puts, warrants, for example) related to its debt,investments in marketable equity securities and forecasted foreign currency transactions.
77

Billed and Unbilled Services and Unearned Income
In general, prerequisites for billings and payments are established by contractual provisions includingpredetermined payment schedules, which may or may not correspond to the timing of the performance ofservices under the contract. Unbilled services arise when services have been rendered for which revenue has beenrecognized but the customers have not been billed.
In some cases, payments received are in excess of revenue recognized. Payments received in advance ofservices being provided are deferred as unearned income on the consolidated balance sheet. As the contractedservices are subsequently performed and the associated revenue is recognized, the unearned income balance isreduced by the amount of the revenue recognized during the period.
Allowance for Doubtful Accounts
The Company’s allowance for doubtful accounts is determined based on a variety of factors that affect thepotential collectability of the related receivables, including length of time the receivables are past due, customercredit ratings, financial stability of the customer, specific one-time events and past customer history. In addition,in circumstances where the Company is made aware of a specific customer’s inability to meet its financialobligations, a specific allowance is established. The accounts are individually evaluated on a regular basis andappropriate reserves are established as deemed appropriate based on the above criteria.
Business Combinations
Business combinations are accounted for using the acquisition method, and accordingly, the identifiableassets acquired, the liabilities assumed, and any noncontrolling interest in the acquiree are recorded at theirestimated fair values on the date of the acquisition. Goodwill represents the excess of the purchase price over theestimated fair value of the net assets acquired, including the amount assigned to identifiable intangible assets.When a business combination involves contingent consideration, the Company recognizes a liability equal to theestimated fair value of the contingent consideration obligation at the date of the acquisition. Subsequent changesin the estimated fair value of the contingent consideration are recognized in earnings in the period of the change.
Long-Lived Assets
Property and equipment are stated at cost and are depreciated using the straight-line method over the shorterof the asset’s estimated useful life or the lease term, if related to leased property, as follows:
Buildings and leasehold improvements . . . . . . . . . . . . . . . 3 - 40 yearsEquipment . . . . . . . . . . . . . . . . . . . . . . . . . . . . . . . . . . . . . . 3 - 10 yearsFurniture and fixtures . . . . . . . . . . . . . . . . . . . . . . . . . . . . . 5 - 10 yearsMotor vehicles . . . . . . . . . . . . . . . . . . . . . . . . . . . . . . . . . . 3 - 5 years
Definite-lived identifiable intangible assets are amortized primarily using an accelerated method thatreflects the pattern in which the Company expects to benefit from the use of the asset over its estimatedremaining useful life as follows:
Trademarks and trade names . . . . . . . . . . . . . . . . . . . . . . . 1 - 8 yearsProduct licensing and distribution rights . . . . . . . . . . . . . . 1 - 7 yearsNon-compete agreements . . . . . . . . . . . . . . . . . . . . . . . . . . 2 - 4 yearsContract backlog and customer relationships . . . . . . . . . . . 1 - 12 yearsSoftware and related assets . . . . . . . . . . . . . . . . . . . . . . . . . 3 - 5 years
Goodwill and indefinite-lived identifiable intangible assets, which consist of certain trade names, are notamortized but evaluated for impairment annually, or more frequently if events or changes in circumstancesindicate an impairment.
78

Included in software and related items is the capitalized cost of internal-use software used in supporting theCompany’s business. Qualifying costs incurred during the application development stage are capitalized andamortized over their estimated useful lives. The Company recognized $32.2 million, $27.4 million and $19.9million of amortization expense in 2013, 2012 and 2011, respectively, related to software and related assets.
The carrying values of property, equipment and intangible and other long-lived assets are reviewed forrecoverability if the facts and circumstances suggest that a potential impairment may have occurred. If thisreview indicates that carrying values will not be recoverable, as determined based on undiscounted cash flowprojections, the Company will record an impairment charge to reduce carrying values to estimated fair value.There were no events, facts or circumstances in 2013 and 2012 that resulted in any impairment charges to theCompany’s property, equipment, intangible or other long-lived assets. In 2011, the Company recognized a $12.2million impairment charge related to long-lived assets in its early clinical development service offerings.
Revenue Recognition
The Company recognizes revenue when all of the following conditions are satisfied: (1) there is persuasiveevidence of an arrangement; (2) the service offering has been delivered to the customer; (3) the collection of thefees is probable; and (4) the arrangement consideration is fixed or determinable. The Company’s arrangementsare primarily service contracts that range in duration from a few months to several years. Most contracts may beterminated upon 30 to 90 days notice by the customer, however, in the event of termination, contract provisionstypically require payment for services rendered through the date of termination, as well as for subsequentservices rendered to close out the contract.
In some cases, contracts provide for consideration that is contingent upon the occurrence of uncertain futureevents. The Company recognizes contingent revenue when the contingency has been resolved and all othercriteria for revenue recognition have been met. The Company treats cash payments to customers as incentives toinduce the customers to enter into such a service agreement with the Company. The related asset is amortized asa reduction of revenue over the period the services are performed. The Company records revenues net of any taxassessments by governmental authorities, such as value added taxes, that are imposed on and concurrent withspecific revenue generating transactions. The Company does not recognize revenue with respect to start-upactivities including contract and scope negotiation, feasibility analysis and conflict of interest review associatedwith contracts. The costs for these activities are expensed as incurred.
For the arrangements that include multiple elements, arrangement consideration is allocated to units ofaccounting based on the relative selling price. The best evidence of selling price of a unit of accounting isvendor-specific objective evidence (“VSOE”), which is the price the Company charges when the deliverable issold separately. When VSOE is not available to determine selling price, management uses relevant third-partyevidence (“TPE”) of selling price, if available. When neither VSOE nor TPE of selling price exists, managementuses its best estimate of selling price considering all relevant information that is available without undue cost andeffort.
The majority of the Company’s contracts within the Product Development segment are service contracts forclinical research that represent a single unit of accounting. The Company recognizes revenue on its clinicalresearch services contracts as services are performed primarily on a proportional-performance basis, generallyusing output measures that are specific to the service provided. Examples of output measures include amongothers, number of investigators enrolled, number of site initiation visits and number of monitoring visitscompleted. Revenue is determined by dividing the actual units of work completed by the total units of workrequired under the contract and multiplying that ratio by the total contract value. The total contract value, or totalcontractual payments, represents the aggregate contracted price for each of the agreed upon services to beprovided. Changes in the scope of work are common, especially under long-term contracts, and generally resultin a change in contract value. Once the customer has agreed to the changes in scope and renegotiated pricing
79

terms, the contract value is amended and revenue is recognized, as described above. To the extent that contractsinvolve multiple elements, the Company follows the allocation methodology described above and recognizesrevenue for each unit of accounting on a proportional performance basis.
The Company derives the majority of its revenues in its Integrated Healthcare Services segment fromproviding commercialization services on a fee-for-service basis to customers within the biopharmaceuticalindustry. Fees on these arrangements are billed based on a contractual per-diem or hourly rate basis. TheCompany recognizes revenue on commercialization services contracts primarily on a time and materials basis.Some of the Company’s commercialization contracts are multiple element arrangements, with elements includingrecruiting, training and deployment of sales representatives. The nature of the terms of these multiple elementarrangements will vary based on the customized needs of the Company’s customers. For contracts that havemultiple elements, the Company follows the allocation methodology described above and recognizes revenue foreach unit of accounting on a time and materials basis. The Company’s commercialization contracts sometimesinclude variable fees that are based on a percentage of product sales (royalty payments). The Companyrecognizes revenue on royalty payments when the variable components become fixed or determinable and allother revenue recognition criteria have been met, which generally only occurs upon the sale of the underlyingproduct(s) and upon the Company’s receipt of information necessary to make a reasonable estimate.
Reimbursed Expenses
The Company includes reimbursed expenses in total revenues and costs of revenue as the Company isdeemed to be the primary obligor in the applicable arrangements. These costs include such items as payments toinvestigators and travel expenses for the Company’s clinical monitors and sales representatives.
Expenses
Costs of revenue include reimbursed expenses, compensation and benefits for billable employees,depreciation of assets used in generating revenue and other expenses directly related to service contracts such ascourier fees and laboratory supplies for the Company’s laboratory services, professional services and travelexpenses. Selling, general and administrative expenses primarily include costs related to administrative functionssuch as compensation and benefits, travel, professional services, training and expenses for advertising,information technology, facilities and depreciation and amortization.
Concentration of Credit Risk
Financial instruments that subject the Company to credit risk primarily consist of cash and cash equivalents,marketable securities and accounts receivable. The Company maintains its cash and cash equivalent balanceswith high-quality financial institutions and, consequently, the Company believes that such funds are subject tominimal credit risk. Investment policies have been implemented that limit purchases of marketable securities toinvestment grade securities. Substantially all service revenues for Product Development and IntegratedHealthcare Services are earned by performing services under contracts with various pharmaceutical,biotechnology, medical device and healthcare companies. The concentration of credit risk is equal to theoutstanding accounts receivable and unbilled services balances, less the unearned income related thereto, andsuch risk is subject to the financial and industry conditions of the Company’s customers. The Company does notrequire collateral or other securities to support customer receivables. Credit losses have been immaterial andreasonably within management’s expectations. No customer accounted for 10.0% or more of consolidated servicerevenues in 2013, 2012 or 2011.
80

Research and Development Costs
Research and development costs consist primarily of employee compensation and related expenses andinformation technology contract services. The following is a summary of the research and development expenses(in thousands):
Year Ended December 31,
2013 2012 2011
Internally developed software applications and computer technology . . . . . . . . . . . . $3,955 $ 9,907 $9,447Funding of customer’s research and development activity . . . . . . . . . . . . . . . . . . . . . 1,000 — —Collaboration agreement with HUYA . . . . . . . . . . . . . . . . . . . . . . . . . . . . . . . . . . . . . — 519 539
$4,955 $10,426 $9,986
In January 2010, the Company entered into a collaboration agreement with a related party, HUYABioscience International, LLC (“HUYA”), to fund up to $2.3 million of its research and development activity fora specific compound. The funding consisted of $1.0 million in cash which was paid and expensed in 2010 and$1.3 million of services provided by the Company, which have been fully provided. In return for the $2.3 millionin funding, the Company has the potential to receive additional consideration which contractually may notexceed $16.5 million excluding interest if certain events were to occur.
Advertising Costs
Advertising costs, which include the development and production of advertising materials and thecommunication of these materials, are charged to expense as incurred. The Company incurred approximately$14.8 million, $14.5 million and $13.2 million in advertising expense in 2013, 2012 and 2011, respectively.
Restructuring Costs
Restructuring costs, which primarily include termination benefits and facility closure costs, are recorded atestimated fair value. Key assumptions in determining the restructuring costs include the terms and payments thatmay be negotiated to terminate certain contractual obligations and the timing of employees leaving the Company.
Contingencies
The Company records accruals for claims, suits, investigations and proceedings when it is probable that aliability has been incurred and the amount of the loss can be reasonably estimated. The Company reviews claims,suits, investigations and proceedings at least quarterly and records or adjusts accruals related to such matters toreflect the impact and status of any settlements, rulings, advice of counsel or other information pertinent to aparticular matter. Legal costs associated with contingencies are charged to expense as incurred.
The Company is party to legal proceedings incidental to its business. While the outcome of these matterscould differ from management’s expectations, the Company does not believe the resolution of these matters has areasonable possibility of having a material adverse effect to the Company’s financial statements.
Income Taxes
Income tax expense includes United States federal, state and international income taxes. Certain items ofincome and expense are not reported in income tax returns and financial statements in the same year. The incometax effects of these differences are reported as deferred income taxes. Valuation allowances are provided toreduce the related deferred income tax assets to an amount which will, more likely than not, be realized.Beginning in 2013, the undistributed earnings of most of the Company’s foreign subsidiaries are considered to beindefinitely reinvested outside of the United States. Accordingly, a deferred income tax liability has not been
81

provided related to those undistributed earnings. Interest and penalties related to unrecognized income taxbenefits are recognized as a component of income tax expense as discussed further in Note 17.
Employee Stock Compensation
The Company accounts for share-based compensation for stock options and stock appreciation rights(“SARs”) under the fair value method and uses the Black-Scholes-Merton model to estimate the value of suchshare-based awards granted to its employees and non-executive directors using the assumptions noted in thefollowing table. Expected volatility is based upon the historical volatility of a peer group for a period equal to theexpected term, as the Company does not have adequate history to calculate its own volatility and believes theexpected volatility will approximate the historical volatility of the peer group. Prior to the IPO, the expecteddividends were based on the historical dividends paid by the Company, excluding dividends that resulted fromactivities that the Company deemed to be one-time in nature. Following the IPO, the Company does not currentlyanticipate paying dividends. The expected term represents the period of time the grants are expected to beoutstanding. The risk-free interest rate is based on the United States Treasury yield curve in effect at the time ofthe grant.
Year Ended December 31,
2013 2012 2011
Expected volatility . . . . . . . . . . . . . . . . . . . . . . . . . . . . . . . . . . . . . . . . . . 18 – 47% 33 – 53% 40 – 53%Weighted average expected volatility . . . . . . . . . . . . . . . . . . . . . . . . . . . 40% 40% 42%Expected dividends . . . . . . . . . . . . . . . . . . . . . . . . . . . . . . . . . . . . . . . . . 0.0 – 5.45% 4.82% 4.10%Expected term (in years) . . . . . . . . . . . . . . . . . . . . . . . . . . . . . . . . . . . . . 0.25 – 6.4 2.0 – 7.0 2.7 – 6.7Risk-free interest rate . . . . . . . . . . . . . . . . . . . . . . . . . . . . . . . . . . . . . . . 0.04 – 2.24% 0.29 – 1.31% 0.30 – 2.995%
The Company accounts for its share-based compensation for restricted stock units (“RSUs”) based on theclosing market price of the Company’s common stock on the date of grant.
The Company recognized share-based compensation expense as follows (in thousands):
Year Ended December 31,
2013 2012 2011
Share-based compensation expense . . . . . . . . . . . . . . . . . . . . . . . . . . . . $22,826 $25,926 $14,130
Share-based compensation expense is included in selling, general and administrative expenses on theaccompanying consolidated statements of income based upon the classification of the employees who weregranted the share-based awards. The associated future income tax benefit recognized was $8.1 million, $6.9million and $4.2 million in 2013, 2012 and 2011, respectively. As of December 31, 2013, there wasapproximately $36.6 million of total unrecognized share-based compensation expense related to outstanding non-vested share-based compensation arrangements, which the Company expects to recognize over a weightedaverage period of 1.75 years.
Earnings Per Share
The calculation of earnings per share is based on the weighted average number of common shares orcommon stock equivalents outstanding during the applicable period. The dilutive effect of common stockequivalents is excluded from basic earnings per share and is included in the calculation of diluted earnings pershare. Potentially dilutive securities include outstanding stock options, shares to be purchased under theCompany’s employee stock purchase plan (see Note 18) and unvested RSUs.
82

2. Accounts Receivable and Unbilled Services
Accounts receivable and unbilled services consist of the following (in thousands):
December 31,
2013 2012
Trade:Billed . . . . . . . . . . . . . . . . . . . . . . . . . . . . . . . . . . . . . . . . . . . . . . . . . . . . . . . . . . . . . . . $408,959 $346,732Unbilled services . . . . . . . . . . . . . . . . . . . . . . . . . . . . . . . . . . . . . . . . . . . . . . . . . . . . . . 516,942 400,610
925,901 747,342Allowance for doubtful accounts . . . . . . . . . . . . . . . . . . . . . . . . . . . . . . . . . . . . . . . . . . . . . (1,696) (1,969)
$924,205 $745,373
Substantially all of the Company’s trade accounts receivable and unbilled services are due from companiesin the pharmaceutical, biotechnology, medical device and healthcare industries and are a result of contractresearch, sales, marketing, healthcare consulting and health information management services provided by theCompany on a global basis. The percentage of accounts receivable and unbilled services by region is as follows:
December 31,
2013 2012
Americas:United States . . . . . . . . . . . . . . . . . . . . . . . . . . . . . . . . . . . . . . . . . . . . . . . . . . . . . . . . 53% 51%Other . . . . . . . . . . . . . . . . . . . . . . . . . . . . . . . . . . . . . . . . . . . . . . . . . . . . . . . . . . . . . . 2 2
Americas . . . . . . . . . . . . . . . . . . . . . . . . . . . . . . . . . . . . . . . . . . . . . . . . . . . . . . . 55 53Europe and Africa:
United Kingdom . . . . . . . . . . . . . . . . . . . . . . . . . . . . . . . . . . . . . . . . . . . . . . . . . . . . . 25 26Other . . . . . . . . . . . . . . . . . . . . . . . . . . . . . . . . . . . . . . . . . . . . . . . . . . . . . . . . . . . . . . 12 12
Europe and Africa . . . . . . . . . . . . . . . . . . . . . . . . . . . . . . . . . . . . . . . . . . . . . . . . 37 38Asia-Pacific:
Japan . . . . . . . . . . . . . . . . . . . . . . . . . . . . . . . . . . . . . . . . . . . . . . . . . . . . . . . . . . . . . . 4 5Other . . . . . . . . . . . . . . . . . . . . . . . . . . . . . . . . . . . . . . . . . . . . . . . . . . . . . . . . . . . . . . 4 4
Asia-Pacific . . . . . . . . . . . . . . . . . . . . . . . . . . . . . . . . . . . . . . . . . . . . . . . . . . . . . 8 9
100% 100%
3. Investments—Debt, Equity and Other Securities
The following is a summary of the Company’s debt, equity and other securities (in thousands):
December 31,
2013 2012
Marketable securities . . . . . . . . . . . . . . . . . . . . . . . . . . . . . . . . . . . . . . . . . . . . . . . . . . . . $ 7,668 $ 2,427Cost method . . . . . . . . . . . . . . . . . . . . . . . . . . . . . . . . . . . . . . . . . . . . . . . . . . . . . . . . . . . . 32,681 33,524
$ 40,349 $ 35,951
83

Investments in Marketable Securities:
The following is a summary of available-for-sale securities (in thousands):
December 31, 2013 December 31, 2012
Available-for-Sale Securities Amortized Cost
GrossUnrealized
Gains Market Value Amortized Cost
GrossUnrealized
Gains Market Value
Marketable equity . . . . . . . . $1,960 $5,708 $7,668 $1,960 $467 $2,427
The Company did not recognize any gains or losses from the sale of marketable equity securities in 2013,2012 and 2011.
The net after-tax adjustment to unrealized holding gains (losses) on available-for-sale securities included inthe accumulated other comprehensive income component of shareholders’ deficit was $3.5 million, $284,000 and($117,000) in 2013, 2012 and 2011, respectively.
The Company’s policy is to continually review declines in fair value of marketable equity securities fordeclines that may be other than temporary. As part of this review, the Company considers the financialstatements of the investee, analysts’ reports, duration of the decline in fair value and general market factors. TheCompany did not recognize any such losses in 2013, 2012 and 2011. No securities were in an unrealized lossposition as of December 31, 2013.
Investments—Cost Method
The Company has investments in equity securities of companies for which there are not readily availablemarket values and for which the Company does not exercise significant influence or control. These investmentsare accounted for using the cost method. Below is a summary of the Company’s portfolio of cost methodinvestments (in thousands):
December 31,
2013 2012
Venture capital funds . . . . . . . . . . . . . . . . . . . . . . . . . . . . . . . . . . . . . . . . . . . . . . . . . . . . . . . . $ — $ 64Equity investments . . . . . . . . . . . . . . . . . . . . . . . . . . . . . . . . . . . . . . . . . . . . . . . . . . . . . . . . . . 32,516 33,298Convertible note . . . . . . . . . . . . . . . . . . . . . . . . . . . . . . . . . . . . . . . . . . . . . . . . . . . . . . . . . . . . 165 162
$32,681 $33,524
On February 25, 2011, the Company and the Samsung Group entered into an agreement to form a jointventure intended to provide biopharmaceutical contract manufacturing services in South Korea. The Companycommitted to invest up to $30.0 million for a noncontrolling interest and has funded all of this commitment. Asof December 31, 2013 and 2012, the Company has a 5.1% and 10.0%, respectively, ownership interest in thejoint venture.
In December 2011, the Company and Intarcia Therapeutics (“Intarcia”) entered into an alliance to develop anew therapy for type 2 diabetes whereby Intarcia will use the Company to conduct Phase III pivotal trials and acardiovascular outcomes trial. Under the alliance, the Company provided Intarcia a customer incentive of $12.5million and acquired $5.0 million of preferred stock of Intarcia. The customer incentive is being amortized inproportion to the revenues earned as a reduction of revenue recorded under the service arrangements. As ofDecember 31, 2013 and 2012, the customer incentive of $10.7 million and $11.9 million, respectively, wasrecorded in deposits and other assets on the accompanying consolidated balance sheets. The $5.0 millioninvestment in preferred stock of Intarcia is recorded in “investments—debt, equity and other securities” on theaccompanying consolidated balance sheets.
84

The Company reviews the carrying value of each individual investment at each balance sheet date todetermine whether or not an other-than-temporary decline in fair value has occurred. The Company employsalternative valuation techniques including the following: (i) the review of financial statements includingassessments of liquidity, (ii) the review of valuations available to the Company prepared by independent thirdparties used in raising capital, (iii) the review of publicly available information including press releases and(iv) direct communications with the investee’s management, as appropriate. If the review indicates that such adecline in fair value has occurred, the Company adjusts the carrying value to the estimated fair value of theinvestment and recognizes a loss for the amount of the adjustment. The Company recognized $145,000 of lossesdue to such impairments in 2011 relating to a non-marketable equity security. This loss was primarily due to thedeclining financial condition of the investee that was deemed by management to be other than temporary.
4. Investments in and Advances to Unconsolidated Affiliates
The Company accounts for its investments in and advances to unconsolidated affiliates under the equitymethod of accounting and records its pro rata share of its losses or earnings from these investments in equity in(losses) earnings of unconsolidated affiliates. The following is a summary of the Company’s investments in andadvances to unconsolidated affiliates (in thousands):
December 31,
2013 2012
NovaQuest Pharma Opportunities Fund III, L.P. (the “Fund”) . . . . . . . . . . . . . . . . . . . . . . . . . . $11,792 $10,617Oxford Cancer Biomarkers . . . . . . . . . . . . . . . . . . . . . . . . . . . . . . . . . . . . . . . . . . . . . . . . . . . . . . 4,141 4,497Cenduit™ . . . . . . . . . . . . . . . . . . . . . . . . . . . . . . . . . . . . . . . . . . . . . . . . . . . . . . . . . . . . . . . . . . . 6,431 3,479Other . . . . . . . . . . . . . . . . . . . . . . . . . . . . . . . . . . . . . . . . . . . . . . . . . . . . . . . . . . . . . . . . . . . . . . . 563 555
$22,927 $19,148
NovaQuest Pharma Opportunities Fund III, L.P.
In November 2010, the Company committed to invest up to $60 million as a limited partner in a privateequity fund (“the Fund”). In November 2013, the Company sold $10.0 million of its commitment, thus, reducingits total commitment to $50.0 million. The Company had funded approximately $2.9 million of this commitmentwhich had a carrying value of approximately $2.2 million. The Company received approximately $2.3 million forthe funded portion of the commitment it sold. As of December 31, 2013, the Company has approximately $34.2million of remaining funding commitments to the Fund. As of December 31, 2013 and 2012, the Company has a10.9% and 13.9%, respectively, ownership interest in the Fund.
Oxford Cancer Biomarkers
In January 2012, the Company invested approximately $4.7 million in Oxford Cancer Biomarkers. TheCompany has a 30.0% ownership interest in Oxford Cancer Biomarkers.
Cenduit™
In May 2007, the Company and Thermo Fisher Scientific Inc. (“Thermo Fisher”) completed the formationof a joint venture, Cenduit™. The Company contributed its Interactive Response Technology operations in Indiaand the United States. Thermo Fisher contributed its Fisher Clinical Services Interactive Response Technologyoperations in three locations—the United Kingdom, the United States and Switzerland. Additionally, eachcompany contributed $3.5 million in initial capital. The Company and Thermo Fisher each own 50% ofCenduit™.
85

HUYA
In May 2009, the Company acquired a 10% interest in HUYA for $5.0 million. On November 29, 2011, theCompany sold its investment in HUYA to PharmaBio for approximately $5.0 million and recorded a gain on thesale of approximately $949,000, which is included in equity in earnings from unconsolidated affiliates on theaccompanying consolidated statement of income.
Invida Pharmaceutical Holdings Pte. Ltd.
In April 2006, the Company, TLS Beta Pte. Ltd. (“TLS”), a Singapore company and an indirect whollyowned subsidiary of Temasek Holdings (Private) Limited (“Temasek Holdings”) and PharmaCo Investments Ltd(“PharmaCo,” and together with the Company and TLS, the “JV Partners”), a company incorporated in Labuan,Malaysia and an indirect wholly owned subsidiary of Interpharma Asia Pacific, completed the formation of ajoint venture to commercialize biopharmaceutical products in the Asia-Pacific region (the “Joint Venture”).Temasek Holdings is a beneficial owner of more than 5% of the Company’s common stock. The JV Partnersconduct the Joint Venture through Invida. As part of this arrangement, the Company became a 33.33%shareholder of Invida. In November 2011, the Company sold its investment in Invida for approximately $103.6million in net proceeds and recognized a gain on the sale of approximately $74.9 million which is included inequity in earnings from unconsolidated affiliates on the accompanying consolidated statement of income.
5. Derivatives
As of December 31, 2013, the Company held the following derivative positions: (i) freestanding warrants topurchase shares of common stock of a third party, (ii) forward exchange contracts to protect against foreignexchange movements for certain forecasted foreign currency cash flows related to service contracts and(iii) interest rate swaps to hedge the exposure to variability in interest payments on variable interest rate debt.The Company does not use derivative financial instruments for speculative or trading purposes.
As of December 31, 2013, the Company had freestanding warrants to purchase shares of third parties’common stock. No quoted price is available for the warrants. Accordingly, the Company uses various valuationtechniques to value the warrants, including the present value of estimated expected future cash flows, option-pricing models and fundamental analysis. Factors affecting the valuation include the current price of theunderlying common stock, the exercise price of the warrants, the expected time to exercise the warrants, theestimated price volatility of the underlying common stock over the life of the warrants and the restrictions on thetransferability of or ability to exercise the warrants. The Company recognized investment gains (losses) of$182,000, $17,000 and ($28,000) in 2013, 2012 and 2011, respectively, related to the warrants. The Company didnot sell any warrants in 2013, 2012 or 2011.
As of December 31, 2013, the Company had 12 open foreign exchange forward contracts to hedge certainforecasted foreign currency cash flow transactions occurring in 2014 with notional amounts totaling $60.8million. As of December 31, 2012, the Company had 12 open foreign exchange forward contracts to hedgecertain forecasted foreign currency transactions which occurred in 2013 with notional amounts totaling $38.9million. As these contracts were entered into to hedge the risk of the potential volatility in the cash flowsresulting from fluctuations in currency exchange rates in the first nine months of 2014, these transactions areaccounted for as cash flow hedges. As such, the effective portion of the gain or loss on the contracts is recordedas unrealized gains (losses) on derivatives included in the accumulated other comprehensive income componentof shareholders’ deficit. These hedges are highly effective. As of December 31, 2013 and 2012, the Company hadrecorded gross unrealized gains related to foreign exchange forward contracts of approximately $3.95 millionand $465,000, respectively. No gross unrealized losses were recorded as of December 31, 2013 and 2012. Uponexpiration of the hedge instruments in 2014, the Company will reclassify the unrealized holding gains and losseson the derivative instruments included in accumulated other comprehensive (loss) income into earnings. Theunrealized gains are included in other current assets and the unrealized losses are included in other currentliabilities on the accompanying consolidated balance sheets as of December 31, 2013 and 2012, respectively.
86

As of December 31, 2011, the Company, through its acquired subsidiary, Outcome Sciences, Inc.(“Outcome”), had open foreign exchange forward contracts to protect against the effects of foreign currencyfluctuations on certain foreign currency cash flow transactions occurring in 2012. The derivative instruments thatmatured in 2012 and 2011 had not been designated as hedges and, as a result, changes in the fair value wererecorded as other (income) expense, net. The Company recognized $588,000 and $177,000 of losses related tothese foreign exchange forward contracts as other (income) expense, net on the accompanying consolidatedstatement of income for the years ended December 31, 2012 and 2011, respectively. All of these contractsmatured in 2012.
In April 2006, the Company entered into six interest rate swaps expiring between December 31, 2006 andDecember 31, 2012 in an effort to limit its exposure to changes in the variable interest rate on its then-existingsenior secured credit facilities. In June 2011, in conjunction with the debt refinancing described in Note 10, theCompany discontinued hedge accounting and paid $11.6 million to terminate the remaining open interest rateswaps, which had a combined notional amount of approximately $179 million. The Company discontinued hedgeaccounting because it became probable that the original forecasted transactions would not occur due to the termsunder the Company’s credit arrangements. As a result, the Company reclassified the derivative losses of $11.6million previously reported in accumulated other comprehensive income into earnings as part of other (income)expense, net on the accompanying consolidated statement of income for the year ended December 31, 2011.
On June 9, 2011, the Company entered into six interest rate swaps effective September 28, 2012 andexpiring between September 30, 2013 and March 31, 2016 in an effort to limit its exposure to changes in thevariable interest rate on its senior secured credit facilities. The critical terms of the interest rate swaps weresubstantially the same as those of the Company’s senior secured credit facilities, including quarterly interestsettlements. These interest rate swaps are being accounted for as cash flow hedges as these transactions wereentered into to hedge the Company’s interest payments, and these hedges are deemed to be highly effective. Assuch, changes in the fair value of these derivative instruments are recorded as unrealized gains (losses) onderivatives included in the accumulated other comprehensive income component of shareholders’ deficit. AtDecember 31, 2013 and December 31, 2012, the unrealized losses included in accumulated other comprehensiveincome were $24.8 million and $34.0 million, respectively. The fair value of these interest rate swaps representsthe present value of the anticipated net payments the Company will make to the counterparty, which, when theyoccur, are reflected as interest expense on the consolidated statements of income. These payments, together withthe variable rate of interest incurred on the underlying debt, result in a fixed rate of interest of 2.55% plus theapplicable margin on the affected borrowings ($945.0 million or 45.9% of the Company’s variable rate debt atDecember 31, 2013). The Company expects that $12.5 million of unrealized losses will be reclassified out ofaccumulated other comprehensive (loss) income and will form the interest rate swap component of the 2.55%fixed rate of interest incurred over the next 12 months as the underlying net payments are settled.
The fair values of the Company’s derivative instruments designated as hedging instruments and the lineitems on the accompanying consolidated balance sheets to which they were recorded are summarized in thefollowing table (in thousands):
December 31,
Balance Sheet Classification 2013 2012
Foreign exchange forward contracts . . . . . . . . . . . . . . . . . . . . . . . . Other current assets $ 3,950 $ 465Interest rate swaps . . . . . . . . . . . . . . . . . . . . . . . . . . . . . . . . . . . . . . Other current liabilities $24,805 $34,007
87

The fair values of the Company’s derivative instruments not designated as hedging instruments and the lineitems on the accompanying consolidated balance sheets to which they were recorded are summarized in thefollowing table (in thousands):
December 31,
Balance Sheet Classification 2013 2012
Warrants . . . . . . . . . . . . . . . . . . . . . . . . . . . . . . . . . . . . . . . . . . . Deposits and other assets $211 $29
The effect of the Company’s cash flow hedging instruments on other comprehensive income (loss) issummarized in the following table (in thousands):
Year Ended December 31,
2013 2012 2011
Foreign exchange forward contracts . . . . . . . . . . . . . . . . . . . . . . . . . . . . . . . . . . . . $ 3,485 $ 2,327 $ (1,867)Interest rate swaps . . . . . . . . . . . . . . . . . . . . . . . . . . . . . . . . . . . . . . . . . . . . . . . . . . 9,202 (9,524) (10,270)
Total . . . . . . . . . . . . . . . . . . . . . . . . . . . . . . . . . . . . . . . . . . . . . . . . . . . . . . . . . $12,687 $(7,197) $(12,137)
(Gains) losses from derivative instruments not designated as hedges impacting the Company’s consolidatedstatements of income are summarized below (in thousands):
Year Ended December 31,
Income Statement Classification 2013 2012 2011
Warrants . . . . . . . . . . . . . . . . . . . . . . . . . . . . . . . . . Other (income) expense, net $(182) $ (17) $ 28Foreign exchange forward contracts . . . . . . . . . . . . Other (income) expense, net — 588 177
Total . . . . . . . . . . . . . . . . . . . . . . . . . . . . . . . . . . . . . . . . . . . . . . . . . . . . . . . . . $(182) $571 $205
6. Fair Value Measurements
The Company records certain assets and liabilities at fair value. Fair value is defined as the price that wouldbe received to sell an asset or paid to transfer a liability in the principal or most advantageous market for the assetor liability in an orderly transaction between market participants at the measurement date. A three-level fair valuehierarchy that prioritizes the inputs used to measure fair value is described below. This hierarchy requires entitiesto maximize the use of observable inputs and minimize the use of unobservable inputs. The three levels of inputsused to measure fair value are as follows:
• Level 1—Quoted prices in active markets for identical assets or liabilities.
• Level 2—Observable inputs other than quoted prices included in Level 1, such as quoted prices forsimilar assets and liabilities in active markets; quoted prices for identical or similar assets and liabilitiesin markets that are not active; or other inputs that are observable or can be corroborated by observablemarket data.
• Level 3—Unobservable inputs that are supported by little or no market activity. This includes certainpricing models, discounted cash flow methodologies and similar techniques that use significantunobservable inputs.
88

Recurring Fair Value Measurements
The following table summarizes the fair value of the Company’s financial assets and liabilities that aremeasured on a recurring basis as of December 31, 2013 (in thousands):
Level 1 Level 2 Level 3 Total
Assets:Marketable equity securities . . . . . . . . . . . . . . . . . . . . . . . . . . . . . . . . . . . $7,668 $ — $ — $ 7,668Foreign exchange forward contracts . . . . . . . . . . . . . . . . . . . . . . . . . . . . . — 3,950 — 3,950Warrants . . . . . . . . . . . . . . . . . . . . . . . . . . . . . . . . . . . . . . . . . . . . . . . . . . — — 211 211
Total . . . . . . . . . . . . . . . . . . . . . . . . . . . . . . . . . . . . . . . . . . . . . . . . . $7,668 $ 3,950 $ 211 $11,829
Liabilities:Interest rate swaps . . . . . . . . . . . . . . . . . . . . . . . . . . . . . . . . . . . . . . . . . . . $ — $24,805 $ — $24,805Contingent consideration . . . . . . . . . . . . . . . . . . . . . . . . . . . . . . . . . . . . . . — — 13,014 13,014
Total . . . . . . . . . . . . . . . . . . . . . . . . . . . . . . . . . . . . . . . . . . . . . . . . . $ — $24,805 $13,014 $37,819
The following table summarizes the fair value of the Company’s financial assets and liabilities that aremeasured on a recurring basis as of December 31, 2012 (in thousands):
Level 1 Level 2 Level 3 Total
Assets:Marketable equity securities . . . . . . . . . . . . . . . . . . . . . . . . . . . . . . . . . . . . $2,427 $ — $ — $ 2,427Foreign exchange forward contracts . . . . . . . . . . . . . . . . . . . . . . . . . . . . . — 465 — 465Warrants . . . . . . . . . . . . . . . . . . . . . . . . . . . . . . . . . . . . . . . . . . . . . . . . . . . — — 29 29
Total . . . . . . . . . . . . . . . . . . . . . . . . . . . . . . . . . . . . . . . . . . . . . . . . . . $2,427 $ 465 $ 29 $ 2,921
Liabilities:Interest rate swaps . . . . . . . . . . . . . . . . . . . . . . . . . . . . . . . . . . . . . . . . . . . $ — $34,007 $ — $34,007Contingent consideration . . . . . . . . . . . . . . . . . . . . . . . . . . . . . . . . . . . . . . — — 3,521 3,521
Total . . . . . . . . . . . . . . . . . . . . . . . . . . . . . . . . . . . . . . . . . . . . . . . . . . $ — $34,007 $3,521 $37,528
Below is a summary of the valuation techniques used in determining fair value:
Marketable equity securities—The Company values marketable equity securities utilizing quoted marketprices for these securities.
Warrants—The Company values warrants utilizing the Black-Scholes-Merton model.
Foreign exchange forward contracts—The Company values foreign exchange forward contracts usingquoted market prices for identical instruments in less active markets or using other observable inputs.
Interest rate swaps—The Company values interest rate swaps using market inputs with mid-market pricingas a practical expedient for bid-ask spread.
Contingent consideration—The Company values contingent consideration related to business combinationsusing a weighted probability calculation of potential payment scenarios discounted at rates reflective of the risksassociated with the expected future cash flows. Key assumptions used to estimate the fair value of contingentconsideration include revenue, net new business and operating forecasts and the probability of achieving thespecific targets.
89
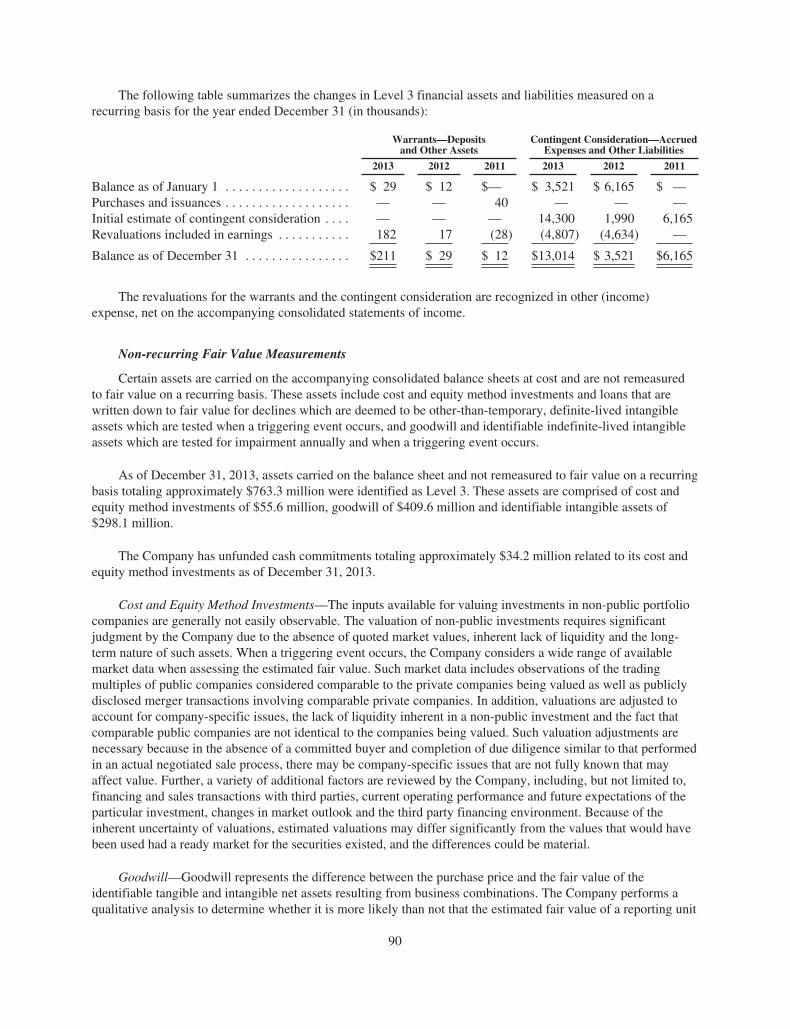
The following table summarizes the changes in Level 3 financial assets and liabilities measured on arecurring basis for the year ended December 31 (in thousands):
Warrants—Depositsand Other Assets
Contingent Consideration—AccruedExpenses and Other Liabilities
2013 2012 2011 2013 2012 2011
Balance as of January 1 . . . . . . . . . . . . . . . . . . . $ 29 $ 12 $— $ 3,521 $ 6,165 $ —Purchases and issuances . . . . . . . . . . . . . . . . . . . — — 40 — — —Initial estimate of contingent consideration . . . . — — — 14,300 1,990 6,165Revaluations included in earnings . . . . . . . . . . . 182 17 (28) (4,807) (4,634) —
Balance as of December 31 . . . . . . . . . . . . . . . . $211 $ 29 $ 12 $13,014 $ 3,521 $6,165
The revaluations for the warrants and the contingent consideration are recognized in other (income)expense, net on the accompanying consolidated statements of income.
Non-recurring Fair Value Measurements
Certain assets are carried on the accompanying consolidated balance sheets at cost and are not remeasuredto fair value on a recurring basis. These assets include cost and equity method investments and loans that arewritten down to fair value for declines which are deemed to be other-than-temporary, definite-lived intangibleassets which are tested when a triggering event occurs, and goodwill and identifiable indefinite-lived intangibleassets which are tested for impairment annually and when a triggering event occurs.
As of December 31, 2013, assets carried on the balance sheet and not remeasured to fair value on a recurringbasis totaling approximately $763.3 million were identified as Level 3. These assets are comprised of cost andequity method investments of $55.6 million, goodwill of $409.6 million and identifiable intangible assets of$298.1 million.
The Company has unfunded cash commitments totaling approximately $34.2 million related to its cost andequity method investments as of December 31, 2013.
Cost and Equity Method Investments—The inputs available for valuing investments in non-public portfoliocompanies are generally not easily observable. The valuation of non-public investments requires significantjudgment by the Company due to the absence of quoted market values, inherent lack of liquidity and the long-term nature of such assets. When a triggering event occurs, the Company considers a wide range of availablemarket data when assessing the estimated fair value. Such market data includes observations of the tradingmultiples of public companies considered comparable to the private companies being valued as well as publiclydisclosed merger transactions involving comparable private companies. In addition, valuations are adjusted toaccount for company-specific issues, the lack of liquidity inherent in a non-public investment and the fact thatcomparable public companies are not identical to the companies being valued. Such valuation adjustments arenecessary because in the absence of a committed buyer and completion of due diligence similar to that performedin an actual negotiated sale process, there may be company-specific issues that are not fully known that mayaffect value. Further, a variety of additional factors are reviewed by the Company, including, but not limited to,financing and sales transactions with third parties, current operating performance and future expectations of theparticular investment, changes in market outlook and the third party financing environment. Because of theinherent uncertainty of valuations, estimated valuations may differ significantly from the values that would havebeen used had a ready market for the securities existed, and the differences could be material.
Goodwill—Goodwill represents the difference between the purchase price and the fair value of theidentifiable tangible and intangible net assets resulting from business combinations. The Company performs aqualitative analysis to determine whether it is more likely than not that the estimated fair value of a reporting unit
90

is less than its book value. This includes a qualitative analysis of macroeconomic conditions, industry and marketconsiderations, internal cost factors, financial performance, fair value history and other company specific events.If this qualitative analysis indicates that it is more likely than not that the estimated fair value is less than thebook value for the respective reporting unit, the Company applies a two-step impairment test in which theCompany determines whether the estimated fair value of the reporting unit is in excess of its carrying value. Ifthe carrying value of the net assets assigned to the reporting unit exceeds the estimated fair value of the reportingunit, the Company performs the second step of the impairment test to determine the implied estimated fair valueof the reporting unit’s goodwill. The Company determines the implied estimated fair value of goodwill bydetermining the present value of the estimated future cash flows for each reporting unit and comparing thereporting unit’s risk profile and growth prospects to selected, reasonably similar publicly traded companies. Noindication of impairment was identified during the Company’s annual review.
Definite-lived Intangible Assets—If a triggering event occurs, the Company determines the estimated fairvalue of definite-lived intangible assets by determining the present value of the expected cash flows.
Indefinite-lived Intangible Assets—The Company performs a qualitative analysis to determine whether it ismore likely than not that the estimated fair value of the indefinite-lived intangible asset is less than its carryingvalue. If this qualitative analysis indicates that it is more likely than not that the estimated fair value is less thanthe carrying value of the indefinite-lived intangible asset, the Company determines the estimated fair value of theindefinite-lived intangible asset (trade name) by determining the present value of the estimated royalty paymentson an after-tax basis that it would be required to pay the owner for the right to use such trade name. If thecarrying amount exceeds the estimated fair value, an impairment loss is recognized in an amount equal to theexcess. No indication of impairment was identified during the Company’s annual review.
7. Property and Equipment
The major classes of property and equipment were as follows (in thousands):
December 31,
2013 2012
Land, buildings and leasehold improvements . . . . . . . . . . . . . . . . . . . . . . . . . . . . . . . . $ 184,726 $ 182,548Equipment . . . . . . . . . . . . . . . . . . . . . . . . . . . . . . . . . . . . . . . . . . . . . . . . . . . . . . . . . . . . 222,858 197,384Furniture and fixtures . . . . . . . . . . . . . . . . . . . . . . . . . . . . . . . . . . . . . . . . . . . . . . . . . . . 55,741 52,498Motor vehicles . . . . . . . . . . . . . . . . . . . . . . . . . . . . . . . . . . . . . . . . . . . . . . . . . . . . . . . . 17,801 19,035
481,126 451,465Less accumulated depreciation . . . . . . . . . . . . . . . . . . . . . . . . . . . . . . . . . . . . . . . . . . . . (281,548) (257,466)
$ 199,578 $ 193,999
8. Goodwill and Identifiable Intangible Assets
As of December 31, 2013, the Company has approximately $298.1 million of identifiable intangible assets,of which approximately $109.7 million, relating to a trade name, is deemed to be indefinite-lived and,accordingly, is not being amortized. Amortization expense associated with identifiable definite-lived intangibleassets was as follows (in thousands):
Year Ended December 31,
2013 2012 2011
Amortization expense . . . . . . . . . . . . . . . . . . . . . . . . . . . . . . . . . . . . . . . . $51,450 $46,440 $35,549
Estimated amortization expense for existing identifiable intangible assets is expected to be approximately$57.3 million, $46.9 million, $32.3 million, $21.3 million and $12.6 million for the years ending December 31,2014, 2015, 2016, 2017 and 2018, respectively. Estimated amortization expense can be affected by various factors,including future acquisitions or divestitures of product and/or licensing and distribution rights or impairments.
91

The following is a summary of identifiable intangible assets (in thousands):
As of December 31, 2013 As of December 31, 2012
GrossAmount
AccumulatedAmortization
NetAmount
GrossAmount
AccumulatedAmortization
NetAmount
Definite-lived identifiable intangible assets:Product licensing and distribution rights and
customer relationships . . . . . . . . . . . . . . . $115,895 $ (35,027) $ 80,868 $ 83,273 $ (21,553) $ 61,720Trademarks, trade names and other . . . . . . . 52,053 (37,450) 14,603 44,263 (32,870) 11,393Software and related assets . . . . . . . . . . . . . 232,468 (139,561) 92,907 201,800 (111,776) 90,024
$400,416 $(212,038) $188,378 $329,336 $(166,199) $163,137
Indefinite-lived identifiable intangibleassets:
Trade name . . . . . . . . . . . . . . . . . . . . . . . . . . $109,676 $ — $109,676 $109,676 $ — $109,676
Accumulated amortization of identifiable intangible assets includes the impact of amortization expense,foreign exchange fluctuations and disposals of software and related assets.
The following is a summary of goodwill by segment for the years ended December 31, 2013 and 2012 (inthousands):
ProductDevelopment
IntegratedHealthcare
Services Consolidated
Balance as of December 31, 2011 . . . . . . . . . . . . . . . . . . . . . . . . . . . . . . . . $216,264 $61,777 $278,041Acquisition . . . . . . . . . . . . . . . . . . . . . . . . . . . . . . . . . . . . . . . . . . . . . . . . . . 28,201 — 28,201Reallocation between segments . . . . . . . . . . . . . . . . . . . . . . . . . . . . . . . . . . (5,800) 5,800 —Impact of foreign currency fluctuations . . . . . . . . . . . . . . . . . . . . . . . . . . . . (908) (2,905) (3,813)
Balance as of December 31, 2012 . . . . . . . . . . . . . . . . . . . . . . . . . . . . . . . . 237,757 64,672 302,429Acquisition . . . . . . . . . . . . . . . . . . . . . . . . . . . . . . . . . . . . . . . . . . . . . . . . . . 116,542 — 116,542Impact of foreign currency fluctuations . . . . . . . . . . . . . . . . . . . . . . . . . . . . (3,155) (6,190) (9,345)
Balance as of December 31, 2013 . . . . . . . . . . . . . . . . . . . . . . . . . . . . . . . . $351,144 $58,482 $409,626
In September 2012, the Company reorganized its reporting structure. This change resulted in moving theCompany’s real-world and late phase research service line from the Product Development segment to theIntegrated Healthcare Services segment. The Company reallocated goodwill based upon the relative estimatedfair value of the affected service line to the pre-reorganization reporting unit estimated fair value, which resultedin the allocation of approximately $5.8 million of goodwill from Product Development to Integrated HealthcareServices.
9. Accrued Expenses
Accrued expenses consist of the following (in thousands):
December 31,
2013 2012
Compensation, including bonuses, fringe benefits and payroll taxes . . . . . . . . . . . . . . . . . . $437,138 $360,649Restructuring . . . . . . . . . . . . . . . . . . . . . . . . . . . . . . . . . . . . . . . . . . . . . . . . . . . . . . . . . . . . . 5,474 12,784Interest . . . . . . . . . . . . . . . . . . . . . . . . . . . . . . . . . . . . . . . . . . . . . . . . . . . . . . . . . . . . . . . . . . 278 368Contract related . . . . . . . . . . . . . . . . . . . . . . . . . . . . . . . . . . . . . . . . . . . . . . . . . . . . . . . . . . . 240,548 207,982Other . . . . . . . . . . . . . . . . . . . . . . . . . . . . . . . . . . . . . . . . . . . . . . . . . . . . . . . . . . . . . . . . . . . 77,751 76,336
$761,189 $658,119
92

10. Credit Arrangements
The following is a summary of the Company’s revolving credit facilities at December 31, 2013:
Facility Interest Rates
$300.0 million (first lien revolving credit facility) One month LIBOR (0.17% at December 31, 2013)plus 2.50% to 2.75% depending upon the Company’stotal leverage ratio
£10.0 million (approximately $16.5 million) generalbanking facility with a European headquartered bank
Bank’s base rate (0.5% at December 31, 2013) plus 1%
The Company did not have any outstanding borrowings under any of the revolving credit facilities atDecember 31, 2013 or 2012. At December 31, 2013, there were bank guarantees totaling approximately£1.8 million (approximately $3.0 million) issued against the availability of the general banking facility with aEuropean headquartered bank through their operations in the United Kingdom.
Long-term debt consists of the following (in thousands):
December 31,
2013 2012
Term Loan B-3 due 2018 ((the greater of three month LIBOR or 1.25%) plus 2.50%,or 3.75% at December 31, 2013) . . . . . . . . . . . . . . . . . . . . . . . . . . . . . . . . . . . . . . . . . $2,060,756 $ —
Term Loan B-2 due 2018 . . . . . . . . . . . . . . . . . . . . . . . . . . . . . . . . . . . . . . . . . . . . . . . . — 1,970,000Term Loan B-1 due 2018 . . . . . . . . . . . . . . . . . . . . . . . . . . . . . . . . . . . . . . . . . . . . . . . . — 174,5637.5% Term Loan due 2017 . . . . . . . . . . . . . . . . . . . . . . . . . . . . . . . . . . . . . . . . . . . . . . . — 300,000Other notes payable . . . . . . . . . . . . . . . . . . . . . . . . . . . . . . . . . . . . . . . . . . . . . . . . . . . . . 7 43
2,060,763 2,444,606Less: unamortized discount . . . . . . . . . . . . . . . . . . . . . . . . . . . . . . . . . . . . . . . . . . . . . . . (14,975) (22,908)Less: current portion . . . . . . . . . . . . . . . . . . . . . . . . . . . . . . . . . . . . . . . . . . . . . . . . . . . . (10,307) (55,594)
$2,035,481 $2,366,104
Contractual maturities of long-term debt at December 31, 2013 are as follows (in thousands):
2014 . . . . . . . . . . . . . . . . . . . . . . . . . . . . . . . . . . . . . . . . . . . . . . . . . . . . . . . . . . . . . . . . . . . . . . . . . . . . $ 10,3072015 . . . . . . . . . . . . . . . . . . . . . . . . . . . . . . . . . . . . . . . . . . . . . . . . . . . . . . . . . . . . . . . . . . . . . . . . . . . . 20,6002016 . . . . . . . . . . . . . . . . . . . . . . . . . . . . . . . . . . . . . . . . . . . . . . . . . . . . . . . . . . . . . . . . . . . . . . . . . . . . 20,6002017 . . . . . . . . . . . . . . . . . . . . . . . . . . . . . . . . . . . . . . . . . . . . . . . . . . . . . . . . . . . . . . . . . . . . . . . . . . . . 20,6002018 . . . . . . . . . . . . . . . . . . . . . . . . . . . . . . . . . . . . . . . . . . . . . . . . . . . . . . . . . . . . . . . . . . . . . . . . . . . . 1,988,656
$2,060,763
The estimated fair value of the long-term debt, which is primarily based on rates in which the debt is tradedamong banks, was approximately $2.1 billion and $2.5 billion at December 31, 2013 and 2012, respectively.
Senior Secured Credit Agreement
2011 Refinancing Transaction
On June 8, 2011, the Company, through its wholly owned subsidiary, Quintiles Transnational Corp.(“Quintiles Transnational”), entered into the initial credit agreement governing the Quintiles Transnational seniorsecured credit facilities under which the Company was permitted to borrow up to $2.225 billion. The creditfacility arrangements were amended in October 2012, December 2012 and December 2013, as described below,and initially consisted of two components: a $225.0 million first lien revolving credit facility due in 2016 and a$2.0 billion first lien Term Loan B (the “Term Loan B”) (collectively, the “2011 Senior Debt”).
93

The Company used the proceeds from the Term Loan B, together with cash on hand, to (i) repay theoutstanding balance on the Company’s then-existing senior secured credit facilities which included a $1.0 billionfirst lien term loan due in 2013 and a $220.0 million second lien term loan due in 2014, (ii) pay the purchaseprice for the Company’s then-existing senior notes accepted in the tender offer, (iii) redeem the senior notesremaining outstanding following completion of the tender offer (collectively, the “Prior Senior Debt”), (iv) pay adividend to its shareholders totaling approximately $288.3 million, (v) pay a bonus to certain option holderstotaling approximately $11.0 million and (vi) pay related fees and expenses.
In 2011, the Company recognized a $46.4 million loss on extinguishment of debt which includedapproximately $14.1 million of prepayment premiums, approximately $15.2 million of unamortized debtissuance costs, approximately $7.5 million of unamortized discount and approximately $9.6 million of relatedfees and expenses.
October 2012 Debt Issuance
On October 22, 2012, the Company entered into an amendment to the credit agreement to provide (i) a newTerm Loan B-1 (the “Term Loan B-1”) with a syndicate of banks for an aggregate principal amount of $175.0million due 2018, (ii) a one-year extension of the maturity date of its existing $225.0 million senior securedrevolving credit facility (to 2017) and (iii) a $75.0 million increase in its existing $225.0 million senior securedrevolving credit facility (the “Increased Revolving Facility”), which will also mature in 2017. Annual maturities onthe Term Loan B-1 were 1% of the original principal amount until December 31, 2017, with the balance of theTerm Loan B-1 to be repaid at final maturity on June 8, 2018. In the fourth quarter of 2012, the proceeds from theTerm Loan B-1, together with approximately $73 million of cash on hand, were used to (i) pay a dividend to theCompany’s shareholders totaling approximately $241.7 million, (ii) pay a bonus to certain option holders totalingapproximately $2.4 million and (iii) pay approximately $4.0 million of fees and related expenses. Other terms andcovenants of the Term Loan B-1 and the Increased Revolving Facility were and are the same as the terms andcovenants of the Company’s Term Loan B and the senior secured revolving credit facility prior to the amendment.
In May 2013, the Company used $50.0 million of cash to pay down indebtedness under the Term Loan B-1.In connection with the pay down of indebtedness, the Company recognized a $1.0 million loss on extinguishmentof debt which included approximately $930,000 of unamortized debt issuance costs and $112,000 of unamortizeddiscount.
On December 20, 2013, the Term Loan B-1 was repaid with the proceeds of a new Term Loan B-3 (seebelow).
2012 Refinancing Transaction
On December 20, 2012, the Company entered into an amendment to the credit agreement to provide a newTerm Loan B-2 (the “Term Loan B-2”) with a syndicate of banks for an aggregate principal amount of $1.975billion due in 2018. Annual maturities on the Term Loan B-2 were $20.0 million through December 31, 2017with the balance of the Term Loan B-2 to be repaid at final maturity on June 8, 2018. Other terms and covenantsof the Term Loan B-2 were the same as the terms and covenants of our Term Loan B prior to the amendment.
The Company used the proceeds from the Term Loan B-2, together with cash on hand, to repay theremaining outstanding balance on the Company’s then-existing Term Loan B and related fees and expenses. In2012, the Company recognized a $1.3 million loss on extinguishment of debt which included approximately$634,000 of unamortized debt issuance costs, approximately $631,000 of unamortized discount andapproximately $10,000 of related fees and expenses.
On December 20, 2013, the Term Loan B-2 was repaid with the proceeds of a new Term Loan B-3 (seebelow).
94

2013 Refinancing Transaction
On December 20, 2013, the Company entered into an amendment to its senior secured credit agreement toprovide a new Term Loan B-3 (the “Term Loan B-3”) with a syndicate of banks for an aggregate principalamount of $2.061 billion due in 2018. The proceeds from the Term Loan B-3 were used to repay the thenoutstanding balances of the Term Loan B-1 and Term Loan B-2 and related fees and expenses. Quarterlyprincipal payments on the Term Loan B-3 are $5.15 million, commencing on September 30, 2014 and continuingthrough March 31, 2018, with the balance of the Term Loan B-3 to be repaid at final maturity on June 8, 2018.The credit facility arrangements are collateralized by substantially all of the assets of Quintiles Transnational andthe assets of Quintiles Transnational’s domestic subsidiaries, including 100% of the equity interests ofsubstantially all of Quintiles Transnational’s domestic subsidiaries, and 65% of the equity interests ofsubstantially all of the first-tier foreign subsidiaries of Quintiles Transnational and its domestic subsidiaries (ineach case other than certain excluded subsidiaries as defined in the credit agreement). Beginning with fiscal yearending December 31, 2014, the Company is required to apply 50% of excess cash flow (as defined in the creditagreement), subject to a reduction to 25% or 0% depending upon Quintiles Transnational’s total leverage ratio,for prepayment of the Term Loan B-3, with any such prepayment to be applied, first, in direct order of maturities,pro rata to reduce the Term Loan B-3 principal payments due within eight quarters of such prepayment, then on apro rata basis to reduce the other principal payments due prior to the maturity date, and then to reduce theprincipal payments due on the maturity date. The amendment also provides additional flexibility for theCompany to enter into certain securitization financing transactions. Other terms and covenants of the Term LoanB-3 are the same as the terms and covenants of our Term Loan B-1 and Term Loan B-2 prior to the amendment.
In connection with this amendment to the credit agreement, the Company recognized a $3.3 million loss onextinguishment of debt which included approximately $1.6 million of unamortized debt issuance costs,approximately $1.6 million of unamortized discount and approximately $25,000 of related fees and expenses.
Other Long-Term Debt
In February 2012, the Company executed a new term loan facility with a syndicate of banks for an aggregateprincipal amount of $300.0 million due February 26, 2017 (the “Holdings Term Loan”). The Company used theproceeds from the Holdings Term Loan, together with cash on hand, to (1) pay a dividend to its shareholders inMarch 2012 totaling approximately $326.1 million, (2) pay a bonus to certain option holders totalingapproximately $8.9 million and (3) pay related expenses.
In May 2013, the Company used $308.9 million of cash to pay all amounts outstanding under the $300.0million Holdings Term Loan (including accrued interest and related fees and expenses). In connection with therepayment of debt, the Company recognized a $15.5 million loss on extinguishment of debt which includedapproximately $4.7 million of unamortized debt issuance costs, $4.7 million of unamortized discount and $6.1million of related fees and expenses.
Debt Issuance Costs and Covenants
In connection with the long-term debt agreements, the Company had net debt issuance costs ofapproximately $12.6 million and $23.6 million as of December 31, 2013 and 2012, respectively, included indeposits and other assets in the accompanying consolidated balance sheets. The debt issuance costs are beingamortized as a component of interest expense using the effective interest method over the term of the related debtarrangements, which range from five years to seven years.
The Company’s long-term debt agreements contain usual and customary restrictive covenants that, amongother things, place limitations on its ability to declare dividends and make other restricted payments; prepay,redeem or purchase debt; incur liens; make loans and investments; incur additional indebtedness; amend orotherwise alter debt and other material documents; engage in mergers, acquisitions and asset sales; transact withaffiliates; and engage in businesses that are not related to the Company’s existing business. In 2013, 2012 and2011, the Company believes it was in compliance with its debt covenants.
95
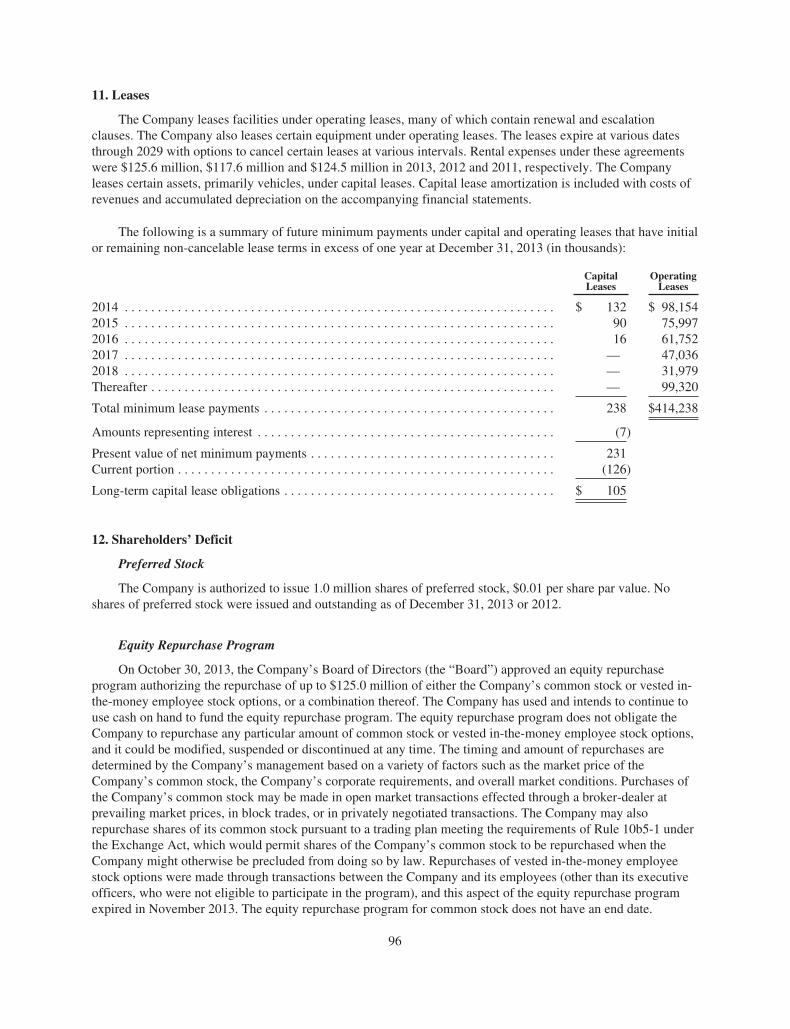
11. Leases
The Company leases facilities under operating leases, many of which contain renewal and escalationclauses. The Company also leases certain equipment under operating leases. The leases expire at various datesthrough 2029 with options to cancel certain leases at various intervals. Rental expenses under these agreementswere $125.6 million, $117.6 million and $124.5 million in 2013, 2012 and 2011, respectively. The Companyleases certain assets, primarily vehicles, under capital leases. Capital lease amortization is included with costs ofrevenues and accumulated depreciation on the accompanying financial statements.
The following is a summary of future minimum payments under capital and operating leases that have initialor remaining non-cancelable lease terms in excess of one year at December 31, 2013 (in thousands):
CapitalLeases
OperatingLeases
2014 . . . . . . . . . . . . . . . . . . . . . . . . . . . . . . . . . . . . . . . . . . . . . . . . . . . . . . . . . . . . . . . . . $ 132 $ 98,1542015 . . . . . . . . . . . . . . . . . . . . . . . . . . . . . . . . . . . . . . . . . . . . . . . . . . . . . . . . . . . . . . . . . 90 75,9972016 . . . . . . . . . . . . . . . . . . . . . . . . . . . . . . . . . . . . . . . . . . . . . . . . . . . . . . . . . . . . . . . . . 16 61,7522017 . . . . . . . . . . . . . . . . . . . . . . . . . . . . . . . . . . . . . . . . . . . . . . . . . . . . . . . . . . . . . . . . . — 47,0362018 . . . . . . . . . . . . . . . . . . . . . . . . . . . . . . . . . . . . . . . . . . . . . . . . . . . . . . . . . . . . . . . . . — 31,979Thereafter . . . . . . . . . . . . . . . . . . . . . . . . . . . . . . . . . . . . . . . . . . . . . . . . . . . . . . . . . . . . . — 99,320
Total minimum lease payments . . . . . . . . . . . . . . . . . . . . . . . . . . . . . . . . . . . . . . . . . . . . 238 $414,238
Amounts representing interest . . . . . . . . . . . . . . . . . . . . . . . . . . . . . . . . . . . . . . . . . . . . . (7)
Present value of net minimum payments . . . . . . . . . . . . . . . . . . . . . . . . . . . . . . . . . . . . . 231Current portion . . . . . . . . . . . . . . . . . . . . . . . . . . . . . . . . . . . . . . . . . . . . . . . . . . . . . . . . . (126)
Long-term capital lease obligations . . . . . . . . . . . . . . . . . . . . . . . . . . . . . . . . . . . . . . . . . $ 105
12. Shareholders’ Deficit
Preferred Stock
The Company is authorized to issue 1.0 million shares of preferred stock, $0.01 per share par value. Noshares of preferred stock were issued and outstanding as of December 31, 2013 or 2012.
Equity Repurchase Program
On October 30, 2013, the Company’s Board of Directors (the “Board”) approved an equity repurchaseprogram authorizing the repurchase of up to $125.0 million of either the Company’s common stock or vested in-the-money employee stock options, or a combination thereof. The Company has used and intends to continue touse cash on hand to fund the equity repurchase program. The equity repurchase program does not obligate theCompany to repurchase any particular amount of common stock or vested in-the-money employee stock options,and it could be modified, suspended or discontinued at any time. The timing and amount of repurchases aredetermined by the Company’s management based on a variety of factors such as the market price of theCompany’s common stock, the Company’s corporate requirements, and overall market conditions. Purchases ofthe Company’s common stock may be made in open market transactions effected through a broker-dealer atprevailing market prices, in block trades, or in privately negotiated transactions. The Company may alsorepurchase shares of its common stock pursuant to a trading plan meeting the requirements of Rule 10b5-1 underthe Exchange Act, which would permit shares of the Company’s common stock to be repurchased when theCompany might otherwise be precluded from doing so by law. Repurchases of vested in-the-money employeestock options were made through transactions between the Company and its employees (other than its executiveofficers, who were not eligible to participate in the program), and this aspect of the equity repurchase programexpired in November 2013. The equity repurchase program for common stock does not have an end date.
96

In 2013, repurchases under the equity repurchase program resulted in a $65.5 million charge to equityconsisting of (i) the repurchase of approximately 153,200 shares of common stock for an aggregate purchaseprice of $6.4 million (representing an average price per share of $42.01), and (ii) the repurchase of 2.0 millionvested in-the-money employee stock options at fair value for an aggregate purchase price of $59.1 million(representing an average market price per share of $43.42 and an average exercise price per option of $13.74). Asof December 31, 2013, $59.5 million is available for repurchase under the equity repurchase program.
Dividends
In October 2012, the Board declared a $2.09 per share dividend to shareholders of record on October 24,2012. The dividend totaled approximately $241.7 million and was paid on November 1, 2012.
In February 2012, the Board declared a $2.82 per share dividend to shareholders of record on February 29,2012. The dividend totaled approximately $326.1 million and was paid on March 9, 2012.
In June 2011, the Board declared a $2.48 per share dividend to shareholders of record on June 7, 2011. Thedividend totaled approximately $288.3 million and was paid on June 10, 2011.
13. Management Fees
In January 2008, pursuant to a management agreement with affiliates of certain of the Company’sshareholders, the Company agreed to pay an annual management service fee of $5.0 million in the aggregate to(i) GF Management Company, LLC (“GFM”); (ii) Bain Capital Partners, LLC; (iii) TPG Capital, LP; (iv) 3iCorporation; (v) Cassia Fund Management Pte Ltd; and (vi) Aisling Capital, LLC (“Aisling Capital”). Of thisamount, Aisling Capital received $150,000 annually for so long as the Company’s Investment Committeeincluded a member nominated by Aisling Capital. The remaining approximately $4.9 million of the annualmanagement service fee was paid to the other managers each year, in advance and in equal quarterlyinstallments, in proportion to each manager’s (or such manager’s affiliates’) respective share ownership in theCompany. The annual management service fee was subject to upward adjustment each year effective as ofMarch 31 based on any increase in the Consumer Price Index for the preceding calendar year. The initial term ofthe management agreement extended through December 31, 2010, after which it automatically renewed for anadditional year unless written notice was provided or other conditions were met. In 2013, the managementagreement was terminated, and the Company paid a $25.0 million fee in connection with the termination. In2013, 2012 and 2011, the Company expensed $27.7 million, $5.3 million and $5.2 million, respectively, inmanagement fees under this agreement.
14. Business Combinations
Novella Clinical Inc.
On September 16, 2013, the Company completed the acquisition of Novella Clinical Inc. (“Novella”)through the purchase of 100% of Novella’s outstanding stock for approximately $146.6 million in cash (net ofapproximately $26.2 million of acquired cash) plus potential annual earn-out payments totaling up to $21.0million contingent upon the achievement of certain revenue and net new business targets for approximately threeyears following closing. The Company initially recognized a liability of approximately $14.3 million as theestimated acquisition date fair value of the earn-out. Changes in the fair value of the earn-out subsequent to theacquisition date are recognized in earnings in the period of the change. Goodwill was primarily attributable to theassembled workforce of Novella and expected synergies. Novella has operations primarily in the United Statesand Europe and is a clinical research organization focused primarily on emerging oncology customers as well asthose in the medical device and diagnostics sectors. As part of its Product Development segment, the Companyexpects that Novella will complement its clinical service offerings through its focus on emerging companies andby adding expertise in oncology and medical devices.
97

Expression Analysis, Inc.
On August 10, 2012, the Company completed the acquisition of Expression Analysis, Inc. (“EA”) throughthe purchase of 100% of EA’s outstanding stock for $39.7 million in cash and contingent consideration in theform of a potential earn-out payment of up to $3.5 million. The earn-out payment is contingent upon theachievement of certain revenue and earnings targets during the 24 month period following closing. The Companyinitially recognized a liability of approximately $2.0 million as the estimated acquisition date fair value of theearn-out. Changes in the fair value of the earn-out subsequent to the acquisition date are recognized in earningsin the period of the change. EA, based in the United States, provides genomic sequencing, gene expression,genotyping and bioinformatics services to biopharmaceutical companies, diagnostic test developers, governmentagencies and academic laboratories. The Company acquired EA to complement its current laboratory services byadding expertise in genetic sequencing and advanced bioinformatics.
Advion BioServices, Inc.
On November 4, 2011, the Company completed the acquisition of Advion BioServices, Inc. (“Advion”)effected through a merger for $54.9 million in cash and contingent consideration in the form of a potential earn-out payment. The earn-out payment, capped at $5.0 million, was contingent upon the achievement of certainearnings targets in 2012. The Company initially recognized a liability of approximately $1.5 million as theestimated acquisition date fair value of the earn-out. Advion is a bioanalytical laboratory based in the UnitedStates providing good laboratory practice, pharmacokinetic/pharmacodynamic (“PK/PD”) testing and otherservices. The Company acquired Advion to move into emerging and fast-growing market segments includingbiomarkers and other advanced testing segments by offering services such as biomarker discovery and testing,molecular screening, drug discovery and metabolism, immunoassay, plus broaden its laboratory servicesofferings to include PK/PD testing.
Outcome Sciences, Inc.
On October 19, 2011, the Company completed the acquisition of Outcome through the purchase of 100% ofOutcome’s outstanding stock and cancellation of all of Outcome’s outstanding stock options for approximately$164.9 million (net of approximately $12.1 million of acquired cash). Outcome is headquartered in Cambridge,Massachusetts and is a provider of observational research services which encompasses registries, post-approvalresearch and quality improvement initiatives across multiple healthcare stakeholders includingbiopharmaceutical, medical device, government and providers. The Company acquired Outcome to strengthen itsobservational and real-world research services by offering global reach, robust dedicated resources andspecialization.
98

Accounting for Acquisitions
Acquisitions are accounted for as business combinations and, accordingly, the assets acquired and theliabilities assumed have been recorded at their respective estimated fair values as of the acquisition date. Inconnection with the following acquisitions, the Company recorded goodwill which was assigned to the ProductDevelopment segment and is not deductible for income tax purposes. The pro forma results and the revenues andearnings of the acquired businesses, and acquisition-related expenses, are immaterial for separate disclosure. Thefollowing table summarizes the estimated fair value of the net assets acquired at the date of the acquisitions (inthousands):
Novella EA Advion Outcome
Assets acquired:Cash and cash equivalents . . . . . . . . . . . . . . . . . . . . . . . . . . . . . . $ 26,190 $ 441 $ — $ 12,128Accounts receivable and unbilled services . . . . . . . . . . . . . . . . . 28,644 1,920 6,193 14,076Other current assets . . . . . . . . . . . . . . . . . . . . . . . . . . . . . . . . . . . 1,441 2,952 1,015 5,404Property and equipment . . . . . . . . . . . . . . . . . . . . . . . . . . . . . . . 9,616 4,731 8,292 2,610Goodwill . . . . . . . . . . . . . . . . . . . . . . . . . . . . . . . . . . . . . . . . . . . 116,542 28,201 27,995 130,762Other identifiable intangibles, net . . . . . . . . . . . . . . . . . . . . . . . . 42,740 9,460 12,120 45,900Deferred income tax asset—long-term . . . . . . . . . . . . . . . . . . . . — — 9,468 —Other long-term assets . . . . . . . . . . . . . . . . . . . . . . . . . . . . . . . . . 2,203 — — 480
Liabilities assumed:Accounts payable and accrued expenses . . . . . . . . . . . . . . . . . . . (12,716) (3,574) (1,731) (3,186)Unearned income . . . . . . . . . . . . . . . . . . . . . . . . . . . . . . . . . . . . . (7,782) (411) (1,077) (11,953)Other current liabilities . . . . . . . . . . . . . . . . . . . . . . . . . . . . . . . . (132) (101) (5,583) (3,566)Deferred income tax liability—long-term . . . . . . . . . . . . . . . . . . (18,364) (1,707) — (15,635)Other long-term liabilities . . . . . . . . . . . . . . . . . . . . . . . . . . . . . . (1,334) (226) (282) —
Net assets acquired . . . . . . . . . . . . . . . . . . . . . . . . . . . . . . . . . . . . . . . $187,048 $41,686 $56,410 $177,020
The identifiable definite-lived intangible assets consisted of the following:
Novella EA Advion Outcome
Other identifiable intangibles, net (in thousands)Customer relationships . . . . . . . . . . . . . . . . . . . . . . . . . . . . . . . . $ 20,800 $ 9,000 $ 9,400 $ 27,600Acquired backlog . . . . . . . . . . . . . . . . . . . . . . . . . . . . . . . . . . . . 14,000 170 2,500 11,800Trade names . . . . . . . . . . . . . . . . . . . . . . . . . . . . . . . . . . . . . . . . 7,500 290 170 4,900Non-compete agreements . . . . . . . . . . . . . . . . . . . . . . . . . . . . . . 440 — 50 1,600
Total other identifiable intangibles, net . . . . . . . . . . . . . . . . . . . . . . . $ 42,740 $ 9,460 $12,120 $ 45,900
Amortized over a weighted average useful life (in years) . . . . . . . . . 7 11 8 9
15. Restructuring
2013 Plan
In February 2013, the Board approved a restructuring plan of up to $15.0 million to migrate the delivery ofservices, primarily in the Product Development segment, and to reduce anticipated overcapacity in selected areas,primarily in the Integrated Healthcare Services segment. These actions are expected to result in a reduction ofapproximately 400 positions. Since February 2013, the Company has recognized approximately $14.2 million ofrestructuring costs related to this plan. All of the restructuring costs are related to severance costs. Of the $14.2million in total restructuring costs recognized for this plan, approximately $9.0 million, $4.7 million and$469,000 were related to activities in the Product Development segment, Integrated Healthcare Services segmentand corporate activities, respectively.
99

2012 Plan
In May 2012, the Board approved a restructuring plan of up to $20.0 million to reduce anticipatedovercapacity and to rationalize the number of non-billable support roles, which resulted in a reduction ofapproximately 280 positions, primarily in Europe. Since May 2012, the Company has recognized approximately$20.1 million of restructuring costs related to this plan including reversals. The reversals were due to changes inestimates primarily resulting from the redeployment of staff and higher than expected voluntary terminations. Ofthe $20.1 million in total restructuring costs recognized for this plan, $19.7 million and $376,000 were related toseverance costs and lease costs, respectively. Of the $20.1 million in total restructuring costs recognized for thisplan, approximately $12.2 million, $3.9 million and $4.0 million were related to activities in the ProductDevelopment segment, Integrated Healthcare Services segment and corporate activities, respectively.
2011 Plan
In July 2011, the Company initiated a restructuring plan to reduce its overcapacity within the ProductDevelopment segment and the Integrated Healthcare Services segment and to rationalize the number of its non-billable support roles, which resulted in a reduction of approximately 290 positions, primarily in North Americaand Europe. Since July 2011, the Company has recognized approximately $21.6 million of restructuring costsrelated to this plan including reversals. The reversals were due to changes in estimates primarily resulting fromthe redeployment of staff and higher than expected voluntary terminations. Of the $21.6 million in totalrestructuring costs recognized for this plan, approximately $17.6 million, $3.2 million and $837,000 were relatedto activities in the Product Development segment, Integrated Healthcare Services segment and corporateactivities, respectively.
Summary
As of December 31, 2013, the following amounts were recorded for the restructuring plans discussed above(in thousands):
Severance and Related Costs Exit Costs
Balance atDecember 31,
2012
Expense,Net of
Reversals Payments
ForeignCurrency
Translation
Expense,Net of
Reversals Payments
ForeignCurrency
Translation
Balance atDecember 31,
2013
2013 Plan . . . . . $ — $14,232 $(11,130) $123 $— $ — $— $3,2252012 Plan . . . . . 11,220 (263) (9,450) (40) 377 (111) — 1,733Prior Year Plans 1,564 (251) (744) 15 (24) (43) (1) 516
$12,784 $13,718 $(21,324) $ 98 $353 $(154) $ (1) $5,474
The Company expects the majority of the remaining restructuring accruals to be paid in 2014.
As of December 31, 2012, the following amounts were recorded for the restructuring plans discussed above(in thousands):
Severance and Related Costs Exit Costs
Balance atDecember 31,
2011
Expense,Net of
Reversals Payments
ForeignCurrency
Translation
Expense,Net of
Reversals Payments
ForeignCurrency
Translation
Balance atDecember 31,
2012
2012 Plan . . . . . $ — $19,997 $ (9,028) $251 $— $ — $— $11,2202011 Plan . . . . . 12,522 (1,901) (5,149) 52 941 (5,304) 73 1,234Prior Year Plans 2,338 (268) (1,727) 15 (28) — — 330
$14,860 $17,828 $(15,904) $318 $913 $(5,304) $ 73 $12,784
Restructuring costs are not allocated to the Company’s reportable segments as they are not part of thesegment performance measures regularly reviewed by management.
100

16. Impairments
The following table is a summary of the impairments recognized by the Company, including those describedin Note 3 (in thousands):
Year EndedDecember 31,
2011
Non-marketable equity securities . . . . . . . . . . . . . . . . . . . . . . . . . . . . . . . . . . . . . . . . . . . . . . . . . . . . . $ 145Long-lived assets . . . . . . . . . . . . . . . . . . . . . . . . . . . . . . . . . . . . . . . . . . . . . . . . . . . . . . . . . . . . . . . . . 12,150
Total impairments recognized . . . . . . . . . . . . . . . . . . . . . . . . . . . . . . . . . . . . . . . . . . . . . . . . . . . . . . . $12,295
In the fourth quarter of 2011, the Company determined that indicators of impairment existed in its earlyclinical development service offering due to a decline in revenue as well as an increasingly competitive marketfor early clinical development services. Also in the fourth quarter of 2011, management approved a plan toconsolidate two locations providing early clinical development services and begin implementing process changesthat will reduce capacity and temporarily suspend services. Based on these changes, the Company’s estimate ofthe future cash flows of the related asset group was no longer sufficient to recover the asset group’s carryingvalue. As a result, the Company recognized an impairment charge of $12.2 million related to the write-down ofthese long-lived assets to estimated fair value. Estimated fair value was determined using a discounted presentvalue approach on the asset group, which consisted of furniture and fixtures, equipment, software and leaseholdimprovements. The early clinical development service offering and the related asset group are part of the ProductDevelopment segment. There were no impairments in 2013 or 2012.
17. Income Taxes
The components of income before income taxes and equity in earnings of unconsolidated affiliates are asfollows (in thousands):
Year Ended December 31,
2013 2012 2011
Domestic . . . . . . . . . . . . . . . . . . . . . . . . . . . . . . . . . . . . . . . . . . . . . . . . . . . . . . . $ 68,425 $ 31,204 $ (30,334)Foreign . . . . . . . . . . . . . . . . . . . . . . . . . . . . . . . . . . . . . . . . . . . . . . . . . . . . . . . . 254,691 236,224 215,009
$323,116 $267,428 $184,675
The components of income tax expense attributable to continuing operations are as follows (in thousands):
Year Ended December 31,
2013 2012 2011
Current expense (benefit):Federal . . . . . . . . . . . . . . . . . . . . . . . . . . . . . . . . . . . . . . . . . . . . . . . . . . . . $ 38,573 $ 18,236 $ 10,324State . . . . . . . . . . . . . . . . . . . . . . . . . . . . . . . . . . . . . . . . . . . . . . . . . . . . . . (4,309) 1,384 3,875Foreign . . . . . . . . . . . . . . . . . . . . . . . . . . . . . . . . . . . . . . . . . . . . . . . . . . . . 83,744 58,712 70,905
118,008 78,332 85,104
Deferred (benefit) expense:Federal and state . . . . . . . . . . . . . . . . . . . . . . . . . . . . . . . . . . . . . . . . . . . . . (15,807) 16,023 (47,517)Foreign . . . . . . . . . . . . . . . . . . . . . . . . . . . . . . . . . . . . . . . . . . . . . . . . . . . . (6,236) (991) (22,482)
(22,043) 15,032 (69,999)
$ 95,965 $ 93,364 $ 15,105
101

The differences between the Company’s consolidated income tax expense attributable to continuingoperations and the expense computed at the 35% United States statutory income tax rate were as follows (inthousands):
Year Ended December 31,
2013 2012 2011
Federal income tax expense at statutory rate . . . . . . . . . . . . . . . . . . . . . . . . . . . . $113,091 $ 93,600 $ 64,636State and local income taxes, net of federal benefit . . . . . . . . . . . . . . . . . . . . . . (1,088) (914) 3,487Research and development . . . . . . . . . . . . . . . . . . . . . . . . . . . . . . . . . . . . . . . . . (12,788) (17,096) (14,111)Foreign nontaxable interest income . . . . . . . . . . . . . . . . . . . . . . . . . . . . . . . . . . . (9,751) (7,864) (8,375)Transaction costs . . . . . . . . . . . . . . . . . . . . . . . . . . . . . . . . . . . . . . . . . . . . . . . . . 343 291 16,932Gain on note settlement . . . . . . . . . . . . . . . . . . . . . . . . . . . . . . . . . . . . . . . . . . . . 10,794 — —US taxes recorded on foreign earnings . . . . . . . . . . . . . . . . . . . . . . . . . . . . . . . . (1,616) 23,236 (33,180)Foreign rate differential . . . . . . . . . . . . . . . . . . . . . . . . . . . . . . . . . . . . . . . . . . . . (10,753) (8,396) 145(Decrease) increase in valuation allowance . . . . . . . . . . . . . . . . . . . . . . . . . . . . (178) 401 (9,939)Effect of changes in apportionment and tax rates . . . . . . . . . . . . . . . . . . . . . . . . (492) 1,872 663Foreign tax contingencies . . . . . . . . . . . . . . . . . . . . . . . . . . . . . . . . . . . . . . . . . . 2,069 104 (16,609)Future foreign branch earnings . . . . . . . . . . . . . . . . . . . . . . . . . . . . . . . . . . . . . . 606 858 7,249Other . . . . . . . . . . . . . . . . . . . . . . . . . . . . . . . . . . . . . . . . . . . . . . . . . . . . . . . . . . 5,728 7,272 4,207
$ 95,965 $ 93,364 $ 15,105
Prior to June 2013, the Company had not considered the majority of the undistributed earnings of its foreignsubsidiaries to be indefinitely reinvested. Management reevaluated this assertion following the IPO, as a portionof the IPO proceeds were used to pay down debt held in the United States as well as the fact the Company doesnot anticipate paying dividends in the foreseeable future, which had been significant in the past. With thisreduction of debt and related interest expense and the change in approach related to payment of dividends, theCompany expects to be able to support the cash needs of the domestic subsidiaries without repatriating cash fromthe affected foreign subsidiaries. The Company expects to utilize the cash generated outside of the United Statesto fund growth outside of the United States. As a result of the assertion change, the Company recorded an $8.1million income tax benefit in the second quarter of 2013 to reverse the deferred income tax liability previouslyrecorded on undistributed foreign earnings prior to 2013 that are now considered indefinitely reinvested outsideof the United States. Undistributed earnings of the Company’s foreign subsidiaries amounted to approximately$488.6 million at December 31, 2013. Approximately $119.8 million of this total is not considered to beindefinitely reinvested and would be taxable upon repatriation. The Company has recorded a deferred income taxliability, net of foreign income tax credits that would be generated upon repatriation, of $18.4 million as ofDecember 31, 2013 associated with those earnings based upon the United States federal income tax rate. Upondistribution of those earnings in the form of dividends or otherwise, the Company would be subject to bothUnited States income taxes (subject to an adjustment for foreign tax credits, if available) and withholding taxespayable to the various countries in which the Company’s foreign subsidiaries are located. If the approximately$368.8 million of indefinitely reinvested earnings were repatriated to the United States, it would generate anestimated $32.0 million of additional tax liability for the Company.
In years prior to 2009, the Company elected to deduct on its United States income tax returns the actualforeign taxes associated with repatriated foreign earnings instead of treating these taxes as credits. Throughout2010, the Company could not support amending prior year income tax returns to recognize potential past taxcredits based on projections of foreign source income. However, as a result of the favorable impacts from therefinancing transaction in 2011 discussed in Note 10 coupled with continued improvement in its foreign sourceincome, the Company concluded that it would be able to receive an income tax benefit if it amended its prioryear income tax returns and claimed foreign tax credits rather than foreign tax deductions as were takenpreviously. As a result, the Company’s effective income tax rate for the year ended December 31, 2011 waspositively impacted by a $48.7 million income tax benefit for this change in estimate.
102

The income tax effects of temporary differences from continuing operations that give rise to significantportions of deferred income tax (liabilities) assets are presented below (in thousands):
December 31,
2013 2012
Deferred income tax liabilities:Undistributed foreign earnings . . . . . . . . . . . . . . . . . . . . . . . . . . . . . . . . . . . . . . . . . . $ (18,393) $ (44,972)Depreciation and amortization . . . . . . . . . . . . . . . . . . . . . . . . . . . . . . . . . . . . . . . . . . (78,486) (64,573)Other . . . . . . . . . . . . . . . . . . . . . . . . . . . . . . . . . . . . . . . . . . . . . . . . . . . . . . . . . . . . . . (12,700) (12,984)
Total deferred income tax liabilities . . . . . . . . . . . . . . . . . . . . . . . . . . . . . . . . . . . . . . . . . . (109,579) (122,529)Deferred income tax assets:
Net operating loss, capital loss and foreign tax credit carryforwards . . . . . . . . . . . . 49,308 82,745Unrealized loss on investments . . . . . . . . . . . . . . . . . . . . . . . . . . . . . . . . . . . . . . . . . 8,182 12,695Accrued expenses and unearned income . . . . . . . . . . . . . . . . . . . . . . . . . . . . . . . . . . 31,067 22,614Employee benefits . . . . . . . . . . . . . . . . . . . . . . . . . . . . . . . . . . . . . . . . . . . . . . . . . . . 124,688 120,603Other . . . . . . . . . . . . . . . . . . . . . . . . . . . . . . . . . . . . . . . . . . . . . . . . . . . . . . . . . . . . . . 12,033 10,347
225,278 249,004Valuation allowance for deferred income tax assets . . . . . . . . . . . . . . . . . . . . . . . . . (29,501) (32,344)
Total deferred income tax assets . . . . . . . . . . . . . . . . . . . . . . . . . . . . . . . . . . . . . . . . . . . . 195,777 216,660
Net deferred income tax assets . . . . . . . . . . . . . . . . . . . . . . . . . . . . . . . . . . . . . . . . . . . . . . $ 86,198 $ 94,131
The Company has net operating loss and capital loss carryforwards of approximately $42.1 million invarious entities within the United Kingdom which have no expiration date and has $75.6 million of net operatingloss and capital loss carryforwards from various foreign jurisdictions which have different expiration periods.The Company has United States net operating loss carryforwards of $23.6 million, which were obtained throughthe acquisitions of Novella, EA, and Advion in 2013, 2012, and 2011, respectively, and expire through 2023.These losses are subject to IRC Section 382 limitations; however, management expects all losses to be utilizedduring the carryforward periods. In addition, the Company has approximately $72.6 million of United States stateoperating loss carryforwards which expire through 2033.
In 2013, the Company decreased its valuation allowance $2.8 million to $29.5 million at December 31, 2013from $32.3 million at December 31, 2012. The valuation allowance is primarily related to loss carryforwards invarious foreign and state jurisdictions.
A reconciliation of the beginning and ending amount of gross unrecognized income tax benefits is presentedbelow (in thousands):
December 31,
2013 2012 2011
Balance at January 1 . . . . . . . . . . . . . . . . . . . . . . . . . . . . . . . . . . . . . . . . . . . . . . . . $43,393 $41,371 $ 49,532Additions based on tax positions related to the current year . . . . . . . . . . . . . . . . . 4,493 891 1,416Additions for income tax positions of prior years . . . . . . . . . . . . . . . . . . . . . . . . . 12,854 2,230 2,039Impact of changes in exchange rates . . . . . . . . . . . . . . . . . . . . . . . . . . . . . . . . . . . (71) 118 (286)Settlements with tax authorities . . . . . . . . . . . . . . . . . . . . . . . . . . . . . . . . . . . . . . . (1,052) (179) (165)Reductions for income tax positions of prior years . . . . . . . . . . . . . . . . . . . . . . . . (3,520) (63) (1,052)Reductions due to the lapse of the applicable statute of limitations . . . . . . . . . . . . (1,161) (975) (10,113)
Balance at December 31 . . . . . . . . . . . . . . . . . . . . . . . . . . . . . . . . . . . . . . . . . . . . . $54,936 $43,393 $ 41,371
103
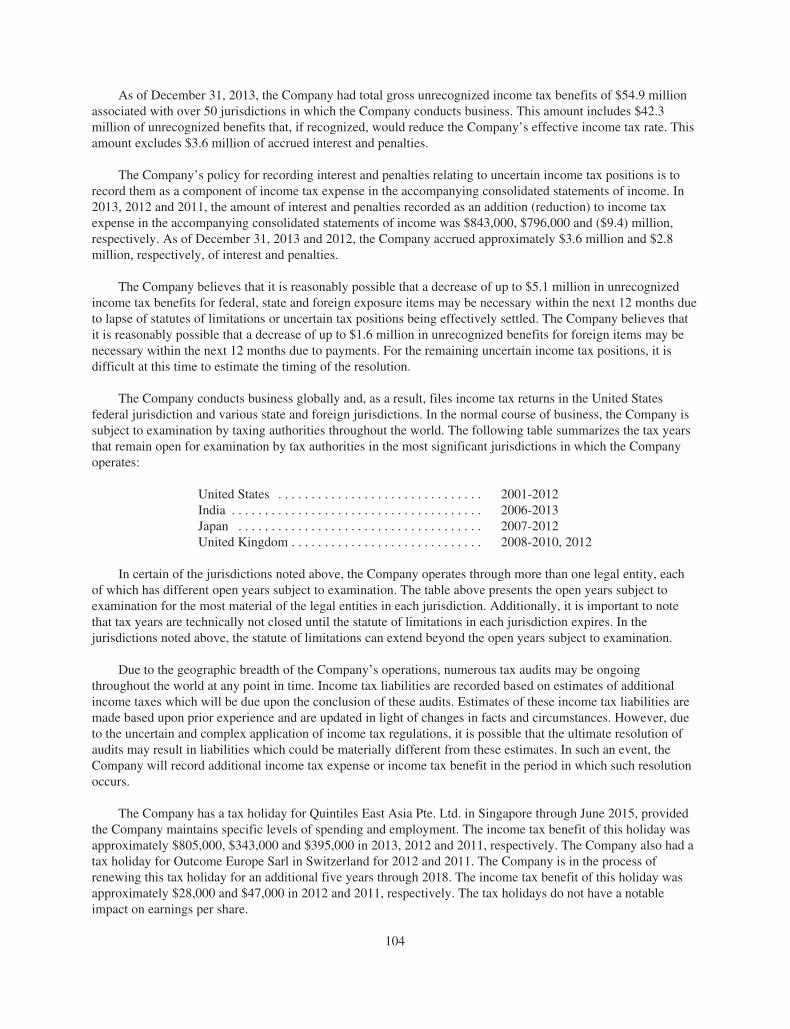
As of December 31, 2013, the Company had total gross unrecognized income tax benefits of $54.9 millionassociated with over 50 jurisdictions in which the Company conducts business. This amount includes $42.3million of unrecognized benefits that, if recognized, would reduce the Company’s effective income tax rate. Thisamount excludes $3.6 million of accrued interest and penalties.
The Company’s policy for recording interest and penalties relating to uncertain income tax positions is torecord them as a component of income tax expense in the accompanying consolidated statements of income. In2013, 2012 and 2011, the amount of interest and penalties recorded as an addition (reduction) to income taxexpense in the accompanying consolidated statements of income was $843,000, $796,000 and ($9.4) million,respectively. As of December 31, 2013 and 2012, the Company accrued approximately $3.6 million and $2.8million, respectively, of interest and penalties.
The Company believes that it is reasonably possible that a decrease of up to $5.1 million in unrecognizedincome tax benefits for federal, state and foreign exposure items may be necessary within the next 12 months dueto lapse of statutes of limitations or uncertain tax positions being effectively settled. The Company believes thatit is reasonably possible that a decrease of up to $1.6 million in unrecognized benefits for foreign items may benecessary within the next 12 months due to payments. For the remaining uncertain income tax positions, it isdifficult at this time to estimate the timing of the resolution.
The Company conducts business globally and, as a result, files income tax returns in the United Statesfederal jurisdiction and various state and foreign jurisdictions. In the normal course of business, the Company issubject to examination by taxing authorities throughout the world. The following table summarizes the tax yearsthat remain open for examination by tax authorities in the most significant jurisdictions in which the Companyoperates:
United States . . . . . . . . . . . . . . . . . . . . . . . . . . . . . . . 2001-2012India . . . . . . . . . . . . . . . . . . . . . . . . . . . . . . . . . . . . . . 2006-2013Japan . . . . . . . . . . . . . . . . . . . . . . . . . . . . . . . . . . . . . 2007-2012United Kingdom . . . . . . . . . . . . . . . . . . . . . . . . . . . . . 2008-2010, 2012
In certain of the jurisdictions noted above, the Company operates through more than one legal entity, eachof which has different open years subject to examination. The table above presents the open years subject toexamination for the most material of the legal entities in each jurisdiction. Additionally, it is important to notethat tax years are technically not closed until the statute of limitations in each jurisdiction expires. In thejurisdictions noted above, the statute of limitations can extend beyond the open years subject to examination.
Due to the geographic breadth of the Company’s operations, numerous tax audits may be ongoingthroughout the world at any point in time. Income tax liabilities are recorded based on estimates of additionalincome taxes which will be due upon the conclusion of these audits. Estimates of these income tax liabilities aremade based upon prior experience and are updated in light of changes in facts and circumstances. However, dueto the uncertain and complex application of income tax regulations, it is possible that the ultimate resolution ofaudits may result in liabilities which could be materially different from these estimates. In such an event, theCompany will record additional income tax expense or income tax benefit in the period in which such resolutionoccurs.
The Company has a tax holiday for Quintiles East Asia Pte. Ltd. in Singapore through June 2015, providedthe Company maintains specific levels of spending and employment. The income tax benefit of this holiday wasapproximately $805,000, $343,000 and $395,000 in 2013, 2012 and 2011, respectively. The Company also had atax holiday for Outcome Europe Sarl in Switzerland for 2012 and 2011. The Company is in the process ofrenewing this tax holiday for an additional five years through 2018. The income tax benefit of this holiday wasapproximately $28,000 and $47,000 in 2012 and 2011, respectively. The tax holidays do not have a notableimpact on earnings per share.
104

18. Employee Benefit Plans
The Company has numerous employee retirement benefit plans, which cover substantially all eligibleemployees in the countries where the plans are offered either voluntarily or statutorily. Contributions areprimarily discretionary, except in some countries where contributions are contractually required.
Defined Contribution Plans
Defined contribution or profit sharing style plans are offered in Austria, Belgium, Bulgaria, Canada, theCzech Republic, Denmark, Finland, France, Germany, Hungary, India, Ireland, Israel, Malaysia, the Netherlands,Poland, Slovakia, South Africa, Sweden, Switzerland, Thailand, the United States and the United Kingdom. Insome cases these plans are required by local laws or regulations.
In the United States, the Company has a 401(k) Plan under which the Company matches employee deferralsat varying percentages, set at the discretion of the Board. In 2013, 2012 and 2011, the Company expensed $26.1million, $24.3 million and $19.9 million, respectively, related to matching contributions.
Defined Benefit Plans
Defined benefit plans are offered in Austria, France, Germany, India, Israel, Japan, Mexico, Philippines andthe United Kingdom. The following table summarizes the components of pension expense related to thesedefined benefit plans (in thousands):
Year Ended December 31,
2013 2012 2011
Service cost . . . . . . . . . . . . . . . . . . . . . . . . . . . . . . . . . . . . . . . . . . . . . . . . . . . . . . . $13,227 $13,839 $11,939Interest cost . . . . . . . . . . . . . . . . . . . . . . . . . . . . . . . . . . . . . . . . . . . . . . . . . . . . . . . 3,684 3,775 3,762Expected return on plan assets . . . . . . . . . . . . . . . . . . . . . . . . . . . . . . . . . . . . . . . . . (3,442) (2,822) (3,048)Amortization of prior service costs . . . . . . . . . . . . . . . . . . . . . . . . . . . . . . . . . . . . . 336 411 413Amortization of actuarial losses . . . . . . . . . . . . . . . . . . . . . . . . . . . . . . . . . . . . . . . . 708 758 902
$14,513 $15,961 $13,968
The Company expects to recognize approximately $78 and $670 in its pension expense in 2014 related tothe amortization of prior service costs and net actuarial losses, respectively.
The weighted average assumptions used in determining pension expense were as follows:
Year Ended December 31,
2013 2012 2011
Discount rate . . . . . . . . . . . . . . . . . . . . . . . . . . . . . . . . . . . . . . . . . . . . . . . . . . . . . . . 3.06% 3.32% 3.68%Rate of compensation increases . . . . . . . . . . . . . . . . . . . . . . . . . . . . . . . . . . . . . . . . 4.74% 4.96% 4.96%Expected return on plan assets . . . . . . . . . . . . . . . . . . . . . . . . . . . . . . . . . . . . . . . . . 5.33% 5.23% 6.17%
105

The following table summarizes financial information about the Company’s defined benefit plans asmeasured on December 31 (in thousands):
2013 2012
Projected benefit obligation January 1 . . . . . . . . . . . . . . . . . . . . . . . . . . . . . . . . . . . . . . . $130,323 $118,076Service costs . . . . . . . . . . . . . . . . . . . . . . . . . . . . . . . . . . . . . . . . . . . . . . . . . . . . . . . . . . . 13,227 13,839Interest cost . . . . . . . . . . . . . . . . . . . . . . . . . . . . . . . . . . . . . . . . . . . . . . . . . . . . . . . . . . . . 3,684 3,775Expected return on plan assets . . . . . . . . . . . . . . . . . . . . . . . . . . . . . . . . . . . . . . . . . . . . . (3,442) (2,822)Actuarial losses . . . . . . . . . . . . . . . . . . . . . . . . . . . . . . . . . . . . . . . . . . . . . . . . . . . . . . . . . 1,890 9,469Benefits paid . . . . . . . . . . . . . . . . . . . . . . . . . . . . . . . . . . . . . . . . . . . . . . . . . . . . . . . . . . . (5,917) (7,132)Foreign currency fluctuations and other . . . . . . . . . . . . . . . . . . . . . . . . . . . . . . . . . . . . . . (4,655) (4,882)
Projected benefit obligation December 31 . . . . . . . . . . . . . . . . . . . . . . . . . . . . . . . . . . . . $135,110 $130,323
Plan assets at fair value, January 1 . . . . . . . . . . . . . . . . . . . . . . . . . . . . . . . . . . . . . . . . . . $ 68,258 $ 55,590Actual return on plan assets . . . . . . . . . . . . . . . . . . . . . . . . . . . . . . . . . . . . . . . . . . . . . . . 5,928 4,551Contributions . . . . . . . . . . . . . . . . . . . . . . . . . . . . . . . . . . . . . . . . . . . . . . . . . . . . . . . . . . . 8,620 12,935Benefits paid . . . . . . . . . . . . . . . . . . . . . . . . . . . . . . . . . . . . . . . . . . . . . . . . . . . . . . . . . . . (5,917) (7,132)Foreign currency fluctuations and other . . . . . . . . . . . . . . . . . . . . . . . . . . . . . . . . . . . . . . 5,898 2,314
Plan assets at fair value, December 31 . . . . . . . . . . . . . . . . . . . . . . . . . . . . . . . . . . . . . . . $ 82,787 $ 68,258
Unfunded balance . . . . . . . . . . . . . . . . . . . . . . . . . . . . . . . . . . . . . . . . . . . . . . . . . . . . . . . $ 52,323 $ 62,065
The accumulated benefit obligation for all defined benefit plans was approximately $118.4 million and$111.7 million as of December 31, 2013 and 2012, respectively.
As of December 31, 2013, the projected benefit obligation and accumulated benefit obligation for thedefined benefit plans with accumulated benefit obligations in excess of plan assets were $77.7 million and $63.6million, respectively, and were primarily related to unfunded plans. As of December 31, 2012, the projectedbenefit obligation and accumulated benefit obligation for the defined benefit plans with accumulated benefitobligations in excess of plan assets were $71.0 million and $57.2 million, respectively, and were primarilyrelated to unfunded plans. As of December 31, 2013 and 2012, the projected benefit obligation exceeded the fairvalue of the plan assets for each defined benefit plan except for the defined benefit plan in the United Kingdomand one plan in India.
The following table summarizes the amounts recognized in the consolidated balance sheets related to thedefined benefit plans as of December 31 (in thousands):
2013 2012
Deposits and other assets . . . . . . . . . . . . . . . . . . . . . . . . . . . . . . . . . . . . . . . . . . . . . . . . . . $18,835 $10,523Accrued expenses . . . . . . . . . . . . . . . . . . . . . . . . . . . . . . . . . . . . . . . . . . . . . . . . . . . . . . . 8,622 9,787Other long-term liabilities . . . . . . . . . . . . . . . . . . . . . . . . . . . . . . . . . . . . . . . . . . . . . . . . . 62,536 62,801Accumulated other comprehensive income . . . . . . . . . . . . . . . . . . . . . . . . . . . . . . . . . . . $ (5,044) $ (8,235)
106

The following table summarizes the amounts recognized in accumulated other comprehensive incomerelated to the defined benefit plans (in thousands):
Prior ServiceCosts
ActuarialNet (Gain)
Loss
DeferredIncomeTaxes Total
Balance as of December 31, 2011 . . . . . . . . . . . . . . . . . . . . . . . . . . . $(854) $(3,934) $2,216 $(2,572)Reclassification adjustments included in pension expense:
Amortization . . . . . . . . . . . . . . . . . . . . . . . . . . . . . . . . . . . . . . . 411 758 (446) 723Amounts arising during the period:
Tax rate adjustments . . . . . . . . . . . . . . . . . . . . . . . . . . . . . . . . . — — (52) (52)Actuarial changes in benefit obligation . . . . . . . . . . . . . . . . . . . — (4,616) 1,496 (3,120)
Balance as of December 31, 2012 . . . . . . . . . . . . . . . . . . . . . . . . . . . (443) (7,792) 3,214 (5,021)Reclassification adjustments included in pension expense:
Amortization . . . . . . . . . . . . . . . . . . . . . . . . . . . . . . . . . . . . . . . 336 708 (389) 655Amounts arising during the period:
Tax rate adjustments . . . . . . . . . . . . . . . . . . . . . . . . . . . . . . . . . — — (26) (26)Actuarial changes in benefit obligation . . . . . . . . . . . . . . . . . . . — 2,147 157 2,304
Balance as of December 31, 2013 . . . . . . . . . . . . . . . . . . . . . . . . . . . $(107) $(4,937) $2,956 $(2,088)
The following table summarizes the weighted average assumptions used in determining the pensionobligations as of December 31:
Year Ended December 31,
2013 2012
Discount rate . . . . . . . . . . . . . . . . . . . . . . . . . . . . . . . . . . . . . . . . . . . . . . . . . . . . . . . . . . . . 3.01% 3.06%Rate of compensation increases . . . . . . . . . . . . . . . . . . . . . . . . . . . . . . . . . . . . . . . . . . . . . 4.36% 4.74%
The discount rate represents the interest rate used to determine the present value of the future cash flowscurrently expected to be required to settle the Company’s defined benefit plan obligations. The discount rates arederived using weighted average yield curves on AA-rated corporate bonds. The cash flows from the Company’sexpected benefit obligation payments are then matched to the yield curve to derive the discount rates.
The Company’s assumption for the expected return on plan assets was determined by the weighted averageof the long-term expected rate of return on each of the asset classes invested as of the balance sheet date. For planassets invested in government bonds, the expected return was based on the yields on the relevant indices as of thebalance sheet date. There is considerable uncertainty for the expected return on plan assets invested in equity anddiversified growth funds. The expected return on these plan assets was based on the expected return on long-termfixed interest rate government bonds as of the balance sheet date with a premium of 3% to 4% added to reflectthe expected long-term returns expected from these types of investments.
The Company’s investment objective for defined benefit plan assets is to meet the plan’s benefit obligationsand maintaining adequate funding, while minimizing the potential for future required Company contributions.The defined benefit plans in the United Kingdom, India and Israel are funded. The plan assets of the definedbenefit plans in India and Israel are held in a fund which holds debt investments, primarily government bonds inaccordance with local laws and regulations. The plan assets of the defined benefit plan in the United Kingdomare primarily held in funds which hold investments in government bonds, equity investments and diversifiedgrowth funds. The equity investments are diversified to include domestic (United Kingdom) and global equityinvestments. A “horizon based” approach is used to determine the asset allocation. Funds intended to meet theplan’s benefit obligation payments in a horizon period are invested in low risk assets such as bond investments.Funds intended to meet the plan’s benefit obligation payments outside of the horizon period are invested in more
107

volatile assets which are expected to provide a higher return such as equity investments and diversified growthfunds. The Company’s target allocation percentage for 2014 is approximately 40-50% in bond investments,35-45% in equity investments and 15-25% in diversified growth funds. However, the Company may reallocatethe plan assets between equity investments and bond investments depending upon the actual investmentperformances.
The Company’s plan assets have been identified within the fair value hierarchy as Level 2. Funds are valuedusing the net asset value reported by the managers of the funds. The following table summarizes the fair value ofthe Company’s defined benefit plans assets as of December 31, 2013 and 2012 (in thousands):
2013 2012
Funds that hold debt investments primarily government bonds . . . . . . . . . . . . . . . . . . . . . . $19,826 $31,315Funds that hold United Kingdom equity investments . . . . . . . . . . . . . . . . . . . . . . . . . . . . . . 8,393 22,924Funds that hold global equity investments . . . . . . . . . . . . . . . . . . . . . . . . . . . . . . . . . . . . . . 11,169 9,730Diversified growth fund . . . . . . . . . . . . . . . . . . . . . . . . . . . . . . . . . . . . . . . . . . . . . . . . . . . . 42,733 3,238Other . . . . . . . . . . . . . . . . . . . . . . . . . . . . . . . . . . . . . . . . . . . . . . . . . . . . . . . . . . . . . . . . . . . 661 1,051
Total . . . . . . . . . . . . . . . . . . . . . . . . . . . . . . . . . . . . . . . . . . . . . . . . . . . . . . . . . . . . . . . . . . . $82,782 $68,258
The Company estimates that it will make contributions totaling approximately $13.0 million to the definedbenefit plans in 2014.
The following table summarizes the Company’s expected benefit payments under the defined benefit plansfor each of the next five years and the aggregate of the five years thereafter (in thousands):
2014 . . . . . . . . . . . . . . . . . . . . . . . . . . . . . . . . . . . . . . . . . . . . . . . . . . . . . . . . . . . . . . . . . . . . . . . . . . . . $ 9,7692015 . . . . . . . . . . . . . . . . . . . . . . . . . . . . . . . . . . . . . . . . . . . . . . . . . . . . . . . . . . . . . . . . . . . . . . . . . . . . 9,3452016 . . . . . . . . . . . . . . . . . . . . . . . . . . . . . . . . . . . . . . . . . . . . . . . . . . . . . . . . . . . . . . . . . . . . . . . . . . . . 9,7852017 . . . . . . . . . . . . . . . . . . . . . . . . . . . . . . . . . . . . . . . . . . . . . . . . . . . . . . . . . . . . . . . . . . . . . . . . . . . . 10,9152018 . . . . . . . . . . . . . . . . . . . . . . . . . . . . . . . . . . . . . . . . . . . . . . . . . . . . . . . . . . . . . . . . . . . . . . . . . . . . 11,427Years 2019 through 2023 . . . . . . . . . . . . . . . . . . . . . . . . . . . . . . . . . . . . . . . . . . . . . . . . . . . . . . . . . . . . 61,590
$112,831
Stock Incentive Plans
The 2013 Stock Incentive Plan provides incentives to eligible employees, officers and directors in the formof non-qualified stock options, incentive stock options, SARs, restricted stock, RSUs, performance shares,performance units, covered annual incentive awards, cash-based awards and other share-based awards, in eachcase subject to the terms of the 2013 Stock Incentive Plan. As of December 31, 2013, there were 8,659,733shares available for future grants under the 2013 Stock Incentive Plan.
The 2008 Stock Incentive Plan provides incentives to eligible employees, officers and directors in the formof non-qualified stock options, incentive stock options, SARs, restricted stock, RSUs, performance shares,performance units, covered annual incentive awards, cash-based awards and other share-based awards, in eachcase subject to the terms of the 2008 Stock Incentive Plan. As of December 31, 2013, there were 970,257 sharesavailable for future grants under the 2008 Stock Incentive Plan.
Stock Options
The option price is determined by the Board at the date of grant and the options expire 10 years from thedate of grant. Beginning in May 2013, options were granted to certain employees with a vesting schedule of 33%on the third anniversary of the date of grant and 67% on the fourth anniversary of the date of grant. Additionally,
108

beginning in August 2012, options were granted to certain employees with a vesting schedule of 25% per yearbeginning on the first anniversary of the date of grant. Prior to August 2012, options were granted to certainemployees with a vesting schedule of 20% per year beginning on the first anniversary of the date of grant. Inaddition, an option to acquire 38,580 shares of the Company’s common stock was granted to the Company’sChief Executive Officer on May 31, 2012 which vests monthly over three years.
The Company’s stock option activity in 2013 is as follows:
Year Ended December 31,
Number ofOptions
WeightedAverage
Exercise PriceAggregate
Intrinsic Value
(in thousands)
Outstanding at December 31, 2012 . . . . . . . . . . . . . . . . . . . . . . . . . . . . 11,054,690 $17.17 $142,626Granted . . . . . . . . . . . . . . . . . . . . . . . . . . . . . . . . . . . . . . . . . . . . . 2,363,500 40.08Exercised . . . . . . . . . . . . . . . . . . . . . . . . . . . . . . . . . . . . . . . . . . . . (916,620) 13.68Cash settled . . . . . . . . . . . . . . . . . . . . . . . . . . . . . . . . . . . . . . . . . . (1,990,540) 13.74Canceled . . . . . . . . . . . . . . . . . . . . . . . . . . . . . . . . . . . . . . . . . . . . (410,870) 29.95
Outstanding at December 31, 2013 . . . . . . . . . . . . . . . . . . . . . . . . . . . . 10,100,160 $23.00 $235,729
The weighted average fair value per share of the options granted in 2013, 2012 and 2011 was $14.39, $6.34and $6.73, respectively. The total intrinsic value of options exercised was approximately $27.1 million, $4.6million and $1.5 million in 2013, 2012 and 2011, respectively. The Company received cash of approximately$12.5 million, $2.5 million and $1.1 million in 2013, 2012 and 2011, respectively, from options exercised.
Under the Company’s equity repurchase program discussed further in Note 12, in 2013 the Companyrepurchased 1,990,540 vested in-the-money employee stock options with an intrinsic value of $59.1 million.
Selected information regarding the Company’s stock options as of December 31, 2013 is as follows:
Options Outstanding Options Exercisable
Number of Options Exercise Price RangeWeighted Average
Exercise Price
Weighted AverageRemaining Life
(in Years) Number of OptionsWeighted Average
Exercise Price
1,845,650 $ 4.70 - $13.06 $11.20 3.30 1,771,650 $11.221,646,900 $13.40 - $15.88 $15.28 4.29 1,466,700 $15.361,692,755 $17.11 - $21.20 $19.27 6.94 788,595 $18.922,675,855 $21.22 - $24.59 $24.25 8.38 581,258 $24.21
128,500 $25.64 - $30.07 $28.23 9.00 13,375 $25.642,110,500 $40.00 - $44.75 $40.44 9.37 — $ —
The weighted average remaining contractual life of the options outstanding and exercisable as ofDecember 31, 2013 is 6.76 years and 4.72 years, respectively. The total aggregate intrinsic value of theexercisable stock options and the stock options expected to vest as of December 31, 2013 was approximately$232.1 million.
In connection with the November 2012 per share dividend discussed further in Note 12, the Boardauthorized a $2.09 per share reduction in the exercise price of certain non-vested and vested options outstandingon October 24, 2012. As such, the Company repriced 10,166,820 options previously granted to 228 employeesand directors. The other terms, including the vesting schedules, remained unchanged. The aggregate incrementalshare-based compensation expense resulting from the modification of these outstanding stock options wasapproximately $11.4 million, of which approximately $9.2 million was recognized during the three months endedDecember 31, 2012, and the remaining $2.2 million is being recognized over the remaining vesting periods of therespective stock options.
109

In connection with the February 2012 per share dividend discussed further in Note 12, the Board authorized a$2.82 per share reduction in the exercise price of all non-vested options and certain vested options outstanding onFebruary 29, 2012. As such, the Company repriced 5,561,700 options previously granted to 222 employees anddirectors. The other terms, including the vesting schedules, remained unchanged. The aggregate incremental share-based compensation expense resulting from the modification of these outstanding stock options was approximately$7.1 million, of which approximately $4.5 million was recognized during the three months ended March 31, 2012,and the remaining $2.6 million is being recognized over the remaining vesting periods of the respective stock options.
Stock Appreciation Rights
The Company’s SARs require the Company to settle in cash an amount equal to the difference between thefair value of the Company’s common stock on the date of exercise and the grant price, multiplied by the numberof SARs being exercised. These awards either (i) vest 25% per year or (ii) vest 33% on the third anniversary ofthe date of grant and 67% on the fourth anniversary of the date of grant.
The Company’s SAR activity in 2013 is as follows:
Year Ended December 31,
Number ofSARs
WeightedAverage
Exercise PriceAggregate
Intrinsic Value
(in thousands)Outstanding at December 31, 2012 . . . . . . . . . . . . . . . . . . . . . . . . . . . . . 94,250 $24.59 $ 516
Granted . . . . . . . . . . . . . . . . . . . . . . . . . . . . . . . . . . . . . . . . . . . . . . . 172,600 40.55Exercised . . . . . . . . . . . . . . . . . . . . . . . . . . . . . . . . . . . . . . . . . . . . . (4,225) 24.59Canceled . . . . . . . . . . . . . . . . . . . . . . . . . . . . . . . . . . . . . . . . . . . . . . (4,600) 24.59
Outstanding at December 31, 2013 . . . . . . . . . . . . . . . . . . . . . . . . . . . . . 258,025 $35.26 $2,858
As of December 31, 2013 and 2012, the weighted average fair value per share of the SARs granted was$19.07 and $8.16, respectively. The Company paid approximately $83,000 to settle exercised SARs in 2013.There were no SARs exercised in 2012.
The weighted average remaining contractual life of the SARs outstanding and exercisable as ofDecember 31, 2013 is 9.1 years and 8.6 years, respectively. The total aggregate intrinsic value of the exercisableSARs and the SARs expected to vest as of December 31, 2013 was approximately $2.8 million.
In connection with the November 2012 per share dividend discussed further in Note 12, the Company’sBoard authorized a $2.09 per share reduction in the exercise price of all non-vested cash-settled SARsoutstanding on October 24, 2012.
Restricted Stock Units
The Company’s RSUs will settle in shares of the Company’s common stock within 45 days of the applicablevesting date. One-third of the RSUs vest on the third anniversary of the date of grant and the remaining two-thirds of the RSUs vest on the fourth anniversary of the date of grant.
The Company’s RSU activity in 2013 is as follows:
Year Ended December 31,
Number ofRSUs
WeightedAverage
Grant-DateFair Value
Non-vested at December 31, 2012 . . . . . . . . . . . . . . . . . . . . . . . . . . . . . . . . . . . . . . . . . . . — $ —Granted . . . . . . . . . . . . . . . . . . . . . . . . . . . . . . . . . . . . . . . . . . . . . . . . . . . . . . . . . . . . 57,167 44.62
Non-vested at December 31, 2013 . . . . . . . . . . . . . . . . . . . . . . . . . . . . . . . . . . . . . . . . . . . 57,167 $44.62
110

As of December 31, 2013, there are 57,167 RSUs outstanding with an intrinsic value of approximately $2.6million.
Employee Stock Purchase Plan
In November 2013, the Board approved an Employee Stock Purchase Plan (“ESPP”) which will alloweligible employees to authorize payroll deductions of up to 10% of their base salary to be applied toward thepurchase of full shares of the Company’s common stock on the last day of the offering period. Offering periodsunder the ESPP will be six months in duration and will begin on each March 1 and September 1. The firstoffering period for the ESPP begins March 1, 2014. Shares will be purchased on the last day of each offeringperiod at a discount of 15% of the closing price of the common stock on such date as reported on the NYSE. Theaggregate number of shares of the Company’s common stock that may be issued under the ESPP may not exceed2,500,000 shares and no one employee may purchase any shares under the ESPP having a collective fair marketvalue greater than $25,000 in any one calendar year. The shares available for purchase under the ESPP will bedrawn from authorized but unissued shares of common stock.
Other
The Company sponsors a supplemental non-qualified deferred compensation plan, covering certainmanagement employees, and maintains other statutory indemnity plans as required by local laws or regulations.
During the fourth quarter of 2013, the Company recognized $14.1 million of severance expense associatedwith cost reduction programs (of which, $4.0 million is reflected in costs of revenue, service costs and $10.1million is reflected in selling, general and administrative expenses). The Company recognizes obligationsassociated with severance related to contractual termination benefits at fair value on the date that it is probablethat the affected employees will be entitled to the benefit and the amount can reasonably be estimated. The costreduction programs will result in the reduction of approximately 270 positions, which is expected to loweroperating costs and improve profitability by reducing excess capacities. These actions are expected to occur andbe paid during 2014 and 2015. As of December 31, 2013, $14.1 million was included in accrued expenses on theconsolidated balance sheet. No payments were made related to these cost reduction programs in 2013. Thesegment break down of the total severance expense related to these programs was $12.3 million in ProductDevelopment, $1.5 million in Integrated Healthcare Services and $0.3 million in unallocated corporate costs.
19. Related Party Transactions
As the Company has done in prior years, the Company reimburses its Executive Chairman for business-related travel services he provides for himself and other Company employees with the use of his own airplane. In2013, 2012 and 2011, the Company expensed approximately $2.7 million, $4.2 million and $4.9 million,respectively, for such business-related travel expenses. In the second quarter of 2013, the Company paid a $1.5million fee in connection with the modification of the agreement for the business usage of the airplane that limitsfuture reimbursements to $2.5 million per year.
During 2013, the Company entered into a number of contracts with HUYA, primarily in Asia, in which theCompany will provide up to approximately $19.2 million of services on a fee for services basis at arm’s lengthand at market rates. During 2013, the Company provided approximately $772,000 of services under theseagreements.
The Company has entered into other transactions with related parties including the funding of research anddevelopment costs which is discussed in Note 1; investments in and advances to unconsolidated affiliates whichare discussed in Note 4; and management fees which are discussed in Note 13.
111

20. Operations by Geographic Location
The table below presents the Company’s operations by geographical location. The Company attributesrevenues to geographical locations based upon where the services are performed. The Company’s operationswithin each geographical region are further broken down to show each country which accounts for 10% or moreof the totals (in thousands):
Year Ended December 31,
2013 2012 2011
Service revenues:Americas:
United States . . . . . . . . . . . . . . . . . . . . . . . . . . . . . . . . . . . . . . . . . . . $1,351,160 $1,288,990 $1,054,379Other . . . . . . . . . . . . . . . . . . . . . . . . . . . . . . . . . . . . . . . . . . . . . . . . . 181,814 180,568 160,593
Americas . . . . . . . . . . . . . . . . . . . . . . . . . . . . . . . . . . . . . . . . . . 1,532,974 1,469,558 1,214,972Europe and Africa:
United Kingdom . . . . . . . . . . . . . . . . . . . . . . . . . . . . . . . . . . . . . . . . 362,242 344,852 321,146Other . . . . . . . . . . . . . . . . . . . . . . . . . . . . . . . . . . . . . . . . . . . . . . . . . 1,139,262 1,086,065 1,052,424
Europe and Africa . . . . . . . . . . . . . . . . . . . . . . . . . . . . . . . . . . . 1,501,504 1,430,917 1,373,570Asia-Pacific:
Japan . . . . . . . . . . . . . . . . . . . . . . . . . . . . . . . . . . . . . . . . . . . . . . . . . 438,882 500,280 449,300Other . . . . . . . . . . . . . . . . . . . . . . . . . . . . . . . . . . . . . . . . . . . . . . . . . 334,980 291,543 257,124
Asia-Pacific . . . . . . . . . . . . . . . . . . . . . . . . . . . . . . . . . . . . . . . . 773,862 791,823 706,424
Total service revenues . . . . . . . . . . . . . . . . . . . . . . . . . . . . . . . . . . . . . . . . 3,808,340 3,692,298 3,294,966Reimbursed expenses . . . . . . . . . . . . . . . . . . . . . . . . . . . . . . . . . . . . . . . . 1,291,205 1,173,215 1,032,782
Total revenues . . . . . . . . . . . . . . . . . . . . . . . . . . . . . . . . . . . . . . . . . . . . . . $5,099,545 $4,865,513 $4,327,748
As of December 31,
2013 2012
Property, equipment and software, net:Americas:
United States . . . . . . . . . . . . . . . . . . . . . . . . . . . . . . . . . . . . . . . . . . . . . . . . . . . . . $ 168,380 $ 162,365Other . . . . . . . . . . . . . . . . . . . . . . . . . . . . . . . . . . . . . . . . . . . . . . . . . . . . . . . . . . . 2,146 2,717
Americas . . . . . . . . . . . . . . . . . . . . . . . . . . . . . . . . . . . . . . . . . . . . . . . . . . . . 170,526 165,082Europe and Africa:
United Kingdom . . . . . . . . . . . . . . . . . . . . . . . . . . . . . . . . . . . . . . . . . . . . . . . . . . 50,043 53,847Other . . . . . . . . . . . . . . . . . . . . . . . . . . . . . . . . . . . . . . . . . . . . . . . . . . . . . . . . . . . 18,246 19,549
Europe and Africa . . . . . . . . . . . . . . . . . . . . . . . . . . . . . . . . . . . . . . . . . . . . . 68,289 73,396Asia-Pacific:
Japan . . . . . . . . . . . . . . . . . . . . . . . . . . . . . . . . . . . . . . . . . . . . . . . . . . . . . . . . . . . 26,096 17,605Other . . . . . . . . . . . . . . . . . . . . . . . . . . . . . . . . . . . . . . . . . . . . . . . . . . . . . . . . . . . 27,574 27,940
Asia-Pacific . . . . . . . . . . . . . . . . . . . . . . . . . . . . . . . . . . . . . . . . . . . . . . . . . . 53,670 45,545
Total property, equipment and software, net . . . . . . . . . . . . . . . . . . . . . . . . . . . . . . . . $ 292,485 $ 284,023
21. Segments
The following table presents the Company’s operations by reportable segment. The Company is managedthrough two reportable segments, Product Development and Integrated Healthcare Services. ProductDevelopment, which primarily serves biopharmaceutical customers engaged in research and development,provides clinical research and clinical trial services. Integrated Healthcare Services provides commercializationservices to biopharmaceutical customers and research, analytics, outcomes research consulting, and otherservices to both biopharmaceutical customers and the broader healthcare market.
112

Certain costs are not allocated to the Company’s segments and are reported as general corporate andunallocated expenses. These costs primarily consist of share-based compensation and expenses for corporateoverhead functions such as finance, human resources, information technology, facilities and legal, as well ascertain expenses incurred in the second quarter of 2013 including the $25.0 million fee incurred in connectionwith the termination of the management agreement with affiliates of certain shareholders and the $1.5 million feepaid in connection with the modification of an agreement for the business usage of an airplane owned by GFM, acompany owned by the Company’s Executive Chairman. The Company does not allocate restructuring orimpairment charges to its segments. Information presented below is in thousands:
Year Ended December 31,
2013 2012 2011
Service revenuesProduct Development $2,919,730 $2,728,695 $2,437,822Integrated Healthcare Services 888,610 963,603 857,144
Total service revenues 3,808,340 3,692,298 3,294,966Costs of revenue, service costsProduct Development 1,752,800 1,683,340 1,464,297Integrated Healthcare Services 718,626 776,027 688,708
Total costs of revenue, service costs 2,471,426 2,459,367 2,153,005Selling, general and administrative expensesProduct Development 604,663 567,500 548,784Integrated Healthcare Services 127,860 127,067 110,247General corporate and unallocated expenses 127,987 123,188 103,268
Total selling, general and administrative expenses 860,510 817,755 762,299Income from operationsProduct Development 562,267 477,855 424,741Integrated Healthcare Services 42,124 60,509 58,189General corporate and unallocated expenses (127,987) (123,188) (103,268)Restructuring costs (14,071) (18,741) (22,116)Impairment charges — — (12,295)
Total income from operations $ 462,333 $ 396,435 $ 345,251
As of December 31,
2013 2012 2011
AssetsProduct Development $2,571,502 $2,016,605 $1,814,062Integrated Healthcare Services 299,284 351,656 358,075General corporate and unallocated 196,011 130,892 150,780
Total assets $3,066,797 $2,499,153 $2,322,917
Year Ended December 31,
2013 2012 2011
Expenditures to acquire long-lived assetsProduct Development $ 72,609 $ 61,097 $ 66,415Integrated Healthcare Services 18,162 8,181 6,753General corporate and unallocated 1,574 2,058 2,511
Total expenditures to acquire long-lived assets $ 92,345 $ 71,336 $ 75,679
113

Year Ended December 31,
2013 2012 2011
Depreciation and amortization expenseProduct Development . . . . . . . . . . . . . . . . . . . . . . . . . . . . . . . . . . . . . . . . . . . . . . . $ 82,047 $68,825 $68,029Integrated Healthcare Services . . . . . . . . . . . . . . . . . . . . . . . . . . . . . . . . . . . . . . . . 20,475 24,366 19,785General corporate and unallocated . . . . . . . . . . . . . . . . . . . . . . . . . . . . . . . . . . . . . 4,982 5,097 4,190
Total depreciation and amortization expense . . . . . . . . . . . . . . . . . . . . . . . . . $107,504 $98,288 $92,004
22. Earnings Per Share
The following table reconciles the basic to diluted weighted average shares outstanding (in thousands):
Year Ended December 31,
2013 2012 2011
Basic weighted average common shares outstanding . . . . . . . . . . . . . . . . . . . . . . . 124,147 115,710 116,232Effect of dilutive stock options and share awards . . . . . . . . . . . . . . . . . . . . . . . . . . 3,715 2,086 1,704
Diluted weighted average common shares outstanding . . . . . . . . . . . . . . . . . . . . . . 127,862 117,796 117,936
The following table shows the weighted average number of outstanding stock options not included in thecomputation of diluted earnings per share as the effect of including such stock options in the computation wouldbe anti-dilutive (in thousands):
Year Ended December 31,
2013 2012 2011
Weighted average shares subject to anti-dilutive stock options and shareawards . . . . . . . . . . . . . . . . . . . . . . . . . . . . . . . . . . . . . . . . . . . . . . . . . . . . . . . . . . 1,765 2,363 1,929
Stock options and share awards will have a dilutive effect under the treasury method only when therespective period’s average market value of the Company’s common stock exceeds the exercise proceeds.
23. Comprehensive Income
Below is a summary of the components of accumulated other comprehensive (loss) income in 2013, 2012and 2011 (in thousands):
ForeignCurrency
TranslationMarketableSecurities
DerivativeInstrument
DefinedBenefit
PlanIncomeTaxes
AccumulatedOther
Comprehensive(Loss) Income
Balance at December 31, 2010 . . . . . . . $ 43,164 $ (94) $(14,208) $(4,387) $21,102 $ 45,577Other comprehensive (loss) income
before reclassifications . . . . . . . . . . . (17,276) (97) (26,032) (1,716) 13,830 (31,291)Reclassification adjustments . . . . . . . . . (531) — 13,895 1,315 (6,094) 8,585
Balance at December 31, 2011 . . . . . . . 25,357 (191) (26,345) (4,788) 28,838 22,871Other comprehensive (loss) income
before reclassifications . . . . . . . . . . . (6,045) 658 (10,698) (4,616) 2,614 (18,087)Reclassification adjustments . . . . . . . . . — — 3,501 1,169 (1,759) 2,911
Balance at December 31, 2012 . . . . . . . 19,312 467 (33,542) (8,235) 29,693 7,695Other comprehensive (loss) income
before reclassifications . . . . . . . . . . . (25,141) 5,241 (393) 2,147 1,331 (16,815)Reclassification adjustments . . . . . . . . . — — 13,080 1,044 (5,380) 8,744
Balance at December 31, 2013 . . . . . . . $ (5,829) $5,708 $(20,855) $(5,044) $25,644 $ (376)
114

Below is a summary of the reclassification adjustments from accumulated other comprehensive (loss)income into net income in 2013, 2012 and 2011 (in thousands):
Year Ended December 31,
2013 2012 2011
Foreign currency translation:Increase in equity in earnings of unconsolidated affiliates . . . . . . . . . . . . $ — $ — $ (531)
Total before income taxes . . . . . . . . . . . . . . . . . . . . . . . . . . . . . . . . . . . . . — — (531)Income taxes . . . . . . . . . . . . . . . . . . . . . . . . . . . . . . . . . . . . . . . . . . . . . . . . — — —
Total net of income taxes . . . . . . . . . . . . . . . . . . . . . . . . . . . . . . . . . . . . . . $ — $ — $ (531)
Losses (gains) on derivative instruments:Interest rate swaps—increase to interest expense . . . . . . . . . . . . . . . . . . . $12,582 $3,248 $ 3,968Interest rate swaps—increase to other expense . . . . . . . . . . . . . . . . . . . . . — — 11,630Foreign exchange forward contracts—reduction (increase) to service
revenues . . . . . . . . . . . . . . . . . . . . . . . . . . . . . . . . . . . . . . . . . . . . . . . . . 498 253 (1,703)
Total before income taxes . . . . . . . . . . . . . . . . . . . . . . . . . . . . . . . . . . . . . 13,080 3,501 13,895Income taxes . . . . . . . . . . . . . . . . . . . . . . . . . . . . . . . . . . . . . . . . . . . . . . . . 4,991 1,313 5,541
Total net of income taxes . . . . . . . . . . . . . . . . . . . . . . . . . . . . . . . . . . . . . . $ 8,089 $2,188 $ 8,354
Defined benefit plans:Amortization of prior service costs . . . . . . . . . . . . . . . . . . . . . . . . . . . . . . $ 336 $ 411 $ 413Amortization of actuarial losses . . . . . . . . . . . . . . . . . . . . . . . . . . . . . . . . . 708 758 902
Total before income taxes . . . . . . . . . . . . . . . . . . . . . . . . . . . . . . . . . . . . . 1,044 1,169 1,315Income taxes . . . . . . . . . . . . . . . . . . . . . . . . . . . . . . . . . . . . . . . . . . . . . . . . 389 446 553
Total net of income taxes . . . . . . . . . . . . . . . . . . . . . . . . . . . . . . . . . . . . . . $ 655 $ 723 $ 762
Amortization of prior service costs and actuarial losses are included in the computation of pension expensefor the Company’s defined benefit plans. See Note 18 for additional information.
24. Supplemental Cash Flow Information
The following table presents the Company’s supplemental cash flow information (in thousands):
Year Ended December 31,
2013 2012 2011
Supplemental Cash Flow Information:Interest paid, net of capitalized interest . . . . . . . . . . . . . . . . . . . . . . . . . . . $115,494 $127,133 $100,906Capitalized interest . . . . . . . . . . . . . . . . . . . . . . . . . . . . . . . . . . . . . . . . . . . — — 42Income taxes paid, net of refunds . . . . . . . . . . . . . . . . . . . . . . . . . . . . . . . 70,983 103,976 63,369
Non-cash Investing Activities:Acquisition of property and equipment utilizing capital leases . . . . . . . . . $ 3,761 $ 5,267 $ 5,096Fair value of contingent consideration payable in connection with
acquisitions . . . . . . . . . . . . . . . . . . . . . . . . . . . . . . . . . . . . . . . . . . . . . . . 14,300 1,990 6,165
115
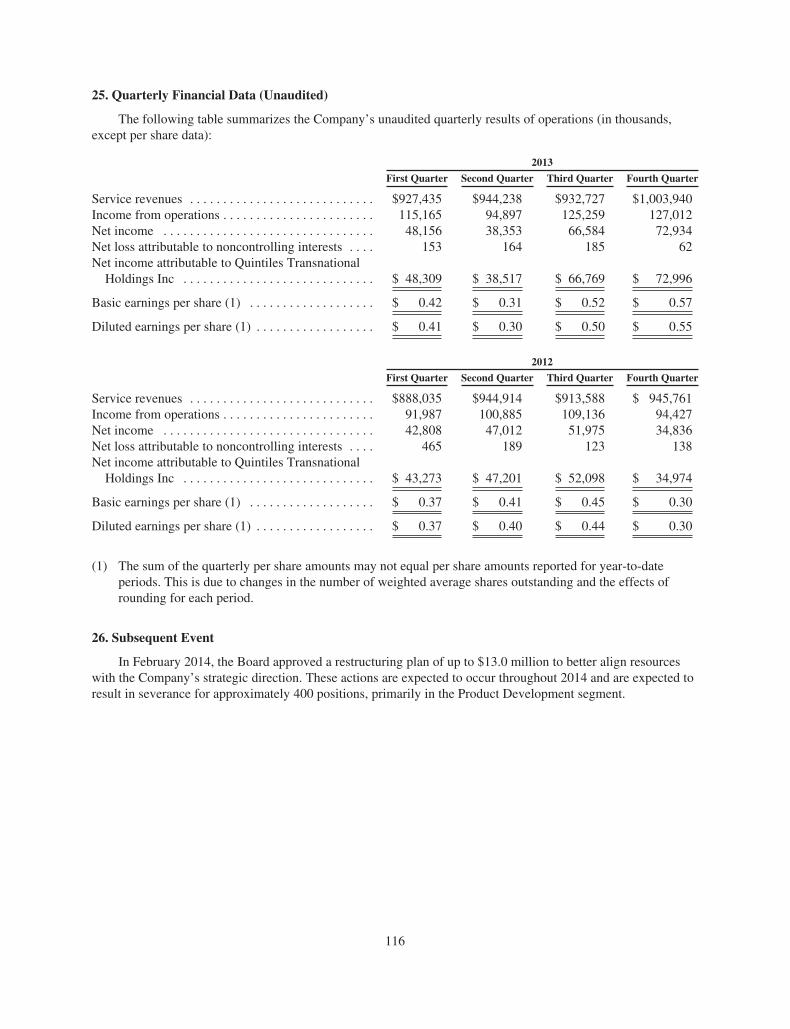
25. Quarterly Financial Data (Unaudited)
The following table summarizes the Company’s unaudited quarterly results of operations (in thousands,except per share data):
2013
First Quarter Second Quarter Third Quarter Fourth Quarter
Service revenues . . . . . . . . . . . . . . . . . . . . . . . . . . . . $927,435 $944,238 $932,727 $1,003,940Income from operations . . . . . . . . . . . . . . . . . . . . . . . 115,165 94,897 125,259 127,012Net income . . . . . . . . . . . . . . . . . . . . . . . . . . . . . . . . 48,156 38,353 66,584 72,934Net loss attributable to noncontrolling interests . . . . 153 164 185 62Net income attributable to Quintiles Transnational
Holdings Inc . . . . . . . . . . . . . . . . . . . . . . . . . . . . . $ 48,309 $ 38,517 $ 66,769 $ 72,996
Basic earnings per share (1) . . . . . . . . . . . . . . . . . . . $ 0.42 $ 0.31 $ 0.52 $ 0.57
Diluted earnings per share (1) . . . . . . . . . . . . . . . . . . $ 0.41 $ 0.30 $ 0.50 $ 0.55
2012
First Quarter Second Quarter Third Quarter Fourth Quarter
Service revenues . . . . . . . . . . . . . . . . . . . . . . . . . . . . $888,035 $944,914 $913,588 $ 945,761Income from operations . . . . . . . . . . . . . . . . . . . . . . . 91,987 100,885 109,136 94,427Net income . . . . . . . . . . . . . . . . . . . . . . . . . . . . . . . . 42,808 47,012 51,975 34,836Net loss attributable to noncontrolling interests . . . . 465 189 123 138Net income attributable to Quintiles Transnational
Holdings Inc . . . . . . . . . . . . . . . . . . . . . . . . . . . . . $ 43,273 $ 47,201 $ 52,098 $ 34,974
Basic earnings per share (1) . . . . . . . . . . . . . . . . . . . $ 0.37 $ 0.41 $ 0.45 $ 0.30
Diluted earnings per share (1) . . . . . . . . . . . . . . . . . . $ 0.37 $ 0.40 $ 0.44 $ 0.30
(1) The sum of the quarterly per share amounts may not equal per share amounts reported for year-to-dateperiods. This is due to changes in the number of weighted average shares outstanding and the effects ofrounding for each period.
26. Subsequent Event
In February 2014, the Board approved a restructuring plan of up to $13.0 million to better align resourceswith the Company’s strategic direction. These actions are expected to occur throughout 2014 and are expected toresult in severance for approximately 400 positions, primarily in the Product Development segment.
116
Item 9. Changes in and Disagreements with Accountants on Accounting and Financial Disclosure
None.
Item 9A. Controls and Procedures
As required by Rule 13a-15 under the Exchange Act, as amended, we carried out an evaluation under thesupervision and with the participation of our management, including the CEO and CFO, of the effectiveness ofthe design and operation of our disclosure controls and procedures. There are inherent limitations to theeffectiveness of any system of disclosure controls and procedures, including the possibility of human error andthe circumvention or overriding of the controls and procedures. Accordingly, even effective disclosure controlsand procedures can only provide reasonable assurance of achieving their control objectives. Based upon ourevaluation, our CEO and CFO concluded that our disclosure controls and procedures were effective to providereasonable assurance that information required to be disclosed by us in the reports that we file or submit underthe Exchange Act, as amended, is recorded, processed, summarized and reported within the time periodsspecified in the applicable rules and forms, and that it is accumulated and communicated to our management,including our CEO and CFO, as appropriate, to allow timely decisions regarding required disclosure.
There has been no change in our internal control over financial reporting during the quarter endedDecember 31, 2013 that has materially affected, or is reasonably likely to materially affect, our internal controlover financial reporting.
This Annual Report on Form 10-K does not include a report of management’s assessment regarding internalcontrol over financial reporting or an attestation report of our registered public accounting firm due to a transitionperiod established by rules of the SEC for newly public companies.
Item 9B. Other Information
None.
117

PART III
Item 10. Directors, Executive Officers and Corporate Governance
Information regarding directors, executive officers and other key employees and information regarding auditcommittee members and any audit committee financial experts called for by this item is incorporated byreference to our proxy statement to be filed with the SEC within 120 days of the end of our fiscal year endedDecember 31, 2013 for the 2014 Annual Meeting of Shareholders, or the “2014 Proxy Statement.”
Information regarding Section 16(a) reporting compliance called for by this item is incorporated byreference to “Section 16(a) Beneficial Ownership Reporting Compliance” in the 2014 Proxy Statement.
We have adopted a code of conduct that applies to our directors, officers and employees, including ourprincipal executive officer, principal accounting officer, controller, or persons performing similar functions. Acopy of this code of conduct is posted on the investor relations portion of our website at www.quintiles.com. Inthe event the code of conduct is revised, or any waiver is granted under the code of conduct with respect to ourprincipal executive officer, principal accounting officer, controller, or persons performing similar functions,notice of such revision or waiver will be posted on our website or disclosed on a Form 8-K as required.
Item 11. Executive Compensation
Information regarding executive and director compensation called for by this item is incorporated byreference to the 2014 Proxy Statement. Information included under the caption “Compensation CommitteeReport” in the 2014 Proxy Statement is incorporated by reference herein; however, this information shall not bedeemed to be “soliciting material” or to be “filed” with the SEC or subject to Regulation 14A or 14C, or theliabilities of Section 18 of the Exchange Act.
Item 12. Security Ownership of Certain Beneficial Owners and Management and Related StockholderMatters
Information regarding security ownership and securities authorized for issuance under equity compensationplans called for by this item is incorporated by reference to the 2014 Proxy Statement.
Item 13. Certain Relationships and Related Transactions and Director Independence
Information regarding certain relationships and related party transactions and director independence calledfor by this item is incorporated by reference to the 2014 Proxy Statement.
Item 14. Principal Accountant Fees and Services
Information regarding principal accountant fees and services called for by this item is incorporated byreference to the 2014 Proxy Statement.
118

PART IV
Item 15. Exhibits and Financial Statement Schedules
(a) The following documents are filed as part of this report:
(1) Financial Statements
The following consolidated financial statements of Quintiles Transnational Holdings Inc. and itssubsidiaries are included in Part II, Item 8 of this report:
Page
Report of Independent Registered Public Accounting Firm . . . . . . . . . . . . . . . . . . . . . . . . . . . . . . . . . . . . . . . 70Consolidated Statements of Income . . . . . . . . . . . . . . . . . . . . . . . . . . . . . . . . . . . . . . . . . . . . . . . . . . . . . . . . . 71Consolidated Statements of Comprehensive Income . . . . . . . . . . . . . . . . . . . . . . . . . . . . . . . . . . . . . . . . . . . . 72Consolidated Balance Sheets . . . . . . . . . . . . . . . . . . . . . . . . . . . . . . . . . . . . . . . . . . . . . . . . . . . . . . . . . . . . . . 73Consolidated Statements of Cash Flows . . . . . . . . . . . . . . . . . . . . . . . . . . . . . . . . . . . . . . . . . . . . . . . . . . . . . . 74Consolidated Statements of Shareholders’ Deficit . . . . . . . . . . . . . . . . . . . . . . . . . . . . . . . . . . . . . . . . . . . . . . 75Notes to Consolidated Financial Statements . . . . . . . . . . . . . . . . . . . . . . . . . . . . . . . . . . . . . . . . . . . . . . . . . . . 76
(2) Financial Statement Schedules
Schedule I—Condensed Financial Information of Registrant (Parent Company Only) . . . . . . . . . . . . . . . . . . 122Schedule II—Valuation and Qualifying Accounts . . . . . . . . . . . . . . . . . . . . . . . . . . . . . . . . . . . . . . . . . . . . . . 127
All other schedules are omitted, since the required information is not applicable or is not present in amountssufficient to require submission of the schedule, or because the information required is included in theconsolidated financial statements and notes thereto.
(3) Exhibits
The exhibits listed in the accompanying Exhibit Index following the signature page are filed or furnished asa part of this report and are incorporated herein by reference.
119

SIGNATURES
Pursuant to the requirements of Section 13 or 15(d) of the Securities Exchange Act of 1934, the registranthas duly caused this report to be signed on its behalf by the undersigned, thereunto duly authorized.
QUINTILES TRANSNATIONAL HOLDINGS INC.
By: /s/ Kevin K. Gordon
Name: Kevin K. GordonTitle: Executive Vice President and ChiefFinancial Officer
Date: February 13, 2014
Pursuant to the requirements of the Securities Exchange Act of 1934, this report has been signed below bythe following persons on behalf of the registrant in the capacities and on the dates indicated.
Signature Title Date
/s/ Thomas H. Pike
Thomas H. Pike
Chief Executive Officer and Director(Principal Executive Officer)
February 13, 2014
/s/ Kevin K. Gordon
Kevin K. Gordon
Executive Vice President and Chief Financial Officer(Principal Financial Officer)
February 13, 2014
/s/ Charles E. Williams
Charles E. Williams
Senior Vice President, Corporate Controller(Principal Accounting Officer)
February 13, 2014
/s/ Dennis B. Gillings, CBE
Dennis B. Gillings, CBE
Director February 13, 2014
/s/ Fred E. Cohen
Fred E. Cohen
Director February 13, 2014
/s/ John P. Connaughton
John P. Connaughton
Director February 13, 2014
/s/ Jonathan J. Coslet
Jonathan J. Coslet
Director February 13, 2014
/s/ Michael J. Evanisko
Michael J. Evanisko
Director February 13, 2014
/s/ Mireille G. Gillings
Mireille G. Gillings
Director February 13, 2014
/s/ Christopher R. Gordon
Christopher R. Gordon
Director February 13, 2014
120

Signature Title Date
/s/ Jack M. Greenberg
Jack M. Greenberg
Director February 13, 2014
/s/ Richard Relyea
Richard Relyea
Director February 13, 2014
/s/ Leonard D. Schaeffer
Leonard D. Schaeffer
Director February 13, 2014
121
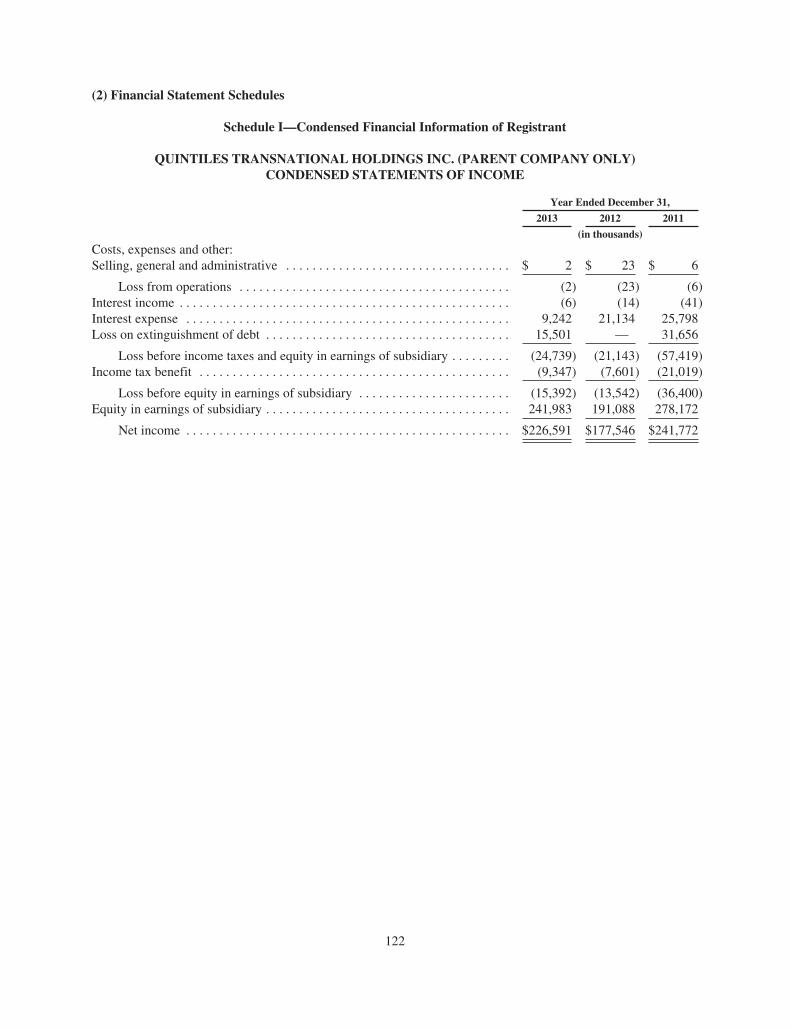
(2) Financial Statement Schedules
Schedule I—Condensed Financial Information of Registrant
QUINTILES TRANSNATIONAL HOLDINGS INC. (PARENT COMPANY ONLY)CONDENSED STATEMENTS OF INCOME
Year Ended December 31,
2013 2012 2011
(in thousands)
Costs, expenses and other:Selling, general and administrative . . . . . . . . . . . . . . . . . . . . . . . . . . . . . . . . . . $ 2 $ 23 $ 6
Loss from operations . . . . . . . . . . . . . . . . . . . . . . . . . . . . . . . . . . . . . . . . . (2) (23) (6)Interest income . . . . . . . . . . . . . . . . . . . . . . . . . . . . . . . . . . . . . . . . . . . . . . . . . . (6) (14) (41)Interest expense . . . . . . . . . . . . . . . . . . . . . . . . . . . . . . . . . . . . . . . . . . . . . . . . . 9,242 21,134 25,798Loss on extinguishment of debt . . . . . . . . . . . . . . . . . . . . . . . . . . . . . . . . . . . . . 15,501 — 31,656
Loss before income taxes and equity in earnings of subsidiary . . . . . . . . . (24,739) (21,143) (57,419)Income tax benefit . . . . . . . . . . . . . . . . . . . . . . . . . . . . . . . . . . . . . . . . . . . . . . . (9,347) (7,601) (21,019)
Loss before equity in earnings of subsidiary . . . . . . . . . . . . . . . . . . . . . . . (15,392) (13,542) (36,400)Equity in earnings of subsidiary . . . . . . . . . . . . . . . . . . . . . . . . . . . . . . . . . . . . . 241,983 191,088 278,172
Net income . . . . . . . . . . . . . . . . . . . . . . . . . . . . . . . . . . . . . . . . . . . . . . . . . $226,591 $177,546 $241,772
122

QUINTILES TRANSNATIONAL HOLDINGS INC. (PARENT COMPANY ONLY)CONDENSED STATEMENTS OF COMPREHENSIVE INCOME
Year Ended December 31,
2013 2012 2011
(in thousands)
Net income $226,591 $177,546 $241,772Unrealized gains (losses) on marketable securities, net of income taxes
of $2,016, $258 and ($37) . . . . . . . . . . . . . . . . . . . . . . . . . . . . . . . . . . . 3,225 400 (60)Unrealized gains (losses) on derivative instruments, net of income taxes
of ($751), ($4,392) and ($9,969) . . . . . . . . . . . . . . . . . . . . . . . . . . . . . . 358 (6,306) (16,063)Foreign currency translation, net of income taxes of ($2,465), $2,964
and ($3,851) . . . . . . . . . . . . . . . . . . . . . . . . . . . . . . . . . . . . . . . . . . . . . . (22,676) (9,009) (13,425)Defined benefit plan adjustment, net of income taxes of ($131), ($1,444)
and $27 . . . . . . . . . . . . . . . . . . . . . . . . . . . . . . . . . . . . . . . . . . . . . . . . . . 2,278 (3,172) (1,743)Reclassification adjustments:
Losses on derivative instruments included in net income, net of incometaxes of $4,991, $1,313 and $5,541 . . . . . . . . . . . . . . . . . . . . . . . . . . . . 8,089 2,188 8,354
Amortization of prior service costs and losses included in net income,net of income taxes of $389, $446 and $553 . . . . . . . . . . . . . . . . . . . . . 655 723 762
Foreign currency translation on sale of equity method investment . . . . . . — — (531)
Comprehensive income . . . . . . . . . . . . . . . . . . . . . . . . . . . . . . . . . . . $218,520 $162,370 $219,066
123

QUINTILES TRANSNATIONAL HOLDINGS INC. (PARENT COMPANY ONLY)CONDENSED BALANCE SHEETS
December 31,
2013 2012
(in thousands, except per share data)
ASSETSCurrent assets:
Cash and cash equivalents . . . . . . . . . . . . . . . . . . . . . . . . . . . . . . . . . . . . . . . $ 71,942 $ 2,411Prepaid expenses . . . . . . . . . . . . . . . . . . . . . . . . . . . . . . . . . . . . . . . . . . . . . . — 17Other current assets and receivables . . . . . . . . . . . . . . . . . . . . . . . . . . . . . . . 2,995 —
Total current assets . . . . . . . . . . . . . . . . . . . . . . . . . . . . . . . . . . . . . . . . 74,937 2,428
Deferred income taxes . . . . . . . . . . . . . . . . . . . . . . . . . . . . . . . . . . . . . . . . . . 44 348Deposits and other assets . . . . . . . . . . . . . . . . . . . . . . . . . . . . . . . . . . . . . . . . 26 5,097
Total assets . . . . . . . . . . . . . . . . . . . . . . . . . . . . . . . . . . . . . . . . . . . . . . $ 75,007 $ 7,873
LIABILITIES AND SHAREHOLDERS’ DEFICITCurrent liabilities:
Accrued expenses . . . . . . . . . . . . . . . . . . . . . . . . . . . . . . . . . . . . . . . . . . . . . $ — $ 63Income taxes payable . . . . . . . . . . . . . . . . . . . . . . . . . . . . . . . . . . . . . . . . . . 302 467
Total current liabilities . . . . . . . . . . . . . . . . . . . . . . . . . . . . . . . . . . . . . 302 530Long-term debt and obligations held under capital leases, less current
portion . . . . . . . . . . . . . . . . . . . . . . . . . . . . . . . . . . . . . . . . . . . . . . . . . . . . — 294,787Investment in subsidiary . . . . . . . . . . . . . . . . . . . . . . . . . . . . . . . . . . . . . . . . 739,115 1,068,952Payable to subsidiary . . . . . . . . . . . . . . . . . . . . . . . . . . . . . . . . . . . . . . . . . . . 3,003 3,127
Total liabilities . . . . . . . . . . . . . . . . . . . . . . . . . . . . . . . . . . . . . . . . . . . . 742,420 1,367,396
Commitments and contingenciesShareholders’ deficit:
Common stock and additional paid-in capital, 300,000 and 150,000 sharesauthorized at December 31, 2013 and 2012, respectively, $0.01 parvalue, 129,652 and 115,764 shares issued and outstanding atDecember 31, 2013 and 2012, respectively . . . . . . . . . . . . . . . . . . . . . . . 478,144 4,554
Accumulated deficit . . . . . . . . . . . . . . . . . . . . . . . . . . . . . . . . . . . . . . . . . . . (1,145,181) (1,371,772)Accumulated other comprehensive income . . . . . . . . . . . . . . . . . . . . . . . . . (376) 7,695
Total shareholders’ deficit . . . . . . . . . . . . . . . . . . . . . . . . . . . . . . . . . . . (667,413) (1,359,523)
Total liabilities and shareholders’ deficit . . . . . . . . . . . . . . . . . . . . . . . $ 75,007 $ 7,873
124

QUINTILES TRANSNATIONAL HOLDINGS INC. (PARENT COMPANY ONLY)CONDENSED STATEMENTS OF CASH FLOWS
Year Ended December 31,
2013 2012 2011
(in thousands)
Operating activities:Net income . . . . . . . . . . . . . . . . . . . . . . . . . . . . . . . . . . . . . . . . . . . . . . . . . . . $ 226,591 $ 177,546 $ 241,772Adjustments to reconcile net income to cash provided by operating
activities:Amortization of debt issuance costs and discount . . . . . . . . . . . . . . . . . 10,346 1,884 18,897Subsidiary income . . . . . . . . . . . . . . . . . . . . . . . . . . . . . . . . . . . . . . . . . (119,998) — —Provision for (benefit from) deferred income taxes . . . . . . . . . . . . . . . . 304 (70) 85
Change in operating assets and liabilities:Accounts receivable and unbilled services . . . . . . . . . . . . . . . . . . . . . . (2,995) — —Prepaid expenses and other assets . . . . . . . . . . . . . . . . . . . . . . . . . . . . . (21) (100) —Accounts payable and accrued expenses . . . . . . . . . . . . . . . . . . . . . . . . (62) 63 (155)Income taxes payable and other liabilities . . . . . . . . . . . . . . . . . . . . . . . (9,651) (7,531) (21,105)
Net cash provided by operating activities . . . . . . . . . . . . . . . . . . . 104,514 171,792 239,494Investing activities:
Investments in subsidiary, net of payments received . . . . . . . . . . . . . . . (179,847) 118,712 584,914
Net cash (used in) provided by investing activities . . . . . . . . . . . . (179,847) 118,712 584,914Financing activities:
Proceeds from issuance of debt . . . . . . . . . . . . . . . . . . . . . . . . . . . . . . . — 293,877 —Payment of debt issuance costs . . . . . . . . . . . . . . . . . . . . . . . . . . . . . . . — (5,988) —Repayment of debt . . . . . . . . . . . . . . . . . . . . . . . . . . . . . . . . . . . . . . . . . (300,000) — (525,000)Issuance of common stock . . . . . . . . . . . . . . . . . . . . . . . . . . . . . . . . . . . 525,000 3,466 1,114Payment of common stock issuance costs . . . . . . . . . . . . . . . . . . . . . . . (35,439) — —Exercise of stock options . . . . . . . . . . . . . . . . . . . . . . . . . . . . . . . . . . . . 12,539 — —Repurchase of common stock . . . . . . . . . . . . . . . . . . . . . . . . . . . . . . . . (6,434) (13,363) (14,324)Repurchase of stock options . . . . . . . . . . . . . . . . . . . . . . . . . . . . . . . . . . (50,649) — —Intercompany with subsidiary . . . . . . . . . . . . . . . . . . . . . . . . . . . . . . . . (153) 156 —Dividends paid to common shareholders . . . . . . . . . . . . . . . . . . . . . . . . — (567,851) (288,322)
Net cash provided by (used in) financing activities . . . . . . . . . . . . 144,864 (289,703) (826,532)
Increase (decrease) in cash and cash equivalents . . . . . . . . . . . . . . . . . . . . . . 69,531 801 (2,124)Cash and cash equivalents at beginning of period . . . . . . . . . . . . . . . . . . . . . 2,411 1,610 3,734
Cash and cash equivalents at end of period . . . . . . . . . . . . . . . . . . . . . . . . . . $ 71,942 $ 2,411 $ 1,610
125
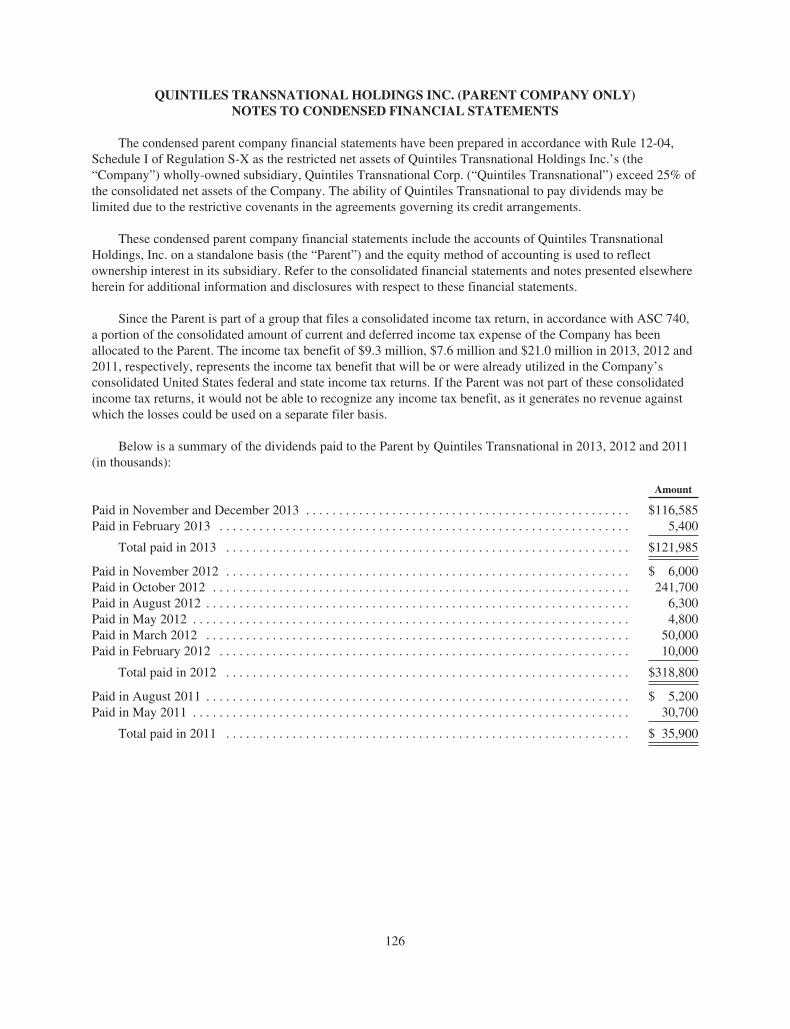
QUINTILES TRANSNATIONAL HOLDINGS INC. (PARENT COMPANY ONLY)NOTES TO CONDENSED FINANCIAL STATEMENTS
The condensed parent company financial statements have been prepared in accordance with Rule 12-04,Schedule I of Regulation S-X as the restricted net assets of Quintiles Transnational Holdings Inc.’s (the“Company”) wholly-owned subsidiary, Quintiles Transnational Corp. (“Quintiles Transnational”) exceed 25% ofthe consolidated net assets of the Company. The ability of Quintiles Transnational to pay dividends may belimited due to the restrictive covenants in the agreements governing its credit arrangements.
These condensed parent company financial statements include the accounts of Quintiles TransnationalHoldings, Inc. on a standalone basis (the “Parent”) and the equity method of accounting is used to reflectownership interest in its subsidiary. Refer to the consolidated financial statements and notes presented elsewhereherein for additional information and disclosures with respect to these financial statements.
Since the Parent is part of a group that files a consolidated income tax return, in accordance with ASC 740,a portion of the consolidated amount of current and deferred income tax expense of the Company has beenallocated to the Parent. The income tax benefit of $9.3 million, $7.6 million and $21.0 million in 2013, 2012 and2011, respectively, represents the income tax benefit that will be or were already utilized in the Company’sconsolidated United States federal and state income tax returns. If the Parent was not part of these consolidatedincome tax returns, it would not be able to recognize any income tax benefit, as it generates no revenue againstwhich the losses could be used on a separate filer basis.
Below is a summary of the dividends paid to the Parent by Quintiles Transnational in 2013, 2012 and 2011(in thousands):
Amount
Paid in November and December 2013 . . . . . . . . . . . . . . . . . . . . . . . . . . . . . . . . . . . . . . . . . . . . . . . . . $116,585Paid in February 2013 . . . . . . . . . . . . . . . . . . . . . . . . . . . . . . . . . . . . . . . . . . . . . . . . . . . . . . . . . . . . . . 5,400
Total paid in 2013 . . . . . . . . . . . . . . . . . . . . . . . . . . . . . . . . . . . . . . . . . . . . . . . . . . . . . . . . . . . . . $121,985
Paid in November 2012 . . . . . . . . . . . . . . . . . . . . . . . . . . . . . . . . . . . . . . . . . . . . . . . . . . . . . . . . . . . . . $ 6,000Paid in October 2012 . . . . . . . . . . . . . . . . . . . . . . . . . . . . . . . . . . . . . . . . . . . . . . . . . . . . . . . . . . . . . . . 241,700Paid in August 2012 . . . . . . . . . . . . . . . . . . . . . . . . . . . . . . . . . . . . . . . . . . . . . . . . . . . . . . . . . . . . . . . . 6,300Paid in May 2012 . . . . . . . . . . . . . . . . . . . . . . . . . . . . . . . . . . . . . . . . . . . . . . . . . . . . . . . . . . . . . . . . . . 4,800Paid in March 2012 . . . . . . . . . . . . . . . . . . . . . . . . . . . . . . . . . . . . . . . . . . . . . . . . . . . . . . . . . . . . . . . . 50,000Paid in February 2012 . . . . . . . . . . . . . . . . . . . . . . . . . . . . . . . . . . . . . . . . . . . . . . . . . . . . . . . . . . . . . . 10,000
Total paid in 2012 . . . . . . . . . . . . . . . . . . . . . . . . . . . . . . . . . . . . . . . . . . . . . . . . . . . . . . . . . . . . . $318,800
Paid in August 2011 . . . . . . . . . . . . . . . . . . . . . . . . . . . . . . . . . . . . . . . . . . . . . . . . . . . . . . . . . . . . . . . . $ 5,200Paid in May 2011 . . . . . . . . . . . . . . . . . . . . . . . . . . . . . . . . . . . . . . . . . . . . . . . . . . . . . . . . . . . . . . . . . . 30,700
Total paid in 2011 . . . . . . . . . . . . . . . . . . . . . . . . . . . . . . . . . . . . . . . . . . . . . . . . . . . . . . . . . . . . . $ 35,900
126

Schedule II—Valuation and Qualifying Accounts
Deferred Tax Asset Valuation Allowance
Information presented below is in thousands:
Additions
Balance atBeginning
of YearCharged toExpenses
Charged toOther
Accounts Deductions (a)Balance at
End of Year
December 31, 2013 . . . . . . . . . . . . . . . . . . . . . . . . $32,344 $3,611 $— $ (6,454) $29,501December 31, 2012 . . . . . . . . . . . . . . . . . . . . . . . . $31,669 $4,173 $— $ (3,498) $32,344December 31, 2011 . . . . . . . . . . . . . . . . . . . . . . . . $38,281 $4,883 $961 $(12,456) $31,669
(a) – Impact of reductions recorded to expense, dispositions and translation adjustments.
127
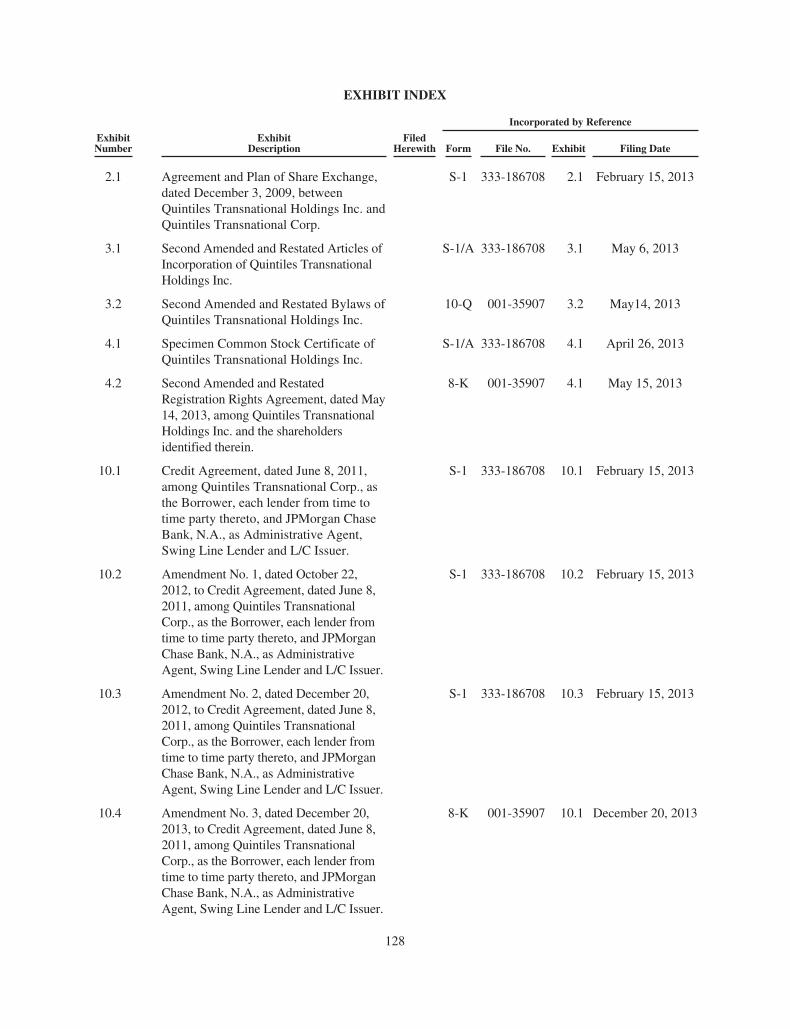
EXHIBIT INDEX
Incorporated by Reference
ExhibitNumber
ExhibitDescription
FiledHerewith Form File No. Exhibit Filing Date
2.1 Agreement and Plan of Share Exchange,dated December 3, 2009, betweenQuintiles Transnational Holdings Inc. andQuintiles Transnational Corp.
S-1 333-186708 2.1 February 15, 2013
3.1 Second Amended and Restated Articles ofIncorporation of Quintiles TransnationalHoldings Inc.
S-1/A 333-186708 3.1 May 6, 2013
3.2 Second Amended and Restated Bylaws ofQuintiles Transnational Holdings Inc.
10-Q 001-35907 3.2 May14, 2013
4.1 Specimen Common Stock Certificate ofQuintiles Transnational Holdings Inc.
S-1/A 333-186708 4.1 April 26, 2013
4.2 Second Amended and RestatedRegistration Rights Agreement, dated May14, 2013, among Quintiles TransnationalHoldings Inc. and the shareholdersidentified therein.
8-K 001-35907 4.1 May 15, 2013
10.1 Credit Agreement, dated June 8, 2011,among Quintiles Transnational Corp., asthe Borrower, each lender from time totime party thereto, and JPMorgan ChaseBank, N.A., as Administrative Agent,Swing Line Lender and L/C Issuer.
S-1 333-186708 10.1 February 15, 2013
10.2 Amendment No. 1, dated October 22,2012, to Credit Agreement, dated June 8,2011, among Quintiles TransnationalCorp., as the Borrower, each lender fromtime to time party thereto, and JPMorganChase Bank, N.A., as AdministrativeAgent, Swing Line Lender and L/C Issuer.
S-1 333-186708 10.2 February 15, 2013
10.3 Amendment No. 2, dated December 20,2012, to Credit Agreement, dated June 8,2011, among Quintiles TransnationalCorp., as the Borrower, each lender fromtime to time party thereto, and JPMorganChase Bank, N.A., as AdministrativeAgent, Swing Line Lender and L/C Issuer.
S-1 333-186708 10.3 February 15, 2013
10.4 Amendment No. 3, dated December 20,2013, to Credit Agreement, dated June 8,2011, among Quintiles TransnationalCorp., as the Borrower, each lender fromtime to time party thereto, and JPMorganChase Bank, N.A., as AdministrativeAgent, Swing Line Lender and L/C Issuer.
8-K 001-35907 10.1 December 20, 2013
128
Incorporated by Reference
ExhibitNumber
ExhibitDescription
FiledHerewith Form File No. Exhibit Filing Date
10.5 Credit Agreement, dated February 28,2012, among Quintiles TransnationalHoldings Inc., as the Borrower, eachlender from time to time party thereto,and JPMorgan Chase Bank, N.A., asAdministrative Agent.
S-1 333-186708 10.4 February 15, 2013
10.6 Shareholders Agreement, datedJanuary 22, 2008, among QuintilesTransnational Corp. and the shareholdersidentified therein.
S-1 333-186708 10.5 February 15, 2013
10.7 Supplement, effective August 9, 2012, toShareholders Agreement, datedJanuary 22, 2008, among QuintilesTransnational Corp. and the shareholdersidentified therein.
S-1 333-186708 10.6 February 15, 2013
10.8 Amendment No. 1, dated May 8, 2013, toShareholders Agreement, datedJanuary 22, 2008, among QuintilesTransnational Corp. and the shareholdersidentified therein.
10-Q 001-35907 10.1 May 14, 2013
10.9 Management Agreement, datedJanuary 22, 2008, among QuintilesTransnational Corp., Bain CapitalPartners, LLC, GF ManagementCompany, LLC, TPG Capital, L.P.,Cassia Fund Management Pte Ltd., 3iCorporation and Aisling Capital, LLC.
S-1 333-186708 10.8 February 15, 2013
10.10 Amendment No. 1, dated May 8, 2013, toManagement Agreement, dated January22, 2008, among Quintiles TransnationalCorp., Bain Capital Partners, LLC, GFManagement Company, LLC, TPGCapital, L.P., Cassia Fund ManagementPte Ltd., 3i Corporation and AislingCapital, LLC.
10-Q 001-35907 10.2 May 14, 2013
10.11 Management Rights Letter from QuintilesTransnational Corp. to Aisling Capital II,L.P.
S-1 333-186708 10.9 February 15, 2013
10.12 Amendment, dated May 8, 2013, toManagement Rights Letter from QuintilesTransnational Corp. to Aisling Capital II,L.P.
10-Q 001-35907 10.3 August 1, 2013
10.13 Management Rights Agreement betweenQuintiles Transnational Corp. and TPGBiotechnology Partners II, L.P.
S-1 333-186708 10.10 February 15, 2013
129

Incorporated by Reference
ExhibitNumber
ExhibitDescription
FiledHerewith Form File No. Exhibit Filing Date
10.14 Management Rights Agreement betweenQuintiles Transnational Corp. and 3iGrowth Healthcare Fund 2008 L.P.
S-1 333-186708 10.11 February 15, 2013
10.15 Amendment No. 1, dated May 8, 2013, toManagement Rights Agreement betweenQuintiles Transnational Corp. and 3iGrowth Healthcare Fund 2008 L.P.
10-Q 001-35907 10.4 August 1, 2013
10.16 Assignment and Assumption Agreement,dated December 10, 2009, betweenQuintiles Transnational Corp. andQuintiles Transnational Holdings Inc.
S-1 333-186708 10.12 February 15, 2013
10.17† Form of Director IndemnificationAgreement.
S-1/A 333-186708 10.13 April 19, 2013
10.18† Quintiles Transnational Holdings Inc.Annual Management Incentive Plan.
S-1/A 333-186708 10.57 April 19, 2013
10.19† Quintiles Transnational Holdings Inc.2003 Stock Incentive Plan.
S-1 333-186708 10.14 February 15, 2013
10.20† Form of Stock Option Award Agreementunder the Quintiles TransnationalHoldings Inc. 2003 Stock Incentive Plan.
S-1 333-186708 10.15 February 15, 2013
10.21† Form of Restricted Stock PurchaseAgreement under the QuintilesTransnational Holdings Inc. 2003 StockIncentive Plan.
S-1 333-186708 10.16 February 15, 2013
10.22† Quintiles Transnational Holdings Inc.2008 Stock Incentive Plan.
S-1 333-186708 10.17 February 15, 2013
10.23† Form of Stock Option Award Agreementfor Senior Executives under the QuintilesTransnational Holdings Inc. 2008 StockIncentive Plan.
S-1 333-186708 10.18 February 15, 2013
10.24† Form of Stock Option Award Agreementfor Non-Employee Directors under theQuintiles Transnational Holdings Inc.2008 Stock Incentive Plan.
S-1 333-186708 10.19 February 15, 2013
10.25† Quintiles Transnational Corp. ElectiveDeferred Compensation Plan, as amendedand restated.
S-1 333-186708 10.20 February 15, 2013
10.26† Quintiles Transnational Corp. ElectiveDeferred Compensation Plan (Amendedand Restated for Deferrals On and AfterJanuary 1, 2005).
S-1 333-186708 10.21 February 15, 2013
10.27† Quintiles Transnational Holdings Inc.2013 Stock Incentive Plan.
S-1/A 333-186708 10.22 April 19, 2013
130
Incorporated by Reference
ExhibitNumber
ExhibitDescription
FiledHerewith Form File No. Exhibit Filing Date
10.28† Form of Award Agreement AwardingNonqualified Stock Options toEmployees under the QuintilesTransnational Holdings Inc. 2013 StockIncentive Plan.
S-1/A 333-186708 10.23 April 19, 2013
10.29† Form of Award Agreement AwardingNonqualified Stock Options to Non-Employee Directors under the QuintilesTransnational Holdings Inc. 2013 StockIncentive Plan.
S-1/A 333-186708 10.24 April 19, 2013
10.30† Form of Award Agreement AwardingStock Appreciation Rights under theQuintiles Transnational Holdings Inc.2013 Stock Incentive Plan.
S-1/A 333-186708 10.56 April 19, 2013
10.31† Form of Award Agreement AwardingRestricted Stock Units under theQuintiles Transnational Holdings Inc.2013 Stock Incentive Plan.
8-K 001-35907 10.1 November 26, 2013
10.32† Quintiles Transnational Holdings Inc.Employee Stock Purchase Plan.
S-8 333-193212 10.1 January 6, 2014
10.33† Executive Employment Agreement, datedSeptember 25, 2003, among DennisB. Gillings, Pharma Services Holding,Inc. and Quintiles Transnational Corp.
S-1 333-186708 10.26 February 15, 2013
10.34† Assignment and Assumption Agreement,dated March 31, 2006, among PharmaServices Holding, Inc., QuintilesTransnational Corp., and Dennis B.Gillings.
S-1 333-186708 10.27 February 15, 2013
10.35† Amendment, dated February 1, 2008, toExecutive Employment Agreement, datedSeptember 25, 2003, between DennisB. Gillings and Quintiles TransnationalCorp.
S-1 333-186708 10.28 February 15, 2013
10.36† Agreement and Amendment, effectiveDecember 12, 2008, to ExecutiveEmployment Agreement, datedSeptember 25, 2003, between DennisB. Gillings and Quintiles TransnationalCorp.
S-1 333-186708 10.29 February 15, 2013
10.37† Third Amendment, dated December 31,2008, to Executive Employment Agreement,dated September 25, 2003, between DennisB. Gillings and Quintiles TransnationalCorp.
S-1 333-186708 10.30 February 15, 2013
131

Incorporated by Reference
ExhibitNumber
ExhibitDescription
FiledHerewith Form File No. Exhibit Filing Date
10.38† Fourth Amendment, dated December 14,2009, to Executive Employment Agreement,dated September 25, 2003, between DennisB. Gillings and Quintiles TransnationalCorp.
S-1 333-186708 10.31 February 15, 2013
10.39† Fifth Amendment, dated April 18, 2013,to Executive Employment Agreement,dated September 25, 2003, betweenDennis B. Gillings and QuintilesTransnational Corp.
S-1/A 333-186708 10.32 April 19, 2013
10.40 Rollover Agreement, dated August 28,2003, among Pharma Services Holding,Inc., Dennis B. Gillings, Joan H. Gillings,Susan Ashley Gillings, the Gillings FamilyFoundation, the Gillings LimitedPartnership and the GFEF LimitedPartnership.
S-1 333-186708 10.33 February 15, 2013
10.41 Amendment No. 1, dated September 23,2003, to Rollover Agreement, datedAugust 28, 2003, among Pharma ServicesHolding, Inc., Dennis B. Gillings, Joan H.Gillings, Susan Ashley Gillings, theGillings Family Foundation, the GillingsLimited Partnership and the GFEFLimited Partnership.
S-1 333-186708 10.34 February 15, 2013
10.42† Stock Option Award Agreement, datedJune 30, 2008, between QuintilesTransnational Corp. and Dennis B.Gillings.
S-1 333-186708 10.35 February 15, 2013
10.43† Executive Employment Agreement,effective April 30, 2012, betweenThomas H. Pike and QuintilesTransnational Corp.
S-1 333-186708 10.36 February 15, 2013
10.44† Subscription Agreement, effectiveMay 31, 2012, between Thomas H. Pikeand Quintiles Transnational Holdings Inc.
S-1 333-186708 10.37 February 15, 2013
10.45† Stock Option Award Agreement, datedMay 10, 2012, between QuintilesTransnational Holdings Inc. and ThomasH. Pike.
S-1 333-186708 10.38 February 15, 2013
10.46† Stock Option Award Agreement, datedMay 31, 2012, between QuintilesTransnational Holdings Inc. and Thomas H.Pike.
S-1 333-186708 10.39 February 15, 2013
132

Incorporated by Reference
ExhibitNumber
ExhibitDescription
FiledHerewith Form File No. Exhibit Filing Date
10.47† Executive Employment Agreement,effective July 30, 2010, between KevinK. Gordon and Quintiles TransnationalCorp.
S-1 333-186708 10.40 February 15, 2013
10.48† First Amendment to EmploymentAgreement, dated November 22, 2010, toExecutive Employment Agreement,effective July 30, 2010, between KevinK. Gordon and Quintiles TransnationalCorp.
S-1 333-186708 10.41 February 15, 2013
10.49† Executive Employment Agreement, datedJune 14, 2004, between John D. Ratliffand Quintiles Transnational Corp.
S-1 333-186708 10.42 February 15, 2013
10.50† Amendment, dated December 30, 2008,and Supplement, dated April 18, 2013, toExecutive Employment Agreement, datedJune 14, 2004, between John D. Ratliffand Quintiles Transnational Corp.
S-1/A 333-186708 10.43 April 19, 2013
10.51† Letter Agreement, dated September 19,2006, and effective October 20, 2006,between Quintiles Transnational Corp.and John D. Ratliff re promotion.
S-1 333-186708 10.44 February 15, 2013
10.52† Letter, dated August 22, 2005, to John D.Ratliff from Quintiles TransnationalCorp. re. Purchase of Pharma Shares.
S-1 333-186708 10.45 February 15, 2013
10.53† Letter, dated February 22, 2005, to JohnD. Ratliff from Quintiles TransnationalCorp. re. Purchase of Pharma Shares.
S-1 333-186708 10.46 February 15, 2013
10.54† Letter, dated December 6, 2004, to JohnD. Ratliff from Quintiles TransnationalCorp. re. Purchase of Pharma Shares.
S-1 333-186708 10.47 February 15, 2013
10.55† Executive Employment Agreement, datedJune 1, 2003, between Michael I.Mortimer and Quintiles TransnationalCorp.
S-1 333-186708 10.48 February 15, 2013
10.56† Amendment, dated January 9, 2004, toExecutive Employment Agreement, datedJune 1, 2003, between Michael I.Mortimer and Quintiles TransnationalCorp.
S-1 333-186708 10.49 February 15, 2013
10.57† Second Amendment, dated December 30,2008, to Executive EmploymentAgreement, dated June 1, 2003, betweenMichael I. Mortimer and QuintilesTransnational Corp.
S-1 333-186708 10.50 February 15, 2013
133

Incorporated by Reference
ExhibitNumber
ExhibitDescription
FiledHerewith Form File No. Exhibit Filing Date
10.58† Letter, dated February 22, 2005, toMichael I. Mortimer from PharmaServices Holding, Inc. re. Purchase ofPharma Shares.
S-1 333-186708 10.51 February 15, 2013
10.59† Letter, dated February 5, 2004, toMichael I. Mortimer from PharmaServices Holding, Inc. re. Opportunity toPurchase Shares.
S-1 333-186708 10.52 February 15, 2013
10.60† Amended Executive EmploymentAgreement, dated July 26, 2005, betweenDerek Winstanly and QuintilesTransnational Corp.
S-1 333-186708 10.53 February 15, 2013
10.61† First Amendment, dated December 30,2008, to Amended ExecutiveEmployment Agreement, dated July 26,2005, between Derek Winstanly andQuintiles Transnational Corp.
S-1 333-186708 10.54 February 15, 2013
10.62† Letter, dated October 30, 2003, to DerekWinstanly from Pharma ServicesHolding, Inc. re. Opportunity to PurchaseShares.
S-1 333-186708 10.55 February 15, 2013
10.63† Description of Independent DirectorCompensation.
S-1/A 333-186708 10.59 April 26, 2013
21.1 List of Subsidiaries of QuintilesTransnational Holdings Inc.
X
23.1 Consent of PricewaterhouseCoopers LLP. X
31.1 Certification of Chief Executive Officer,pursuant to Rule 13a-14(a)/15d-14(a), asadopted pursuant to Section 302 of theSarbanes-Oxley Act of 2002.
X
31.2 Certification of Executive Vice Presidentand Chief Financial Officer, pursuant toRule 13a-14(a)/15d-14(a), as adoptedpursuant to Section 302 of the Sarbanes-Oxley Act of 2002.
X
32.1 Certification of Chief Executive Officer,pursuant to 18 U.S.C. Section 1350, asadopted pursuant to Section 906 of theSarbanes-Oxley Act of 2002.
X
32.2 Certification of Executive Vice Presidentand Chief Financial Officer, pursuant to18 U.S.C. Section 1350, as adoptedpursuant to Section 906 of the Sarbanes-Oxley Act of 2002.
X
134

Incorporated by Reference
ExhibitNumber
ExhibitDescription
FiledHerewith Form File No. Exhibit Filing Date
101* Interactive Data Files Pursuant toRule 405 of Regulation S-T: (i)Consolidated Statements of Income, (ii)Consolidated Statements ofComprehensive Income, (iii)Consolidated Balance Sheets, (iv)Consolidated Statements of Cash Flows,and (v) Notes to Consolidated FinancialStatements
X
† Indicates management contract or compensatory plan or arrangement.* Pursuant to Rule 406T of Regulation S-T, the Interactive Data Files in Exhibit 101 hereto are deemed not filed
or part of a registration statement or prospectus for purposes of Sections 11 or 12 of the Securities Act of 1933,as amended, are deemed not filed for purposes of Section 18 of the Securities and Exchange Act of 1934, asamended, and otherwise are not subject to liability under those sections.
135


