+ All Categories
Home > Documents > 2013 SRS M&A Post-Closing Claims Study · PDF fileUnmatched dispute resolution and litigation...

2013 SRS M&A Post-Closing Claims Study · PDF fileUnmatched dispute resolution and litigation...

Date post: 08-Feb-2018
Category:
Upload: hoangcong
View: 219 times
Download: 1 times
Share this document with a friend
56
2012 SRS Life Sciences M&A Study 1 © 2013 Shareholder Representative Services LLC. All rights reserved. www.shareholderrep.com 2013 SRS M&A Post-Closing Claims Study 1 © 2013 Shareholder Representative Services LLC. All rights reserved. www.shareholderrep.com 2013 SRS M&A Post-Closing Claims Study An analysis of post-closing claims in private-target M&A transactions For more information, please contact SRS at [email protected]
Transcript

2012 SRS Life Sciences M&A Study | 1 © 2013 Shareholder Representative Services LLC. All rights reserved. www.shareholderrep.com

2013 SRS M&A Post-Closing Claims Study | 1 © 2013 Shareholder Representative Services LLC. All rights reserved. www.shareholderrep.com

2013 SRS M&A Post-Closing Claims Study An analysis of post-closing claims in private-target M&A transactions

For more information, please contact SRS at [email protected]

2012 SRS Life Sciences M&A Study | 2 © 2013 Shareholder Representative Services LLC. All rights reserved. www.shareholderrep.com

2013 SRS M&A Post-Closing Claims Study | 2

A closed deal is not a done deal. Anything can happen after closing. A great variety of issues, often unpredicted, arise over the months and years following the sale. SRS has accumulated years of experience through hundreds of deals. When the stakes are high, shareholders require the most experienced post-closing team.

You worked hard to close the deal. Make sure you have the right representative to see it through.

The SRS Difference:

§  Unmatched dispute resolution and litigation management

SRS is the only firm with post-closing expertise based on the successful resolution of hundreds of claims and the completion of final escrow releases and earn-out milestone payments.

§  Post-closing escrow management, client support, online access, and monthly reporting

SRS offers superior client service by anticipating questions and issues that could arise and delivering information online 24/7.

§  Better escrow economics through Acquiom™

Acquiom provides a completely re-engineered M&A escrow, investment and payments service, which provides a superior client experience while reducing transaction expenses.

§  M&A analytics to drive better deals

SRS has the most extensive database of M&A deal-terms and post-closing claims from private company sales ever assembled.

SRS also offers SRS MAX™ for customized deal analytics, and SRS EscrowExchange™ for early escrow liquidity.

For more information visit: www.shareholderrep.com

About SRS | Shareholder Representative Services

About SRS

2012 SRS Life Sciences M&A Study | 3 © 2013 Shareholder Representative Services LLC. All rights reserved. www.shareholderrep.com

2013 SRS M&A Post-Closing Claims Study | 3

§  The SRS M&A Post-Closing Claims Study Sample The 2013 SRS M&A Post-Closing Claims Study analyzes post-closing escrow claim activity across 420 private-target acquisitions on which SRS served as the shareholder representative from 2007 through Q1 2013 (the 2011 study analyzed claims from 2007 through the end of Q1 2011). 200 deals in this study have reached a point at which no escrow-based indemnification obligations remain for shareholders (“expired-escrow deals”), allowing us to analyze claim activity over the life of these deals. Across all deals, this study reports on nearly 700 individual claims totaling over $850 million in claimed merger consideration that SRS has managed.

§  Why Our Study is Unique As shareholder representative, SRS has access to seller management, shareholders, and all deal documents, and manages all post-closing matters. Most information from these sources is not publicly available or reported in other studies. Our goal is to arm deal professionals who negotiate and advise on private-target transactions with robust, reliable sources of information that can’t be found elsewhere.

§  New data points in the 2013 Study on claims, payouts, and non-life science earn-outs

About this Study

Overview

•  $66.7 Billion in stated deal value

•  $51.0 Billion paid at closing

•  $6.7 Billion held in escrow

•  $9.0 Billion in defined earn-out consideration, plus uncapped potential payments

•  420 Acquisitions analyzed

•  Aggregate data on nearly 700 claims

•  367 Mergers, 36 stock purchases and 17 asset purchases

•  100 Deals with earn-outs

SRS received claim notices with varying levels of specificity, and the claim resolution process is not always the result of communication supported by formal documentation between the parties. Categorization of claim and resolution data is frequently subjective. Therefore, the conclusions presented in this study may be subject to important qualifications not expressly articulated herein. All information herein is subject to change.

2012 SRS Life Sciences M&A Study | 4 © 2013 Shareholder Representative Services LLC. All rights reserved. www.shareholderrep.com

2013 SRS M&A Post-Closing Claims Study | 4

§  Key Points............................................................................5 §  SRS Insights.........................................................................6 §  Deal Set Overview.................................................................7

•  Transaction Values...............................................................8 •  Target Company Industries...................................................9

•  Deal Structures and Buyers................................................10 •  Claim Types and Subject Matter.........................................11

§  Post-Closing Purchase Price Adjustments..........................12 •  Adjustment Direction and Key Figures................................13

•  Claim Sizes........................................................................14 §  Non-PPA Claim Activity.......................................................15

•  Claim Activity Generally......................................................16

•  Claim Sizes Generally.........................................................17 •  Claim Activity Based on Deal Characteristics......................18 •  Third-Party Claims Based on Transaction Value..................22

•  Claim Timing: 6-Month Mark..............................................23 •  Claim Timing: 3rd-Party vs. Buyer Claims............................24 •  Claim Timing: Final Week of Escrow Period........................25

•  Claim Timing: Escrow-Release Delays.................................26 •  Claim Resolution Methods........................................27

•  Claim Resolution Methods, by Claim Type...........................28 •  Claim Resolution Methods Over Time.................................29 •  Claim Resolution Time.......................................................30

•  Claim Payout Reductions...................................................31 •  Ultimate Escrow Payouts....................................................32 •  Baskets.........................................................................33

•  Expense Funds...................................................................34 §  Earn-outs............................................................................35

§  Analysis of Individual Claim Types.....................................37 •  Appraisal Rights Claims.....................................................38 •  Breach of Fiduciary Duty Claims........................................39

•  Breach of Capitalization Representation Claims..................40 •  Breach of Customer Contract Representation Claims..........41

•  Breach of Employee-related Representation Claims............42 •  Fees/Costs Claims.............................................................43 •  Breach of Financial Statement Representation Claims........44

•  Fraud Claims.....................................................................45 •  Breach of Intellectual Property Representation Claims.......46 •  Breach of Regulatory Compliance Representation Claims...47

•  Breach of Tax Representation Claims.................................48 •  Breach of Undisclosed Liabilities Representation Claims....49

§  Glossary.............................................................................50

Table of Contents

Table of Contents

2012 SRS Life Sciences M&A Study | 5 © 2013 Shareholder Representative Services LLC. All rights reserved. www.shareholderrep.com

2013 SRS M&A Post-Closing Claims Study | 5

§  Claim activity across all deals was frequent •  Two-thirds (67%) of expired-escrow deals* had post-closing issues arise relating to indemnification claims,

purchase price adjustments (“PPAs”), and/or earn-outs •  Over half (58%) of expired-escrow deals had post-closing PPA and indemnification claims against the escrow

•  18% of expired-escrow deals had at least one claim made in the final week of the escrow period

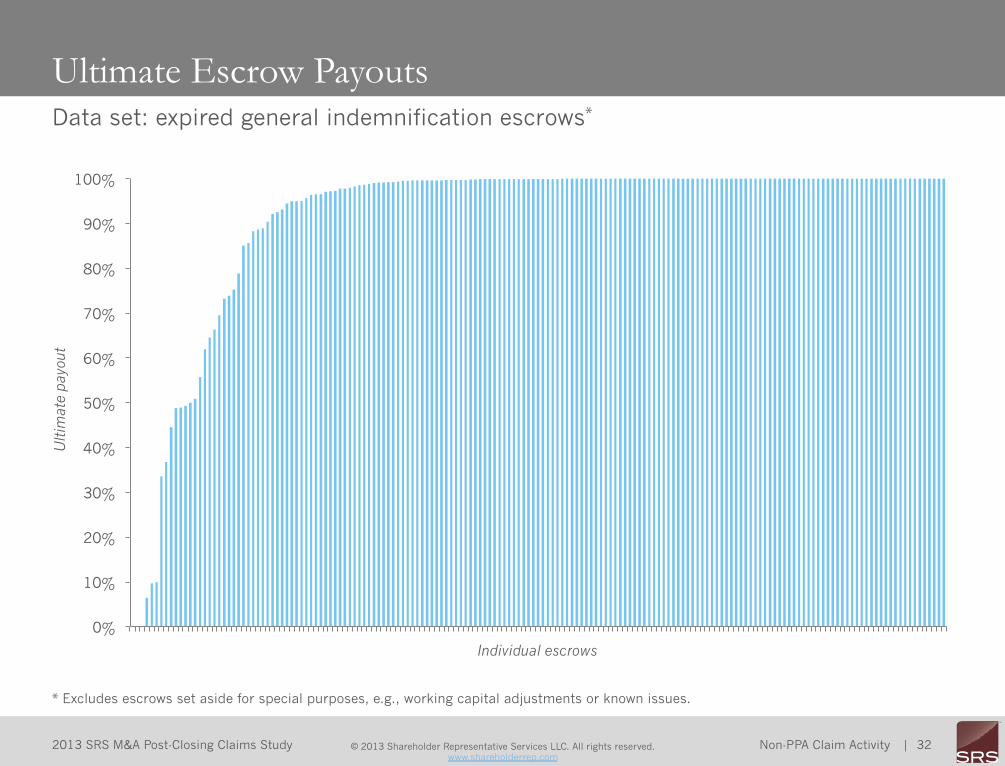
•  Final escrow releases in nearly a third (30%) of expired-escrow deals were delayed due to outstanding claims, with held-back funds delayed 7 months on average

§  Claim activity in deals with claims was significant •  Expired-escrow deals with claims had 3.6 claims on average

•  An average of 30% of escrow dollars were claimed in expired-escrow deals with claims

•  21% of expired-escrow deals with claims had claims exceeding half of the escrow

•  12% of expired-escrow deals with claims had one or more of their claims result in litigation or arbitration between the buyer and shareholder representative, which also affected the use of expense funds

§  Post-closing purchase price adjustments occurred often •  72% of deals with PPA mechanisms had a post-closing adjustment

•  27% of PPA claims were disputed, and 9% of PPA claims originally brought as negative adjustments were converted to a surplus being returned to shareholders after discussion

§  Non-life sciences** earn-outs were achieved half of the time and were sometimes disputed •  50% of milestones that have come due have been achieved

•  10% of milestones initially claimed as missed were disputed and negotiated to a payout for shareholders

Key Points

Key Points

* “Expired-escrow deals” as used herein includes deals where selling shareholders have no further escrow-based indemnification obligations. ** For a detailed analysis of SRS’s life sciences deals, including earn-outs, please see the 2012 SRS Life Sciences M&A Study.

2012 SRS Life Sciences M&A Study | 6 © 2013 Shareholder Representative Services LLC. All rights reserved. www.shareholderrep.com

2013 SRS M&A Post-Closing Claims Study | 6

§  Comparative analysis of this study, the 2011 SRS M&A Post-Closing Claims Study and the recent 2012 SRS M&A Deal Terms Study* revealed:

•  More efficient resolution of most claims, with high stakes claims utilizing more formal processes.

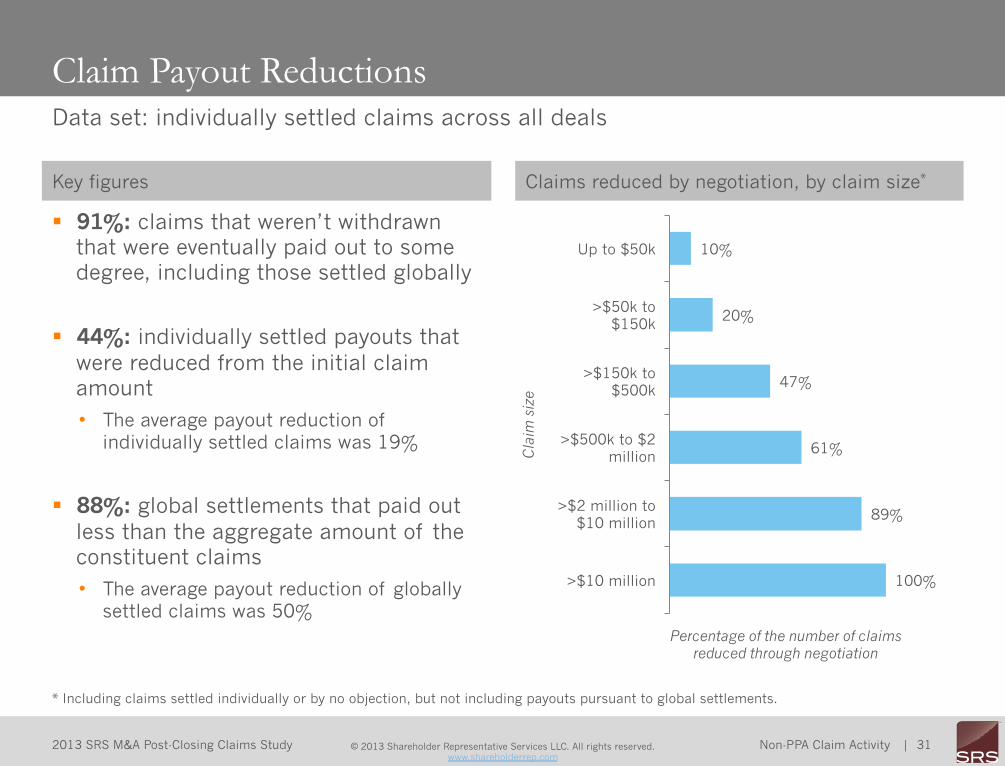
•  Claim payout reductions have increased while claim resolution times have generally shortened. The availability of more data and information is a contributing factor, giving parties the ability to craft smarter deals focused on terms that really matter after closing, potentially narrowing the gap of post-closing misunderstandings.

•  Where the stakes were especially high, the parties often resorted to more formal proceedings to ensure fair resolution. Consistent with this, expense funds were used in fewer deals, but the amount used was higher when needed.

•  Smaller post-closing purchase price adjustment (“PPA”) sizes, potentially due to increased adoption of clear, specific methodologies as the standard for preparing the closing financial statements upon which PPAs are based.

•  Tax claims have become relatively more frequent, potentially due to the average target company being more mature (time to exit, revenue/earnings), and renewed state and federal focus on revenue collection following the financial crisis.

•  However, the size of tax claims is trending lower, potentially due to broader adoption of certain reductions against buyer claims (e.g. requiring buyers to mitigate losses), more pre-closing focus on sales tax issues where target companies are more mature, and more prevalent review of pre-closing tax returns prepared by buyer.

•  Fewer claims for breaches of undisclosed liabilities representations, potentially due to broader adoption of a limited GAAP-based definition of “undisclosed liabilities” in the acquisition agreement.

•  Smaller claims for breaches of financial statement representations, potentially due to more frequent exclusion (and less express inclusion) of “diminution of value” in the definition of “indemnifiable losses” in the acquisition agreement, and more mature target companies having audited financials and stronger internal controls in place.

•  Larger customer contract claims that were sometimes litigated, potentially due to the average target company being more mature (products, sales, customer relationships), indicating that deal parties should focus on this area in the acquisition agreement and in diligence to avoid large post-closing issues.

SRS Insights

SRS Insights

* See the 2012 SRS M&A Deal Terms Study, available at https://www.shareholderrep.com/data-analytics/

2012 SRS Life Sciences M&A Study | 7 © 2013 Shareholder Representative Services LLC. All rights reserved. www.shareholderrep.com

2013 SRS M&A Post-Closing Claims Study | 7

Deal Set Overview

2012 SRS Life Sciences M&A Study | 8 © 2013 Shareholder Representative Services LLC. All rights reserved. www.shareholderrep.com

2013 SRS M&A Post-Closing Claims Study | 8

$25MM or less 23%

>$25MM to $50MM

17%

>$50MM to $100MM 21%

>$100MM to $250MM

23%

>$250MM to $750MM

14%

More than $750MM 2%

* “Transaction value” as used herein includes escrowed amounts but does not include potential earn-out consideration.

Data set: all deals

Transaction Values*

Deal Set Overview

2012 SRS Life Sciences M&A Study | 9 © 2013 Shareholder Representative Services LLC. All rights reserved. www.shareholderrep.com

2013 SRS M&A Post-Closing Claims Study | 9

Data set: all deals

Target Company Industries

Deal Set Overview

Biopharmaceuticals 7%

Business products and services

15%

Computers and peripherals

4%

Consumer products and services

2%

Electronics and instrumentation

4%

Health care services

3% Industrial

and energy 5%

IT services 16%

Media and entertainment

7%

Medical devices and equipment

7%

Networking equipment 3%

Semiconductors 4%

Software 23%

Telecommunications 4%

Other 1%

2012 SRS Life Sciences M&A Study | 10 © 2013 Shareholder Representative Services LLC. All rights reserved. www.shareholderrep.com

2013 SRS M&A Post-Closing Claims Study | 10

Merger 87%

Stock purchase

9%

Asset purchase

4%

Data set: all deals

Financial 6%

Public 71%

Private 14%

Foreign 9%

Deal Structures Buyer Types

Deal Structures and Buyers

Deal Set Overview

2012 SRS Life Sciences M&A Study | 11 © 2013 Shareholder Representative Services LLC. All rights reserved. www.shareholderrep.com

2013 SRS M&A Post-Closing Claims Study | 11

Breach of R&W 57%

Appraisal 2%

Breach of fiduciary duty

1%

Fees/costs 12%

Fraud 1%

Purchase price adjustment*

27%

* Claims pursuant to a post-closing purchase price adjustment mechanism (e.g. working capital).

Data set: claims across all deals

Claim subject matter as % of all claims (approx. 700 claims) Subset: breaches of R&W (approx. 400 claims)

Claim Types and Subject Matter

Capitalization 8%

Customer contracts

9%

Employee-related

9%

Financial statement

11%

Intellectual property

12% Regulatory compliance

3%

Tax 26%

Undisclosed liabilities

14%

Other 8%

Deal Set Overview

2012 SRS Life Sciences M&A Study | 12 © 2013 Shareholder Representative Services LLC. All rights reserved. www.shareholderrep.com

2013 SRS M&A Post-Closing Claims Study | 12

Post-Closing Purchase Price Adjustments

2012 SRS Life Sciences M&A Study | 13 © 2013 Shareholder Representative Services LLC. All rights reserved. www.shareholderrep.com

2013 SRS M&A Post-Closing Claims Study | 13

Adjustment direction Key figures

Post-Closing Purchase Price Adjustments (“PPAs”)

Statement delivered, no adjustment

7%

Buyer-favorable

adjustment 50%

Seller-favorable

adjustment 22%

No PPA statement delivered

21%

PPA Activity

§  73%: deals with a PPA mechanism

§  46%: deals where the PPA statement was delivered after the contractual deadline

§  3%: median claim size of buyer-favorable adjustments, as a percentage of escrow dollars

•  The average was 10%, swayed by a number of large claims

§  27%: PPAs to which SRS objected

§  33%: average claim payout reduction due to negotiation where PPAs were contested •  9% of PPA claims, after negotiation, resulted in a

surplus being returned to shareholders

•  The average time to resolve a contested PPA claim was 2.5 months

2012 SRS Life Sciences M&A Study | 14 © 2013 Shareholder Representative Services LLC. All rights reserved. www.shareholderrep.com

2013 SRS M&A Post-Closing Claims Study | 14

* Encompasses the maximum values in this data set.

Post-Closing Purchase Price Adjustments (“PPAs”)

PPA Activity

Claim sizes as % of transaction value

41%

20%

14%

11%

7%

4%

3%

Up to 0.25%

>0.25% to 0.5%

>0.5% to 1%

>1% to 2%

>2% to 5%

>5% to 10%

>10% to 40%*

29%

19%

17%

10%

12%

5%

3%

3%

1%

$100k or less

>$100k to $250k

>$250k to $500k

>$500k to $1MM

>$1MM to $2MM

>$2MM to $4MM

>$4MM to $8MM

>$8MM to $12MM

More than $12MM

Claim sizes in dollars

2012 SRS Life Sciences M&A Study | 15 © 2013 Shareholder Representative Services LLC. All rights reserved. www.shareholderrep.com

2013 SRS M&A Post-Closing Claims Study | 15

Non-PPA Claim Activity

2012 SRS Life Sciences M&A Study | 16 © 2013 Shareholder Representative Services LLC. All rights reserved. www.shareholderrep.com

2013 SRS M&A Post-Closing Claims Study | 16

16%

11%

10%

9%

9%

9%

8%

7%

6%

5%

3%

2%

2%

Tax

IP

Fees/costs

Capitalization

Employee

Undisclosed liabilities

Customer contract

Financial statement

Other R&W

Regulatory compliance

Fraud

Appraisal rights

Breach of fiduciary duty

Data set: claims in expired-escrow deals

§  44%: deals with at least one non-PPA claim •  28% had more than one non-PPA claim

§  1.6: average number of claims per deal, including deals with no claims •  Where deals had claims, the average was 3.6

§  16%: average escrow amount claimed across expired-escrow deals, including deals with no claims •  Where deals had claims, the average was 30%

§  9%: deals with claims against the entire escrow amount or in excess thereof •  8% of deals had claims in excess of the total

escrow amount

•  14% of deals had claims for 50% or more of the total escrow amount

% of deals that received each claim type Key figures

Claim Activity Generally

Non-PPA Claim Activity

2012 SRS Life Sciences M&A Study | 17 © 2013 Shareholder Representative Services LLC. All rights reserved. www.shareholderrep.com

2013 SRS M&A Post-Closing Claims Study | 17

Up to $50k 36%

>$50k to $150k 20%

>$150k to $500k 16%

>$500k to $2MM 16%

>$2MM to $10MM

9%

>$10MM 3%

Data set: claims across all deals

100%

44%

29%

19%

16%

9%

6%

6%

6%

3%

1%

1%

Fraud

Breach of fiduciary duty

Customer contract

Intellectual property

Financial statement

Undisclosed liabilities

Employee

Tax

Regulatory

Fees/costs

Appraisal

Capitalization

Claim size breakdown (median: $140k) Average claim size as % of the escrow

Claim Sizes Generally

Non-PPA Claim Activity

§  18% of deals had claims totaling more than $1MM

2012 SRS Life Sciences M&A Study | 18 © 2013 Shareholder Representative Services LLC. All rights reserved. www.shareholderrep.com

2013 SRS M&A Post-Closing Claims Study | 18

36%

58%

43%

47%

67%

1.0

2.5

1.7

1.8

1.3

Up to $50MM

>$50MM to $100MM

>$100MM to $200MM

>$200MM to $500MM

>$500MM to $1.5B**

Deals with a claim Average claims per deal*

* Including deals with no claims. ** Encompasses the maximum values in this data set.

Data set: claims in expired-escrow deals

Claim frequency based on transaction value Claim size based on transaction value

Claim Activity Based on Transaction Value

Non-PPA Claim Activity

10%

16%

4%

7%

8%

31%

43%

18%

26%

27%

11%

23%

7%

11%

18%

Up to $50MM

>$50MM to $100MM

>$100MM to $200MM

>$200MM to $500MM

>$500MM to $1.5B**

Average individual claim size as % of escrow

Average % of escrow claimed, deals ≥1 claim

Average % of escrow claimed, all deals

2012 SRS Life Sciences M&A Study | 19 © 2013 Shareholder Representative Services LLC. All rights reserved. www.shareholderrep.com

2013 SRS M&A Post-Closing Claims Study | 19

* Including deals with no claims. ** Encompasses the maximum values in this data set.

Data set: claims in expired-escrow deals

Claim frequency based on escrow size Claim size based on escrow size

Claim Activity Based on Escrow Size

28%

11%

8%

6%

12%

67%

27%

33%

14%

35%

29%

13%

10%

9%

20%

Up to 5%

>5% to 10%

>10% to 15%

>15% to 20%

>20% to 50%**

Average individual claim size as % of escrow

Average % of escrow claimed, deals ≥1 claim

Average % of escrow claimed, all deals

Non-PPA Claim Activity

43%

51%

35%

60%

56%

1.1

1.7

1.4

3.1

1.2

Up to 5%

>5% to 10%

>10% to 15%

>15% to 20%

>20% to 50%**

Escr

ow s

ize

as %

of t

rans

acti

on v

alue

Deals with a claim Average claims per deal*

2012 SRS Life Sciences M&A Study | 20 © 2013 Shareholder Representative Services LLC. All rights reserved. www.shareholderrep.com

2013 SRS M&A Post-Closing Claims Study | 20

46%

23%

40%

1.7

1.1

1.1

Merger

Stock purchase

Asset purchase

Deals with a claim Average claims per deal*

* Including deals with no claims.

Data set: claims in expired-escrow deals

Claim frequency based on deal structure Claim size based on deal structure

Claim Activity Based on Deal Structure

Non-PPA Claim Activity

9%

7%

37%

28%

48%

80%

12%

7%

32%

Merger

Stock purchase

Asset purchase

Average individual claim size as % of escrow

Average % of escrow claimed, deals ≥1 claim

Average % of escrow claimed, all deals

2012 SRS Life Sciences M&A Study | 21 © 2013 Shareholder Representative Services LLC. All rights reserved. www.shareholderrep.com

2013 SRS M&A Post-Closing Claims Study | 21

* Including deals with no claims.

Data set: claims in expired-escrow deals

Claim frequency based on buyer type Claim size based on buyer type

Claim Activity Based on Buyer Type

8%

13%

25%

6%

26%

42%

61%

12%

11%

17%

33%

4%

Public

Private

Financial

Foreign

Average individual claim size as % of escrow

Average % of escrow claimed, deals ≥1 claim

Average % of escrow claimed, all deals

Non-PPA Claim Activity

42%

53%

64%

38%

1.4

2.0

3.5

1.1

Public

Private

Financial

Foreign

Deals with a claim Average claims per deal*

2012 SRS Life Sciences M&A Study | 22 © 2013 Shareholder Representative Services LLC. All rights reserved. www.shareholderrep.com

2013 SRS M&A Post-Closing Claims Study | 22

Data set: claims in expired-escrow deals

Third-Party Claims Based on Transaction Value

Percentage of deals that received third-party claims

Non-PPA Claim Activity

21%

35%

29%

22%

50%

Up to $50MM

>$50MM to $100MM

>$100MM to $200MM

>$200MM to $500MM

>$500MM to $1.5B**

Tran

sact

ion

valu

e

2012 SRS Life Sciences M&A Study | 23 © 2013 Shareholder Representative Services LLC. All rights reserved. www.shareholderrep.com

2013 SRS M&A Post-Closing Claims Study | 23

100%*

56% 52% 50% 43%

36% 35%

25% 20%

12% 10% 8% 0%

44% 48% 50% 57% 64% 65% 75% 80% 88% 90% 92% 100%

Claims made within 6 months Claims made after 6 months

* Excludes one appraisal claim brought after closing to the buyer directly (without the knowledge of SRS) which was later settled and presented to SRS in the final week of the escrow period.

Data set: claims in expired-escrow deals

Claim Timing: Six-Month Mark

Claims made within six months of closing vs. those made later

Non-PPA Claim Activity

2012 SRS Life Sciences M&A Study | 24 © 2013 Shareholder Representative Services LLC. All rights reserved. www.shareholderrep.com

2013 SRS M&A Post-Closing Claims Study | 24

16%

52%

84% 48%

Buyer claims Third-party claims

After 6 months from closing

Within 6 months of closing

§  Buyers made claims for fraud and breaches of representations and warranties related to financial statements, regulatory compliance, customer contracts and taxes later in the escrow period, after a significant opportunity to examine the target post-closing

§  Third-party claims frequently filed soon after closing included appraisal rights, shareholder derivative suits against the target’s board of directors, claims by former employees and intellectual property claims

Timing breakdown

Claim Timing: Third-Party vs. Buyer Claims Data set: claims in expired-escrow deals

Non-PPA Claim Activity

Notes about claim types

2012 SRS Life Sciences M&A Study | 25 © 2013 Shareholder Representative Services LLC. All rights reserved. www.shareholderrep.com

2013 SRS M&A Post-Closing Claims Study | 25

62%

60%

58%

51%

47%

46%

45%

38%

32%

30%

26%

0%

0%*

Financial statement

Fraud

Regulatory

Tax

Other R&W

Fees/costs

Undisclosed liabilities

Customer contract

Intellectual property

Employee

Capitalization

Breach of fiduciary duty

Appraisal

* Excludes one appraisal claim brought after closing to the buyer directly (without the knowledge of SRS) which was later settled and presented to SRS in the final week of the escrow period.

Data set: claims in expired-escrow deals

Claim Timing: Final Week of the Escrow Period

Percentage of claims made within the final week of the escrow period

Non-PPA Claim Activity

§  30% of claims were made in the final week

§  18% of deals had at least one claim made in the final week

§  There was no correlation between claim timing and average claim size

2012 SRS Life Sciences M&A Study | 26 © 2013 Shareholder Representative Services LLC. All rights reserved. www.shareholderrep.com

2013 SRS M&A Post-Closing Claims Study | 26

* Foreign buyers did not make any claims in the final week.

Data set: claims in expired-escrow deals

Key figures Claims made in the final week, by buyer type*

Claim Timing: Escrow-Release Delays

§  Last-minute and pending claims delayed final escrow releases

•  18%: deals with at least one claim made during the final week of the escrow period

•  40% of deals with claims

•  30%: deals with escrows released late due to pending claims

•  36%: average of the escrow held back in deals with delays

•  7 months: average delay in deals with delays

19%

15%

36%

3.4

5.4

5.3

Public

Private

Financial

Deals with a claim in the final week

If brought in the final week, average number of claims

Non-PPA Claim Activity

2012 SRS Life Sciences M&A Study | 27 © 2013 Shareholder Representative Services LLC. All rights reserved. www.shareholderrep.com

2013 SRS M&A Post-Closing Claims Study | 27

Claims settled/

paid individually

52% Claims part of global

settlements 32%

Claims withdrawn

16%

Data set: claims across all deals

Claim resolution breakdown Notes about litigation and arbitration

Claim Resolution Methods

Non-PPA Claim Activity

§  12% of expired-escrow deals with claims had one or more claims result in litigation or arbitration between the buyer and shareholder representative

§  Claims for breaches of representations relating to customer contracts and intellectual property were frequently litigated or arbitrated

2012 SRS Life Sciences M&A Study | 28 © 2013 Shareholder Representative Services LLC. All rights reserved. www.shareholderrep.com

2013 SRS M&A Post-Closing Claims Study | 28

9%

11%

4%

10%

31%

14%

44%

20%

42%

54%

80%

79%

7%

14%

22%

20%

19%

44%

11%

40%

19%

25%

7%

Fees/costs

Intellectual property

Employee

Other R&W

Capitalization

Tax

Appraisal

Regulatory

Breach of fiduciary duty

Undisclosed liabilities

Financial statement

Fraud

Customer contract

Settled individually Settled globally Withdrawn

Data set: claims across all deals

Claim Resolution Methods, by Claim Type

Non-PPA Claim Activity

2012 SRS Life Sciences M&A Study | 29 © 2013 Shareholder Representative Services LLC. All rights reserved. www.shareholderrep.com

2013 SRS M&A Post-Closing Claims Study | 29

83%

76%

41%

10% 15%

43%

7% 9% 16%

Claims made within 6 months of closing Claims made after 6 months but before the final week of the escrow period

Claims made within the final week of the escrow period

Settled individually Settled globally Withdrawn

Data set: claims in expired-escrow deals

Claim Resolution Methods Over Time

Non-PPA Claim Activity

2012 SRS Life Sciences M&A Study | 30 © 2013 Shareholder Representative Services LLC. All rights reserved. www.shareholderrep.com

2013 SRS M&A Post-Closing Claims Study | 30

3

14

5

9

4

1

8

5

7

5

2

5

5

8

4

9

8

6

4

6

Appraisal

Breach of fiduciary duty

Capitalization

Customer contract

Employee

Fees/costs

Financial statement

Fraud

Intellectual property

Regulatory

Tax

Undisclosed liabilities

Average across all claims, including resolved by no objection Average across contested claims only

Data set: claims across all deals

Claim Resolution Time

Average resolution time, in months

Non-PPA Claim Activity

§  Average across all claims and all resolution methods: 4.6 months

§  Average across contested claims: 6.4 months

2012 SRS Life Sciences M&A Study | 31 © 2013 Shareholder Representative Services LLC. All rights reserved. www.shareholderrep.com

2013 SRS M&A Post-Closing Claims Study | 31

Data set: individually settled claims across all deals

Claim Payout Reductions

Non-PPA Claim Activity

Cla

im s

ize

* Including claims settled individually or by no objection, but not including payouts pursuant to global settlements.

Claims reduced by negotiation, by claim size*

10%

20%

47%

61%

89%

100%

Up to $50k

>$50k to $150k

>$150k to $500k

>$500k to $2 million

>$2 million to $10 million

>$10 million

Percentage of the number of claims reduced through negotiation

Key figures

§  91%: claims that weren’t withdrawn that were eventually paid out to some degree, including those settled globally

§  44%: individually settled payouts that were reduced from the initial claim amount

•  The average payout reduction of individually settled claims was 19%

§  88%: global settlements that paid out less than the aggregate amount of the constituent claims

•  The average payout reduction of globally settled claims was 50%

2012 SRS Life Sciences M&A Study | 32 © 2013 Shareholder Representative Services LLC. All rights reserved. www.shareholderrep.com

2013 SRS M&A Post-Closing Claims Study | 32

0%

10%

20%

30%

40%

50%

60%

70%

80%

90%

100%

Ult

imat

e pa

yout

Individual escrows

* Excludes escrows set aside for special purposes, e.g., working capital adjustments or known issues.

Data set: expired general indemnification escrows*

Ultimate Escrow Payouts

Non-PPA Claim Activity

2012 SRS Life Sciences M&A Study | 33 © 2013 Shareholder Representative Services LLC. All rights reserved. www.shareholderrep.com

2013 SRS M&A Post-Closing Claims Study | 33

* Combination baskets are excluded here due to small sample size.

Data set: claims in expired-escrow deals

Basket types, by deal Baskets and claims*

Baskets

1.9

1.1

11%

13%

First dollar

Deductible

Average number of claims

Average size of claim as % of escrow

First dollar 66%

Deductible 32%

Combination 2%

Non-PPA Claim Activity

2012 SRS Life Sciences M&A Study | 34 © 2013 Shareholder Representative Services LLC. All rights reserved. www.shareholderrep.com

2013 SRS M&A Post-Closing Claims Study | 34

No expense fund 23%

<$50k 4%

$50k to <$150k

21% $150k to <$250k

12%

$250k to <$500k

25%

$500k or more

15%

§  Median size: $250,000

§  Expense fund accounts are slightly larger in deals with earn-outs •  0.6% of transaction value (not counting

the potential value of the earn-out) for deals with an earn-out

•  0.4% of transaction value for deals without an earn-out

§  Expense funds were often used •  In expired-escrow deals, 42% used some

portion of the expense fund

•  In deals where some portion was used, the average amount used was 20%

Expense fund sizes (data set: all deals) Expense fund notes

Expense Funds

Expense Funds

2012 SRS Life Sciences M&A Study | 35 © 2013 Shareholder Representative Services LLC. All rights reserved. www.shareholderrep.com

2013 SRS M&A Post-Closing Claims Study | 35

Earn-outs

2012 SRS Life Sciences M&A Study | 36 © 2013 Shareholder Representative Services LLC. All rights reserved. www.shareholderrep.com

2013 SRS M&A Post-Closing Claims Study | 36

Achieved 50%

Missed 50%

* For a detailed analysis of SRS’s life sciences deals, including earn-outs, please see the 2012 SRS Life Sciences M&A Study.

Data set: 36 non-life sciences* milestone events that have come due

§  38%: expired-escrow deals with earn-outs that had non-PPA escrow claims

•  47% of expired-escrow deals without earn-outs had non-PPA escrow claims

§  10%: earn-out milestones initially claimed as missed that were disputed and negotiated to a payout for shareholders

§  89%: earn-out milestones in this data set based on financial metrics (e.g., revenue, earnings)

Milestone achievement rates Key figures

Earn-outs

Earn-outs

2012 SRS Life Sciences M&A Study | 37 © 2013 Shareholder Representative Services LLC. All rights reserved. www.shareholderrep.com

2013 SRS M&A Post-Closing Claims Study | 37

Analysis of Individual Claim Types

2012 SRS Life Sciences M&A Study | 38 © 2013 Shareholder Representative Services LLC. All rights reserved. www.shareholderrep.com

2013 SRS M&A Post-Closing Claims Study | 38

Frequency and size

% of deals receiving this claim type Average % of escrow claimed, per claim

2% 1%

Timing

Made within 6 months of closing Made after 6 months of closing Made within the final week of the

escrow period

100% 0%* 0%*

Payout

Percentage of claims withdrawn Percentage of non-withdrawn

claims that were paid to the buyer to some degree

Average payout reduction from initial claim amount when settled

individually*

44% 100% 23%

* Excludes one appraisal claim brought after closing to the buyer directly (without the knowledge of SRS) which was later settled and presented to SRS the final week of the escrow period. ** Does not include potential payout reductions due to global settlements, which may be significant.

Appraisal Rights Claims

Individual Claim Analysis

2012 SRS Life Sciences M&A Study | 39 © 2013 Shareholder Representative Services LLC. All rights reserved. www.shareholderrep.com

2013 SRS M&A Post-Closing Claims Study | 39

Frequency and size

% of deals receiving this claim type Average % of escrow claimed, per claim

2% 44%

Timing

Made within 6 months of closing Made after 6 months of closing Made within the final week of the

escrow period

50% 50% 0%

Payout

Percentage of claims withdrawn Percentage of non-withdrawn

claims that were paid to the buyer to some degree

Average payout reduction from initial claim amount when settled

individually*

40% 100% 96%

* Does not include potential payout reductions due to global settlements, which may be significant.

Breach of Fiduciary Duty Claims

Individual Claim Analysis

2012 SRS Life Sciences M&A Study | 40 © 2013 Shareholder Representative Services LLC. All rights reserved. www.shareholderrep.com

2013 SRS M&A Post-Closing Claims Study | 40

Frequency and size

% of deals receiving this claim type Average % of escrow claimed, per claim

9% 1%

Timing

Made within 6 months of closing Made after 6 months of closing Made within the final week of the

escrow period

56% 44% 26%

Payout

Percentage of claims withdrawn Percentage of non-withdrawn

claims that were paid to the buyer to some degree

Average payout reduction from initial claim amount when settled

individually*

0% 100% 15%

* Does not include potential payout reductions due to global settlements, which may be significant.

Breach of Capitalization Representation Claims

Individual Claim Analysis

2012 SRS Life Sciences M&A Study | 41 © 2013 Shareholder Representative Services LLC. All rights reserved. www.shareholderrep.com

2013 SRS M&A Post-Closing Claims Study | 41

Frequency and size

% of deals receiving this claim type Average % of escrow claimed, per claim

8% 29%

Timing

Made within 6 months of closing Made after 6 months of closing Made within the final week of the

escrow period

25% 75% 38%

Payout

Percentage of claims withdrawn Percentage of non-withdrawn

claims that were paid to the buyer to some degree

Average payout reduction from initial claim amount when settled

individually*

7% 100% 39%

* Does not include potential payout reductions due to global settlements, which may be significant.

Breach of Customer Contract Representation Claims

Individual Claim Analysis

2012 SRS Life Sciences M&A Study | 42 © 2013 Shareholder Representative Services LLC. All rights reserved. www.shareholderrep.com

2013 SRS M&A Post-Closing Claims Study | 42

Frequency and size

% of deals receiving this claim type Average % of escrow claimed, per claim

9% 6%

Timing

Made within 6 months of closing Made after 6 months of closing Made within the final week of the

escrow period

52% 48% 30%

Payout

Percentage of claims withdrawn Percentage of non-withdrawn

claims that were paid to the buyer to some degree

Average payout reduction from initial claim amount when settled

individually*

22% 83% 44%

* Does not include potential payout reductions due to global settlements, which may be significant.

Breach of Employee-related Representations Claims

Individual Claim Analysis

2012 SRS Life Sciences M&A Study | 43 © 2013 Shareholder Representative Services LLC. All rights reserved. www.shareholderrep.com

2013 SRS M&A Post-Closing Claims Study | 43

Frequency and size

% of deals receiving this claim type Average % of escrow claimed, per claim

10% 3%

Timing

Made within 6 months of closing Made after 6 months of closing Made within the final week of the

escrow period

8% 92% 46%

Payout

Percentage of claims withdrawn Percentage of non-withdrawn

claims that were paid to the buyer to some degree

Average payout reduction from initial claim amount when settled

individually*

7% 100% 2%

* Does not include potential payout reductions due to global settlements, which may be significant.

Fees/Costs Claims

Individual Claim Analysis

2012 SRS Life Sciences M&A Study | 44 © 2013 Shareholder Representative Services LLC. All rights reserved. www.shareholderrep.com

2013 SRS M&A Post-Closing Claims Study | 44

Frequency and size

% of deals receiving this claim type Average % of escrow claimed, per claim

7% 16%

Timing

Made within 6 months of closing Made after 6 months of closing Made within the final week of the

escrow period

10% 90% 62%

Payout

Percentage of claims withdrawn Percentage of non-withdrawn

claims that were paid to the buyer to some degree

Average payout reduction from initial claim amount when settled

individually*

25% 78% 22%

* Does not include potential payout reductions due to global settlements, which may be significant.

Breach of Financial Statement Representation Claims

Individual Claim Analysis

2012 SRS Life Sciences M&A Study | 45 © 2013 Shareholder Representative Services LLC. All rights reserved. www.shareholderrep.com

2013 SRS M&A Post-Closing Claims Study | 45

Frequency and size

% of deals receiving this claim type Average % of escrow claimed, per claim

3% 100%

Timing

Made within 6 months of closing Made after 6 months of closing Made within the final week of the

escrow period

20% 80% 60%

Payout

Percentage of claims withdrawn Percentage of non-withdrawn

claims that were paid to the buyer to some degree

Average payout reduction from initial claim amount when settled

individually*

0% 80% 82%

* Does not include potential payout reductions due to global settlements, which may be significant.

Fraud Claims

Individual Claim Analysis

2012 SRS Life Sciences M&A Study | 46 © 2013 Shareholder Representative Services LLC. All rights reserved. www.shareholderrep.com

2013 SRS M&A Post-Closing Claims Study | 46

Frequency and size

% of deals receiving this claim type Average % of escrow claimed, per claim

11% 19%

Timing

Made within 6 months of closing Made after 6 months of closing Made within the final week of the

escrow period

43% 57% 32%

Payout

Percentage of claims withdrawn Percentage of non-withdrawn

claims that were paid to the buyer to some degree

Average payout reduction from initial claim amount when settled

individually*

14% 83% 44%

* Does not include potential payout reductions due to global settlements, which may be significant.

Breach of Intellectual Property Representation Claims

Individual Claim Analysis

2012 SRS Life Sciences M&A Study | 47 © 2013 Shareholder Representative Services LLC. All rights reserved. www.shareholderrep.com

2013 SRS M&A Post-Closing Claims Study | 47

Frequency and size

% of deals receiving this claim type Average % of escrow claimed, per claim

5% 6%

Timing

Made within 6 months of closing Made after 6 months of closing Made within the final week of the

escrow period

0% 100% 58%

Payout

Percentage of claims withdrawn Percentage of non-withdrawn

claims that were paid to the buyer to some degree

Average payout reduction from initial claim amount when settled

individually*

11% 100% 24%

* Does not include potential payout reductions due to global settlements, which may be significant.

Breach of Regulatory Compliance Representation Claims

Individual Claim Analysis

2012 SRS Life Sciences M&A Study | 48 © 2013 Shareholder Representative Services LLC. All rights reserved. www.shareholderrep.com

2013 SRS M&A Post-Closing Claims Study | 48

Frequency and size

% of deals receiving this claim type Average % of escrow claimed, per claim

16% 6%

Timing

Made within 6 months of closing Made after 6 months of closing Made within the final week of the

escrow period

12% 88% 51%

Payout

Percentage of claims withdrawn Percentage of non-withdrawn

claims that were paid to the buyer to some degree

Average payout reduction from initial claim amount when settled

individually*

19% 96% 15%

* Does not include potential payout reductions due to global settlements, which may be significant.

Breach of Tax Representation Claims

Individual Claim Analysis

2012 SRS Life Sciences M&A Study | 49 © 2013 Shareholder Representative Services LLC. All rights reserved. www.shareholderrep.com

2013 SRS M&A Post-Closing Claims Study | 49

Frequency and size

% of deals receiving this claim type Average % of escrow claimed, per claim

9% 9%

Timing

Made within 6 months of closing Made after 6 months of closing Made within the final week of the

escrow period

36% 64% 45%

Payout

Percentage of claims withdrawn Percentage of non-withdrawn

claims that were paid to the buyer to some degree

Average payout reduction from initial claim amount when settled

individually*

19% 97% 29%

* Does not include potential payout reductions due to global settlements, which may be significant.

Breach of Undisclosed Liabilities Representation Claims

Individual Claim Analysis

2012 SRS Life Sciences M&A Study | 50 © 2013 Shareholder Representative Services LLC. All rights reserved. www.shareholderrep.com

2013 SRS M&A Post-Closing Claims Study | 50

Glossary

2012 SRS Life Sciences M&A Study | 51 © 2013 Shareholder Representative Services LLC. All rights reserved. www.shareholderrep.com

2013 SRS M&A Post-Closing Claims Study | 51

Glossary §  Appraisal rights

Shareholders’ statutory right under state law to seek judicial determination of the value of their shares when the corporation is party to a merger. Appraisal rights claims are third-party claims where the buyer seeks indemnification for payments made, or that might be made, to dissenting shareholders.

§  Asset purchase agreement Transaction where the buyer purchases all or substantially all of the assets of the selling company. Certain liabilities of the selling company may be explicitly excluded from the purchase. The buyer does not merge with the selling company.

§  Basket Common provision within the indemnification section of a merger agreement. The basket is a mechanism whereby a party cannot collect on an indemnification claim until its total claimed losses reach a specific threshold amount. The three general categories are deductible, first dollar, and combination.

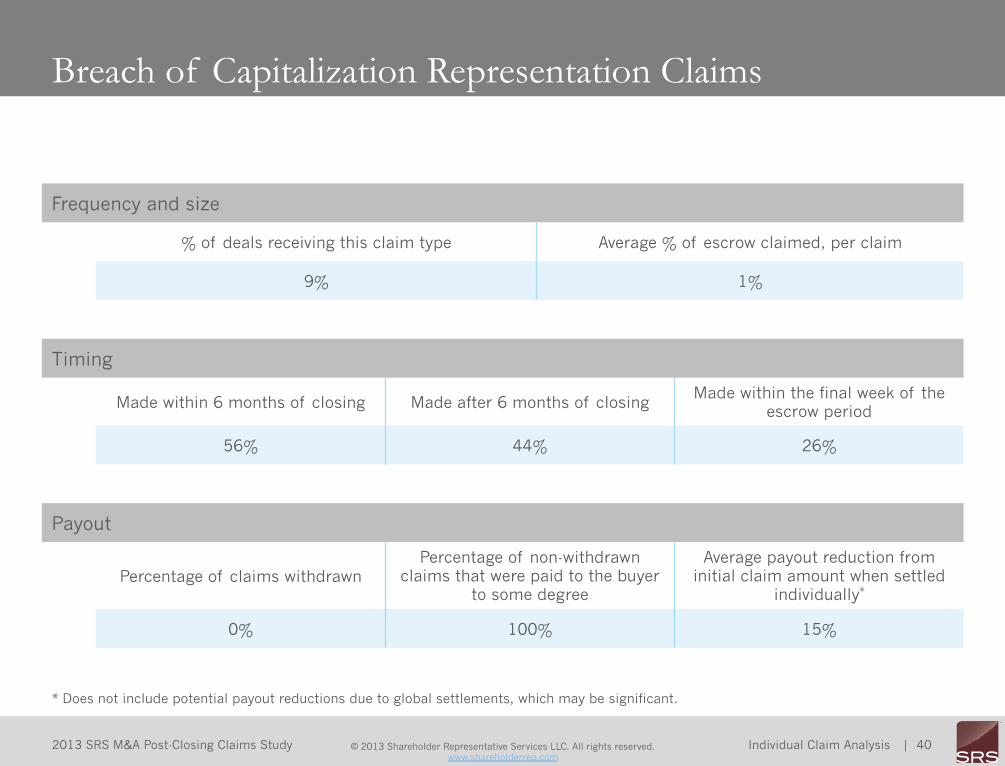
§  Capitalization claim

These claims are typically made because an individual has claimed that they are entitled to additional merger consideration based upon inaccuracies in the closing capitalization and/or consideration spreadsheet. Includes former and current employees of the target that claim they are due additional merger consideration based on options or similar equity-based pay.

§  Combination basket

Example: Sellers shall not be required to indemnify Buyer for Losses until the aggregate amount of all such Losses exceeds $500,000 (the “Threshold”) in which event Sellers shall be responsible only for Losses in excess of $300,000 (the “Deductible”).

§  Customer contract claim Third-party or direct claim type. Claims are placed in this category where the buyer’s claim is based on a customer contract of the target. Common examples include claims that the target failed to provide a contracted service or product to the customer. Does not include claims involving contracts with vendors or suppliers of the target.

§  Deductible (a.k.a. “overflow”) basket

Example: Sellers shall not be required to indemnify Buyer for Losses until the aggregate amount of all such Losses exceeds $300,000 (the “Deductible”) in which event Sellers shall be responsible only for Losses exceeding the Deductible

2012 SRS Life Sciences M&A Study | 52 © 2013 Shareholder Representative Services LLC. All rights reserved. www.shareholderrep.com

2013 SRS M&A Post-Closing Claims Study | 52

Glossary §  Dissenting shareholder

Term that refers to a target shareholder that has chosen to exercise appraisal rights under state law.

§  Employee claim

Third-party claim type. Examples of claims in this category include claims by former employees involving non-equity based compensation and lawsuits by former employees for discrimination or harassment.

§  Escrow

In the M&A context, a portion of the transaction consideration that is held to secure the selling shareholders’ indemnification obligations to the buyer. After a pre-determined period of time has passed (the “escrow period”), any amount in the escrow account not claimed by the buyer is released to the selling shareholders. This study does not distinguish between escrows and holdback accounts retained by the buyer for the same purpose.

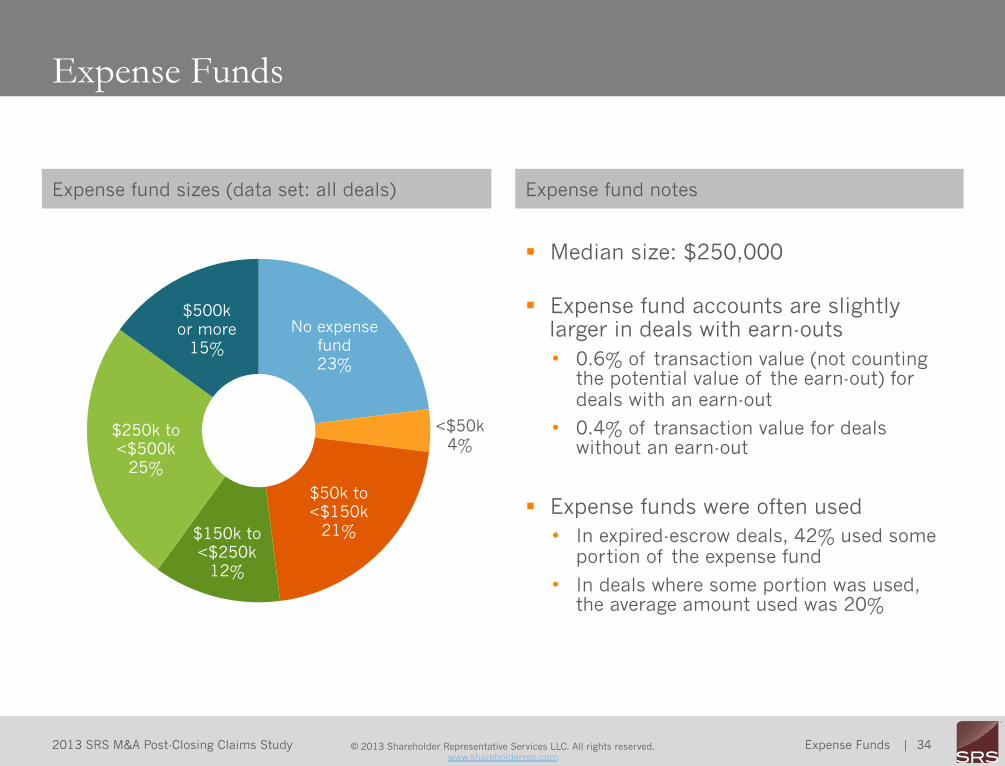
§  Expense fund A voluntary fund set aside by the shareholders from the merger consideration at closing for potential third-party expenses that might be incurred during the post-closing period.

§  Expired-escrow deal A deal that has reached the escrow release date. The escrow in such a deal may still be held by the escrow agent or buyer if there are outstanding indemnification claims, but any escrow-based obligation of shareholders to indemnify the buyer for new claims has expired.

§  Fees and costs claim

Can be either a direct or third-party claim. These claims may be based on terms such as seller’s obligation to pay outstanding transaction costs, or costs relating to audits or litigation disclosed prior to closing.

§  Financial buyer Buyer that acquires a target as an investment rather than for the purpose of expanding its own business or for other strategic purposes.

2012 SRS Life Sciences M&A Study | 53 © 2013 Shareholder Representative Services LLC. All rights reserved. www.shareholderrep.com

2013 SRS M&A Post-Closing Claims Study | 53

Glossary §  Financial statements claim

Direct claim type. These claims are based on alleged breach of representations and warranties regarding the accuracy of the target’s financial statements. This may also include claims for a net working capital adjustment included in the indemnification section rather than as a dedicated, short-term post-closing adjustment mechanism.

§  First dollar (a.k.a. “tipping”) basket Example: Sellers shall not be required to indemnify Buyer for Losses until the aggregate amount of all such Losses exceeds $500,000 (the “Threshold”) in which event Sellers shall be responsible for the aggregate amount of all Losses, regardless of the Threshold.

§  Foreign buyer

Includes foreign companies not listed on the NYSE or NASDAQ. Both public and private foreign companies are included.

§  Fraud claim Direct claim type. Based on the buyer’s allegations that the target and/or selling shareholders committed some manner of fraud and/or intentional misrepresentation in connection with the transaction. Common examples include allegations that the target intentionally misrepresented its financial condition or fraudulently concealed certain liabilities.

§  Global settlement

A method of claim resolution where multiple claims are resolved together. A typical global settlement results in a lump sum amount paid to the buyer from the escrow in full satisfaction of all outstanding claims.

§  Indemnification Where one party secures another against suffered losses. In the M&A context, the selling parties almost always agree to indemnify the buyer against certain types of losses that could be suffered in connection with the transaction.

§  Intellectual property claim Usually a third-party claim type. IP claims are often based on alleged patent infringement by the target. Can also include a direct claim by the buyer that the target’s proprietary technology had defects.

2012 SRS Life Sciences M&A Study | 54 © 2013 Shareholder Representative Services LLC. All rights reserved. www.shareholderrep.com

2013 SRS M&A Post-Closing Claims Study | 54

Glossary §  Merger

Transaction where the buyer and target merge into one company or the target merges with a wholly owned subsidiary of the buyer.

§  Purchase price adjustment (“PPA”)

A common deal feature where the transaction consideration is adjusted shortly after closing in accordance with a specified financial metric. While there are a number of metrics used to determine the adjustment, the most common is some variation of a net working capital formula. As a result, claims in this category are commonly referred to as “Net Working Capital” claims. The adjustment can be in favor of either the buyer or selling shareholders.

§  “Other breaches of reps & warranties” claim May be either a direct or third-party claim type. This category includes claims that do not fit into other categories included in this study, typically because they are infrequent. Examples of claims in this category include an alleged breach of the “no broker” representation and an alleged breach of the material changes representation and related covenants.

§  Private buyer

Includes private companies headquartered in the United States. Also includes companies whose stock is traded on the OTCBB or Pink Sheets.

§  Public buyer

Includes companies listed on the NYSE or NASDAQ; location of corporate headquarters is not taken into account.

§  Regulatory claim

Claims in this category are based on an alleged breach of the representations and warranties dealing with the target’s compliance with applicable laws.

§  Representations & warranties In the context used in this study, a section of the merger agreement where certain assurances made by the target as to the existence or non-existence of certain facts. These facts typically concern the condition of the target as of the time it is acquired.

2012 SRS Life Sciences M&A Study | 55 © 2013 Shareholder Representative Services LLC. All rights reserved. www.shareholderrep.com

2013 SRS M&A Post-Closing Claims Study | 55

Glossary §  Stock purchase agreement

Transaction where the buyer purchases the outstanding shares of the target directly from the selling shareholders. The result is that the target becomes a subsidiary of the buyer.

§  Target The selling or acquired company in a merger or acquisition transaction.

§  Tax claim Tax claims are based on the target’s alleged failure to pay applicable state or federal taxes. Includes, among others, income, sales, and use taxes.

§  Transaction value The enterprise value to be paid by the buyer according to the transaction agreement. Does not include contingent consideration or adjustments to the purchase price.

§  Undisclosed liabilities claim These claims are based on the target’s alleged failure to disclose a liability in the disclosure schedules. The undisclosed liabilities representation is sometimes used as a catch-all by buyers for unexpected third party claims that do not fit under the financial statements or material contracts representations. The most common example is a buyer’s claim that the target did not disclose outstanding obligations to a vendor, supplier or other partner.

2012 SRS Life Sciences M&A Study | 56 © 2013 Shareholder Representative Services LLC. All rights reserved. www.shareholderrep.com

2013 SRS M&A Post-Closing Claims Study | 56

The information herein may not be stripped of any copyright or trademark information or copied, published or used, in whole or in part, for any other purpose than as expressly authorized by SRS. In preparing this study, we have relied upon and assumed, without independent verification, the accuracy and completeness of all information available from public sources or which was provided to us by or on behalf of our clients or which was otherwise reviewed by us. The terms of the agreements surveyed for this Study vary widely and are subject to many competing interpretations; the conclusions presented in this Study are therefore subject to important qualifications that are not expressly articulated herein. SRS makes no representations as to, and no party shall be entitled to rely upon, the legal, regulatory, or tax implications of the matters referred to in this study, and neither SRS nor any of its directors, officers, employees or agents shall incur any responsibility or liability whatsoever to any party in respect of the contents of this study or any matters referred to in, or discussed as a result of, this document.

SAN FRANCISCO BOSTON DENVER ISRAEL p. 415.367.9400

Data Inquiries: [email protected] Prospective Clients: [email protected] Existing Clients: [email protected]


Recommended