i MINISTRY OF ENERGY AND MINERAL DEVELOPMENT 2013 STATISTICAL ABSTRACT Ministry of Energy and Mineral Development, Plot No. 29/33 Kampala Road, P.O. Box 7270, Kampala Tel: +256–414-505942; Fax: +256–414-505941 Email: [email protected]; Website: www.energyandminerals.co.ug THE REPUBLIC OF UGANDA
Transcript
i
MINISTRY OF ENERGY AND MINERAL DEVELOPMENT
2013 STATISTICAL ABSTRACT
Ministry of Energy and Mineral Development, Plot No. 29/33 Kampala Road, P.O. Box 7270, Kampala Tel: +256–414-505942; Fax: +256–414-505941 Email: [email protected]; Website: www.energyandminerals.co.ug
LIST OF TABLES ..................................................................................................................................................... VI
LIST OF FIGURES .................................................................................................................................................. VIII
FOREWORD .......................................................................................................................................................... IX
ACRONYMS ............................................................................................................................................................ X
EXECUTIVE SUMMARY ......................................................................................................................................... XII
1.2 ROLE AND FUNCTIONS ......................................................................................................................................... 1
1.4 MAIN PRIORITIES ................................................................................................................................................. 1
1.5 OTHER IMPORTANT AREAS; ................................................................................................................................. 2
2.0 ENERGY RESOURCES STATISTICS ............................................................................................................... 3
2.1 ELECTRIC POWER ...................................................................................................................................................... 3
2.1.2 Transmission ................................................................................................................................................ 5 2.1.2.1 Transmission route length ...................................................................................................................................... 5 2.1.2.2 Transmission power purchases .............................................................................................................................. 5 2.1.2.3 UETCL power sales ................................................................................................................................................. 6 2.1.2.4 Transmission power losses ..................................................................................................................................... 7 2.1.3 Power Distribution .................................................................................................................................................... 8 2.1.3.1 Umeme Power Purchases ....................................................................................................................................... 8 2.1.3.2 Umeme Electric Power Sales .................................................................................................................................. 9 2.1.3.3 Distribution power losses ..................................................................................................................................... 10
2.2 NEW AND RENEWABLE ENERGY ASSESSMENT STATISTICS ............................................................................................... 11
2.2.1 Charcoal production ................................................................................................................................... 11
2.2.2 Biomass in the Ugandan Energy Mix ......................................................................................................... 12
2.3 ATOMIC ENERGY STATISTICS ..................................................................................................................................... 12
3.0 PETROLEUM SUPPLIES AND DISTRIBUTION STATISTICS .................................................................................. 13
3.1 Petroleum Imports and Import Bill ................................................................................................................ 13
Gravity and Magnetic Data ................................................................................................................................. 22
4.4 WELL TESTING ....................................................................................................................................................... 25
4.7 INVESTMENTS IN THE SECTOR........................................................................................................................ 29
4.8 NON TAX REVENUE (NTR) ....................................................................................................................................... 30
4.9 EMPLOYMENT IN THE OIL AND GAS SECTOR .................................................................................................. 30
5.0 MINERAL STATISTICS ...................................................................................................................................... 32
5.1 STATUS OF MINERAL LICENSING ................................................................................................................................ 32
5.2 NTR ASSESSED AND REPORTED IN 2013 ..................................................................................................................... 32
5.3 MINERAL IMPORTS ................................................................................................................................................. 35
5.4 MINERAL EXPORTS .................................................................................................................................................. 35
APPENDIX 1: ENERGY RESOURCES STATISTICS ..................................................................................................... 37
1.1: UETCL TOTAL VOLUMES PURCHASED ACROSS ALL SUPPLIERS OF ELECTRICITY IN MWH (2007-2013) ........... 37
1.2: UETCL ELECTRICITY SALES IN MWH (2007-2013) ........................................................................................... 37
1.3: LICENSED POWER PROJECTS ..................................................................................................................................... 38
1.4: POWER PROJECTS - AT FEASIBILITY STUDY STAGE - WITH VALID PERMITS ..................................................................... 39
1.5: DISTRICT HEADQUARTERS’ ELECTRIFICATION STATUS ..................................................................................... 41
1.6: UGANDA ENERGY BALANCE FOR 2013 ...................................................................................................................... 44
1.7: ATOMIC ENERGY STATISTICS .................................................................................................................................... 45
1.7.1 Inspections conducted from Jan–Dec 2013 ................................................................................................ 45
1.7.2 Registration of facilities (Phase 1: Kampala District) from Jan–Dec 2013 ................................................. 45
1.7.3 Monitoring of occupationally exposed workers in Uganda from Jan–Dec 2013 ........................................ 45
1.7.4 List of Inspected facilities by AEC from January 2010 to march 2014 ........................................................ 45
1.7.5 List of Licenced facilities by AEC from January 2010 to march 2014.......................................................... 45
1.7.6 Number of Occupationally exposed (radiation) workers being monitored by AEC from Jan 2010 to March
2.2: MONTHLY IMPORTS OF PETROLEUM PRODUCTS IN 2013 .............................................................................................. 49
2.3: SALES OF PETROLEUM PRODUCTS (‘000’ CUBIC METRES) ............................................................................................... 49
2.4: INTERNATIONAL PRICES OF PETROLEUM PRODUCTS ....................................................................................................... 50
2.5: TOTAL IMPORTED VOLUMES PER PRODUCT (01/01/2013-31/12/2013) ....................................................................... 52
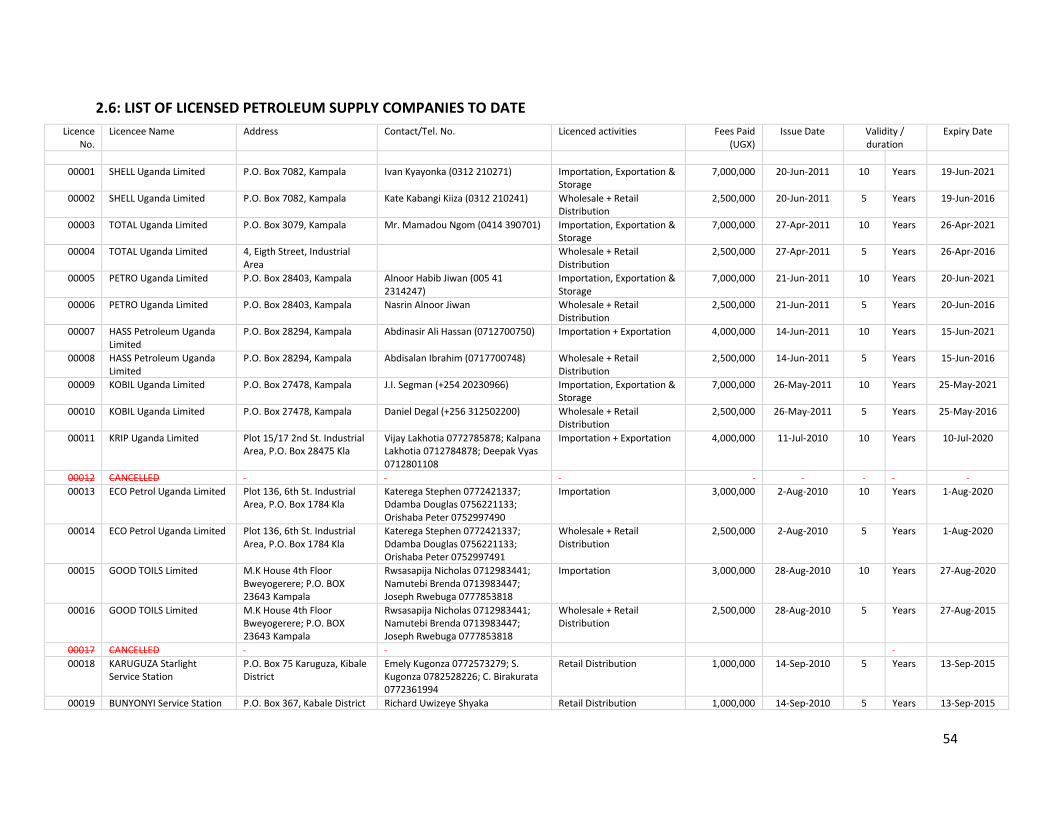
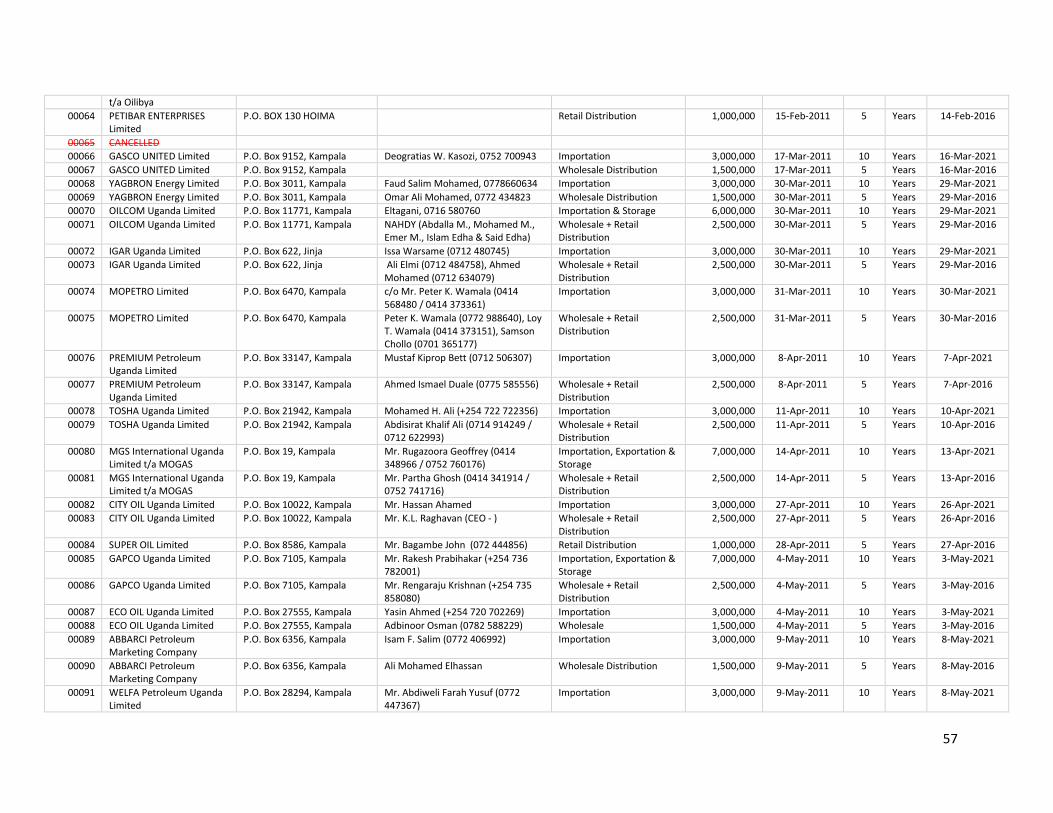
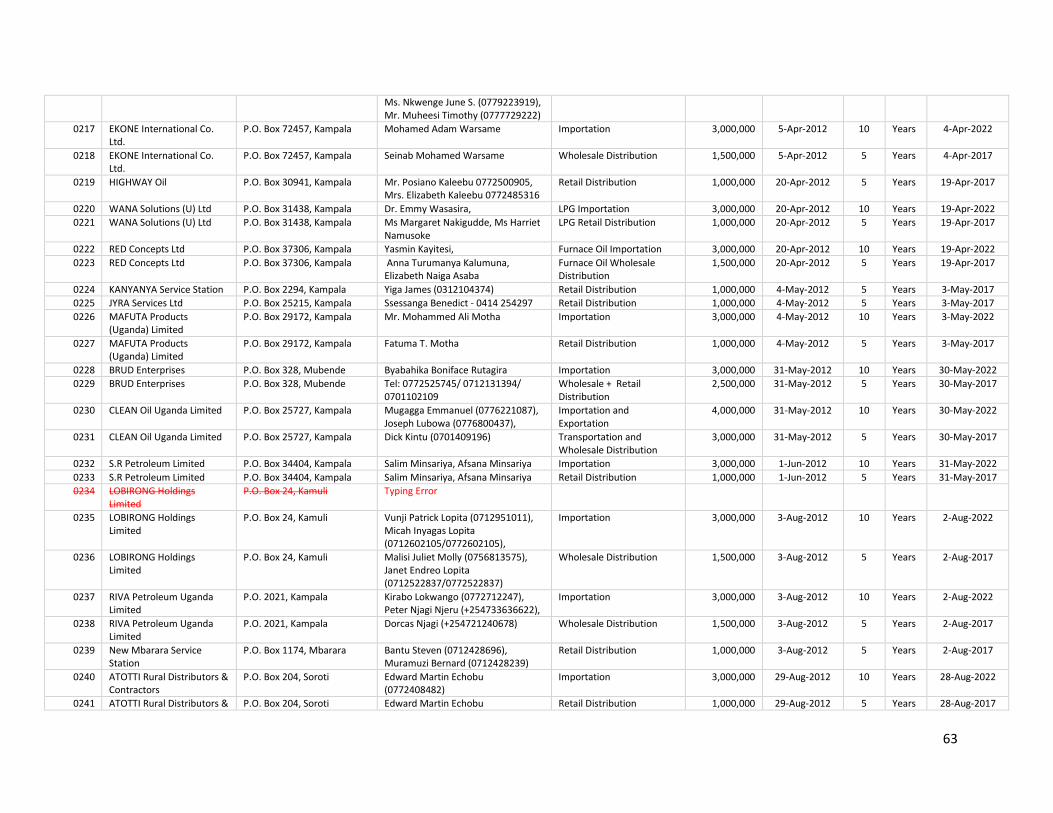
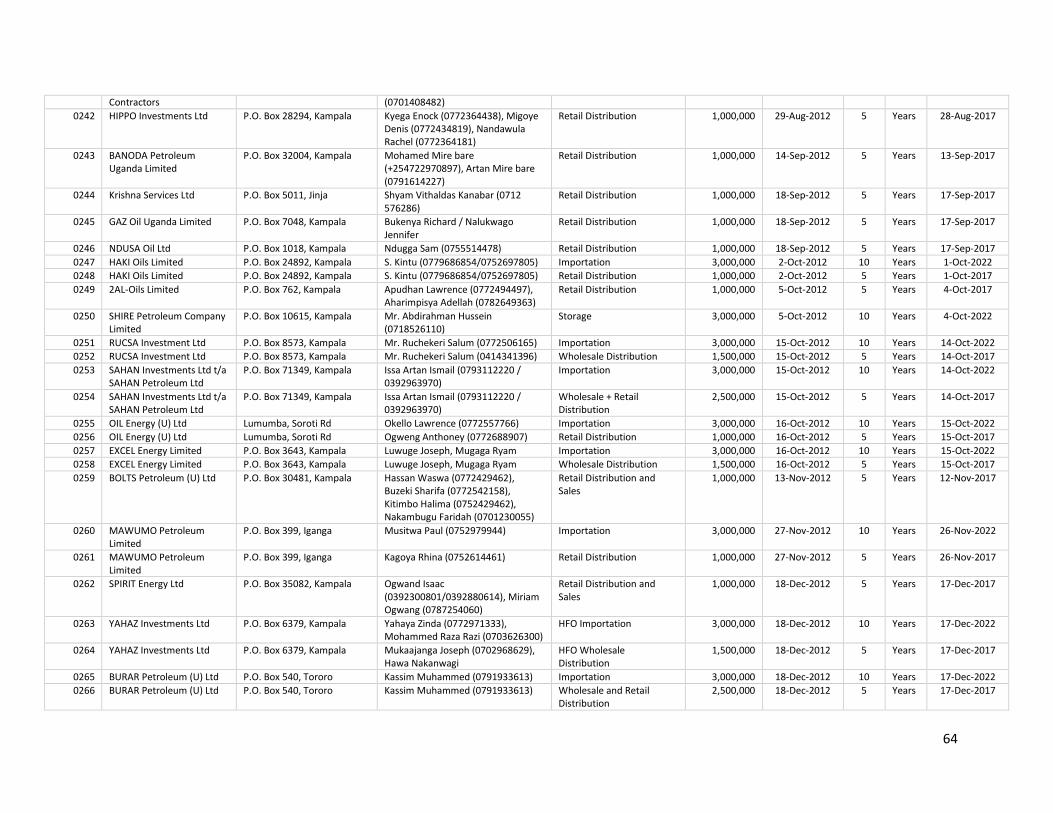
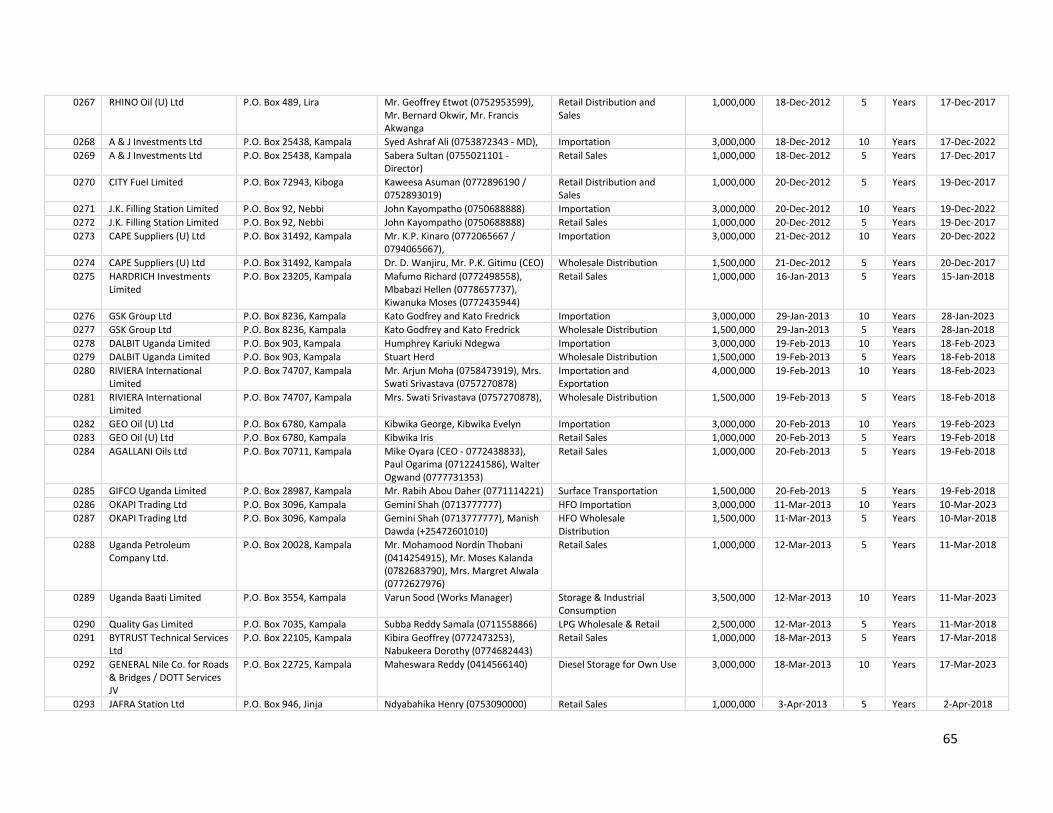
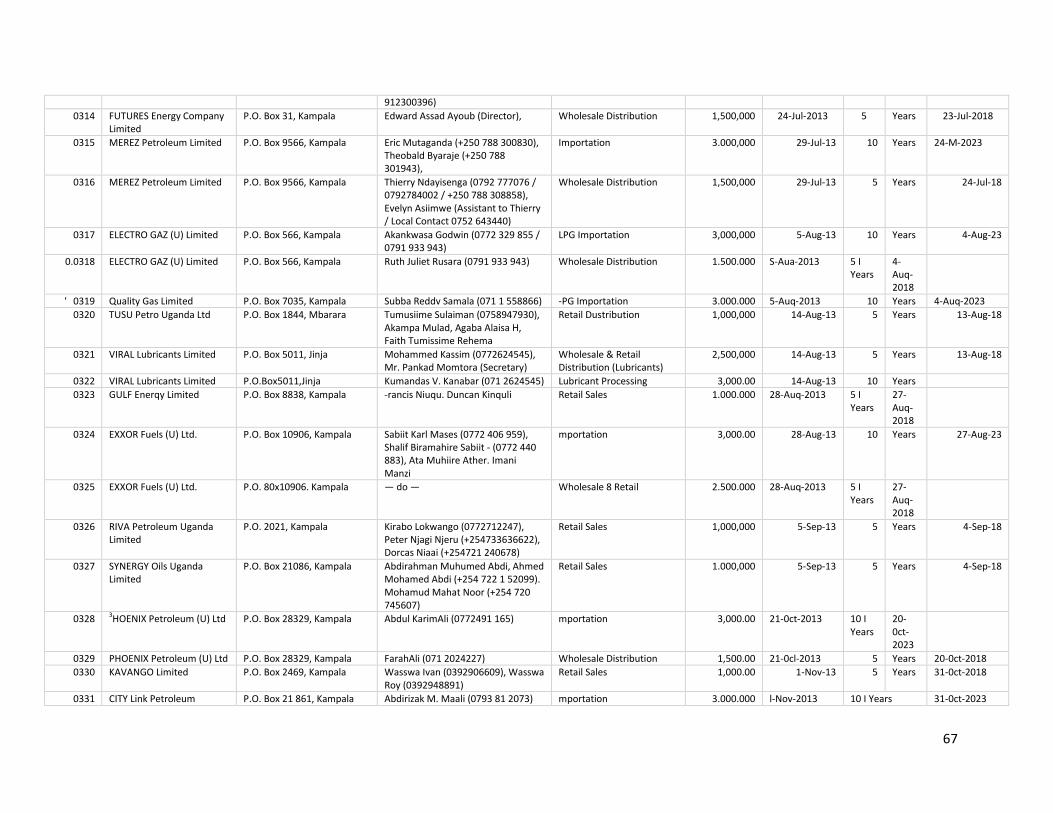
2.6: LIST OF LICENSED PETROLEUM SUPPLY COMPANIES TO DATE ......................................................................... 54
v
2.7: ISSUED PETROLEUM CONSTRUCTION PERMITS TO-DATE ................................................................................ 69
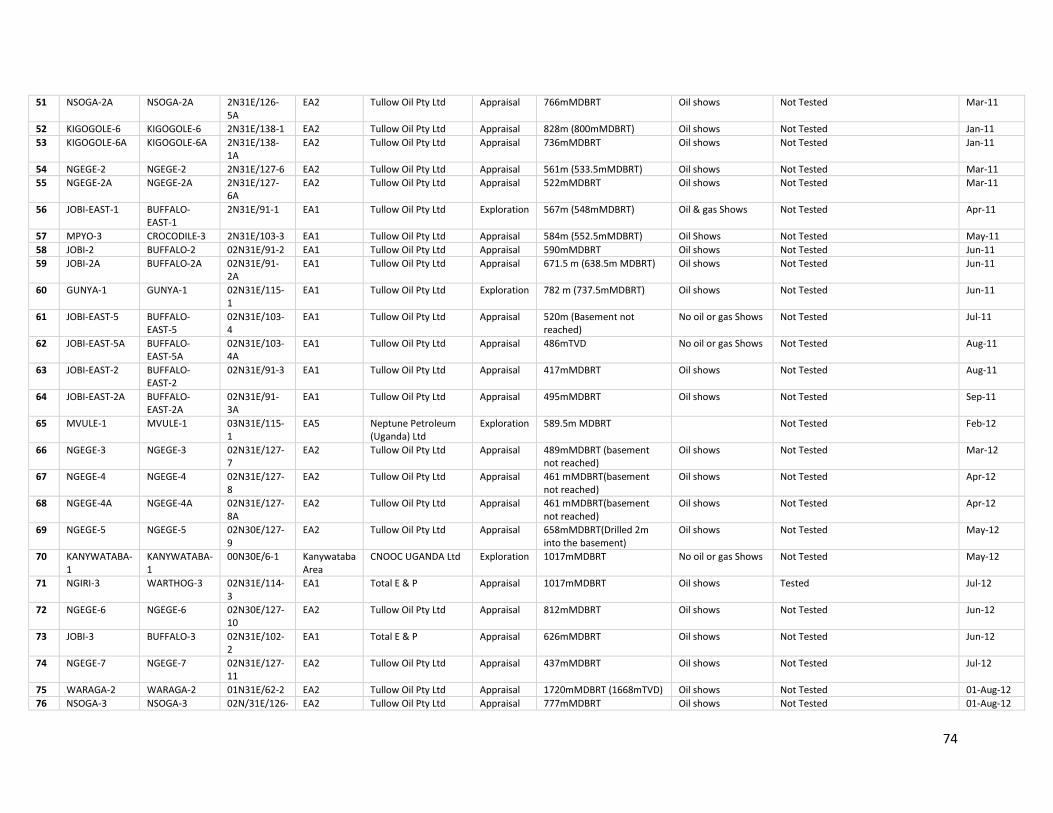
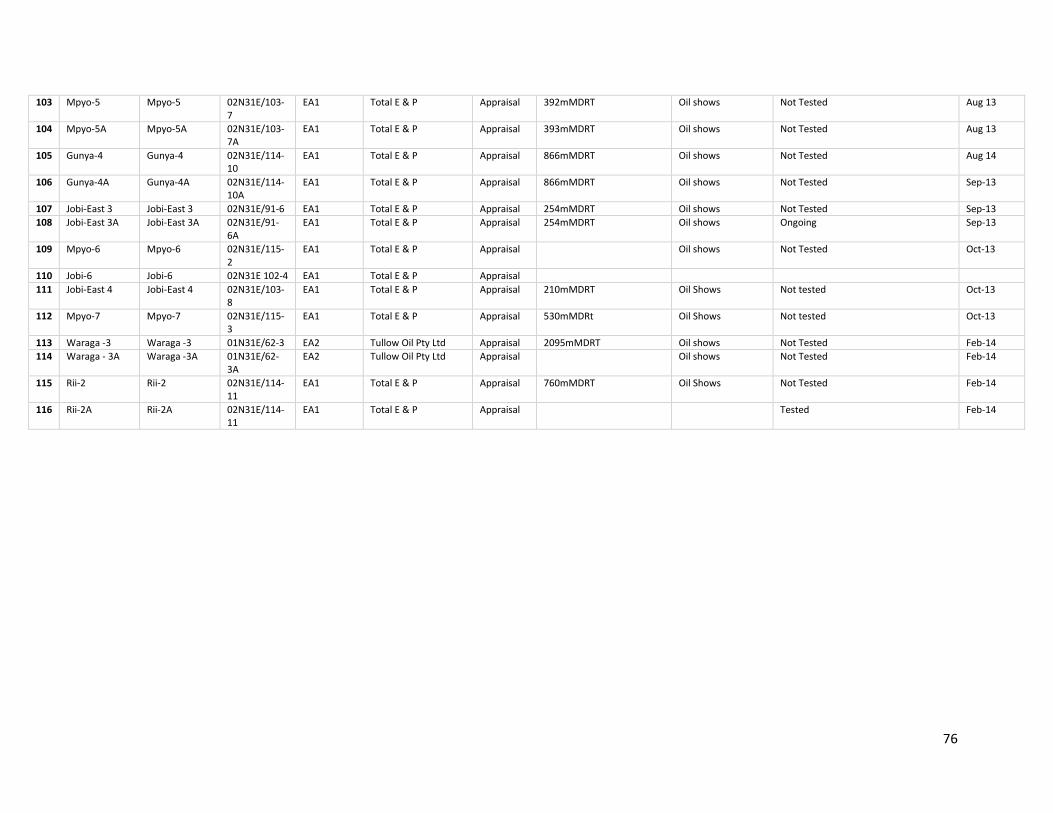
2.8: WELL FACT SHEET FOR WELLS IN THE ALBERTINE GRABEN AS AT JUNE 2013 .................................................... 72
APPENDIX 3: GEOLOGICAL SURVEY AND MINERAL STATISTICS ............................................................................ 77
3.1: LIST OF LICENSED MINERAL DEALERS FOR 2013 .......................................................................................................... 77
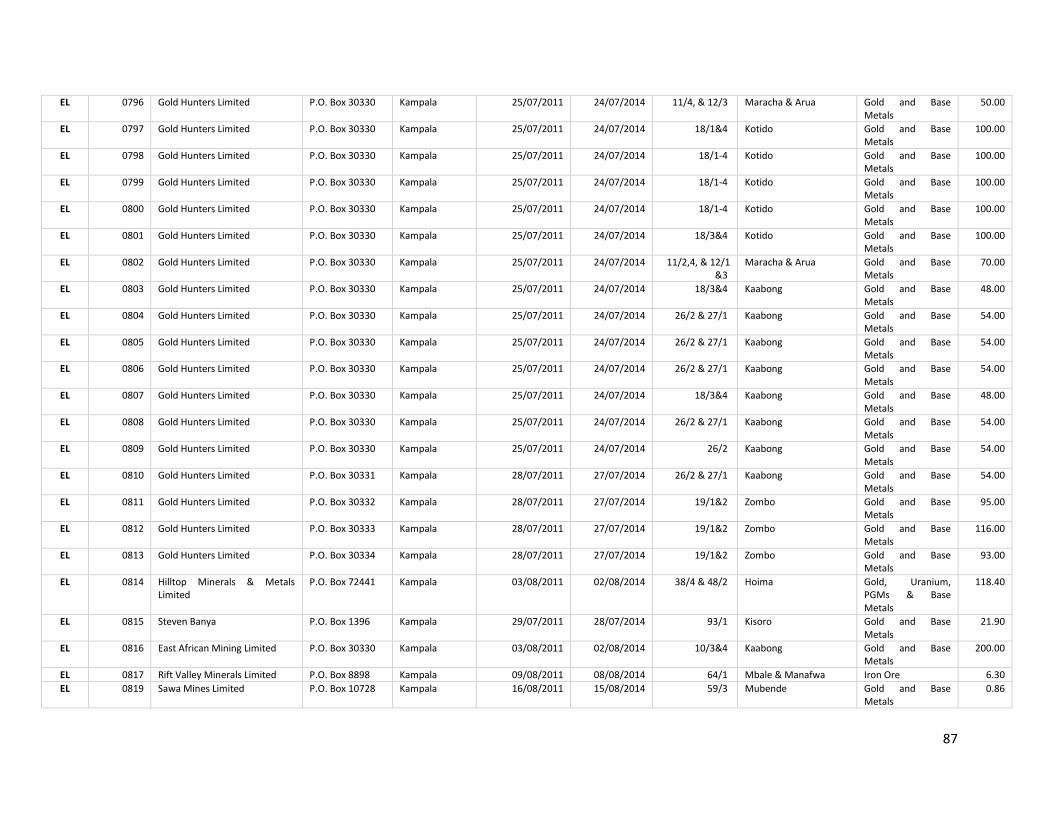
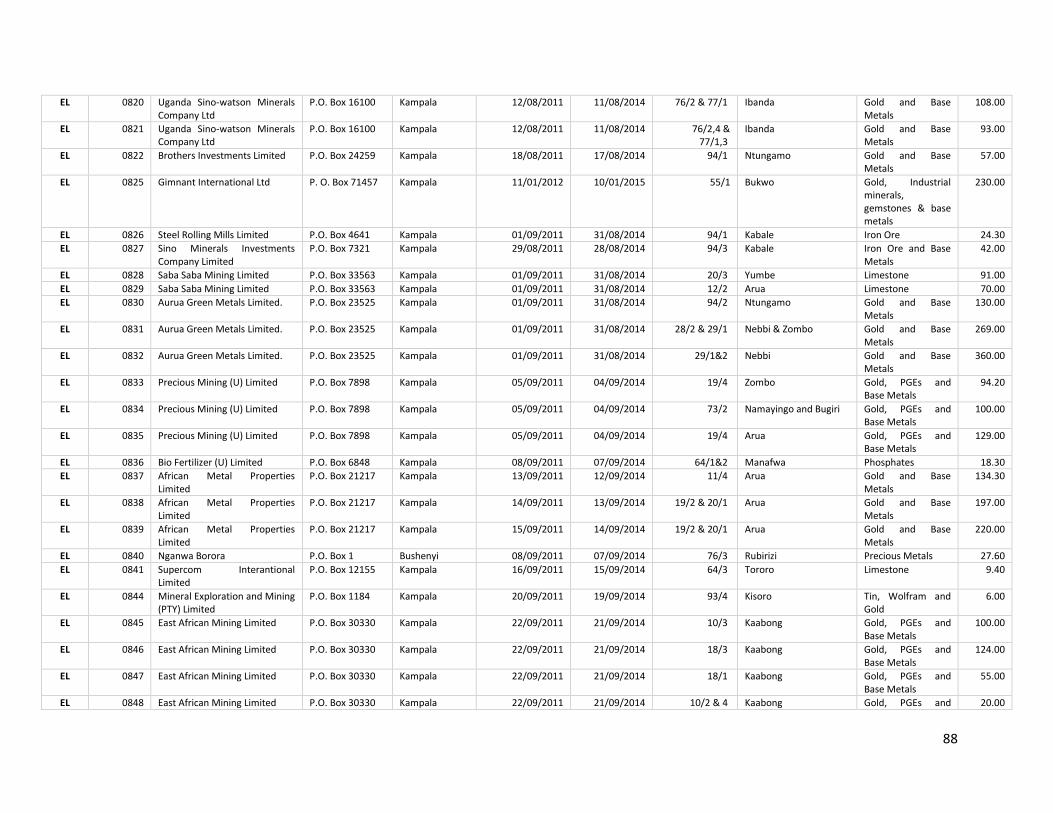
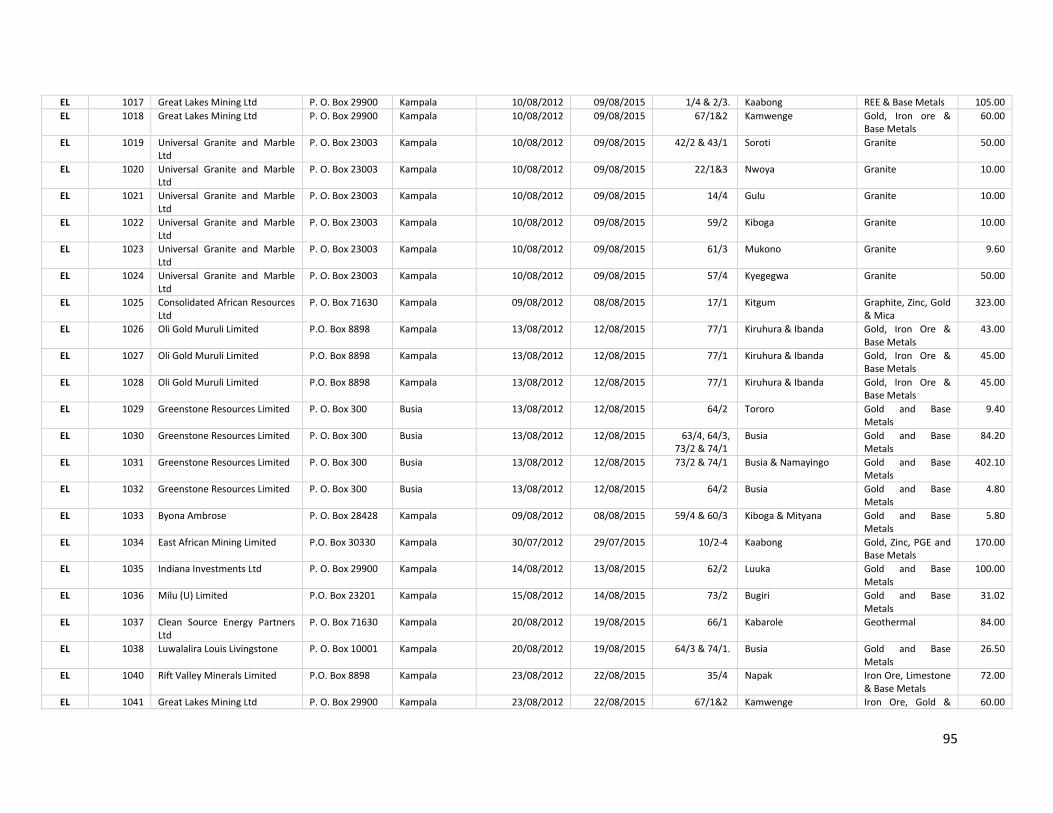
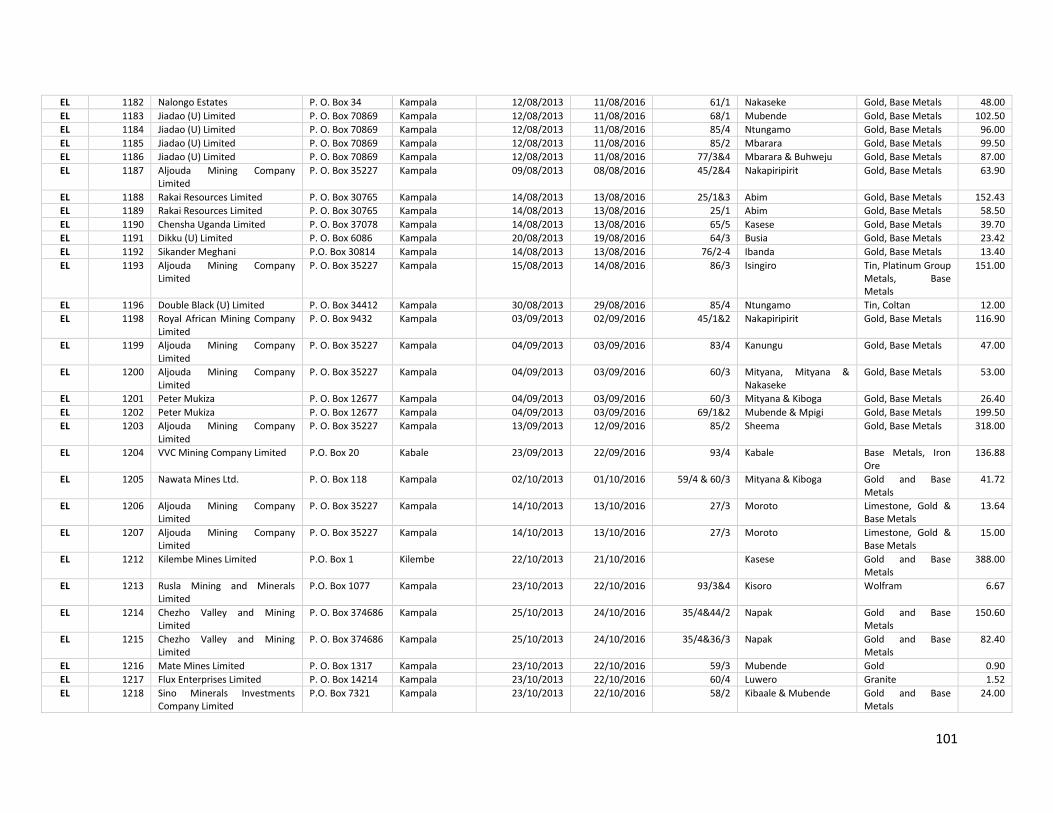
3.2: TITLES OF MINERAL RIGHTS OTHER THAN PROSPECTING LICENSES ..................................................................................... 82
APPENDIX 4: ENERGY AND MINERAL SECTOR META DATA ................................................................................ 107
vi
List of Tables
TABLE 2.1: ELECTRIC POWER SUMMARY STATISTICS .................................................................................................... 3
TABLE 2.4: UETCL POWER PURCHASES IN MWH (2007-2013) ...................................................................................... 5
TABLE 2.5: UETCL POWER SALES IN MWH (2007-2013) ................................................................................................ 6
TABLE 2.6: TRANSMISSION POWER LOSSES (2007-2013) .............................................................................................. 7
TABLE 2.7: UMEME POWER PURCHASES IN MWH ........................................................................................................ 8
TABLE 2.8: UMEME ELECTRIC POWER SALES IN MWH .................................................................................................. 9
TABLE 2.9: DISTRIBUTION POWER LOSSES IN MWH ................................................................................................... 10
TABLE 2.10: MARKET ESTIMATE FOR ETHANOL .......................................................................................................... 11
TABLE 2.11: BIOMASS IN THE UGANDAN ENERGY MIX ............................................................................................... 12
TABLE 2.13: LICENSES AND PERMITS ISSUED FROM JAN–DEC 2013 ........................................................................... 12
TABLE 3.1: ANNUAL PETROLEUM IMPORTS IN LITRES ................................................................................................ 13
TABLE 3.2: MONTHLY IMPORT BILL AND GOVERNMENT REVENUE ............................................................................ 14
TABLE 3.3: ANNUAL IMPORT BILL AND GOVERNMENT REVENUE (2007-2013) .......................................................... 14
TABLE 3.4: ANNUAL SALES OF PETROLEUM PRODUCTS IN '000' CUBIC METRES (2007-2013) ................................... 15
TABLE 3.5: MARKET SHARES OF OIL COMPANIES IN 2013 .......................................................................................... 16
TABLE 3.6: LOCAL PUMP PRICES OF PETROLEUM PRODUCTS (UGX) .......................................................................... 17
TABLE 3.7: INTERNATIONAL CRUDE OIL PRICES .......................................................................................................... 18
TABLE 3.8: MONTHLY INTERNATIONAL REFINED PRODUCT PRICES IN 2013 .............................................................. 19
TABLE 4.1: SEISMIC COVERAGE PER AREA IN 2013 ..................................................................................................... 22
TABLE 4.2: SEISMIC COVERAGE AND COST EXPENDITURE .......................................................................................... 23
TABLE 4.3: WELLS DRILLED BY PURPOSE (1938-2013)................................................................................................. 23
TABLE 4.4: WELLS WITH SIDE TRACKS DRILLED BY EACH COMPANY .......................................................................... 24
TABLE 4.5: TESTED WELLS PER YEAR (2004-2013) ....................................................................................................... 25
TABLE 4.6: MAXIMUM FLOW RATE OF THE PRODUCED CRUDE ................................................................................. 26
TABLE 4.8: CRUDE VOLUMES PRODUCED DURING TESTING (2011-2013) .................................................................. 28
TABLE 4.9: SUMMARY OF PETROLEUM RESOURCES IN THE ALBERTINE GRABEN AS AT DECEMBER 2013 ................ 28
TABLE 4.10: INVESTMENTS IN THE SECTOR ................................................................................................................. 29
TABLE 4.11: NON-TAX REVENUES FROM OIL COMPANIES .......................................................................................... 30
vii
TABLE 4.12: EMPLOYMENT IN THE SECTOR ................................................................................................................ 31
TABLE 5.1: MINERAL LICENSING STATUS JANUARY – DECEMBER, 2013 ..................................................................... 32
TABLE 5.2: NTR ASSESSED AND REPORTED IN 2013 .................................................................................................... 32
TABLE 5.3: MINERAL PRODUCTION FOR 2013 ............................................................................................................. 34
TABLE 5.4: MINERAL IMPORTS IN 2013 ....................................................................................................................... 35
TABLE 5.5: MINERAL EXPORTS IN 2013 ....................................................................................................................... 35
viii
List of figures
FIGURE 2.1: ELECTRICITY GENERATION BY SOURCE ................................................................................................. 3
FIGURE 4.6: CAPITAL INVESTMENTS ADDED PER OIL COMPANY ............................................................................ 30
ix
Foreword
The Ministry of Energy and Mineral Development (MEMD) has published its annual 2013 Statistical Abstract which is a key output for the continuous implementation of the Energy and Mineral Development Sector Strategic Plan for Statistics (EMDSSPS). This plan feeds into the broader Plan for National Statistical Development (PNSD), being coordinated by the Uganda Bureau of Statistics (UBOS). This publication intends to enable planners and Policy makers to make informed decisions in the country. The 2013 Statistical Abstract presents statistics on Energy Resources, Petroleum Supplies, Petroleum Exploration & Production activities and Mineral activities within the country. The information contained covers a period of seven years or less. The Ministry appreciates all sister agencies within the EMS that provided some of the data contained. In a special way, I wish to thank EMS statistics committee comprised of Emmanuel Ajutu (Chairman/Head Sector Planning Unit), Michael Ahimbisibwe (Senior Energy Officer), Bridget Nabagereka (Electrical Engineer), Joseph Elangot (Principal Petroleum Officer), Vivienne Sempala (Palynologist), John Kennedy Okewling (Mining Engineer), Ian Kisawuzi (Ag. Sen. Statistician), Isaac Baziwe (Senior Economist), Hellen Nakato (Statistician), Paul Basudde (Economist), Patrick Muhindo (Economist), Denis Musiime T (Nuclear Engineer) and Deo Sekyanzi (Radiation Protection Officer-AEC) for compiling this document. Lastly, I wish to commend UBOS for the continuous support it renders to all MDAs as they implement their SSPS. Copies of this document can be obtained from the Ministry’s headquarters, Amber House, Plot 29/33 Kampala Road.
F.A. Kabagambe Kaliisa
PERMANENT SECRETARY
x
ACRONYMS
CNOOC China National Offshore Oil Corporation
DRC Democratic Republic of Congo
EA Exploration Areas
EL Exploration License
EMDSSPS Energy and Mineral Development Sector Strategic Plan for Statistics
EMS Energy and Mineral Sector
ERA Electricity Regulatory Agency
ERD Energy Resources Department
ERT Energy for Rural Transformation
GSMD Geological Survey and Mines Department
HHI Hierfindahl Hirschman Index
IDA International Development Association
IDO Industrial Diesel Oil
IPP Isolated Power Plant
KCCL Kasese Copper Cobalt Company Limited
KML Kilembe Mines Limited
KPLC Kenya Power and Lighting Company
KSW Kakira Sugar Works
Kv Kilo Volts
KWh Kilo Watt Hours
LL Location License
MDL Mineral Dealers License
MEMD Ministry of Energy and Mineral Development
MMBBL Million Barrels (oil reserves)
MPS Ministerial Policy Statement
MW Mega Watt
MWh Mega Watt Hours
NSS National Statistical System
NTR Non Tax Revenue
PEPD Petroleum Exploration and Production Department
PL Prospecting License
PNSD Plan for National Statistical Development
PSD Petroleum Supply Department
REA Rural Electrification Agency
SEG Society of Exploration Geophysicists
SPE Society of Petroleum Engineering
xi
SPU Sector Planning Unit
SSPS Sector Strategic Planning for Statistics
STOIIP Stock Tank Oil Initially In Place
TENESCO Tanzania Electricity Supply Company
TOE Tons of Oil Equipment
UBOS Uganda Bureau of Statistics
UEDCL Uganda Electricity Distribution Company Limited
UEGCL Uganda Electricity Generation Company Limited
UETCL Uganda Electricity Transmission Company Limited
UGX Uganda Shillings
URA Uganda Revenue Authority
US$ United States Dollar
“-” Not Applicable/Not Available
xii
Executive summary
The MEMD Statistical Abstract is an annual publication that presents statistics on the Energy
and Mineral Sector (EMS). Such statistics include Energy, Petroleum and Mineral Resources.
Some of the data presented in this publication dates back as far as 2007.
The data was collected by the Ministry’s Statistics Committee which has members from all
departments and sister agencies, and the compilation done by the statistics section within the
Sector Planing Unit (SPU). The document is composed of tables, graphs and a few narratives.
Five chapters make up this publication followed by a list of appendices. However, some of the
data in the main body of the document is summarized, but referenced to more detailed tables
in the appendices.
Chapter one covers the Ministry’s overview such as; it’s Mandate, Role, Goal and main
priorities.
Chapter two presents statistics on Energy resources such as Electric Power, New and
Renewable resources with the following highlights;
Generation
i. The National Grid Electrification Rate in 2013 stood at 14.9 % (2012 RE II Survey).
ii. The Generation mix by the end of 2013 stood at 845.735 MW, of which 696.4 MW were
from hydro, 119.835 MW from Thermal and 29.5 MW from Co-Generation sources.
iii. The total electric power generation stood at 2,992,689 MWh.
iv. Power exports stood at 105,774 MWh while imports stood at 45,928 MWh.
Transmission
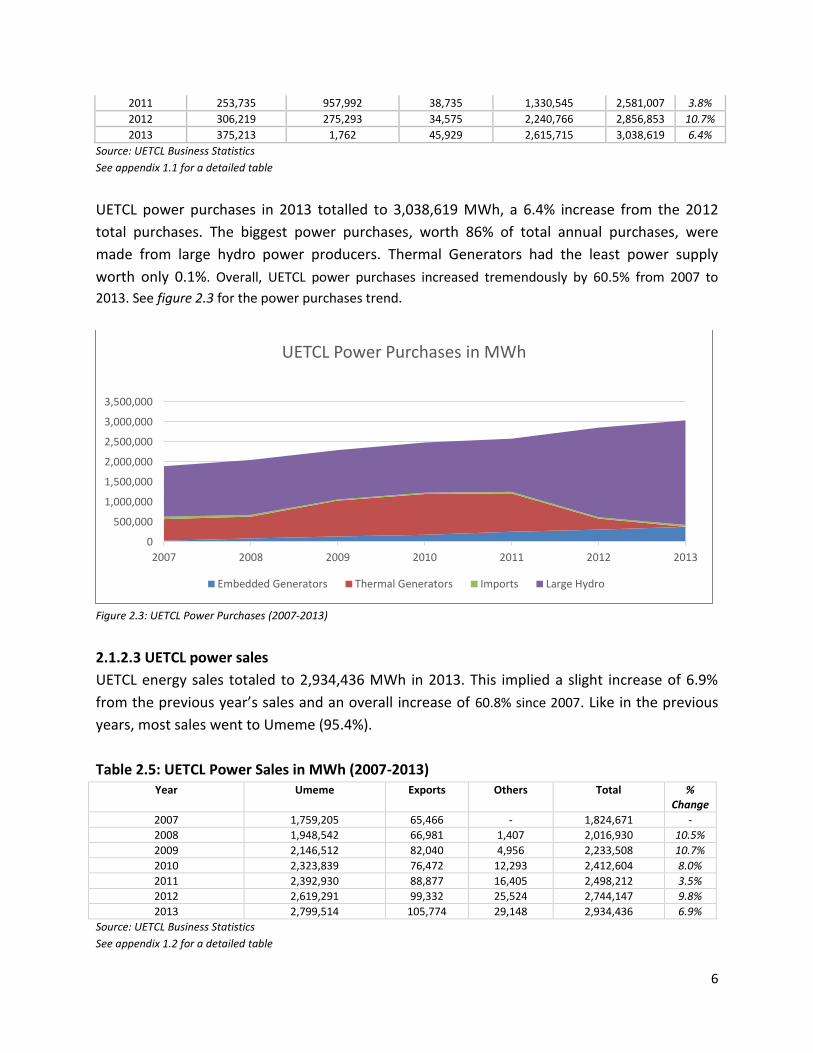
i. UETCL power purchases in 2013 totalled to 3,038,619 MWh, a 6.4% increase from the
2012 total purchases.
ii. The biggest power purchases, worth 86% of total annual purchases, were from large
hydro power producers. Thermal Generators had the least power supply worth only
0.1%.
iii. Overall, UETCL power purchases increased tremendously by 60.5% from 2007 to 2013.
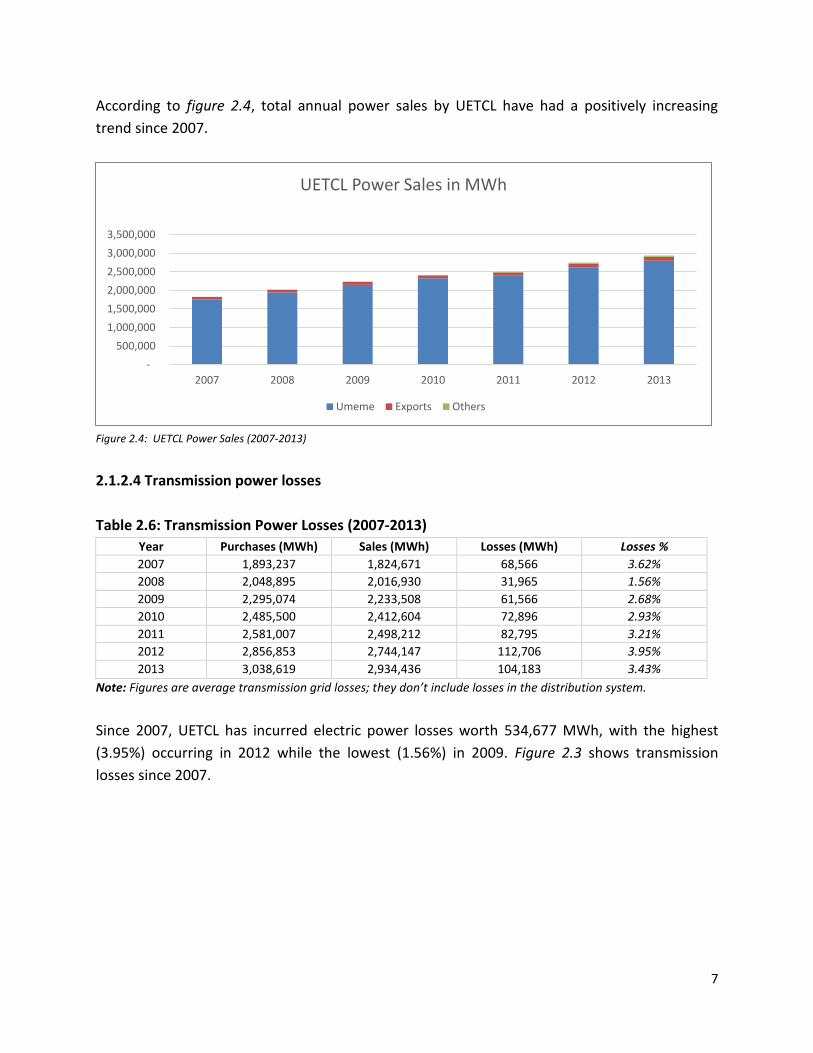
iv. UETCL energy sales totaled to 2,934,436 MWh in 2013. This implied a slight increase of
6.9% from the previous year’s sales and an overall increase of 60.8% since 2007.
v. Like in the previous years, most sales went to Umeme (95.4%).
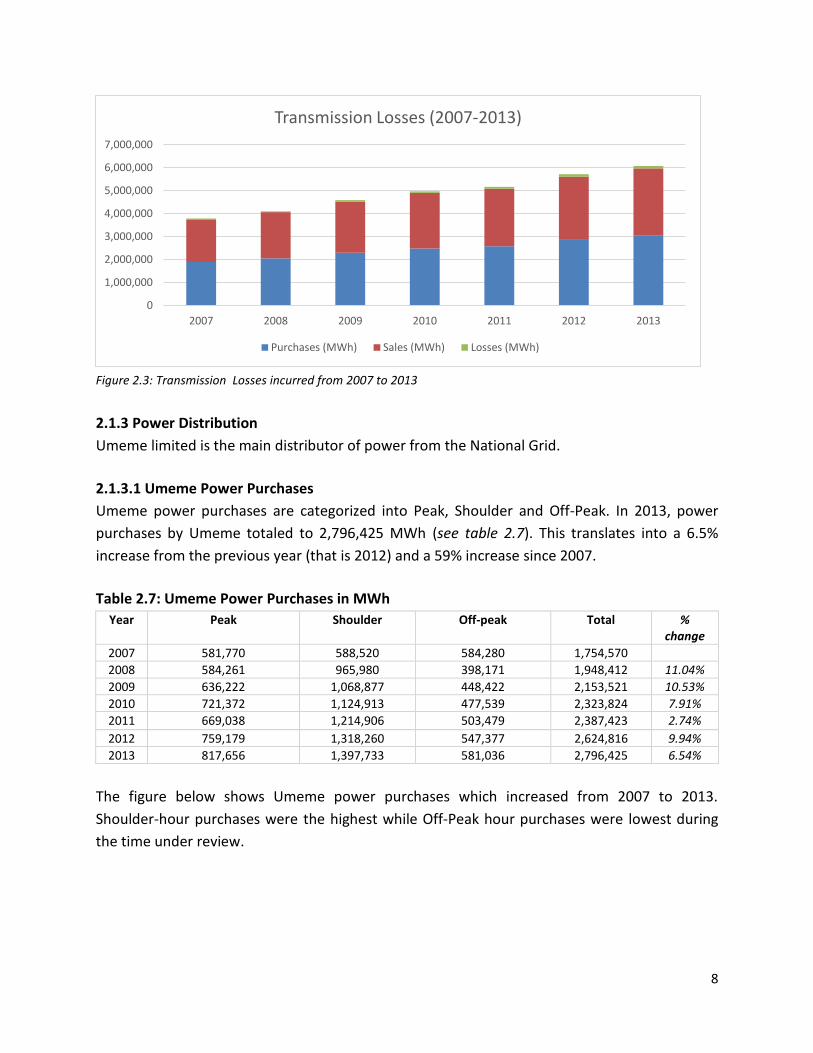
vi. Since 2007, UETCL has incurred electric power losses worth 534,677 MWh, with the
highest (3.95%) occurring in 2012 while the lowest (1.56%) in 2009.
xiii
Distribution
i. In 2013, power purchases by Umeme totaled to 2,796,425 MWh, translating into a 6.5%
increase from the previous year and a 59% increase since 2007.
ii. Umeme sold a total of 2,091,824 MWh in 2013, translating into a 7.9% increase from
the previous year and an 83.8% increase since 2007.
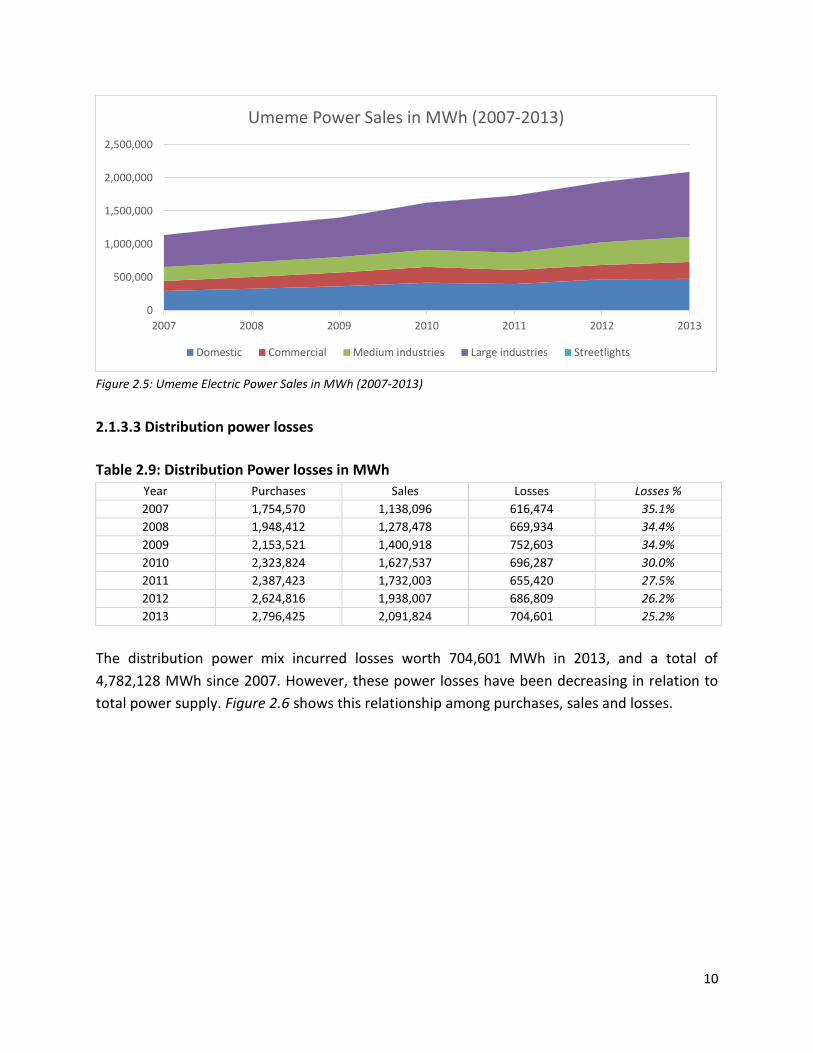
iii. The distribution power mix incurred losses worth 704,601 MWh in 2013, and a total of
4,782,128 MWh since 2007.
Atomic Energy Statistics
i. A total of 99 licenses were issued out by the Atomic Energy Council to various
facilities
ii. Among these, 60 were Industrial while 39 were Medical facilities.
Chapter Three presents statistics on petroleum supplies and distribution in the country. Such
statistics include; Imports, Sales, Prices, Non Tax Revenue and Market shares of oil companies
as highlighted below;
Petroleum Imports
i. Petroleum imports in 2013 totalled to 1.313 billion litres, of which 51.2%, 5.6% and
43.2% was AGO, BIK and PMS respectively.
ii. Between 2007 and 2013, total annual imports of petroleum products increased by
35.7%. Between 2012 and 2013, these imports increased by 7%.
iii. The total import bill in 2013 was UGX 2,720 billion while Government Revenue totaled
to UGX 849 billion.
iv. There was a 321% increase in the total annual import bill since 2007.
v. The year 2013 recorded the highest import bill worth UGX 2,720 billion while 2007
recorded the lowest worth UGX 646 billion.
vi. The year 2009 recorded the highest figure for Government revenue worth UGX 1,216
billion while 2007 recorded the lowest collections worth UGX 450 billion.
vii. Overall, Government annual revenue collection from petroleum products increased by
88.7% between 2007 and 2013.
Petroleum Sales
i. Petroleum sales in 2013 totalled to 1.349 billion cubic metres.
ii. Gas oil was the most sold product with 602.9 million cubic metres followed by Premium
with 488.6 million cubic metres. On the other hand, there were no sales for IDO while
products within ‘Others’ such as Chemicals recorded the least sales worth only 41,100
cubic metres.
xiv
iii. There was a 60.1% overall increase in sales from 2007 to 2013 with the year 2012
recording the highest sales worth 1.4 billion cubic metres. On the other hand, a 4.5%
decrease in sales was realized from 2012 to 2013.
Market Shares of Oil Companies
i. Total and Shell/Vivo Energy (U) limited continued to dominate the Petroleum industry
with Total taking up 16.57% while Vivo energy 15.38% of the entire industry.
ii. During the year 2013, many small companies joined the industry.
Prices of Petroleum Products
i. Local pump prices for petroleum products averaged at UGX 3,716, UGX 2,819 and UGX
3,375 for Petrol, Kerosene and Diesel, respectively.
ii. International Refined Product Prices for Nymex-Petrol, IPE-Diesel and Nymex-Kerosene
averaged at US$ 105.9467 per tonne, 108.6225 per tonne and 97.8725 per tonne in
2013 respectively.
iii. Crude prices averaged at US$ 105.9467 per barrel, 108.6225 per barrel and 97.8725 per
barrel for Opec Basket, IPE Brent and Nymex Lt Sweet in 2013 respectively.
Chapter Four contains statistics on Petroleum Exploration and Production particularly on
Licensing, Exploration activities and Extended Well Testing as summarized below;
Gravity and Magnetic Data
i. A total of 60 gravity-magnetic surveys covering approximately 20,260.89 line kilometers
have been acquired to date.
ii. By the end of 2013 the cumulative seismic data acquired was 6,564.63 km2 of 2D and
1,608.06 km2 of 3D coverage.
Exploration/Appraisal Drilling
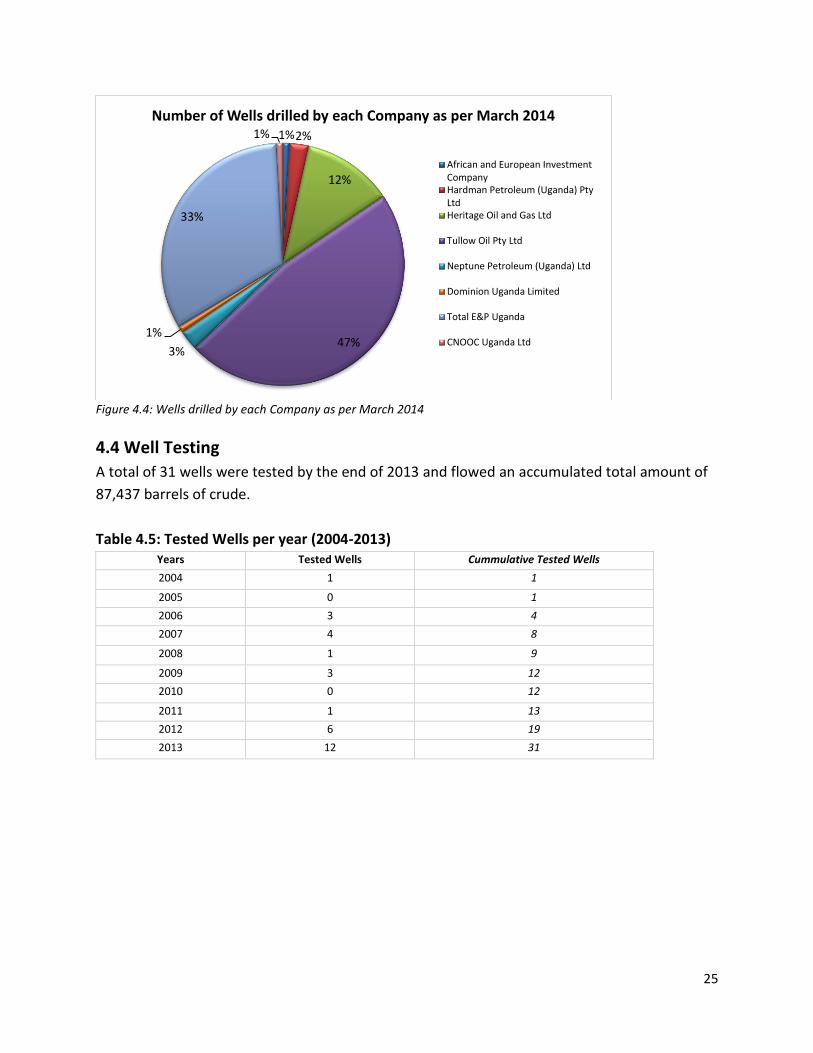
i. A total of 112 onshore wells were drilled by the end of 2013 with 77 appraisal wells and
35 exploration wells.
ii. The year 2013 registered the highest number of appraisal wells drilled totaling to 25.
Tullow Oil Pty Ltd registered the overall highest number of wells drilled by the end of
2013.
Well Testing
i. A total of 31 wells were tested by the end of 2013 and flowed an accumulated total
amount of 87,437 barrels of crude.
xv
Flow Rates
i. Kingfisher-2 registered the highest flow rate of 13,830 barrels of oil per day while Jobi
East-6A registered the lowest flow rate of 4.3 barrels of oil per day so far.
ii. Only two gas wells (Turaco-3 and Nzizi-2) have been tested so far.
iii. The gas flow rate stood at 60 million standard cubic feet and 14.13 million standard
cubic feet of gas per day respectively.
Volumes of Crude
i. The highest volume of 14,364 barrels of oil was reported from Kingfisher-2 and the least
from Lyec and Mpyo-4/4A wells.
ii. One injection test was performed at Jobi-5A.
Petroleum Resources
i. The current Stock Tank Oil in Place (STOIIP) estimate in the Albertine Graben stands at
6.5MMBBL of which 1.4 billion barrels is estimated to be recoverable.
ii. The Gas Initially in Place (GIIP) stands at 461BCF.
Investments in the Sector
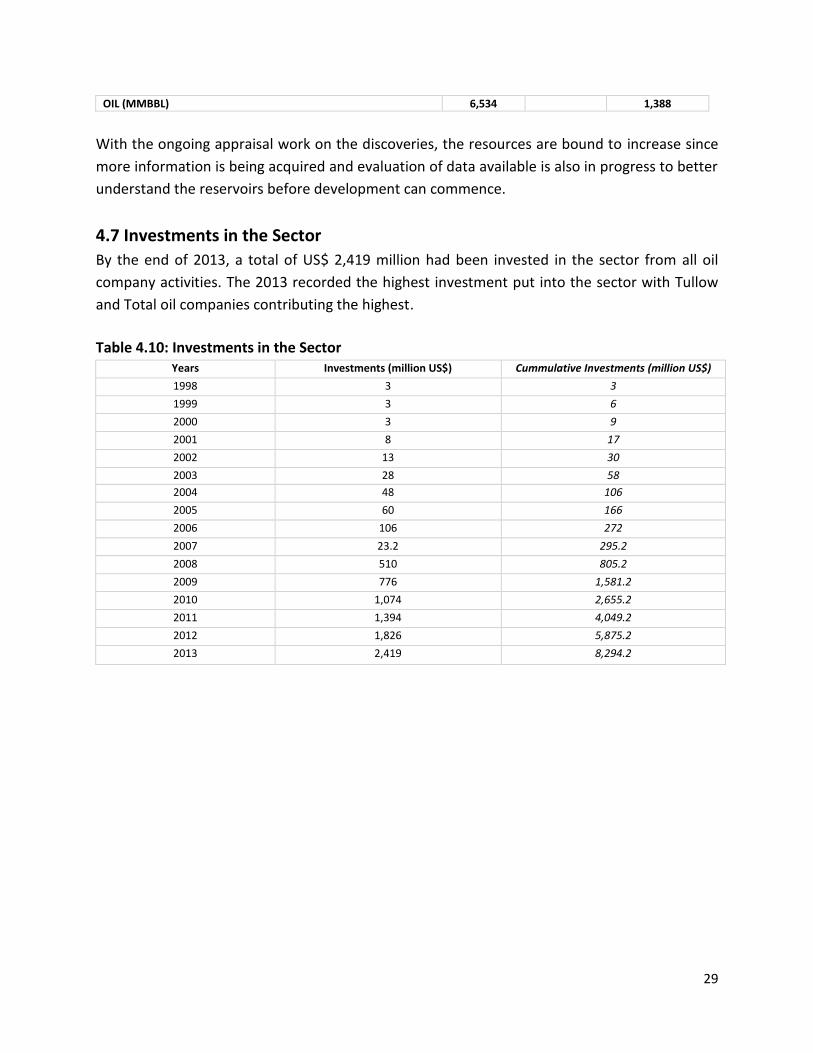
i. By the end of 2013, a total of US$ 2,419 million had been invested in the sector from all
oil company activities.
ii. The 2013 recorded the highest investment put into the sector with Tullow and Total oil
companies contributing the highest.
Non Tax Revenue (NTR)
i. The Ministry collected NTR amounting to US$ 2,863 thousand within 2013.
ii. An accumulated amount of US$ 8,828 thousand has been received from 2002 to the end
of 2013.
Chapter Five presents statistics on Mineral dealings in the Country particularly on Licensing,
Non Tax Revenue, Production, Imports and Exports as highlighted below;
Licensing
i. A total of 447 mineral licenses were granted to various companies in 2013.
ii. Amongst these, 164 were Exploration licenses (EL), 159 Prospecting licenses (PL), 95
Mineral Dealers Licenses (MDL), 5 Mining Lease, 3 Retention Licenses (RL) and 21
Location Licenses (LL).
iii. At the same time, 47 licenses were renewed, 387 licenses expired and no license was
revoked.
xvi
iv. By 31st December 2013, a total of 873 licenses were in operation by various companies
Non-Tax Revenue
i. UGX 4,944 billion in NTR was collected in 2013 registering a decline of 4% from UGX
5.158 billion collected in 2012
ii. Royalties’ arrears registered to approximately UGX 3,368 billion (68%)
Mineral Production, Imports and Exports
i. All minerals produced in 2013 were valued at UGX 149,034 billion
ii. This translates into a 28% decrease from UGX 207,819 million in 2012.
iii. Gold was the only mineral that was imported and valued in 2013 with a total of 160.8
kgs worth UGX. 21,208 billion.
iv. Like imports, mineral exports in 2013 exceeded those of 2012 by UGX 13.78 billion
translating into an increase of 19.7%
1
1.0 SECTOR OVERVIEW The Ministry of Energy and Mineral Development (MEMD) is responsible for the Energy and Mineral Sub-Sectors in Uganda including Oil and Gas. The sector is guided by policies and associated legislations in the Energy, Minerals, Oil and Gas. While the Ministerial Policy Statement (MPS) and Annual Report highlight the ministry’s financial and physical performance, The Statistical Abstract show the statistics generated for the technical information, for the interest of the public and all stakeholders to get updates of the sector for a given year.
1.1 MANDATE
“To establish, promote the development, strategically manage and safeguard the rational and sustainable exploitation and utilization of energy and mineral resources for social and economic development”.
1.2 ROLE AND FUNCTIONS
i) To provide policy guidance in the development and exploitation of the energy and mineral resources.
ii) To create an enabling environment in order to attract investment in the development, provision, and utilization of energy and mineral resources.
iii) To acquire, process and interpret technical data in order to establish the energy and mineral resource potential of the country.
iv) To inspect, regulate, monitor and evaluate activities of private companies in energy and mineral sectors so that the resources are developed, exploited and used on a rational and sustainable basis.
1.3 GOALS
In order to contribute effectively to poverty reduction, the sector’s policy goals are; i) To meet the Energy needs of Uganda’s population for social and economic development in
an environmentally sustainable manner. ii) To use the county’s oil and gas resources to contribute to early achievement of poverty
eradication and create lasting value to society. iii) To develop the mineral sector for it to contribute significantly to sustainable national
economic and social growth.
1.4 MAIN PRIORITIES
In the medium term, the key priorities of the Ministry are;
i) To increase electricity generation capacity and transmission network. ii) To increase access to modern energy services through rural electrification and renewable
energy development. iii) To promote and monitor petroleum exploration and development in order to achieve
national production.
2
iv) To develop petroleum refining and pipeline transportation infrastructure v) To streamline petroleum supply and distribution; and vi) To promote and regulate mineral exploration, development, production and value
addition.
1.5 OTHER IMPORTANT AREAS;
i) To promote the efficient utilization of energy.
ii) To promote free and fair competition in petroleum supply and marketing industry.
iii) To monitor geo-tectonic disturbances and radioactive emissions.
3
2.0 Energy Resources statistics
The Energy resources section comprises of statistics on Electrical Power, New & Renewable
Energy and Atomic Energy.
2.1 Electric power
Statistics on electric power vary from Generation and Transmission to Distribution. According to
table 2.1, the National Grid Electrification rate in 2013 stood at 14.9% as established during the
2012 Rural Electrification II survey. The total electric power generation stood at 2,992,689
MWh while power worth 105,774 MWh and 45,928 MWh was exported and imported into the
country, respectively.
Table 2.1: Electric Power summary statistics Statistics Produced 2010 2011 2012 2013
Feedstock and processing capacity for about 45 million litres is possible when all the sugar industries get involved.
0
1,000,000
2,000,000
3,000,000
4,000,000
5,000,000
6,000,000
2007 2008 2009 2010 2011 2012 2013
Distribution Power Losses in MWh
Purchases (MWh) Sales (MWh) Losses (MWh)
12
The last row gives the summary of the proposed blending increases every two years, such that
the 10% blending level will be achieved in the 7th year. This scenario is what has been adopted
in the identification and comparison of feed stocks for ethanol. As with Petrol/Ethanol blends, a
phased-in approach is contemplated under which the blending ratio is increased gradually to
achieve a 20% blend ratio by 2021.
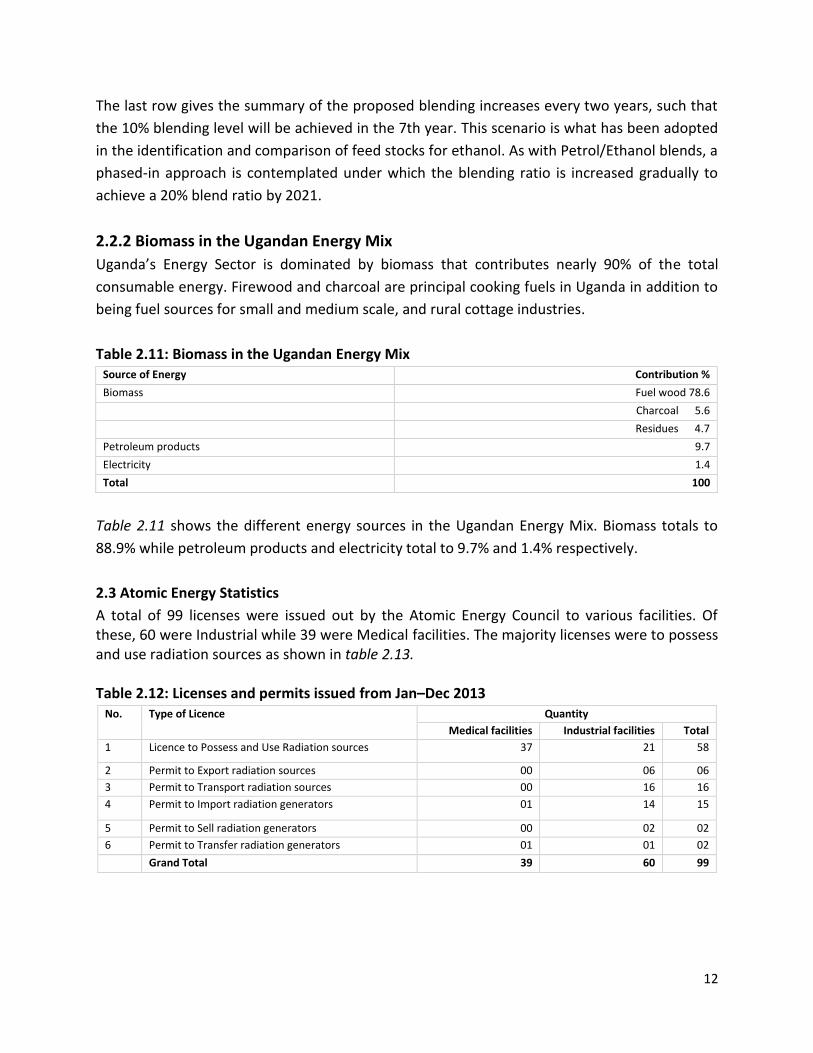
2.2.2 Biomass in the Ugandan Energy Mix
Uganda’s Energy Sector is dominated by biomass that contributes nearly 90% of the total
consumable energy. Firewood and charcoal are principal cooking fuels in Uganda in addition to
being fuel sources for small and medium scale, and rural cottage industries.
Table 2.11: Biomass in the Ugandan Energy Mix Source of Energy Contribution %
Biomass Fuel wood 78.6
Charcoal 5.6
Residues 4.7
Petroleum products 9.7
Electricity 1.4
Total 100
Table 2.11 shows the different energy sources in the Ugandan Energy Mix. Biomass totals to
88.9% while petroleum products and electricity total to 9.7% and 1.4% respectively.
2.3 Atomic Energy Statistics
A total of 99 licenses were issued out by the Atomic Energy Council to various facilities. Of these, 60 were Industrial while 39 were Medical facilities. The majority licenses were to possess and use radiation sources as shown in table 2.13. Table 2.12: Licenses and permits issued from Jan–Dec 2013
No. Type of Licence Quantity
Medical facilities Industrial facilities Total
1 Licence to Possess and Use Radiation sources 37 21 58
2 Permit to Export radiation sources 00 06 06
3 Permit to Transport radiation sources 00 16 16
4 Permit to Import radiation generators 01 14 15
5 Permit to Sell radiation generators 00 02 02
6 Permit to Transfer radiation generators 01 01 02
Grand Total 39 60 99
13
3.0 Petroleum Supplies and Distribution statistics
This section presents statistics on petroleum supplies and distribution. Such statistics include
petroleum imports, exports, sales, import bill and Government revenue. It also includes market
shares of oil companies and prices of petroleum products.
3.1 Petroleum Imports and Import Bill
3.1.1 Petroleum Imports
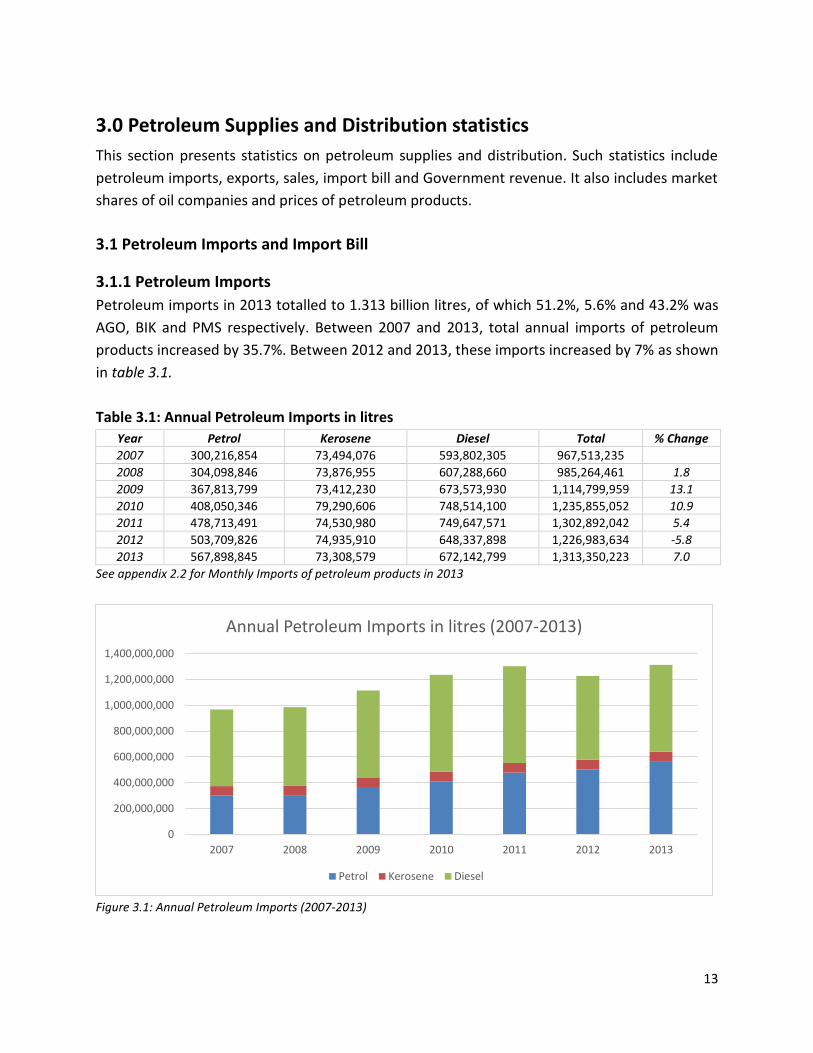
Petroleum imports in 2013 totalled to 1.313 billion litres, of which 51.2%, 5.6% and 43.2% was
AGO, BIK and PMS respectively. Between 2007 and 2013, total annual imports of petroleum
products increased by 35.7%. Between 2012 and 2013, these imports increased by 7% as shown
Total 842,266.30 1,090,826.00 1,298,355.60 1,239,452.40 1,299,695.80 1,411,522.50 1,348,618.20
Annual % change 29.5 19.0 -4.5 4.9 8.6 -4.5
0
500
1000
1500
2000
2500
3000
3500
4000
2007 2008 2009 2010 2011 2012 2013
Annual Import Bill and Government Revenue (2007-2013)
Annual Import Bill Government Revenue
16
See appendix 2.3 for monthly sales of petroleum products (‘000’ cubic metres)
Below is a stacked column bar graph showing annual sales of petroleum products ranging from
2007 to 2013.
Figure 3.3: Annual Sales of Petroleum Products in '000' cubic metres (2007-2013)
3.3 Market shares of Oil Companies
Total and Shell/Vivo Energy (U) limited continued to dominate the Petroleum industry with
Total taking up 16.57% while Vivo energy 15.38% of the entire industry. During the year 2013,
many small companies joined the industry as shown in appendix 2.5.
Table 3.5: Market shares of Oil Companies in 2013 Company Market Shares (%) Squares of market shares
Total Uganda Ltd 16.57 274.5649
Shell/VIVO ENERGY (U) LTD 15.38 236.5444
Nile Energy Limited 7.06 49.8436
Petrocity Enterprises Uganda 6.14 37.6996
STABEX PETROLEUM 5.22 27.2484
Gapco Uganda Ltd 4.84 23.4256
Hass Petroleum (U) Ltd 3.96 15.6816
SYNERGY OILS (U) LTD 3.57 12.7449
Petro Uganda Limited 3.19 10.1761
MOGAS 3.01 9.0601
Kobil Uganda Ltd 2.63 6.9169
SHIRE PETROLEUM 2.42 5.8564
City Oil Ltd 2.34 5.4756
Delta Petroleum Ltd 2.16 4.6656
OLYMPIC PETROLEUM 1.8 3.24
0.00
200,000.00
400,000.00
600,000.00
800,000.00
1,000,000.00
1,200,000.00
1,400,000.00
1,600,000.00
2007 2008 2009 2010 2011 2012 2013
Annual Sales of Petroleum Products in '000' cubic metres (2007-2013)
Premium Kerosene Gas Oil Aviation Fuels Fuel Oil
LPG Bitumen Lubricants/Gr. IDO Others (Chms etc)
17
Hashi Energy (U) Ltd 1.8 3.24
Hared Petroleum Ltd 1.75 3.0625
TOSHA (U) LTD 1.5 2.25
DON (U) LTD 1.38 1.9044
Moil Uganda Limited 1.09 1.1881
Others 12.19 148.5961
Total 100 HHI = 883.3848
Note: A HHI index below 0.01 (or 100) indicates a highly competitive index. A HHI index below 0.15 (or 1,500) indicates an unconcentrated index. A HHI index between 0.15 to 0.25 (or 1,500 to 2,500) indicates moderate concentration. A HHI index above 0.25 (above 2,500) indicates high concentration. A small index indicates a competitive industry with no dominant players.
Table 3.5 shows the market shares of selected petroleum companies and also determines the
level of competition of firms within the industry using the Herfindahl Hirschman Index (HHI).
Thus, HHI of 883.4 in the above table implies that the industry is not concentrated with
dominant players. This is evident with the many new entrants into the industry in appendix 2.5.
In comparison to the 2012 HHI that stood at 1,742, the year 2013 realised an improvement in
market competition and shows how the industry is drifting away from a monopolistic market to
a highly competitive market.
3.4 Prices of petroleum products
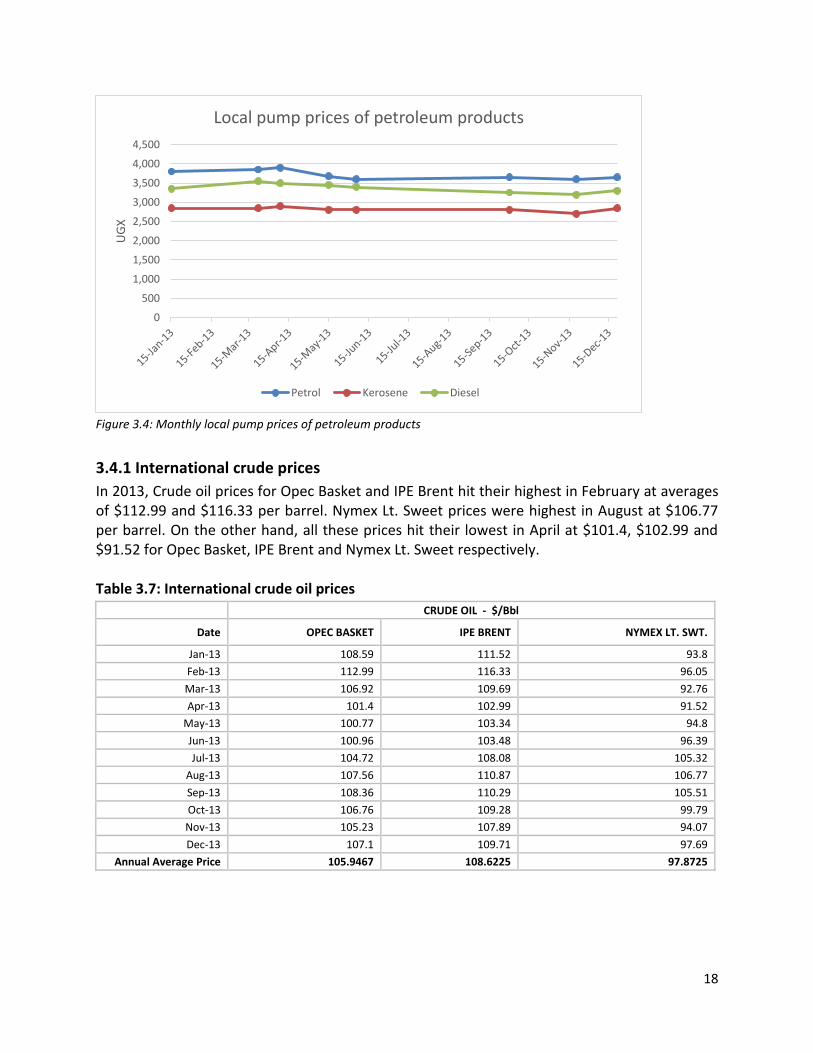
According to table 3.6, local pump prices for petroleum products averaged at UGX 3,716, UGX
2,819 and UGX 3,375 for Petrol, Kerosene and Diesel, respectively.
Table 3.6: Local pump prices of petroleum products (UGX) Date Petrol Kerosene Diesel
15-Jan-13 3,800 2,850 3,350
22-Mar-13 3,850 2,850 3,550
8-Apr-13 3,900 2,900 3,500
15-May-13 3,680 2,800 3,450
5-Jun-13 3,600 2,800 3,400
30-Sep-13 3,650 2,800 3,250
20-Nov-13 3,600 2,700 3,200
21-Dec-13 3,650 2,850 3,300
Annual Average Price 3,716 2,819 3,375
The rising prices in January reached their peak in April for petrol and kerosene at prices of UGX 3,900 and UGX 2,900. Diesel prices reached their peak in March at UGX 3,550. All prices stabilised for the rest of the year as indicated in table 3.6 and figure 3.4.
18
Figure 3.4: Monthly local pump prices of petroleum products
3.4.1 International crude prices
In 2013, Crude oil prices for Opec Basket and IPE Brent hit their highest in February at averages of $112.99 and $116.33 per barrel. Nymex Lt. Sweet prices were highest in August at $106.77 per barrel. On the other hand, all these prices hit their lowest in April at $101.4, $102.99 and $91.52 for Opec Basket, IPE Brent and Nymex Lt. Sweet respectively. Table 3.7: International crude oil prices
CRUDE OIL - $/Bbl
Date OPEC BASKET IPE BRENT NYMEX LT. SWT.
Jan-13 108.59 111.52 93.8
Feb-13 112.99 116.33 96.05
Mar-13 106.92 109.69 92.76
Apr-13 101.4 102.99 91.52
May-13 100.77 103.34 94.8
Jun-13 100.96 103.48 96.39
Jul-13 104.72 108.08 105.32
Aug-13 107.56 110.87 106.77
Sep-13 108.36 110.29 105.51
Oct-13 106.76 109.28 99.79
Nov-13 105.23 107.89 94.07
Dec-13 107.1 109.71 97.69
Annual Average Price 105.9467 108.6225 97.8725
0
500
1,000
1,500
2,000
2,500
3,000
3,500
4,000
4,500
UG
X
Local pump prices of petroleum products
Petrol Kerosene Diesel
19
Figure 3.5: Monthly International crude oil prices for 2013
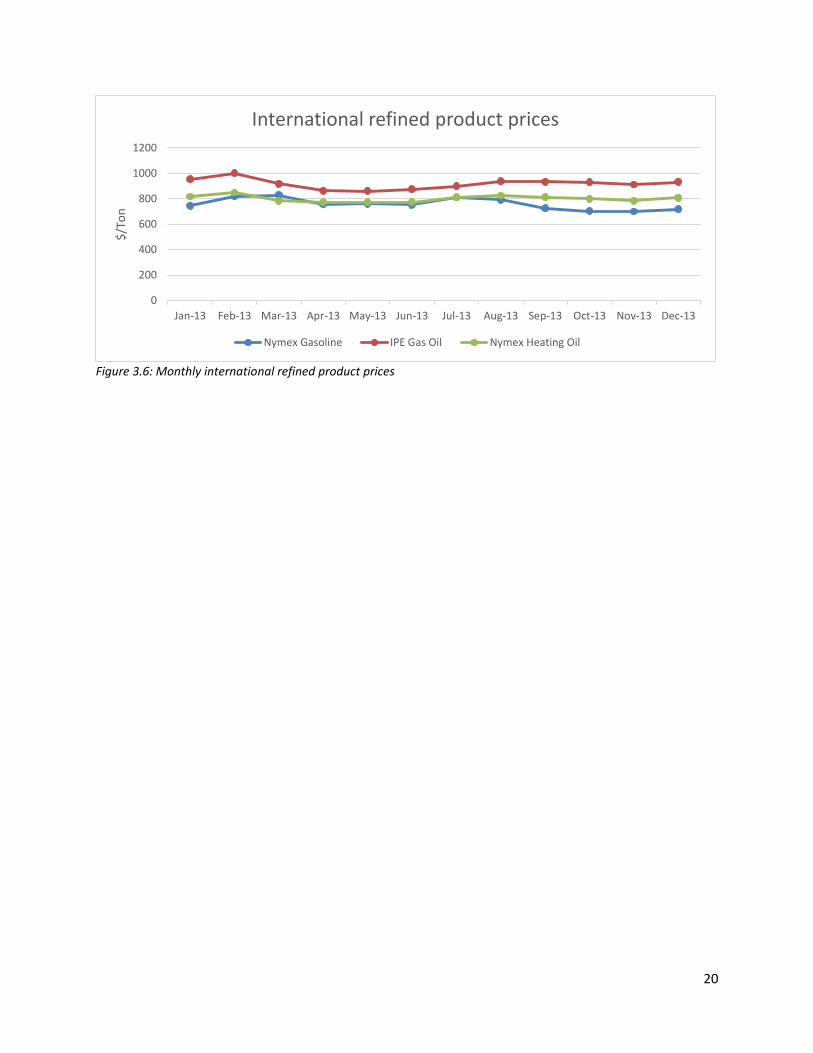
3.4.2 International refined product prices
Table 3.8: Monthly International refined product prices in 2013
PRODUCTS - $/Ton
Date Nymex Gasoline IPE Gas Oil Nymex Heating Oil
Jan-13 745.11 954.58 816.64
Feb-13 817.71 1000.99 848.5
Mar-13 828.98 917.76 784.16
Apr-13 756.97 863.85 771.63
May-13 760.9 861.91 773.19
Jun-13 752.74 876.15 774.65
Jul-13 810.39 899.66 811.54
Aug-13 791.61 937.2 823.86
Sep-13 725.48 932.39 812.5
Oct-13 703.67 930.17 799.17
Nov-13 699.59 911.43 782.98
Dec-13 719.44 932.09 808.34
Annual Average Price 759.3825 918.1817 800.5967
International refined product prices in 2013 averaged at $759.3825, $918.1817 and $800.5967 for Nymex Gasoline, IPE Gas Oil and Nymex Heating Oil, respectively as shown in table 3.8 and illustrated in figure 3.6.
Note: Average price of gold on LME and average URA monthly fixed exchange rates were used to compute the average value of gold (and other minerals) over the year.
The value of mineral production in 2013 declined by 28.3% from that of the previous year. This is attributed to the limited trade in
3Ts following the cross border restrictions in the trade of the 3Ts and gold due to Regional Certification Mechanism coupled with
fluctuating market rates for minerals.
Worth noting is that Kisita Mining Company has been the only company reporting gold production. It is imperative to note that most
of the gold in the country is mined by Artisanal Miners.
35
5.3 Mineral imports
Gold was the only mineral that was imported and valued in 2013. Its total import value stood at
UGX. 21,208,368,103. Mercury was also imported but not valued as indicated in the table
below.
Table 5.4: Mineral imports in 2013 Commodity Jan - March Apr - June July - Sep Oct - Dec Total Value
Gold 120 0 40.8 0 160.8 21,208,368,103
Mercury 0 2 0 0 2 -
Total 21,208,368,103
Most of the Gold imports to Uganda were from South Sudan. The companies currently licensed
to deal in minerals produce verifiable certificates of origin for the minerals and respective
export permits from the originating country.
5.4 Mineral exports
All minerals are mined in the course of prospecting, exploration, mining and mineral
beneficiation operations. The produced minerals are subject to the payment of royalties on the
gross value based on the prevailing market price of minerals. These are then exported or
1.7.1 Inspections conducted from Jan–Dec 2013 Regions in Uganda Medical facilities Industrial facilities Total
Central 36 08 44
Eastern 29 01 30
Western 16 02 18
Northern 07 00 07
Total 99
1.7.2 Registration of facilities (Phase 1: Kampala District) from Jan–Dec 2013 Regions in Uganda Medical facilities Industrial facilities Total
Central Region (Kampala) 47 45 92
1.7.3 Monitoring of occupationally exposed workers in Uganda from Jan–Dec 2013 Regions in Uganda Medical Persons Industrial Persons Total
Central 216 00 216
Eastern 01 00 01
Western 15 06 21
Northern 14 00 14
Total 246 06 252
1.7.4 List of Inspected facilities by AEC from January 2010 to march 2014 Type of practice Jan-Dec 2010 Jan-Dec 2011 Jan-Dec 2012 Jan-Dec 2013 Jan-mar 2014 Total
Medical facilities 02 08 11 81 30* 132
Industrial facilities 00 02 04 11 04* 21
Total 02 10 15 100 34*
1.7.5 List of Licenced facilities by AEC from January 2010 to march 2014 Type of Licence/Permit Jan-Dec
2011 Jan-Dec
2012 Jan-Dec
2013 Jan-mar
2014 Total
License to Possess and Use radiation sources 02 57 53 20* 132
Permit to Transport radiation sources 00 17 16 06* 39
Permit to Import radiation sources 04 15 16 04* 39
Permit to Export radiation sources 01 00 06 04* 11
Permit to Sell/Hire radiation sources 00 02 01 00 03
Total 07 91 92 34*
1.7.6 Number of Occupationally exposed (radiation) workers being monitored by AEC from
Jan 2010 to March 2014 Period 2011 2012 2013 2014
Qty 207 251 141 116
46
1.7.7: Preeep Perfomance Figures 2013
Technology Jan-June Jul-Dec Total
Solar PV Households 332 326 658
Social Institutions 34 52 86
SMEs 58 60 118
Pico PV systems Households 6,563 2,934 9,497
Stoves Households 16,590 11,453 28,043
Social Institutions 16 23 39
SMEs 12 23 35
Grid Densification Households 23 25 48
Social Institutions 4 1 5
SMEs 8 3 11
MHPs Households 47 42 89
Social Institutions 7 1 8
SMEs 87 45 132
47
Appendix 2: Petroleum Statistics
2.1: Licensing Ref. schedule 2 of The Petroleum Supply (General) Regulations, 2009
Ptroleum Operating Licence Petroleum Facility Construction Permit
Licencing Item Currency Points @ 20,000 UGX
Validity Period for Licence (Years)
Initial Grant of Permit: 0.1%of total value of investment.
For extension, assignment or Transfer: half the above (or 0.05% of total value of investment). 1 Importation 150 Ten
2 Exportation 50 Ten
3 Pipeline Transportation 500 Twenty
4 Surface Transportation 75 Five
5 Storage 150 Ten
6 Wholesale distribution 75 Five
7 Retail sales 50 Five
8 Industrial Consumers 25 Ten
9 Processing and Transformation 150 Ten
THIS APPLICANT: GASCO UNITED LIMITED
Ptroleum Operating Licence
Licencing Item Currency Points @ 20,000 UGX
1 Importation 150 20000 3,000,000
2 Exportation -
3 Pipeline Transportation -
4 Surface Transportation -
5 Storage -
6 Wholesale distribution 75 20000 1,500,000
7 Retail sales -
8 Industrial Consumers -
9 Processing and Transformation -
TOTAL LICENSE FEES 4,500,000
TOTAL LICENSE FEES 4,500,000
LICENCE VALIDITY PERIOD:
Cleared by AC/PSD: Approved by Ag. C/PSD:
Ref. schedule 2 of The Petroleum Supply (General) Regulations, 2009
Ptroleum Operating Licence Petroleum Facility Construction Permit
Licencing Item Currency Points @ 20,000 UGX
Validity Period for Licence (Years)
Initial Grant of Permit: 0.1%of total value of investment.
For extension, assignment or Transfer: half the above ( or 0.05% of total value of investment).
1 Importation 150 Ten
2 Exportation 50 Ten
3 Pipeline Transportation 500 Twenty
4 Surface Transportation 75 Five
5 Storage 150 Ten
6 Wholesale distribution 75 Five
7 Retail sales 50 Five
8 Industrial Consumers 25 Ten
9 Processing and Transformation 150 Ten
THIS APPLICANT: OILCOM UGANDA LIMITED
48
Ptroleum Operating Licence
Licencing Item Currency Points @ 20,000 UGX
1 Importation 150 20000 3,000,000
2 Exportation -
3 Pipeline Transportation -
4 Surface Transportation -
5 Storage 150 20000 3,000,000
6 Wholesale distribution 75 20000 1,500,000
7 Retail sales 50 20000 1,000,000
8 Industrial Consumers -
9 Processing and Transformation -
TOTAL LICENSE FEES 8,500,000
TOTAL LICENSE FEES 8,500,000
LICENCE VALIDITY PERIOD:
Cleared by AC/PSD: Approved by Ag. C/PSD:
49
2.2: Monthly Imports of petroleum products in 2013
Month PMS (Litres) BIK (Litres) AGO (Litres) TOTAL (Litres)
Importation 3,000,000 21-Dec-2012 10 Years 20-Dec-2022
0274 CAPE Suppliers (U) Ltd P.O. Box 31492, Kampala Dr. D. Wanjiru, Mr. P.K. Gitimu (CEO) Wholesale Distribution 1,500,000 21-Dec-2012 5 Years 20-Dec-2017
Appraisal 1344m RT (1315.8m) Oil shows Not Tested May-06
8 KAJUBIRIZI-1 KINGFISHER-1 1N30E/117-1 EA 3A Heritage Oil and Gas Ltd
Exploration 2125m (2069m) Oil and Gas Shows Well tested and flowed 4170 bbl/d (1783m-1790 m; 1792m-1795m)
Aug-06
9 NZIZI-1 NZIZI-1 1N30E/83-1 EA 2 Tullow Oil Pty Ltd Exploration 1065m (1060m) Oil and Gas Shows Not Tested Nov-06
10 KAJUBIRIZI-1A KINGFISHER-1A
1N30E/117-1A
EA 3A Heritage Oil and Gas Ltd
Exploration 2962.5m (2876m) Oil and Gas Shows Well tested and flowed over 9,700 bbl/d (2260m-2271m; 2290m-2302m; 2344m-2367m)
Nov-06
11 KAJUBIRIZI-1B KINGFISHER-1B
1N30E/117-1B
EA 3A Heritage Oil and Gas Ltd
Exploration 3195m (basement not reached)
No Shows Not Tested 01/01/2007
12 NZIZI-2 NZIZI-2 1N30E/95-1 EA 2 Tullow Oil Pty Ltd Appraisal 981.5m (971.5m) Gas Shows Well tested and flowed dry natural gas at 14.13 MMscf/d (792m – 799m)
May-07
13 MPUTA-3 MPUTA-3 1N30E/84-3 EA 2 Tullow Oil Pty Ltd Appraisal 973m (954m) Oil and gas shows Well tested and flowed over 1,900 bbl/d (867m – 877m). (The two upper zones are assumed to be similar to Mputa 1)
Jul-07
14 MPUTA-4 MPUTA-4 1N30E/84-4 EA 2 Tullow Oil Pty Ltd Appraisal 1082m (1059.5m) Oil and gas shows Well tested and flowed over 2,100 bbl/d (944m – 950m).
Sep-07
15 NGASSA-1 NGASSA-1 1N30E/72-1 EA 2 Tullow Oil Pty Ltd Exploration Actual: 1601.5mBRT, stk 1: 1509mBRT, stk2:1635mBRT(basement not reached)
Gas shows Not Tested Nov-07
16 TAITAI-1 TAITAI-1 1N31E/29-2 EA 2 Tullow Oil Pty Ltd Exploration 1006m(940m) Oil shows Not Tested Apr-08
17 TAITAI-1A TAITAI-1A 1N31E/29-2A EA 2 Tullow Oil Pty Ltd Exploration 981m(Top of basement) Oil shows Not Tested May-08
18 KAJUBIRIZI-2 KINGFISHER-2 1N30E/105-1 EA 2 Heritage Oil and Gas Ltd
Appraisal 3906mMDBRT Oil shows Well tested and flowed cumulative of about 14,364 bopd ( 2757.05-2783.55m MD, 2706.5 m - 2733.0 m MD and 2756.7 m - 2783.2 m MD)
Apr-08
19 NGEGE-1 NGEGE-1 2N31E/139-1 EA 2 Tullow Oil Pty Ltd Exploration 640m (618mRT) Oil and Gas shows Not Tested Jun-08
73
20 KARUKA-1 KARUKA-1 1N31E/18-1 EA 2 Tullow Oil Pty Ltd Exploration 853m(785mRT) Oil and Gas shows Not Tested Jun-08
21 KASAMENE-1 KASAMENE-1 2N31E/126-1 EA 2 Tullow Oil Pty Ltd Exploration 957m (924.5m) Oil and Gas shows Well tested and flowed cumulative of about 3,550 bopd
Jul-08
22 KASAMENE-1A KASAMENE-1A 2N31E/126-1A
EA 2 Tullow Oil Pty Ltd Exploration 865.5mMDBRT Oil and Gas shows Well tested and flowed cumulative of about 3,550 bopd
Aug-08
23 KIGOGOLE-1 KIGOGOLE-1 2N31E/127-1 EA 2 Tullow Oil Pty Ltd Exploration 616m (609m) Oil and Gas shows Well tested (lower zone) and flowed about 300 bopd
Aug-08
24 NGIRI-1 WARTHOG-1 2N31E/114-1 EA1 Heritage Oil and Gas Ltd
Exploration 911m (869mBRT) Oil and Gas shows Not tested Sep-08
25 KAJUBIRIZI-3 KINGFISHER-3 1N30E/117-2 EA3A Heritage Oil and Gas Ltd
Appraisal 3200mBRT(basement not reached)
Oil and Gas shows Not tested Sep-08
26 KAJUBIRIZI-3A KINGFISHER-3A
1N30E/117-2A
EA3A Heritage Oil and Gas Ltd
Appraisal 2712m Oil and Gas shows Not tested Nov-08
27 JOBI-1 BUFFALO-1 2N31E/103-1 EA1 Heritage Oil and Gas Ltd
Exploration 637mBRT(583m) Oil and Gas shows Not Tested Nov-08
28 RII-1 GIRAFFE-1 3N31E/102-1 EA1 Heritage Oil and Gas Ltd
Exploration 705.05mBRT(645m) Oil and Gas shows Not Tested Dec-08
29 MPUTA-5 MPUTA-5 1N30E/84-5 EA2 Tullow Oil Pty Ltd Appraisal 1231 mBRT (1200m) Oil and Gas shows Well tested and flowed cumulative of about 1,500 bopd
EL 1001 Jan Mangal (U) Ltd P.O. Box 28984 Kampala 20/07/2012 19/07/2015 27/3&4. Moroto Gold & Base Metals 74.20
EL 1002 Oli Gold Muruli Limited P.O. Box 8898 Kampala 26/07/2012 25/07/2015 77/1. Ibanda & Kiruhura Gold, Iron Ore & Base Metals
45.00
EL 1003 John Mary Muyambi (Jr) P.O. Box 8898 Kampala 26/07/2012 25/07/2015 93/4. Kabale Gold & Base Metals 14.80
EL 1004 John Mary Muyambi (Jr) P.O. Box 8898 Kampala 26/07/2012 25/07/2015 94/3. Kabale Iron Ore & Base Metals
10.00
EL 1005 Oryx Minerals Limited P.O.Box 701 Entebbe 30/07/2012 29/07/2015 84/4. Rukungiri Gold and Base Metals
5.20
EL 1006 Dao Africa Limited P.O.Box 35277 Kampala 26/07/2012 25/07/2015 64/1. Tororo Pozzolana 12.00
EL 1007 Sun and Sand Mining Ltd P. O. Box 23191 Kampala 06/08/2012 05/08/2015 56/4 & 57/3. Kyenjojo, Kabarole & Kamwenge
Gold, Uranium, PGE, REE & Base Metals
107.00
EL 1008 Sun and Sand Mining Ltd P. O. Box 23191 Kampala 06/08/2012 05/08/2015 86/3. Isingiro Gold, Uranium, PGE, REE, Columbite, Tantalite & Base Metals
5.80
EL 1009 Sun and Sand Mining Ltd P. O. Box 23191 Kampala 06/08/2012 05/08/2015 61/4. Mukono & Kayunga Gold, Uranium, PGE, REE & Base Metals
120.00
EL 1010 Sun and Sand Mining Ltd P. O. Box 23191 Kampala 06/08/2012 05/08/2015 10/4. Kaabong Gold, Uranium, PGE, REE & Base Metals
79.00
EL 1011 Indiana Mining Uganda Ltd P. O. Box 29901 Kampala 06/08/2012 05/08/2015 85/1. Sheema Gold and Base Metals
16.00
EL 1012 Indiana Mining Uganda Ltd P. O. Box 29901 Kampala 06/08/2012 05/08/2015 76/3. Bushenyi Gold and Base Metals
20.00
EL 1013 Indiana Mining Uganda Ltd P. O. Box 29901 Kampala 06/08/2012 05/08/2015 77/3. Mbarara Gold and Base Metals
39.00
EL 1014 Indiana Mining Uganda Ltd P. O. Box 29901 Kampala 06/08/2012 05/08/2015 77/3. Mbarara Gold and Base Metals
9.00
EL 1015 Great Lakes Mining Ltd P. O. Box 29900 Kampala 07/08/2012 06/08/2015 35/2-4. Napak Iron Ore & Base Metals
36.00
EL 1016 Great Lakes Mining Ltd P. O. Box 29900 Kampala 10/08/2012 09/08/2015 18A/3. Moroto REE & Base Metals 55.00
95
EL 1017 Great Lakes Mining Ltd P. O. Box 29900 Kampala 10/08/2012 09/08/2015 1/4 & 2/3. Kaabong REE & Base Metals 105.00
EL 1018 Great Lakes Mining Ltd P. O. Box 29900 Kampala 10/08/2012 09/08/2015 67/1&2. Kamwenge Gold, Iron ore & Base Metals
60.00
EL 1019 Universal Granite and Marble Ltd
P. O. Box 23003 Kampala 10/08/2012 09/08/2015 42/2 & 43/1. Soroti Granite 50.00
EL 1020 Universal Granite and Marble Ltd
P. O. Box 23003 Kampala 10/08/2012 09/08/2015 22/1&3. Nwoya Granite 10.00
EL 1021 Universal Granite and Marble Ltd
P. O. Box 23003 Kampala 10/08/2012 09/08/2015 14/4. Gulu Granite 10.00
EL 1022 Universal Granite and Marble Ltd
P. O. Box 23003 Kampala 10/08/2012 09/08/2015 59/2. Kiboga Granite 10.00
EL 1023 Universal Granite and Marble Ltd
P. O. Box 23003 Kampala 10/08/2012 09/08/2015 61/3. Mukono Granite 9.60
EL 1024 Universal Granite and Marble Ltd
P. O. Box 23003 Kampala 10/08/2012 09/08/2015 57/4. Kyegegwa Granite 50.00
EL 1025 Consolidated African Resources Ltd
P. O. Box 71630 Kampala 09/08/2012 08/08/2015 17/1. Kitgum Graphite, Zinc, Gold & Mica
323.00
EL 1026 Oli Gold Muruli Limited P.O. Box 8898 Kampala 13/08/2012 12/08/2015 77/1. Kiruhura & Ibanda Gold, Iron Ore & Base Metals
43.00
EL 1027 Oli Gold Muruli Limited P.O. Box 8898 Kampala 13/08/2012 12/08/2015 77/1. Kiruhura & Ibanda Gold, Iron Ore & Base Metals
45.00
EL 1028 Oli Gold Muruli Limited P.O. Box 8898 Kampala 13/08/2012 12/08/2015 77/1. Kiruhura & Ibanda Gold, Iron Ore & Base Metals
45.00
EL 1029 Greenstone Resources Limited P. O. Box 300 Busia 13/08/2012 12/08/2015 64/2. Tororo Gold and Base Metals
9.40
EL 1030 Greenstone Resources Limited P. O. Box 300 Busia 13/08/2012 12/08/2015 63/4, 64/3, 73/2 & 74/1.
Busia Gold and Base Metals
84.20
EL 1031 Greenstone Resources Limited P. O. Box 300 Busia 13/08/2012 12/08/2015 73/2 & 74/1. Busia & Namayingo Gold and Base Metals
402.10
EL 1032 Greenstone Resources Limited P. O. Box 300 Busia 13/08/2012 12/08/2015 64/2. Busia Gold and Base Metals
4.80
EL 1033 Byona Ambrose P. O. Box 28428 Kampala 09/08/2012 08/08/2015 59/4 & 60/3. Kiboga & Mityana Gold and Base Metals
5.80
EL 1034 East African Mining Limited P.O. Box 30330 Kampala 30/07/2012 29/07/2015 10/2-4. Kaabong Gold, Zinc, PGE and Base Metals
170.00
EL 1035 Indiana Investments Ltd P. O. Box 29900 Kampala 14/08/2012 13/08/2015 62/2. Luuka Gold and Base Metals
100.00
EL 1036 Milu (U) Limited P.O. Box 23201 Kampala 15/08/2012 14/08/2015 73/2. Bugiri Gold and Base Metals
31.02
EL 1037 Clean Source Energy Partners Ltd
P. O. Box 71630 Kampala 20/08/2012 19/08/2015 66/1. Kabarole Geothermal 84.00
EL 1038 Luwalalira Louis Livingstone P. O. Box 10001 Kampala 20/08/2012 19/08/2015 64/3 & 74/1. Busia Gold and Base Metals
26.50
EL 1040 Rift Valley Minerals Limited P.O. Box 8898 Kampala 23/08/2012 22/08/2015 35/4. Napak Iron Ore, Limestone & Base Metals
72.00
EL 1041 Great Lakes Mining Ltd P. O. Box 29900 Kampala 23/08/2012 22/08/2015 67/1&2. Kamwenge Iron Ore, Gold & 60.00
96
Base Metals
EL 1043 Zhong Hua Exploration and Mineral Development Company Limited.
EL 1065 Kirabira Stephen P.O. Box 2120 03/12/2012 02/12/2015 85/1 Sheema Gold and Base Metals
21.80
EL 1066 Gimnant International Ltd P. O. Box 71457 Kampala 19/12/2012 18/12/2015 55/1 Kween Gold, Industrial minerals, gemstones & base metals
55.50
EL 1067 John Mary Muyambi (Jr) P.O. Box 8898 Kampala 05/12/2012 04/12/2015 76/4 Buhweju Gold and Base Metals
4.03
97
EL 1068 Mwendo Enterprises Limited P. O. Box 257 Entebbe 19/12/2012 18/12/2015 76/3 Bushenyi Gold, Copper and Cobalt
102.20
EL 1069 Mwendo Enterprises Limited P. O. Box 257 Entebbe 19/12/2012 18/12/2015 66/4 Kamwenge Gold, Copper and Cobalt
30.00
EL 1070 Spencon (U) Limited P. O. Box 956 Kampala 18/01/2013 17/01/2016 59/4 Mubende Gold, Base Metals, Diamond Granite, Gniess REE, Sandstones and PGMs
494.06
EL 1071 Angaro Investment Company Ltd
P. O. Box 48 Moroto 18/02/2013 17/02/2016 36/3 & 45/1 Moroto Gold and Base Metals
102.00
EL 1072 Wananchi Mining Ltd P. O. Box 1171 Kampala 19/02/2013 18/02/2016 29/2 Nebbi Gold and Base Metals
78.00
EL 1073 Spencon (U) Limited P. O. Box 956 Kampala 18/01/2013 17/01/2016 59/4 Mubende & Mityana Gold, Base Metals, Diamond and PGMs
96.20
EL 1075 Tin Tan (U) Limited P. O. Box 34412 Kampala 28/01/2013 27/01/2016 85/4 Ntungamo Tin & Coltan 33.50
EL 1076 Fulin Mines Ltd P. O. Box 36595 Kampala 29/01/2013 28/01/2016 14/2&4 Amuru and Gulu Gold and Base Metals
69.60
EL 1077 Royalco Resources Ltd P. O. Box 373 Iganga 29/01/2013 28/01/2016 63/4 Bugiri Gold and Base Metals
117.60
EL 1078 Blackstone Ichiban Ltd P. O. Box 10111 Kampala 05/02/2013 04/02/2016 36/4 & 45/2 Nakapiripirit and Amudat
Gold and Base Metals
474.80
EL 1079 Blackstone Ichiban Ltd P. O. Box 10111 Kampala 05/02/2013 04/02/2016 36/1 - 4 Moroto and Nakapiripirit
Gold and Base Metals
411.00
EL 1080 Blackstone Ichiban Ltd P. O. Box 10111 Kampala 05/02/2013 04/02/2016 27/3,4, 36/1& 2 Moroto Gold and Base Metals
212.50
EL 1081 Rhino United Agencies Ltd P. O. Box 21 Moroto 18/02/2013 17/02/2016 36/1 - 3 Moroto Gold and Base Metals
97.00
EL 1082 Royalco Resources Ltd P. O. Box 373 Iganga 05/02/2013 04/02/2016 63/4 & 73/2 Bugiri, Busia and Tororo 100.00
EL 1083 Infinity Minerals Ltd P. O. Box 72 Kampala 11/02/2013 10/02/2016 27/3&4 Moroto Gold and Base Metals
437.00
EL 1084 Infinity Minerals Ltd P. O. Box 72 Kampala 11/02/2013 10/02/2016 64/3 Tororo Gold and Base Metals
203.00
EL 1086 Budha Mining & Exploration 2009 Limited
P.O. Box 33563 Kampala 12/02/2013 11/02/2016 76/1 Rubirizi and Ibanda Gold and Base Metals
35.35
EL 1088 Gemstones International Ltd P. O. Box 10130 Kampala 20/02/2013 19/02/2016 59/3 Mubende Gold 21.00
EL 1089 AUC Mining (U) Limited P. O. Box 10130 Kampala 20/02/2013 19/02/2016 59/3 Mubende Gold 202.00
EL 1090 Dao Africa Limited P.O.Box 35277 Kampala 20/02/2013 19/02/2016 27/1 Moroto Limestone and Marble
40.70
EL 1091 Emmanuel Kyoyeta Makaga P. O. Box 12361 Kampala 20/02/2013 19/02/2016 27/3 Moroto Gold, Base Metals, Limestone and Marble
40.00
EL 1092 African Rift Minerals Ltd P. O. Box 263 Entebbe 04/03/2013 03/03/2016 31/4&40/2 Kiryandongo Gold and Base Metals
240.25
EL 1093 Gemstones International Ltd P. O. Box 10130 Kampala 20/02/2013 19/02/2016 59/3&4 Mubende Gold 207.80
EL 1094 Dagerton Geological Company P. O. Box 1743 Jinja 27/02/2013 26/02/2016 93/2 Kabale and Kanungu Iron Ore 35.80
98
Ltd
EL 1096 Rhino United Agencies Ltd P. O. Box 21 Moroto 27/02/2013 26/02/2016 45/1 Nakapiripirit Gold, Iron Ore and Base Metals
100.00
EL 1097 Africa Rare Earth & Metals (U) Ltd
P.O. Box 8891 Kampala 27/02/2013 26/02/2016 65/2&4 Kasese REE, PGM and Base Metals
74.90
EL 1098 Mwendo Enterprises Limited P. O. Box 257 Entebbe 27/02/2013 26/02/2016 76/2 Bushenyi Gold and Limestone 24.00
EL 1099 Blackstone Ichiban Ltd P. O. Box 10111 Kampala 25/02/2013 24/02/2016 76/4 Kabale Kaolin, Pozzolana, Gold and Base Metals
40.00
EL 1100 Earth Cement (U) Limited P. O. Box 35905 Kampala 22/02/2013 21/02/2016 27/3 Moroto Limestone 50.00
EL 1101 Earth Cement (U) Limited P. O. Box 35905 Kampala 22/02/2013 21/02/2016 36/2 Moroto Limestone 51.00
EL 1102 Mineral Research & Mines Limited
P.O.Box 10702 Kampala 27/02/2013 26/02/2016 59/3 Mubende Gold and Base Metals
21.60
EL 1103 Nicobat Interservices (U) Ltd P.O. Box 28904 Kampala 04/03/2013 03/03/2016 45/2&4 Nakapiripirit and Amudat
Gold and Marble 290.00
EL 1104 Nicobat Interservices (U) Ltd P.O. Box 28904 Kampala 04/03/2013 03/03/2016 45/2 Nakapiripirit and Amudat
Gold and Marble 290.00
EL 1105 Development Services Kigezi (DESK)
P. O. Box 476 Kabale 12/03/2013 11/03/2016 84/3 Kabale Gold and Base Metals
15.53
EL 1106 Sun and Sand Mining Limited P. O. Box 23191 Kampala 10/09/2013 09/09/2016 62/2 Luuka Gold, BaseMetals, Uranium, Platinum Group Metals, Rare Earth Element
224.00
EL 1107 Zhong Hua Exploration and Mineral Development Company Limited.
Appendix 4: Energy and Mineral Sector Meta Data Data Type/ Indicator
Definition and Standard Classifications
Scope/Coverage of the Data
Sources of the data Compilation Practices
Method of Computation
Accessibility and availability of data
Accounting conventions
Comments and limitations
Electricity Generation
Number of Operational hydro- power sites
Number of water body sites generating electricity. This can be categorised into Large - Above 20 MW, Mini - 1-20 MW, Micro 50KW - 1MW, Pico below 50 KW (The classification should be compared with other countries)
National level Reports from the generating companies- i.e. Kasese Kilembe Mines, Kisiizi hospital, Kuluva Hospital, UEGCL etc Site inspection and audit reports
Data is compiled through site inspections, and audits Data validation Data is validated through visits to the different sites to verify the figures captured
Summation of all the hydro-power operational sites
Data can be readily got on request This indicator is not comparable with other countries due to the difference in classification
Power from operational Hydro- power sites
Power generated from the water body sites generating electricity categorized accordingly; Large - Above 20 MW, Mini - 1-20 MW, Micro 50KW - 1MW and Pico below 50 KW
National level Reports from the generating companies- i.e. Kasese Kilembe Mines, Kisiizi hospital, Kuluva Hospital, UEGCL etc Site inspection and audit reports
Data is captured using the data logger machine from the power generation sites and consolidated at the centre (Ministry)
Summation of power (watts) by capacity from operational hydro-sites
Expected number of MW from a Potential Hydro site. This can be classified into Large - Above 20 MW, Mini - 1-20 MW, Micro 50KW - 1MW and Pico below 50 KW
National Level Consultancy reports (MEMD) Site inspection and survey reports
Data is captured from surveys carried out per site using GPS. These are there after analyzed using Arc Gis 9.3 software and Mathematical Computation
Power produced = Efficiency of turbine * Head (m) *Discharge (cm3)* gravity
Total Power from all Potential Hydro power sites Number of Potential Geothermal Sites
Expected number of MW from all Potential Hydro sites. This can be classified into Large - Above 20 MW, Mini - 1-20 MW, Micro 50KW - 1MW and Pico below 50 KW Total number of sites with potential Geothermal energy
National Level National Level
Consultancy reports (MEMD) Site inspection and survey reports Consultancy reports (MEMD)
Data is captured from surveys carried out per site using GPS. These are there after analyzed using Arc Gis 9.3 software Maps showing incidence of geothermal energy generated and sites selected after doing field surveys
Summation of power (watts) by capacity from potential hydro-sites Summation of the Potential Geothermal power sites
Data can be readily got on request Need to update the database with more sites as more are being discovered. Data can be readily got on request.
Power from Potential Geothermal sites
Power expected from a potential Geothermal site
National level Studying the underground fluid characteristics of selected areas in order to get the positions with the highest heat discharge. These characteristics include temperatures, discharge rate, Fluid density and fluid enthalpy.
Geothermal power = Max Temperature * Discharge rate*Fluid density * Fluid enthalpy.
Total number of units supplied with electricity by the main grid. This can be classified into companies, Households, factories, small scale businesses.
National Level Reports form UMEME and UETCL. Field surveys
Data is compiled through site inspections, audits and extraction from UMEME reports.
Need to update the database with all the new grid lines being constructed and those that are being proposed.
Electricity coverage
Percentage coverage of the electricity grid
National Level Reports form UMEME, REA and Rural electrification companies. Field surveys Consultancy reports (MEMD) Site inspection and survey reports UBOS
Data is captured from surveys carried out along the electricity grid using GPS. These are there after analyzed using Arc Gis 9.3 software.
Total area coverage of grid lines in square KM over the total area of the country in square KM expressed in percentage.
Energy Production potential from Agro-residues (Biomass)
Total expected number of MW of energy produced from the agro-residues. This can be classified into Coffee husks, tobacco dust, rice straw, groundnut shells and bagasse
Rural Areas and Urban Centres Country wide.
Reports from Agro-residue industries like Coffee factories Fish Processing Marts Tea factories and Sugar factories Field surveys
Administrative Reports (Annually)
Percentage of Agro-residue in tons that can produce energy. This amount in tons is converted into MW of energy.
MEMD GIS Database MEMD Annual reports
Annually
Need to update the database with more information on the degradation of the biomass resource
Annually, Need to update database with information on the state of current consumption of firewood in rural, urban, institutional and industrial settings
Wood fuel Production (Charcoal)
Total amount of charcoal produced from woody biomass
National level especially the Cattle corridor
Field surveys, Local Govt’s Depts of Forestry and Natural Resources production reports
Administrative Reports. Field surveys
Summation of Local Govt Forestry /Natural Resources Production reports, in tons.
District local Govt Natural resources production reports. MEMD GIS Database MEMD Annual reports
Annually Need to update the database with more information on the degradation of the biomass resource. Information is available on request.
Ratio of wood resource converted into charcoal
Amount of wood used to produce a unit amount of charcoal expressed as a percentage (Charcoal conversion efficiency)
National level Field surveys On-Site study visits
Administrative reports
Average of results from different site studies on charcoal conversion results
MEMD Annual reports GIS database
Annually Need to update database with new information on charcoal production activities and experimental results
Total energy from charcoal
Total amount of energy obtained from charcoal consumed expressed as Mega Watt of electricity (MWe)
National level Field surveys reports, Lime and Iron ore smelting factories, MEMD
Administrative reports
Summation of charcoal consumed in tons from different consuming entities, converted into MWe
MEMD Annual reports, Local govt natural production exports
Quarterly Annually
Need to update database with new information on charcoal production and consumption statistics country wide
Number of Improved Biomass Energy Technologies adopted
Total number of installed and operational Biomass Energy Technologies: These can be classified as Household and Institutional Stoves, Ovens, industrial Kilns and, Furnaces.
National level Field surveys reports, Reports from Artisans and fabricators
Administrative reports, Visits to different users
Summation of the improved biomass energy technologies by category
MEMD Annual reports, Dealer NGO reports
Quarterly Annually
Need to establish a monitoring and evaluation tool for concrete results on adoption of stoves and other technologies.
Number of biogas digesters and gasifiers installed
Number of installed Biogas digesters and Gasification plants
National level Visits to sites, Field surveys to farms and institutions,
Administrative reports, Visits to different users Operator NGO reports
Summation of the Biogas and Gasification plants installed by category
MEMD annual reports Heifer Project reports
Quarterly Annually
Need to update database with more information on installation and use of biogas
112
Energy from gasification of biomass – Biogas and Wood gas, (from Plant and animal residues)
Total gas (M3) produced from gasifiers and biogas plants
National level Farms, Factories, Institutions and individual homes.
Administrative reports, Field survey reports, Particular company reports
Summation of gas volumes produced for the two gas categories. Conversion of data into energy units(MWe, MWt)
MEMD annual reports Dealer company reports Institutional reports e.g. Nyabyeya, Makerere Univ., Tea factories
Quarterly Annually
Need to update database with information on new installations and their gas capacity production.
Potential wind energy regions
Distribution of wind speeds in the various regions of the country. The higher the speed in M/S, the higher the potential for energy in KV.
Country wide Reports from the National Meteorological Centre
Maps GIS Database Administrative Reports (Annual)
Wind speed at different positions in the country
MEMD GIS Database The Renewable Energy Policy
Quarterly and annually
Need to get better equipment that can measure wind speeds for the energy applications
Potential solar energy regions
Distribution of solar radiations in the various regions of the country in KWh per Square meter per day. The higher the solar radiation, the higher the potential for energy.
Country wide Reports from the National Meteorological Centre Consultants Reports
Maps GIS Database Administrative Reports (Annual)
Solar radiation at different positions through out the country
MEMD GIS Database The Renewable Energy Policy
Quarterly and Annually
Need to get better equipment that can measure solar radiation for energy applications
Energy Predictions
Energy Demand Forecasts
Total predicted demand for energy which can be classified into firewood energy, charcoal energy and electricity energy.
Country wide Reports from National Forestry Authority Field Surveys Uganda Population Census Reports from UMEME and UETCL
Administrative Reports (Annual) GIS Database Maps
Use the Population growth rate in 5, 10 and 15 years time to get the predicted firewood demand in 5, 10 and 15 years. It’s then that firewood demand which is converted into energy but this will also depend on the availability of firewood. Charcoal availability in 5, 10, and 15 years depending on the previous trends. Electricity generation potential in 5, 10 and 15 years.
MEMD GIS Database Consultants Reports
Annually
Reliable data compiled.
Minerals
113
Quantity of Minerals produced
Total Quantities of minerals produced by mining license holders measured in tons, pounds, carats and ounces by category and type Categories include; - Precious metals - Precious stones, - Base metals and - Industrial minerals - Aggregate, stone and clays (Include Details Of The Stones In The Compendium)
National level GSMD records of submitted mining returns Individual company records Records from key stakeholders
Information is extracted from mining monthly returns submitted by licensed holders Field inspections are also undertaken to validate the records submitted to the Ministry and identify missing records.
Summation of quantities of minerals produced by category.
Update of the databank is dependent on timely submission of mining returns and field verification Different methods of capturing data from un licensed holders
Quantity of Minerals mined or won
Total Quantities of minerals mined ,classified into;-
Precious stones
Precious metals
Base metals
Industrial Minerals
National Level Licensed Mineral producing entities/mining companies
Administrative Reports (Annual) GIS Database Visits to the different sites Monthly reports of Mining entities/companies
Sums of quantities of minerals mined.
GMSD databank MEMD Annual report
Monthly, Quarterly and Annually
Update of the databank dependent on timely submission of mining returns and field verification
Quantity of Minerals Exported
Total quantities of mineral exported, classified into;-
Precious stones
Precious metals
Base metals
Industrial Minerals
National level Licensed Mineral producing and mineral dealing entities/ companies
Administrative Reports (Annual) Inspection to the different producing and purchasing sites Monthly reports of Mining and mineral dealing entities/companies
Sums of quantities of different categories of minerals exported as per Permits issued.
GMSD databank MEMD Annual report, URA tax collection receipts
Monthly, Quarterly, Annually
Update of the databank dependent on timely submission of mining returns and field verification.
Quantity of Minerals Imported
Total quantities of mineral imported, classified into;-
Precious stones
Precious metals
Base metals
Industrial Minerals
National level Licensed Mineral dealing entities/ companies
Administrative Reports (Annual) Inspection to the different purchasing sites. Monthly reports of mineral dealing entities/companies
Sums of quantities of different categories of minerals imported as per Permits issued.
GMSD databank MEMD Annual report, URA tax collection receipts
Monthly, Quarterly, Annually
Update of the databank dependent on timely submission of mining returns and field verification.
Number of Mineral dealers license holders
Total number of companies, individuals holding licenses permitting them to buy and sell minerals
National level DGSM data bank(License register)
Administrative records
Sum of all holders of mineral dealers licenses issued By DGSM
GMSD databank MEMD Annual report, URA tax collection receipts
the product of mineral grade and quantities produced expressed as a fraction of the quantity produced
Performance reports of mineral processing plants , monthly production reports from mineral producing entities
Monthly, Quarterly and Annual reports,
Cooperation from mining companies, false reporting by mining companies and nonexistence of plant performance reports. Need to station metallurgical auditors at these facilities.
Mineral identification, analysis and characterization
Mineral, rock, fossil and water. Countrywide. Assay, geochemical, petrology and mineral dressing laboratories.
Administrative records
Sums, Average, Percentage and Parts per million.
GSMD Data bank. Monthly, Quarterly and Annual reports
Reliable data compiled. Lack of modern equipment, manpower and skilled staff.
Mineral Occurrences
Types of minerals/commodities and where they occur
National level Geo Surveys Administrative records, Geo-survey reports
Mineral occurrence maps produced from integration of existing maps with geo- survey information
GSMD Documentation centre.
Monthly, quarterly and Annual reports
Detailed geological mapping currently being undertaken
Total Annual Mineral Rent fees collected
Total amount of money collected annually from the holders of mineral rights of the following category:-
Mining lease,
Location license
Retention license and;
Exploration license.
National level DGSM databank, URA receipts
Administrative records
Sum of money collected as mineral rent fees
GSMD Data bank, URA reciepts.
Monthly, quarterly and Annual reports
Paid annually on the anniversary of the grant until the termination of the mineral right concerned
Royalty on Minerals mined.
Total amount of money collected monthly from the holders of mining rights as royalty on the minerals produced.
National level DGSM databank, URA receipts
Administrative records
Sum of money collected as mineral royalty
GSMD Data bank, URA reciepts.
Monthly, quarterly and Annual reports
Sometimes paid by Mineral dealers
Value of Minerals Commodities produced
Total amount of money obtainable from the sale of the mineral commodities mined in the country over a particular period of time.
National level Submitted monthly reports of mining operations and prevailing commodity market prices.
Administrative records
Sum of the product of the mineral commodity unit price and the quantity of the mineral commodity mined over a particular
GSMD data bank Monthly, quarterly and Annual reports
115
period of time
Value of Minerals Imported
Total amount of money obtainable from the sale of the mineral commodities imported into the country over a particular period of time
National level Submitted monthly reports of mineral dealing operations, and prevailing International commodity market price lists.
Administrative records
Sum of the product of the mineral commodity unit price and the quantity of the mineral commodity imported over a particular period of time
GSMD data bank Monthly, quarterly and Annual reports
Value of Minerals Exported
Total amount of money obtainable from the sale of the mineral commodities exported out of the country over a particular period of time
National level Submitted monthly reports of mineral producing operations, mineral dealing operations, and prevailing International commodity market price lists.
Administrative records
Sum of the product of the mineral commodity unit price and the quantity of the mineral commodity exported over a particular period of time
GSMD data bank Monthly, quarterly and Annual reports
Investment in the Mineral Sector
Total amount of money spent on exploration and mining operations in the country over a given period of time.
National level Submitted monthly reports of exploration and mining operations.
Administrative records
Sum of amounts spent by different exploration and mining operations over a particular period of time.
GSMD data bank Monthly, quarterly and Annual reports
It is envisaged to be captured in the Modern mining Cadastre System due to be implemented. The data is mostly unreliable as it is not audited in any way.
Total Employment in Exploration and Mining
Total number of Person (s) in the service of another/company in the mineral sector under any contract of hire, express or implied, oral or written, where the employer has the right to mine or carry out mineral exploration.
National level Submitted monthly reports of exploration and mining operations.
Administrative records
Sum of the number of people directly or indirectly employed in mining and exploration operations.
GSMD data bank Monthly, quarterly and Annual reports
The data is mostly unreliable as it is difficult to verify it.
Daily, Monthly, Quarterly and Annual reports, Periodic, Scale of operation, Type of mineralization
Cooperation from mining companies, false reporting by mining companies and nonexistence of plant performance reports. Need to station metallurgical auditors at these facilities.
Mineral Mineral, rock, fossil and water. Countrywide. Assay, geochemical, Administrative Sums, Average, GSMD Data bank. Monthly, Reliable data compiled. Lack
116
identification, analysis and characterization
petrology and mineral dressing laboratories.
records Percentage and Parts per million.
Quarterly and Annual reports
of modern equipment, manpower and skilled staff.
Mineral Occurrences
Types of minerals/commodities and where they occur
Countrywide
Geological Surveys
Administrative records
Mapping, Sampling
GSMD Data bank.
Monthly, quarterly and Annual reports
Detailed geological mapping currently being undertaken
Total Mineral Rent
Total amount of money payable annually by an applicant for, or the holder of, a mining lease, a location license retention license or an exploration license.
Countrywide DGSM, URA receipts Administrative records
Sums and Percentage GSMD Data bank, URA. Monthly, quarterly and Annual reports
Paid annually on the anniversary of the grant until the termination of the mineral right concerned
Mineral Royalty all minerals obtained or mined in the course of prospecting, exploration, mining or mineral beneficiation operations are subject to the payment of royalties on the gross value of the minerals based on the prevailing market price of the minerals
Countrywide DGSM, URA receipts Administrative records
Sums, and Percentage GSMD Data bank, URA. Monthly, quarterly and Annual reports
Paid by mining rights holders and sometimes Mineral dealers
Investment in the Sector
Fiscal resources expended for exploration and mining operations
National Submitted Reports of exploration and mining operations , UIA
Administrative records
Sums, averages and Percentage
GSMD, UIA No reports have been made to date
It is envisaged to be captured in the Modern mining Cadastre System due to be implemented. Most so called investors are phony. The data is mostly unreliable
Employment in Exploration and Mining
Person (s) in the service of another/company in the mineral sector under any contract of hire, express or implied, oral or written, where the employer has the power or right to control and direct the employee in the material details of how the work is to be performed
Rural and urban centers countrywide.
Submitted Reports of exploration and mining operations ,
Administrative records
Sums, and Percentage GSMD No figures have been compiled yet
The data is being compiled. The data is not readily available
Airborne Geophysical Survey Information
airborne magnetic surveys, airborne radiometric surveys and airborne electro-magnetic surveys
Countrywide Data Interpreted from the Airborne Geophysical Surveys
PC based "in field" geophysical data compilation system
numerous methods, algorithms and software programs
GSMD Data bank. Monthly, quarterly and Annual reports
Data is readily available at GSMD
Geology of Uganda
the solid and liquid matter that constitutes the Earth
Countrywide GSMD, MAK Geological Mapping Mapping Scanned and Geodetic maps readily available at GSMD Data bank.
Monthly, quarterly and Annual reports
The databank is currently being updated
117
Plant production Beneficiation plants, Hydrometallurgical and Pyrometallurgical plants, Manufacturing plants, Metal Recycling Plants
National Mining and Metallurgical Companies
Plant audits Sums, average and percentage
Plant performance reports Daily, Monthly, Quarterly and Annual reports
Inconsistencies in plant production over time and false reporting my companies. This calls for positioning metallurgical auditors at these facilities.
Installed plant capacities
Beneficiation plants, Hydrometallurgical and Pyrometallurgical plants, Manufacturing plants, Metal Recycling Plants
Plant operation records Daily, Monthly, Quarterly and Annual reports
Dosages of reagents may be proprietary information. However consumptions are attainable.
Processing technologies
Crushing and Grinding, Classification, Gravity separation (concentration tables, jigs, spiral concentrators, Centrifugal Concentrators), Flowing film concentrators, Dense and Heavy Media Separation, Magnetic Separation, Sorting, Flotation, Electrostatic/high tension separation
National Mining and Metallurgical Companies
Surveys Sums, average and percentage
Plant inspections, Plant commissioning reports
Periodic, Scale of operation, Type of mineralization
Companies continuously work towards increasing recoveries thus advancements in technology
Percentage Annual reports of the Department of Geological Survey and Mines, Publications of research laboratories, mining and metallurgy journals
Periodic, scale of operations, type of mineralization
Effort is being exerted to achieve best recoveries; therefore these recoveries are to continuously change with time.
Energy Balance
Energy Balance Total supply and demand for energy. This can be classified into demand and supply of: Fuel wood, Charcoal, Residues, Gasoline, Av Fuel, Kerosene, Diesel, Fuel Oil, LPG, Electricity
Country wide Field Surveys Survey Reports Total supply and total demand
MEMD GIS Database Monthly Energy Balance does not include the energy produced by renewable energy technologies
Seismicity Events
Location and Magnitude of Earthquakes
Specific Location (Latitude, Longitude) and magnitude of earthquakes
Country wide Seismological reports Maps GIS Database
Identification of earthquakes at different monitoring stations
MEMD GIS Database Monthly There are few existing earthquake monitoring stations
Total Loss due to earthquakes. This is in terms of property that is destroyed by Earthquakes and volcanic eruptions
Catalogues; Bulletins; Maps
Seismic energy release; modeling
Mining
Small Scale mining sites
Includes total number of quarries where building minerals and industrial minerals are mined
Country wide Field surveys Administrative Reports
Identification and counting of mineral sources
MEMD GIS Database Annually Need to construct programmes to support the development of small scale mining
Consultancy reports GIS Database Maps
Calculating the are of land utilization for small scale mining
Reliable data is compiled.
Small scale mining Hand book
Petroleum Supply (Down stream)
Consumption of Petroleum Products.
The total amount of petroleum products consumed. This can be categorized as: 1. Premium Motor Spirit (PMS) (Petrol) 2. Automotive Gas Oil (AGO) (Diesel) 3. Bulk Illuminating Kerosene (BIK) (Kerosene) 4. Liquefied Petroleum Gas (LPG) 5. Jet – A1 6 Aviation Gasoline (AVGAS) 7. Heavy Oils
National Level Oil and gas marketing companies
Information is extracted from Receipts and performance reports from the oil marketing companies. Surveys Data reconciliation is done with data returns from URA border stations
Summation of petroleum products consumed by category
Petroleum supply department database MEMD annual reports
Monthly, Quarterly and Annually
Incomplete data due to non-response or under-declaration
119
8. Lubricants 9r. Bitumen
Imports of Petroleum Products.
Total amount of imports of Petroleum products categorised as 1. PMS 2. AGO 3. BIK 4. LPG 5. Jet – A1 6. Heavy Oils 7. Lubricants 8. Bitumen
Entire country. 1. Oil and gas importing companies. 2. Uganda National Bureau of Standards. 3. Uganda Revenue Authority.
Administrative records (URA tax collection documents and fuel marking practices) Surveys
Sum, Average and Percentage
Petroleum database at MEMD annual reports
Monthly, Quarterly and Annually
Data collection method still being fine tuned. Smuggling and damping distort accuracy of data collected
Petroleum Retail Pump Prices.
Average retail prices of the petroleum products at pumps. Products can be classified as 1. PMS 2. AGO 3. BIK 4. LPG 5. Jet - A1 6. Heavy Oils 7. Lubricants 8. Bitumen
Entire country.
Administrative books of retail facilities Billboards of retailing facilities, Relationship between liters pumped and amount (Shs.) displayed on filling pumps.
Administrative records. Surveys
Average and percentage change in price
Petroleum database at MEMD
Daily Distorted by bulk consumers purchasing directly from depots/ Wholesalers. Limited funding to cover entire country.
International Prices of Petroleum Products
Average price of petroleum products. Only Crude Oil is considered.
International Platts, Energy Intelligence and websites with relevant information
Administrative records
Average and Percentage change in price
Petroleum database at MEMD
Daily Reliable data compiled
Limited funds to get data from platts.
Number of Petroleum facilities and installations
Total number of dealers in petroleum products categorized under; 1. Filling stations 2. Service stations 3. Depots 4. Bulk consumers (Importation for own use)
National and Regional
1. PSD – Monitoring and Inspection section - MEMD 2.NEMA 3.Local Councils 4. URA and 5. UNBS
Extract information from quarterly field inspection reports and application forms submitted by the developers (Administrative records)
Summation of the number of petroleum facilities and installations by category
Quarterly Monitoring and Inspection reports- PSD- MEMD Annual statistical abstract
Quarterly and Annually
Reliable data is compiled. Developers having illegal installations
120
Means of Transporting of petroleum products Number of licensed petroleum facilities
Total number of Trucks, rail wagons, ships that transport the various petroleum products. Total number of Petroleum facilities and installations classified into 1.Filling stations 2.Service stations 3. Depots 4. Bulk consumers (Importation for own use)
National and Regional National and Regional
1. Uganda Revenue Authority 2. Rift Valley railways 3. UNBS 4. Ministry of Works and Transport PSD NEMA Local councils
Administrative records Field surveys Administrative tools
Sum, Average and Percentage Sum, Average and Percentage
URA Data base PSD UNBS Ministry of Works and Transport PSD
Quarterly and Annually Quarterly and Annually
Data collection method still being fine tuned. Limited funds to inspect facilities and sites prior to awarding licenses. Accurate data about facilities can be got
PETROLEUM REFINING
Legal and Regulatory framework
Putting in place laws and regulations that will govern MSU activities
National Consultancy reports, national/international legal publications
Workshops, administrative records
MEMD annual report, Resource centre, MSU quarterly report
Annually Data can be readily got on request
Utilization of oil and gas resources
This means the processing, refining, conversion, storage and transportation of oil and gas resources
National consultancy reports, workshops
consultancy reports, workshops
MEMD annual report, Resource centre, MSU quarterly report
Annual quarterly
Data can be readily got on request
Development of MSU facilities
Development of infrastructure that will enable Mid Stream Unit (MSU) activities to be carried out, i.e. pipelines, tanks, refinery
National Consultancy reports, workshops
Consultancy reports, workshops
MEMD annual report, Resource centre, MSU quarterly report
Annual Quarterly
Data can be readily got on request
Develop efficient Supervisory and monitoring framework
This is a framework that will guide activities within MSU
National Consultancy reports, workshops, national/international publications
Capacity building To develop expertise in the different fields like oil refining, trading, transportation and storage, gas conversion and petrochemicals
National Reports Administrative records
Database of artisans developed
Data can be readily got on request
Petroleum Exploration and Production (Up Stream)
Exploration Areas
The land covered by or acquired under an exploration license
Currently limited to the Albertine Graben
PEPD Use of geophysical and geological software to create models which
Obtain the total area of the Basins and Sub-basins and then divide into particular
● PEPD Quarterly Reports. ● MEMD Annual Reports. ●MEMD Website and other websites.
Quarterly and Annually.
Licensing is currently on-hold pending finalization of the Resouce Management law under formulation.
121
Licensed Areas Land/Area licesed to Oil and Gas Companies
EA1, EA2, EA3A, EA4B, EA5
define Basins and Sub-basins. Subdivide the basin and sub-basins using Plannimeters, GIS tools like ArcGIS, Oasis Montaj etc.
segments.
Unlicensed Land/Area not yet licesed to Oil and Gas Companies
EA3B, EA3C,EA3D, EA4A
Gravity Data Gravity data can be collected on Land, Lake or Airborne.
1. Albertine Graben 2. Hoima Basin 3. Lake Wamala Basin 4. Moroto-Kadam Basin 5. Lake Victoria Basin
● Field Surveys by PEPD ● Oil Companies
Use of Gravitymeters and GPS to observe and locate the station points. The raw data is then processed by software to reduce the data for quick interpretation
Obtain the total distance across the observed points
Anually and we are party to international conventions like SEG, AAPG, EAGE etc
All these data (including the raw data) are available at the Department on request and at a cost. Plans are in place to establish PEPD GIS Database System
Number of line Km
Distance covered through Station Points
Number of Station Points
Total number of points occupied. Obtain total station points in the survey area
Anomaly Maps and Profiles
The end product of gravity survey which forms an interpretive material for decision making.
Use of different algorithms and software.
Magnetic Data Magnetic data can be got for land and Airborne
1. Albertine Graben 2. Hoima Basin 3. Lake Wamala Basin 4. Moroto-Kadam Basin 5. Lake Victoria Basin
● Field Surveys by PEPD ● Oil Companies
Use of Magnetometers and GPS to observe and locate the station points for recording. The spatial raw data is then processed by softaware to reduce the data for quick interpretation in a specified format.
Obtain the total distance across the observed points
Anually and we are party to international conventions like SEG, AAPG, EAGE
All these data (including the raw data) are available at the Department on request and at a cost. Plans are in place to establish PEPD GIS Database System
Number of line Km.
Distance covered through Station Points.
Number of Station Points.
Total number of points occupied. Obtain total station points in the survey area.
Anomaly Maps and Profiles
The end product of magnetic survey which form an interpretive material for decision making
Use of different algorithms and software.
Seismic Survey Data
Seismic data can be acquired on Land and Marine. This can be 2D, 3D or 4C seismic survey methods.
Albertine Graben
● Field Surveys by Oil Companies. ●PEPD
Seismic profiles are acquired by transmitting sound waves from a source above or in the substratum. The waves travel through the rock layers which reflect them up to sensors on the water-bed or at the surface or in a borehole. This allows an image of the geology of the
Obtain the total distance across the observed points
Anually and we are party to international conventions like SEG, AAPG, EAGE etc
All these data are available at a cost. Data storage facility (space) may soon become a challenge due to the increasing activities. Plans are in place to establish electronic G&G data management system. Incapability of reading field data and Lack of processing software for QC.
Number of Line Km for 2D Seismic Survey
Distance covered through station points.
EA1, EA2, EA3A, EA4B, EA5
Number of Square Km for 3D Seismic Survey
Area covered by 3D seismic survey EA2, EA3A, EA3B and EA3D
Obtain the total area in square kilometers covered by 3D seismic survey.
Number of reciever stations points.
The number of reciever stations points covered either in the 2D or 3D seismic survey.
EA1, EA2, EA3A, EA4B, EA5, EA3B, EA3C and EA3D.
Obtain the total number of receiver stations points.
122
Number of source stations points
The number of souce stations points covered either in the 2D or 3D seismic survey
EA1, EA2, EA3A, EA4B, EA5, EA3B, EA3C and EA3D
substratum to be formed.
Obtain the total number of source stations points.
Number of Seismic Data tapes
The total number of both field, pre-processed and processed Data tapes.
EA1, EA2, EA3A, EA4B, EA5, EA3B, EA3C and EA3D
Obtain the catalog of field tapes
Interpretation Results
Results of all interpretations made on seismic data, including maps in time and depth, both regional and detailed
EA1, EA2, EA3A, EA4B, EA5, EA3B, EA3C and EA3D
Use of different algorithms and software
Drilling (Well) Data
Number of exploration wells
Wells being drilled with the object of discovering a new oil or gas accumulation or for the purposes of obtaining stratigraphical information which may assist in the discovery of a new oil or gas accumulation
EA1, EA2, EA3A, EA5
● Exploration and appaisal drilling by Oil Companies. ●PEPD
A rig is utilized for drilling used with among others, a suitable mud drilling fluid to remove the drill cuttings from the hole and to control the reservoir pressure. Measurements including wireline logs, mud logs and lithologic logs are recorded which can then be analysed for formation evaluation
Anually and we are party to international conventions like SEG, AAPG, EAGE, SPE, etc
Data is Available at a cost. Plans are in place to establish a resource data bank. Plans are in place tp procure all the relevant well data interpretation software Number of
Appraisal Wells Wells being drilled to define the extent of an already discovered oil or gas accumulation.
EA1, EA2, EA3A obtain the total number of appraisal wells
Number of Development wells
Wells drilled in a formation for the purpose of producing oil and gas
Obtain the number of development wells
Depth of penetration in meters
The target depth reached when drilling well
EA1, EA2, EA3A, EA5
Determine the total depth reached
Number of both dry and wet samples
Series of cutting samples of the formation which a drill penetrates, taken at appropriate intervals and taking into account the rate of penetration
EA1, EA2, EA3A, EA5
Obtain the number of samples by cataloguing
Number of core samples taken
The sample taken from a rock formation by core drilling or the use of a sidewall core
EA1, EA2, EA3A, EA5
Obtain the number of cores (which may be stored in boxes)
123
Fluid Samples
Formation fluid recovered from formation or other non routine production tests sampled.
EA1, EA2, EA3A, EA5
Obtain the quantity of the fluid samples
Geological and Geochemical Data
Geological investigation by any recognised method including surface and sub surface mapping, and geochemical study of the earth's surface.
1. Albertine Graben 2. Hoima Basin 3. Lake Wamala Basin 4. Moroto-Kadam Basin 5. Lake Victoria Basin
● Field mapping by PEPD ● Oil Companies
Use of GPS to obtain the position point from point to point. Carryout geochemical lab analysis using Leco, Gas Chromatograph, Soctex, Soxhlet, etc
Obtain total distance across the observed points and traverse
Anually and we are party to international conventions like SEG, AAPG, EAGE, SPE, etc
All these data (including the raw data) are available at the Department on request and at a cost. Plans are in place to establish PEPD GIS Database System Location points
for geochemical data covered
Total number of sampled stations within a survey area.
Number of Square Kmcovered by geology mapping
The total area mapped during geology mapping of uganda's rift basins
Use of geological tools and GPS for establishment of location points
Obtain the area covered in square kilometers
Investiment in the Petroleum subsector
Fiscal resources expended for exploration and production activities in Ugandan Shillings or US Dollars
National and International
Oil Companies Administrative records
Sums, Average and Percentages. Analysis and benchmarking with other operators
● PEPD ●Oil Company Offices ●Conferences
Annually Oil Company Operations costs and expenditures are monitored by PEPD
Resource Assessment
Estimation and Evaluation of the country's petroleum resources and reserves
National and International
Administrative records, Oil Companies, Local, Regional and International Conference
Adminstrative records, Research, Literature review
Sums, Averages, Percentile and Benchmarking with other basins in the world
Performance reports, Promotional reports, Conferences and Workshops
● Quarterly reports and Annual reports. ●We use the Petroleum Resource Management System (PRMS) classification procedures.
Effort is being exerted to achieve the best and accurate estimates
Reserves
Reserves include volumes of petroleum in deposits which the licensees have decided to recover, but whose plans have not yet been approved by the authorities in the form of a PDO or exemption from a PDO.
EA1, EA2, EA3A, EA3B, EA3C, EA3D, EA4B, EA5
Oil Companies and PEPD
Adminstrative records, Research, Literature review
Recovery reserves
That portion of the oil/gas in a reservoir that can be removed using currently available techniques
Published by: Sector Planning/Policy Analysis Unit Ministry of Energy and Mineral Development Plot No. 29/33 Kampala Road, P.O. Box 7270, Kampala Tel: +256–414-345811;
+256–414-235261 Email: [email protected] Website: www.energyandminerals.go.ug November 2014
Copyright 2014 Ministry of Energy and Mineral Development The material in this document may be freely reproduced provided due acknowledgement is made to the publisher and source.