INTRODUCTION This edition of AASA, The School Superintendents Association’s “Superintendents Salary and Benefits Study” marks the second year the association has undertaken a national study on public school superintendents’ compensation. Until recently, most school superintendents have had to rely on the annual salary study sponsored by Education Research Service to benchmark their compensation and benefits. With the closure of ERS, a void was created for such data. AASA responded to this need by creating a comprehensive study of the salary and benefits of school superintendents that far exceeded previous studies undertaken on this topic. AASA is particularly well-suited for this task because it represents the vast majority of school superintendents in the country and has been most active in collecting and disseminating to its members critical data needed to inform decision making. AASA is committed to refining this work over time, thus maximizing the benefit to superintendents. This work complements The American School Superintendent: 2010 Decennial Study (Kowalski et al. 2010) also sponsored by AASA and available from Roman & Littlefield Publishers (https://rowman.com). METHODOLOGY An extensive survey instrument was developed in 2012 with the assistance of Professors Theodore J. Kowalski (University of Dayton), I. Phillip Young (University of South Carolina), Terry Orr (Bank Street College) and Christopher C. Stream (University of Nevada, Las Vegas). This survey instrument was further refined for use in 2013 (see Section #11) as a result of input received from superintendents participating in the 2012 study. Using a commercially prepared mailing list of American public school superintendents, more than 9,000 e-mail links were distributed during the month of September 2013. At the same time, state association executive directors were contacted to encourage their members to respond to the Internet survey. Superintendents had the capacity to forward the link to their staff members for input in completing the survey in their area of expertise. The response to the 2012 study numbered 1280 or about 14 percent, while the number of superintendents responding to the 2013 study nearly doubled to 2,369 or more than 25 percent. REPORT OF FINDINGS This report of findings is divided into 11 sections and solely relies on measures of central tendency for this initial analysis of the data collected. These data were generally disaggregated by gender, district enrollment and racial/ethnic group. A significant
2
body of data was collected with the central core of the data reported in this document. Additional analysis will follow. As with any ambitious effort of this sort, there are limitations on the proper use of the data that must be identified. Upon reflection and careful analysis, there are two limitations that should be taken into account when using these data. First, sufficient data was collected to guide superintendents in the development of their compensation packages save one important factor – in some cases, even with the near doubling of the response rate, the disaggregation by racial/ethnic group did not have a sufficient number of responses to support decision-making based on this category. Care should be exercised in drawing conclusions or inferences on this particular data element. Second, survey fatigue is apparent among superintendents and impacted the return rate. Superintendents are inundated with research requests resulting in selective participation in those studies seen as most important to the role of the superintendent or of benefit to their district. The dramatic growth in the 2013 response rate over that received in 2012 is an indication of the importance superintendents place on collecting these data, while the participation rate of just over a quarter of all superintendents is less than is desired and reasonably raises questions of whether the data fairly represents the entire population. Having clearly identified the limitations inherent in any endeavor of this sort, the report that follows is rich with information that can prove useful to superintendents. SOME NOTEWORTHY FINDINGS For the purpose of bringing attention to some of the noteworthy findings, a few of those have been repeated below. Readers may also find particular interest in Section 10, which displays verbatim text of the unique contract provisions reported by responding superintendents. During the first year of this study, there has been great interest expressed in these redacted (to shield the identity of any respondent) contract provisions. Given that high level of interest, the responses from the 2012 study have been reprinted here along with the newly collected 2013 responses. A total of 2,369 usable responses were received for the 2013 study, or slightly over 25
percent of those contacted, which represents near double the responses received for the 2012 study, indicating greater interest on the part of superintendents in these data.
Similar to the 2012 study, respondents arrayed by gender favor males over females in a slightly more than three to one ratio which is consistent to the respondents in The American School Superintendent: 2010 Decennial Study.
Whites (not Hispanic) dominate the respondent ranks regardless of the gender. Central to the study of salary and benefits is understanding the respondents’
perception of the economic condition of their district. Regardless of gender, nearly
3
half of the superintendents described their district as stable while more than four in 10 described their district as in declining economic condition.
For those describing their district in declining economic condition, females outnumbered the males.
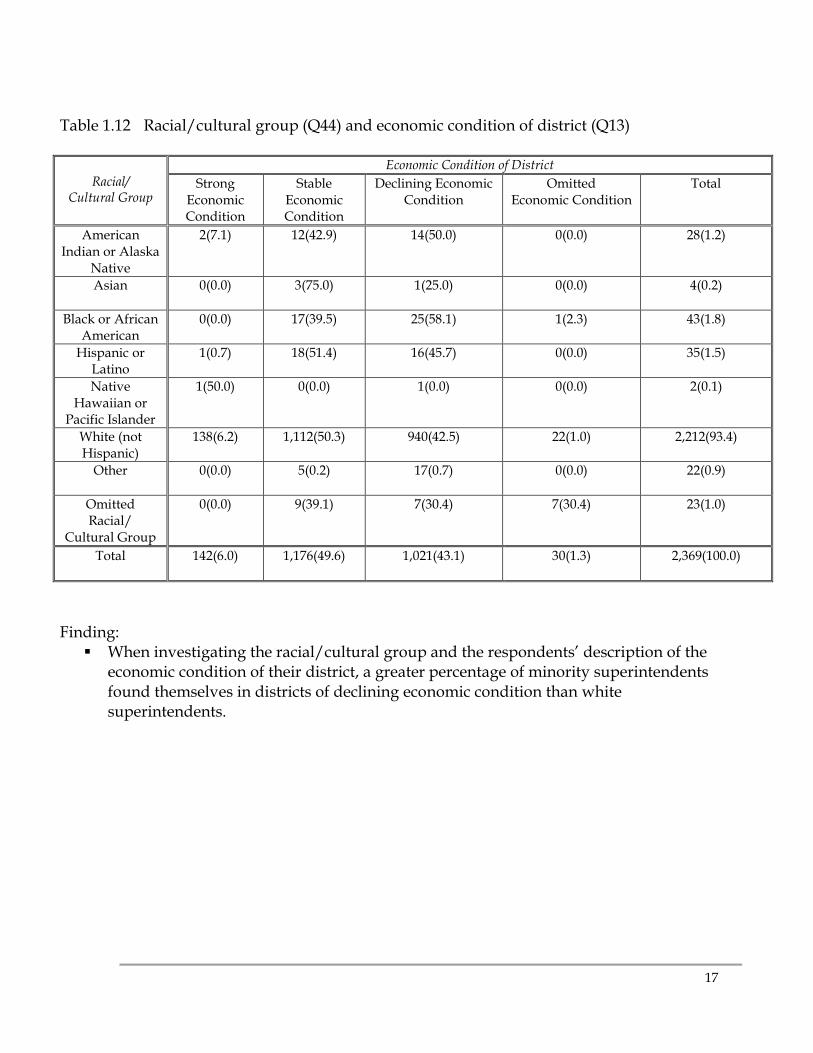
When investigating the racial/cultural group and the respondents’ description of the economic condition of their district, a greater percentage of minority superintendents found themselves in districts of declining economic condition than white superintendents.
As expected, 2012-13 median salary increases with district enrollment. This growth more than doubles when the median salary for the smallest district is compared to the largest enrollment district.
In most, but not all cases, across district enrollments, median salaries paid to females are slightly higher than those paid to male superintendents. In drawing conclusions from these data, one must take into consideration the relatively small count of respondents in the smallest and largest districts.
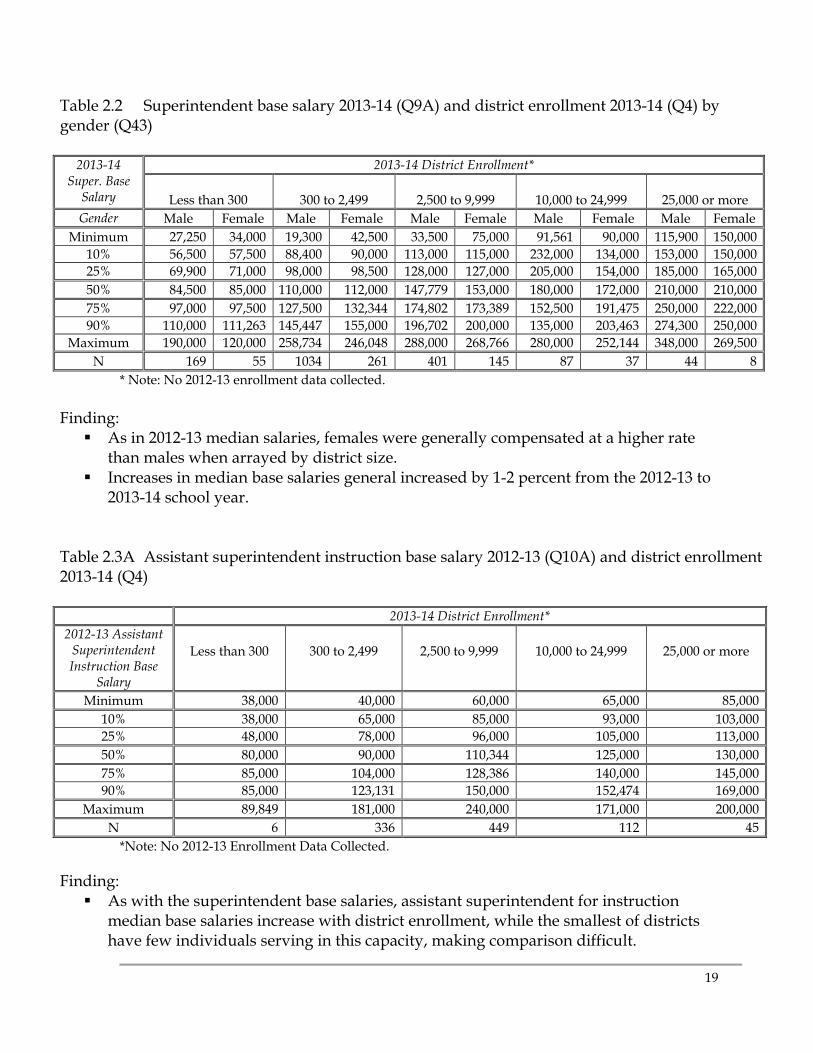
As in 2012-13 median salaries overall, females were generally still compensated at a higher rate than males when arrayed by district size.
Increases in median base salaries generally increased by 1-2 percent from the 2012-13 to 2013-14 school year.
Constructing the metric ratios of median superintendent salary and median beginning teacher salary produced no appreciable change in recent years.
Comparison of responses from the present study to the 2012-13 study indicate that nearly 10 percent more superintendents are now subject to an annual evaluation (85.1 to 94.3).
Even with the growth in annual evaluations, only half of the respondent superintendents indicate that they have included the process, measures and indicators to be used in the formal evaluation in their employment agreement.
Slightly more than four in 10 superintendents indicated that student outcomes/performance data are included in their evaluations. No trend data on this matter is yet available.
Slightly more than one in 10 superintendents who responded indicated they have been rehired as a superintendent after retiring from that state's or another state's retirement system. This is a marker of both an aging superintendent population and potentially narrowing pool of individuals interested in entering the superintendency.
Slightly more than half of the respondent superintendents indicated that the district used a legal counsel to negotiate the superintendent’s employment agreement.
In contrast to the use of legal counsel by the district, only about a quarter of respondent superintendents use the services of legal counsel themselves to negotiate their employment agreement.
4
END NOTES: Many additional data elements were collected beyond those reported in this document. AASA members interested in investigating in greater depth a particular contract element beyond those reported herein and/or are interested in offering suggestions for improvement of this research undertaking are invited to directly contact Dr. Robert S. McCord ([email protected]). Special thanks is extended to co-authors Noelle Ellerson and Leslie Finnan for their expertise and tireless efforts to manage the nearly 500,000 cell spreadsheet containing the data collected in this study. Robert S. McCord
5
LIST OF TABLES
Table 1.1 Respondents count by state (Q3) Table 1.2 Gender (Q43) and racial/cultural group (Q44) Table 1.3 Gender (Q43) and district enrollment (Q4) Table 1.4 Gender (Q43) and district description (Q5) Table 1.5 Gender (Q43) and longevity in present position (Q6) Table 1.6 Gender (Q43) and longevity as superintendent (Q7) Table 1.7 Gender (Q43) and economic condition of district (Q13) Table 1.8 Racial/cultural group (Q44) and district enrollment (Q4) Table 1.9 Racial/cultural group (Q44) and description of school district (Q5) Table 1.10 Racial/cultural group (Q44) and years in present position (Q6) Table 1.11 Racial/cultural group (Q44) and years as superintendent (Q7) Table 1.12 Racial/cultural group (Q44) and economic condition of district (Q13) Table 2.1 Superintendent base salary 2012-13 (Q8A) and district enrollment 2013-14
(Q4) by gender (Q43) Table 2.2 Superintendent base salary 2013-14 (Q9A) and district enrollment 2013-14 (Q4) by
gender (Q43) Table 2.3A Assistant superintendent instruction base salary 2012-13 (Q10A) and district
enrollment 2013-14 (Q4) Table 2.3B Assistant superintendent human resources base salary 2012-13 (Q10B) and
district enrollment 2013-14 (Q4) Table 2.3C Assistant superintendent business and finance base salary 2012-13 (Q10C)
and district enrollment 2013-14 (Q4) Table 2.3D High school principal base salary 2012-13 (Q10D) and district enrollment
2013-14 (Q4) Table 2.3E Middle school principal base salary 2012-13 (Q10E) and district enrollment
2013-14 (Q4) Table 2.3F Elementary school principal base salary 2012-13 (Q10F) and district
enrollment 2013-14 (Q4) Table 2.3G Beginning teacher base salary 2012-13 (Q10G) and district enrollment
2013-14 (Q4) Table 2.4A Assistant superintendent instruction base salary 2013-14 (Q11A) and
district enrollment 2013-14 (Q4) Table 2.4B Assistant superintendent human resources base salary 2013-14 (Q11B) and
district enrollment 2013-14 (Q4) Table 2.4C Assistant superintendent business and finance base salary 2013-14 (Q11C) and
district enrollment (2013-14) Q4
6
Table 2.4D High school principal base salary 2013-14 (Q11D) and district enrollment 2013-14 (Q4)
Table 2.4E Middle school principal base salary 2013-14 (Q11E) and district enrollment 2013-14 (Q4)
Table 2.4F Elementary school principal base salary 2013-14 (Q11F) and district enrollment 2013-14 (Q4)
Table 2.4G Beginning teacher base salary 2013-14 (Q11G) and district enrollment 2013-14 (Q4) Table 2.5 Ratio of 2013-14 median superintendent salaries (male only) (Q9A) with
that of beginning teacher base salary (males and females) (Q11G) by district enrollment (Q4)
Table 3.1 Does your employment contract require an annual performance evaluation? (Q26A) Table 3.2 Does your employment contract specify the process, measures, and indicators to be
used for your formal performance evaluation? (Q26B) Table 3.3 Is your formal performance evaluation linked to objectives or directions specified in
the previous year's performance? (Q26C) Table 3.4 Is your formal performance evaluation linked to a 360 degree feedback? (Q26 D) Table 3.5 Is your formal performance evaluation linked to student outcomes/performance?
(Q26 E) Table 3.6 Who formally evaluates your performance? (Q27) Table 3.7 Is the outcome of your formal performance evaluation made public? (Q26 F) Table 4.1 Does the school district make a contribution to an annuity or private retirement
account that you have? (Q 32) Table 4.2 Is your retirement plan/system contribution based on your salary? (Q30) Table 4.3 Percentage of total retirement contribution paid by the school district. (Q31) Table 5.1 What health insurance coverage do you receive in you contract? Coverage paid for
superintendent: medical/hospital (Q34 A) Table 5.2 What health insurance coverage do you receive in you contract? Coverage paid for
superintendent: dental (Q34 B) Table 5.3 What health insurance coverage do you receive in you contract? Coverage paid for
superintendent: vision/optical (Q34 C) Table 5.4 What health insurance coverage do you receive in you contract? Coverage paid
for superintendent: disability insurance (Q34 D) Table 5.5 What health insurance coverage do you receive in you contract? Coverage paid for
superintendent’s family: medical/hospital (Q35 A) Table 5.6 What health insurance coverage do you receive in you contract? Coverage paid for
superintendent’s family: dental (Q35 B) Table 5.7 What health insurance coverage do you receive in you contract? Coverage paid for
superintendent’s family: vision/optical (Q35 C) Table 5.8 What health insurance coverage do you receive in you contract? Coverage paid for
superintendent’s family: disability (Q35 D) Table 5.9 What health insurance coverage do you receive in you contract? Do you receive
any post-retirement health insurance coverage? (Q 36)
7
Table 6.1 Have you been rehired for your present position as superintendent after retiring in the state system? (Q41)
Table 6.2 Are you drawing retirement from one state and working as a superintendent in another state? (Q42)
Table 7.1 Which of the following contract benefits are provided in your employment contract? (Q29)
Table 7.2 Does the school district contribute to the premiums on a term insurance policy apart from the insurance benefits provided for all employees? (Q 33)
Table 7.3 Gender (Q43) and sick leave provision (Q16A/B) Table 7.4 Gender (Q43) and vacation leave provision (Q17A/B) Table 7.5 Gender (Q43) and personal leave provision (Q18A/B) Table 7.6 Gender (Q43) and upon departure from the district, how is sick leave
accrual handled? (Q19A-C) Table 7.7 Gender (Q43) and upon departure from the district, how is vacation leave
accrual handled? (Q20A-C) Table 7.8 Gender (Q43) and upon departure from the district, how is personal leave
accrual handled? (Q21A-C) Table 7.9 Gender (Q43) and what is the term of your 2013-2014 employment
contract? (Q14) Table 7.10 Gender (Q43) and does your present employment contract have an
incentive/performance clause (i.e., a defined provision providing for a reward for accomplishing a predetermined task or objective)? (Q22)
Table 7.11 Gender (Q43) and does your contract have a severance (buy out) clause? (Q23)
Table 7.12 Gender (Q43) and does your contract have a longevity clause (i.e., a lump sum payment you will receive for the number of years you remain in the position)? (Q24)
Table 7.13 Gender (Q43) and is your contract base salary subject to a "cap" imposed by any of the following? (Q25)
Table 7.14 Gender (Q43) and evergreen (rollover) provision (Q15) Table 7.15 Racial/cultural group (Q44) and what is the term of your 2013-2014
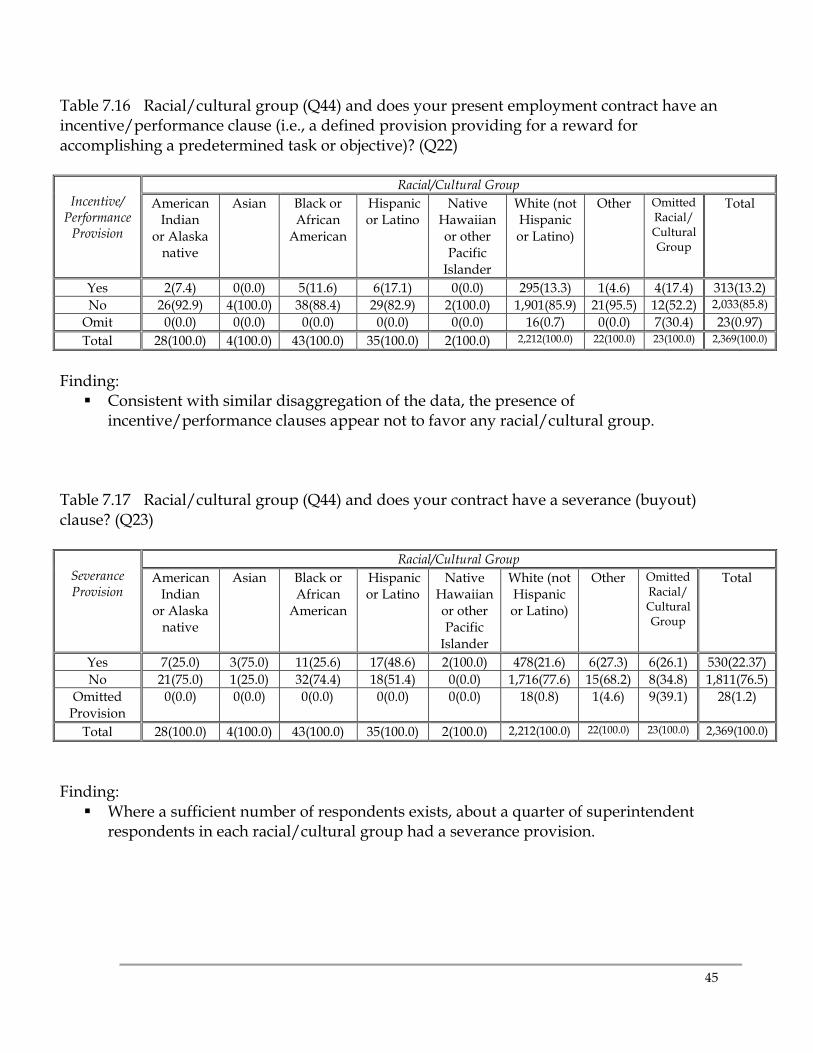
employment contract? (Q14) Table 7.16 Racial/cultural group (Q44) and does your present employment contract
have an incentive/performance clause (i.e., a defined provision providing for a reward for accomplishing a predetermined task or objective)? (Q22)
Table 7.17 Racial/cultural group (Q44) and does your contract have a severance (buyout) clause? (Q23)
Table 7.18 Racial/cultural group (Q44) and does your contract have a longevity clause (i.e., a lump sum payment you will receive for the number of years you remain in the position)? (Q24)
Table 7.19 Racial/cultural group (Q44) and is your contract base salary subject to a "cap" imposed by any of the following? (Q25)
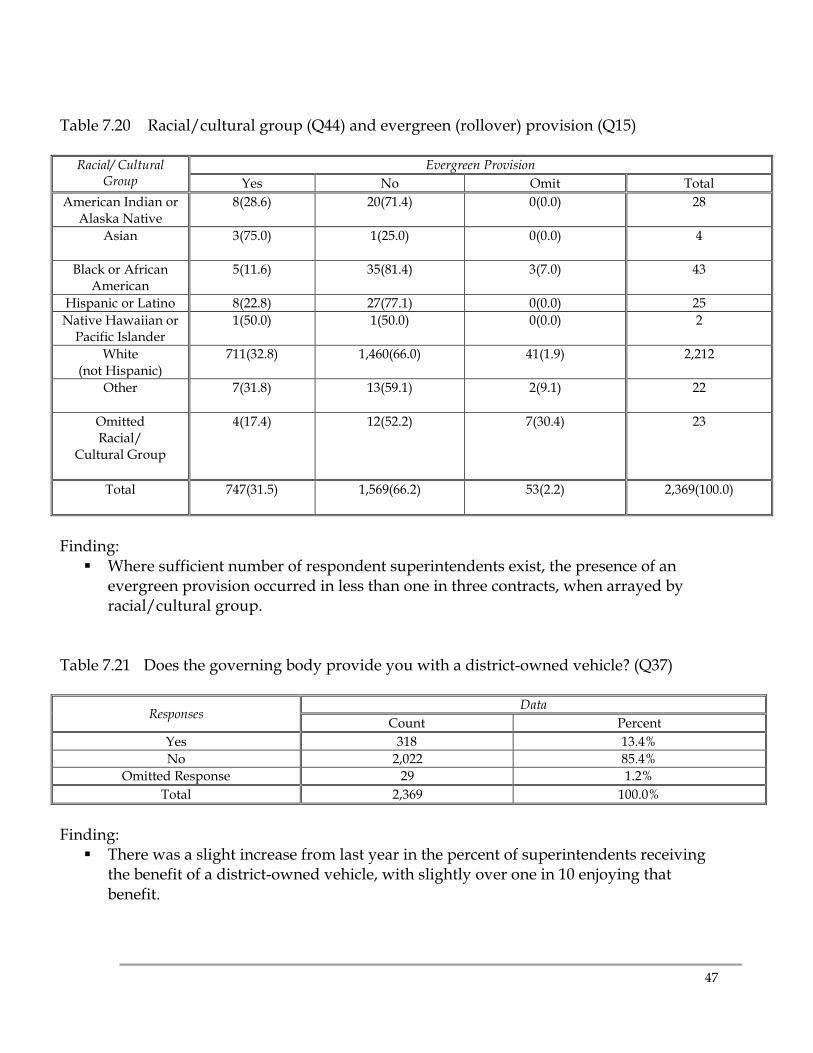
Table 7.20 Racial/ cultural group (Q44) and evergreen (rollover) provision (Q15)
8
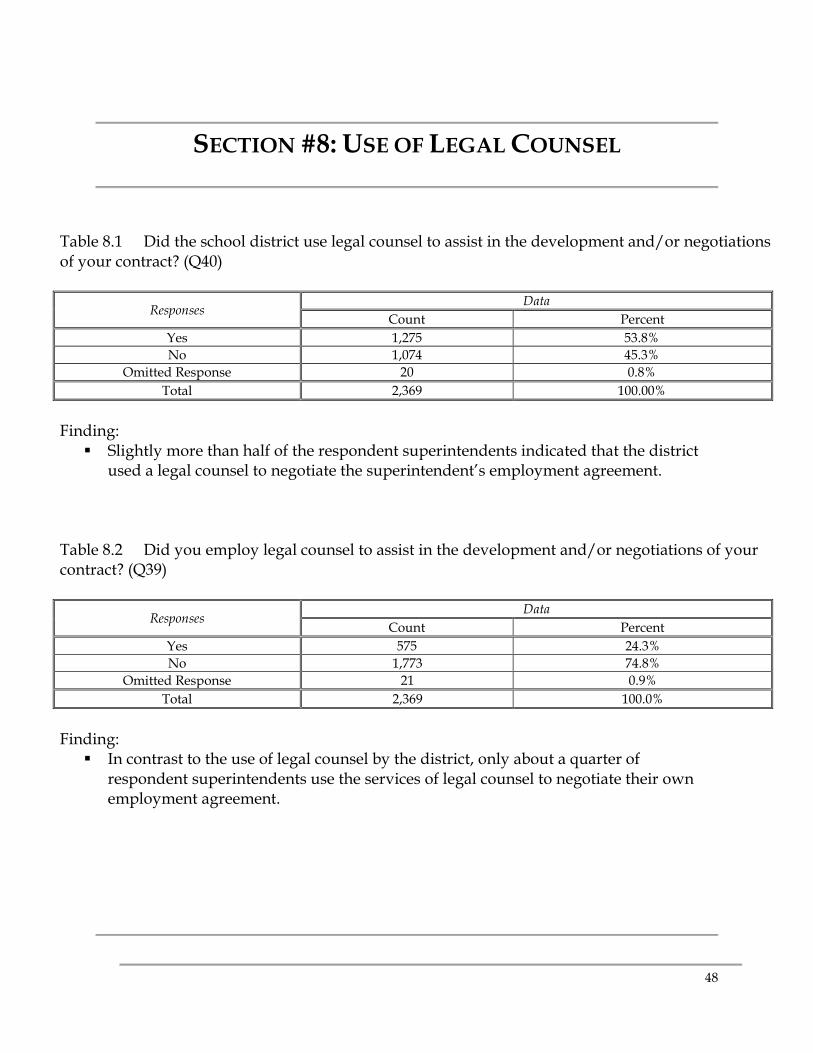
Table 8.1 Did the school district use legal counsel to assist in the development and/or negotiations of your contract? (Q40)
Table 8.2 Did you employ legal counsel to assist in the development and/or negotiations of your contract? (Q39)
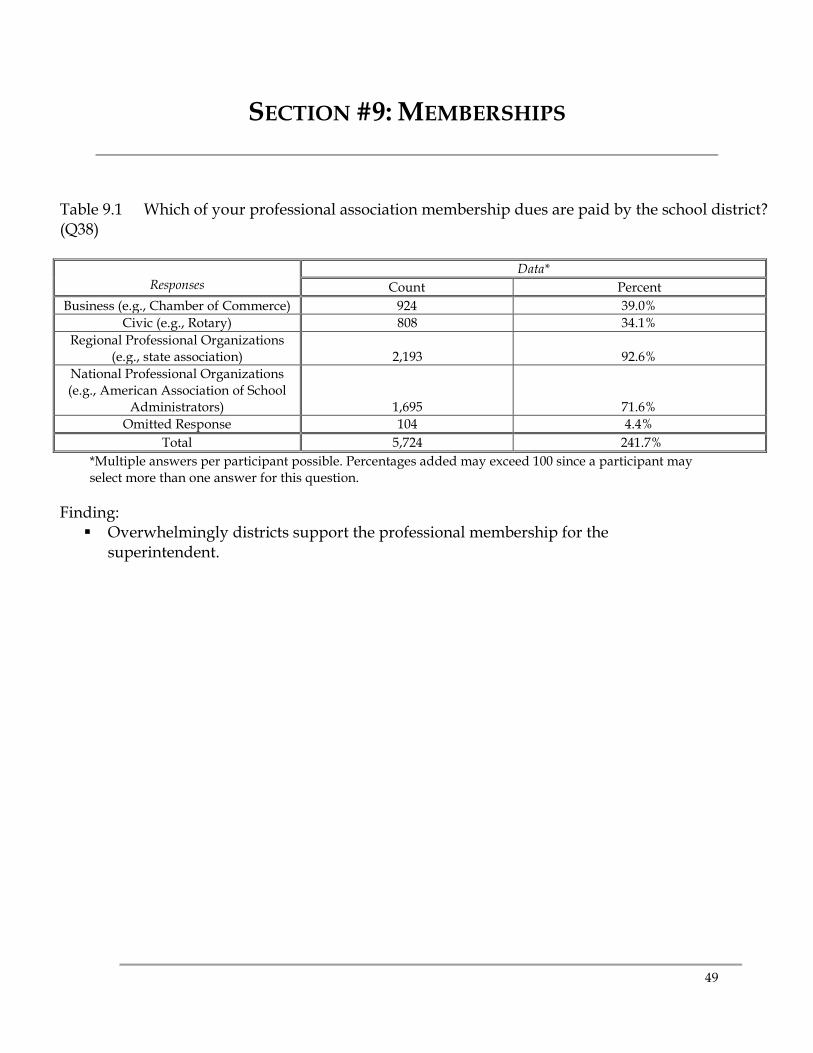
Table 9.1 Which of your professional association membership dues are paid by the school district? (Q38)
9
SECTION #1: GENERAL DEMOGRAPHICS OF RESPONDENTS
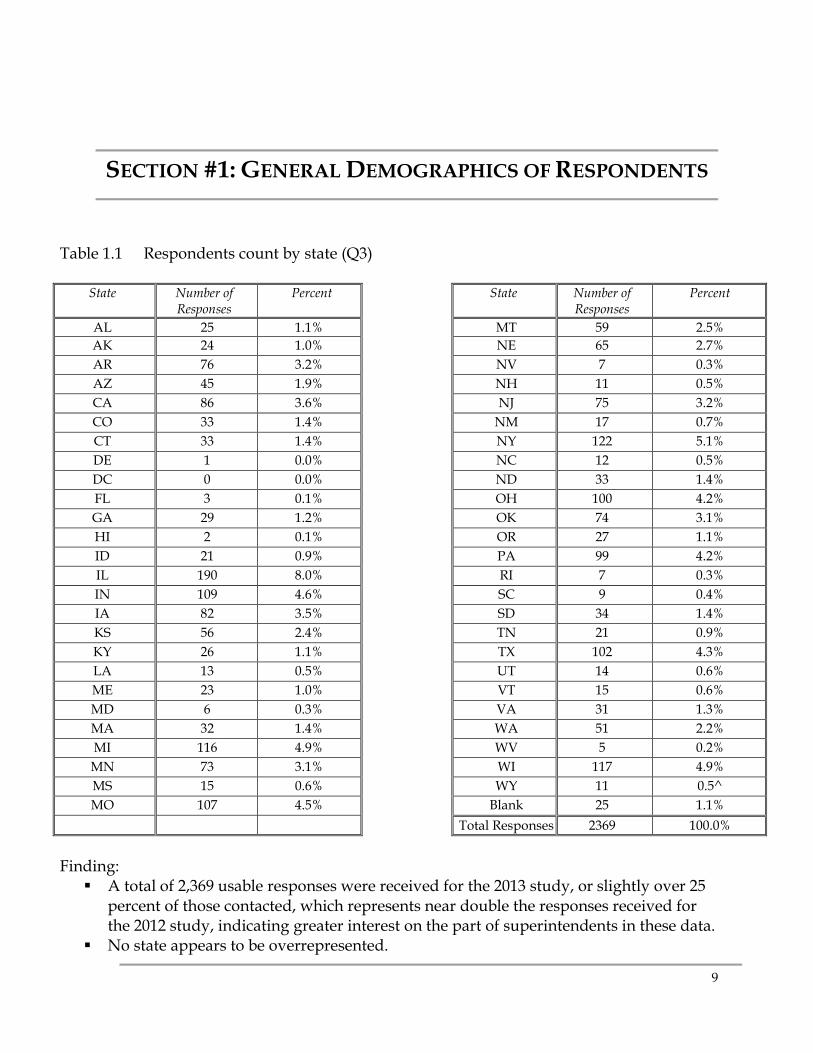
Table 1.1 Respondents count by state (Q3)
State Number of Responses
Percent State Number of Responses
Percent
AL 25 1.1% MT 59 2.5% AK 24 1.0% NE 65 2.7% AR 76 3.2% NV 7 0.3% AZ 45 1.9% NH 11 0.5% CA 86 3.6% NJ 75 3.2% CO 33 1.4% NM 17 0.7% CT 33 1.4% NY 122 5.1% DE 1 0.0% NC 12 0.5% DC 0 0.0% ND 33 1.4% FL 3 0.1% OH 100 4.2% GA 29 1.2% OK 74 3.1% HI 2 0.1% OR 27 1.1% ID 21 0.9% PA 99 4.2% IL 190 8.0% RI 7 0.3% IN 109 4.6% SC 9 0.4% IA 82 3.5% SD 34 1.4% KS 56 2.4% TN 21 0.9% KY 26 1.1% TX 102 4.3% LA 13 0.5% UT 14 0.6% ME 23 1.0% VT 15 0.6% MD 6 0.3% VA 31 1.3% MA 32 1.4% WA 51 2.2% MI 116 4.9% WV 5 0.2% MN 73 3.1% WI 117 4.9% MS 15 0.6% WY 11 0.5^ MO 107 4.5% Blank 25 1.1%
Total Responses 2369 100.0% Finding: A total of 2,369 usable responses were received for the 2013 study, or slightly over 25
percent of those contacted, which represents near double the responses received for the 2012 study, indicating greater interest on the part of superintendents in these data.
No state appears to be overrepresented.
10
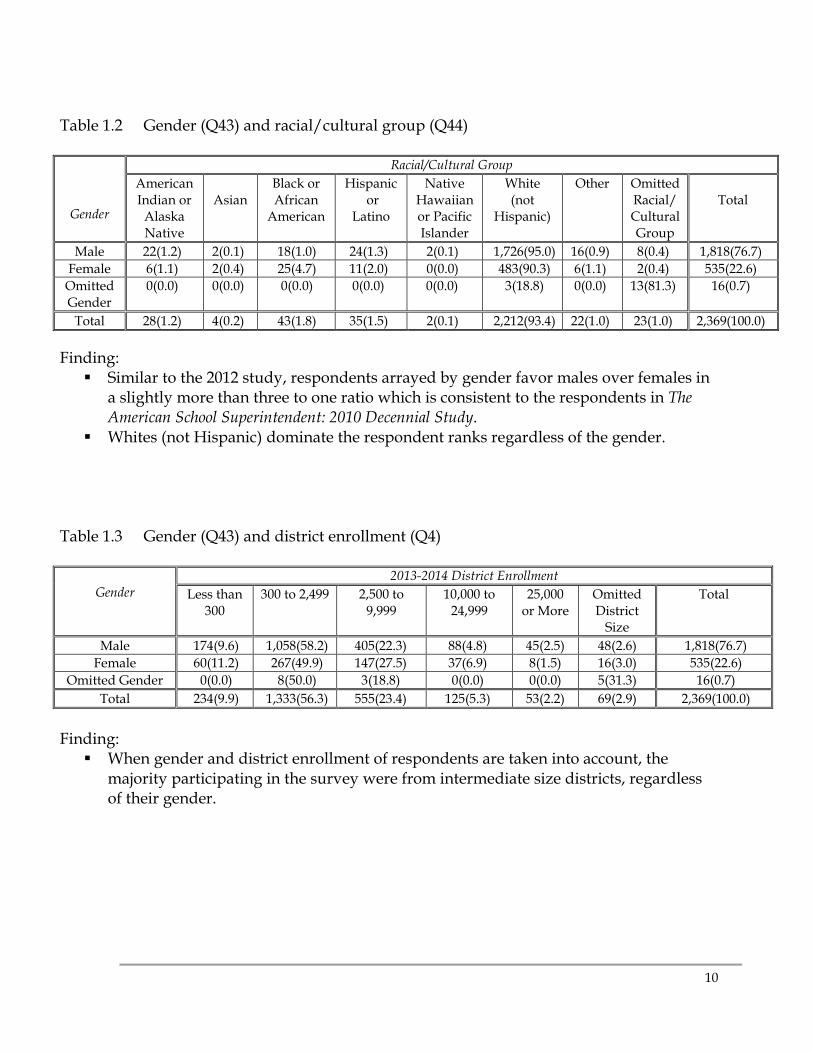
Table 1.2 Gender (Q43) and racial/cultural group (Q44)
Total 28(1.2) 4(0.2) 43(1.8) 35(1.5) 2(0.1) 2,212(93.4) 22(1.0) 23(1.0) 2,369(100.0) Finding: Similar to the 2012 study, respondents arrayed by gender favor males over females in
a slightly more than three to one ratio which is consistent to the respondents in The American School Superintendent: 2010 Decennial Study.
Whites (not Hispanic) dominate the respondent ranks regardless of the gender. Table 1.3 Gender (Q43) and district enrollment (Q4)
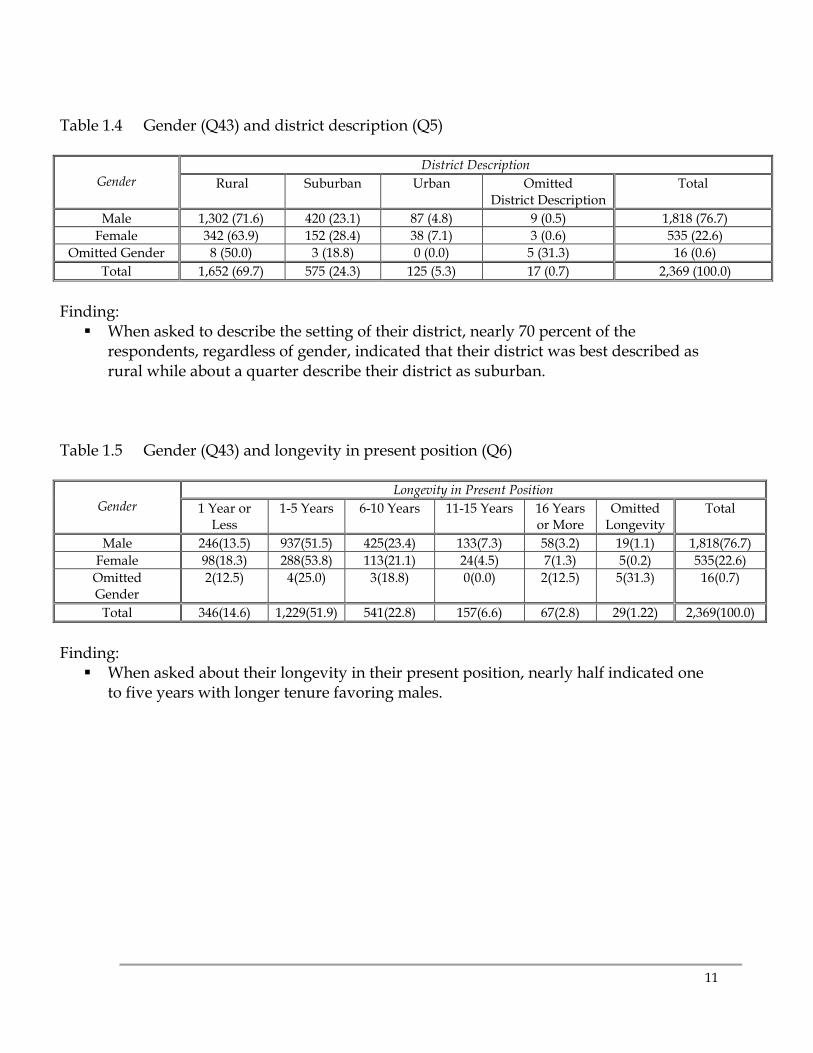
Finding: When asked to describe the setting of their district, nearly 70 percent of the
respondents, regardless of gender, indicated that their district was best described as rural while about a quarter describe their district as suburban.
Table 1.5 Gender (Q43) and longevity in present position (Q6)
Total 142(6.0) 1,176(49.6) 1,021(43.1) 30(1.3) 2,369(100.0)
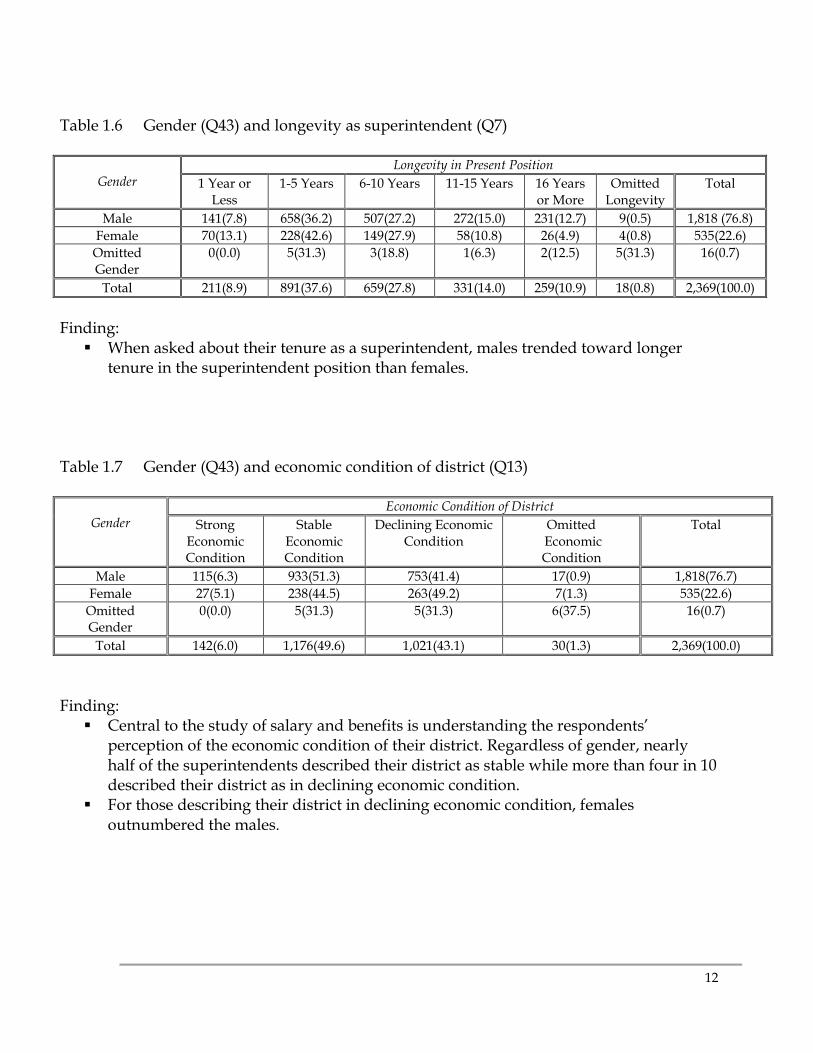
Finding: Central to the study of salary and benefits is understanding the respondents’
perception of the economic condition of their district. Regardless of gender, nearly half of the superintendents described their district as stable while more than four in 10 described their district as in declining economic condition.
For those describing their district in declining economic condition, females outnumbered the males.
13
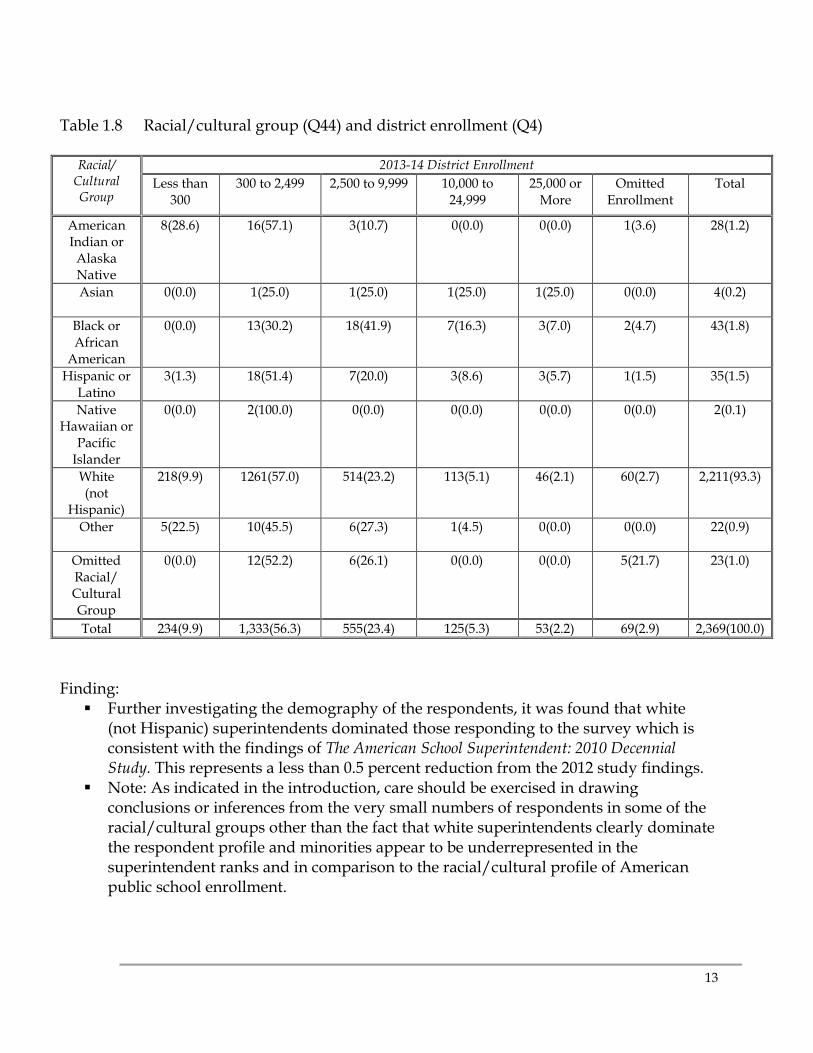
Table 1.8 Racial/cultural group (Q44) and district enrollment (Q4)
Total 234(9.9) 1,333(56.3) 555(23.4) 125(5.3) 53(2.2) 69(2.9) 2,369(100.0)
Finding: Further investigating the demography of the respondents, it was found that white
(not Hispanic) superintendents dominated those responding to the survey which is consistent with the findings of The American School Superintendent: 2010 Decennial Study. This represents a less than 0.5 percent reduction from the 2012 study findings.
Note: As indicated in the introduction, care should be exercised in drawing conclusions or inferences from the very small numbers of respondents in some of the racial/cultural groups other than the fact that white superintendents clearly dominate the respondent profile and minorities appear to be underrepresented in the superintendent ranks and in comparison to the racial/cultural profile of American public school enrollment.
14
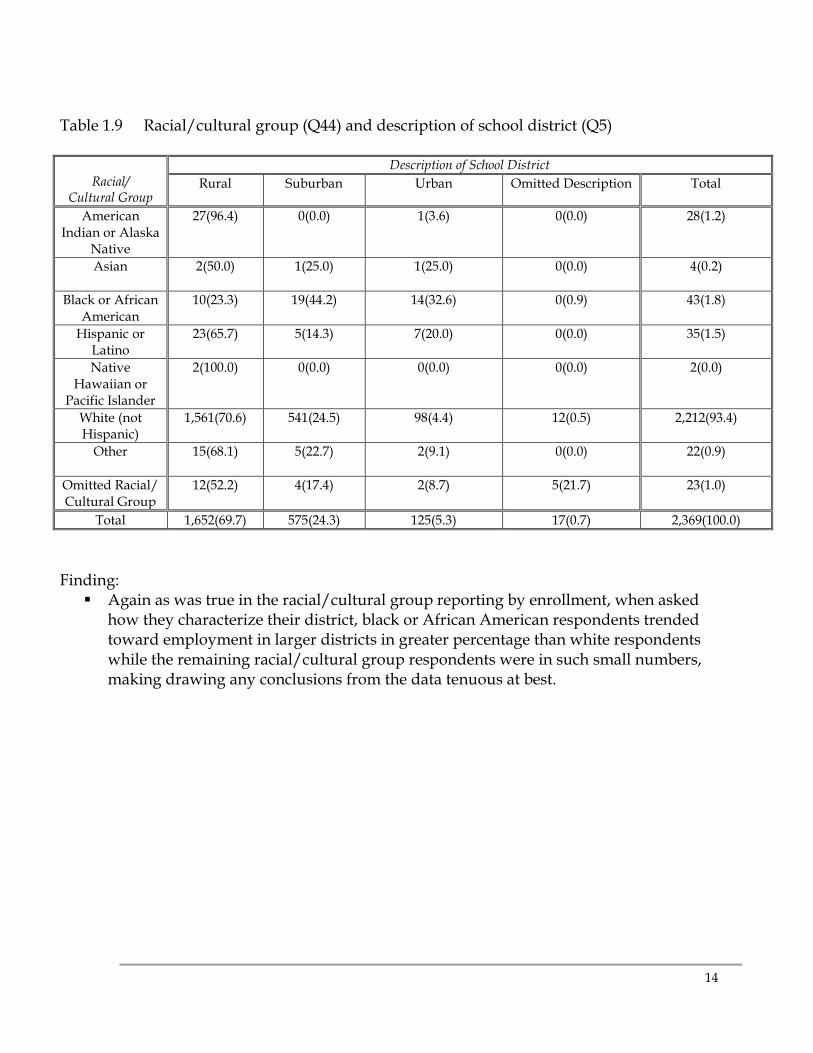
Table 1.9 Racial/cultural group (Q44) and description of school district (Q5)
Racial/
Cultural Group
Description of School District Rural Suburban Urban Omitted Description Total
American Indian or Alaska
Native
27(96.4) 0(0.0) 1(3.6) 0(0.0) 28(1.2)
Asian
2(50.0) 1(25.0) 1(25.0) 0(0.0) 4(0.2)
Black or African American
10(23.3) 19(44.2) 14(32.6) 0(0.9) 43(1.8)
Hispanic or Latino
23(65.7) 5(14.3) 7(20.0) 0(0.0) 35(1.5)
Native Hawaiian or
Pacific Islander
2(100.0) 0(0.0) 0(0.0) 0(0.0) 2(0.0)
White (not Hispanic)
1,561(70.6) 541(24.5) 98(4.4) 12(0.5) 2,212(93.4)
Other
15(68.1) 5(22.7) 2(9.1) 0(0.0) 22(0.9)
Omitted Racial/ Cultural Group
12(52.2) 4(17.4) 2(8.7) 5(21.7) 23(1.0)
Total 1,652(69.7) 575(24.3) 125(5.3) 17(0.7) 2,369(100.0)
Finding: Again as was true in the racial/cultural group reporting by enrollment, when asked
how they characterize their district, black or African American respondents trended toward employment in larger districts in greater percentage than white respondents while the remaining racial/cultural group respondents were in such small numbers, making drawing any conclusions from the data tenuous at best.
15
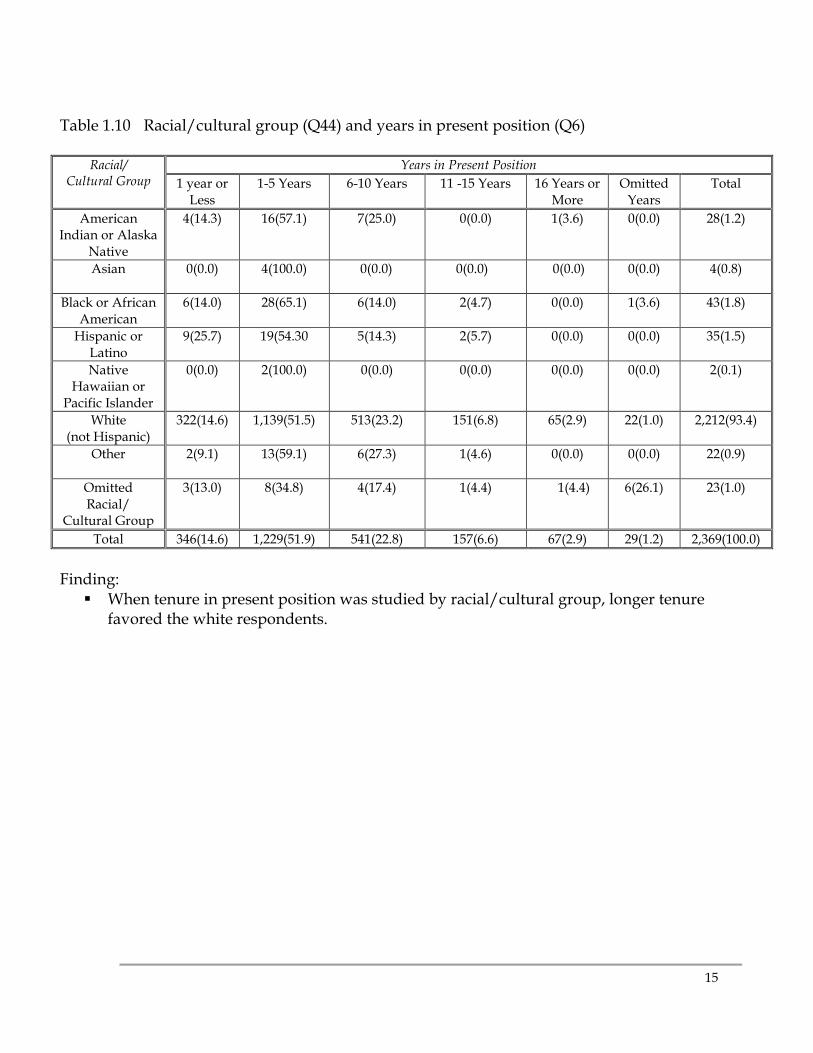
Table 1.10 Racial/cultural group (Q44) and years in present position (Q6)
Racial/
Cultural Group Years in Present Position
1 year or Less
1-5 Years 6-10 Years 11 -15 Years 16 Years or More
Finding: When investigating the racial/cultural group and the respondents’ description of the
economic condition of their district, a greater percentage of minority superintendents found themselves in districts of declining economic condition than white superintendents.
18
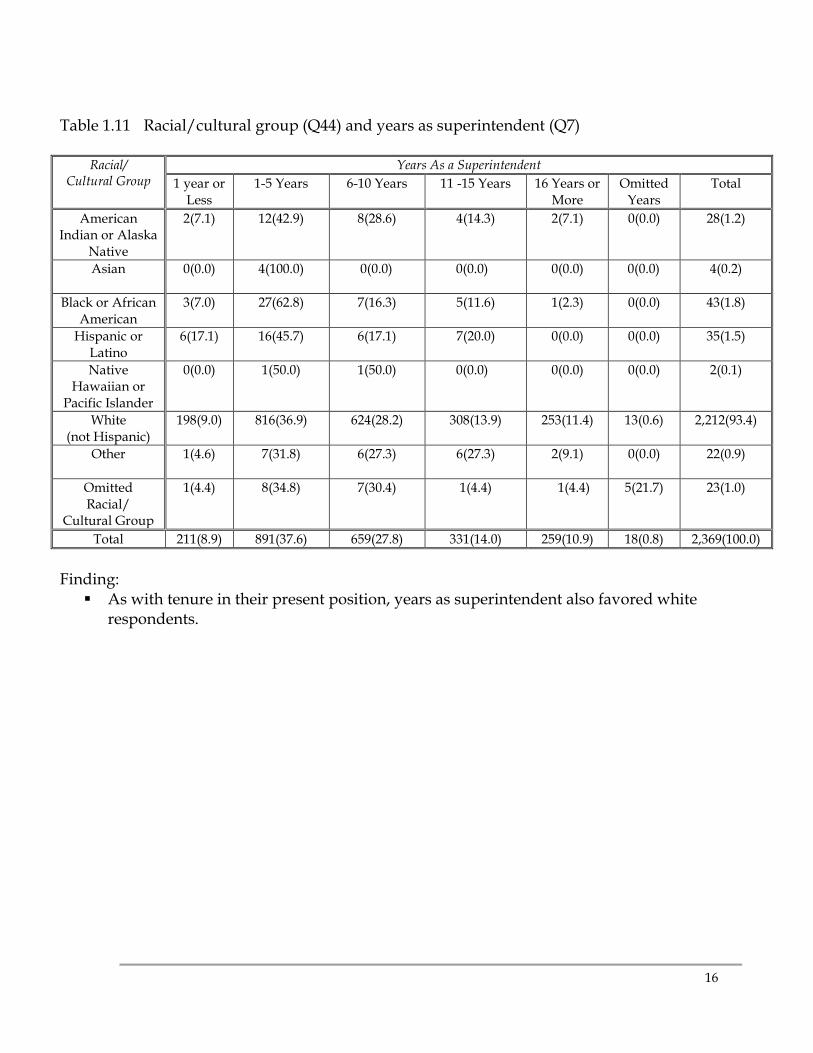
SECTION #2: SALARY
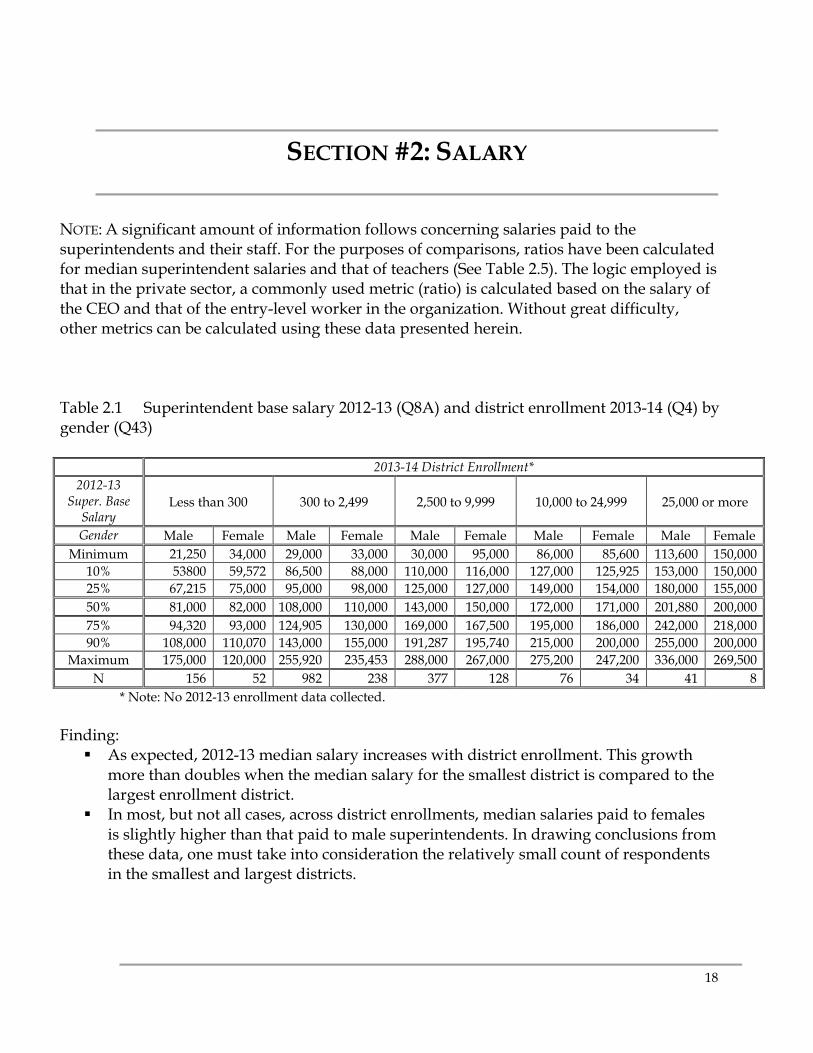
NOTE: A significant amount of information follows concerning salaries paid to the superintendents and their staff. For the purposes of comparisons, ratios have been calculated for median superintendent salaries and that of teachers (See Table 2.5). The logic employed is that in the private sector, a commonly used metric (ratio) is calculated based on the salary of the CEO and that of the entry-level worker in the organization. Without great difficulty, other metrics can be calculated using these data presented herein. Table 2.1 Superintendent base salary 2012-13 (Q8A) and district enrollment 2013-14 (Q4) by gender (Q43)
2013-14 District Enrollment*
2012-13 Super. Base
Salary
Less than 300
300 to 2,499
2,500 to 9,999
10,000 to 24,999
25,000 or more
Gender Male Female Male Female Male Female Male Female Male Female Minimum 21,250 34,000 29,000 33,000 30,000 95,000 86,000 85,600 113,600 150,000
* Note: No 2012-13 enrollment data collected. Finding: As expected, 2012-13 median salary increases with district enrollment. This growth
more than doubles when the median salary for the smallest district is compared to the largest enrollment district.
In most, but not all cases, across district enrollments, median salaries paid to females is slightly higher than that paid to male superintendents. In drawing conclusions from these data, one must take into consideration the relatively small count of respondents in the smallest and largest districts.
19
Table 2.2 Superintendent base salary 2013-14 (Q9A) and district enrollment 2013-14 (Q4) by gender (Q43)
2013-14 Super. Base
Salary
2013-14 District Enrollment*
Less than 300
300 to 2,499
2,500 to 9,999
10,000 to 24,999
25,000 or more Gender Male Female Male Female Male Female Male Female Male Female
Maximum 89,849 181,000 240,000 171,000 200,000 N 6 336 449 112 45
*Note: No 2012-13 Enrollment Data Collected.
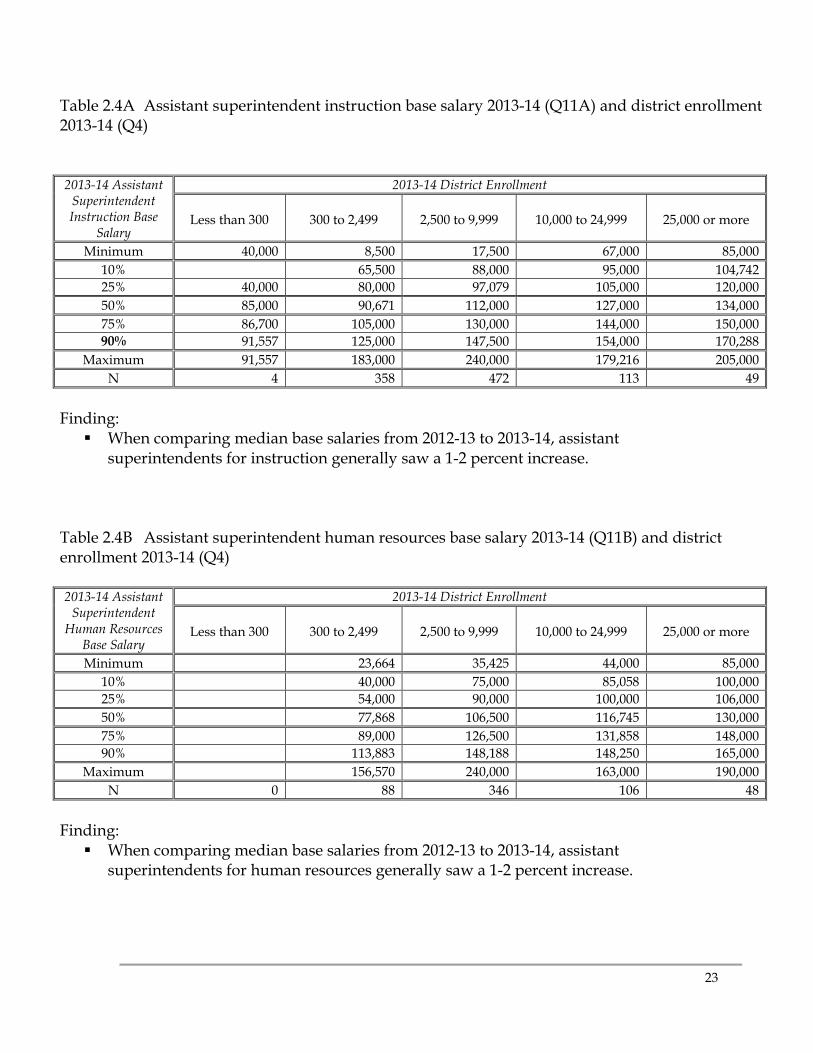
Finding: As with the superintendent base salaries, assistant superintendent for instruction
median base salaries increase with district enrollment, while the smallest of districts have few individuals serving in this capacity, making comparison difficult.
20
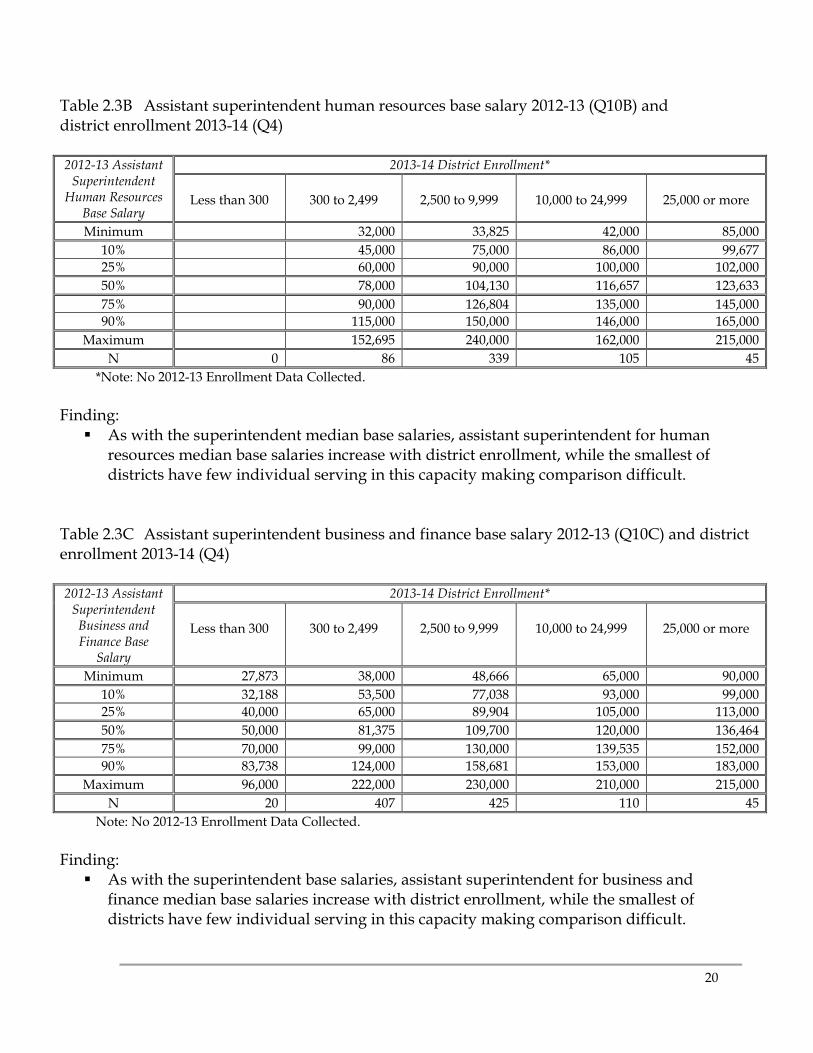
Table 2.3B Assistant superintendent human resources base salary 2012-13 (Q10B) and district enrollment 2013-14 (Q4) 2012-13 Assistant
Maximum 152,695 240,000 162,000 215,000 N 0 86 339 105 45
*Note: No 2012-13 Enrollment Data Collected. Finding: As with the superintendent median base salaries, assistant superintendent for human
resources median base salaries increase with district enrollment, while the smallest of districts have few individual serving in this capacity making comparison difficult.
Table 2.3C Assistant superintendent business and finance base salary 2012-13 (Q10C) and district enrollment 2013-14 (Q4) 2012-13 Assistant
Maximum 96,000 222,000 230,000 210,000 215,000 N 20 407 425 110 45
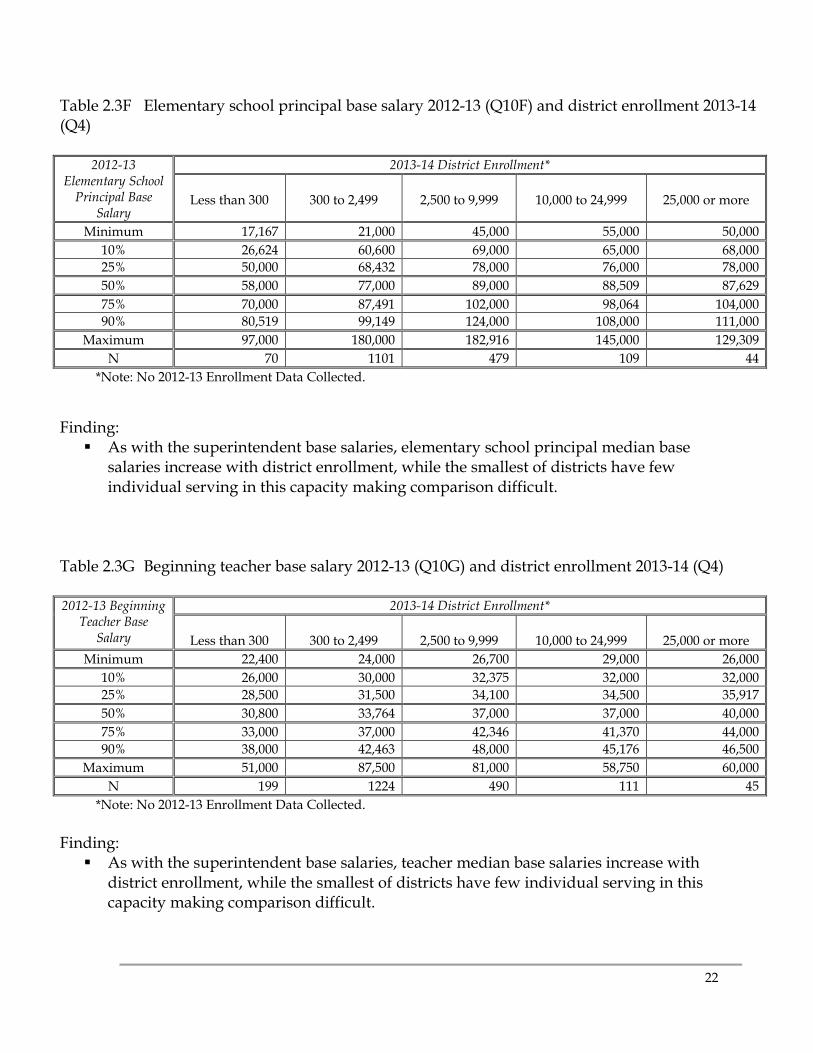
Note: No 2012-13 Enrollment Data Collected. Finding: As with the superintendent base salaries, assistant superintendent for business and
finance median base salaries increase with district enrollment, while the smallest of districts have few individual serving in this capacity making comparison difficult.
21
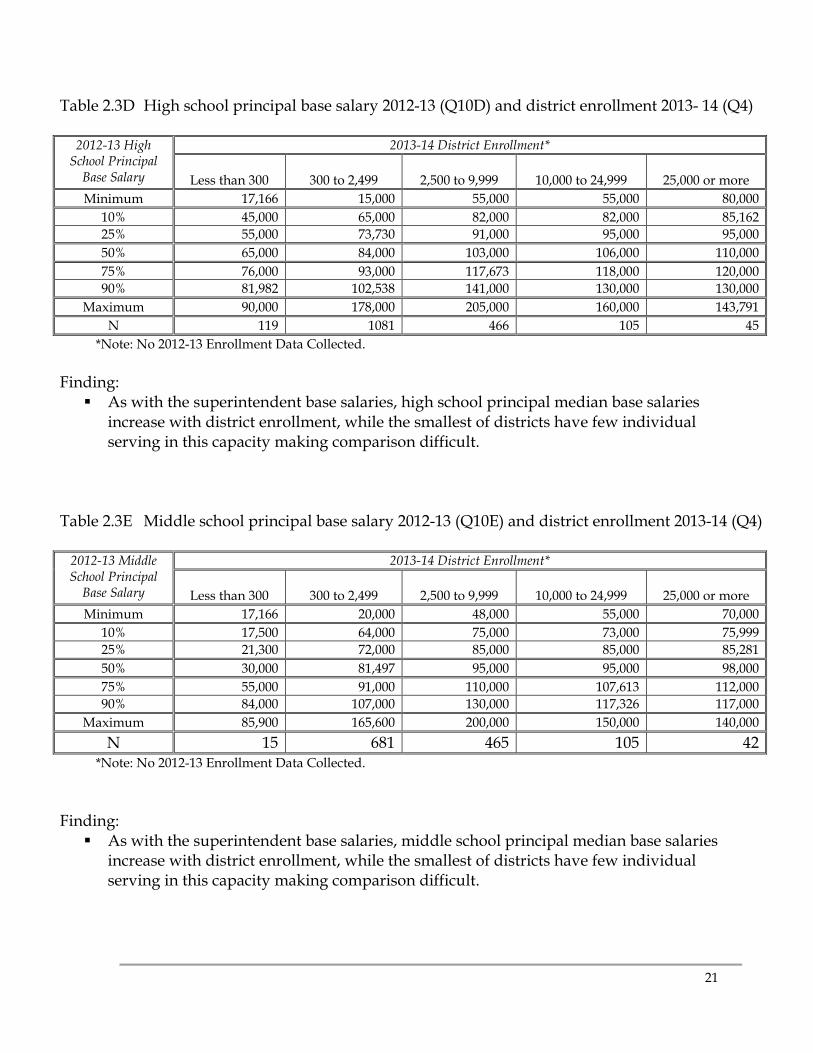
Table 2.3D High school principal base salary 2012-13 (Q10D) and district enrollment 2013- 14 (Q4)
2012-13 High School Principal
Base Salary
2013-14 District Enrollment*
Less than 300
300 to 2,499
2,500 to 9,999
10,000 to 24,999
25,000 or more Minimum 17,166 15,000 55,000 55,000 80,000
Maximum 91,557 183,000 240,000 179,216 205,000 N 4 358 472 113 49
Finding: When comparing median base salaries from 2012-13 to 2013-14, assistant
superintendents for instruction generally saw a 1-2 percent increase. Table 2.4B Assistant superintendent human resources base salary 2013-14 (Q11B) and district enrollment 2013-14 (Q4) 2013-14 Assistant
Maximum 96,000 227,000 230,000 220,000 215,000 N 17 410 439 110 47
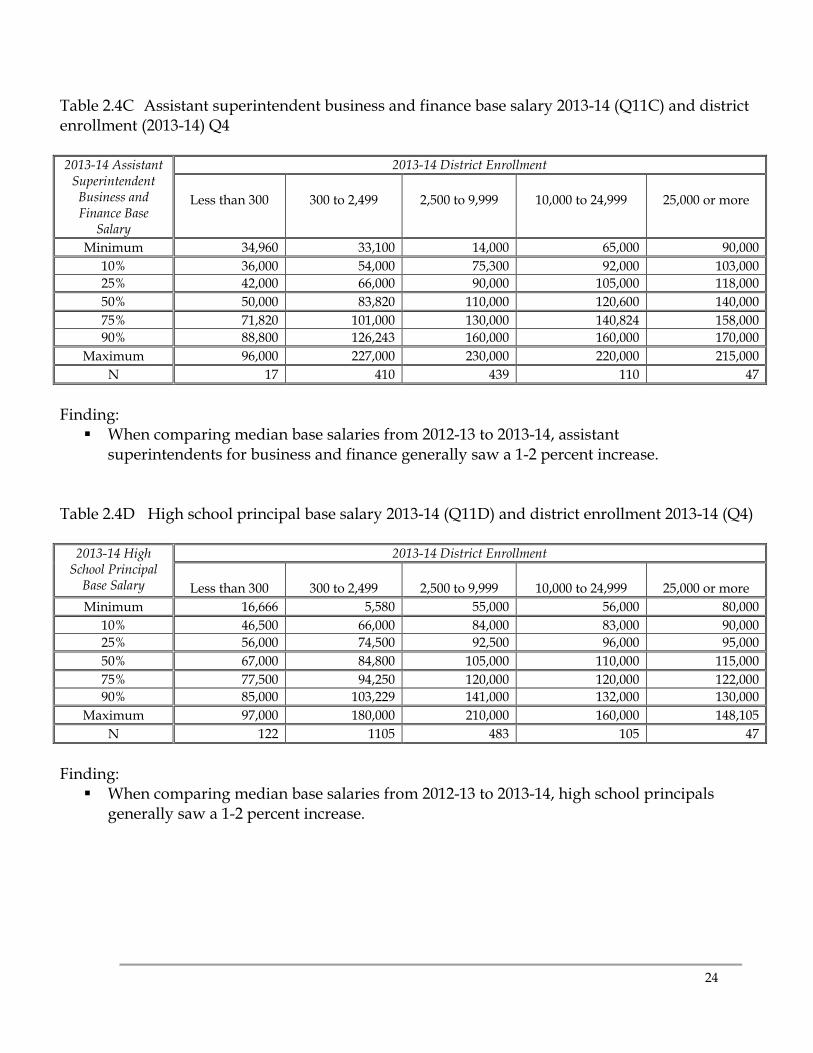
Finding: When comparing median base salaries from 2012-13 to 2013-14, assistant
superintendents for business and finance generally saw a 1-2 percent increase. Table 2.4D High school principal base salary 2013-14 (Q11D) and district enrollment 2013-14 (Q4)
2013-14 High School Principal
Base Salary
2013-14 District Enrollment
Less than 300
300 to 2,499
2,500 to 9,999
10,000 to 24,999
25,000 or more Minimum 16,666 5,580 55,000 56,000 80,000
Maximum 86,800 168,500 205,000 150,000 145,000 N 15 702 485 103 44
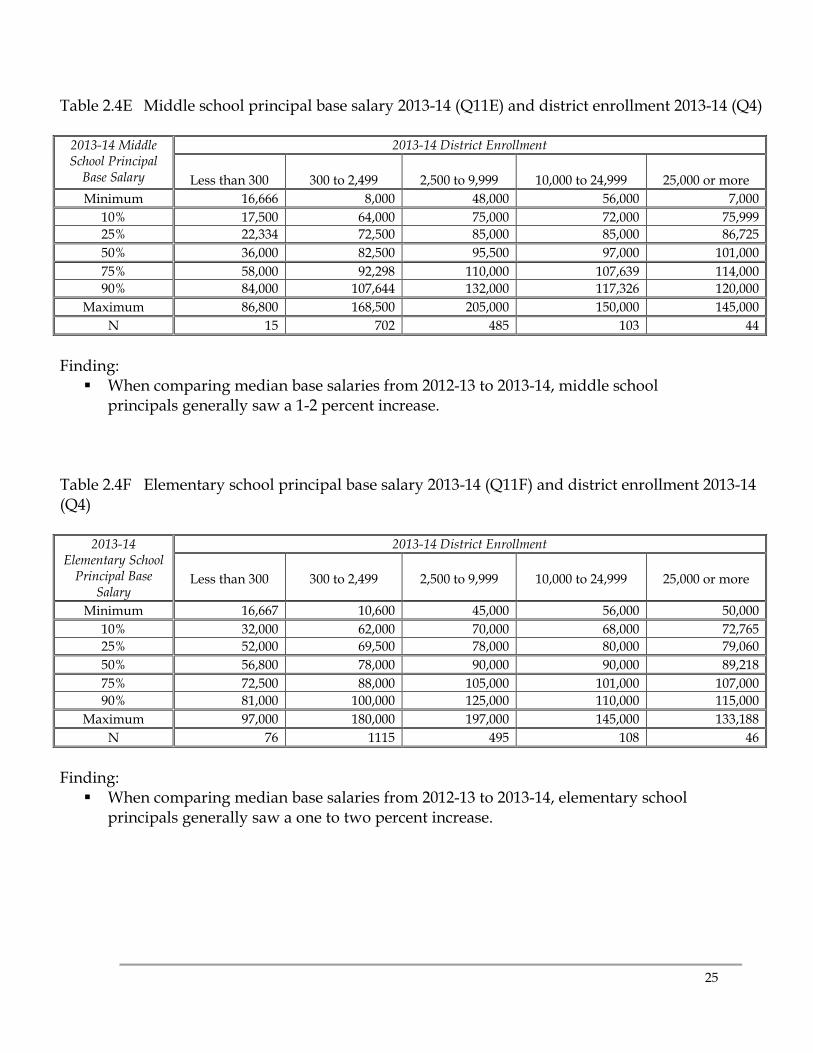
Finding: When comparing median base salaries from 2012-13 to 2013-14, middle school
principals generally saw a 1-2 percent increase. Table 2.4F Elementary school principal base salary 2013-14 (Q11F) and district enrollment 2013-14 (Q4)
Maximum 53,000 95,318 85,000 63,000 60,000 N 197 1206 502 111 45
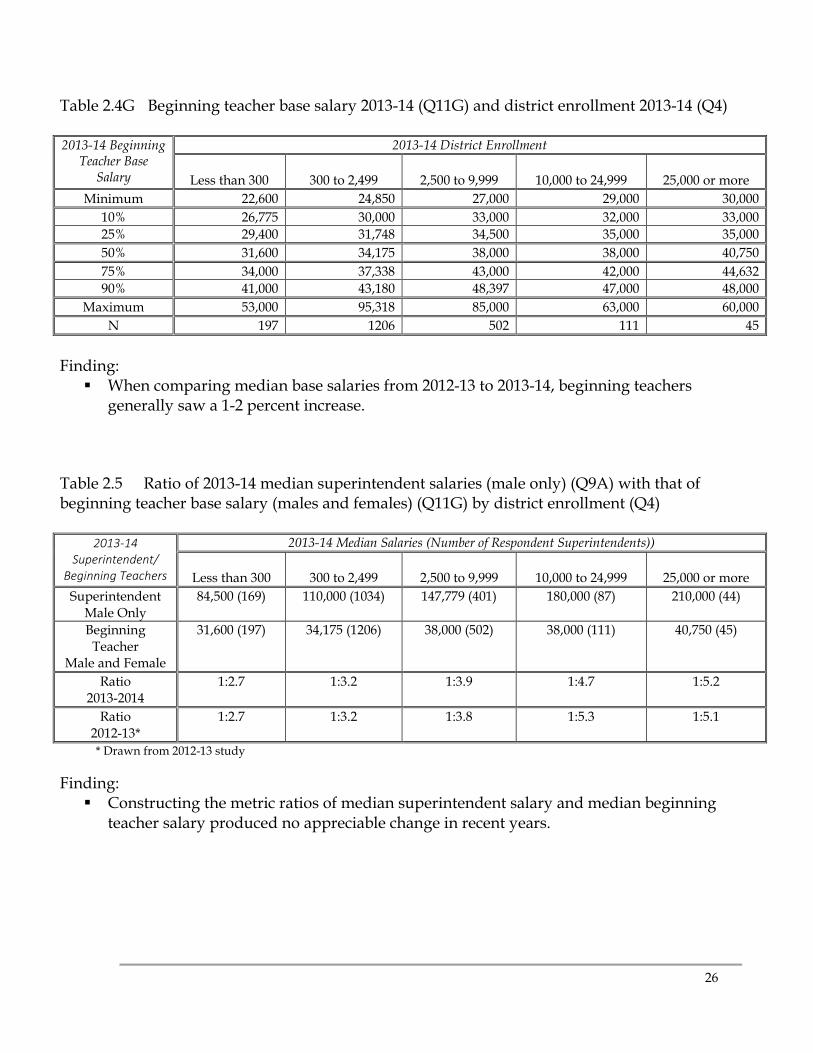
Finding: When comparing median base salaries from 2012-13 to 2013-14, beginning teachers
generally saw a 1-2 percent increase.
Table 2.5 Ratio of 2013-14 median superintendent salaries (male only) (Q9A) with that of beginning teacher base salary (males and females) (Q11G) by district enrollment (Q4)
2013-14 Superintendent/
Beginning Teachers
2013-14 Median Salaries (Number of Respondent Superintendents))
Less than 300
300 to 2,499
2,500 to 9,999
10,000 to 24,999
25,000 or more Superintendent
Male Only 84,500 (169) 110,000 (1034) 147,779 (401) 180,000 (87) 210,000 (44)
Finding: Constructing the metric ratios of median superintendent salary and median beginning
teacher salary produced no appreciable change in recent years.
27
SECTION #3: EVALUATION
Table 3.1 Does your employment contract require an annual performance evaluation? (Q26A)
Responses Data
Count Percent Yes 2,238 94.3% No 120 5.1%
Omitted 15 0.6% Total Responses 2,373* 100.0%
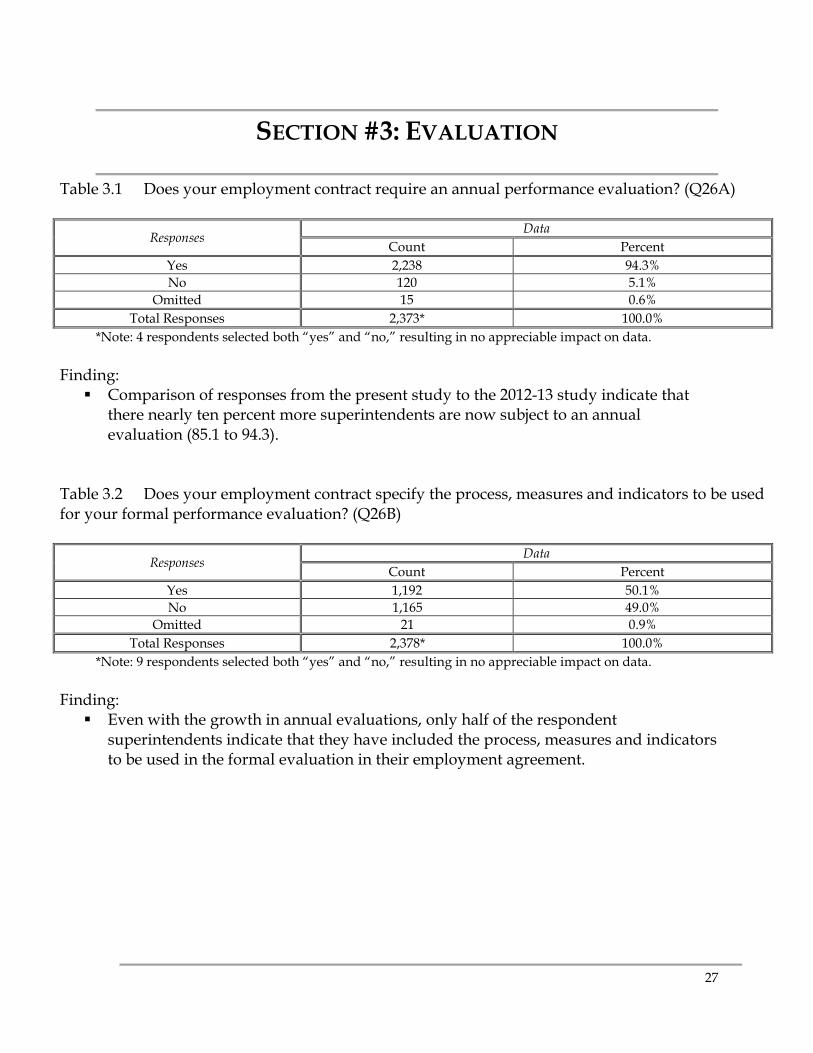
*Note: 4 respondents selected both “yes” and “no,” resulting in no appreciable impact on data. Finding: Comparison of responses from the present study to the 2012-13 study indicate that
there nearly ten percent more superintendents are now subject to an annual evaluation (85.1 to 94.3).
Table 3.2 Does your employment contract specify the process, measures and indicators to be used for your formal performance evaluation? (Q26B)
Responses Data
Count Percent Yes 1,192 50.1% No 1,165 49.0%
Omitted 21 0.9% Total Responses 2,378* 100.0%
*Note: 9 respondents selected both “yes” and “no,” resulting in no appreciable impact on data. Finding: Even with the growth in annual evaluations, only half of the respondent
superintendents indicate that they have included the process, measures and indicators to be used in the formal evaluation in their employment agreement.
28
Table 3.3 Is your formal performance evaluation linked to objectives or directions specified in the previous year's performance? (Q26C)
Responses Data
Count Percent Yes 1,385 58.2% No 969 40.7%
Omitted 24 1.0% Total Responses 2,378* 100.0%
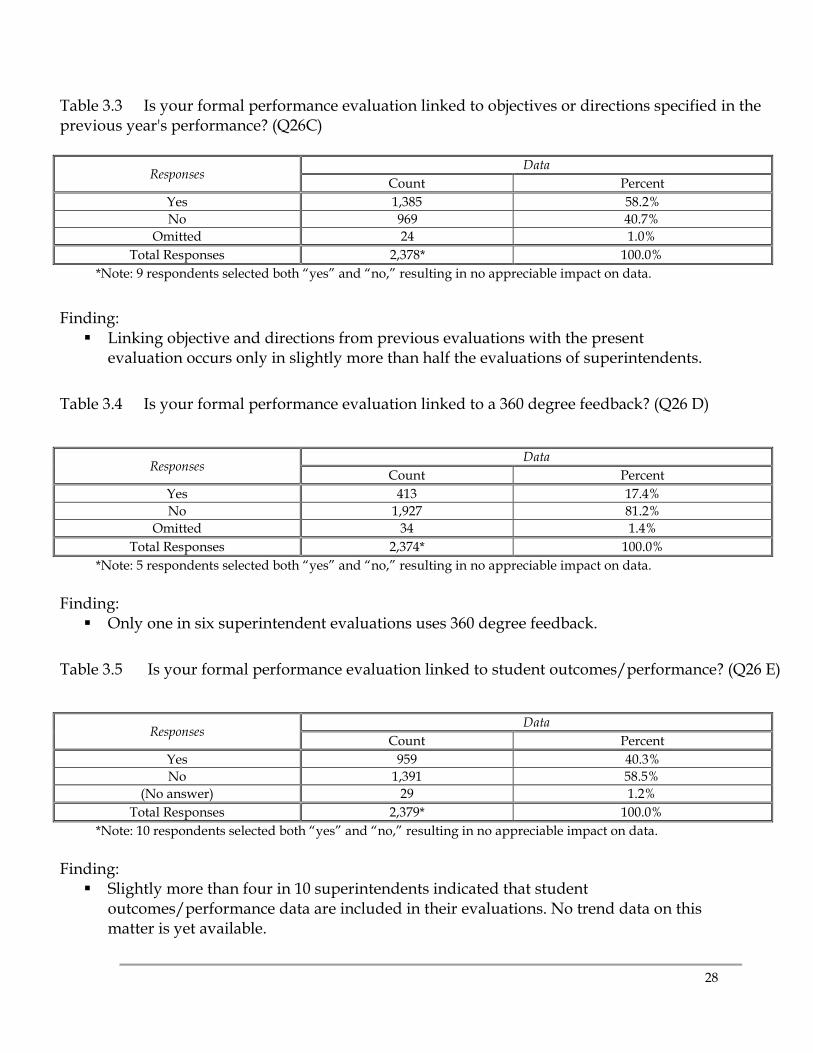
*Note: 9 respondents selected both “yes” and “no,” resulting in no appreciable impact on data. Finding: Linking objective and directions from previous evaluations with the present
evaluation occurs only in slightly more than half the evaluations of superintendents. Table 3.4 Is your formal performance evaluation linked to a 360 degree feedback? (Q26 D)
Responses Data
Count Percent Yes 413 17.4% No 1,927 81.2%
Omitted 34 1.4% Total Responses 2,374* 100.0%
*Note: 5 respondents selected both “yes” and “no,” resulting in no appreciable impact on data.
Finding: Only one in six superintendent evaluations uses 360 degree feedback.
Table 3.5 Is your formal performance evaluation linked to student outcomes/performance? (Q26 E)
Responses Data
Count Percent Yes 959 40.3% No 1,391 58.5%
(No answer) 29 1.2% Total Responses 2,379* 100.0%
*Note: 10 respondents selected both “yes” and “no,” resulting in no appreciable impact on data.
Finding: Slightly more than four in 10 superintendents indicated that student
outcomes/performance data are included in their evaluations. No trend data on this matter is yet available.
29
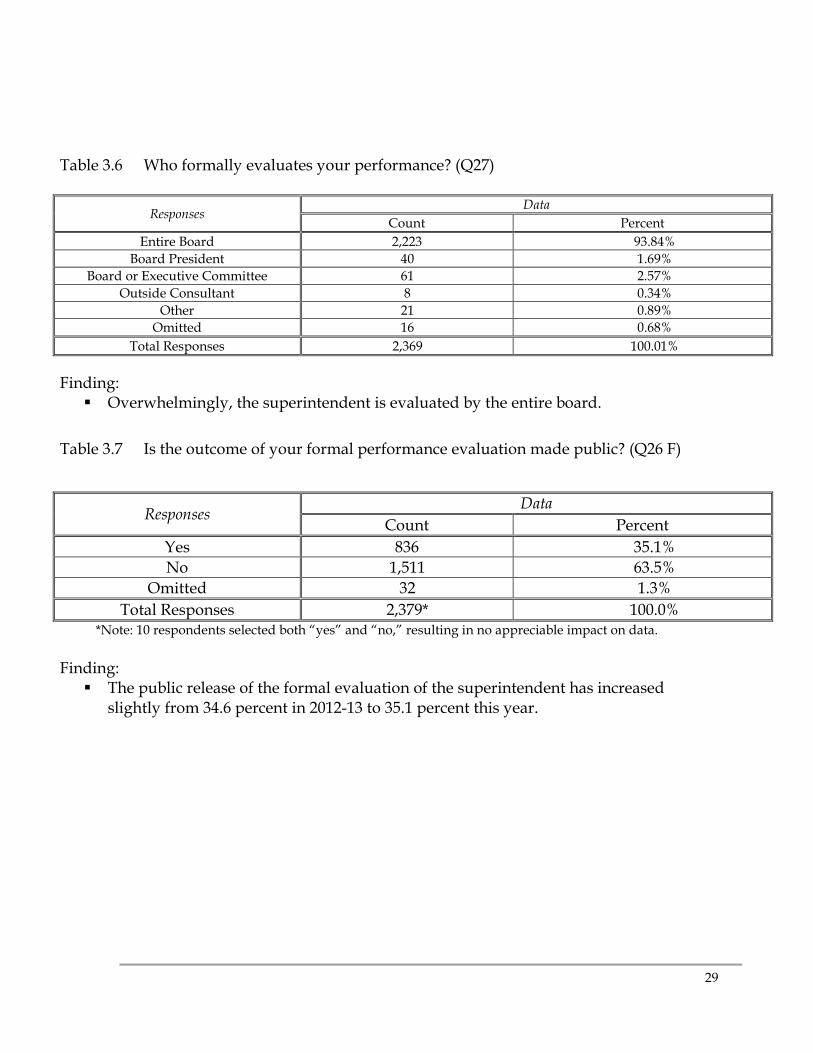
Table 3.6 Who formally evaluates your performance? (Q27)
Responses Data
Count Percent Entire Board 2,223 93.84%
Board President 40 1.69% Board or Executive Committee 61 2.57%
Outside Consultant 8 0.34% Other 21 0.89%
Omitted 16 0.68% Total Responses 2,369 100.01%
Finding: Overwhelmingly, the superintendent is evaluated by the entire board.
Table 3.7 Is the outcome of your formal performance evaluation made public? (Q26 F)
Responses Data
Count Percent Yes 836 35.1% No 1,511 63.5%
Omitted 32 1.3% Total Responses 2,379* 100.0%
*Note: 10 respondents selected both “yes” and “no,” resulting in no appreciable impact on data. Finding: The public release of the formal evaluation of the superintendent has increased
slightly from 34.6 percent in 2012-13 to 35.1 percent this year.
30
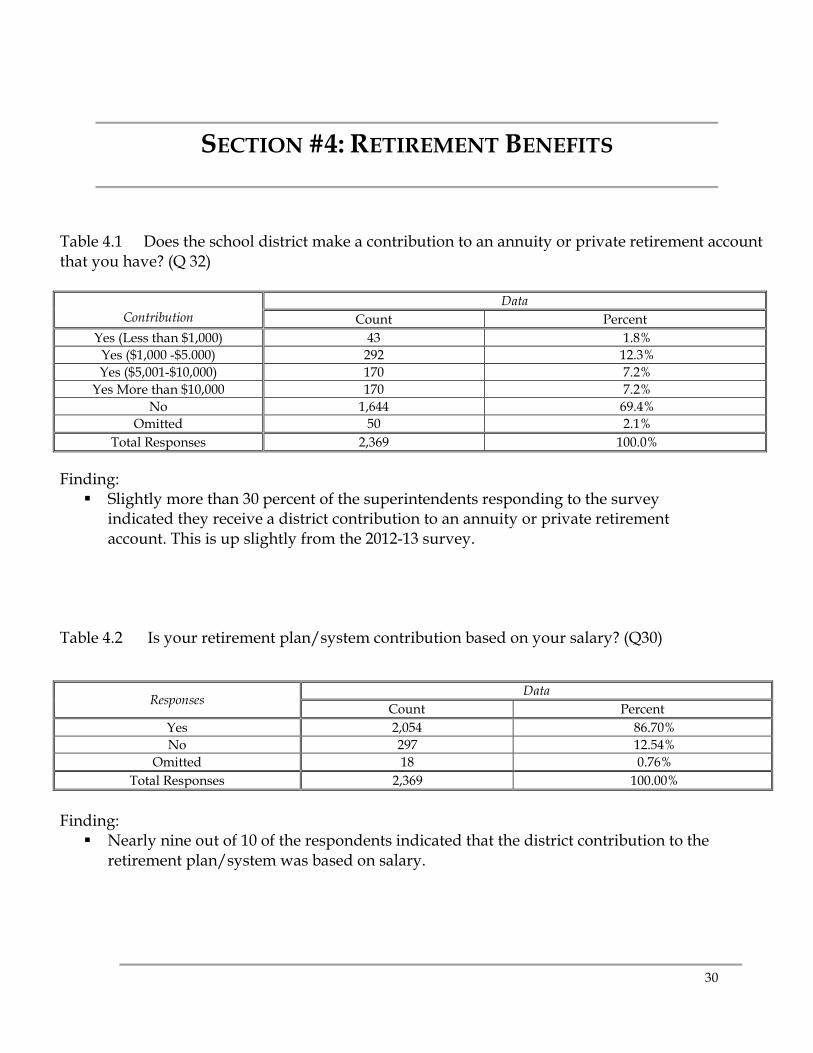
SECTION #4: RETIREMENT BENEFITS
Table 4.1 Does the school district make a contribution to an annuity or private retirement account that you have? (Q 32)
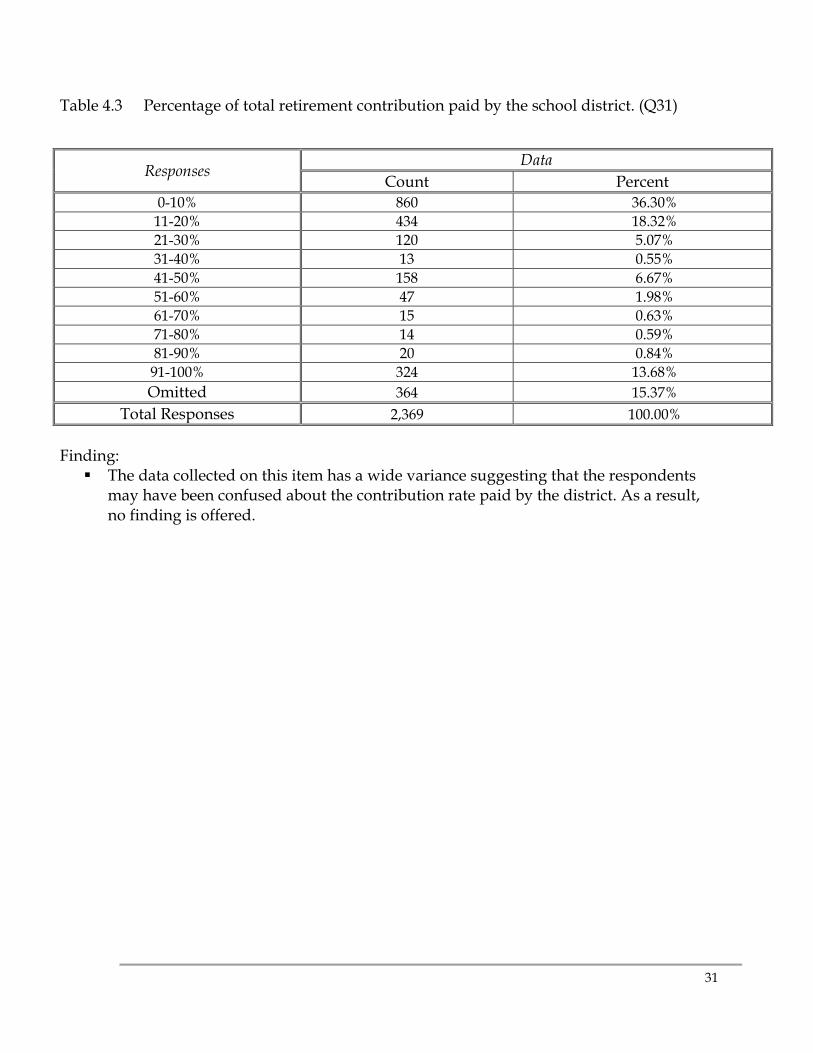
Total Responses 2,369 100.00% Finding: The data collected on this item has a wide variance suggesting that the respondents
may have been confused about the contribution rate paid by the district. As a result, no finding is offered.
32
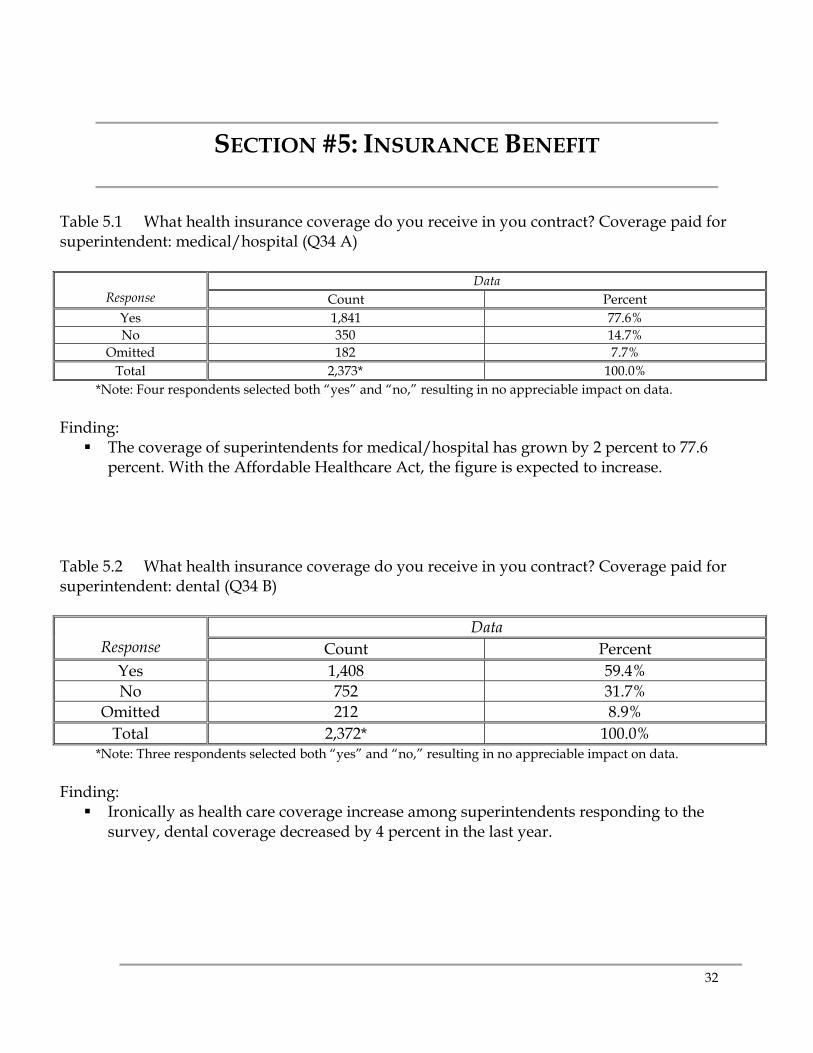
SECTION #5: INSURANCE BENEFIT
Table 5.1 What health insurance coverage do you receive in you contract? Coverage paid for superintendent: medical/hospital (Q34 A)
Response Data
Count Percent Yes 1,841 77.6% No 350 14.7%
Omitted 182 7.7% Total 2,373* 100.0%
*Note: Four respondents selected both “yes” and “no,” resulting in no appreciable impact on data. Finding: The coverage of superintendents for medical/hospital has grown by 2 percent to 77.6
percent. With the Affordable Healthcare Act, the figure is expected to increase. Table 5.2 What health insurance coverage do you receive in you contract? Coverage paid for superintendent: dental (Q34 B)
Response Data
Count Percent Yes 1,408 59.4% No 752 31.7%
Omitted 212 8.9% Total 2,372* 100.0%
*Note: Three respondents selected both “yes” and “no,” resulting in no appreciable impact on data. Finding: Ironically as health care coverage increase among superintendents responding to the
survey, dental coverage decreased by 4 percent in the last year.
33
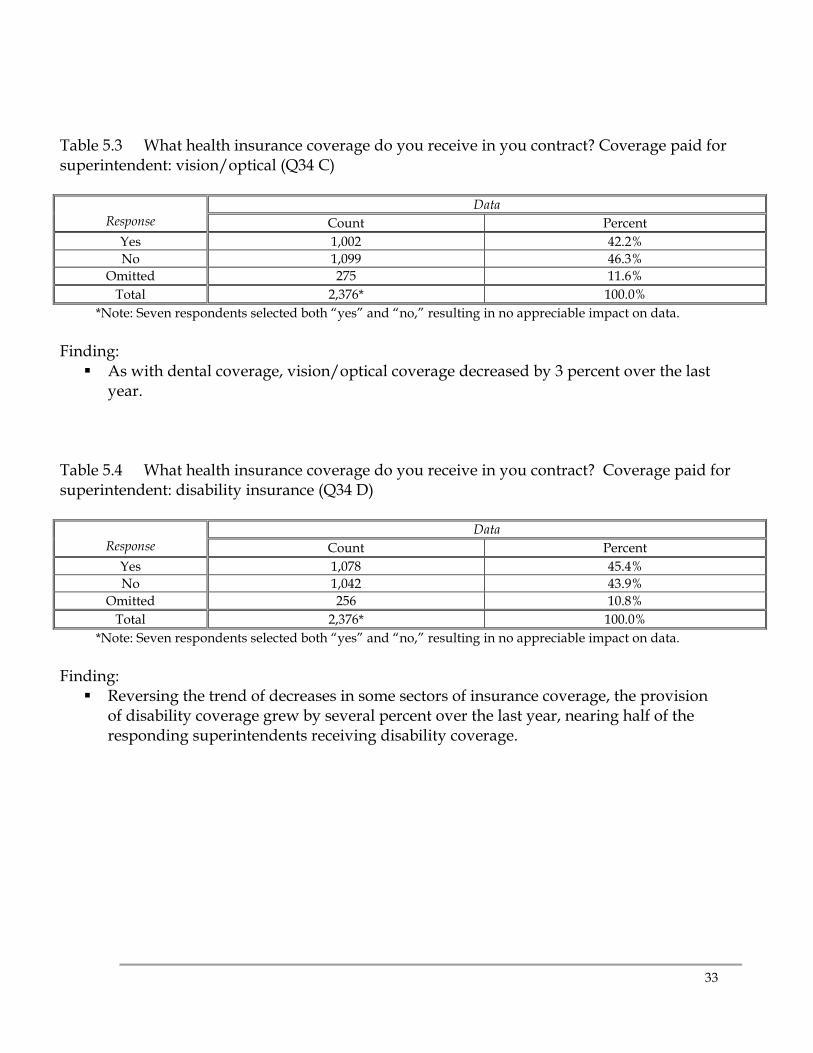
Table 5.3 What health insurance coverage do you receive in you contract? Coverage paid for superintendent: vision/optical (Q34 C)
Response Data
Count Percent Yes 1,002 42.2% No 1,099 46.3%
Omitted 275 11.6% Total 2,376* 100.0%
*Note: Seven respondents selected both “yes” and “no,” resulting in no appreciable impact on data. Finding: As with dental coverage, vision/optical coverage decreased by 3 percent over the last
year. Table 5.4 What health insurance coverage do you receive in you contract? Coverage paid for superintendent: disability insurance (Q34 D)
Response Data
Count Percent Yes 1,078 45.4% No 1,042 43.9%
Omitted 256 10.8% Total 2,376* 100.0%
*Note: Seven respondents selected both “yes” and “no,” resulting in no appreciable impact on data. Finding: Reversing the trend of decreases in some sectors of insurance coverage, the provision
of disability coverage grew by several percent over the last year, nearing half of the responding superintendents receiving disability coverage.
34
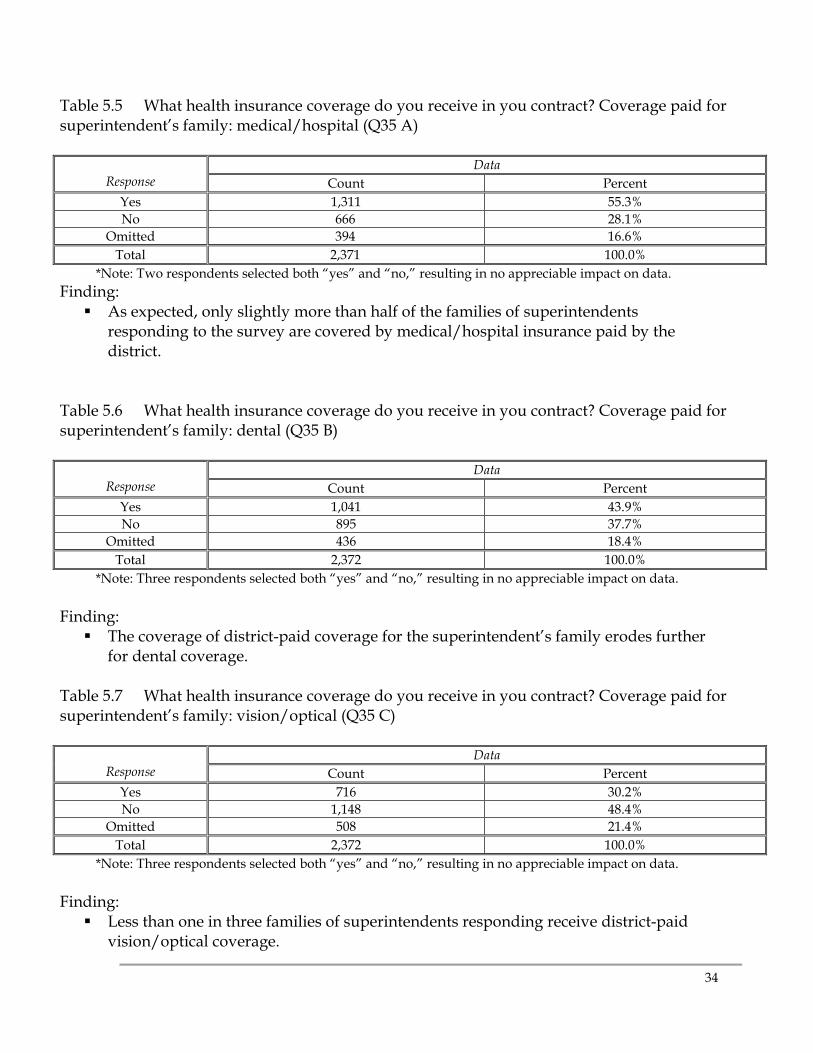
Table 5.5 What health insurance coverage do you receive in you contract? Coverage paid for superintendent’s family: medical/hospital (Q35 A)
Response Data
Count Percent Yes 1,311 55.3% No 666 28.1%
Omitted 394 16.6% Total 2,371 100.0%
*Note: Two respondents selected both “yes” and “no,” resulting in no appreciable impact on data. Finding: As expected, only slightly more than half of the families of superintendents
responding to the survey are covered by medical/hospital insurance paid by the district.
Table 5.6 What health insurance coverage do you receive in you contract? Coverage paid for superintendent’s family: dental (Q35 B)
Response Data
Count Percent Yes 1,041 43.9% No 895 37.7%
Omitted 436 18.4% Total 2,372 100.0%
*Note: Three respondents selected both “yes” and “no,” resulting in no appreciable impact on data. Finding: The coverage of district-paid coverage for the superintendent’s family erodes further
for dental coverage. Table 5.7 What health insurance coverage do you receive in you contract? Coverage paid for superintendent’s family: vision/optical (Q35 C)
Response Data
Count Percent Yes 716 30.2% No 1,148 48.4%
Omitted 508 21.4% Total 2,372 100.0%
*Note: Three respondents selected both “yes” and “no,” resulting in no appreciable impact on data. Finding: Less than one in three families of superintendents responding receive district-paid
vision/optical coverage.
35
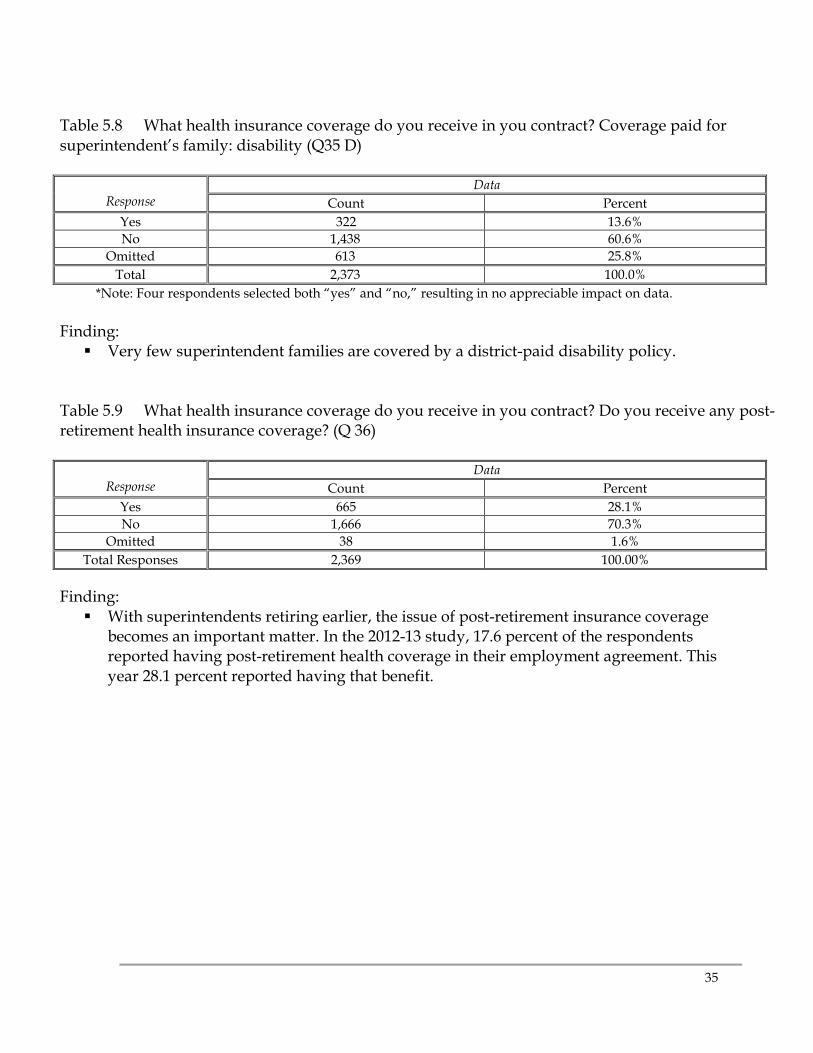
Table 5.8 What health insurance coverage do you receive in you contract? Coverage paid for superintendent’s family: disability (Q35 D)
Response Data
Count Percent Yes 322 13.6% No 1,438 60.6%
Omitted 613 25.8% Total 2,373 100.0%
*Note: Four respondents selected both “yes” and “no,” resulting in no appreciable impact on data. Finding: Very few superintendent families are covered by a district-paid disability policy.
Table 5.9 What health insurance coverage do you receive in you contract? Do you receive any post-retirement health insurance coverage? (Q 36)
Response Data
Count Percent Yes 665 28.1% No 1,666 70.3%
Omitted 38 1.6% Total Responses 2,369 100.00%
Finding: With superintendents retiring earlier, the issue of post-retirement insurance coverage
becomes an important matter. In the 2012-13 study, 17.6 percent of the respondents reported having post-retirement health coverage in their employment agreement. This year 28.1 percent reported having that benefit.
36
SECTION #6: HIRE/REHIRE
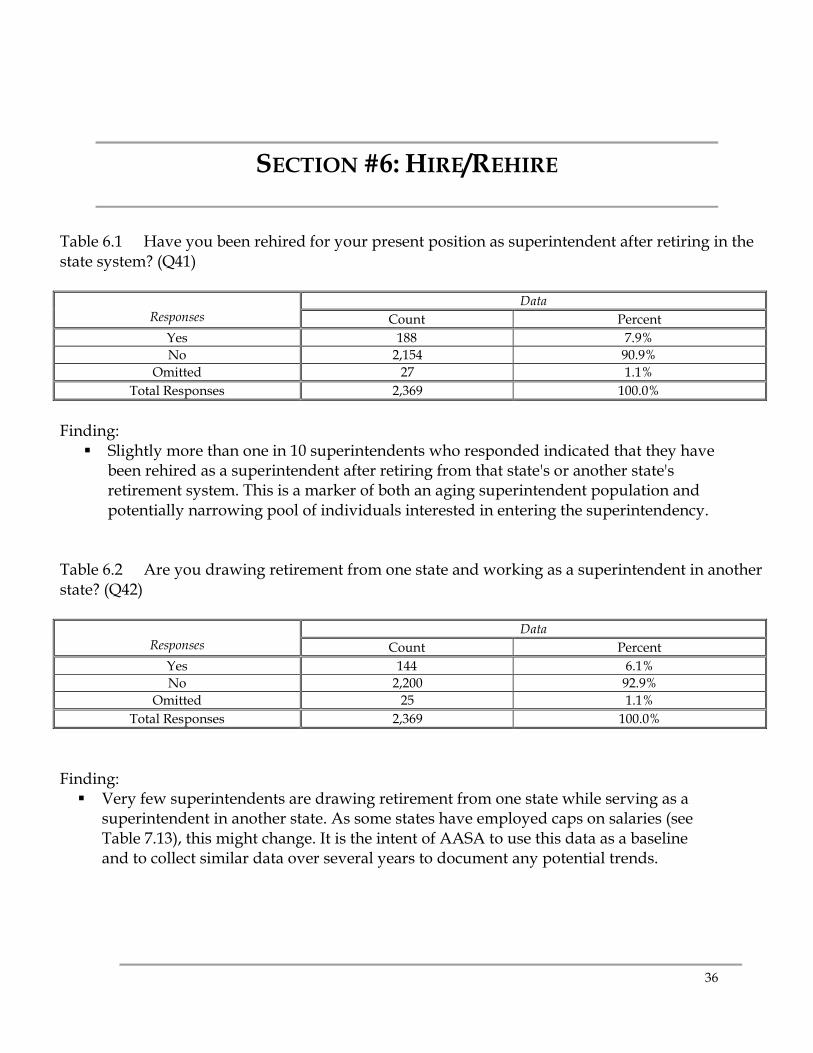
Table 6.1 Have you been rehired for your present position as superintendent after retiring in the state system? (Q41)
Responses Data
Count Percent Yes 188 7.9% No 2,154 90.9%
Omitted 27 1.1% Total Responses 2,369 100.0%
Finding: Slightly more than one in 10 superintendents who responded indicated that they have
been rehired as a superintendent after retiring from that state's or another state's retirement system. This is a marker of both an aging superintendent population and potentially narrowing pool of individuals interested in entering the superintendency.
Table 6.2 Are you drawing retirement from one state and working as a superintendent in another state? (Q42)
Responses
Data Count Percent
Yes 144 6.1% No 2,200 92.9%
Omitted 25 1.1% Total Responses 2,369 100.0%
Finding: Very few superintendents are drawing retirement from one state while serving as a
superintendent in another state. As some states have employed caps on salaries (see Table 7.13), this might change. It is the intent of AASA to use this data as a baseline and to collect similar data over several years to document any potential trends.
37
SECTION #7: MISCELLANEOUS BENEFITS
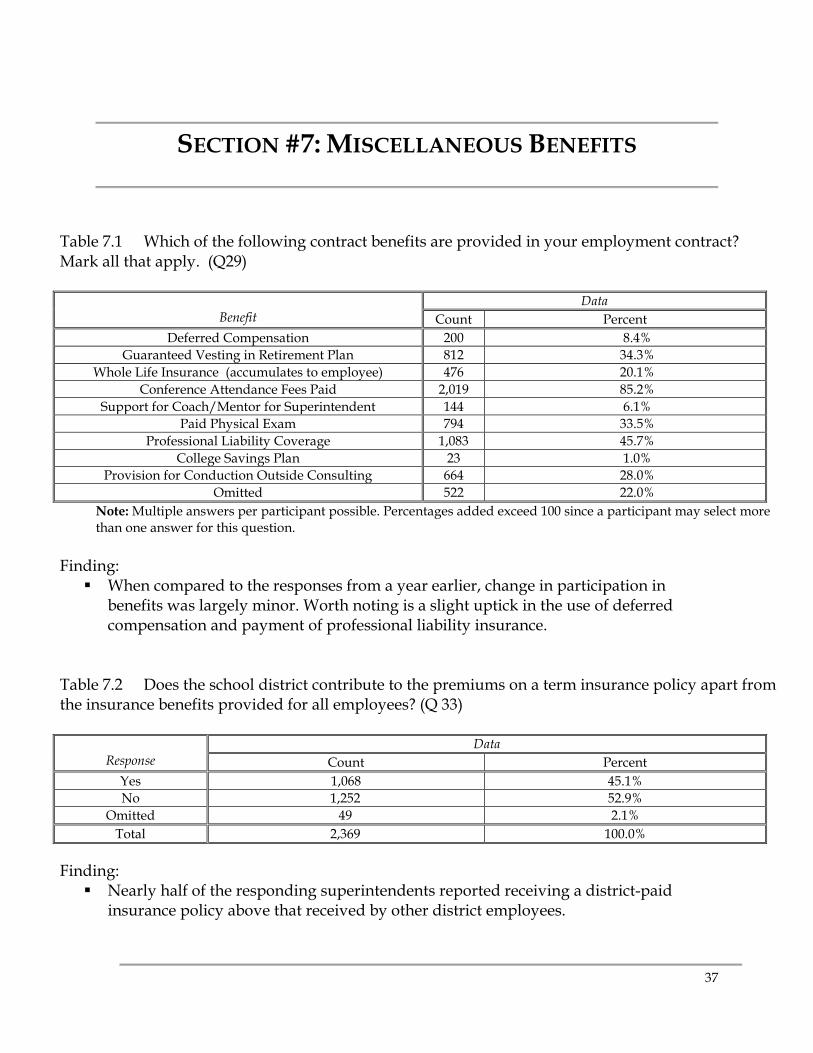
Table 7.1 Which of the following contract benefits are provided in your employment contract? Mark all that apply. (Q29)
Benefit Data
Count Percent Deferred Compensation 200 8.4%
Guaranteed Vesting in Retirement Plan 812 34.3% Whole Life Insurance (accumulates to employee) 476 20.1%
Conference Attendance Fees Paid 2,019 85.2% Support for Coach/Mentor for Superintendent 144 6.1%
Paid Physical Exam 794 33.5% Professional Liability Coverage 1,083 45.7%
College Savings Plan 23 1.0% Provision for Conduction Outside Consulting 664 28.0%
Omitted 522 22.0% Note: Multiple answers per participant possible. Percentages added exceed 100 since a participant may select more than one answer for this question.
Finding: When compared to the responses from a year earlier, change in participation in
benefits was largely minor. Worth noting is a slight uptick in the use of deferred compensation and payment of professional liability insurance.
Table 7.2 Does the school district contribute to the premiums on a term insurance policy apart from the insurance benefits provided for all employees? (Q 33)
Response Data
Count Percent Yes 1,068 45.1% No 1,252 52.9%
Omitted 49 2.1% Total 2,369 100.0%
Finding: Nearly half of the responding superintendents reported receiving a district-paid
insurance policy above that received by other district employees.
38
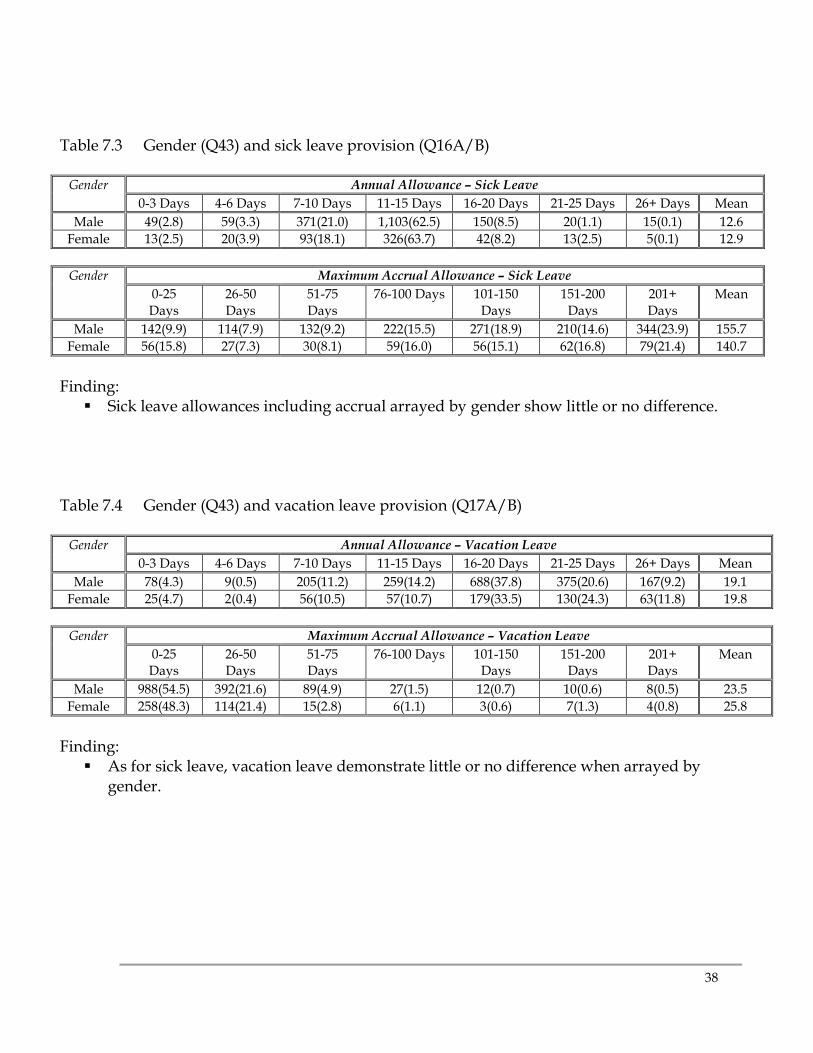
Table 7.3 Gender (Q43) and sick leave provision (Q16A/B)
Gender Annual Allowance – Sick Leave 0-3 Days 4-6 Days 7-10 Days 11-15 Days 16-20 Days 21-25 Days 26+ Days Mean
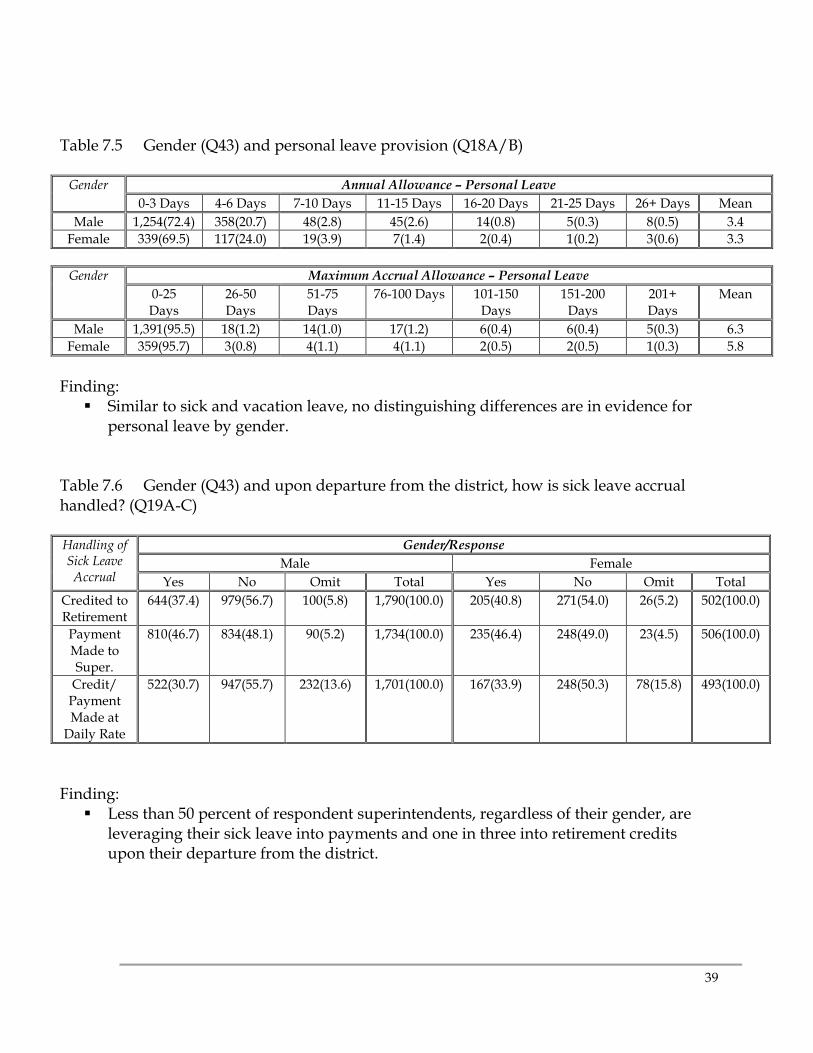
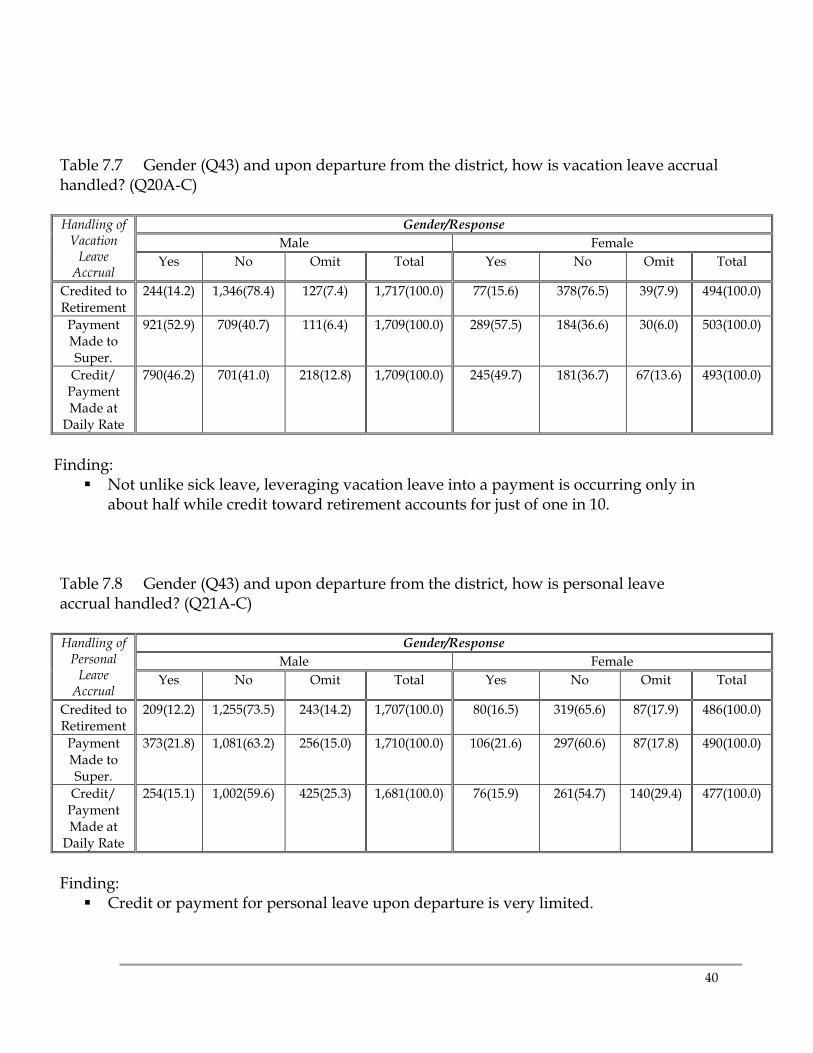
Not unlike sick leave, leveraging vacation leave into a payment is occurring only in about half while credit toward retirement accounts for just of one in 10.
Table 7.8 Gender (Q43) and upon departure from the district, how is personal leave accrual handled? (Q21A-C)
Finding: Credit or payment for personal leave upon departure is very limited.
41
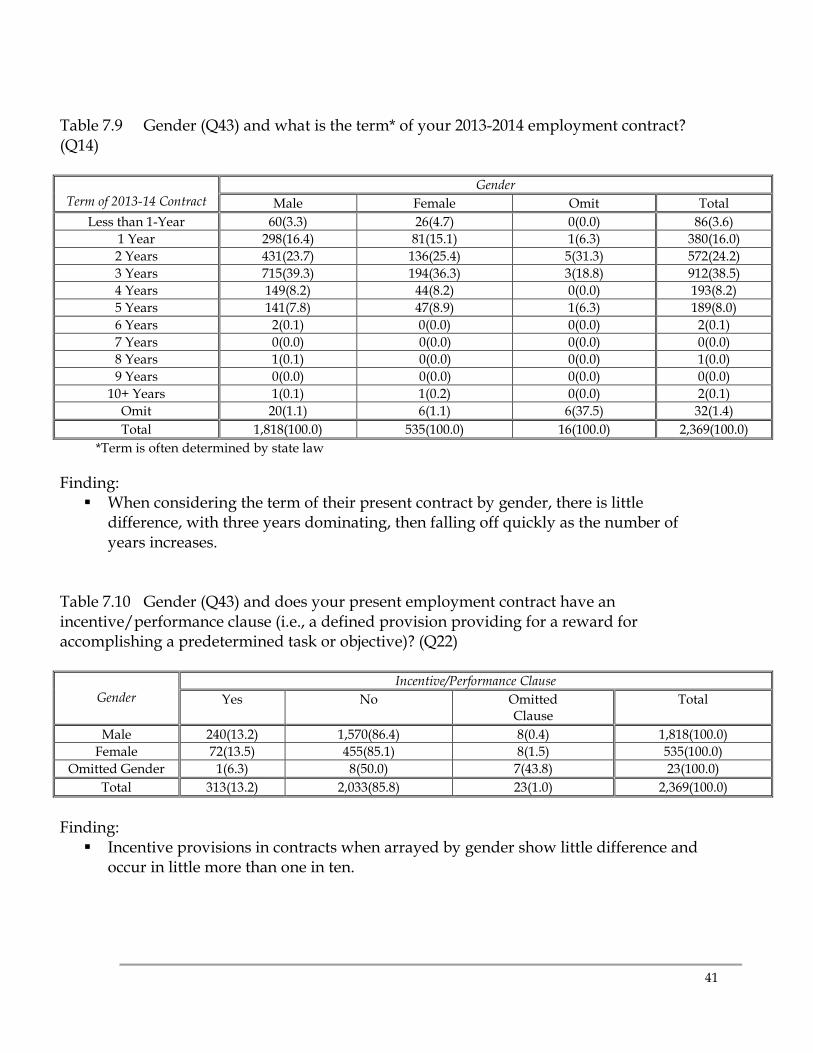
Table 7.9 Gender (Q43) and what is the term* of your 2013-2014 employment contract? (Q14)
Term of 2013-14 Contract
Gender Male Female Omit Total
Less than 1-Year 60(3.3) 26(4.7) 0(0.0) 86(3.6) 1 Year 298(16.4) 81(15.1) 1(6.3) 380(16.0) 2 Years 431(23.7) 136(25.4) 5(31.3) 572(24.2) 3 Years 715(39.3) 194(36.3) 3(18.8) 912(38.5) 4 Years 149(8.2) 44(8.2) 0(0.0) 193(8.2) 5 Years 141(7.8) 47(8.9) 1(6.3) 189(8.0) 6 Years 2(0.1) 0(0.0) 0(0.0) 2(0.1) 7 Years 0(0.0) 0(0.0) 0(0.0) 0(0.0) 8 Years 1(0.1) 0(0.0) 0(0.0) 1(0.0) 9 Years 0(0.0) 0(0.0) 0(0.0) 0(0.0)
10+ Years 1(0.1) 1(0.2) 0(0.0) 2(0.1) Omit 20(1.1) 6(1.1) 6(37.5) 32(1.4) Total 1,818(100.0) 535(100.0) 16(100.0) 2,369(100.0)
*Term is often determined by state law
Finding: When considering the term of their present contract by gender, there is little
difference, with three years dominating, then falling off quickly as the number of years increases.
Table 7.10 Gender (Q43) and does your present employment contract have an incentive/performance clause (i.e., a defined provision providing for a reward for accomplishing a predetermined task or objective)? (Q22)
Gender
Incentive/Performance Clause Yes No Omitted
Clause Total
Male 240(13.2) 1,570(86.4) 8(0.4) 1,818(100.0) Female 72(13.5) 455(85.1) 8(1.5) 535(100.0)
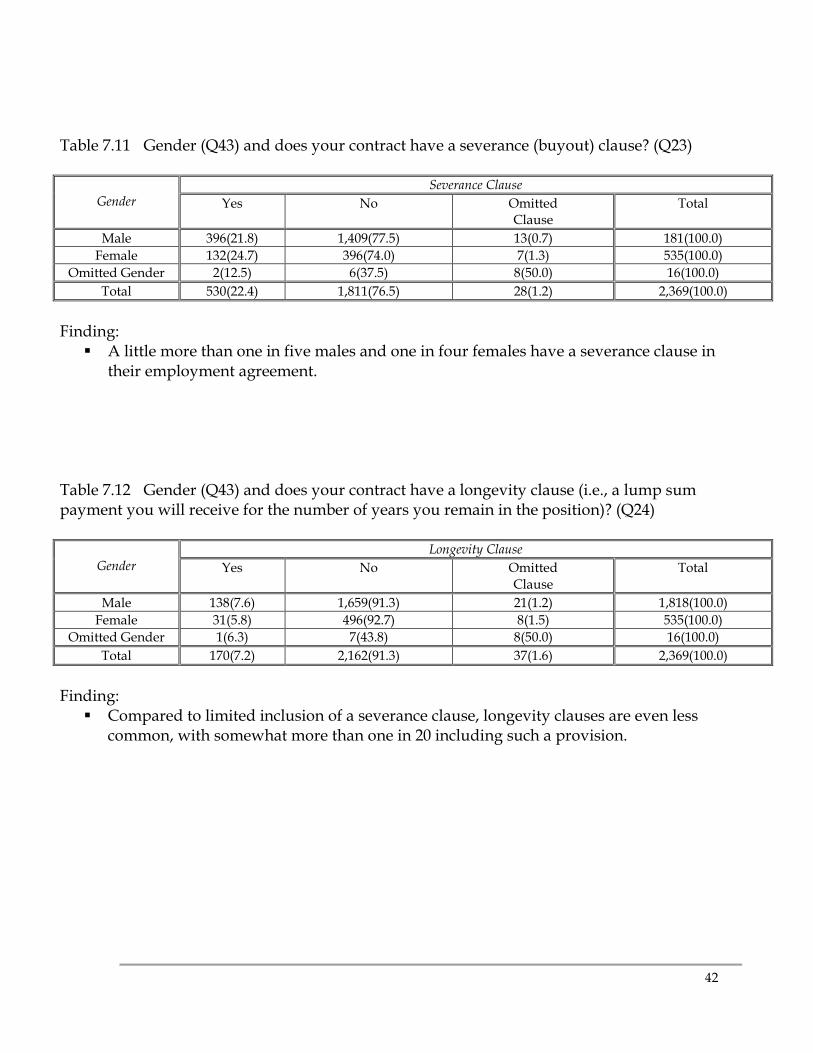
Finding: A little more than one in five males and one in four females have a severance clause in
their employment agreement. Table 7.12 Gender (Q43) and does your contract have a longevity clause (i.e., a lump sum payment you will receive for the number of years you remain in the position)? (Q24)
Gender
Longevity Clause Yes No Omitted
Clause Total
Male 138(7.6) 1,659(91.3) 21(1.2) 1,818(100.0) Female 31(5.8) 496(92.7) 8(1.5) 535(100.0)
Term 0(0.0) 0(0.0) 1(2.3) 0(0.0) 0(0.0) 24(1.1) 1(4.6) 6(26.1) 32(1.4)
Total 28(100.0) 4(100.0) 43(100.0) 35(100.0) 2(100.0) 2,212(100.0) 22(100.0) 23(100.0) 2,369(100.0) *Term is often determined by state law
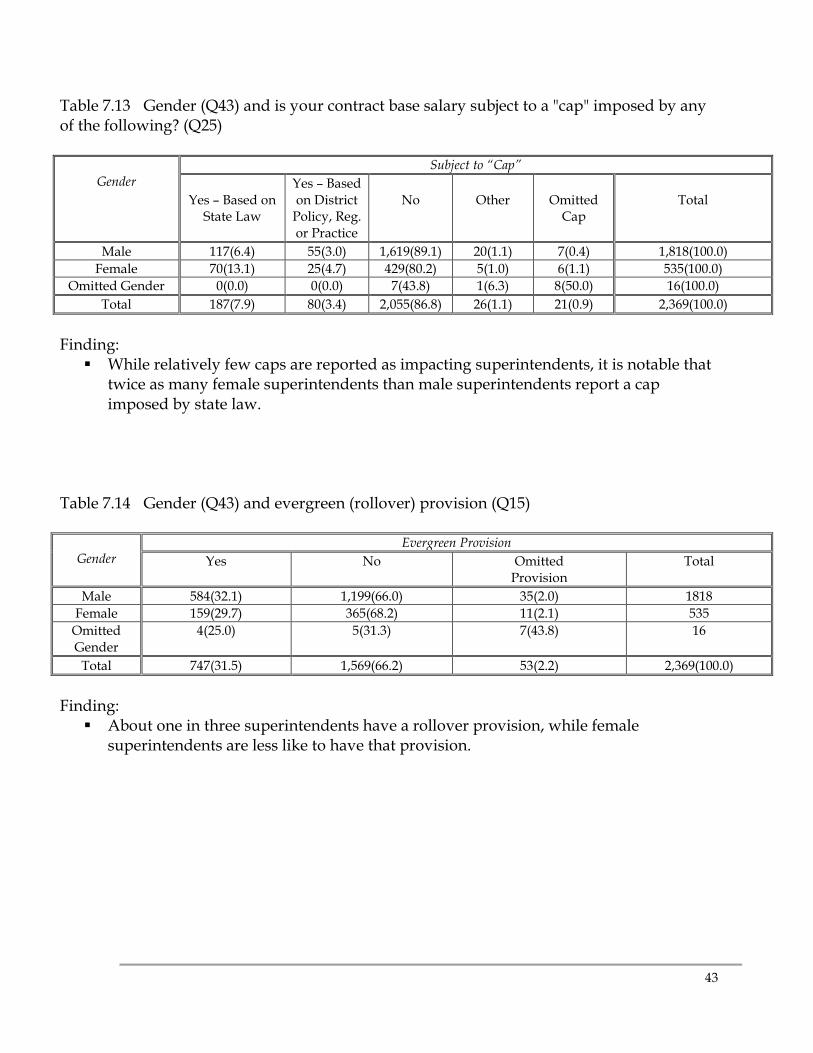
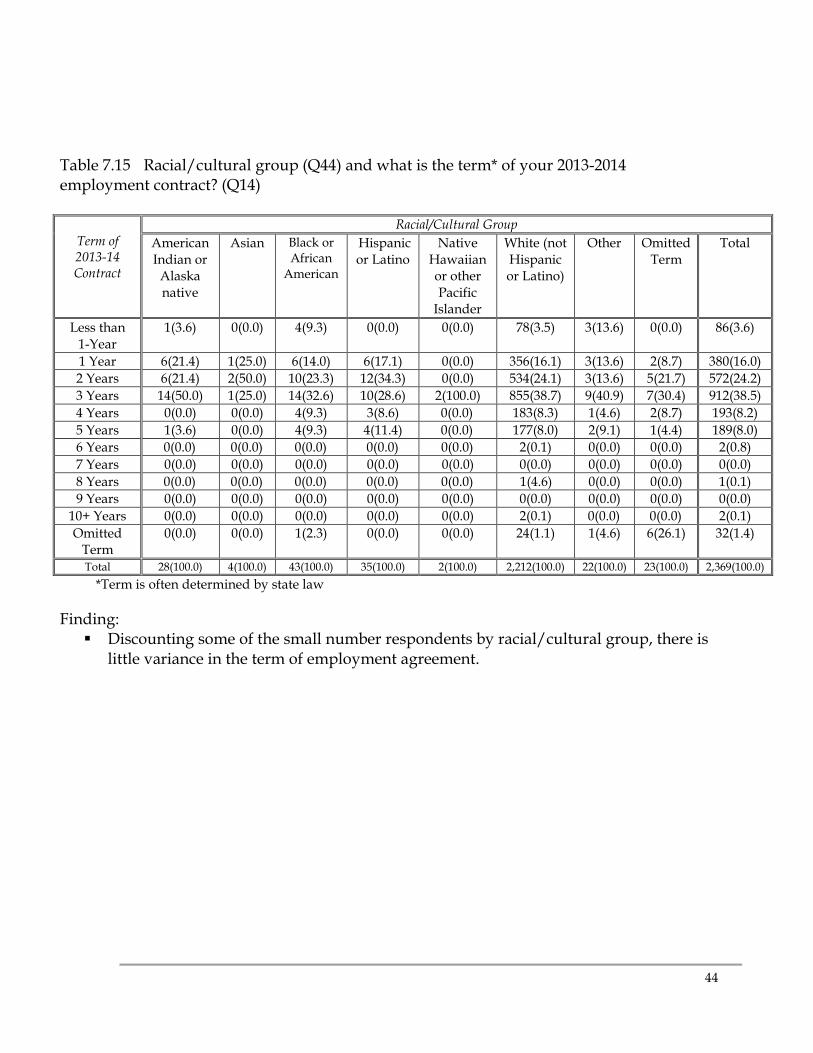
Finding: Discounting some of the small number respondents by racial/cultural group, there is
little variance in the term of employment agreement.
45
Table 7.16 Racial/cultural group (Q44) and does your present employment contract have an incentive/performance clause (i.e., a defined provision providing for a reward for accomplishing a predetermined task or objective)? (Q22)
Finding: Consistent with similar disaggregation of the data, the presence of
incentive/performance clauses appear not to favor any racial/cultural group. Table 7.17 Racial/cultural group (Q44) and does your contract have a severance (buyout) clause? (Q23)
Total 28(100.0) 4(100.0) 43(100.0) 35(100.0) 2(100.0) 2,212(100.0) 22(100.0) 23(100.0) 2,369(100.0)
Finding: Where a sufficient number of respondents exists, about a quarter of superintendent
respondents in each racial/cultural group had a severance provision.
46
Table 7.18 Racial/cultural group (Q44) and does your contract have a longevity clause (i.e., a lump sum payment you will receive for the number of years you remain in the position)? (Q24)
Total 28(100.0) 4(100.0) 43(100.0) 35(100.0) 2(100.0) 2,212(100.0) 22(100.0) 23(100.0) 2,369(100.0)
Finding: Caps on salary do not favor any racial/cultural group.
47
Table 7.20 Racial/cultural group (Q44) and evergreen (rollover) provision (Q15)
Racial/ Cultural
Group Evergreen Provision
Yes No Omit Total American Indian or
Alaska Native 8(28.6) 20(71.4) 0(0.0) 28
Asian
3(75.0) 1(25.0) 0(0.0) 4
Black or African American
5(11.6) 35(81.4) 3(7.0) 43
Hispanic or Latino 8(22.8) 27(77.1) 0(0.0) 25 Native Hawaiian or
Pacific Islander 1(50.0) 1(50.0) 0(0.0) 2
White (not Hispanic)
711(32.8) 1,460(66.0) 41(1.9) 2,212
Other
7(31.8) 13(59.1) 2(9.1) 22
Omitted Racial/
Cultural Group
4(17.4) 12(52.2) 7(30.4) 23
Total
747(31.5) 1,569(66.2) 53(2.2) 2,369(100.0)
Finding: Where sufficient number of respondent superintendents exist, the presence of an
evergreen provision occurred in less than one in three contracts, when arrayed by racial/cultural group.
Table 7.21 Does the governing body provide you with a district-owned vehicle? (Q37)
Responses Data
Count Percent Yes 318 13.4% No 2,022 85.4%
Omitted Response 29 1.2% Total 2,369 100.0%
Finding: There was a slight increase from last year in the percent of superintendents receiving
the benefit of a district-owned vehicle, with slightly over one in 10 enjoying that benefit.
48
SECTION #8: USE OF LEGAL COUNSEL
Table 8.1 Did the school district use legal counsel to assist in the development and/or negotiations of your contract? (Q40)
Responses Data
Count Percent Yes 1,275 53.8% No 1,074 45.3%
Omitted Response 20 0.8% Total 2,369 100.00%
Finding: Slightly more than half of the respondent superintendents indicated that the district
used a legal counsel to negotiate the superintendent’s employment agreement. Table 8.2 Did you employ legal counsel to assist in the development and/or negotiations of your contract? (Q39)
Responses Data
Count Percent Yes 575 24.3% No 1,773 74.8%
Omitted Response 21 0.9% Total 2,369 100.0%
Finding: In contrast to the use of legal counsel by the district, only about a quarter of
respondent superintendents use the services of legal counsel to negotiate their own employment agreement.
49
SECTION #9: MEMBERSHIPS
Table 9.1 Which of your professional association membership dues are paid by the school district? (Q38)
Responses Data*
Count Percent Business (e.g., Chamber of Commerce) 924 39.0%
Civic (e.g., Rotary) 808 34.1% Regional Professional Organizations
(e.g., state association) 2,193 92.6% National Professional Organizations (e.g., American Association of School
Total 5,724 241.7% *Multiple answers per participant possible. Percentages added may exceed 100 since a participant may select more than one answer for this question.
Finding: Overwhelmingly districts support the professional membership for the
superintendent.
50
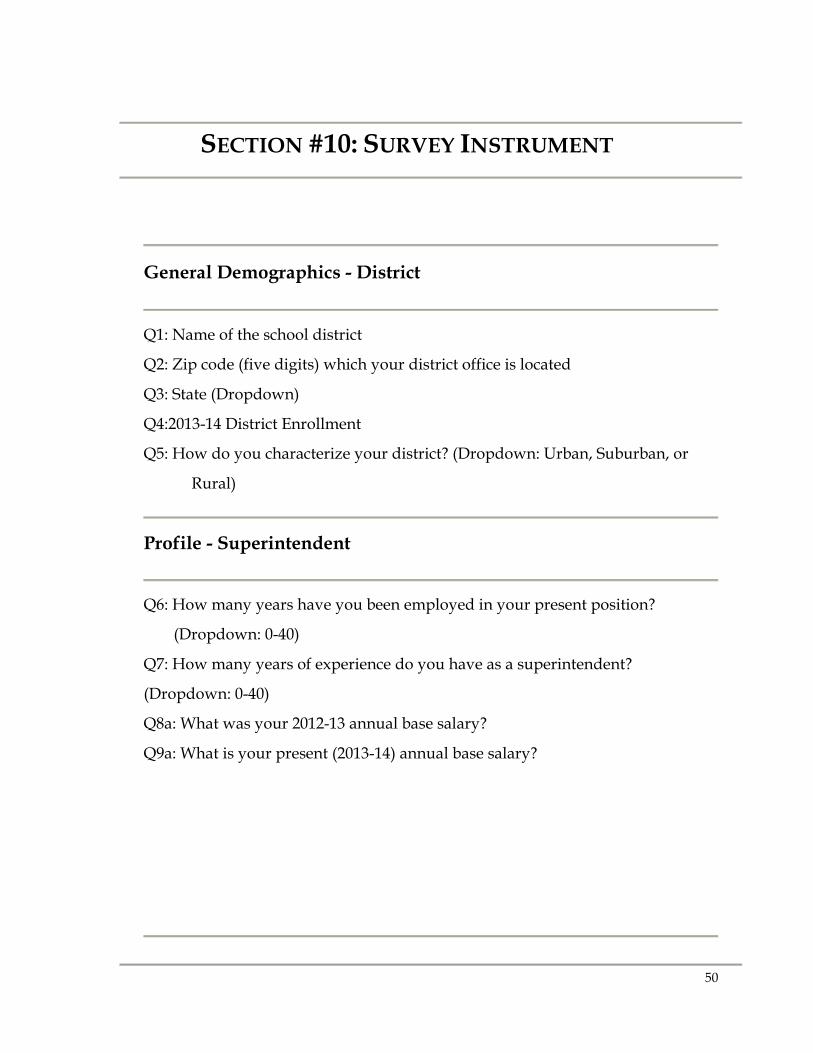
SECTION #10: SURVEY INSTRUMENT
General Demographics - District
Q1: Name of the school district
Q2: Zip code (five digits) which your district office is located
Q3: State (Dropdown)
Q4:2013-14 District Enrollment
Q5: How do you characterize your district? (Dropdown: Urban, Suburban, or
Rural)
Profile - Superintendent
Q6: How many years have you been employed in your present position?
(Dropdown: 0-40)
Q7: How many years of experience do you have as a superintendent?
(Dropdown: 0-40)
Q8a: What was your 2012-13 annual base salary?
Q9a: What is your present (2013-14) annual base salary?
51
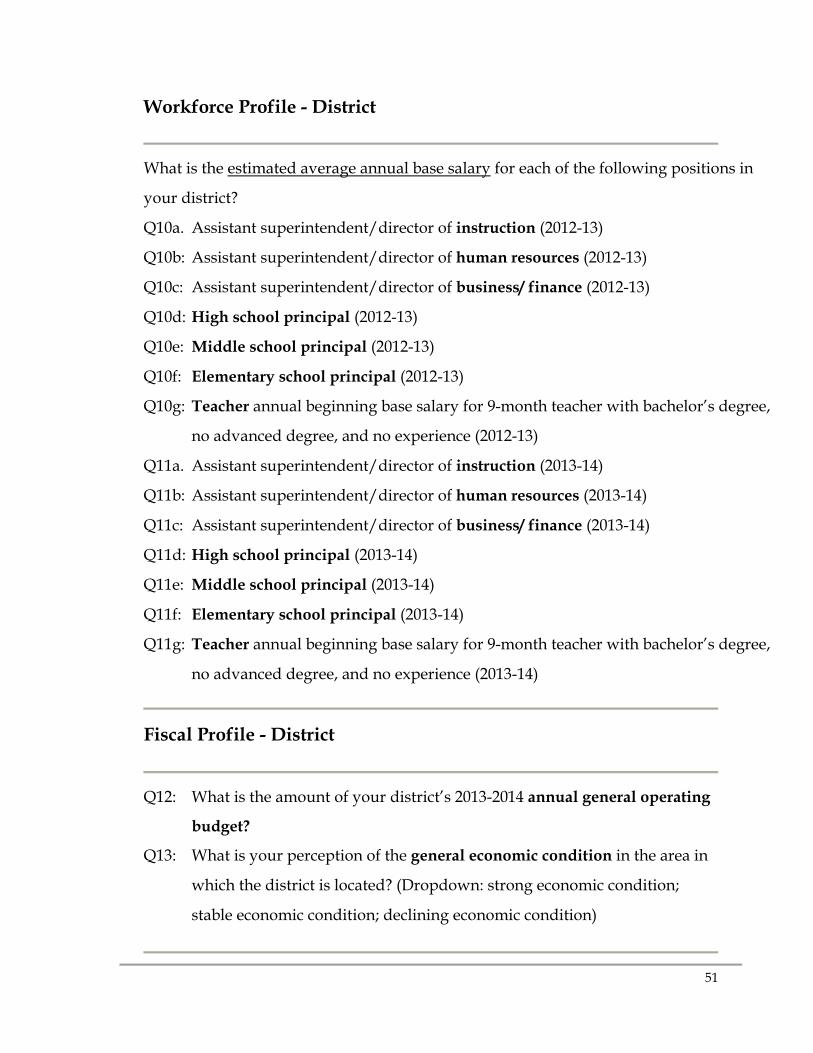
Workforce Profile - District
What is the estimated average annual base salary for each of the following positions in
your district?
Q10a. Assistant superintendent/director of instruction (2012-13)
Q10b: Assistant superintendent/director of human resources (2012-13)
Q10c: Assistant superintendent/director of business/ finance (2012-13)
Q10d: High school principal (2012-13)
Q10e: Middle school principal (2012-13)
Q10f: Elementary school principal (2012-13)
Q10g: Teacher annual beginning base salary for 9-month teacher with bachelor’s degree,
no advanced degree, and no experience (2012-13)
Q11a. Assistant superintendent/director of instruction (2013-14)
Q11b: Assistant superintendent/director of human resources (2013-14)
Q11c: Assistant superintendent/director of business/ finance (2013-14)
Q11d: High school principal (2013-14)
Q11e: Middle school principal (2013-14)
Q11f: Elementary school principal (2013-14)
Q11g: Teacher annual beginning base salary for 9-month teacher with bachelor’s degree,
no advanced degree, and no experience (2013-14)
Fiscal Profile - District
Q12: What is the amount of your district’s 2013-2014 annual general operating
budget?
Q13: What is your perception of the general economic condition in the area in
which the district is located? (Dropdown: strong economic condition;