20
2013 UPDATE Spokane Valley-Rathdrum Prairie Aquifer Water Demand Forecast Update Rob Lindsay Water Resources Manager Spokane County Utilities Spokane River Forum Conference March 27, 2013
| Date post: | 24-Dec-2015 |
| Category: |
Documents |
| Upload: | eric-woods |
| View: | 219 times |
| Download: | 5 times |

2013 UPDATE
Spokane Valley-Rathdrum Prairie AquiferWater Demand Forecast Update
Rob LindsayWater Resources Manager
Spokane County Utilities
Spokane River Forum ConferenceMarch 27, 2013

Spokane Valley-Rathdrum Prairie AquiferWater Demand Forecasts
Presented by:
Mike HermansonWater Resources Specialist
Spokane County Utilities
Spokane River Forum ConferenceMay 23, 2011
Presentation Overview
• Review Spokane County Water Demand Model (2010) and 2012 Updates
• Idaho Future Demand Study• Summary

History
• 2010– Idaho Future Demand Study Draft Results
presentation– Spokane County Water Demand Model presentation
of project goals, objectives, concepts. • 2011
– Spokane County presented results of Water Demand Model, compared two studies
• 2013– Spokane County performed updates to the Water
Demand Model
Background
• Project funded by Washington Dept. of Ecology
• A county-wide, multi-WRIA project• Performed by CDM, supported by
local advisory committee

Background• Evaluations based on:
– Use Sectors (public supply, agricultural, industrial, self supply)
– Geographic Location (SRTC, TAZ)– Population (current census, STRC forecasts)– Variable Weather – Variable Conservation Scenarios– Time
Spokane County Water Demand Model
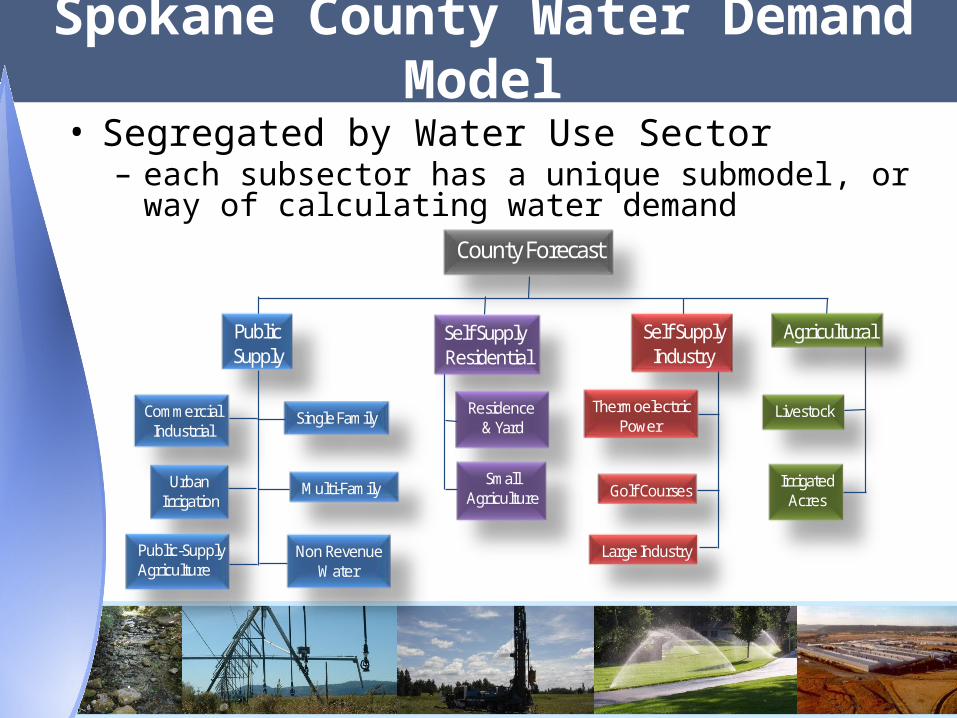
County Forecast
PublicSupply
Self Supply Residential
Self SupplyIndustry
Agricultural
CommercialIndustrial
UrbanIrrigation
Public-SupplyAgriculture
Single Family
Multi-Family
Non RevenueWater
Residence& Yard
SmallAgriculture
ThermoelectricPower
Golf Courses
Large Industry
Livestock
IrrigatedAcres
• Segregated by Water Use Sector– each subsector has a unique submodel, or way of calculating
water demand

Spokane County Water Demand Model
Total daily water use per single family
residence
Indoor water use
Outdoor water use
Indoor consumptive
use
Indoor non-consumptive
use
Onsite septic
Sanitary sewer
Water use per ft2 of irrigated
landscape
Outdoor consumptive
use
Outdoor non-consumptive
use
% Consumptive area of irrigated landscape
ET RateReturn Flow
• UPDATE - Residential Consumptive/Non Consumptive Segregation

Spokane County Water Demand Model 2010
– 2000 census– 2008 SRTC forecast– 487 separate forecast
units ( aka TAZ; transportation analysis zone)
2012– 2010 census– 2010 SRTC forecast– +/- 500 TAZs
A unique water demand calculation is done for each forecast unit
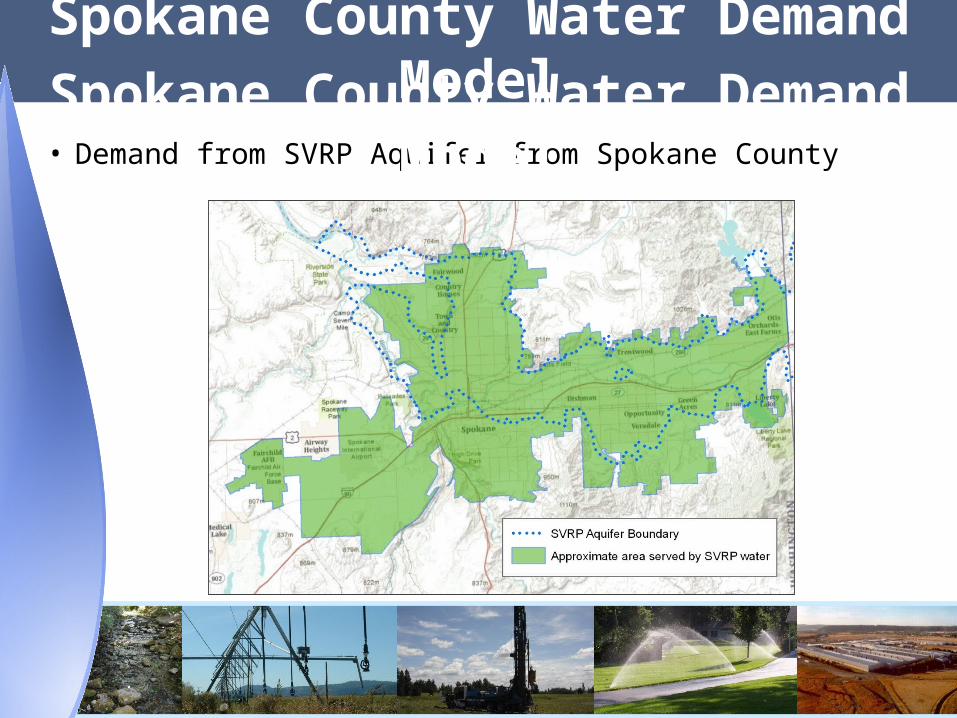
• Demand from SVRP Aquifer from Spokane CountySpokane County Water Demand ModelSpokane County Water Demand Model

Sector Modeled Reported RPD
Total Production 41,895 41,530 0.88 %
Single Family Residential 15,920 15,617 1.92%
Multi Family Residential 3,996 4,102 -2.62%
Total Residential 19,916 19,719 0.99%
Commercial/Industrial 9,528 9,798 -2.79%
Total Non Residential 10,758 10,118 6.13%
Non Revenue 3,433 3,500 -1.92%
Annual Public Water System Use: Modeled vs. Reported
Reported in millions of gallons per year
Spokane County Water Demand Model
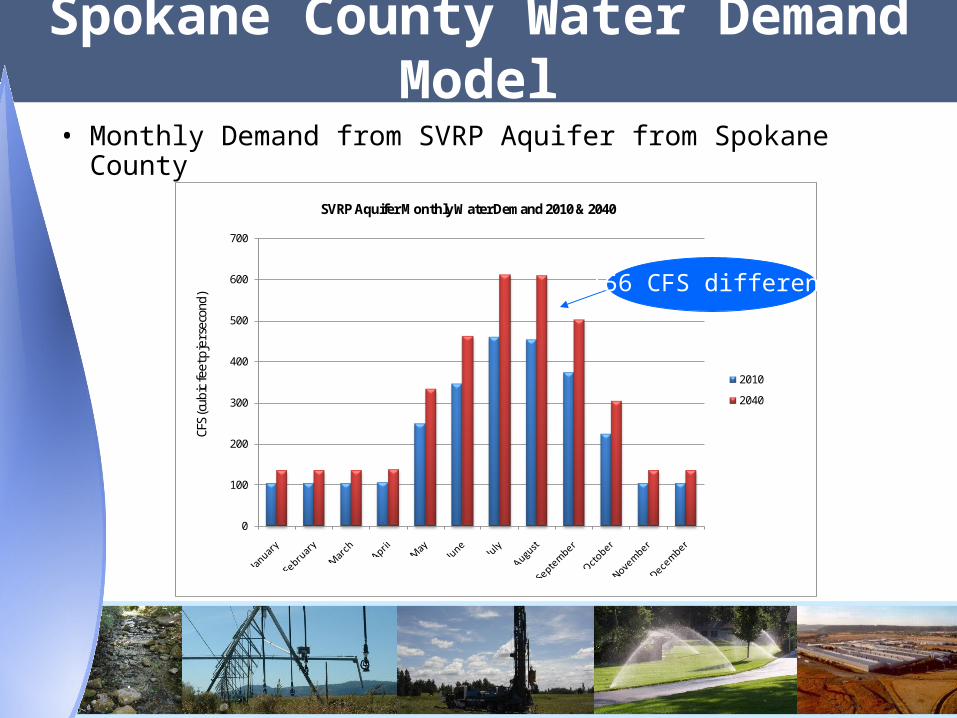
• Monthly Demand from SVRP Aquifer from Spokane County
0
100
200
300
400
500
600
700
2010
2040
CFS(
cubi
c fee
t pje
r sec
ond)
SVRP Aquifer Monthly Water Demand 2010 & 2040
156 CFS difference
Spokane County Water Demand Model

Spokane County Water Demand Model
Year 2008 SRTC Forecast 2010 SRTC Forecast
2010 162,661 157,330
2020 179,812 174,074
2030 199,472 195,845
2040 219,132 207,270
• UPDATE - Comparison of 2008 & 2010 SRTC Forecast of Single Family Dwelling Units

• Conservation and Weather– Conservation efforts can be
masked by changes in weather
Spokane County Water Demand Model
-
5
10
15
20
25
30
35
40
2010 2015 2020 2025 2030 2035 2040
2005 weather
2006 weather 5% conservation
20 year average weather
2006 weatherBillio
ns o
f Gal
lons
per
year
Forecast Year
Comparison of Conservation and Weather on Water Demand
-
5
10
15
20
25
30
35
40
2010 2015 2020 2025 2030 2035 2040
2005 weather
2006 weather 5% conservation
20 year average weather
2006 weatherBillio
ns o
f Gal
lons
per
year
Forecast Year
Comparison of Conservation and Weather on Water Demand
no conservation
no conservation
no conservation

Idaho Future Demand Study• Includes an estimate of current and future use by water use
sector on an annual basis:– Public Water Systems– Self Supplied Domestic– Self Supplied Commercial & Industrial– Agriculture
• Separates Irrigation and Non-Irrigation Use

• Evaluates consumptive vs. non consumptive use
• Range of population & employment growth scenarios
• Detailed analysis of conservation scenarios• Evaluation of potential climate change impacts
Idaho Future Demand Study

• Aquifer Total Demand to 2040– Washington +/- 33 %; Idaho +/- 40%
WA & ID Demand
-
20
40
60
80
100
120
2010 2015 2020 2025 2030 2035 2040
Idaho Demand
Washington Demand
SVRP Aquifer Total Annual Water Demand Projections
Idaho scenario – medium growth & no conservation
Updated Model Applications• Model Applications
– Support local agencies in regional planning/forecasts– Recent updates now support analyses to asses impacts
of inter-basin water transfers, including SVRP to Latah Creek, west plains and the Little Spokane River
– Updates will support and inform the proposed hydrogeologic model development in the Little Spokane River basin
– Evaluates scenarios to assess potential impacts from climate change

Spokane County Water Demand Model
Thank You
Questions?

• Impact of weather on water use
300
400
500
600
700
800
90019
98
1999
2000
2001
2002
2003
2004
2005
2006
2007
2008
Ann
ual A
vera
ge G
PD
SCWD#3 WSA 2
Actual
Modeled
300
400
500
600
700
800
900
2002
2003
2004
2005
2006
2007
2008
2009
Ann
ual A
vera
ge G
PD
City of Spokane
Actual
Modeled
300
400
500
600
700
800
900
1998
1999
2000
2001
2002
2003
2004
2005
2006
2007
2008
Ann
ual A
vera
ge G
PD
SCWD#3 WSA 3
Actual
Modeled
300
400
500
600
700
800
900
1991
1992
1993
1994
1995
1996
1997
1998
1999
2000
2001
2002
2003
2004
2005
2006
2007
2008
2009
Ann
ual A
vera
ge G
PD
Whitworth Water District
Actual
Modeled
Spokane County Water Demand Model


