32
Enterprise Legal Management Trends Report 2013 2013 YEAR - END EDITION Growth in M&A Billings Benefits ‘Second Largest’ Law Firms CounselLink ® Powered by:

Enterprise Legal Management Trends Report
2013
2013 YEAR-END EDITION
Growth in M&A Billings Benefits ‘Second Largest’ Law Firms
CounselLink®Powered by:
2 2013 CounselLink Enterprise Legal Management | Trends Report
Enterprise Legal Management Trends ReportPowered by LexisNexis CounselLink – 2013 Year-End EditionDoubling in M&A Billings Benefits Second-Largest Law Firms
Highlights
Exec
utive
Executive HighlightsBased on data pulled from the CounselLink platform.
• Merger & Acquisition billings almost double as a percentage of legal spend in 2013 With modest gains for three of the past four years, M&A billings spiked with a 77% gain in 2013 to reach a level more than double the 2010 and 2011 totals.
• Beneficiaries of increased M&A activity are law firms in the “Second Largest” classification In the CounselLink data, the “Largest 50” firms – those with more than 750 lawyers – have led the field in M&A work since 2010. CounselLink data identified the “Second Largest” group (501-750 lawyers) crossing to the top in 2012 and gaining momentum in 2013. The change is even more dramatic when looking at high-fee M&A work – aggregate M&A transactions that generate outside counsel fees totaling more than $1 million.
• Blended average rates paid on M&A matters drop year-over-year The shift of M&A work to the “Second Largest” law firm group is the dominant cause of the average rate drop. A closer look at associated partner rates for M&A matters rationalizes the shift in work – the largest firms have average rates 18% higher than the new category leaders.
• AFA utilization remains steady 12.4% of matters utilize alternative fee arrangements in whole or part. The percentage is virtually unchanged from the previous 12 month period.
• Average partner rates have modest 0.8% gain to reach $386 per hour This useful trend-spotting metric is representative of multiple law firm sizes, locations, lawyer experience levels and practice areas. For a partner in a U.S. law firm specializing in advice and counseling related to M&A work, the average hourly billing rate continues to occupy the top spot at $589 per hour among 12 practice categories.
• Manufacturing and Finance segments have higher levels of law firm consolidation than others The overall law firm consolidation trend continues. Data examined for the years 2011 through 2013 reflect fewer law firms being used in 70% and 67% of the manufacturing and finance companies respectively.

Introd
uctio
n
Table of Contents
This is the second edition of the Enterprise Legal Management Trends Report, powered by LexisNexis CounselLink. The intent behind this semi-annual review and update of several key metrics is to offer information that corporate counsel and law firms can choose to use to guide their decisions and subsequent actions.
The report presents a snapshot of our analysis of data available via the CounselLink Enterprise Legal Management platform. Currently, the collective stream of data and processed invoices gathered over the past 5 years represents nearly $15 billion in legal spending, more than 3 million invoices, and well over 450,000 matters, with the volume of data available for analysis growing at a rapid pace.
Details about the methodologies used, definitions and expert contributors conducting the analysis are presented at the end of the report. Unless noted otherwise, information is based on the trailing 12 months ending December 31, 2013.
Executive Highlights
Introduction
Market Insights:
The Key Metrics
#1: Blended Hourly Rate for Matters – by Practice Area
#2: Law Firm Consolidation – # Legal Vendors Used by Corporations
#3: Alternative Fee Arrangement (AFA) Usage
#4: Partner Hourly Rate – Overall
#5: Partner Hourly Rate Growth – by Location (City / State)
#6: Partner Hourly Rate Growth – by Practice Area
About the Trends Report
2
3
4
13
14
16
17
19
20
22
24
32013 CounselLink Enterprise Legal Management | Trends Report

4 2013 CounselLink Enterprise Legal Management | Trends Report
Market Insights: M&A Activity Increases – “Second Largest” Law Firms Capture BenefitsCounselLink data reflects a significant jump in Merger & Acquisition billing occurring during 2013. The change is especially noteworthy as year-over-year growth for the previous few years was quite modest. The beneficiaries of this increase in M&A activity are not the “Largest 50” firms (those with more than 750 lawyers) which, among CounselLink customers, have historically been the dominant players in advising on this type of legal work. Instead, general counsel are assigning more M&A matters – including those with total fees in excess of $1 million – to the “Second Largest” group of firms with 501-750 lawyers. With general counsel becoming increasingly savvy in managing outside counsel fees, it is not surprising that many are turning to highly credible firms with lower hourly rates to handle even their most mission critical transactions. CounselLink data shows a significant difference in average U.S. hourly partner rates in the “Largest 50” firms versus other firms. (See Figure 5)
Another cost management strategy employed by many legal departments is consolidation. In addition to shifting work from one tier to another, savings can be gained by reducing the number of law firms handling legal matters. The Market Insights section of this report includes analysis of the types of companies pursuing this strategy and the degree to which consolidation is occurring.

52013 CounselLink Enterprise Legal Management | Trends Report
After only modest increases in Merger & Acquisition billings between 2010 and 2012, there was a large uptick during 2013. M&A billings have more than doubled as a percent of total spend over the past four years (from 0.7% to 1.6% of total billings), with most of the gains occurring over the past year.
Figure 1: Enterprise Legal Management Trends ReportMacro Trend: Billing data shows increased Merger & Acquisition activityBased on rolling 12-month totals ending December 31 for years 2010 to 2013
This chart shows a 4-year trend of Merger & Acquisition (M&A) legal fees billed to CounselLink customers as a percentage of billings for all types of legal work.
Mergers and Acquisitions
1FIG
URE
1.6%
1.4%
1.2%
1.0%
0.8%
0.6%
0.4%
0.2%
0
0.7%0.8%
0.9%
1.6%
2010 2011 2012 2013
+

Historically, the “Largest 50” firms (those with more than 750 lawyers) have dominated the M&A legal market, as evidenced by the 2010 and 2011 data points for that group. However, a changeover occurred in 2012 when the “Second Largest” firms (those with 501-750 lawyers) inched past the “Largest 50” in terms of M&A fees, and noticeably surpassed their share in 2013.
6 2013 CounselLink Enterprise Legal Management | Trends Report
Figure 2: Enterprise Legal Management Trends ReportMacro Trend: “Second Largest” firms gain and grow the greatest share of M&A billingsBased on rolling 12-month totals ending December 31 for years 2010 to 2013
2FIGURE
20112010
60%
50%
40%
30%
20%
10%
0
2012 2013
This chart illustrates all legal fees billed to CounselLink customers on M&A matters over the past four years, aligned with different size law firms. Each line on the graph reflects one of five law firm size groupings and the percent of total billings handled by each group. For example, 37% of all outside counsel spending on these matters last year went to firms with 501-750 lawyers.
Firms < 50 Lawyers
Firms <51-200 Lawyers
Firms 201-500 Lawyers
Firms 500-750 Lawyers
Firms > 750 Lawyers
+
++
+
+
+
+
+++
+
+
+
+
+ +++
+
+
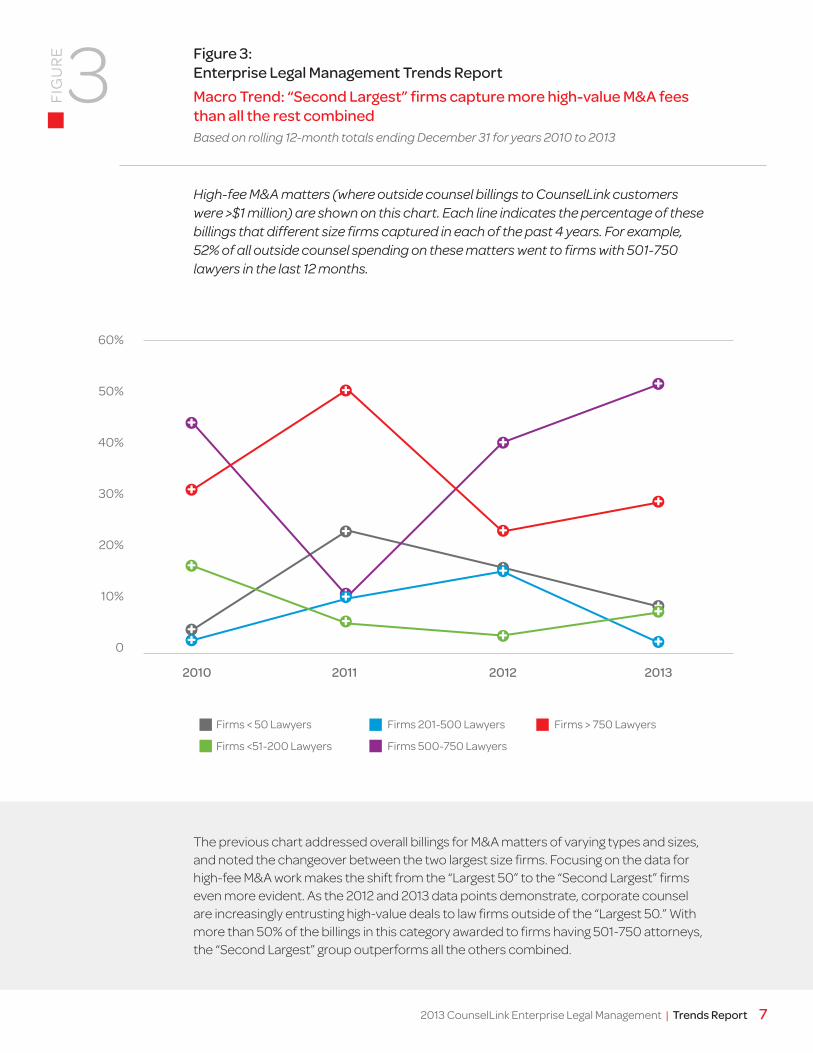
The previous chart addressed overall billings for M&A matters of varying types and sizes, and noted the changeover between the two largest size firms. Focusing on the data for high-fee M&A work makes the shift from the “Largest 50” to the “Second Largest” firms even more evident. As the 2012 and 2013 data points demonstrate, corporate counsel are increasingly entrusting high-value deals to law firms outside of the “Largest 50.” With more than 50% of the billings in this category awarded to firms having 501-750 attorneys, the “Second Largest” group outperforms all the others combined.
72013 CounselLink Enterprise Legal Management | Trends Report
Figure 3: Enterprise Legal Management Trends ReportMacro Trend: “Second Largest” firms capture more high-value M&A fees than all the rest combinedBased on rolling 12-month totals ending December 31 for years 2010 to 2013
3FIGURE
20112010
60%
50%
40%
30%
20%
10%
0
2012 2013
High-fee M&A matters (where outside counsel billings to CounselLink customers were >$1 million) are shown on this chart. Each line indicates the percentage of these billings that different size firms captured in each of the past 4 years. For example, 52% of all outside counsel spending on these matters went to firms with 501-750 lawyers in the last 12 months.
Firms < 50 Lawyers
Firms <51-200 Lawyers
Firms 201-500 Lawyers
Firms 500-750 Lawyers
Firms > 750 Lawyers
+
++
+
+
+
+
+
+
+
+
++
+
+
+++
+
+
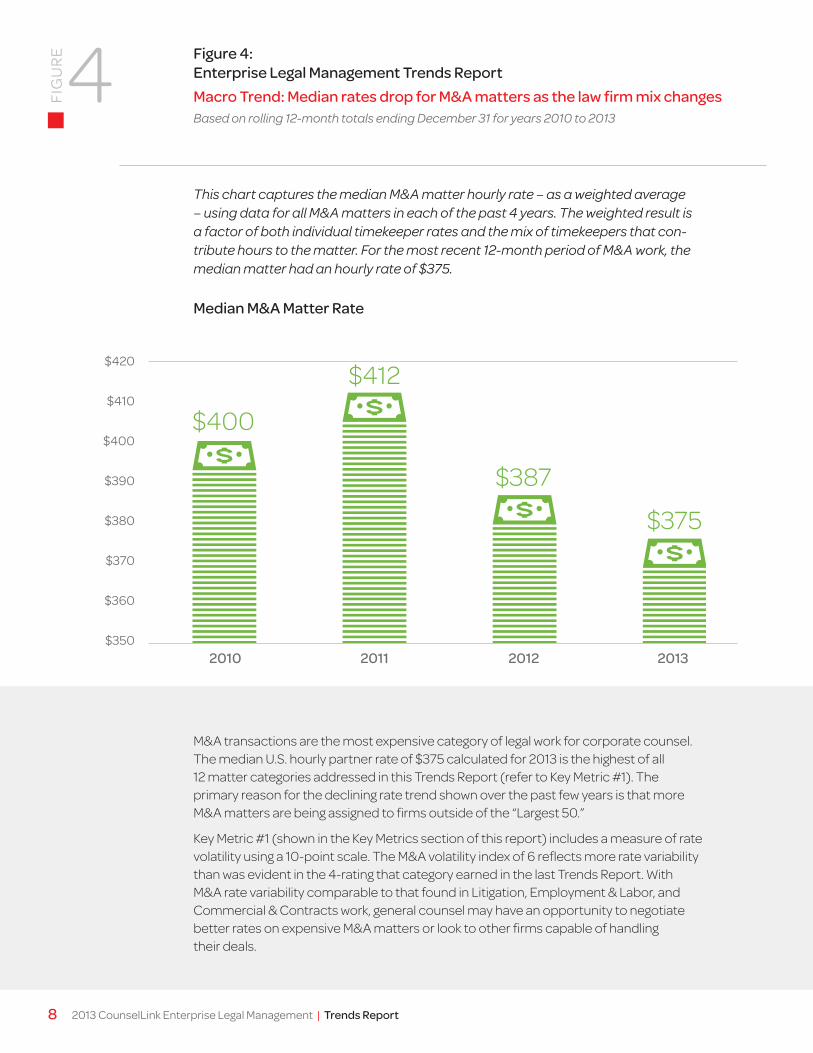
M&A transactions are the most expensive category of legal work for corporate counsel. The median U.S. hourly partner rate of $375 calculated for 2013 is the highest of all 12 matter categories addressed in this Trends Report (refer to Key Metric #1). The primary reason for the declining rate trend shown over the past few years is that more M&A matters are being assigned to firms outside of the “Largest 50.”
Key Metric #1 (shown in the Key Metrics section of this report) includes a measure of rate volatility using a 10-point scale. The M&A volatility index of 6 reflects more rate variability than was evident in the 4-rating that category earned in the last Trends Report. With M&A rate variability comparable to that found in Litigation, Employment & Labor, and Commercial & Contracts work, general counsel may have an opportunity to negotiate better rates on expensive M&A matters or look to other firms capable of handling their deals.
8 2013 CounselLink Enterprise Legal Management | Trends Report
Figure 4: Enterprise Legal Management Trends ReportMacro Trend: Median rates drop for M&A matters as the law firm mix changesBased on rolling 12-month totals ending December 31 for years 2010 to 2013
4FIGURE
This chart captures the median M&A matter hourly rate – as a weighted average – using data for all M&A matters in each of the past 4 years. The weighted result is a factor of both individual timekeeper rates and the mix of timekeepers that con-tribute hours to the matter. For the most recent 12-month period of M&A work, the median matter had an hourly rate of $375.
$420
$410
$400
$390
$380
$370
$360
$350
$412
$387
$375
2010 2011 2012 2013
Median M&A Matter Rate
$400
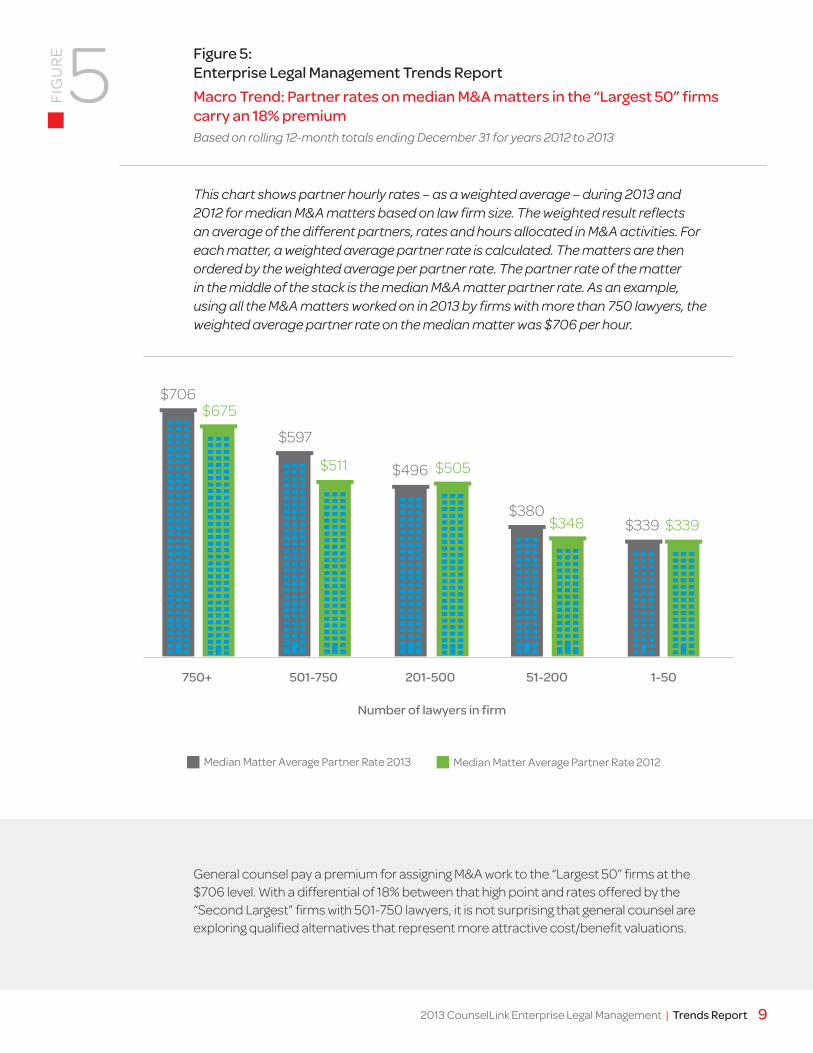
General counsel pay a premium for assigning M&A work to the “Largest 50” firms at the $706 level. With a differential of 18% between that high point and rates offered by the “Second Largest” firms with 501-750 lawyers, it is not surprising that general counsel are exploring qualified alternatives that represent more attractive cost/benefit valuations.
92013 CounselLink Enterprise Legal Management | Trends Report
Figure 5: Enterprise Legal Management Trends ReportMacro Trend: Partner rates on median M&A matters in the “Largest 50” firms carry an 18% premiumBased on rolling 12-month totals ending December 31 for years 2012 to 2013
5FIGURE
501-750750+ 201-500
Number of lawyers in firm
51-200 1-50
This chart shows partner hourly rates – as a weighted average – during 2013 and 2012 for median M&A matters based on law firm size. The weighted result reflects an average of the different partners, rates and hours allocated in M&A activities. For each matter, a weighted average partner rate is calculated. The matters are then ordered by the weighted average per partner rate. The partner rate of the matter in the middle of the stack is the median M&A matter partner rate. As an example, using all the M&A matters worked on in 2013 by firms with more than 750 lawyers, the weighted average partner rate on the median matter was $706 per hour.
Median Matter Average Partner Rate 2013 Median Matter Average Partner Rate 2012
$706
$597
$496
$380$339 $339
$675
$511 $505
$348
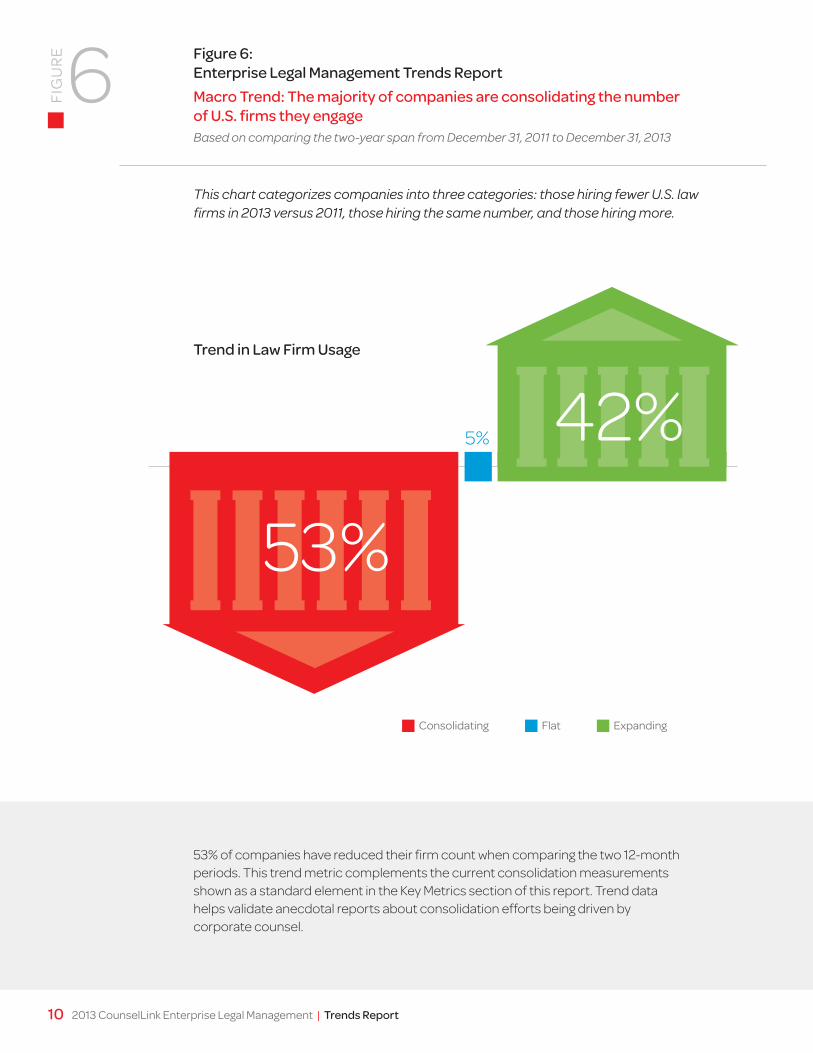
53% of companies have reduced their firm count when comparing the two 12-month periods. This trend metric complements the current consolidation measurements shown as a standard element in the Key Metrics section of this report. Trend data helps validate anecdotal reports about consolidation efforts being driven by corporate counsel.
10 2013 CounselLink Enterprise Legal Management | Trends Report
Figure 6: Enterprise Legal Management Trends ReportMacro Trend: The majority of companies are consolidating the number of U.S. firms they engageBased on comparing the two-year span from December 31, 2011 to December 31, 2013
6FIGURE
This chart categorizes companies into three categories: those hiring fewer U.S. law firms in 2013 versus 2011, those hiring the same number, and those hiring more.
Trend in Law Firm Usage
53%
42%5%
Consolidating Flat Expanding
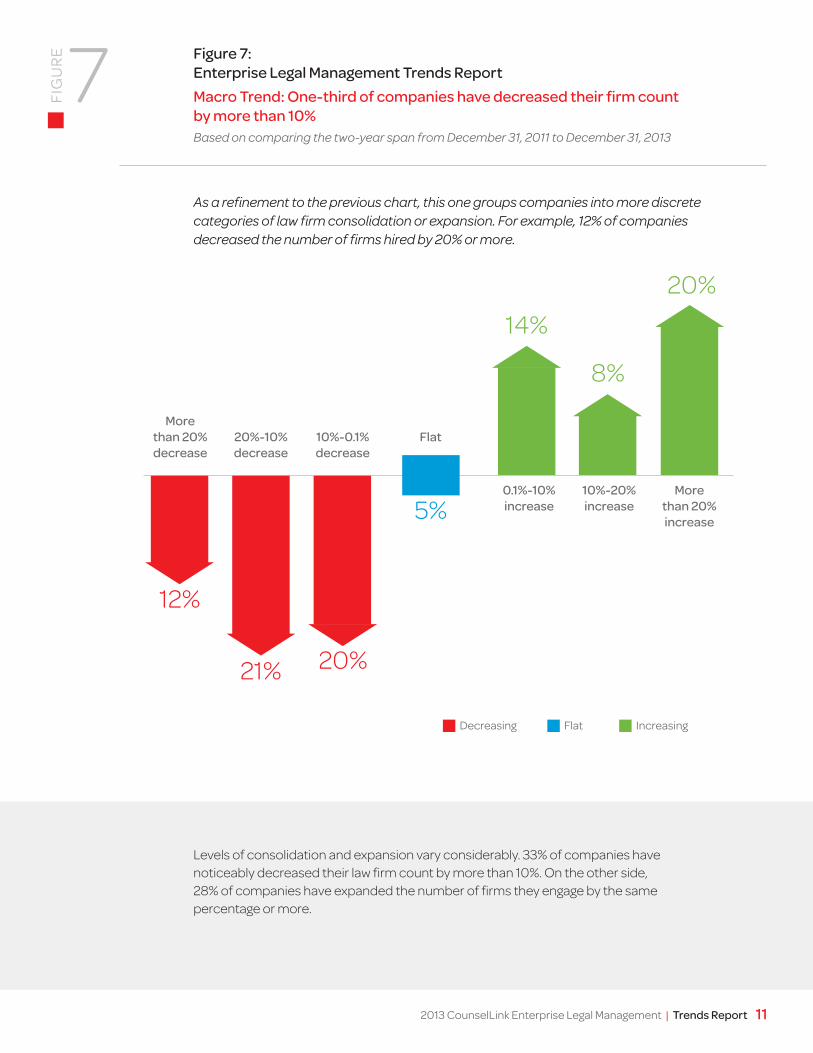
Levels of consolidation and expansion vary considerably. 33% of companies have noticeably decreased their law firm count by more than 10%. On the other side, 28% of companies have expanded the number of firms they engage by the same percentage or more.
112013 CounselLink Enterprise Legal Management | Trends Report
Figure 7: Enterprise Legal Management Trends ReportMacro Trend: One-third of companies have decreased their firm count by more than 10%Based on comparing the two-year span from December 31, 2011 to December 31, 2013
7FIGURE
As a refinement to the previous chart, this one groups companies into more discrete categories of law firm consolidation or expansion. For example, 12% of companies decreased the number of firms hired by 20% or more.
12%
21% 20%
14%
5%
20%
8%
Decreasing Flat Increasing
More than 20% decrease
20%-10% decrease
10%-0.1% decrease
Flat
0.1%-10%increase
10%-20%increase
More than 20%increase

Manufacturing and finance companies – at consolidation levels of 70% and 67% respectively – are the top two industry segments reducing the number of firms they engage. As a management strategy, electing to use the consolidation lever can achieve multiple benefits: increased negotiating power with the firms gaining business, stronger relationships with a smaller pool of firms, and a reduced operational burden.
12 2013 CounselLink Enterprise Legal Management | Trends Report
Figure 8: Enterprise Legal Management Trends ReportMacro Trend: Manufacturing and Finance companies have high percentages of law firm consolidationBased on comparing the two-year span from December 31, 2011 to December 31, 2013
8FIGURE
Another way to look at the same consolidation data is by industry segment, as shown in this chart. For example, 67% of CounselLink customers in the Finance industry used fewer outside counsel firms to handle their legal work in 2013 versus 2011.
Consolidating Flat Expanding
Mfg
All
Fina
nce
Info
rmat
ion
Insu
ranc
e
Reta
il Tra
de Tran
spor
tatio
n &
War
ehou
sing
20%33%
25%42%
40%
80%
70%67% 50%
50%40%
20%
10% 25% 8% 20%
132013 CounselLink Enterprise Legal Management | Trends Report
The Key Metrics
Enterprise Legal Management Trends Report
Each semi-annual update of the Enterprise Legal Management Trends Report covers a standard set of key metrics for hourly legal rates and the corporate procurement of legal services from law firms.
See following page for guidance on interpreting this chart.
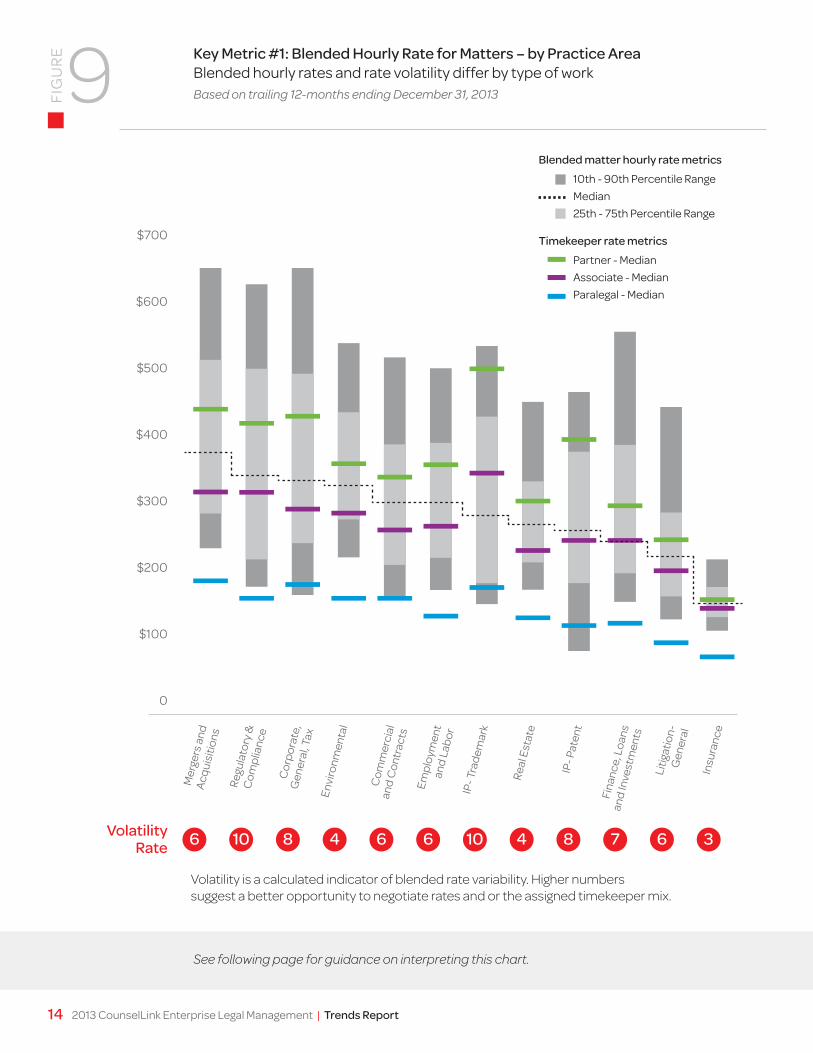
Volatility is a calculated indicator of blended rate variability. Higher numbers suggest a better opportunity to negotiate rates and or the assigned timekeeper mix.
14 2013 CounselLink Enterprise Legal Management | Trends Report
Key Metric #1: Blended Hourly Rate for Matters – by Practice Area Blended hourly rates and rate volatility differ by type of workBased on trailing 12-months ending December 31, 20139FIGURE
Mer
gers
and
Acqu
isiti
ons
Envi
ronm
enta
l
Cor
pora
te,
Gen
eral
, Tax
Regu
lato
ry &
Com
plia
nce
Com
mer
cial
an
d C
ontr
acts
Empl
oym
ent
and
Labo
rIP
- Tra
dem
ark
Real
Est
ate
IP- P
aten
t
Fina
nce,
Loa
ns
and
Inve
stm
ents
Litig
atio
n-
Gen
eral
Insu
ranc
e
10th - 90th Percentile Range Median25th - 75th Percentile Range
Partner - Median Associate - Median Paralegal - Median
Blended matter hourly rate metrics
Volatility Rate
Timekeeper rate metrics
6 10 8 4 6 6 10 4 8 7 6 3
$700
$600
$500
$400
$300
$200
$100
0

Interpreting the Chart:
The chart captures median rates for three different groups of timekeepers (partners, associates and paralegals) and the range of the blended average rate across multiple matter types. As a guide to interpreting the output, consider IP-Trademark compared to Mergers and Acquisitions. These two categories have the highest median rates for Partners – $500 and $440, respectively – but IP-Trademark work requires significantly less partner time. The result is a noticeably lower blended median rate for IP-Trademark work versus the same rate for Mergers and Acquisitions.
An additional metric provided in this section is the Volatility Index – a calculated marker indicating the variability encountered in blended matter rates. Using a 10-point scale, the Index reflects how broad the spread is between the 25th and 75th percentiles of hourly rates. High volatility scores indicate greater variance in prices paid based on the mix of timekeepers and individual hourly rates.
Again using IP-Trademark compared to Mergers and Acquisitions as an example, the spread between the 25th and 75th percentiles of blended hourly rates for IP-Trademark work is broader than that for Mergers and Acquisitions. On a 10 point scale, IP-Trademark has a Volatility Index of 10, while Mergers and Acquisitions has an Index of 6, indicating that the mix of timekeepers and rates paid on these matters varies more significantly than the mix for Mergers and Acquisitions.
While there is considerable industry focus on individual lawyer rates, it is equally or arguably more important to pay attention to the big picture – the blended average rates that result when a mix of different timekeepers works on matters. The chart will show the median blended rate is highest in Mergers & Acquisitions, where the most expensive firms are more often involved with a high amount of partner engagement.
Three matter types have a relatively low Volatility Index, which means these rates are consistent and less subject to negotiations between corporations and firms:
• Insurance
• Environmental
• RealEstate
Legal departments can compare their own data against these rates and ranges for help in managing costs. If currently paying at the top end of the range for more volatile areas, there may be an opportunity to negotiate lower rates or arrange a different mix of timekeepers to reduce costs.
152013 CounselLink Enterprise Legal Management | Trends Report

Interpreting the Chart:
This chart shows the degree of law firm consolidation among companies. The horizontal axis aligns participating companies into 9 segments addressing different degrees of consolidation. For example, the bar on the far right indicates 27% of participating companies have 90%-100% of their legal billings with 10 or fewer vendors … representing the most consolidated legal departments. On the other hand, the far left bar shows the least consolidation with only 1% of companies having less than 20% of their legal billings with 10 or fewer firms.
Industry alignment plays a significant role in consolidation levels:
• Manufacturing(non-pharma)companies,at73%,andretailtradecompanies, at 71%, are highly consolidated.
• Companieswithlowlevelsofconsolidationincludethoseininsurance,pharma, and the professional, scientific and technical services category.
16 2013 CounselLink Enterprise Legal Management | Trends Report
Key Metric #2: Law Firm Consolidation – Number of Legal Vendors Used by Corporations54% of companies in the data pool have 10 firms or fewer accounting for at least 80% of outside counsel feesBased on trailing 12-months ending December 31, 2013
10FIG
URE
20-30%<20%
30%
25%
20%
15%
10%
5%
0
30-40% 40-50% 50-60% 60-70% 70-80% 80-90% 90-100%
Degree of consolidation (% of billings from the company’s top 10 law firms)
% o
f com
pani
es

172013 CounselLink Enterprise Legal Management | Trends Report
Key Metric #3: Alternative Fee Arrangement (AFA) Usage AFAs used in 12% of matters and 7% of billings in the past yearBased on trailing 12-months ending December 31, 2013
% of Matters Executed under AFA
Average 12%
11aFIG
URE
20%
15%
10%
5%
0
Practice Area
Mer
gers
and
Acqu
isiti
ons
Envi
ronm
enta
l
Cor
pora
te,
Gen
eral
, Tax
Regu
lato
ry &
Com
plia
nce
Com
mer
cial
an
d C
ontr
acts
Empl
oym
ent
and
Labo
r
IP- T
rade
mar
k
Real
Est
ate
IP- P
aten
t
Fina
nce,
Loa
ns
and
Inve
stm
ents
Litig
atio
n-
Gen
eral
Insu
ranc
e
The use of AFAs to govern legal service payments varies significantly by legal matter type. Over the 12-month period of 2013, 12.4% of matters submitted and processed via the CounselLink solution were invoiced, at least in part, under a fee arrangement other than traditional hourly billing.
The total percentage of invoiced legal fees attributed to AFAs is smaller than the 12.4% of matters cited above, reaching 7.0% of all legal fees invoiced during 2013 via the CounselLink solution. Two factors affect this result:
• AFAsaremorefrequentlyusedformattersexpectedtogeneratelower,ratherthanhigher, aggregate fees.
• ClientsoftenputAFAsintoplaceonportionsorsubsetsofmatterwork,ratherthanfor entire projects, particularly with respect to dispute resolution or litigation matters.

Key Metric #3: Alternative Fee Arrangement (AFA) Usage AFAs used in 12% of matters and 7% of billings in the past yearBased on trailing 12-months ending December 31, 2013
11FIG
URE
18 2013 CounselLink Enterprise Legal Management | Trends Report
% of Billings Utilizing AFA
Average 7%
20%
15%
10%
5%
0
Practice Area
$$ $
$ $$ $$$
$$$
Mer
gers
and
Acqu
isiti
ons
Envi
ronm
enta
l
Cor
pora
te,
Gen
eral
, Tax
Regu
lato
ry &
Com
plia
nce
Com
mer
cial
an
d C
ontr
acts
Empl
oym
ent
and
Labo
r
IP- T
rade
mar
k
Real
Est
ate
IP- P
aten
t
Fina
nce,
Loa
ns
and
Inve
stm
ents
Litig
atio
n-
Gen
eral
Insu
ranc
e
b
192013 CounselLink Enterprise Legal Management | Trends Report
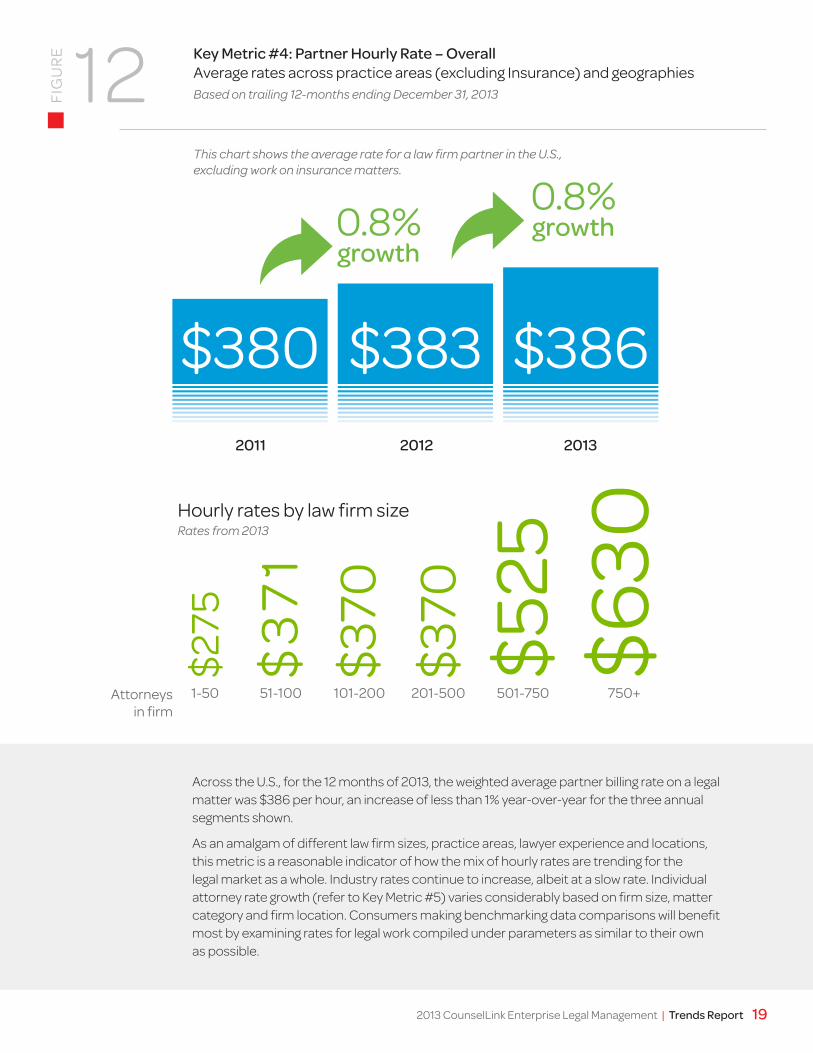
Across the U.S., for the 12 months of 2013, the weighted average partner billing rate on a legal matter was $386 per hour, an increase of less than 1% year-over-year for the three annual segments shown.
As an amalgam of different law firm sizes, practice areas, lawyer experience and locations, this metric is a reasonable indicator of how the mix of hourly rates are trending for the legal market as a whole. Industry rates continue to increase, albeit at a slow rate. Individual attorney rate growth (refer to Key Metric #5) varies considerably based on firm size, matter category and firm location. Consumers making benchmarking data comparisons will benefit most by examining rates for legal work compiled under parameters as similar to their own as possible.
Key Metric #4: Partner Hourly Rate – Overall Average rates across practice areas (excluding Insurance) and geographiesBased on trailing 12-months ending December 31, 201312FI
GU
RE
Hourly rates by law firm size
51-1001-50Attorneysin firm
Rates from 2013
101-200 201-500 501-750 750+
$630
$525
$370
$370
$37
1$2
75This chart shows the average rate for a law firm partner in the U.S., excluding work on insurance matters.
$380
0.8%0.8%
growthgrowth
$383 $3862011 2012 2013

Interpreting the Chart:
In looking at unique partner hourly rates across 15 major metro areas, two indicators were plotted for each location to show both the compound annual growth rate (CAGR) over a three-year span, and the year-over-year change.
Data for individual attorney rate growth by major U.S. city show Atlanta, Boston, Chicago, New York and Washington at or above the 3.5% level in both annual and compound annual growth rates (CAGR). Alternatively, five cities had partner hourly growth rates below 3.5% in both metrics: Detroit, Houston, Minneapolis, Phoenix and Seattle.
WASHINGTON DC
NEW YORKYOY CHANGE3-YEARCAGR3.6%
YOY CHANGE
3-YEAR CAGR
4.1%4.5%
CHICAGOYOY CHANGE3-YEARCAGR
4.7%4.9%
5.1%
BOSTONYOY CHANGE3-YEARCAGR
4.0%5.8%
ATLANTAYOY CHANGE3-YEARCAGR
3.8%3.9%
1
4
2
5
3
20 2013 CounselLink Enterprise Legal Management | Trends Report
Key Metric #5: Partner Hourly Rate Growth – by Location (City / State) 5 major cities show rate growth of 3.5% or more over both the last year and the last 3 yearsBased on trailing 12-months ending December 31, 2013
13FIG
URE
Los A
ngel
es C
A
Dal
las T
X
San
Fran
cisc
o C
A
Det
roit
MI
Mia
mi F
L
Min
neap
olis
MN
Phoe
nix A
Z
Hou
ston
TX
Phila
delp
hia
PA
Seat
tle W
A
3 Year CAGRYOY Change
Growth rates across the country5%
4%
3%
2%
1%
0

212013 CounselLink Enterprise Legal Management | Trends Report
Key Metric #5: Partner Hourly Rate Growth – by Location (City / State) Growth in average partner rates varies by state, averaging 2-3% in year-over-year growthBased on trailing 12-months ending December 31, 2013
14FIG
URE
> 4%2.1% to 4%0% to 2%< 0%
Growth Rate
10.10%$350 median
8.30%$338 median
5.6%$339 median
Across all states, the median year-over-year growth for unique partner hourly rates is 2.3%. The data suggests states with the highest rate growth are predominantly based on the East Coast, a data point supported by individual cities with high growth as noted on the previous chart.

22 2013 CounselLink Enterprise Legal Management | Trends Report
Aggregate statistics based on invoice data submitted through the CounselLink solution in 2013 identify Mergers and Acquisition as the practice area with the highest average hourly partner rate – $589. The next highest is Corporate, General, Tax (“Corporate”) – which includes advice and counsel, antitrust work and tax-related matters. In part, both of those practice areas are at the top because companies often use larger firms for these kinds of matters. In the last 12 months, the “Largest 50” firms handled 29% of Merger and Acquisition work, and 33% of Corporate legal work, versus 19% for all other types of legal work. At the lower end of the average hourly-rate spectrum is Insurance work. Insurance companies demand, and negotiate aggressively for, low rates on their commodity defense matters.
Key Metric #6: Partner Hourly Rate and Growth – by Practice AreaBased on trailing 12-months ending December 31, 201315FI
GU
RE
Mergers and Acquisitions
Corporate, General, Tax
Regulatory & Compliance
IP - Trademark
IP - Patent
Finance, Loans and Investments
Commercial and Contracts
Employment and Labor
Real Estate
Environmental
Litigation - General
Insurance
$589$533$475$470$435$431$400$375$360$360$343$179

232013 CounselLink Enterprise Legal Management | Trends Report
Key Metric #6: Partner Hourly Rate and Growth – by Practice Area One practice area shows 3.5% partner rate growth over both the last year and the last 3 yearsBased on trailing 12-months ending December 31, 2013
16FIG
URE
Turning to partner rate growth by practice area, only one of the 12 categories has shown growth at or exceeding a 3.5% rate during the past year and over the previous three-year period: IP – Patent. Two other practice areas are close behind: Employment and Labor, and Finance, Loans and Investments. Partner rates for Insurance and Real Estate are growing more slowly than rates in other practice areas.
3 Year CAGR YOY Change
Mergers and Acquisitions
Corporate, General, Tax
Regulatory & Compliance
IP - Trademark
IP - Patent
Finance, Loans and Investments
Commercial and Contracts
Employment and Labor
Real Estate
Environmental
Litigation - General
Insurance
IP Patent
Corporate, General and Tax
Finance, Loans and Investments
Commercial and Contracts
Employment and LaborIP Patent
Corporate, General and Tax
Finance, Loans and Investments
Commercial and Contracts
Employment and Labor
IP Patent
Corporate, General and Tax
Finance, Loans and Investments
Commercial and Contracts
Employment and Labor
3.5%
0 1% 2% 3% 4% 5%
24 2013 CounselLink Enterprise Legal Management | Trends Report
About theEnterprise Legal ManagementTrends Report

252013 CounselLink Enterprise Legal Management | Trends Report
About the Trends Report:Terminology:
• MatterCategorization – CounselLink solution users define the types of work associated with various matters that were analyzed and categorized into legal practice areas. For this analysis, all types of litigation matters are classified as “litigation”, regardless of the nature of the dispute; e.g., a patent litigation matter is classified as litigation, not as patent work. Data in this report has been mapped to one of 12 practice areas:
> Commercial and Contracts, including negotiating and drafting commercial and other business contracts, and excluding M&A transactions
> Insurance, including medical malpractice, workers compensation, auto claims, title insurance claims, et al.
> Employment and Labor, including immigration, non-compete, benefits and general human resources related matters
> Mergers and Acquisitions, narrowly defined to mean M&A transactions
> Real Estate, includes real estate transactions
> Regulatory and Compliance, covering matters that companies define as regulatory, compliance, government affairs or a government action/investigation
> Litigation, as a broad category covering litigation matters with patents, personal injury, breach of contract, product liability and others
> IP Patent, patent prosecution and counseling, including filings in the U.S. and internationally, excluding patent litigation
> IP-Trademark, for work classified as Trademark matters, including applications for registration, registrations and advice and counseling
> Finance, Loans and Investments, includes securities, credit and collections, and other funding activities
> Environmental, for all matters defined as environmental or energy related
> Corporate, General & Tax, to include antitrust, restructuring, bankruptcy, tax and other general corporate work

26 2013 CounselLink Enterprise Legal Management | Trends Report
• InsuranceMatters – For comparison purposes, charges on Insurance matters were removed from two pieces of analysis covering Partner Hourly Rate – Overall, and Partner Hourly Rate Growth – by Location.
• CitiesandStates – To capture billing timekeeper locations, timekeepers were mapped based on their law firm office zip codes. Where city locations are used, they include any zip code within that city’s metropolitan division as defined by the U.S. Census Bureau.
• LawFirmRoles – In referencing partners, associates, and paralegals, the underlying data included some discrete roles, such as “senior partner” or “junior associate.” In such instances, those timekeepers were placed within the broader partner, associate or paralegal segments. Non-partner lawyer titles, such as “of counsel,” were classified as associates.
• AlternativeFeeArrangements(AFAs) – Invoice charges are categorized within fee structures utilized in the CounselLink solution. Those charges in non-hourly fee structures were classified as alternative fee arrangements (AFAs). Additionally, charges coded as hourly were classified as AFA if the timekeeper level was a partner and the calculated hourly rate exceeded $1500. For timekeeper levels other than partner, charges with rates of greater than $1000 were categorized as AFAs. Lastly, work – which had invoiced-time narratives including terms such as flat fee, fixed fee or similar key words – was categorized as a matter subject to AFAs.
• CompanySize – Based on revenue cited in public sources, companies were grouped into these three size categories:
> $10 Billion
> $1-10 Billion
> < $1 Billion
• CompanyIndustry – Companies were mapped into the NAICS hierarchy based on publically-available information:
> Finance
> Information
> Insurance
> Manufacturing
> Pharma
> Professional, Scientific & Technical Services
> Retail Trade
> Transportation & Warehousing
> Other

The Expert Contributors
Enterprise Legal Management Trends Report
272013 CounselLink Enterprise Legal Management | Trends Report

28 2013 CounselLink Enterprise Legal Management | Trends Report
Several LexisNexis individuals made notable contributions to this latest Enterprise Legal Management Trends Report in the analysis of CounselLink data and preparing the surrounding narrative, specifically:
Principal AuthorKris Satkunas – Director of Strategic Consulting
As Director of Strategic Consulting at LexisNexis, Kris leads the CounselLink team in advising corporate legal department managers on improving operations with data-driven decisions. Kris is an expert in managing the business of law and in data mining, with specific expertise in matter pricing and staffing, practice area metrics and scorecards.
Prior to joining CounselLink, Kris served as Director of the LexisNexis Redwood Think Tank, which she also established. For five years, Kris worked closely with thought leaders in large law firms conducting unbiased data-based research studies focused on finding solutions to legal industry management issues. Earlier, she led the Redwood Analytics services group and the business of law consulting practice for large law firms. During this time she worked with key management at over a hundred law firms to evolve the financial models and analyses developed by Redwood Analytics for large law firms.
Kris has authored numerous articles and spoken at legal industry conferences and events. She came to LexisNexis in 2000 after having honed her finance skills as a Senior Vice President in Strategic Finance at Suntrust Bank. She holds a B.B.A. in Finance from The College of William & Mary.
Kris may be reached at [email protected] or 804.955.4034.
Con
tributors
Expe
rt

292013 CounselLink Enterprise Legal Management | Trends Report
Key ContributorsJonah Paransky – Vice President & Managing Director, Product Management
With responsibilities spanning the entire Business of Law Software Solutions portfolio, Jonah directs the activities of multiple teams working on individual product and marketing strategies and the overall end-to-end customer experience. He has been with LexisNexis for five years, applying an extensive background in business-to-business product management and marketing, and expertise in identifying opportunities that result in new products and services being brought to market. Jonah is a recognized expert in the areas of legal software, information security, IT infrastructure and SaaS (software-as-a-service). Prior to LexisNexis, he held senior management roles at StackSafe Inc., Symantec and RIPTech Inc. He earned bachelor of science and bachelor of arts degrees – in electrical engineering and economics, respectively – from the University of Pennsylvania.
Justin Silverman – Senior Director, Product Management
Focused on the core CounselLink solution and its capabilities for Matter Management, Legal Spend Management and Legal Hold, Justin is responsible for all aspects of product and market strategy and the end-to-end experience for corporate legal department customers. He joined the CounselLink team one year ago, coming from a two-year assignment as Senior Director of Global Strategy and Business Development for LexisNexis. Prior to that, he managed a professional services business at Gerson Lehrman Group, and also acquired more than six years of man-agement consulting experience, equally split between Oliver Wyman and the Boston Consulting Group. He earned a J.D. degree from Northwestern University Law School, and an MBA from the Kellogg School of Management.

30 2013 CounselLink Enterprise Legal Management | Trends Report
Mike Haysley – Director of Strategic Services
In his Strategic Services role, Mike consults with corporate legal departments, advising them about ways to manage the business of law that improve operations and results. He joined the CounselLink organization from Waste Management, where he was Director of Legal Operations and gained valuable first-hand knowledge of the pressing issues legal departments face every day. Previously, Mike held legal consulting roles with Huron Consulting Group, PricewaterhouseCoopers and Arthur Andersen; and also acquired experience as an implementation executive with another matter and legal spend management supplier. He graduated from Texas A&M University with a business degree, received his law degree from the University of Houston, and is licensed to practice law in Texas.
The CounselLink solution is an Enterprise Legal Management solution suite for matter management, legal spend management, legal hold, analytics and strategic consulting services. The solution has earned an industry reputation for enabling corporate counsel to use data effectively as a basis for improving legal department performance and outcomes. Two factors validate these customer opinions and perceptions:
• SpecificlegalspendandmattermanagementfeaturesintheCounselLink solution give corporate clients advanced capabilities to evaluate legal department performance and metrics on an ongoing basis, entirely on their own.
• LexisNexisinvestssignificantresourcesinprofessionalconsultingandserviceofferings that add a valuable layer of expertise in analytics, benchmarking and best practices. The overall goal with these optimization programs is to help clients translate data-driven analysis into actions that improve efficiency and bottom-line results.
If you have questions or comments about the Trends Report, or want to learn more about CounselLink software and services, visit www.lexisnexis.com/counsellink, or contact us via email: [email protected] or phone: 855.974.7774. For media inquiries, please contact: [email protected].
Follow us online:Blog: www.businessoflawblog.com
Twitter: @lncounsellink
Facebook: www.facebook.com/lexisnexisbusinessoflaw
Con
tributors
Expe
rt
Facebook “f ” Logo CMYK / .ai Facebook “f ” Logo CMYK / .ai

312013 CounselLink Enterprise Legal Management | Trends Report

2013 www.counsellink.com
CounselLink®


