84
| Date post: | 15-Apr-2017 |
| Category: |
Presentations & Public Speaking |
| Upload: | hossam-zein |
| View: | 301 times |
| Download: | 1 times |

On the cover: Trans-Alaska oil pipeline; aerial view of New Jersey refinery; coal barges on Mississippi River in St. Paul, Minnesota; power plant in Prince George’s County, Maryland; Grand Coulee Dam in Washington State; corn field near Somers, Iowa; wind turbines in Texas.
Photo credits: iStockphoto

U.S. ENERGY SECTOR VULNERABILITIES TO CLIMATE CHANGE AND EXTREME WEATHER
Acknowledgements This report was drafted by the U.S. Department of Energy’s Office of Policy and International Affairs (DOE-PI) and the National Renewable Energy Laboratory (NREL). The coordinating lead author and a principal author was Craig Zamuda of DOE-PI; other principal authors included Bryan Mignone of DOE-PI, and Dan Bilello, KC Hallett, Courtney Lee, Jordan Macknick, Robin Newmark, and Daniel Steinberg of NREL. Vince Tidwell of Sandia National Laboratories, Tom Wilbanks of Oak Ridge National Laboratory, and Matt Antes, Gareth Williams, and C.W. Gillespie of Energetics Incorporated provided analytical support and editing services. Contributions were made from experts throughout the Department, particularly: Carla Frisch, Amitai Bin-Nun, and Sam Baldwin, Office of Energy Efficiency and Renewable Energy; Gilbert Bindewald III, Brian Copeland, and Eric Rollison, Office of Electricity Delivery and Energy Reliability; Jarad Daniels, Thomas Grahame, and Olayinka Ogunsola, Office of Fossil Energy; Matt Crozat, Office of Nuclear Energy; Diana Bauer, Aaron Bergman, and Robert Marlay, DOE-PI; Robert Vallario and Gary Geernaert, Office of Science; Jennifer MacDonald and Glenn Sonntag, Sustainability Performance Office. Other reviewers at DOE’s national laboratories included May Wu and Dan Santini, Argonne National Laboratory; Jayant Sathaye, Lawrence Berkeley National Laboratory; Thomas Jenkin, NREL; and William Emanuel and Richard Skaggs, Pacific Northwest National Laboratory. The effort benefited from interagency input and feedback, particularly from the White House Office of Science and Technology Policy and Council on Environmental Quality, the National Oceanic and Atmospheric Administration, and the U.S. Environmental Protection Agency. This report was enhanced by the input of government, industry, and non-governmental experts who participated in the “Climate Change and Extreme Weather Vulnerability Assessment of the U.S. Energy Sector” workshop hosted by the Atlantic Council on July 24–25, 2012, which was supported by a grant from DOE-PI. Disclaimer This report was prepared as an account of work sponsored by an agency of the United States Government. Reference herein to any specific commercial product, process, or service by trade name, trademark, manufacturer, or otherwise, does not necessarily constitute or imply its endorsement, recommendation, or favoring by the United States Government or any agency thereof.

U.S. ENERGY SECTOR VULNERABILITIES TO CLIMATE CHANGE AND EXTREME WEATHER
Contents EXECUTIVE SUMMARY ..................................................................................................................................................... i
Vulnerabilities in the U.S. Energy Sector ................................................................................................................................. i Adaptation Responses and Future Opportunities ............................................................................................................. ii
INTRODUCTION ................................................................................................................................................................. 1
Regional Variation in Impacts ...................................................................................................................................................4 Compounding Factors and Interdependencies ....................................................................................................................5 Thresholds and Tipping Points .................................................................................................................................................6 Response Optimization ................................................................................................................................................................6 Report Snapshot ..............................................................................................................................................................................6
CHAPTER 1: Increasing Temperatures ..................................................................................................................... 8
Recent Trends and Projections .................................................................................................................................................8 Implications for the Energy Sector ...........................................................................................................................................9
Oil and Gas Exploration and Production .......................................................................................................................... 9 Thermoelectric Power Generation ................................................................................................................................... 10 Renewable Energy Resources ............................................................................................................................................ 11 Electric Grid .............................................................................................................................................................................. 12 Energy Demand ....................................................................................................................................................................... 13
CHAPTER 2: Decreasing Water Availability ......................................................................................................... 17
Recent Trends and Projections .............................................................................................................................................. 17 Implications for the Energy Sector ........................................................................................................................................ 18
Oil and Gas Exploration and Production ........................................................................................................................ 18 Fuel Transport ......................................................................................................................................................................... 21 Thermoelectric Power Generation ................................................................................................................................... 22 Renewable Energy Resources ............................................................................................................................................ 25
CHAPTER 3: Increasing Storms, Flooding, and Sea Level Rise ...................................................................... 28
Recent Trends and Projections .............................................................................................................................................. 28 Implications for the Energy Sector ........................................................................................................................................ 29
Oil and Gas Exploration and Production ........................................................................................................................ 30 Fuel Transport ......................................................................................................................................................................... 32 Thermoelectric Power Generation ................................................................................................................................... 33 Renewable Energy Resources ............................................................................................................................................ 34 Electric Grid .............................................................................................................................................................................. 35
CHAPTER 4: Adaptation Actions and Major Opportunities ............................................................................ 36
Adaptation Actions Underway ................................................................................................................................................ 37 Major Opportunities ................................................................................................................................................................... 42
CONCLUSION ................................................................................................................................................................... 46
APPENDIX: Climate and Extreme Weather Trends in the United States ................................................. A-1
REFERENCES .................................................................................................................................................................. R-1

U.S. ENERGY SECTOR VULNERABILITIES TO CLIMATE CHANGE AND EXTREME WEATHER
Figures Figure 1. Selected events over the last decade illustrate the U.S. energy sector's vulnerabilities to climatic conditions .......................... 1Figure 2. Climate change implications for the energy sector ..................................................................................................................... 4Figure 3. Rate of warming in the United States by region, 1901–2011 .................................................................................................... 8Figure 4. Wildfire disrupting electricity transmission ............................................................................................................................... 13Figure 5. Changes in cooling degree days and heating degree days in the United States by 2080–2099, under a lower emissions scenario (B1) and a very high emissions scenario (A1FI) ......................................................................................................................... 14Figure 6. Distribution of heating and cooling degree days for different climate zones across the United States ................................... 14Figure 7. Projected changes in precipitation by season ........................................................................................................................... 17Figure 8. U.S. shale oil and shale gas plays .............................................................................................................................................. 20Figure 9. Oil barge loading at a refinery on the Mississippi River ............................................................................................................ 21Figure 10. Barges transporting coal down the Mississippi River .............................................................................................................. 22Figure 11. Low water level at Martin Lake Steam Electric Station facility in Texas ................................................................................. 22Figure 12. Locations of thermoelectric power plants by cooling technology and water source .............................................................. 23Figure 13. Water use by fuel and cooling technology .............................................................................................................................. 24Figure 14. Water stress: Locations of the 100 most vulnerable coal-fired power plants ......................................................................... 24Figure 15. Drought-stricken farm field ..................................................................................................................................................... 26Figure 16. Percentage change in very heavy precipitation, 1958–2007 .................................................................................................. 28Figure 17. Projected changes in Atlantic hurricane frequency by category ............................................................................................. 29Figure 18. Billion-dollar weather and climate disasters, 1980–2012 ....................................................................................................... 30Figure 19. Flooded refinery near Beaumont, Texas, in the aftermath of Hurricane Ike ........................................................................... 30Figure 20. Damaged offshore platform after Hurricane Katrina ............................................................................................................. 30Figure 21. Hurricane storm tracks and locations of coastal energy infrastructure .................................................................................. 31Figure 22. SPR storage locations .............................................................................................................................................................. 32Figure 23. SPR site and equipment inundated following a storm surge .................................................................................................. 32Figure 24. Flooded railroad along the Spring River in Arkansas .............................................................................................................. 33Figure 25. Regions with heavy rainfall events (1958–2007) and coal shipment routes that cross major rivers ...................................... 33Figure 26. Power plants in California potentially at risk from a 100-year flood with sea level rise of 4.6 feet (1.4 meters) ................... 34Figure 27. Flooding of the Ft. Calhoun nuclear power plant in Nebraska, spring 2011 ........................................................................... 34Figure 28. Weather-related grid disruptions, 2000–2012 ........................................................................................................................ 35Figure 29. San Juan generating station .................................................................................................................................................... 37Figure 30. Concentrating solar power plant in the Mojave Desert .......................................................................................................... 38Figure 31. Illustrative view of projected Gulf Coast energy assets at risk by 2030 .................................................................................. 39Figure 32. Changes in the levelized cost of electricity associated with retrofitting thermoelectric power plants to dry cooling or non-potable water, depending on which was the least expensive alternative ............................................................................................... 40Figure 33. Illustrative technology opportunities to build a more climate-resilient U.S. energy sector .................................................... 43Figure 34. Projected seasonal differences in temperature ..................................................................................................................... A-3Figure 35. Projected changes in frost-free season ................................................................................................................................. A-4Figure 36. Observed changes in annual precipitation in the United States (1991–2011) ...................................................................... A-5Figure 37. Projected changes in precipitation by season ....................................................................................................................... A-6Figure 38. Projected changes in Atlantic hurricane frequency by category ........................................................................................... A-8Figure 39. Percentage change in very heavy precipitation, 1958–2007 ................................................................................................ A-9Figure 40. Trends in flood magnitude .................................................................................................................................................. A-10

U.S. ENERGY SECTOR VULNERABILITIES TO CLIMATE CHANGE AND EXTREME WEATHER
Tables Table ES-1. Relationship between climate change projections and implications for the energy sector ................................................... iii Table 1. Nexus of energy, water, and land systems ................................................................................................................................... 5Table 2. Report organization and relationship between climate change projections and implications for the energy sector .................. 7Table 3. Climate indicators that affect water availability ........................................................................................................................ 17Table 4. Connections between the U.S. energy sector and water availability and quality ...................................................................... 19Table 5. Likelihood scale from the IPCC Fourth Assessment Report (AR4) ............................................................................................. A-2

U.S. ENERGY SECTOR VULNERABILITIES TO CLIMATE CHANGE AND EXTREME WEATHER
i
EXECUTIVE SUMMARY Since the start of the 20th century, average annual temperatures across the contiguous United States have increased approximately 1.5°F (0.8°C) (NOAA 2013b, EPA 2012a). Recent weather conditions are no exception to this trend. July 2012 was the hottest month in the United States since record keeping began in 1895, and 2012 was the warmest year overall, marked by historic high temperatures and droughts, above average wildfires, multiple intense storms that disrupted power to millions, and multiple extreme heat waves (NOAA 2013c). More than 60% of the country experienced drought during the summer of 2012, including some areas of exceptional drought (NOAA 2013c, NOAA 2012c). These trends, which are expected to continue (NOAA 2013b, IPCC 2012, USGCRP 2009), could restrict the supply of secure, sustainable, and affordable energy critical to the nation’s economic growth. At least three major climate trends are relevant to the energy sector: • Increasing air and water temperatures • Decreasing water availability in some regions and
seasons • Increasing intensity and frequency of storm events,
flooding, and sea level rise This report—part of the Administration’s efforts to support national climate change adaptation planning through the Interagency Climate Change Adaptation Task Force and Strategic Sustainability Planning process established under Executive Order 13514 and to advance the U.S. Department of Energy’s goal of promoting energy security—examines current and potential future impacts of these climate trends on the U.S. energy sector. It identifies activities underway to address these challenges and discusses potential opportunities to enhance energy technologies that are more climate-resilient, as well as information, stakeholder engagement, and policies and strategies to further enable their deployment.
Vulnerabilities in the U.S. Energy Sector Increasing temperatures, decreasing water availability, more intense storm events, and sea level rise will each independently, and in some cases in combination, affect the ability of the United States to produce and transmit electricity from fossil, nuclear, and existing and emerging renewable energy sources. These changes are also projected to affect the nation’s demand for energy and its ability to access, produce, and distribute oil and natural gas (ORNL 2012a, USGCRP 2009). An assessment of impacts—both positive and negative—is necessary to inform forward-looking efforts to enhance energy security. Significant findings include: • Thermoelectric power generation facilities are at risk
from decreasing water availability and increasing ambient
air and water temperatures, which reduce the efficiency of cooling, increase the likelihood of exceeding water thermal intake or effluent limits that protect local ecology, and increase the risk of partial or full shutdowns of generation facilities
• Energy infrastructure located along the coast is at risk from sea level rise, increasing intensity of storms, and higher storm surge and flooding, potentially disrupting oil and gas production, refining, and distribution, as well as electricity generation and distribution
• Oil and gas production, including unconventional oil and gas production (which constitutes an expanding share of the nation’s energy supply) is vulnerable to decreasing water availability given the volumes of water required for enhanced oil recovery, hydraulic fracturing, and refining
• Renewable energy resources, particularly hydropower, bioenergy, and concentrating solar power can be affected by changing precipitation patterns, increasing frequency and intensity of droughts, and increasing temperatures
• Electricity transmission and distribution systems carry less current and operate less efficiently when ambient air temperatures are higher, and they may face increasing risks of physical damage from more intense and frequent storm events or wildfires
• Fuel transport by rail and barge is susceptible to increased interruption and delay during more frequent periods of drought and flooding that affect water levels in rivers and ports
• Onshore oil and gas operations in Arctic Alaska are vulnerable to thawing permafrost, which may cause damage to existing infrastructure and restrict seasonal access, while offshore operations could benefit from a longer sea ice-free season
• Increasing temperatures will likely increase electricity demand for cooling and decrease fuel oil and natural gas demand for heating
Some of these effects, such as higher temperatures of ambient water used for cooling, are projected to occur in all regions. Other effects may vary more by region, and the vulnerabilities faced by various stakeholders may differ significantly depending on their specific exposure to the condition or event. However, regional variation does not imply regional isolation as energy systems have become increasingly interconnected. Compounding factors may create additional challenges. For example, combinations of persistent drought, extreme heat events, and wildfire may create short-term peaks in demand and diminish system flexibility and supply, which could limit the ability to respond to that demand.

U.S. ENERGY SECTOR VULNERABILITIES TO CLIMATE CHANGE AND EXTREME WEATHER
ii
Adaptation Responses and Future Opportunities Federal, state, and local governments and the private sector are already responding to the threat of climate change. These efforts include the deployment of energy technologies that are more climate-resilient, assessment of vulnerabilities in the energy sector, adaptation planning efforts, and policies that can facilitate these efforts. However, the pace, scale, and scope of combined public and private efforts to improve the climate preparedness and resilience of the energy sector will need to increase, given the challenges identified. Greater resilience will require improved technologies, polices, information, and stakeholder engagement. Possible future technology opportunities include: • Water-efficient technologies for fuels production,
including conventional oil and natural gas, shale gas, shale oil, and coalbed methane
• Improved energy efficiency and reduced water intensity of thermoelectric power generation, including innovative cooling technologies, non-traditional water supplies (e.g., municipal wastewater or brackish groundwater), and water capture/reuse
• Enhanced water efficiency of bioenergy (e.g., modified agricultural practices and use of alternative water sources), use of drought-tolerant crop varieties for bioenergy production, and more water-efficient conversion of biomass into biofuels
• Improved grid equipment and operations to manage changing load conditions and increase reliability and resilience
• Increased resilience of energy infrastructure to wildfires, storms, floods, and sea level rise, including “hardening” of existing facilities and structures (e.g., transmission and distribution lines, power plants, oil and gas refineries, and offshore oil and gas platforms)
• Enhanced demand-side management and development of energy/water-efficient and energy-smart appliances, equipment, buildings, and vehicles
An improved framework of enabling policies could help facilitate the development and deployment of climate-resilient energy technologies. Policy choices occur at the federal, state, and local levels, and any adjustments to future policies, existing federal efforts, or new undertakings would need to be evaluated thoroughly with complete consideration of an array of factors, including societal and economic costs and benefits, and competing priorities. Possible future opportunities include: • Innovation policies to broaden the suite of advanced
technologies • Enabling national and sub-national policies and
incentives to overcome existing market barriers, accelerate deployment of more climate-resilient energy
technologies, and encourage design, operation, and siting of energy infrastructure in a manner that increases climate resilience
• Measures that promote integration of energy sector climate risks into different levels of development planning and maximize benefits of adaptation to multiple sectors
Technology and policy development should be accompanied by better information—data, models, tools, and vulnerability assessments—to help decision-makers understand climate risks, the potential for technological or operational solutions, and the relative economic costs of technology and policy strategies. Such improvements could include: • Better characterization of the aggregate vulnerabilities of
the energy sector to climate change, interdependencies between the energy sector and other sectors that can lead to cascading impacts, and low probability-high impact climate scenarios with thresholds and tipping points beyond which there are irreversible changes or changes of unexpected magnitude
• Improved data collection and analysis of the costs and benefits of adaptation and resilience measures, including the benefits of preventing critical infrastructure damage or loss, and preventing economic loss due to disruptions in energy production and delivery
• Enhanced tools and models that use information about energy sector vulnerabilities and adaptation measures to evaluate trade-offs between various forms of energy production, between various adaptation measures, and between climate change adaptation goals and other relevant national priorities
Finally, a greater level of engagement between key stakeholder and user communities could facilitate the transition to a more climate-resilient energy sector. Current efforts are analyzing the effects of global climate change on the United States and promoting the integration of climate change adaptation into energy system planning and operations. However, all institutions involved—federal and non-federal—will need to continue to work to better facilitate effective planning, development, and communication of these approaches. Future opportunities could include: • Outreach initiatives built on existing communication and
education programs to improve dissemination of information regarding risks, vulnerabilities, and opportunities to build climate-resilient energy systems
• Effective coordination mechanisms with federal, state and local governments to build capacity and to help deploy the most appropriate approaches regionally and nationally

U.S. ENERGY SECTOR VULNERABILITIES TO CLIMATE CHANGE AND EXTREME WEATHER
iii
• Engagement of the investment, financial, and insurance communities in climate change risk reduction through the use of financial instruments
Quantifying the impacts of climate change on the nation’s energy infrastructure is increasingly important to improve understanding of the social and economic costs and benefits of resilience measures and response strategies. Decisions will continue to be made under uncertainty, highlighting the need for risk-based assessments. Flexible
strategies will foster action while allowing course corrections over the longer term. Ultimately, climate change adaptation and mitigation actions are complementary approaches that can jointly reduce the costs and risks of climate change and extreme weather. Effective adaptation strategies and the development and deployment of climate-resilient energy technologies will facilitate resilient energy systems in the United States and around the globe.
Table ES-1. Relationship between climate change projections and implications for the energy sector* Energy sector Climate projection Potential implication
Oil and gas exploration and production
Thawing permafrost in Arctic Alaska Damaged infrastructure and changes to existing operations Longer sea ice-free season in Arctic Alaska Limited use of ice-based infrastructure; longer drilling season; new
shipping routes Decreasing water availability Impacts on drilling, production, and refining Increasing intensity of storm events, sea level rise,
and storm surge Increased risk of physical damage and disruption to offshore and
coastal facilities
Fuel transport Reduction in river levels Disruption of barge transport of crude oil, petroleum products, and coal Increasing intensity and frequency of flooding Disruption of rail and barge transport of crude oil, petroleum products,
and coal
Thermoelectric power generation (Coal, natural gas, nuclear, geothermal and solar CSP)
Increasing air temperatures Reduction in plant efficiencies and available generation capacity Increasing water temperatures Reduction in plant efficiencies and available generation capacity;
increased risk of exceeding thermal discharge limits Decreasing water availability Reduction in available generation capacity; impacts on coal, natural
gas, and nuclear fuel supply chains Increasing intensity of storm events, sea level rise,
and storm surge Increased risk of physical damage and disruption to coastal facilities
Increasing intensity and frequency of flooding Increased risk of physical damage and disruption to inland facilities
Hydropower Increasing temperatures and evaporative losses Reduction in available generation capacity and changes in operations Changes in precipitation and decreasing snowpack Reduction in available generation capacity and changes in operations Increasing intensity and frequency of flooding Increased risk of physical damage and changes in operations
Bioenergy and biofuel production
Increasing air temperatures Increased irrigation demand and risk of crop damage from extreme heat events
Extended growing season Increased production Decreasing water availability Decreased production Sea level rise and increasing intensity and
frequency of flooding Increased risk of crop damage
Wind energy Variation in wind patterns Uncertain impact on resource potential
Solar energy Increasing air temperatures Reduction in potential generation capacity Decreasing water availability Reduction in CSP potential generation capacity
Electric grid
Increasing air temperatures Reduction in transmission efficiency and available transmission capacity
More frequent and severe wildfires Increased risk of physical damage and decreased transmission capacity Increasing intensity of storm events Increased risk of physical damage
Energy demand
Increasing air temperatures Increased electricity demand for cooling; decreased fuel oil and natural gas demand for heating
Increasing magnitude and frequency of extreme heat events
Increased peak electricity demand
* Where possible, this report attempts to characterize the direction and magnitude of change at the national and regional level, as well as on an annual and seasonal basis. However, given limitations in the available literature, statements about the direction of change do not necessarily imply judgment about the magnitude of change unless explicitly stated.
U.S. ENERGY SECTOR VULNERABILITIES TO CLIMATE CHANGE AND EXTREME WEATHER
1
INTRODUCTION
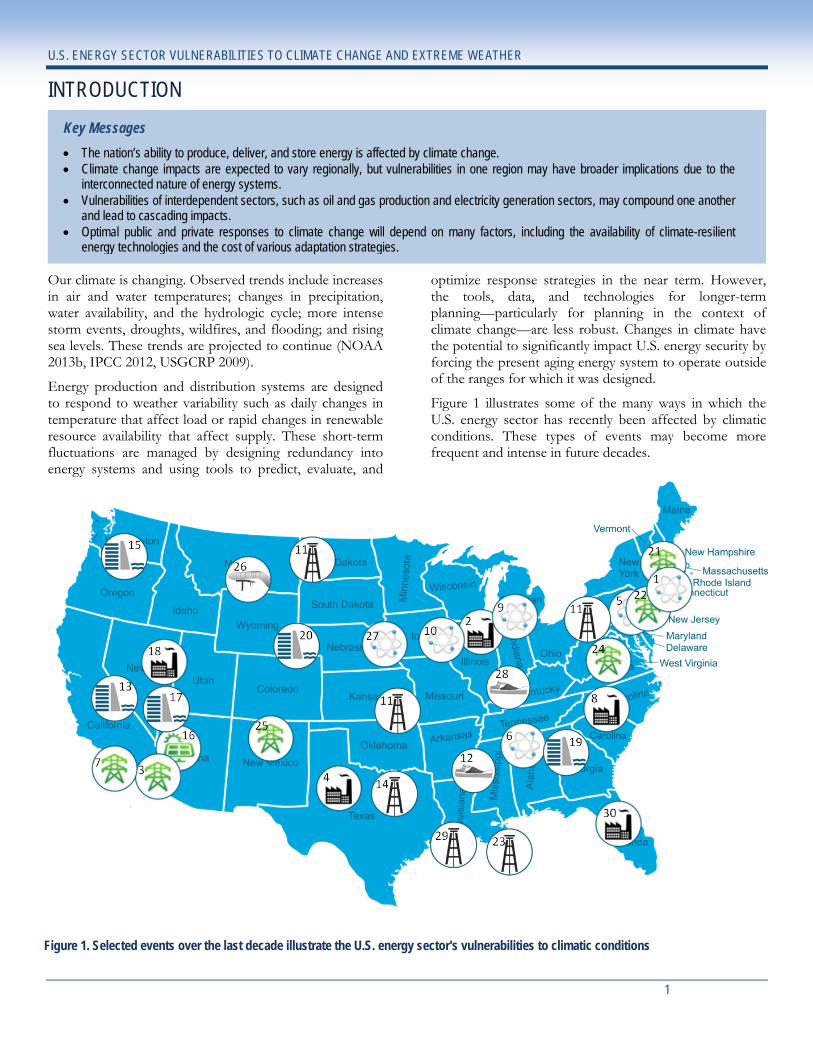
Our climate is changing. Observed trends include increases in air and water temperatures; changes in precipitation, water availability, and the hydrologic cycle; more intense storm events, droughts, wildfires, and flooding; and rising sea levels. These trends are projected to continue (NOAA 2013b, IPCC 2012, USGCRP 2009).
Energy production and distribution systems are designed to respond to weather variability such as daily changes in temperature that affect load or rapid changes in renewable resource availability that affect supply. These short-term fluctuations are managed by designing redundancy into energy systems and using tools to predict, evaluate, and
optimize response strategies in the near term. However, the tools, data, and technologies for longer-term planning—particularly for planning in the context of climate change—are less robust. Changes in climate have the potential to significantly impact U.S. energy security by forcing the present aging energy system to operate outside of the ranges for which it was designed.
Figure 1 illustrates some of the many ways in which the U.S. energy sector has recently been affected by climatic conditions. These types of events may become more frequent and intense in future decades.
Figure 1. Selected events over the last decade illustrate the U.S. energy sector's vulnerabilities to climatic conditions
Key Messages • The nation’s ability to produce, deliver, and store energy is affected by climate change. • Climate change impacts are expected to vary regionally, but vulnerabilities in one region may have broader implications due to the
interconnected nature of energy systems. • Vulnerabilities of interdependent sectors, such as oil and gas production and electricity generation sectors, may compound one another
and lead to cascading impacts. • Optimal public and private responses to climate change will depend on many factors, including the availability of climate-resilient
energy technologies and the cost of various adaptation strategies.

U.S. ENERGY SECTOR VULNERABILITIES TO CLIMATE CHANGE AND EXTREME WEATHER
2
Figure 1. Selected events over the last decade illustrate the U.S. energy sector's vulnerabilities to climatic conditions (continued)
Impacts Due to Increasing Temperatures
1
August 2012: Dominion Resources’ Millstone Nuclear Power Station in Connecticut shut down one reactor because the temperature of the intake cooling water, withdrawn from the Long Island Sound, was too high and exceeded technical specifications of the reactor. Water temperatures were the warmest since operations began in 1970. While no power outages were reported, the two-week shutdown resulted in the loss of 255,000 megawatt-hours of power, worth several million dollars (USNRC 2012, Wald 2012a).
2
July 2012: Four coal-fired power plants and four nuclear power plants in Illinois requested permission to exceed their permitted water temperature discharge levels because the temperature of their cooling water pond is regulated to prevent adverse ecological impacts. The Illinois Environmental Protection Agency granted special exceptions to the eight power plants, allowing them to discharge water that was hotter than allowed by federal Clean Water Act permits (Eilperin 2012, Wald 2012b).
3
September 2011: High temperatures and high electricity demand-related loading tripped a transformer and transmission line near Yuma, Arizona, starting a chain of events that led to shutting down the San Onofre nuclear power plant with power lost to the entire San Diego County distribution system, totaling approximately 2.7 million power customers, with outages as long as 12 hours (FERC 2012).
4
Summer 2011: Consecutive days of triple-digit heat and record drought in Texas resulted in the Electric Reliability Council of Texas declaring power emergencies due to a large number of unplanned power plant outages and at least one power plant reducing its output (Fowler 2011).
5
Summer 2010: The Hope Creek Nuclear Generating Station in New Jersey and Exelon’s Limerick Generating Station in Pennsylvania had to reduce power because the temperatures of the intake cooling water, withdrawn from the Delaware and the Schuylkill Rivers, respectively, were too high and did not provide sufficient cooling for full power operations (Wald 2012b).
6
2007, 2010, and 2011: The Tennessee Valley Authority’s (TVA) Browns Ferry Nuclear Plant in Athens, Alabama, had to reduce power output because the temperature of the Tennessee River, the body of water into which the plant discharges, was too high to discharge heated cooling water from the reactor without risking ecological harm to the river. TVA was forced to curtail the power production of its nuclear reactors, in some cases for nearly two months. While no power outages were reported, the cost of replacement power was estimated at $50 million (PNNL 2012).
7
October 2007: The California Independent System Operator declared an emergency due to wildfire damage to the Southwest Power link transmission system, including more than two dozen transmission lines out of service with damage to 35 miles of wire and nearly 80,000 customers in San Diego losing power, some for several weeks (PPIC 2008, SDG&E 2007).
8
August 2007: Drought, heat waves, and elevated water temperatures forced Duke Energy to curtail operations at two coal-fired power plants (Riverbend Steam Station and Allen Steam Station), causing scattered power outages (Beshears 2007).
9
July 2006: One unit at American Electric Power’s D.C. Cook Nuclear Plant was shut down because the high summer temperatures raised the air temperature inside the containment building above 120°F (48.9°C), and the temperature of the cooling water from Lake Michigan was too high to intake for cooling. The plant could only be returned to full power after five days, once the heat wave had passed (Krier 2012).
10
August 2006: Two units at Exelon’s Quad Cities Generating Station in Illinois had to reduce electricity production to less than 60% electricity capacity because the temperature of the Mississippi River was too high to discharge heated cooling water from the reactors (USNRC 2006).
Impacts Due to Decreasing Water Availability
11
July 2012: In the midst of one of the worst droughts in American history, certain companies that extract natural gas and oil via hydraulic fracturing faced higher water costs or were denied access to water for 6 weeks or more in several states, including Kansas, Texas, Pennsylvania, and North Dakota (Ellis 2012, Hargreaves 2012, Dittrick 2012).
12 Summer 2012: Drought and low river water depths disrupted the transportation of commodities, such as petroleum and coal, delivered by barges. The U.S. Army Corps of Engineers reported grounding of traffic along the Mississippi River (ASA 2012, EIA 2012f, Cart 2012).
13
Summer 2012: Reduced snowpack in the mountains of the Sierra Nevada and low precipitation levels reduced California’s hydroelectric power generation by 38% compared to the prior summer (CISO 2013).
14
Fall 2011: Due to extreme drought conditions, the city of Grand Prairie, Texas, became the first municipality to ban the use of city water for hydraulic fracturing. Other local water districts in Texas followed suit by implementing similar restrictions limiting city water use during drought conditions (Lee 2011).

U.S. ENERGY SECTOR VULNERABILITIES TO CLIMATE CHANGE AND EXTREME WEATHER
3
Figure 1. Selected events over the last decade illustrate the U.S. energy sector's vulnerabilities to climatic conditions (continued)
15
Summer 2010: Below-normal precipitation and streamflows in the Columbia River basin resulted in insufficient hydropower generation to fulfill load obligations for the Bonneville Power Administration. As a result, BPA experienced a net loss of $164 million in fiscal year 2010, which occurred largely due to low water volumes (BPA 2010).
16
2010: The Arizona Corporation Commission ruled that Hualapai Valley Solar LLC would have to use dry cooling or treated wastewater rather than groundwater as a condition of its certificate of environmental compatibility for a proposed 340 MW solar power plant in Mohave County, Arizona, due to concerns about the effects of the power plant on water availability from the Hualapai Valley aquifer (Adams 2010).
17
September 2010: Water levels in Nevada’s Lake Mead dropped to levels not seen since 1956, prompting the Bureau of Reclamation to reduce Hoover Dam’s generating capacity by 23%. As water levels continued to drop, dam operators were concerned that reductions in generating capacity would destabilize energy markets in the Southwest (Quinlan 2010, Walton 2010, Barringer 2010).
18
2009: NV Energy abandoned a proposed plan for a 1,500 MW coal-fired power plant (Ely Energy Center) that would have used more than 7.1 million gallons of water per hour, which raised concerns among local residents and environmental groups (BLM 2009, Woodall 2009).
19
2007: Severe drought in the Southeast caused the Chattahoochee River, which supports more than 10,000 MW of power generation, to drop to one-fifth of its normal flow. Overall, hydroelectric power generation in the Southeast declined by 45% (Ackerman et al. 2008, Bigg 2007).
20
2006: Power production of the North Platte Project (a series of hydropower plants along the North Platte River) was reduced by about half as a result of multi-year drought (Cooley et al. 2011).
Impacts Due to Increasing Storms, Flooding, and Sea Level Rise
21
February 2013: Over 660,000 customers lost power across eight states in the Northeast affected by a winter storm bringing snow, heavy winds, and coastal flooding to the region and resulting in significant damage to the electric transmission system (DOE 2013c).
22
October 2012: Ports and power plants in the Northeast, as well as oil refineries, fuel pipelines, and petroleum terminals, were either damaged or experienced shutdowns as a result of Hurricane Sandy. More than 8 million customers lost power in 21 affected states (DOE 2012a).
23
August 2012: Oil production in the U.S. Gulf of Mexico declined and coastal refineries shut down in anticipation of Hurricane Isaac. Although the closures were precautionary, offshore oil output was reduced by more than 13 million barrels over an 18-day period, and offshore Gulf natural gas output was curtailed by 28 billion cubic feet (BSEE 2012a).
24
June 2012: Almost three million people and businesses lost power due to the complexes of thunderstorms coupled with strong winds, also known as a derecho, that swept across the Midwest to the Mid-Atlantic coast on June 29, 2012. In addition, damage to water filtration facilities in Maryland caused the imposition of water restrictions (NOAA 2012d, NOAA 2012e).
25
Summer 2011: Severe drought and record wildfires in Arizona and New Mexico burned more than one million acres and threatened the U.S. Department of Energy’s Los Alamos National Laboratory as well as two high voltage lines transmitting electricity from Arizona to approximately 400,000 customers in New Mexico and Texas (NOAA 2012k, AP 2011a, AP 2011b).
26 July 2011: ExxonMobil’s Silvertip pipeline, buried beneath the Yellowstone River in Montana, was torn apart by flood-caused debris, spilling oil into the river and disrupting crude oil transport in the region. The property damage cost was $135 million (DOT 2012).
27
June 2011: Missouri River floodwaters surrounded Fort Calhoun Nuclear Power plant in Nebraska. The nuclear reactor had been shut down in April 2011 for scheduled refueling, but the plant remained closed during the summer due to persistent flood waters (USNRC 2011).
28 May 2011: Nearly 20% of barge terminals along the Ohio River were closed due to flooding, impacting coal and petroleum transport. Flooding along the Ohio and Mississippi rivers also threatened oil refineries and infrastructure from Tennessee to Louisiana (Reuters 2011, EIA 2011c).
29
2005: Hurricanes Katrina and Rita inflicted significant damage on the Gulf Coast, destroying 115 offshore platforms and damaging 52 others, damaging 535 pipeline segments, and causing a near-total shutdown of the Gulf’s offshore oil and gas production for several weeks. Nine months after the hurricanes, 22% of oil production and 13% of gas production remained shut-in, equating to the loss of 150 million barrels of oil and 730 billion cubic feet of gas from domestic supplies (BSEE 2012b).
30
September 2004: Hurricane Jeanne shut down several power plants and damaged power lines, resulting in nearly 2.6 million customers losing electrical service in northeast, central, and southwest Florida. Accompanying hot and humid weather forced voluntary, pre-arranged load control programs for customers to reduce power consumption during peak usage (NEI 2012, DOE 2004).

U.S. ENERGY SECTOR VULNERABILITIES TO CLIMATE CHANGE AND EXTREME WEATHER
4
Continuing to accurately assess and address both acute and chronic vulnerabilities in the energy sector will help to ensure access to reliable electricity and fuels, a cornerstone of economic growth and energy security. This report reviews available information about climate trends, examines how these changes could affect the U.S. energy sector (Figure 2), identifies current response actions, and considers opportunities for building a more resilient energy sector. The crosscutting nature of the issues discussed herein may illuminate opportunities for improvement and for collaboration across government agencies, state and local planning authorities, universities, and the private sector, among others.
Figure 2. Climate change implications for the energy sector
This report is part of a broader Department of Energy (DOE) response supporting the Administration initiative on climate change adaptation planning.1 It provides a summary of relevant information from scientific and peer-reviewed literature, provides illustrative examples from government and private sector sources, and incorporates input from a DOE-supported July 2012 workshop conducted by the Atlantic Council.2
This report also builds upon DOE efforts in support of the U.S. National Climate Assessment (NCA), conducted
1 Interagency Climate Change Adaptation Task Force,
http://www.whitehouse.gov/administration/eop/ceq/ initiatives/adaptation
2 Atlantic Council Workshop agenda and presentations, http://www.acus.org/event/climate-change-and-extreme-weather-vulnerability-assessment-us-energy-sector
under the auspices of the Global Change Research Act of 1990. The NCA provides an analysis of the effects of global change on the natural environment, agriculture, energy production and use, land and water resources, transportation, human health and welfare, human social systems, and biological diversity; analyzes current trends in global change, both human-induced and natural; and projects major trends for the next 25 to 100 years. The second NCA report was released in 2009 (USGCRP 2009). The third NCA report is expected to be issued in 2014, and its energy-related chapters build upon technical input from DOE’s Office of Science (ORNL 2012a, PNNL 2012).3
Although this report focuses on the U.S. energy sector, it is likely that most countries, including those from which the United States imports electricity and fuels, will face similar impacts, which may in turn impact U.S. energy security. This reality reinforces the importance of continued research, development, demonstration, and deployment of energy technologies that both mitigate climate change (minimize the magnitude of climate change) and improve adaptation and resilience to climate change. Effective adaptation strategies, including the development and deployment of climate-resilient energy technologies, will facilitate not only a resilient energy system in the United States, but also a more globally resilient energy system to which the United States is inherently linked. Such strategies will also create opportunities in the United States to bring new technologies into the global marketplace.
Regional Variation in Impacts Climate change impacts are projected to vary regionally. For example, annual precipitation is generally expected to increase across the northern United States but decline in the southern states (NOAA 2013b, USGCRP 2009). Fuels production and processing may be most affected in the Gulf of Mexico and along the coasts, due to an increase in the intensity of storm events and relative sea level rise. Vulnerabilities faced by any given stakeholder, whether a utility, oil or gas developer, project financier, insurer, or energy consumer, may result from differences in the regional energy supply mix (e.g., use of hydropower, solar and wind resources, coal, or nuclear), energy demand (e.g., heating and cooling), water availability and uses, and climate change impacts. However, regional variation does not imply regional isolation. As energy systems have become increasingly interconnected, impacts that occur on a local or regional level often have broader implications. For example, climate impacts that affect resource
3 A draft of the third is NCA available at:
http://ncadac.globalchange.gov

U.S. ENERGY SECTOR VULNERABILITIES TO CLIMATE CHANGE AND EXTREME WEATHER
5
availability in one region may put pressure on the electric grid elsewhere to compensate for those changes.
Compounding Factors and Interdependencies This report characterizes the impact of climate change and extreme weather on the energy system by examining the following potential climate impacts: increasing temperatures, decreasing water availability, increasing frequency and intensity of storms and flooding, and sea level rise. However, these effects will likely not occur individually, and they may exhibit compounding effects. In addition, compounding factors and interdependencies within and across the energy sector and other sectors must be better understood to effectively assess the overall impacts on the energy system.
For example, higher ambient air temperatures can increase water temperatures, with both contributing to a reduction in electricity supply and increases in electricity demand. In addition, as air temperatures increase, transmission systems carry less current and operate less efficiently. Such simultaneous effects occurring within an interrelated system can compound vulnerabilities. Due to the complexity of these interactions, this report focuses primarily on how climate change affects individual energy system components (i.e., oil and gas exploration, fuel transport, thermoelectric power generation, renewable energy resources, electric grid, and energy demand). However, understanding the compounding conditions and the aggregate vulnerabilities of the energy sector are critical areas for continued research and scientific investigation.
The energy impacts of recent hurricanes, including Sandy, Rita, and Katrina, illustrate this interdependency among energy system components. For example, electric power outages affecting gas station pumps in the aftermath of Hurricane Sandy limited gasoline available to customers. Similar impacts occurred in association with electricity supply and the operations of oil and gas refineries and pipeline distribution. Thus, disruptions of services in one energy sector (electricity supply, transmission, and distribution) may result in disruptions in one or more other sectors (petroleum production and distribution), potentially leading to cascading system failures.
In addition to interdependencies across energy sector components, the issue of interdependency is also relevant between the energy sector and other sectors. Table 1 illustrates linkages between the energy, water, and land systems, which are discussed in a recent technical report developed by DOE in support of the National Climate Assessment (PNNL 2012). For example, water pumping, transport, treatment, and conditioning require energy, while energy production requires water for extraction,
cooling, processing, and the future deployment of carbon capture and storage (CCS).
National estimates indicate that moving and treating water represents nearly 4% of total electricity consumption in the United States (EPRI 2002), and when end uses of water are considered, approximately 13% of total primary energy consumption in the United States results from water use (Sanders and Webber 2012). Another example of this interdependency is the increase in the use of water for agriculture, which can simultaneously impact energy demand (e.g., increased energy required to extract and transport water for irrigation) and energy production (e.g., less cooling water available for thermoelectric generation).
Table 1. Nexus of energy, water, and land systems
Resource system interaction Illustrative components involved
Water needed for energy
Energy resource extraction Fuel processing Thermal power plant cooling Carbon capture and storage (CCS)
Water needed for land
Agriculture Industrial, municipal, commercial, and residential uses Natural ecosystems
Energy needed for water
Water extraction Water transport Water treatment
Energy needed for land
Resource extraction and conversion Agriculture Transportation Industrial, municipal, commercial, and residential uses
Land needed for energy
Energy resource extraction Energy infrastructure, including dams/reservoirs, mines/wells, power plants, solar and wind farms, power lines, pipelines, and refineries Bioenergy cropland CCS
Land needed for water
Water capture and watershed Ground cover vegetation
Source: Adapted from PNNL 2012 Interdependencies also link the energy sector to other sectors, such as transportation and communications. The transportation sector requires energy for motive power, and the energy sector relies on transportation to provide the necessary coal, oil, and natural gas resources to operate. The communications sector requires electricity to operate, and the energy sector increasingly requires communication systems to monitor and manage the electric grid.

U.S. ENERGY SECTOR VULNERABILITIES TO CLIMATE CHANGE AND EXTREME WEATHER
6
Compounding conditions that create new vulnerabilities may also emerge in coming decades. For example, combinations of persistent drought, extreme heat events, and wildfire may create short-term peaks in demand and diminish system flexibility and supply, which could limit the ability to respond to that demand. Compounding factors may be important for climate preparedness from both a local perspective as well as a regional or national perspective focused on overall system resilience. They will be critical to both assessing the economic rationale for action and designing specific response strategies.
Thresholds and Tipping Points When assessing, forecasting, and responding to potential impacts of climate change and extreme weather on the energy sector, consideration is needed not only for predictable gradual changes but also for lower probability, higher warming scenarios with potentially more severe impacts. Lower probability, higher impact scenarios may be characterized by thresholds or points beyond which there are irreversible changes or changes of higher magnitudes than expected based on previous experience. These “tipping points” are hard to predict and have many uncertainties due to a number of factors, such as insufficient data, models that are not yet able to represent the interactions and interdependencies of multiple stresses, and incomplete understanding of physical climate mechanisms related to tipping points (USGCRP 2009).
Response Optimization Optimal public and private responses to climate variability and climate change will depend on many factors, including the attributes of individual technologies, energy supply mix, nature and duration of the impact, the evaluation of risk associated with potential tipping points or low probability/high consequence events, availability of climate-resilient energy technologies or political acceptance of policies (including land use policies) to reduce the impact, and the costs of various adaptation response strategies.
Although the energy sector is already responding to climate change in some ways—such as assessing vulnerabilities and adaptation planning efforts, and deploying climate-resilient energy technologies—existing barriers may limit more widespread action. These include:
• Limited understanding of vulnerabilities based on their probability and significance
• Lack of robust economic assessments of alternative adaptation options
• Absence of a comprehensive suite of affordable climate-resilient technologies
• Lack of a policy framework or adequate market signals for investments in resilience
• Varying purviews, control, and perceptions of risk that limit the influence of key stakeholders
Continued investments are required to promote energy security in the face of a changing climate. Physical investment in new technologies and approaches is necessary, as is enhanced information, stakeholder engagement, and enabling frameworks. The latter include improved data, models, and vulnerability assessments; greater outreach and collaboration to facilitate communication and education; and forward-looking innovation and deployment policies and strategies, which may be federal or non-federal.
Report Snapshot The first three chapters of this report examine the potential impacts of climate change on the U.S. energy sector, focusing on increasing temperatures (Chapter 1), decreasing water availability (Chapter 2), and increasing storms, flooding, and sea level rise (Chapter 3). Table 2 maps specific climate trends to potential energy sector impacts discussed in these chapters. Chapter 4 highlights a subset of current adaptation activities and identifies opportunities that could enhance the preparedness and resilience of the energy system.
Hurricane Sandy: A Recent Example of Interdependencies across the Energy Sector Hurricane Sandy illustrates the interdependencies of the petroleum sector and the electric sector. The total storm surge in New York Harbor was approximately nine feet above average high tide (NOAA 2012i, NOAA 2012j), and more than 8 million customers lost power in 21 affected states (DOE 2012a). Utilities reported damage to over 7,000 transformers and 15,200 poles throughout the affected region (DOE 2013a). Fuel pumps at gas stations would not operate due to power outages. The Colonial Pipeline, which brings refined products from the Gulf of Mexico, was not fully operational as a consequence of a power outage even though the infrastructure was not damaged. Two oil refineries with total capacity of more than 300,000 barrels per day were temporarily shut down, and an additional four refineries with a cumulative capacity of 862,000 barrels per day were forced to reduce their output (DOE 2012a). Ports and several power plants in the Northeast, including nuclear power units, petroleum/natural gas refineries and pipelines, and petroleum terminals, were either damaged or experienced temporary shutdowns due to high winds and flooding (DOE 2013a).

U.S. ENERGY SECTOR VULNERABILITIES TO CLIMATE CHANGE AND EXTREME WEATHER
7
Table 2. Report organization and relationship between climate change projections and implications for the energy sector*
Energy sector Climate projection Potential implication Chapter
Oil and gas exploration and production
Thawing permafrost in Arctic Alaska Damaged infrastructure and changes to existing operations 1
Longer sea ice-free season in Arctic Alaska Limited use of ice-based infrastructure; longer drilling season; new shipping routes 1
Decreasing water availability Impacts on drilling, production, and refining 2 Increasing intensity of storm events, sea level
rise, and storm surge Increased risk of physical damage and disruption to
offshore and coastal facilities 3
Fuel transport
Reduction in river levels Disruption of barge transport of crude oil, petroleum products, and coal 2
Increasing intensity and frequency of flooding Disruption of rail and barge transport of crude oil, petroleum products, and coal 3
Thermoelectric power generation (Coal, natural gas, nuclear, geothermal and solar CSP)
Increasing air temperatures Reduction in plant efficiencies and available generation capacity 1
Increasing water temperatures Reduction in plant efficiencies and available generation capacity; increased risk of exceeding thermal discharge limits
1
Decreasing water availability Reduction in available generation capacity; impacts on coal, natural gas, and nuclear fuel supply chains 2
Increasing intensity of storm events, sea level rise, and storm surge
Increased risk of physical damage and disruption to coastal generation facilities 3
Increasing intensity and frequency of flooding Increased risk of physical damage and disruption to inland generation facilities 3
Hydropower
Increasing temperatures and evaporative losses
Reduction in available generation capacity and changes in operations 1
Changes in precipitation and decreasing snowpack
Reduction in available generation capacity and changes in operations 2
Increasing intensity and frequency of flooding Increased risk of physical damage and changes in operations 3
Bioenergy and biofuel production
Increasing air temperatures Increased irrigation demand and risk of crop damage from extreme heat events 1
Extended growing season Increased production 1 Decreasing water availability Decreased production 2 Sea level rise and increasing intensity and
frequency of flooding Increased risk of crop damage 3
Wind energy Variation in wind patterns Uncertain impact on resource potential 1
Solar energy Increasing air temperatures Reduction in potential generation capacity 1 Decreasing water availability Reduction in CSP potential generation capacity 2
Electric grid
Increasing air temperatures Reduction in transmission efficiency and available transmission capacity 1
More frequent and severe wildfires Increased risk of physical damage and decreased transmission capacity 1
Increasing intensity of storm events Increased risk of physical damage 3
Energy demand
Increasing air temperatures Increased electricity demand for cooling; decreased fuel oil and natural gas demand for heating
1
Increasing magnitude and frequency of extreme heat events
Increased peak electricity demand 1
* Where possible, this report attempts to characterize the direction and magnitude of change at the national and regional level, as well as on an annual and seasonal basis. However, given limitations in the available literature, statements about the direction of change do not necessarily imply judgment about the magnitude of change unless explicitly stated.

U.S. ENERGY SECTOR VULNERABILITIES TO CLIMATE CHANGE AND EXTREME WEATHER
8
CHAPTER 1: Increasing Temperatures
Recent Trends and Projections Average temperatures across the United States have increased during the past 100 years, and the rate of warming has increased over the past several decades (NOAA 2013b, WMO 2013, EPA 2012a, USGCRP 2009). Nearly the entire United States has experienced increased average temperatures, with the extent of warming varying by region, as illustrated by Figure 3 (NOAA 2013b, EPA 2012a, USGCRP 2009). The warmest year since record keeping began in 1895 for the contiguous United States was 2012, and the hottest month for the nation was July 2012 (NOAA 2013c). The average annual temperature for 2012 was 55.3°F (12.9°C), which was 3.2°F (1.7°C) above the 20th century average (NOAA 2013c).
Higher average temperatures have been accompanied by the following impacts:
• Heat waves (a period of several days to weeks of abnormally hot weather, often with high humidity) have generally become more frequent and intense across the United States in the decades since 1960 (NOAA 2013b, EPA 2010a, USGCRP 2009, CCSP 2008b). High humidity and very high nighttime temperatures have characterized recent heat waves (USGCRP 2009, CCSP 2008b).
• Wildfire season has increased by nearly 80 days in the past three decades (NIFC 2012). The average duration of large fires has almost quadrupled, from 7.5 days to 37 days (IPCC 2007a), and the size of wildfires has also increased (NOAA 2013c, USGCRP 2009).
• Permafrost has thawed, and Alaskan Arctic sea ice cover has decreased (WMO 2013, NASA 2012, USGCRP 2009). In September 2012, Arctic sea ice cover reached its lowest seasonal minimum extent in the satellite record (i.e., since 1979), reinforcing the long-term trend (NOAA 2013c, NASA 2012).
• The growing season has increased by about two weeks since the beginning of the 20th century (EPA 2012a).
These trends are projected to continue. In the period 2021–2050, average annual temperatures across the United States are projected to increase by approximately 2.5°F (1.4°C) in a lower emissions scenario (B1), and by 2.9°F (1.6°C) in a higher emissions scenario (A2), when compared to the climate of 1971–1999 (NOAA 2013b). By 2070–2099, temperatures are projected to increase by 4.8°F (2.7°C) under a lower emissions scenario (B1) and by 8°F (4.4°C) under a higher emissions scenario (A2) in the United States (NOAA 2013b), and conditions currently characterized as heat waves may become dominant summer conditions (Duffy and Tebaldi 2012). There are seasonal differences in projected warming trends; greater warming is projected in the summer and fall than in the winter and spring for most of the United States (NOAA 2013b, USGCRP 2009).
Figure 3. Rate of warming in the United States by region, 1901–2011 Source: EPA 2012a
Key Messages • Increasing temperatures will likely increase electricity demand for cooling and decrease fuel oil and natural gas demand for heating. • Thawing permafrost could damage oil and gas infrastructure and force changes to existing operations in Arctic Alaska, while decreasing sea
ice could generate benefits for oil and gas exploration and production in Arctic Alaska. • Increasing temperatures reduce transmission system efficiency and could decrease available transmission capacity, while more frequent and
severe wildfires also increase the risk of physical damage to transmission infrastructure. • Increasing air and water temperatures reduce the efficiency of thermoelectric power generation and could decrease available generation
capacity.

U.S. ENERGY SECTOR VULNERABILITIES TO CLIMATE CHANGE AND EXTREME WEATHER
9
Warmer temperatures are also expected to contribute to the following climate trends (see Appendix for additional details): • Increase in frequency and intensity of heat waves
(NOAA 2013b, Duffy and Tebaldi 2012) • Increased frequency, intensity, and total acreage
affected by wildfires in some parts of the United States, particularly Alaska and parts of the West (USGCRP 2009, Spracklen et al. 2009)
• Decreased average extent of sea ice in the Arctic by about 15% for every 2°F (1.1°C) of warming (EPA 2012b), with the possible disappearance of summer sea ice by the end of the century (Stroeve et al. 2012, Kay et al. 2011, Wang and Overland 2009, IPCC 2007d)
• Longer growing season throughout the United States (NOAA 2013b, USGCRP 2009)
Implications for the Energy Sector Increasing temperatures can affect key aspects of the energy supply chain. Higher temperatures that thaw permafrost can disrupt onshore oil and gas operations in Arctic Alaska. Higher temperatures also create a longer sea ice-free season in the Arctic, which can limit ice-based infrastructure but allows a longer season for drilling. Increases in ambient air and water temperatures across the United States reduce thermal efficiencies of electricity generation from nuclear, coal, natural gas, concentrating solar power (CSP), bioenergy, and geothermal facilities, which can reduce available capacity and increase fuel consumption by power plants. Higher temperatures reduce the current carrying capacity and decrease the transmission efficiency of electricity lines. Finally, electricity demand for cooling increases when temperatures are higher, while demand for heating decreases.
Oil and Gas Exploration and Production Oil and gas in Arctic Alaska are important sources of energy and are particularly vulnerable to climate change because temperatures in the Arctic are increasing twice as fast as the global average (IPCC 2007b). The region contains an estimated 90 billion barrels of oil, 1,669 trillion cubic feet of natural gas, and 44 billion barrels of natural gas liquids, which amount
to approximately 22% of the world’s undiscovered oil and gas resources (Harsem et al. 2011, USGS 2008). Both onshore and offshore exploration and production have been, and are projected to continue to be, affected by increasing temperatures, as permafrost thaws and sea ice continues to melt (Burkett 2011, SPE 2010).
Thawing permafrost could damage oil and gas infrastructure and force changes to existing operations in Arctic Alaska. As permafrost thaws, the tundra loses its weight-bearing capabilities. Risks to onshore fossil fuel development could include the loss of access roads built on permafrost, loss of the opportunity to establish new roads, problems due to frost heave and settlement of pipelines set on pilings or buried in permafrost, and reduced load-bearing capacity of buildings and structures (Burkett 2011, ADEC 2010). The trans-Alaska oil pipeline was constructed with thousands of thermosyphons, or pipes that remove heat from permafrost, which may now be having problems caused by increasing temperatures (Larsen et al. 2008). In addition, drilling wastes are typically disposed of using in-ground sumps that rely on the permafrost to prevent subsurface movement of the wastes into the surrounding environment; thawing permafrost could require modifications to this practice or the adoption of alternative waste disposal methods. To protect the tundra, the Alaska Department of Natural Resources limits the amount of travel on the tundra, and over the past 30 years, the number of days when travel is permitted has dropped from more than 200 to 100, thereby reducing by half the number of days that oil and gas exploration and extraction equipment can be used (ADEC 2010, USGCRP 2009, ADNR 2004).
Decreasing sea ice could create other challenges for offshore oil and gas development in Arctic Alaska. The extent and thickness of Arctic sea ice has decreased by an average of 2.7% per decade, and by more than 7% per decade in the summer, according to satellite data going back to 1978 (IPCC 2007a). Reduced sea ice coverage could trigger new environmental regulations and protections for Arctic mammals, which may limit development opportunities (Burkett 2011). Reduced sea ice coverage limits ice-based infrastructure and transportation (Burkett 2011, SPE 2010). Sea ice melting can also result in more icebergs, which may pose a risk to oil and gas operations in the Arctic because increased sea ice movement could interrupt
In addition to the thawing of permafrost, other risks could increase, including lightning strikes, tundra fire, storm surge, and coastal erosion (SPE 2010).
Photo source: SPE 2010
The effects from climate change could add $3.6 to $6.1 billion (in 2006 dollars) to Alaska public infrastructure costs through 2030 (Larsen et al. 2008).
Photo source: NETL 2013

U.S. ENERGY SECTOR VULNERABILITIES TO CLIMATE CHANGE AND EXTREME WEATHER
10
drilling and damage rigs and vessels (Harsem et al. 2011). Climate change may increase the frequency of polar storms in the years to come, further disrupting drilling, production, and transportation (Harsem et al. 2011).
Decreasing sea ice could generate benefits for offshore oil and gas exploration and production in Arctic Alaska. A longer sea ice-free season creates a longer exploration, production, and drilling season and may increase the rate at which new oil and gas fields are discovered (Burkett 2011, Harsem et al. 2011, ADEC 2010). Warmer temperatures could open new shipping routes through the Northwest and Northeast Passages and expand the spatial extent of Arctic exploration (Burkett 2011, SPE 2010), a particularly noteworthy opportunity if the Alaskan and Canadian coastal shelf becomes permanently ice-free (Burkett 2011). The Arctic Climate Impact Assessment estimated that a reduction in Arctic sea ice could result in 90–100 navigable days per year by 2080, compared to the current 20–30 days per year, which would expand resource accessibility from sea routes (AMAP 2004).
The combination of risks posed by warming and the opportunities gained through increased access to offshore resources makes it unclear whether oil and gas development in Arctic Alaska will be improved or hindered as temperatures rise.
Thermoelectric Power Generation Increases in ambient air and water temperatures are projected to reduce the thermal efficiencies of thermoelectric power plants. Reduced thermal efficiencies can result in reduced power output and additional fuel consumption. Because almost 90% of the electricity generated in the United States comes from thermoelectric power (EIA 2012a, EIA 2012b), such decreases in power output or increases in fuel consumption will hinder system flexibility or increase costs across the United States.
Increasing air and water temperatures reduce the efficiency of thermoelectric power generation and could reduce available generation capacity. Natural gas, coal, nuclear, CSP, bioenergy, and geothermal power plants are all affected by elevated air temperatures. Warmer air and heat waves can increase ambient cooling water temperatures, which affects generation efficiency regardless of fuel source (NETL 2010c). For thermoelectric power plants, heat is used to produce high-pressure steam, which is expanded over a turbine to produce electricity. The driving force for the process is the phase change of the steam to a liquid following the turbine, from which arises the demand for cooling water. A vacuum is created in the condensation process that draws the steam over the turbine. This low pressure is critical to the thermodynamic efficiency of the process. Increased backpressure will lower the efficiency of
the generation process. Increases in ambient air temperatures and cooling water temperatures will increase steam condensate temperatures and turbine backpressure, reducing power generation efficiency (NETL 2010c).
The magnitude of the impact from increasing air and water temperatures on specific power plants will vary based on a number of plant- and site-specific factors. For example, the power output of natural gas-fired combustion turbines (often used for peaking) is estimated to decrease by approximately 0.6%–0.7% for a 1.8°F (1°C) increase in air temperature (Davcock et al. 2004). For combined cycle power plants, output can decrease by approximately 0.3%–0.5% for 1.8°F (1°C) increase in air temperature (Maulbetsch and DiFilippo 2006). Plant output losses for combined cycle plants with dry cooling may be more sensitive to warmer air temperatures, with reductions in plant output of approximately 0.7% for a 1.8°F (1°C) increase in air temperature. For nuclear power plants, output losses are estimated to be approximately 0.5% for a 1.8°F (1°C) increase in air temperature (Linnerud et al. 2011, Durmayaz and Sogut 2006).
While these studies project relatively small changes in percentage terms, when extended over the nation they could have significant impacts on net electricity supplies, if such losses in available capacity are not compensated by reduced demand or greater supplies elsewhere in the system when they are needed (CCSP 2007a).
When projected increases in air and water temperatures associated with climate change are combined with changes to water availability (discussed in Chapter 2), electric generation capacity during the summer months may be significantly reduced. For example, the average summer capacity at thermoelectric power plants by mid-century (2031–2060) is projected to decrease by between 4.4% and 16%, depending on climate scenario, water availability, and cooling system type, as compared to the end of the 20th century (van Vliet et al. 2012).
Increasing water temperatures pose other risks to thermoelectric power plants and could reduce available generation capacity. Increasing water temperatures put power plants at risk of exceeding thermal discharge limits established to protect aquatic ecosystems and incurring financial penalties or forcing temporary curtailments (PNNL 2012). For example, during the heat waves that hit the Southeast in 2007, 2010, and 2011, the temperature of the Tennessee River exceeded 90°F (32.2°C); these increased water temperatures forced curtailments at once-through cooling facilities along the river, such as the Browns Ferry Nuclear Plant, where cooling water discharge would have exceeded the thermal limit (PNNL 2012). During the 2007 heat wave, Duke Energy was forced to curtail operations at two coal-fired power plants (Beshears 2007). In 2012, several

U.S. ENERGY SECTOR VULNERABILITIES TO CLIMATE CHANGE AND EXTREME WEATHER
11
power plants across the country temporarily shut down or obtained special exemptions from their operating permits to exceed thermal discharge limits (see Figure 1).
Even if an individual power plant could safely continue to discharge its cooling water, the cumulative effect of multiple plants discharging high-temperature waters into a receiving body with already elevated temperatures may result in violation of environmental regulations. For example, multiple plants in the Ohio River Basin share the same water body. As this watershed becomes warmer, the cumulative impact of the energy system as a whole will likely need to be considered, not just the impact of an individual plant (ORNL 2012a).
In addition to the regulatory limits on thermal discharges from once-through cooling for power plants, several other factors influence the vulnerability of these power plants to higher water temperatures. These factors include the location of the water intake (depth and distance from shore), the location of the outlet, the fluid velocities of the inlet and outlet, screening mechanisms, measures to reduce bio-fouling on heat-exchanger surfaces, turbulence and pressure changes within the heat exchangers, and natural temperature distributions within the water column. For example, Unit 2 at the Millstone Nuclear Power Station was shut down in August 2012 after temperatures in Long Island Sound exceeded the maximum temperature at which the nuclear power plant is permitted to extract cooling water (Wald 2012a). However, Unit 3, which pulls water from deeper and cooler waters in the sound, continued to operate (Eaton 2012).
Renewable Energy Resources In recent years, renewable electricity generation capacity in the United States has increased considerably. Despite the relatively small share of non-hydroelectric renewable sources in the current electricity generation portfolio (approximately 4%, NREL 2012), about 30 states, including those with large energy markets such as California, have established renewable portfolio standards and other policies that will encourage higher penetration of these technologies in the future.4
4 Renewable energy contributed about 10% of total U.S.
electricity generation in 2010: 6.4% from hydropower, 2.4% from wind energy, 0.7% from biopower, 0.4% from geothermal energy, and 0.05% from solar energy (NREL 2012).
Wind capacity increased from 2.6 gigawatts (GW) in 2000 to approximately 60 GW in 2012, while solar capacity has also begun to grow rapidly (FERC 2013). The potential impact of climate change will vary across renewable energy technologies and regions.
Hydropower
Increasing temperatures could affect the operation of hydropower facilities and decrease available generation capacity in some regions. Increasing temperatures will increase evaporative water losses and consumptive water use in upstream watersheds, decreasing water availability for hydropower and the operational flexibility of hydropower projects (CCSP 2007a). Increasing air and water temperatures may intensify stratification of some reservoirs behind dams and deplete dissolved oxygen both in the reservoirs and downstream, which may degrade habitat for fish and other wildlife. Such water quality changes can affect growth, reproduction, migration, and survival of aquatic fauna and may cause changes in community structure and biodiversity (McCullough et al. 2009, Jager et al. 1999). This may impel regulatory limits on hydropower flow releases to mitigate adverse ecological effects of water quality fluctuations (Bevelhimer et al. 1997, FERC 1996). These limits can reduce the peak generation capacity of hydropower facilities and diminish the ability of hydropower facilities to respond quickly to electric system demands.
Bioenergy and Biofuel Production
A longer growing season could increase bioenergy production, while increasing temperatures could decrease bioenergy production in some regions. Warmer temperatures lead to a longer growing season and could lead to gained acreage for multiple crops using land that otherwise could not be cultivated effectively. However, the overall effect of warmer temperatures on bioenergy production will vary by location, crop type, soil conditions, and producers’ adaptive responses to the warmer temperatures (such as modifying their crop mix). For some crops and locations, increasing temperatures will increase evapotranspiration (ET) rates, thereby increasing water demand; if increased water demand is not met by increased irrigation (or precipitation), the increased ET rates could reduce average yields. Extreme heat could damage crops, and extended periods of drought could destroy entire yields. Such shortfalls may lead to increased price volatility in associated commodities. A recent study found that impacts from climate change could increase corn price volatility by a factor of more than four over the next three decades (Diffenbaugh et al. 2012). Warmer temperatures and drought can also stress forests and make stands vulnerable to mortality from pest infestations such as the pine beetle, which can reduce bioenergy production and increase fire risk (USGCRP 2009).

U.S. ENERGY SECTOR VULNERABILITIES TO CLIMATE CHANGE AND EXTREME WEATHER
12
Wind Energy
Changes in diurnal and seasonal wind patterns could influence future wind power resource potential as significantly as changes in average annual wind speeds. Projections of wind patterns vary by region, emissions scenario, and climate model. As a result, there is not yet consensus as to how a changing climate will ultimately affect wind resources in the United States. From an energy generation perspective, changes to wind speed and direction are important at a range of temporal scales, from annual averages to changes in diurnal patterns. Average annual wind speeds in the United States could decrease by 1%–3% (Breslow and Sailor 2002) by mid-century, and by as much as 3%–14% at times in the Northwest according to a 2008 study (Sailor et al. 2008).5
Solar Energy
However, a more recent evaluation of several regional climate models suggests that changes in U.S. wind resources through the middle of this century will not exceed changes associated with historic variability (Pryor and Barthelmie 2011).
Increasing temperatures could reduce potential generation capacity of solar PV. Annual and seasonal photovoltaic (PV) output could be affected by increases in ambient air temperature; changes in cloud cover; and changes in haze, humidity, and dust (Omubo-Pepple et al. 2009, Chow et al. 2007). However, limited information has been published on the potential impacts of higher temperatures on solar resources in the United States.
Increasing temperatures decrease the efficiency of PV systems. The extent to which PV efficiencies are affected by temperature depends on the semiconducting material used. Crystalline silicon PV cells are more susceptible to heat-related efficiency losses (Omubo-Pepple et al. 2009, Chow et al. 2007) compared to newer technologies such as thin film PVs, which do not rely on crystalline silicon to produce electricity (Huld et al. 2010). The conversion efficiency of a crystalline silicon PV cell decreases by about 0.08% per 1.8°F (1°C) increase in air temperature when the ambient air temperature is above 77°F (25°C) (Radziemska 2003).
Studies of the potential change in irradiance are not consistent in either direction. Although the magnitude of the change could be as high as 15% or 20% at very high latitudes, the change would be smaller in most regions (Bartok 2010, Cutforth and Judiesch 2007, Pan et al. 2004). One study suggests that solar potential will generally decrease, with the most notable decreases being in the western United States in the fall, winter, and spring (Pan et 5 Wind power is proportional to the cube of wind speed, so it
is important to distinguish quantitative estimates of changes in wind speed from changes in wind power.
al. 2004). In most of the United States, this study projects a trend toward decreased seasonal-mean daily global radiation in the range of 0% to 20% by mid-century (Pan et al. 2004). One study in Europe estimated that a 2% decline in solar radiation paired with a 6.7°F (3.7°C) increase in average ambient temperature could decrease solar panel power output by 6% (Fidje and Martinsen 2006). Understanding how cloud cover changes, including the types of clouds, will be important for understanding future solar resource potential. For example, increases in high thin cirrus clouds that are highly transparent to solar radiation will not have the same impact as lower clouds, such as stratocumulus clouds that are not as transparent and will result in less solar energy reaching the earth’s surface (NASA 2013b).
Electric Grid The U.S. electric grid is a large and complex system that consists of more than 9,200 electric generating units with more than 1,000 GW of generating capacity connected to more than 300,000 miles of transmission lines (DOE 2008a). Increasing temperatures are expected to increase transmission losses, reduce current carrying capacity, increase stresses on the distribution system (ORNL 2012b, CEC 2012, USGCRP 2009), and decrease substation efficiency and lifespan (CEC 2012).
Increasing temperatures reduce transmission system efficiency and could reduce available transmission capacity. Approximately 7% of power is lost in transmission and distribution (EIA 2012j), and these losses increase as temperatures increase. In addition, as temperatures increase, the current carrying capacity of electricity lines decreases. For example, one study of the California power grid projected that during the hot periods of August in 2100, under a higher emissions scenario, a 9°F (5°C) increase in air temperature could decrease transmission line capacity by 7%–8% (Sathaye et al. 2013). The same study projects that 9°F (5°C) warming in 2100 could cause substation capacity to fall by 2%–4% (Sathaye et al. 2013). However, these capacity losses could be reduced by modifying future operating practices and system designs. The effects of high temperatures may be exacerbated when wind speeds are low or nighttime temperatures are high, preventing transmission lines from cooling. This is a particular concern because nighttime temperatures have been increasing at a faster rate than daytime temperatures, and they are projected to continue to increase (CCSP 2008b).
System transmission losses during a heat wave could be significant and contribute to electric power interruptions and power outages. During a 2006 heat wave, electric power transformers failed in Missouri and New York, causing interruptions of the electric power supply (USGCRP 2009). In addition, more than 2,000 distribution

U.S. ENERGY SECTOR VULNERABILITIES TO CLIMATE CHANGE AND EXTREME WEATHER
13
line transformers in California failed during a July 2006 heat wave, causing loss of power to approximately 1.3 million customers (PPIC 2008).
Increasing temperatures can also cause sag of overhead transmission lines due to thermal expansion. A relatively small increase in thermal expansion can produce a significant increase in sag. This initial sag increases with line temperature because the conducting material of which the line is made expands as line temperature increases, effectively lengthening the line (Gupta et al. 2012). This can pose many risks, including fire and safety hazards, and increased chance of power outages due to lines contacting trees or the ground. Replacing or retrofitting transmission lines can be expensive and may include reducing the distance between transmission towers or increasing tower heights (Gupta et al. 2012, Oluwajobi et al. 2012).
More frequent and severe wildfires increase the risk of physical damage to electricity transmission infrastructure and could decrease available transmission capacity. Increasing temperatures and drought could exacerbate the risk of wildfire, which poses a risk to electricity transmission (Figure 4). Wildfires can cause physical damage to wooden transmission line poles, and the associated heat, smoke, and particulate matter can also impact the capacity of a transmission line.
Figure 4. Wildfire disrupting electricity transmission Source: NPS 2013
Soot can accumulate on the insulators that attach transmission lines to towers, causing leakage currents, and ionized air in the smoke could act as a conductor, causing arcing between lines (CEC 2012). Either of these can cause an outage. In addition, fire retardant used in firefighting can foul transmission lines (CEC 2012). The probability of exposure to wildfires for some lines in California is projected to increase by 40% by the end of the century (CEC 2012).
Energy Demand As temperatures increase, energy demand for heating is projected to decrease, while energy demand for cooling is projected to increase (ORNL 2012a, USGCRP 2009, CCSP 2007b). However, the impacts of higher temperatures on net delivered energy and primary energy consumption are uncertain (ORNL 2012a, CCSP 2007b). In addition, as temperatures increase, annual electricity demand for cooling is projected to increase (ORNL 2012a, USGCRP 2009, CCSP 2007b).
Increasing temperatures will likely increase electricity demand for cooling and decrease fuel oil and natural gas demand for heating. Many factors can affect energy demand, including temperature and other weather conditions, population, economic conditions, energy prices, consumer behavior, conservation programs, and the characteristics of energy-using equipment (USGCRP 2009). While the effects of rising temperatures on overall energy demand are difficult to estimate, it is expected that where cooling (largely from electricity) accounts for the largest share of energy use in residential, commercial, and industrial buildings, such as in southern states, increases in cooling will exceed declines in heating (from a combination of natural gas, fuel oil, and electricity), with net energy use in buildings in such regions expected to increase (ORNL 2012a). In contrast, for northern states, where energy demand for heating currently dominates, there could be a net reduction in energy demand (ORNL 2012a). However, climate-induced switching from heating to cooling may contribute to increased primary energy demand even if site energy demand declines, since primary energy demand includes losses in generation, transmission, and distribution that are greater for cooling (ORNL 2012a).
Wildfire Impacts on Electricity Transmission and Distribution In 2007, the California Independent System Operator Corporation (Cal-ISO) declared an emergency when, in two days, one wildfire caused the Southwest Power link transmission system to go out of service, and another fire caused two additional high-voltage transmission lines to trip offline. Cal-ISO asked San Diego Gas and Electric (SDG&E) and Southern California Edison to reduce electric load by a total of 500 MW and also requested voluntary energy conservation in San Diego. Over the course of the week, the fires knocked more than two dozen transmission lines out of service, and only one 230-kilovolt transmission line was serving San Diego. Estimates indicate that more than 1,500 utility poles were burned, more than 35 miles of wire were damaged, and nearly 80,000 SDG&E customers in San Diego lost power (PPIC 2008).
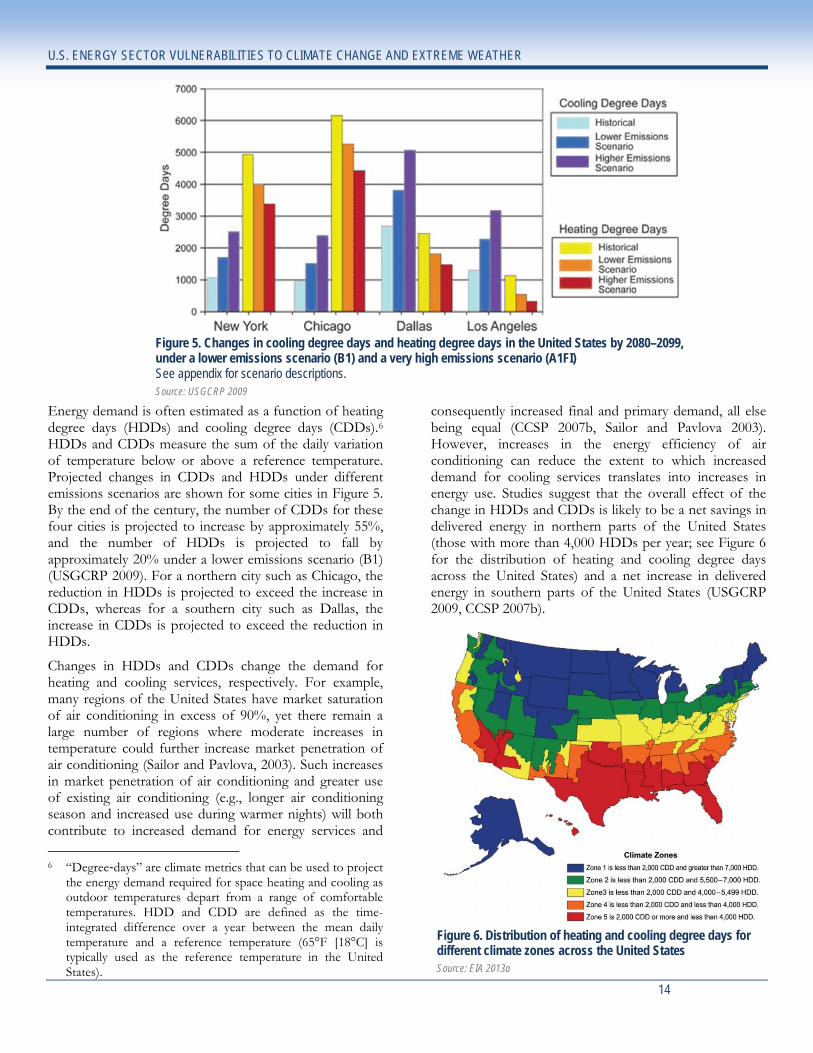
U.S. ENERGY SECTOR VULNERABILITIES TO CLIMATE CHANGE AND EXTREME WEATHER
14
Figure 5. Changes in cooling degree days and heating degree days in the United States by 2080–2099, under a lower emissions scenario (B1) and a very high emissions scenario (A1FI) See appendix for scenario descriptions. Source: USGCRP 2009
Figure 6. Distribution of heating and cooling degree days for different climate zones across the United States Source: EIA 2013a
Energy demand is often estimated as a function of heating degree days (HDDs) and cooling degree days (CDDs).6
Changes in HDDs and CDDs change the demand for heating and cooling services, respectively. For example, many regions of the United States have market saturation of air conditioning in excess of 90%, yet there remain a large number of regions where moderate increases in temperature could further increase market penetration of air conditioning (Sailor and Pavlova, 2003). Such increases in market penetration of air conditioning and greater use of existing air conditioning (e.g., longer air conditioning season and increased use during warmer nights) will both contribute to increased demand for energy services and
HDDs and CDDs measure the sum of the daily variation of temperature below or above a reference temperature. Projected changes in CDDs and HDDs under different emissions scenarios are shown for some cities in Figure 5. By the end of the century, the number of CDDs for these four cities is projected to increase by approximately 55%, and the number of HDDs is projected to fall by approximately 20% under a lower emissions scenario (B1) (USGCRP 2009). For a northern city such as Chicago, the reduction in HDDs is projected to exceed the increase in CDDs, whereas for a southern city such as Dallas, the increase in CDDs is projected to exceed the reduction in HDDs.
6 “Degree‐days” are climate metrics that can be used to project
the energy demand required for space heating and cooling as outdoor temperatures depart from a range of comfortable temperatures. HDD and CDD are defined as the time-integrated difference over a year between the mean daily temperature and a reference temperature (65°F [18°C] is typically used as the reference temperature in the United States).
consequently increased final and primary demand, all else being equal (CCSP 2007b, Sailor and Pavlova 2003). However, increases in the energy efficiency of air conditioning can reduce the extent to which increased demand for cooling services translates into increases in energy use. Studies suggest that the overall effect of the change in HDDs and CDDs is likely to be a net savings in delivered energy in northern parts of the United States (those with more than 4,000 HDDs per year; see Figure 6 for the distribution of heating and cooling degree days across the United States) and a net increase in delivered energy in southern parts of the United States (USGCRP 2009, CCSP 2007b).

U.S. ENERGY SECTOR VULNERABILITIES TO CLIMATE CHANGE AND EXTREME WEATHER
15
After considering the effects on energy demand for heating and cooling separately, few studies have attempted to project the change in net final energy. One recent study projects a net national increase by the end of the century of 11% in residential energy demand under a higher emissions (A1F1) scenario and 4.5°F (2.5°C) of warming (Deschênes and Greenstone 2011). However, it is difficult to accurately assess net change in national final energy demand due to the variety of methodologies used and different assumptions made about climate scenarios, market responsiveness to a given amount of climate change, technology characteristics and improvements, population growth, and other factors (CCSP 2007b).
Even in situations where net final energy demand decreases or remains largely unchanged, primary energy demand may increase with warmer temperatures because electricity generation, transmission, and distribution are subject to significant energy losses, so increases in primary energy for cooling may exceed decreases in primary energy for heating (CCSP 2007b). One study projects that primary energy use will rise 2% under a scenario in which temperatures rise 2.2°F (1.2°C) (CCSP 2007b, Hadley et al. 2006).
Changes in net national energy expenditures also depend on how competing effects from heating and cooling add together. On average, energy used for cooling (largely from electricity) is more expensive to the final consumer than energy used for heating (from a combination of natural gas, fuel oil, and electricity) (DOE 2012d). A 2008 study projects an annual increase in net energy expenditures for residential heating and cooling of about 10% by the end of this century for 4.5°F (2.5°C) of warming, and significantly higher net energy expenditures under a higher warming scenario (Mansur et al. 2008).
Finally, electricity demand is projected to increase since demand for cooling is primarily supplied by electricity, while demand for heating is supplied by a variety of energy sources, including natural gas, heating oil, and electricity (ORNL 2012a, USGCRP 2009, CCSP 2007b). In a scenario in which CDDs increase 20%, the electricity demand for residential air conditioning is projected to increase 20%–60%, whereas total residential electricity
consumption is projected to increase 1%–9% (Sailor and Pavlova 2003). Another study projects that continued warming will increase U.S. electricity demand for air conditioning by 30% in 2030 (Isaac and Vuuren 2009) and by nearly 100% by the end of the century (Isaac and Vuuren 2009). To put this in perspective, in 2011, EIA estimates that approximately 16% of total residential and commercial electricity use was for cooling (EIA 2011d).
Increases in electricity demand will vary regionally and seasonally. Several studies examine changes in residential electricity demand at the state or local level and report a range of projected increases (Hayhoe et al. 2010, CIG 2009, CEC 2009, CIER 2007). In addition to regional variations, studies have also examined seasonal variations on electricity demand. For example, in the Pacific Northwest, the projected change in electricity demand is greater in the summer than the winter. A 3°F (1.6°C) increase in summer temperatures is projected to increase average monthly load by 1,000 MW, whereas a 2°F (1.1°C) increase in winter temperatures is projected to decrease average monthly load by 600 MW (NPCC 2010a). For comparison, the average monthly summer and winter loads for this region were approximately 21,000 MW and 24,000 MW, respectively, in 2007 (NPCC 2010b, NPCC 2010c).
Lastly, population growth is also expected to increase total energy demand, exacerbating the impacts on electricity demand attributed to increasing temperatures alone. For example, excluding impacts of a warming climate and considering an annual population growth rate of 0.9%, the EIA projects that U.S. electricity demand will increase by 22% between 2010 and 2035 (EIA 2012c).
Increasing magnitude, frequency, and duration of extreme heat events will result in higher peak electricity demand in many regions. Higher summer temperatures will increase electricity use, causing higher summer peak loads (USGCRP 2009). A 2008 study indicates that peak electricity demand in California is expected to increase linearly for temperatures above 82°F (28°C) at a rate of approximately 700 MW per 1°F (0.6°C) (Miller et al. 2008). However, some reports indicate that
Additional Investments Due to Climate Impacts One study estimates that 34 GW of additional generating capacity will need to be constructed in the western region alone by 2050 to reliably meet the increased peak load due to projected increasing temperatures solely from climate change (excluding capacity additions due to population changes). The costs of new generation—largely assumed to be new fossil generation—are estimated to be $45 billion (in 2005 dollars): the capital investment cost to build the additional capacity is projected to be about $8.9 billion, and the net present value for additional fuel and operating and maintenance costs is about $36 billion (ANL 2008).
Changes in Net Energy Expenditures Net energy expenditures on residential and commercial heating and cooling are projected to increase by a cumulative total of $6.1–$14.8 billion (2001 U.S. dollars) depending on the temperature change scenario in a study of the 22-year period ending in 2025 (Hadley et al. 2006). Long term net energy expenditures are estimated to be substantially greater, with residential and commercial heating and cooling projected to increase by $26–$57 billion per year (1990 U.S. dollars) by 2100 depending upon the emissions scenario (Mansur et al. 2008).

U.S. ENERGY SECTOR VULNERABILITIES TO CLIMATE CHANGE AND EXTREME WEATHER
16
average demand increases non-linearly as temperature increases (Pryor and Barthelmie 2010, Sailor 2001).
Projected increases in peak electricity demand vary depending on the models and emissions scenarios used. In California, for example, although projections vary, there are clear trends across several studies that show increased peak electricity demand of less than 5% in the near term (prior to mid-century) and close to 20% by the end of the century (Sathaye et al. 2013, CEC 2012, Miller et al. 2008, CCCC 2006). Without considering population growth, peak demand in California is projected to increase above the baseline period (1961–1990) by 1% to more than 4% by 2034 depending on the climate model and warming scenario (CCCC 2006). By mid-century, peak demand is projected to increase by 2.8%–7.7% under a lower emissions scenario (B1) and by 3.4%–10.0% under higher emissions scenarios (A2 and A1FI) (Miller et al. 2008, CCCC 2006).
Evaluation of the future effects of extreme high temperatures on electricity demand in California, assuming no growth in generation capacity or population, reveals a potential for electricity deficits of as high as 17% during extreme heat events (Miller et al. 2008). The number of days of extreme high temperatures7
7 Days in the summer whose daily maximum temperature is
hotter than 90% of summer days in the period 1961–1990
in California is projected to double by 2035–2064 as compared to 1961–1990. By the end of the century, the number of days of extreme high temperatures is projected to increase an average of 4 times (B1), 5.5 times (A2), and 6.5 times (A1F1), depending on the emissions scenario (Miller et al. 2008). In addition, all scenario combinations indicate an increase in region-wide extreme temperature conditions of a severity associated with electricity shortages under the current configuration of the electric power system and patterns of demand (Miller et. al 2008).
In general, the increased frequency of days with extreme heat is not the only factor contributing to peak demand. Increased population levels and economic growth will lead to increased electricity demand and could further increase the need for generation capacity (Miller et al. 2008). In contrast, technology advances such as improvements in air conditioning efficiency could help reduce the projected increases in electricity demand.
In addition, because air conditioning use is greatest during the same periods of extremely high temperatures that can lead to transmission losses and reduced thermal efficiencies at electric generation facilities, increased cooling demand may increase the occurrence of peak loads coinciding with periods when generation efficiencies are lowest. Average peak capacity losses in California are projected to be 1.7%–2.7% under a lower emissions scenario (B1) and 2.0%–4.6% under a higher emissions scenario (A2) by the end of the century (Sathaye et al. 2013). Other studies suggest that, as a result of increasing temperatures, peak demand could increase by 10%–21% (Sathaye et al. 2013, CEC 2012, CCCC 2006) and up to 25% when generation losses from higher temperatures are included (Sathaye et al. 2013, CEC 2012).
Extreme Heat Events and Wholesale Electricity Prices A sustained period of high temperatures across Texas in 2011 created sharp increases in wholesale electricity prices. In one instance, the 15-minute real-time price averaged $45/MWh in the morning but increased to $1,937/MWh in the afternoon during peak demand (EIA 2011b).

U.S. ENERGY SECTOR VULNERABILITIES TO CLIMATE CHANGE AND EXTREME WEATHER
17
CHAPTER 2: Decreasing Water Availability
Recent Trends and Projections Increasing global temperatures and shifting precipitation patterns are causing regional and seasonal changes to the water cycle (NOAA 2013b, WMO 2013, IPCC 2012, USGCRP 2009). Since 1901, total annual precipitation in the contiguous United States has increased at a rate of about 5.9% per century (EPA 2012a), although some regions, such as the Southeast, Southwest, and Rocky Mountain states, have experienced a decrease in precipitation. Across the country, changing precipitation patterns are affecting water availability (Table 3).
Overall, more annual precipitation is projected for the northern United States, while less precipitation is projected for the southern United States (NOAA 2013b, IPCC 2007a). However, precipitation is expected to vary
seasonally, which is most relevant for understanding regional water availability and competing needs (Figure 7). In particular, the largest declines in precipitation are expected during the summer months (NOAA 2013b, IPCC 2007a).
Figure 7. Projected changes in precipitation by season Projected percent change in seasonal precipitation for 2041–2070 compared to 1971–2000, under an A2 emissions scenario. Source: NOAA 2013b
The fraction of precipitation falling as rain has increased over the last 50 years in many parts of the United States (USGCRP 2009). In western states, the amount of winter precipitation and fraction of that precipitation falling as rain rather than snow affects total snowpack—a natural reservoir and therefore an important component of the water cycle. From 1950 to 2000, snow water equivalent declined for most of the western states, with losses at some measurement sites exceeding 75% (EPA 2010a). Snowmelt has occurred earlier in the season, resulting in peak runoff occurring up to 20 days earlier in the western states and up to 14 days earlier in the northeastern states (USGCRP 2009).
Table 3. Climate indicators that affect water availability
Climate indicator
Projected change Geographic coverage
Annual precipitation
Increasing Northern United States Decreasing Southern United States
Summer precipitation Decreasing United States
Proportion of precipitation falling as snow
Decreasing Northeast, Northwest, and high elevations across the United States
Mountain snow water equivalent Decreasing Western United States
Peak streamflow Occurring earlier
Western and Northeast United States
Annual runoff and streamflow
Increasing Midwest and Northeast Decreasing Southwest
Duration, frequency, and intensity of droughts
Increasing Southern United States
Note: See Figure 36 for illustration of these geographic regions. Source: Adapted from NOAA 2013b, USGCRP 2009
Key Messages • Decreasing water availability for cooling at thermoelectric facilities could reduce available generation capacity and deployment of carbon
capture and storage (CCS) technologies. • Decreasing water availability could impact oil and gas production, particularly in times of drought. • Reductions in river levels could impede barge transport of crude oil, petroleum products, and coal, resulting in delivery delays and increased
costs. • Changes in precipitation and decreasing snowpack could decrease available hydropower generation capacity and affect the operation of
facilities in some regions. • Decreasing water availability could decrease bioenergy production in some regions.

U.S. ENERGY SECTOR VULNERABILITIES TO CLIMATE CHANGE AND EXTREME WEATHER
18
In the future, more precipitation is expected to fall as rain rather than snow, particularly in the northern states and mountain regions (USGCRP 2009). As a result, and because of warmer temperatures affecting snowpack, runoff is projected to begin earlier in the spring, particularly in the West and the Northeast (USGCRP 2009). Streamflows are generally expected to decrease in the summer for most regions. Annual streamflows are likely to increase in the Northeast and Midwest and decrease in the Southwest (USGCRP 2009, IPCC 2007a).
Drought conditions—extended periods between precipitation events that can be exacerbated by high evaporation rates and below-average snowpack—have become more common and widespread over the past 40 years in the Southwest, southern Great Plains, and Southeast (USGCRP 2009, CCSP 2008b). At its peak in July, the drought of 2012 covered more than 60% of the nation, with the Mountain West, Great Plains, and Midwest experiencing the most intense drought conditions. In the Southwest and Southeast, longer periods of time between rainfall events will likely increase the total area affected by droughts (USGCRP 2009, CCSP 2008a). In the Midwest, evaporation rates are projected to increase, as is the duration between rainfall events. Overall, the frequency, intensity, and duration of droughts are likely to increase, and water levels are likely to decrease (USGCRP 2009, CCSP 2008a). Thus, the combination of more intense droughts and reduced summertime precipitation and streamflows may substantially impact water availability during the summer in some regions.
Groundwater depletion is occurring across the United States, including in the High Plains (the location of the Ogallala aquifer) and in the California Central Valley (USGS 2013a). Future impacts on groundwater resources will result from a combination of changes in precipitation patterns, increases in evaporation rates, increases in droughts, and increasing competition for water among various sectors (e.g., energy, agriculture, industry, and residential). These impacts are expected to continue to decrease groundwater availability, particularly in the central and western regions, as heavily utilized aquifers experience reduced recharge rates (IPCC 2007a). The Appendix contains additional information about projected climate-driven changes in the hydrologic cycle for the United States.
Implications for the Energy Sector Decreasing water availability directly impacts nearly all aspects of energy supply: how electricity is produced; where future capacity may be sited; the cost of producing electricity; the types of generation or cooling technologies that are cost-effective; and the costs and methods for extracting, producing, and delivering fuels. Limited water available for cooling at thermoelectric facilities can affect power plant utilization. Increased evaporation rates or changes in snowpack may affect the volume and timing of water available for hydropower. Decreased water availability can affect bioenergy production. In regions where water is already scarce, competition for water between energy production and other uses will also increase. Future conditions will stress energy production infrastructure in all regions—particularly those with the most water-intensive generation portfolios. Table 4 summarizes the connections between components of the energy system and water quantity and quality.
Oil and Gas Exploration and Production The effects of climate change and water availability on the oil and gas sector include a combination of potential direct and indirect impacts. Water is required in many different stages of the oil and gas value chain, from exploration to processing to transport, and the volume of water used in these activities varies, with the largest volume used in the refining process. Among exploration and production processes, the largest volume of water is used as a supplemental fluid in the enhanced recovery of petroleum resources. Water is required to a lesser extent for other activities, including drilling and completion of oil or gas wells; workover of an oil or gas well; creation of underground hydrocarbon storage caverns through solution mining of salt formations; as gas plant cooling and boiler water; as hydrostatic test water for pipelines and tanks; as rig wash water; and as coolant for internal combustion engines for rigs, compressors, and other equipment.
Water is not only used in conventional oil and gas exploration and production, but significant volumes of impaired water are produced in the process. This produced water is the largest volume by-product associated with oil and gas exploration and production (ANL 2009b). The total volume of produced water in 2007 was estimated to be 21 billion barrels, or 2.4 billion gallons per day (ANL 2009b, API 2000). More than 98% of this produced water is injected underground: Approximately 59% is injected into producing formations to enhance production and about 40% is injected into non-producing formations for disposal (ANL 2009b).

U.S. ENERGY SECTOR VULNERABILITIES TO CLIMATE CHANGE AND EXTREME WEATHER
19
In addition to produced water from conventional oil and gas production, significant volumes of produced water result from coal bed methane (CBM) production (EPA 2013, EPA 2010b). CBM is recovered from coal seams and requires the removal of groundwater to reduce the pressure in the coal seam, which allows CBM to flow to the surface through the well. The amount of water produced from most CBM wells is relatively high compared to conventional natural gas wells because coal beds contain many fractures and pores that can contain and transmit large volumes of water (USGS 2000). In 2008, approximately 55,500 coal bed methane wells in the United States pumped out more than 47 billion gallons of produced water, and approximately 22 billion gallons of that produced water (or about 45%) were discharged either directly or indirectly (via a publicly owned treatment works) to surface waters (EPA 2008). The quantity of produced water varies from basin to basin, within a particular basin, from coal seam to coal seam, and over the lifetime of a coal bed methane well (EPA 2010b). For
example, coal bed methane-produced water volumes range from 1,000 gallons per day per well in the San Juan Basin (Colorado/New Mexico) to 17,000 gallons per day per well in the Powder River Basin (Wyoming/Montana) (USGS 2000). While the quality of produced water varies, with appropriate treatment, produced waters from coal beds could be an important source of water to augment existing water supplies and provide system operators with flexible, cost-saving water management options (USGS 2000).
As unconventional oil and gas sources, including coal bed methane, tight (relatively low porosity and permeability) gas sands, and shale oil and gas increasingly contribute to the nation’s energy supply, attendant water demands for their development and production become increasingly important. This is especially true where deposits are very deep in the ground, because deeper wells require even more water (CRS 2010).
Table 4. Connections between the U.S. energy sector and water availability and quality
Energy-related Activity Connection to Water Availability Connection to Water Quality Oil and Gas Exploration and Production
Oil and gas exploration and production
Water is needed for drilling, completion, fracturing, and enhanced oil and gas recovery
Produced water* can impact surface water and groundwater quality
Oil and gas refining Water is required for refining processes Refining processes can impact surface water quality
Oil and gas storage Water is required for slurry mining of caverns Slurry disposal can impact surface water quality and ecology
Fuel Transport
Oil and gas transport Water is needed for hydrostatic testing of pipelines Wastewater can impact surface water quality
Barge transport of coal, oil, and petroleum products Adequate river flows are required Spills or accidents of fuels can impact surface water quality
Thermoelectric Power Generation
Thermoelectric generation Water is needed for steam turbine cooling and scrubbing
Thermal and air emissions can impact surface water temperatures, quality, and ecology
Coal and uranium mining Water is used for mining operations Tailings and drainage can impact surface and groundwater quality
Coal slurry pipelines Water is used during slurry transport Used slurry water discharge can impact surface water quality Renewable Energy Resources
Hydroelectric generation Water stored in reservoirs is needed as energy source for generation
Reservoir and outflow water can impact surface water temperatures, quality, and ecology
Bioenergy and biofuels Water is needed for feedstock production and processing
Farming runoff can impact surface water quality; refinery wastewater treatment can impact surface water quality
* Water may be saline or contain contaminants Source: Adapted from DOE 2006

U.S. ENERGY SECTOR VULNERABILITIES TO CLIMATE CHANGE AND EXTREME WEATHER
20
Shale oil development is active in various parts of the United States, with over 4 trillion barrels of in-place shale oil and an estimated 33 billion barrels of technically recoverable shale oil resources spanning eight states (USGS 2013b, GAO 2012). Development will have implications for water quality and water resource availability, but estimates of the impacts of shale oil development vary widely, at least in part because some of the technologies are still evolving (GAO 2010). A 2010 U.S. Government Accountability Office report estimated that shale oil production requires about 13–26 acre-feet (4.2–8.5 million gallons) of water per day for operations that produce 50,000 barrels (2.1 million gallons) of oil per day (GAO 2010).
Shale gas development is most active in the Barnett, Fayetteville, Antrim, Haynesville, Woodford, and Marcellus shale plays (Figure 8) (ANL 2010). The total volume of water required for drilling and hydraulic fracturing a single well varies, with many factors, such as the depth of the shale formation, determining water needs. The typical range falls between 4 million gallons per well (MGW) in the Barnett shale and 5.6 MGW in the
Shale Gas and Shale Oil Over the past decade, shale gas has become the most productive natural gas activity in the United States (ANL 2010). According to the U.S. Energy Information Administration’s (EIA’s) most recent published data, shale gas production was virtually zero in 2000 and now contributes approximately 34% (8 trillion cubic feet) of U.S. natural gas production (EIA 2012a). EIA further projects that in 2035, shale gas will make up approximately 50% of U.S. natural gas production. Cambridge Energy Research Associates (IHS CERA 2010) similarly estimates that by 2030, shale gas could represent 50% of the natural gas portfolio for North America.
The recent expansion of shale gas and shale oil development is in part due to advances in horizontal drilling and hydraulic fracturing, which require large volumes of water. The fracturing process involves injecting a fracturing fluid (a mixture of mostly water, sand, and other ingredients) at high pressures into a well, which creates small fractures in the rock. Some of the water then returns to the surface (known as flowback), but the sand remains, propping open the fractures and allowing the gas or oil to move and flow out of the formation.
Figure 8. U.S. shale oil and shale gas plays Source: EIA 2011e

U.S. ENERGY SECTOR VULNERABILITIES TO CLIMATE CHANGE AND EXTREME WEATHER
21
Haynesville and Marcellus shales (EPA 2011). More than 90% of the total water required is for hydraulic fracturing, rather than drilling. For example, the water required for drilling a typical shale gas well ranges from 65,000 gallons in the Fayetteville shale to 600,000 gallons in the Haynesville shale (EPA 2011, ANL 2010). Hydraulic fracturing fluid volumes, on the other hand, range from 3.8 MGW in the Barnett shale (which requires 250,000 gallons for drilling) to 4.9 MGW in the Fayetteville shale, 5 MGW in the Haynesville shale, and 5.5 MGW in the Marcellus shale (EPA 2011).
Decreasing water availability could impact oil and gas production, particularly in times of drought. Drought, particularly in water-stressed regions such as the arid Southwest, can limit the amount of water available for agriculture, drinking supplies, aquatic ecosystems, fuel extraction, and power generation. In Texas, for example, those needs are expected to increase to 22 million acre-feet (7.2 trillion gallons) by 2060, with only 15.3 million acre-feet (5.0 trillion gallons) available (TWDB 2012). Increased evaporation rates will exacerbate water issues during a drought, decreasing the amount of water available in surface ponds and holding tanks, and could eventually lead to higher total water use (SPE 2010).
Increased hydraulic fracturing in shale gas developments could introduce additional strains on water systems (ANL 2011). Water used in hydraulic fracturing can come from a variety of sources, including surface water, groundwater, municipal potable water supplies, and reused water from other water sources (DOE 2009). The water may come from off-site sources via tank trunks or pipeline (DOE 2009). Although flowback and produced water (which contain very high levels of total dissolved solids) are sometimes reused during hydraulic fracturing operations, in many cases the water is disposed of via injection into underground disposal wells or hauled to a municipal or commercial wastewater treatment facility (DOE 2009). In Pennsylvania, water disposal fees of some water treatment companies ranged from 2.5 to 5.5 cents per gallon (ANL 2010). One company conducting hydraulic fracturing operations in the Marcellus shale formation estimated annual cost savings of $3.2 million through greater reuse of its water (ANL 2010).
Decreasing water availability can also impact oil refining. Conventional oil refining requires 0.5 to 2.5 gallons of water per gallon of gasoline equivalent. Additional water may be consumed if reforming and hydrogenation steps are required (ANL 2009a, Wu et al. 2009, DOE 2006). In terms of total water use, the United States refined approximately 0.71 billion gallons per day (BGD) in 2005, resulting in water consumption for fuel refining of approximately 0.7 to 1.8 BGD (Davis et al. 2008).
Fuel Transport Decreased water levels in rivers and ports can cause interruptions and delays in barge and other fuel delivery transportation routes. Crude oil and petroleum products are transported by rail, barge systems (Figure 9), pipelines, and tanker trucks. Coal is transported by rail, barge (Figure 10), truck, and pipeline. Corn-based ethanol, blended with gasoline, is largely shipped by rail, while bioenergy feedstock transport relies on barge, rail, and truck freight. A complex web of crude oil and petroleum product pipelines deliver petroleum from domestic oil fields and import terminals to refineries and from refineries to consumption centers across the United States. The shale oil revolution in areas such as the Bakken in North Dakota and Montana will likely increase barge traffic, with crude oil being transported by barge along the Missouri and Mississippi rivers to refineries in Louisiana.
Figure 9. Oil barge loading at a refinery on the Mississippi River Source: iStockphoto
Reductions in river levels could impede barge transport of crude oil, petroleum products, and coal, resulting in delivery delays and increased costs. In August 2012, the U.S. Army Corps of Engineers reported groundings of traffic along the Mississippi River due to low water depths from drought. This disrupted the transportation of commodities delivered by barges, including coal and petroleum products. Petroleum exports through New Orleans were valued at about $1.5 billion per month in 2012 (U.S. Census Bureau 2013). When river levels decrease, barge operators reduce their loads. A tow (chain of barges pulled or pushed as a group) on the upper Mississippi, Illinois, and Ohio rivers typically has 15 barges, each capable of carrying more than 1,000 tons. A one-inch (2.5 cm) drop in river level can reduce tow capacity by 255 tons. Likewise, the typical tow on the lower Mississippi has 30–45 barges, resulting in decreased capacity of up to 765 tons for just a one-inch decrease in river level (NOAA 2012g).

U.S. ENERGY SECTOR VULNERABILITIES TO CLIMATE CHANGE AND EXTREME WEATHER
22
Figure 10. Barges transporting coal down the Mississippi River Source: Willet 2009
Most of the coal in the United States is mined in three regions: Appalachia, the Midwest, and a group of western states from Montana and North Dakota to New Mexico, including the Powder River Basin. Barges carry approximately 11% of U.S. coal to power plants (EIA 2012l). According to the EIA, 63% of coal production is projected to originate from western states by 2030 compared to 54% in 2011, meaning an even larger share of coal produced would be transported long distances (EIA 2012g, EIA 2006). Continued transportation of fossil fuels by barge would maintain this vulnerability to reduced river levels in the future.
Thermoelectric Power Generation Increasing temperatures and changes in precipitation patterns will limit water availability in some seasons and some regions of the United States, which will have implications for thermoelectric power generation, including coal, natural gas, nuclear, CSP, bioenergy, and geothermal facilities.8
Of all the water use sectors (e.g., energy, agriculture, industry, and residential), thermoelectric power generation uses the largest fraction of freshwater in the United States, estimated at over 200 billion gallons per day, or approximately 40% of all freshwater withdrawals (USGS 2009). Approximately 90% of thermoelectric power generation in the United States requires water for cooling, with dry cooling representing a very small percentage of the national total. While freshwater accounts for the majority of water used for cooling, seawater has been used for cooling thermoelectric power plants in coastal locations for many decades. Seawater constitutes approximately 30% of the total water withdrawn by the thermoelectric sector (USGS 2004). Thermoelectric power
8 Additional implications for CSP and bioenergy are discussed
in the Renewable Energy Resources section of this chapter.
plant freshwater withdrawals are significantly greater than freshwater consumption,9
Low flow conditions in rivers and low lake levels—due to drought, increased evaporation, or changes in precipitation and runoff patterns—pose an operational risk to thermoelectric facilities using freshwater for cooling (Figures 11 and 12).
which has been estimated in the range of 2.8–5.9 billion gallons per day, or 4.7%–5.9% of total consumption levels (Averyt et al. 2011).
The water use intensity and the impact of decreasing water availability depends on the type of power plant, cooling system employed, geographic location of the plant, and source of cooling water. For example, water withdrawals per unit of power produced are far lower for closed cycle units, but water consumption is higher (Averyt et al. 2011, NREL 2011). Approximately 90% of the water withdrawn by thermoelectric power plants is for once-through cooling systems, and the remainder is for recirculating cooling systems (EPRI 2011, USGS 2009).
Once-through systems take water from nearby sources (e.g., rivers or lakes), circulate it through the condenser tubes to absorb heat from the steam, and then return the warmer water to the nearby source. For these systems, water consumption reflects the induced evaporation from the elevated temperature of the receiving water body. Once-through cooling systems are particularly vulnerable to low streamflow conditions due to the large volumes of water withdrawn: approximately 10,000–60,000 gallons per megawatt-hour (MWh), depending on the fuel type.
9 Water withdrawal refers to water that is used and may be
returned to the water body. In contrast, water consumption refers to water that is used and not returned.
Figure 11. Low water level at Martin Lake Steam Electric Station facility in Texas Lower water levels in the cooling pond due to drought required piping cooling water over eight miles from another water source. Source: Green 2011

U.S. ENERGY SECTOR VULNERABILITIES TO CLIMATE CHANGE AND EXTREME WEATHER
23
In contrast, recirculating cooling systems reuse cooling water multiple times rather than immediately discharging it back to the water source. In recirculating systems that use cooling towers, some of the water evaporates while the rest is reused and sent back to the condenser in the power plant. Recirculating cooling systems, like once-through systems, continually withdraw water. While they withdraw notably smaller quantities of water from the source—between 250 and 1,800 gallons/MWh (NREL 2011)—they can also be affected by low flow conditions. Complicating the process, water lost through evaporation in the cooling tower must be replaced, resulting in appreciably higher water consumption than for once-through systems. Water consumption rates can be 2–3 times higher for recirculating cooling systems than for once-through systems, ranging from approximately 200 to more than 1,000 gallons/MWh. For comparison, once-through cooling consumes approximately 100–400 gallons/MWh (NREL 2011). Thus, less water is consumed by once-through cooling systems, but greater amounts of water are withdrawn, resulting in a greater potential for entrainment and impingement of aquatic organisms, greater thermal loading of aquatic ecosystems from the cooling water discharge, and perhaps greater sensitivity to low water conditions.
As illustrated in Figure 13, both water withdrawals (left y-axis) and water consumption (right y-axis) vary by generation technology. Steam-cycle coal-fired power plants typically use more water than steam-cycle natural gas-fired power plants. Combined cycle plants are more water-efficient because the gas turbine component of the combined cycle increases generation without requiring cooling water and reduces the overall water use per unit of electricity output (NREL 2011). Nuclear power plants, CSP plants, and geothermal plants can withdraw and consume as much, or more, freshwater as fossil-fueled thermoelectric facilities (NREL 2011).
Decreasing water availability for cooling at thermoelectric facilities could reduce available generation capacity. Researchers from the Electric Power Research Institute used a set of five criteria, including susceptibility to drought and growth in water demand, to develop a water sustainability risk index. Approximately 25% of electric generation in the United States (250,000 MW) is located in counties projected to be at high or moderate water supply sustainability risk in 2030 (EPRI 2011). The study suggests that 28,800 MW of nuclear-powered electricity, 76,900 MW of coal-powered electricity, and 120,881 MW of natural-gas-powered electricity will be generated in counties with “at risk” water supplies due to growth in water demand, susceptibility to
Figure 12. Locations of thermoelectric power plants by cooling technology and water source Source: Adapted from NETL 2008

U.S. ENERGY SECTOR VULNERABILITIES TO CLIMATE CHANGE AND EXTREME WEATHER
24
drought, available precipitation, groundwater use, and water storage limitations (EPRI 2011).
The National Energy Technology Laboratory evaluated the potential water-related vulnerabilities of all coal-fired power plants in the United States and found that nearly 350 plants (60% of the plants identified in an analysis of 580 coal-fired plants) are located in areas subject to water stress (i.e., limited water supply and/or competing water demand from other sectors) (Figure 14, NETL 2010b). Approximately half of the 350 facilities use once-through cooling and half use recirculating cooling; approximately 70% of the vulnerable facilities use surface water and approximately 80% of the vulnerable facilities with once-through cooling use freshwater (NETL 2010b).
Cooling water availability could be limited by low flows, high water temperatures, or both. A recent study estimated the reduction in available capacity of thermoelectric power plants (nuclear or fossil fuel) in the central and eastern
states for the period 2031–2060, compared to 1971–2000 (van Vliet et al. 2012). The study projects that the summer average available capacity of power plants with once-through or combination cooling systems is projected to decrease by 12%–16% (under B1 and A2 emissions scenarios). For recirculating cooling systems, the decrease in available capacity during summer is 4.4%–5.9%. The study also projects that facilities with once-through cooling will experience capacity reductions of more than 25% an average of 24 days per year, compared to 9 days per year at facilities with recirculating cooling. Projections of extreme reductions in capacity—exceeding 90% (i.e., the plant is shut down or nearly shut down)—are much less common, with an average occurrence of less than one day per year (van Vliet et al. 2012).
The placement or location of the cooling water intake structures for thermoelectric power plants can also influence vulnerability to decreasing water availability. Cooling-water intake heights will influence the degree to which intake structures are exposed or above water levels. During times of drought, river, lake, or reservoir water levels may fall near or below the level of the water intakes used for drawing water for cooling, resulting in power production at some power plants being stopped or reduced. In a study of 423 thermoelectric power plants, 43% were identified as having cooling-water intake heights of less than 10 feet (3 meters) below the typical water level of their water source (NETL 2009a).
Changes in load growth and other factors could also affect water requirements for thermoelectric power generation, exacerbating the impacts of decreasing water availability. Increasing power needs for the growing U.S. population could increase thermoelectric water consumption by as much as 27% by 2035 (NETL 2010b). The actual amount of water consumed will depend upon a number of factors,
Figure 14. Water stress: Locations of the 100 most vulnerable coal-fired power plants Source: NETL 2010b
Figure 13. Water use by fuel and cooling technology Source: Adapted from Averyt et al. 2011

U.S. ENERGY SECTOR VULNERABILITIES TO CLIMATE CHANGE AND EXTREME WEATHER
25
including the increase in electricity demand and the energy technologies and associated water intensities of those technologies. Since water consumption is substantially higher for nuclear and coal-fired generation than for natural gas combined cycle generation (NREL 2011), low natural gas prices and increased deployment of natural gas rather than coal-fired generation could reduce the projected increases in water consumption.
Cooling technologies will also affect water consumption and withdrawals. If older power plants using once-though cooling systems are retired and replaced with power plants using recirculating systems, water consumption will increase even though water withdrawal may decrease. However, retrofitting or replacing existing thermal generation to use nontraditional water (e.g., brackish groundwater or municipal wastewater) or converting power plants to dry cooling systems could significantly reduce freshwater use. One study suggests that the use of nontraditional water or dry cooling in drought-vulnerable watersheds could save 847 million gallons per day (3.2 million cubic meters per day), or about 17% of all thermoelectric water consumption (Tidwell et al. 2013).
Finally, adoption of carbon capture and storage (CCS) technologies could contribute to increased water consumption. CCS requires water to strip CO2 from flue gas and power to process concentrated liquefied CO2
(Williams et al. 2011). Carbon capture technologies also require auxiliary power, known as parasitic load or power loss. Estimates of parasitic power loss at a coal-fired power plant are approximately 20% of power plant capacity (Kobos et al. 2011). Both withdrawal and consumption rates are estimated to be approximately two times higher for coal and natural gas facilities that include carbon CCS than for those without CCS depending upon the generation and CCS technologies utilized (NREL 2011, NETL 2010d).
Decreasing water availability could affect the coal and nuclear fuel supply chains. Coal currently accounts for more than 40% of the electric power generated in the United States and uses water for many stages, from extraction to processing and transport. Coal can be mined from deep underground caverns, surface pits, or mountaintops. Coal mining processes can use significant amounts of water: an estimated 70–260 million gallons of water per day (EIA 2006, DOE 2006), or approximately 50–59 gallons of water for every short ton (0.9 metric tonnes) of coal mined (USGS 2005).10
10 One short ton of coal generates about 1,870 kilowatt-hours
of electricity (EIA 2012d).
Water is used at several different stages, including for cooling or lubricating cutting and drilling equipment, dust suppression, fuel processing, and re-vegetation when mining and extraction are complete.
Depending on its quality, coal may need to be “washed” with water and chemicals to remove sulfur and impurities before it can be burned in a power plant.
Nuclear energy provides about 20% of the electricity in the United States (EIA 2012a). Over the last decade, U.S. uranium mines have supplied less than 10% of the uranium fuel powering the nuclear fleet, with the rest imported (EIA 2012h). However, increases in the price of uranium oxide have sparked renewed interest in uranium mining across the United States (Cole 2012, Williams 2011). Water used to mine uranium has traditionally been comparable to the estimates for underground and surface coal mining: between one and six gallons per British thermal unit (BTU) (DOE 2006). Uranium fuel processing requires additional water (45 to 150 gallons per MWh) (McMahon and Price 2011).
Renewable Energy Resources The water demand associated with renewable energy technologies varies significantly. Water consumption for thermoelectric power generation based on solar CSP plants or geothermal technologies using once-through or recirculating cooling can be comparable to, or even greater than, that of fossil or nuclear thermoelectric power plants. In contrast, relatively little water is consumed in the generation of electricity from solar PV or wind technologies.
One recent study calculates that if the United States could transition to an energy mix with 80% of its electricity supply coming from renewable sources by 2050 (with nearly 50% from wind and solar PV generation) using currently available commercial generation technologies, water consumption in the power sector would decrease by approximately 50% (NREL 2012). However, greater use of the more water-intensive renewable technologies, such as CSP or geothermal, would result in less water saved unless those technologies were deployed with an alternative cooling mechanism (e.g., dry cooling or wet-dry hybrid).
Hydropower
Changing precipitation and decreasing snowpack could decrease available hydropower generation capacity and affect the operation of facilities in some regions. Climate change may reduce hydropower production in some parts of the country (ORNL 2012a). Decreasing water availability, either in reservoirs or in the rivers that feed them, can reduce hydropower potential and/or necessitate a change in operating schemes. Projected changes in climate, including more precipitation falling as rain and less as snow, reduced snowpack, and earlier peak runoff, may decrease annual water storage, produce unplanned spills, decrease annual runoff, and otherwise alter streamflow. Decreases in

U.S. ENERGY SECTOR VULNERABILITIES TO CLIMATE CHANGE AND EXTREME WEATHER
26
streamflow decrease available hydropower generation capacity.
Higher temperatures, less snowpack, and decreasing water availability have reduced the Colorado River’s flow and left Lake Mead more than 100 feet (30 meters) below full storage capacity. In the Colorado River’s 100-year recorded history, 1999–2010 ranked as the second-driest 12-year period, yielding an average of 16% less energy from hydropower generation compared to full storage capacity generation potential, or the equivalent of a medium-sized power plant. Hoover Dam loses 5–6 MW of capacity for every foot (0.3 meter) decline in Lake Mead, because at lower water levels there is less water pressure to drive the turbines as well as a greater potential for air bubbles to form and flow through with the water causing the turbines to lose efficiency (DOE 2011c). Studies on the effects of streamflow on available hydropower generation in the Colorado River Basin suggest that for each 1% decrease in streamflow, power generation decreases by 3% (USGCRP 2009).
Hydropower production in the same snowmelt-dominated regions is projected to increase in the winter and decrease in the summer. For several California rivers, summer hydropower potential is projected to decrease 25% because runoff is projected to occur two weeks earlier under a climate scenario of 3.6°F (2°C) warming (Mehta et al. 2011).
Results from a model designed to optimize hydropower pricing and estimate subsequent revenue under warmer climatic conditions in California predicted that, even though hydropower prices are projected to increase, annual high-elevation hydropower generation under dry conditions could decrease by as much as 20% in 2070–2099 compared to 2005–2008. The study also projected revenue would decrease 14%–19% over the same time period, depending on the climate scenario (Guégan et al. 2012).
Significant changes in hydropower availability are also expected in the Pacific Northwest (Hamlet et al. 2010, IPCC 2007a). The Intergovernmental Panel on Climate Change projects higher annual runoff in this region to 2040 with potential increases in hydropower generation, but a possibility of modest decreases in hydropower generation in the longer term (IPCC 2007a). One recent study simulated changes in streamflow in the Columbia River hydropower system under a variety of climate
scenarios and projected that total annual hydropower production could decrease by 2.0%–3.4% by the 2040s, which is the net effect of an expected increase of 4.7%–5.0% in the winter and a decrease of 12.1%–15.4% in the summer (Hamlet et al. 2010).
Increased annual precipitation and potential hydropower generation is also expected in the northern Great Plains (ORNL 2012a). In contrast, in the Southeast and Southwest, dry years are expected to increase in frequency and potentially result in reduced hydropower generation (ORNL 2012a, IPCC 2007a). Seasonal trends may be more relevant than annual trends in impacting hydropower generation. Summer is expected to be drier for nearly all regions of the United States, with the potential impacts to hydropower generation supply coinciding with peak electricity demand for cooling (USGCRP 2009).
Bioenergy and Biofuel Production
Changes in precipitation and runoff may affect bioenergy production. Drought and other changes in the hydrologic cycle may diminish feedstock production efficiency for both traditional and second-generation bioenergy (Figure 15). Increasing competition for water, particularly in times when (and locations where) water is scarce, will affect energy and food production alike.
Decreasing water availability could decrease bioenergy production in some regions. Limited water availability due to projected decreases in summer precipitation for most of the United States could decrease crop yields. However, precipitation is projected to increase for northern states in the winter and spring, which could improve yields of certain crops. The risk posed to the energy sector will vary as a function of a number of factors, including the type of bioenergy crop, the share of that crop used for energy, temperature, precipitation, soil type, soil moisture, and availability of irrigation water.
Figure 15. Drought-stricken farm field Source: Station 2012
Costs of Decreased Snowpack In 2010, the Bonneville Power Association experienced net losses of $164 million, which occurred largely from reduced hydropower generation due to low snowpack runoff in the lower Columbia River (BPA 2010).

U.S. ENERGY SECTOR VULNERABILITIES TO CLIMATE CHANGE AND EXTREME WEATHER
27
Irrigation requirements vary substantially across the United States, even for the same crop. A majority of the irrigation water in the Midwest and East is sourced from groundwater, while surface water is the main source for irrigation in the West (USGS 2009).
Water use in biorefineries has been significantly reduced as a result of energy- and water-efficient designs in new plants and improved system integration in existing plants, from 6 gallons of water required to refine one gallon of ethanol to 2.7 gallons of water per gallon of ethanol over a 10-year period (Wu et al. 2011). On average, producing one gallon of corn ethanol requires 17–239 gallons of water for irrigation and conversion (Wu et al. 2011). A typical 100 million gallon per year ethanol plant requires approximately one million gallons of water per day (Chiu et al. 2009, Wu et al. 2009, NRC 2008). Production of cellulosic ethanol from non-irrigated perennial grass requires fewer than six gallons of water per gallon of ethanol (Wu et al. 2009). Water requirements for algae produced from open ponds could be much greater depending on whether the harvest water is recycled and the location of the facility, based on surface evaporation and pond operation. One study found that 520–3,281 gallons of freshwater is currently required to produce one gallon of biodiesel from microalgae (Yang et al. 2010). However, this freshwater demand can be substantially reduced if an alternative water resource is used.
Solar Energy
Decreasing water availability for concentrating solar power plants could decrease potential generation capacity. Annual and seasonal solar energy production could be affected by decreasing water availability, particularly in arid regions such as the Southwest, which has the greatest solar potential. While photovoltaic (PV) power generation consumes minimal volumes of water (e.g., for mirror washing) and is minimally affected by water availability, concentrating solar power uses steam generation and water cooling and requires significant volumes of water. For example, CSP power plants using recirculating water cooling typically consume more water than a natural gas, coal-fired, or nuclear power plant (NREL 2011, Figure 13). Although CSP cooling technologies are generally the same as those used in traditional thermoelectric facilities, the CSP water footprint is greater due to CSP’s lower net steam cycle efficiency (CRS 2009). A typical parabolic trough CSP plant with recirculating cooling uses more than 800 gal/MWh; the majority of this water is used for cooling, with less than 2% for mirror washing. These values compare to less than 700 gal/MWh for a nuclear power plant, 500 gal/MWh for a supercritical coal-fired power plant, and 200 gal/MWh for a combined cycle natural gas plant (NREL 2011). Thus, deployment and operation of CSP power plants using recirculating cooling in water-stressed regions may be significantly impacted by reduced water availability and require adaptation of alternative cooling technologies such as dry or wet-dry cooling. CSP plants with dry cooling can reduce water usage by more than 95% compared to conventional wet cooling systems (BrightSource 2012).

U.S. ENERGY SECTOR VULNERABILITIES TO CLIMATE CHANGE AND EXTREME WEATHER
28
CHAPTER 3: Increasing Storms, Flooding, and Sea Level Rise
Recent Trends and Projections As atmospheric temperatures increase, so does the water-holding capacity of the air—generally by about 7% per 1.8°F (1°C) increase in temperature (Trenberth 2011). As a result, rainstorms become more intense and a greater fraction of precipitation falls during heavy rainfall events (NOAA 2013b, CCSP 2008b), increasing flooding risk. The greatest increase in heavy precipitation has been in the Northeast and Midwest (Figure 16).
In the future, more frequent and intense downpours and a greater proportion of total rainfall coming from heavy precipitation events are very likely across the United States (NOAA 2013b, CCSP 2008a, IPCC 2007a). Recent projections indicate that globally, the heaviest precipitation events are likely to occur twice as frequently as they do today by the end of the century (Kharin et al. 2013). In the United States, high-rainfall events which today occur once every twenty years may occur once every four to fifteen years by 2100, depending on location. Such events are also expected to become more intense, with 10%–25% more precipitation falling in the heaviest events (USGCRP 2009). The greatest increases are expected in parts of the Northeast, Midwest, Northwest, and Alaska (Kharin et al. 2013, USGCRP 2009).
Changes in the timing and amount of precipitation consequently shift the frequency, intensity, and duration of floods (Hirsch and Ryberg 2012). Measurements of stream gauges with at least 85 years of historical records show that the greatest increases in peak streamflows have occurred in the upper Midwest (specifically, the Red River of the North), and in the Northeast (especially in eastern Pennsylvania, New York, and New Jersey) (Hirsch and Ryberg 2012). However, measurements in the Rocky Mountains and the Southwest have shown significant declines (Hirsch and Ryberg 2012).
Floods are projected to increase in frequency and intensity in some regions of the United States, although with some uncertainty (USGCRP 2009, CCSP 2008a). In general, areas that are projected to receive the greatest increases in heavy precipitation are also expected to experience greater flooding, such as the Northeast and Midwest, as large
amounts of precipitation over short periods can limit the ability of soil to absorb water (USGCRP 2009, CCSP 2008a).
In addition to changes in the timing and amount of precipitation, tropical storm activity may also change. Complexities associated with the atmospheric conditions that lead to a hurricane complicate prediction of exactly how climate change will affect the occurrence of hurricanes (IPCC 2012, USGCRP 2009). Data from 1851–2010 do not show any noticeable trends in changes in the number of major hurricanes (Categories 3, 4, and 5) making landfall in the United States, and the number of land-falling tropical storms and hurricanes in the United States has fluctuated since 1900 (NHC 2012). However, since the 1970s, the intensity of hurricanes and tropical storms has increased (IPCC 2012, IPCC 2007d). According to the Intergovernmental Panel on Climate
Key Messages • Increasing intensity of storm events, sea level rise, and storm surge put coastal and offshore oil and gas facilities at increased risk of
damage or disruption. • Increasing intensity of storm events increases the risk of damage to electric transmission and distribution lines. • Increasing intensity of storm events, sea level rise, and storm surge poses a risk to coastal thermoelectric facilities, while increasing
intensity and frequency of flooding poses a risk to inland thermoelectric facilities. • Increasing intensity and frequency of flooding increases the risk to rail and barge transport of crude oil, petroleum products, and coal.
Figure 16. Percentage change in very heavy precipitation, 1958–2007 The map shows the relative change in the amount of precipitation falling in very heavy events (defined as the heaviest 1% of all daily events). Source: USGCRP 2009

U.S. ENERGY SECTOR VULNERABILITIES TO CLIMATE CHANGE AND EXTREME WEATHER
29
Change, the intensity of these storms is likely to increase (IPCC 2012), as shown in Figure 17. Others have suggested that while fewer hurricanes may form, those that do form may be stronger (Category 4 or 5) (CCES 2012, Knutson et al. 2010).
Figure 17. Projected changes in Atlantic hurricane frequency by category The graph shows model projections of percentage changes in Atlantic hurricane and tropical storm frequencies for different storm categories for the period 2081–2100 compared with the period 2001–2020. Source: Bender et al. 2010 Winter storms have increased in frequency from 1901–2000 in the Northeast and upper Midwest, and their tracks have shifted northward (Wang et al. 2012, CCSP 2008b), while winter storms in the South and southern Midwest regions have decreased in frequency during the same period (CCSP 2008b). The shift in winter storm tracks northward is expected to continue, although projections of the intensity and frequency of winter storms are highly uncertain (NOAA 2013b, USGCRP 2009). Snowfall along the downwind coasts of the Great Lakes could increase as warming temperatures enhance lake-effect snow (USGCRP 2009). Some studies have projected an increase in the intensity of winter extratropical cyclones (e.g., nor’easters), although this is not conclusive (CCSP 2008a).
Globally, absolute sea level rose at an average rate of 0.07 inches (1.8 mm) per year from 1880 to 2011, but from 1993 to 2011 the average sea level rose at a rate of 0.11–0.13 inches (2.8–3.3 mm) per year (EPA 2012a). The rate of global sea level rise over the last twenty years is double the rate observed over the last century (Church and White 2011). Sea level rise results from increased melting of glaciers and ice sheets and the thermal expansion of ocean water as ocean temperatures increase. Relative sea level rise (global sea level rise in combination with local land
elevation changes) increased along much of the U.S. coastline between 1958 and 2008, particularly along the Mid-Atlantic and parts of the Gulf Coast, where some stations registered increases of more than 8 inches (20 cm) (USGCRP 2009).
Future global sea level rise over the rest of this century is projected to increase at a faster rate than over the last century (NOAA 2012f, IPCC 2012). A recent study projected that a rise in global sea level by 2100 (compared to 1992 average sea levels) of 1–4 feet (0.3–1.2 meters) is plausible (NOAA 2012f). When combined with the uplift or subsidence of land, relative sea level rise will vary by location. For example, assuming a two-foot (0.6 meters) rise in global average sea levels by the end of the century, relative sea level may rise 2.3 feet (0.7 meters) in New York City; 2.9 feet (0.9 meters) in Hampton Roads, Virginia; 3.5 feet (1.1 meters) in Galveston, Texas; and only one foot (0.3 meters) in Neah Bay, Washington (USGCRP 2009). Relative sea level rise in California could range from 1.4 to 5.5 feet (0.4–1.7 meters) by the end of the century (NRC 2012).
In coastal areas, storm events combined with sea level rise will contribute to greater storm surge impacts, increasing over time as both storm intensity and sea level rise increase (Strauss et al. 2012). Sea level rise will exacerbate existing vulnerabilities to hurricanes and storm surge because hurricanes and storms damage wetlands and other natural and manmade features that help protect coastal infrastructure from sea level rise, flooding, and hurricanes.
Implications for the Energy Sector The annual frequency of billion-dollar weather and climate-related events and the annual aggregate loss from these events have increased during the last 30 years (Figure 18). The second-costliest year for weather and climate disasters in the United States was 2012, with estimated damage of approximately $115 billion (NOAA 2013a). These events include severe weather and tornados, tropical storms, droughts, and wildfires. The two major drivers of damage costs in 2012 were Hurricane Sandy ($65 billion) and an extended drought ($30 billion). These storm-related damages affect many sectors, including the energy sector. Sea level rise, more intense storms, and flooding can disrupt fuel extraction, storage, refining and delivery, as well as electricity production and delivery.

U.S. ENERGY SECTOR VULNERABILITIES TO CLIMATE CHANGE AND EXTREME WEATHER
30
Heavy rainfall and flood events in the Midwest and Northeast threaten inland facilities and infrastructure and may impede the transportation of coal to power plants. More intense hurricanes pose a particular risk to ports and energy infrastructure in coastal regions (Figures 19, 20, and 21). In 2005 alone, direct costs to the energy industry due to hurricanes amounted to $15 billion (CCSP 2007b).
Figure 19. Flooded refinery near Beaumont, Texas, in the aftermath of Hurricane Ike Source: PBS 2008
In 2012, storm surge and high winds from Hurricane Sandy downed power lines, flooded substations and underground distribution systems, and damaged or temporarily shut down ports and several power plants in
the Northeast, including eight nuclear power units in the region (DOE 2013a). More than 8 million customers in 21 states lost power as a result of the hurricane (DOE 2012a), and fuel pumps at gas stations were not working due to power outages and lack of back-up generation. Hurricane Sandy also forced the shutdown of petroleum and natural gas refineries, pipelines, and petroleum terminals, including two oil refineries with total capacity of more than 300,000 barrels per day. Four additional oil refineries with a cumulative capacity of 862,000 barrels per day were forced to reduce their output (DOE 2012a). The Colonial Pipeline, which brings refined products from the Gulf of Mexico, was not fully operational as a consequence of a power outage even though the infrastructure was not damaged (EIA 2012m, McGurty 2012).
Figure 20. Damaged offshore platform after Hurricane Katrina Source: CCSP 2007a
Oil and Gas Exploration and Production The Gulf Coast region exemplifies the high-volume, high-value, complex system of resources, infrastructure, and transportation networks required to convert raw materials such as natural gas and crude oil into fuels. With nearly 4,000 active oil and gas platforms, more than 30 refineries, and 25,000 miles of pipeline, the Gulf region’s oil and gas industry produces approximately 50% of U.S. crude oil and natural gas and contains nearly half of the total U.S. refining capacity (NOAA 2012a, EIA 2012k).
Figure 18. Billion-dollar weather and climate disasters, 1980–2012 Data source: NOAA 2013a

U.S. ENERGY SECTOR VULNERABILITIES TO CLIMATE CHANGE AND EXTREME WEATHER
31
Figure 21. Hurricane storm tracks and locations of coastal energy infrastructure The map depicts storm tracks of hurricanes and tropical storms from 1980–2012 that have caused more than $1 billion in damage. The costliest storms are often those that intersect areas with dense coastal energy infrastructure. Data sources: NOAA 2013a, NOAA 2013d, NOAA 2012h, EIA 2013b

U.S. ENERGY SECTOR VULNERABILITIES TO CLIMATE CHANGE AND EXTREME WEATHER
32
In addition, the U.S. Strategic Petroleum Reserve (SPR), the world’s largest supply of emergency crude oil (DOE 2012c), is stored in large underground salt caverns along the Gulf Coast (Figure 22). Approximately 700 million barrels of crude oil are stored in the SPR’s four storage sites, providing an available supply of crude oil in the event of an emergency.
Figure 22. SPR storage locations Data source: EIA 2012k
Increasing intensity of storm events, sea level rise, and storm surge put coastal and offshore oil and gas facilities at increased risk of damage or disruption. In 2005, Hurricanes Katrina and Rita shut down or damaged hundreds of oil drilling and production platforms and offshore drilling units. The two storms damaged approximately 457 offshore oil and gas pipelines (Burkett 2011) and significantly damaged onshore oil refining, gas processing, and pipeline facilities, which impacted oil and gas production for months. Disruptions in production decrease revenues for energy companies and can raise prices for customers. As energy sector development in the Gulf Coast has proceeded over the last 50 years, including the deployment of deepwater rigs costing more than half a billion dollars, the potential for significant damage from storm events in the region has increased.
In addition to causing physical damage to energy infrastructure, an increase in the intensity of storms can interfere with operations and decrease fuel supplies. Storm-related disruptions to extraction, processing, refining, and generation also cause losses for downstream businesses and industries.
Increasing intensity of storm events, sea level rise, and storm surge could impact oil storage facilities and operations. In 2008, the Gulf Coast region was impacted by two major hurricanes in quick succession, Hurricane Gustav on September 1 and Hurricane Ike on September 13. These hurricanes resulted in significant storm damage, flooding, and power outages that crippled Gulf Coast refineries and pipeline distribution systems, creating temporary shortages of refined products in many East Coast markets. Although some SPR sites sustained significant damage (Figure 23), the SPR was able to conduct an emergency test exchange of 5.4 million barrels of crude in response to requests for emergency supplies from several refiners. However, it took approximately $22 million and weeks to restore SPR sites to their pre‐storm levels of mission capability (DOE 2008b).
Fuel Transport More frequent heavy rainfall events will increase flood risk across the United States, particularly in the Northeast and Midwest. Increased frequency and intensity of flooding will affect water levels in rivers and ports and could wash out rail lines. Flooding events could also cause interruptions and delays in fuel and petrochemical feedstock deliveries.
Increasing intensity and frequency of flooding increases the risk to rail and barge transport of crude oil, petroleum products, and coal. Intense storms and flooding can impede barge travel and wash out rail lines, which in many regions follow riverbeds (Figures 24 and 25) (USGCRP 2009). Flooding of rail lines has already been a problem both in the Appalachian region and along the Mississippi River. In 2011, severe flooding throughout the Powder River Basin disrupted trains. Rerouting of trains due to flooding can cost millions of dollars and delay coal deliveries (DOE 2007). As heavy precipitation events become more frequent and the risk of
Business Interruption Costs The economic impacts of combined sea level rise and storm surge damages to the energy industry in the Gulf region could average $8 billion per year by 2030 (CCES 2012, Entergy 2010). A substantial portion of overall costs are due to business interruption. For example, two-thirds of the $2.5–$3 billion in economic losses in the oil and gas industry caused by Hurricane Ivan in 2004 was attributed to interrupted operations (CCES 2012).
Figure 23. SPR site and equipment inundated following a storm surge Source: DOE 2011b

U.S. ENERGY SECTOR VULNERABILITIES TO CLIMATE CHANGE AND EXTREME WEATHER
33
flooding increases, so will the risk of disruptions to coal deliveries. Delivery disruptions could, in turn, interrupt electricity generation at some power plants.
The amount of crude oil and petroleum products transported by U.S. railways during the first half of 2012 increased by 38% from the same period in 2011 (EIA 2012e). Although the majority of oil is transported by pipeline, railroads play an increasingly important role in transporting U.S. crude oil to refineries. This is especially true for North Dakota’s Bakken formation, which has limited pipeline infrastructure. The formation has more than tripled oil production in the last three years to become the second-largest oil producer in the United States.
Approximately 71% of the nation’s coal is transported by rail lines, with the remainder transported by barge, truck, and pipeline (USDA 2010). The United States produces and transports more than one billion short tons of coal every year. While coal is produced in 25 states, the Powder River Basin, largely in Wyoming, accounted for 468 million tons of production in 2010, or 43% of U.S. coal production (EIA 2011a).
Figure 25. Regions with heavy rainfall events (1958–2007) and coal shipment routes that cross major rivers Source: DOE 2007
Figure 24. Flooded railroad along the Spring River in Arkansas Source: NOAA 2008

U.S. ENERGY SECTOR VULNERABILITIES TO CLIMATE CHANGE AND EXTREME WEATHER
34
Thermoelectric Power Generation Numerous thermoelectric power plants line the coasts of the United States (EIA 2012i, NETL 2009b).11
Increasing intensity of storm events, sea level rise, and storm surge poses a risk to coastal thermoelectric facilities. Specific vulnerabilities to hurricanes and flooding vary from site to site. For example, a 2011 study evaluated the flood risk from coastal storms and hurricanes for the Calvert Cliffs Nuclear facility (Maryland) and the Turkey Point Nuclear facility (Florida). Under current conditions, storm surge would range from 2 feet (0.6 meters) for a Nor’easter to 12 feet (3.7 meters) for a Category 3 hurricane, causing no flooding at Calvert Cliffs but “considerable flooding” at Turkey Point (which, according to the study, would be inundated during hurricanes stronger than Category 3)
Of those plants, approximately 10% are nuclear reactors, 15% are coal-fired plants, and 75% are oil or natural gas-fired plants. Many inland thermoelectric power plants are located in low-lying areas or flood plains.
11 The use of ocean water for cooling indicates proximity to the
coast and is used here as an indicator of “coastal” power plants.
(Kopytko and Perkins 2011). The study also evaluated facility risk to future sea level rise and storms under a high warming scenario. By the end of the century, while the Calvert Cliffs facility is projected to experience the “potential for flooding” during a Category 3 hurricane, Turkey Point is projected to be inundated by even a Category 2 storm.
The Atlantic Coast from Hampton Roads, Virginia, and further north, and the Gulf Coast are considered to be particularly vulnerable to sea level rise because the land is relatively flat and, in some places, subsiding (USGCRP 2009). An increase in relative sea level of 24 inches (61 cm) has the potential to affect more than 60% of the port facilities on the Gulf Coast, and an increase of 48 inches (122 cm) would affect nearly 75% of port facilities (CCSP 2008c). In addition, assuming higher range projections for sea level rise combined with future 100-year floods in California, up to 25 thermoelectric power plants could be flooded by the end of the century, as well as scores of electricity substations and natural gas storage facilities (Figure 26, CEC 2012).
Increasing intensity and frequency of flooding poses a risk to inland thermoelectric facilities. The intake structures, buildings, and other infrastructure at thermoelectric generation facilities that draw cooling water from rivers are vulnerable to flooding and, in some cases, storm surge. For example, in June 2011, the Missouri River floodwaters surrounded the Fort Calhoun nuclear power plant in Nebraska (Figure 27). The plant remained closed during the summer for several reasons, while floodwaters surrounded the plant for months.
Figure 27. Flooding of the Ft. Calhoun nuclear power plant in Nebraska, spring 2011 Source: NPA 2011
Figure 26. Power plants in California potentially at risk from a 100-year flood with sea level rise of 4.6 feet (1.4 meters) Source: CEC 2012
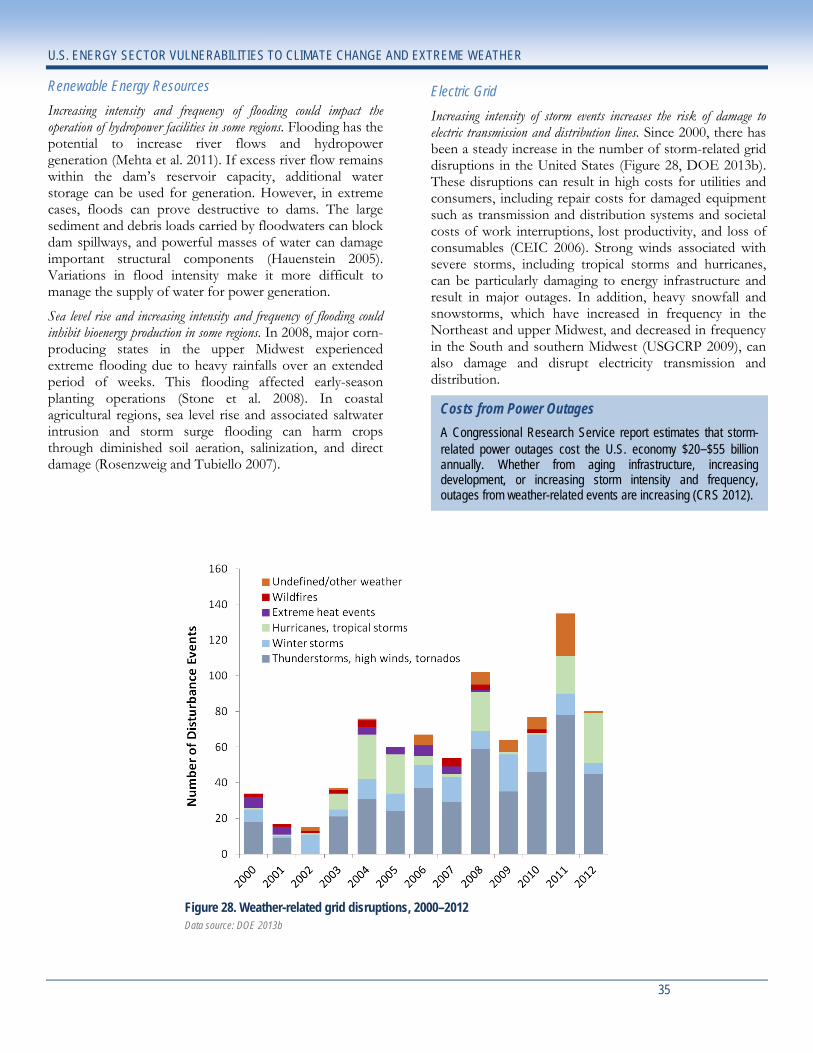
U.S. ENERGY SECTOR VULNERABILITIES TO CLIMATE CHANGE AND EXTREME WEATHER
35
Renewable Energy Resources Increasing intensity and frequency of flooding could impact the operation of hydropower facilities in some regions. Flooding has the potential to increase river flows and hydropower generation (Mehta et al. 2011). If excess river flow remains within the dam’s reservoir capacity, additional water storage can be used for generation. However, in extreme cases, floods can prove destructive to dams. The large sediment and debris loads carried by floodwaters can block dam spillways, and powerful masses of water can damage important structural components (Hauenstein 2005). Variations in flood intensity make it more difficult to manage the supply of water for power generation.
Sea level rise and increasing intensity and frequency of flooding could inhibit bioenergy production in some regions. In 2008, major corn-producing states in the upper Midwest experienced extreme flooding due to heavy rainfalls over an extended period of weeks. This flooding affected early-season planting operations (Stone et al. 2008). In coastal agricultural regions, sea level rise and associated saltwater intrusion and storm surge flooding can harm crops through diminished soil aeration, salinization, and direct damage (Rosenzweig and Tubiello 2007).
Electric Grid Increasing intensity of storm events increases the risk of damage to electric transmission and distribution lines. Since 2000, there has been a steady increase in the number of storm-related grid disruptions in the United States (Figure 28, DOE 2013b). These disruptions can result in high costs for utilities and consumers, including repair costs for damaged equipment such as transmission and distribution systems and societal costs of work interruptions, lost productivity, and loss of consumables (CEIC 2006). Strong winds associated with severe storms, including tropical storms and hurricanes, can be particularly damaging to energy infrastructure and result in major outages. In addition, heavy snowfall and snowstorms, which have increased in frequency in the Northeast and upper Midwest, and decreased in frequency in the South and southern Midwest (USGCRP 2009), can also damage and disrupt electricity transmission and distribution.
Figure 28. Weather-related grid disruptions, 2000–2012 Data source: DOE 2013b
Costs from Power Outages A Congressional Research Service report estimates that storm-related power outages cost the U.S. economy $20–$55 billion annually. Whether from aging infrastructure, increasing development, or increasing storm intensity and frequency, outages from weather-related events are increasing (CRS 2012).
U.S. ENERGY SECTOR VULNERABILITIES TO CLIMATE CHANGE AND EXTREME WEATHER
36
CHAPTER 4: Adaptation Actions and Major Opportunities
Climate change and extreme weather threaten the sustainable, affordable, and reliable supply of energy across the United States and around the globe. The exact character, severity, and timing of impacts will depend not only on changes in climate and extreme weather events, but also on the energy sector’s exposure to risks and ability to adapt in a timely manner. Economic growth, population growth, and other factors may exacerbate this exposure and the challenges associated with adaptation.
The U.S. energy sector is already responding to the threat of climate change, but a number of barriers prevent more widespread action. These include a limited understanding of near- and long-term vulnerabilities; a lack of robust economic assessments of alternative adaptation options; limited alternative climate-resilient energy technologies; lack of a policy framework with adequate market signals for investments in resilience; and varying purviews, control, and perceptions of risk by key stakeholders that limit their influence.
Given that energy infrastructure investments made today will likely be in place for many decades, it is important that energy stakeholders have enough information to make sound technical and economic decisions. Continuing to identify potential impacts to the existing and future U.S. energy infrastructure is essential, as is improving understanding of the technical and economic potential of alternative technologies and possible limits of those options. Innovative research and development efforts involving both private and public stakeholders and supporting policy frameworks could address existing market barriers and enable the development and deployment of the next generation of climate-resilient energy technologies.
Each of the vulnerabilities identified in this report warrants consideration, but a process of prioritization (which will include analysis of the probabilities of impacts and the costs and benefits of alternative mitigation strategies) will be necessary to help decision-makers allocate limited resources toward actions that optimize outcomes. This report does not attempt to prioritize the various identified
vulnerabilities, given the lack of a standardized and accepted methodology, which is compounded by gaps in information about the probability and timing of specific climate impacts and their implications to the energy sector. Prioritization efforts could occur at the federal, state, and local level and within both the public and private sector. Such efforts could focus on prioritization using various criteria (see text box “Prioritization of Vulnerabilities”).
In addressing vulnerabilities to climate change and extreme weather, the energy sector will need to consider uncertainty as part of a risk management approach. As decisions will be made with incomplete information, ensuring longer-term system reliability requires flexible strategies that allow course corrections. Climate resilience measures may also have significant co-benefits that provide near-term justification for up-front investment (e.g., cost savings through reduced fuel or water intensity).
Adaptation activities already underway illustrate opportunities for building a more resilient U.S. energy sector. Actions to improve resilience need not be delayed because of uncertainty in the timing and extent of climate change impacts, since many adaptation activities are beneficial and cost-effective regardless of how climate impacts are realized. Focusing on these activities can help
Prioritization of Vulnerabilities In the absence of a commonly accepted methodology to compare risks or effectiveness of adaptation measures across regions and energy subsectors, diverse criteria could be integrated into a prioritization process, which might include the following: • Probability that the vulnerability will result in disruption or
damage of national or regional significance without adaptation measures
• Economic costs of the disruption or damage • Time frame over which the harmful impact is likely to occur • Adaptation potential, including the cost of measures that
could significantly reduce harmful impacts In addition to these potential criteria, the methodology should recognize uncertainty and be clearly definable, understandable and easily communicated to decision-makers and stakeholders.
Key Messages • Establishing a more climate-resilient energy sector requires improved technologies, information to support decision-making, effective
stakeholder engagement, and an enabling policy framework. • The pace, scale, and scope of combined public and private efforts to improve climate preparedness and resilience of the energy sector will
need to increase given the magnitude of the challenge. • Some practices and technologies are already improving resilience to climate change, including deployment of dry cooling technology for
thermoelectric power plants, more energy-efficient building technologies, and storm-hardened energy infrastructure. • The federal government plays a key role in researching and developing technologies and providing information to promote climate
resilience, but enhanced private sector, state and local government, and non-governmental engagement is also essential to these efforts.

U.S. ENERGY SECTOR VULNERABILITIES TO CLIMATE CHANGE AND EXTREME WEATHER
37
prioritize actions in the face of uncertainty. In addition, advanced technological solutions that mitigate greenhouse gas emissions are essential. Ultimately, adaptation and mitigation can be complementary approaches that jointly reduce the costs and risks of climate change and extreme weather.
This chapter identifies opportunities for advancement of climate preparedness and resilience in the energy sector and potential areas of further work. Responding to the threats from climate change is the responsibility of all stakeholders, including both public and private sector actors. Any adjustments to future policies, existing federal efforts, or new undertakings would need to be evaluated thoroughly with complete consideration of an array of factors, including societal and economic costs and benefits, and consideration of competing priorities.
Adaptation Actions Underway Climate change adaptation requires improved understanding and commitment by individuals, businesses, governments, and others. Efforts to improve the capacity to predict, prepare for, and avoid adverse impacts must span multiple economic sectors and levels of government. These efforts include the deployment of energy technologies that are more climate-resilient, assessment of vulnerabilities in the energy sector, adaptation planning efforts, and policies that can facilitate these efforts. A significant number of actions underway may have been undertaken for reasons other than creation of a more climate-resilient energy sector and may have co-benefits in addition to increasing preparedness to climate change and extreme weather (Lackstrom et al. 2012, CEQ 2012, Preston et al. 2011, USGCRP 2009). These benefits include energy and national security, economic growth and job creation, emergency management and preparedness, public health, agricultural productivity, and ecosystem conservation, among others. The motivation and mechanisms to address energy sector vulnerabilities may vary across the nation and should be recognized in framing effective adaptation strategies.
Illustrative Current Activities: Climate-Resilient Energy Technologies and Practices Progress is being made to deploy energy technologies that will be less vulnerable to climate change and extreme weather. The following examples illustrate technologies and practices that are more climate-resilient and that are commercially available today.
Oil and Gas Exploration and Production
• Some energy companies are beginning to reuse hydraulic fracturing fluids to reduce freshwater requirements (Faeth 2012).
• The U.S. Army Corps of Engineers built a floodwall to
protect Texas City, Texas, and several nearby oil refineries from floods (DOE 2010).
• Petroleum companies are pre-positioning portable generators to provide electricity to critical facilities during outages (DOE 2010).
Thermoelectric Power Generation
• Cooling towers added in 2007 to the 1,250 MW Plant Yates in Newnan, Georgia, reduced water withdrawals by 96% (Tetra Tech 2008).
• The San Juan Generating Station in Waterflow, New Mexico, demonstrated innovative cooling towers fitted with condensing technology, which significantly reduced the release of water vapor (Figure 29). This system has the potential to condense as much as 20% of cooling water that would normally be lost from the system through evaporation. If applied to all power plants with cooling towers in the United States, the potential water savings could exceed 1.5 billion gallons per day (NETL 2010c).
Figure 29. San Juan generating station The cooling tower on the left in the image above has been fitted with innovative condensing technology, significantly reducing the release of water vapor. Source: NETL 2010c
Improving Climate Resilience in New York City In December 2012, in response to Hurricane Sandy, New York City Mayor Michael Bloomberg announced the formation of the Special Initiative for Rebuilding and Resiliency and charged it with producing a plan to provide additional protection for New York’s infrastructure, buildings, and communities given the anticipated impacts of climate change. A Stronger, More Resilient New York is the result of that effort (City of New York 2013). The report calls for $19.5 billion in investments designed to enhance climate preparedness and resilience in New York City, including the utility systems and liquid fuel supply. According to the report, nearly one-quarter of the city is projected to be in a 100-year floodplain by the mid-2050s. Hurricane Sandy caused an estimated $19 billion in losses to New York City, and the plan projects that in the absence of action, future storms the size of Sandy could cost the city $90 billion. If the plan is implemented, New York City would improve climate resilience and reduce expected losses from such events.

U.S. ENERGY SECTOR VULNERABILITIES TO CLIMATE CHANGE AND EXTREME WEATHER
38
• Dry-cooling systems have been installed in several natural gas-fired combined cycle power plants in the United States, including a natural gas-fired 540 MWe power plant in Boulder City, Nevada, and a 240 MWe combined cycle plant in Crockett, California (CEC 2006). Use of dry-cooling technology rather than recirculating cooling systems dramatically reduces water requirements, minimizing vulnerabilities to reduced water availability.
Renewable Energy Resources
• A CSP project currently under construction in California’s Mojave Desert (Figure 30) will be the largest CSP plant in the world and will use dry cooling technology. It is scheduled to begin delivering 370 MW of electricity to consumers in California in September 2013. The plant uses more than 173,000 heliostats to focus sunlight on three towers, where the concentrating solar power turns water into steam to drive conventional steam generators. Rather than using cooling water in a desert environment, the plant will employ a dry-cooling system that converts the steam back into water in a closed-loop cycle. This approach will allow the plant to reduce water usage by more than 95% compared to conventional wet-cooling systems (BrightSource 2012).
• Solar PV and wind energy have experienced cost reductions, encouraging greater market deployment of these more climate-resilient technologies. Solar PV modules have declined in cost at an average of 5%–7% per year since 1998 (DOE 2012e), and consume a fraction of the water of thermoelectric technologies (including CSP) per unit of electricity generated. The trends in costs, along with policies and programs that support solar installation, have partially contributed to a 53% average annual increase in new installations from 2006–2011 in the United States (DOE 2012e). Wind power has decreased from over $0.55/kWh in 1980 (2012 dollars) to under $0.06/kWh in 2012 in
areas with good wind resources (DOE 2012f). From 2008–2012, wind power represented 35% of all new installed U.S. generation capacity.
Energy Demand
• Energy efficiency upgrades can help offset the energy use impacts of additional market penetration of air conditioning and greater cooling degree days (CDDs) (ORNL 2012a). For example, in California energy savings from utilities’ energy efficiency programs and from the state’s building and appliance standards are estimated to have mitigated the need for 12,000 MW of generating capacity, equivalent to a minimum of 24 new, large-scale (500 MW) power plants since 1975 (CEC 2005).
• As temperatures increase, changes in urban planning and design may reduce or slow increases in electricity demand for cooling. In New York City, for example, efforts to reduce electricity use that have already been implemented include tree planting and green roofs, reducing peak electricity use in some neighborhoods by 2%–3% (AMS 2009). A 2010 study reported that replacing conventional roofs (with a solar reflectance of about 0.2) with cool white roofs (with a solar reflectance of 0.55) would lead to average nationwide savings of $0.356 per square meter (m2); savings would be much greater in Arizona ($1.14/m2) and less in West Virginia ($0.126/m2) (Levinson and Akbari 2010). The projected annual energy cost savings of retrofitting 80% of the roof area of conditioned commercial buildings nationwide is $735 million per year (Levinson and Akbari 2010).
• The development and deployment of energy- and water-efficient residential appliances and commercial equipment is resulting in significant reductions in both energy and water demand, and contributing to a more climate-resilient energy system. The Energy Policy and Conservation Act requires DOE to establish energy conservation standards for consumer products and commercial and industrial equipment as well as water conservation standards for residential and commercial products. The development and adoption of efficient technologies that meet or exceed these energy efficiency standards, adopted from 1987 through 2010 for residential appliances and equipment, have resulted in cumulative estimated savings of approximately 26 quadrillion BTU over this period, which is about 25% of total energy use in 2010 (Meyers et al. 2011). DOE estimates adoption of water conservation standards and energy conservation standards resulted in annual water savings of 1.5 trillion gallons in 2010, and projects a cumulative water savings of more than 51 trillion gallons by 2040 (Meyers et al. 2011).
Figure 30. Concentrating solar power plant in the Mojave Desert Source: BrightSource 2013

U.S. ENERGY SECTOR VULNERABILITIES TO CLIMATE CHANGE AND EXTREME WEATHER
39
Illustrative Current Activities: Information and Assessment In assessing the vulnerability of the energy sector to climate change and extreme weather, only a few recent efforts have taken a comprehensive sector- or region-wide approach. A few examples are:
• Gulf Coast vulnerability assessment: Entergy Corporation and America’s Wetland Foundation collaborated on the development of a framework that helped to inform economically sensible approaches to address risks and to build a resilient Gulf Coast (Entergy 2010). The study covers a wide region, including Texas, Louisiana, and coastal counties in Mississippi and Alabama, and is comprehensive across key economic sectors, including fuel supply, electricity generation, and residential and commercial demand sectors (Figure 31). The study projects that by 2030 there will be nearly $1 trillion in energy assets at potential risk from rising sea levels and more intense hurricanes. Based on an analysis of hazards, assets, and vulnerabilities, the Gulf Coast energy sector faces an
average annual loss from climate change and extreme weather of $8 billion in 2030. The study found that key “no regrets” options for adaptation have low investment needs, high potential to reduce expected losses, and additional strong co-benefits such as wetlands restoration. The most attractive investments would cost approximately $50 billion over the next 20 years, and could lead to approximately $135 billion in averted losses over the measures’ lifetime. The study also concluded that supporting and enforcing a range of actions to reduce the risks that individuals bear (e.g., through building codes and development decisions) and to unlock barriers to increasing industry resilience would be important elements of a coordinated response.
• Assessment of the potential for zero freshwater withdrawals from thermoelectric generation: The National Renewable Energy Laboratory and Sandia National Laboratories have conducted an innovative “coarse” scoping-level analysis of the costs and benefits of moving U.S. thermal electric generation away from the use of freshwater. Strategies include retrofitting or replacing existing thermal generation to the use of nontraditional water (brackish groundwater or municipal wastewater) or converting power plants to dry-cooling systems (Tidwell et al. 2013). This analysis suggests that the majority of plants most vulnerable to drought could be retrofitted for less than $4/MWh, or for less than a 10% increase in the
Figure 31. Illustrative view of projected Gulf Coast energy assets at risk by 2030 Source: Entergy 2010
Cost and Water Savings from Energy and Water Conservation Standards In 2010, reduced water use attributed to water conservation standards, together with energy conservation standards that also save water, resulted in estimated savings of nearly $30 million per day and more than 4 billion gallons of water per day (Meyers et al. 2011).

U.S. ENERGY SECTOR VULNERABILITIES TO CLIMATE CHANGE AND EXTREME WEATHER
40
levelized cost of electricity (LCOE), and result in significant reductions in freshwater use (Figure 32). The study found that total parasitic energy requirements are estimated at 140 million MWh, or roughly 4.6% of the initial production from the retrofitted plants. This includes an additional amount of electricity required to pump and treat water and any lost energy production due to reduced efficiencies associated with dry cooling. In general, retrofitting to utilize municipal wastewater is the least expensive alternative, followed by utilizing brackish water. Retrofitting to dry cooling was found to be the most expensive and to have the greatest impact on changes to the LCOE.
Figure 32. Changes in the levelized cost of electricity associated with retrofitting thermoelectric power plants to dry cooling or non-potable water, depending on which was the least expensive alternative Source: Tidwell et al. 2013
• California energy infrastructure vulnerability assessment: In the April 2012 California Energy Commission report, Estimating Risk to California Energy Infrastructure from Projected Climate Change (CEC 2012), researchers from Lawrence Berkeley National Laboratory, University of California at Berkeley, and the Federal University of Rio de Janeiro examined the end-of-century (2070–2099) vulnerability of California’s electricity sector to increased peak summer temperatures, sea level rise, and wildfires due to climate change. The report provides quantitative estimates of the long-term aggregate risks across California’s electricity sector, including climate-related impacts on power plant generation; transmission line and substation capacity during heat spells; wildfires near transmission lines; sea level encroachment on power plants, substations, and natural gas facilities; and peak electricity demand. This study provides insights
about key vulnerabilities that could inform an effective adaptation strategy. For example, electric utilities may be able to avoid electricity outages and prevent major economic damage by increasing generation, transmission, and distribution capacity and reducing risk from wildfires and sea level rise (CEC 2012). This may require additional capital to finance capacity and adaptation measures; current rate-setting practices may also need to change to allow the necessary improvements.
Illustrative Current Activities: Stakeholder Engagement The federal government, along with industry; state, local and tribal governments; and non-governmental organizations, has an important role in climate change adaptation planning. Examples of current federal adaptation planning efforts include the following:
• Interagency Climate Change Adaptation Task Force: In 2009, the Administration launched the Interagency Climate Change Adaptation Task Force, co-chaired by the White House Council on Environmental Quality, the Office of Science and Technology Policy, and the National Oceanic and Atmospheric Administration (CEQ 2013a). It includes representatives from more than 20 federal agencies, including DOE. The 2009 Executive Order 13514, Federal Leadership in Environmental, Energy, and Economic Performance12
The many outputs of the Task Force include the 2011 report, National Action Plan: Priorities for Managing Freshwater Resources in a Changing Climate (CEQ 2011), which provides key recommendations for strengthening federal water data systems, expanding water use efficiency, and supporting training and outreach to build a climate change response capability in the water sector. Two additional related reports include the National Ocean Policy Implementation Plan (CEQ 2013c) and the
called on agencies to evaluate and manage climate change risks and vulnerabilities and to develop approaches through which the policies and practices of the agencies could be made compatible with and reinforce climate change adaptation. The Task Force continues to integrate adaptation into federal government planning and activities, work with stakeholders to build resilience to climate change in communities and businesses, improve accessibility and coordination of science for decision-making, and develop strategies to safeguard natural resources and critical infrastructure in a changing climate.
National Fish, Wildlife and Plants 12 Executive Order 13514, 3 C.F.R. (October 5, 2009).
http://www.gpo.gov/fdsys/pkg/CFR-2010-title3-vol1/pdf/CFR-2010-title3-vol1-eo13514.pdf

U.S. ENERGY SECTOR VULNERABILITIES TO CLIMATE CHANGE AND EXTREME WEATHER
41
Climate Adaptation Strategy (CEQ 2012), both of which include considerations of climate effects on the energy system.
The Office of the Federal Environmental Executive in the White House Council on Environmental Quality also developed guidance for federal agencies to conduct adaptation planning and implementation, as required by Executive Order 13514. The first agency climate change adaptation plans, a part of the annually updated Strategic Sustainability Performance Plan, were released in 2013 (CEQ 2013b). DOE’s Climate Change Adaptation Plan integrates climate change adaptation planning into DOE programs and operations to ensure that DOE operations remain resilient under future climatic conditions.
• National Climate Assessment: The U.S Global Change Research Program (USGCRP) is working to improve the nation’s ability to understand, anticipate, and respond to climate change by providing the best available science to inform and support public and private decision-making at all levels. The Global Change Research Act of 199013
transportation, human health and welfare, human social systems, and biological diversity. It analyzes current trends in global change, both human-induced and natural; and projects major trends for the subsequent 25–100 years. The NCA is an important resource for understanding and communicating climate
requires the USGCRP to conduct a National Climate Assessment (NCA) every four years. The NCA process, which includes representatives from the public and private sector, is responsible for analyzing the effects of global change on energy production and use, the natural environment, agriculture, land and water resources,
change science and impacts in the United States, and it provides input for key stakeholders including governments, communities, businesses, and citizens as they incorporate climate preparedness into plans for the nation’s future. The third NCA is expected to be released in 2014.14
13 Available online: http://www.globalchange.gov/about/
global-change-research-act 14 A draft of the third NCA is available at:
http://ncadac.globalchange.gov/
• National Infrastructure Protection Plan (NIPP): The NIPP was developed by federal agencies, state and local governments, and private sector entities to provide a unifying framework for infrastructure protection efforts and resilience strategies (DHS 2009). The NIPP framework supports government and private sector decision-making to help ensure resources are applied where they can most effectively protect critical infrastructure and improve resilience. The NIPP includes efforts to prepare for and prevent, if possible, damage to critical infrastructure as well as to strengthen national response and recovery in the event of a deliberate attack or natural disaster. The Department of Homeland Security oversees NIPP management and implementation.
A successor to the NIPP will be released in late 2013 as required by the 2013 Presidential Policy Directive on Critical Infrastructure Security and Resilience (PPD-21). The updated NIPP―to be developed by stakeholders from federal, state, and local governments, and from critical infrastructure owners and operators―will include a risk management framework, methods for prioritizing critical infrastructure, metrics for demonstrating progress in managing risks, and additional efforts that are essential for strengthening and maintaining a secure, functioning, and resilient infrastructure.
Illustrative Current Activities: Innovation and Deployment Policy and Strategy In addition to information and stakeholder engagement, successful adaptation requires enabling policies and practices that facilitate public and private development and deployment of climate-resilient technologies and approaches. Among these are basic federal strategies to catalyze innovation and deployment. These include:
• National Principles for Adaptation: The Interagency Climate Change Adaptation Task Force developed national principles to foster government-wide actions that facilitate adaptation, including: building resilience in local communities, safeguarding critical natural resources such as freshwater, and providing accessible climate information and tools to help decision-makers manage climate risks.

U.S. ENERGY SECTOR VULNERABILITIES TO CLIMATE CHANGE AND EXTREME WEATHER
42
• Executive Order 13514: Federal Leadership in Environmental, Energy and Economic Performance: The Administration issued Executive Order 13514, which requires federal agencies to develop and strengthen programs to adapt to the impacts of climate change and ensures that Federal Agencies align their climate change adaptation planning efforts to build a coordinated and comprehensive response.
• Enabling Federal Energy Policies and Strategies for Development and Deployment of Climate-Resilient Energy Technologies: The Administration implements policies including incentives, standards, and government investments that are contributing either directly or indirectly to building a more climate-resilient energy sector (DOE 2011a). Specific examples include policies that promote expanding the use of renewable energy, such as wind energy, that is not dependent upon water availability; improved energy and water efficiency standards for appliances and equipment that reduce both energy demand and water use; and modernization of the electric grid to reduce vulnerabilities to climate change. Progress in these areas can reduce energy consumption and greenhouse gas emissions, while simultaneously reducing the vulnerability of the energy sector to climate change and extreme weather.
Major Opportunities Despite progress being made in several areas, the magnitude of the potential challenge posed by climate change and extreme weather requires additional efforts.
Opportunities: Climate-Resilient Energy Technologies and Practices Understanding the impact of climate change and extreme weather on future energy sources and technologies is critically important. While many impacts are anticipated, there is no single technology solution, and the climate resilience of any energy technology option will ultimately be measured by its ability to remain reliable under a broad range of environmental conditions. Figure 33 illustrates a range of technological options to improve climate resilience. Specific opportunities include the following:
Oil and Gas Exploration and Production
• Improved technologies to reduce freshwater use for fuels production—including for alternative or unconventional fossil fuels—by increasing utilization of degraded waters (e.g., produced waters) and nontraditional waters (e.g., brackish waters), or improving technologies for enhanced shale gas recovery such as dry fracturing processes (use of
exothermic reactions instead of water to fracture shale)
• Technologies to increase the resilience of coastal and offshore oil and gas production and distribution systems to extreme weather events
• Enhanced restoration technologies and practices to maintain or expand regional wetlands and other environmental buffer zones
Thermoelectric Power Generation
• Use of dry and wet-dry hybrid cooling technologies, water recapture and reuse technologies, and nontraditional waters (e.g., brackish and saline groundwater, municipal wastewater) for existing and future thermoelectric power plants
• Innovative water supply augmentation strategies, including alternative water sources and improvements in desalination technologies
• Increased power plant efficiency through integration of technologies with higher thermal efficiencies than conventional coal-fired boilers (e.g., supercritical and ultra-supercritical boilers and integrated gasification combined cycle)
• Advanced carbon capture and storage (CCS) systems that utilize efficient water use designs, and the potential to use saline waters extracted from CCS saline reservoirs and waste heat from thermoelectric power plants
• Improved design and placement of cooling water intake and outflow system channels and pipes to address changes in water levels and temperatures
• Improvements to power generation infrastructure to withstand more frequent and intense storms, flooding, and surges, including elevation of equipment and structures
Renewable Energy Resources
• Enhanced materials for CSP and PV solar to address the impacts of higher temperatures and related factors (e.g., higher humidity, cloud coverage, and dusty conditions) on the potential for electricity generation
• Improved reservoir management and turbine efficiency for more efficient hydropower generation
• Cost-effective, energy-efficient desalination technologies to address the current energy demand of desalination technologies, and the potential application of renewable desalination (e.g., solar desalination)
• Improved wind technologies and materials to withstand extreme weather events
• Improved climate resilience and water efficiency in bioenergy production; use of salt-tolerant feedstocks such as algal biomass that could reduce competition for freshwater

U.S. ENERGY SECTOR VULNERABILITIES TO CLIMATE CHANGE AND EXTREME WEATHER
43
Electric Grid
• Operational and infrastructure improvements to enhance safety, reliability, and performance of transmission and distribution systems, including measures to create additional system capacity and redundancy
• Practical models and tools for integrating renewable resources, demand side management, and alternative energy storage technologies
• Improved design standards for specific components of the smart grid and protective measures for lightning, wildfires, wind, flooding, and other extreme events
• Optimized storage technologies for varied load profiles, including onsite storage
• Improved grid monitoring capabilities and dispatch protocols to manage more varied load scenarios and improve timely restoration of power
• Development and use of microgrids, controlled islanding, distributed generation, and technologies to
maintain service and minimize system vulnerabilities in response to possible climate disruptions of the power grid
• Placement of substations and other critical local electricity infrastructure in locations that are not anticipated to be affected by storm surges
Energy Demand
• Enhanced demand-side management and development of energy/water-efficient and energy-smart appliances, equipment, buildings, and vehicles
• More energy-efficient freshwater extraction, distribution, use, and treatment technologies
• Enhanced demand-side management
Opportunities: Information and Assessment Despite increased awareness and improved understanding of potential impacts of climate change and extreme weather on the U.S. energy sector, the need for improved projections of future changes and resulting impacts
Figure 33. Illustrative technology opportunities to build a more climate-resilient U.S. energy sector

U.S. ENERGY SECTOR VULNERABILITIES TO CLIMATE CHANGE AND EXTREME WEATHER
44
remains. Typically, decision-making and engineering tools and practices rely on historical climate, natural resource, and hazard information. In a changing climate, these tools and practices may need to be adjusted. In addition, improving knowledge about interdependencies among energy sector components and across the energy sector and other sectors exposed to climate change risks and vulnerabilities is critical to supporting strategies and actions to reduce these vulnerabilities. Opportunities to enhance information and related tools and practices include the following:
• Better characterization at the regional and local levels of climate change trends relevant to the energy sector, including water availability, wind resources, solar insolation and cloud cover, and likelihood and magnitude of droughts, floods, storms, sea level rise and storm surge
• Better characterization at the regional and local levels of likely impacts of climate change and extreme weather on the energy system, including near-term and longer-term projections that have higher resolution and incorporate secondary effects (e.g., drought and wildfire)
• Identification of a consistent methodology and indicators to better prioritize and evaluate vulnerabilities and response actions; compare costs and benefits of adaptation intervention versus inaction (including the full costs of future critical infrastructure damage, loss of infrastructure, and power outages); and account for potential limitations of intervention measures over a range of spatial and temporal scales (including high-impact/low-probability events)
• Determination of the sensitivity of the energy sector to non-climate changes, such as changes in demographics, population, and economic activity and associated energy demand
• Better characterization of the aggregate vulnerabilities of the energy sector to climate change, as well as the interdependencies between the energy sector and other sectors (e.g., agriculture, transportation, and health), which can lead to cascading impacts and influence overall energy sector vulnerability
• Development of an inventory of climate-resilient technologies and practices, including information about development status, costs, benefits, and barriers, in order to help stakeholders identify, access, and adopt innovative energy technologies and practices
• Technology-, sector-, and region-specific analyses to better understand resilience strategies
• Data sets on demand response options under various climatic conditions
• Improved tools, methodologies, and analysis capabilities for life-cycle assessment of energy
technologies, with a particular focus on water use intensity optimization for the specific technology and across competing sectors (e.g., agriculture, industrial, and residential) at local, regional, and national levels
• Improved understanding of potential uses and challenges of advanced cooling technologies and alternative water sources for power production
• Additional assessment of potential impacts and resilience efforts for hydropower, including changes in generation and electricity costs, effects on reliability and the frequency of potential outages, potential for utilizing pumped storage generation (which can buffer timing between peak supply and load), improved analysis of land use planning and watershed management in relationship to the energy sector, and tools for predicting water quality impacts at hydropower facilities
• Improved understanding and application of multi-sector adaptation solutions that benefit energy, natural resources, and other sectors
Opportunities: Stakeholder Engagement The transition to a climate-resilient energy sector will require an improved understanding of the vulnerabilities, risks, and opportunities across society based on regular communication and outreach. A greater level of engagement between key stakeholder and user communities could facilitate such communication. Enhanced outreach could build on existing mechanisms and embrace new approaches for communication and education. Specific opportunities include the following:
• Enhanced federal interagency collaboration focused on climate-energy and energy-water challenges to address the entire energy value chain
• Effective coordination mechanisms with states, localities, and tribes to build capacity and to increase technical understanding
• Expanded programs to enable greater information sharing across the electricity generation sector and between the electricity sector and fuels sectors on existing adaptation actions and operating experiences, lessons learned, and potential adaptation opportunities
• Partnerships and initiatives between electric and water utilities to accelerate the cost-effective implementation of energy and water conservation, integrated resource planning, or other adaptation strategies
• Partnerships with investment, financial, and insurance communities to understand their potential role in climate change risk mitigation, including through the use of financial instruments like insurance
• Enhanced communication strategies to engage stakeholders, disseminate critical information, build

U.S. ENERGY SECTOR VULNERABILITIES TO CLIMATE CHANGE AND EXTREME WEATHER
45
awareness of climate risk, promote the widespread adoption of resilient technologies and practices, and evaluate societal responses to perceived risk in the energy sector
Opportunities: Innovation and Deployment Policy and Strategy An improved framework of enabling policies would further accelerate deployment of the technologies and approaches needed to build a climate-resilient energy sector in a timely manner. Novel policies may include those that enhance technological innovation and help to bring new technologies to market, including demonstration, or those that remove inappropriate barriers to the deployment of existing commercial technologies. In addition, existing policies could be examined in terms of how they increase or decrease climate resilience. Policy intervention, when deemed necessary, can occur at the federal, state, and local level, and solutions may or may not be best implemented from the federal level. Specific opportunities in the area of improving the enabling policy framework include the following:
• Continued research, development, and demonstration of climate-resilient energy technologies
• Enhanced deployment policies such as price signals and incentives for climate-resilient technologies
• Expanded demonstration and deployment of climate-resilient energy technologies on federal and tribal lands
• Integration of climate risk considerations in design, siting, and operation of energy facilities, through measures such as buildings standards and codes, and the review process for replacing or repairing damaged infrastructure
• Removal of inappropriate barriers that impede the transition to a climate-resilient energy sector
• Consideration of the impact of water policies and regulations on the energy sector and vice versa
• Incentives for decentralized power generation that could expand adaptive capacity by decreasing stress on the centralized power generation system
• Measures that promote integration of energy sector climate risks into different levels of development planning and maximize benefits of adaptation to multiple sectors
• Development and use of integrated decision frameworks for evaluating potential conflicts and trade-offs for achieving clean air, clean water, climate change mitigation, climate change adaptation, water resource conservation, and other relevant national priorities associated with energy supply and use

U.S. ENERGY SECTOR VULNERABILITIES TO CLIMATE CHANGE AND EXTREME WEATHER
46
CONCLUSION Climate change and extreme weather risks facing the U.S. energy sector are varied, complex, and difficult to project in terms of probability, timing, and severity. Climatic conditions are already affecting energy production and delivery in the United States, causing supply disruptions of varying lengths and magnitude and affecting infrastructure and operations dependent upon energy supply. These risks are expected to increase, and despite their inherent uncertainty, private entities, governments, and research institutions are taking action to further understand and reduce them. However, the magnitude of the challenge posed by climate change on an aging and already stressed U.S. energy system could outpace current adaptation efforts, unless a more comprehensive and accelerated approach is adopted.
The research community is making advances in basic climate science as well as in understanding how climate change affects energy production and use. Continued improvement is required to better assess, forecast, and respond to potential impacts of climate change and extreme weather on the energy sector. This includes consideration of scenarios characterized by gradual change as well as those characterized by lower probability, higher impact scenarios that cross thresholds that lead to irreversible climate changes outside the range of historical experience. In addition to improved understanding of the impacts on energy system components (e.g., oil and gas production or thermoelectric power generation), greater attention to the interdependency between these components, as well as between the energy sector and other sectors (e.g., water, transportation, agriculture, health, and communications) is critical. Finally, efforts to improve the sector-wide preparedness for climate impacts can share in, and create co-benefits for, efforts to improve preparedness and planning for non-climate disasters and disruptions that may threaten the energy sector.
While it is expected that climate change will, on balance, create more challenges and costs for the energy sector, there are potential benefits to the energy sector as well. Examples include reduced average heating loads during the winter in parts of the United States, such as New England, and the opening of new regions to offshore oil and gas exploration due to shrinking sea ice cover in the Arctic.
In addition to an improved characterization of vulnerabilities, there is a need to understand probabilities and prioritize potential response actions. As yet, the economic implications of energy sector vulnerabilities to climate change and extreme weather have not been adequately characterized. There are no commonly accepted methodologies or sets of indicators to compare and
prioritize risks and adaptation needs or the effectiveness of adaptation measures across the energy sector.
Actions to build resilience do not need to wait for a complete understanding of climate change and extreme weather impacts, as there will always be uncertainty. Plans can be adjusted as understanding of impacts increases. In the near term, adaptation efforts should be flexible and could focus on assessing vulnerabilities and implementing actions that are low-cost; actions that end or reverse policies that have unintended negative consequences for resilience; and win-win measures that promote other national objectives, such as energy and national security, economic growth and job creation, and public health. This “no regrets” approach can ensure appropriate action in the face of uncertainty. In the long term, a robust adaptation strategy will require more transformative and innovative solutions, including enhanced basic and applied research, as well as new enabling frameworks.
Specifically, such a strategy will require accelerated private and public sector investment in research, development, demonstration, and deployment of innovative energy technologies. Current energy technologies were in large part developed and deployed to meet design specifications that do not address the full set of challenges posed by climate change and extreme weather. A range of technological options will be necessary to improve the climate preparedness and resilience of the energy sector and to ensure the nation’s energy system remains reliable under a broad range of environmental conditions.
In addition, a robust strategy will require regular dialogue and exchange between industry, governments, technical institutions, and non-governmental organizations that are active in basic and applied research, energy system planning, siting, and adaptation, as well as new attention to adaptation policy development. DOE can play a critical role in many of these activities by facilitating basic scientific discovery, enhancing research, development, demonstration, and deployment; convening and partnering with stakeholders; providing technical information and assistance; and fostering enabling policies.
Since all nations are at risk from the impacts of climate change, the challenge of climate change adaptation is global. Energy sector interdependencies extend beyond national boundaries, and international collaboration among nations facing similar challenges can further enhance national energy security objectives. Finally, advancement of climate-resilient energy technologies in the United States will enhance market opportunities for these new technologies around the world, thereby promoting U.S. economic growth and security.

U.S. ENERGY SECTOR VULNERABILITIES TO CLIMATE CHANGE AND EXTREME WEATHER
A-1
APPENDIX: Climate and Extreme Weather Trends in the United States Numerous observed climate change trends are projected to continue to occur through this century. These trends include: • Increasing air and water temperatures • Decreasing water availability in some regions and
seasons • Increasing intensity and frequency of storms, flooding,
and sea level rise This appendix expands upon historic climate trends and weather events noted in Chapters 1, 2, and 3. It also summarizes projections of future climatic conditions across the United States, with a specific focus on climatic conditions that already affect or could affect the energy sector. Recognizing that these changes will affect parts of the energy sector in different ways and that relative impacts will vary by region, this appendix includes regional distinctions where possible.
Brief Overview of Climate in the United States The U.S. climate exhibits distinct regional characteristics. Alaska is characterized by long coastlines, large areas of permafrost, and extreme cold temperatures. Parts of the Northwest receive more precipitation than anywhere else in the country. Arid conditions are found in the Southwest’s deserts and parts of the Western interior. The Gulf and Atlantic Coasts are humid and hot during the summer and face the risk of hurricanes and tropical storms.
Both short- and long-term averages and variability in climatic conditions affect U.S. energy resources and demand. An understanding of past and potential future trends is important to optimally manage energy resources, identify potential vulnerabilities, and reduce associated risks.
Climate Extremes
With its diverse geography, extensive coastline, and range of latitudes, the United States experiences numerous extreme events that, in any given year, may cause billions of dollars in damage.15
15 An event is considered “extreme” if the value of the variable
(e.g., degrees for temperature) is above or below a threshold value near the upper or lower bound of the observed values for that variable (IPCC 2012).
Extreme events that affect the United States may include extreme cold; wildfires; heat waves and extreme heat; drought; flooding; heavy precipitation, downpours, and hail; and hurricanes and tropical storms. Since 1980, there have been more than 130 extreme events in the United States that have caused
$1 billion or more in damage (NOAA 2013a, Lubchenco and Karl 2012).
In 2012, the United States experienced numerous noteworthy extreme weather events, including historic high temperatures and droughts, above-average wildfires, multiple severe storms that disrupted power to millions, and multiple severe heat waves (NOAA 2013c). Since record keeping began in 1895, the warmest year recorded in the United States was 2012, with July 2012 being the hottest recorded month (NOAA 2013c). The average annual temperature for 2012 in the United States was 55.3°F (12.9°C), 3.2°F (1.7°C) above the 20th century average (NOAA 2013c).
In June 2012, wildfires burned more than 1.3 million acres, the second most on record for the month and a 59% increase from the 10-year monthly average.16
Climate Change: Projections and Uncertainties
In mid-July 2012, more than 60% of the contiguous United States was experiencing drought conditions (NOAA 2012c).
Climate change refers to a significant change in the mean or variability of a particular climate phenomenon (e.g., temperature or precipitation) that persists for an extended period of time, typically several decades or longer (IPCC 2012, EPA 2010a). In its most recent definition, the Intergovernmental Panel on Climate Change (IPCC) specifies that climate change can be a result of natural processes or persistent anthropogenic changes to the atmosphere or land use (IPCC 2012). The IPCC uses terms such as “likely” and “very likely” (Table 5) to indicate the level of confidence the IPCC has about an outcome.
Uncertainty inherent to climate models is largely due to some natural processes (e.g., cloud processes and ice sheet dynamics) that are not completely understood or not robustly resolved in current general circulation models (GCMs). These issues introduce uncertainty into model output and climate change projections. In addition, the amount of long-term historic data available is not consistent among climate variables, which adds to the difficulty in making future predictions.
16 From 2001–2010 the average number of acres burned in the
month of June was 858,169.9 acres. Over the same decade, the months of July and August saw about twice as many acres burned as the month of June (NOAA 2012c).

U.S. ENERGY SECTOR VULNERABILITIES TO CLIMATE CHANGE AND EXTREME WEATHER
A-2
Table 5. Likelihood scale from the IPCC Fourth Assessment Report (AR4)
Modeling future climatic conditions also requires assumptions about global greenhouse gas (GHG) emissions trajectories, which are affected by factors including human behavior, demographic patterns, fuel choices, and economic growth. Selecting a future emissions trajectory adds additional uncertainty to the modeling endeavor. The IPCC modeling teams developed numerous socioeconomic storylines with associated emissions scenarios and narrowed them down to six groups most commonly used: A1 (divided into A1FI, A1T, and A1B) A2, B1, and B2. No relative likelihoods were assigned (IPCC 2000).
The A1 storyline assumes a world of very rapid economic growth, global population peaking mid-century, and rapid introduction of new and more efficient technologies. A1 is divided into three groups that describe alternative directions of technological change: fossil intensive (A1FI), non-fossil energy resources (A1T), and a balance across all sources (A1B). A2 describes a very heterogeneous world with high population growth, slow economic development, and slow technological change. B1 describes a convergent world with the same global population as A1, but with more rapid changes in economic structures toward a service and information economy. B2 describes a world with intermediate population and economic growth, emphasizing local solutions to economic, social, and environmental sustainability (IPCC 2000).
Projections of end-of-century temperature change and sea level rise differ between these six emissions scenarios. Whenever possible, this report distinguishes projections related to lower emissions scenarios, typically the B1 scenario, from those related to higher emissions scenarios, typically the A2 scenario. In a few cases, this report presents results of studies that used the B2, A1B, or A1FI scenarios.
Increasing Temperatures and Related Climate Variables Chapter 1 reviews recent trends and projections for increasing temperatures in the United States. Additional details are provided below on the historic and projected trends by impact type, with reference to specific regional examples.
Air Temperatures
Historic trends: Since the start of the 20th century, average annual temperatures across the United States increased by approximately 1.5°F (0.8°C) (NOAA 2013b, EPA 2012a); however, since the 1980s, the average rate of warming has accelerated (WMO 2013, EPA 2012a). Over the past 30 years, temperatures have risen faster in winter than in any other season, with average winter temperatures in the Midwest and northern Great Plains increasing more than 7ºF (USGCRP 2009).
Temperature-related statistics from the past 20 years reveal the increased pace and magnitude of warming:
• The hottest year on record for the United States was 2012 (NOAA 2013c) with average annual temperature of 55.3°F (12.9°C), or 3.2°F (1.7°C) above the 20th century average and 1°F (0.6°C) warmer than the previous record warm year of 1998 (NOAA 2013c).
• Since 2000, most of the United States has averaged 1–2°F (0.6–1.1°C) warmer than the 1960s and 1970s (USGCRP 2009).
• The hottest decade on record for the United States was 2000–2009 (NOAA 2010).
Projected changes: In the near-term (2021–2050), average annual temperatures are projected to increase across the United States by approximately 2.5°F (1.4°C) in a lower emissions scenario (B1), and by 2.9°F (1.6°C) in a higher emissions scenario (A2), when compared to the climate of 1971–1999 (NOAA 2013b). The range in end-of-century estimates is much greater. By 2070–2099, temperatures are projected to increase by 4.8°F (2.7°C) under a lower emissions scenario (B1) and by as much as 8°F (4.4°C) under a higher emissions scenario (A2) in the United States (NOAA 2013b). There are also seasonal differences in projected warming trends (Figure 34). Greater warming is projected in the summer than in the winter for most of the United States, with the exception of Alaska, parts of the Northeast, and northern parts of the Midwest (NOAA 2013b, USGCRP 2009).
Heat Waves and Extreme Heat
Historic trends: Heat waves (a period of several days to weeks of abnormally hot weather, often with high humidity) have generally become more intense across the United States in the decades since 1960 (EPA 2012a, USGCRP 2009, CCSP 2008b). Recent heat waves have

U.S. ENERGY SECTOR VULNERABILITIES TO CLIMATE CHANGE AND EXTREME WEATHER
A-3
been characterized by high humidity and high nighttime temperatures (USGCRP 2009, CCSP 2008b). The past decade (since 2000) had the second most extreme heat events17
17 Defined by the number of events that exceeded a 1-in-5-year
recurrence interval
on record in the United States, after the 1930s (NOAA 2013b). The heat waves of 2011 and 2012 set records for highest monthly average temperatures on record in the United States, exceeding in some cases records set in the 1930s. The largest geographic extent of record highs was in 2012, including both daytime and nighttime temperatures (Karl et al. 2012). High humidity levels and high nighttime temperatures have distinguished heat waves in recent decades from those of the 1930s (NOAA 2012b, USGCRP 2009, CCSP 2008a). The fraction of the United States with extremely high (i.e., above the 90th percentile) minimum summer temperatures has been increasing since the 1970s, and has been particularly high during the past decade (2001–2010).
Projected changes: All regions of the United States are very likely to experience an increase in maximum temperature as well as an increase in frequency, and/or intensity of heat waves (IPCC 2012, USGCRP 2009). Across the United States, high annual temperatures are projected to increase, as are nighttime temperatures (NOAA 2013b, USGCRP 2009, CCSP 2008b). Projections suggest that summertime temperatures that ranked among the hottest 5% in the 1950–1979 period will occur at least 70% of the time by mid-century under a higher emissions scenario (A2) (Duffy and Tebaldi 2012). Heat wave events that are currently characterized to be once-in-20-year events are projected, under the A2 scenario, to occur every two or three years by the end of the century over much of the continental United States (CCSP 2008a).
Water Temperatures
Historic trends: Water temperatures of rivers, streams, and lakes rise as the air temperature rises and water levels drop. Warmer water temperatures can increase evaporation rates, further lowering water levels. Water temperatures have increased in some streams in the United States, particularly during low-flow periods, and in the Great Lakes where lake ice coverage has been decreasing since 1970 (USGCRP 2009).
Projected changes: Water temperatures are projected to increase across the United States. A 2012 study reports that the average summer temperatures of rivers in the United States are projected to increase 1.2°–1.6°F (0.7°–0.9°C) by 2040, and 2.5°–4.3°F (1.4°–2.4°C) by 2080 (van Vliet et al. 2012). Others suggest that water temperatures could increase during this century by as much as 3.5°–12.5°F (2°–7°C) (IPCC 2007a). An assessment of California’s San Francisco Bay-Delta-River System projects river temperatures increasing at a rate 0.5°F (0.3°C) per decade through the end of the century under a higher emissions scenario and 0.2°F (0.1°C) per decade under a lower emissions scenario, with even warmer temperatures in the Delta (Cloern et al. 2011). The greatest water temperature increases are projected for the southern part of the Mississippi Basin and along the East Coast (van Vliet et al. 2012).
Sea Ice and Permafrost
Historic trends: Since 1951, average annual temperatures in the Arctic have increased at approximately twice the global average rate. Since the 1970s, permafrost temperatures have increased throughout Alaska. The extent of Arctic sea ice cover during summer months has declined, particularly north of Alaska (WMO 2013, NASA 2012, USGCRP 2009). In 2007, the Northwest Passage was ice-free for the first time in modern history. For the most recent annual Arctic sea ice melting ending on September 16, 2012, the Arctic sea ice extent dropped to
Figure 34. Projected seasonal differences in temperature The maps show temperature differences for 2041–2070 compared to the reference period of 1971–2000. These are multi-model means from 11 NARCCAP regional climate simulations for the higher (A2) emissions scenario. Source: NOAA 2013b

U.S. ENERGY SECTOR VULNERABILITIES TO CLIMATE CHANGE AND EXTREME WEATHER
A-4
1.32 million square miles (3.41 million square km), the lowest value ever recorded. The annual minimum extent was 49% below average and 290,000 square miles (760,000 square km) below the previous smallest extent, which occurred in September 2007 (NASA 2012). Projected changes: According to the IPCC’s Fourth Assessment Report, the extent of Arctic sea ice is projected to continue to decrease. Some models indicate that by the end of the century summer sea ice could disappear altogether (Stroeve et al 2012, Kay et al. 2011, Wang and Overland 2009, IPCC 2007d). For every 2°F (1.1°C) of warming, models project about a 15% decrease in the extent of annually averaged sea ice and a 25% decrease in September Arctic sea ice (EPA 2012b). In addition, permafrost is expected to continue to thaw in the northern latitudes (EPA 2012b).
Length of Growing Season
Historic trends: Since the beginning of the 20th century, the average length of the growing season, or frost-free season, in the United States has increased by about two weeks (EPA 2012a), as the last spring day with a temperature of 32°F (0°C) has been occurring earlier while the first autumn day with freezing temperatures has been occurring later (NOAA 2013b). This trend is strongest in the western states. The growing season has increased 2–3 weeks in the Northwest and Southwest, 1–2 weeks in the Midwest, Great Plains and Northeast, and slightly less than 1 week in the Southeast (USGCRP 2009).
Figure 35. Projected changes in frost-free season The map shows projected increases in frost-free days for mid 21st century (2041–2070) compared to the end of the 20th century (1980–2000) under a higher (A2) emissions scenario. Source: NOAA 2013b
Projected changes: The length of the growing season throughout the United States is projected to continue to increase, as shown in Figure 35 (NOAA 2013b, USGCRP 2009). The largest increases are expected for the western states (NOAA 2013b, USGCRP 2009).
Wildfires
Historic trends: In 2012, more than 9.2 million acres burned nationwide, with fires setting records in many states both in terms of acres burned (e.g., New Mexico) and economic damages (e.g., Colorado) (NOAA 2013c). The wildfire activity of 2012 supplanted 2011 as the year with the third most acres burned, behind 2006 and 2007. Although the number of fires was below average, the size of the fires notably increased (NIFC 2012). In the western states, the wildfire season has increased by nearly 80 days during the past three decades and the average duration of large fires has almost quadrupled, from 7.5 days to 37 days (IPCC 2007a). These increases are attributed to both changes in forest management practices and increasing temperatures coupled with earlier spring snowmelt, drying soils, and vegetation (USGCRP 2009).
Projected changes: The frequency of wildfires is projected to increase in some parts of the United States, particularly Alaska and parts of the West (USGCRP 2009). Annual mean area burned in the western United States is projected to increase by 54% by the 2050s compared to the present day (Spracklen et al. 2009). The frequency of wildfires is projected to decrease in certain regions, although the frequency in others, such as in the Pacific Northwest, may increase by as much as 175% (Spracklen et al. 2009).
Wind Speed
Historic trends: A comprehensive comparison of eight datasets that included historical wind speeds over the United States (from both observational and reanalysis datasets) revealed substantial differences in temporal trends in wind speeds among different datasets. The observational datasets show trends of annual mean wind speed, but reanalysis datasets suggest conflicting trends (Pryor et al. 2009). As climate change research continues, additional insights into historical wind speed trends may become available.
Projected changes: While models indicate that wind speeds could change significantly in future years, there is no consistent agreement between GCMs about the magnitude or direction of change (Sailor et al. 2008). By 2050, average annual wind speeds in the United States could decrease by 1%–3% (Breslow and Sailor 2002) and by as much as 3%–14% at times in the Northwest according to a 2008 study (Sailor et al. 2008). A more recent evaluation of several regional climate models suggests that changes in U.S. wind resources through the

U.S. ENERGY SECTOR VULNERABILITIES TO CLIMATE CHANGE AND EXTREME WEATHER
A-5
middle of this century will not exceed changes associated with historic variability (Pryor and Barthelmie 2011). For example, a comparative modeling study of the same location resulted in two models indicating a 5% increase in monthly wind speeds, as well as two different models projecting a decrease of as much as 4% (Sailor et al. 2008).
Cloud Cover
Historic trends: Cloud cover data from more than 100 stations indicate that, from 1970–2004, total cloud cover increased by approximately 1.4%. Increases occurred in nearly all parts of the United States except the Northwest (AMS 2006).
Projected changes: Understanding how cloud cover and humidity change is important for understanding future solar resource potential. However, the impacts of climate change on cloud cover are uncertain because the response of clouds is difficult to simulate in GCMs (AMS 2006). For example, predicting how the distribution of various kinds of clouds will change with increasing temperatures is complicated by factors such as temperature gradients in the atmosphere at different latitudes and the interaction between clouds and regional wind systems (NASA 2013a).
Decreasing Water Availability Chapter 2 provides an overview of recent trends and projections for decreasing water availability in the United States. Additional detail is provided below on historic and projected trends by impact type, with reference to specific regional examples.
Precipitation
Historic trends: Since 1901, total annual precipitation in the United States increased at an average rate of about 5.9% per century (EPA 2012a), although there was notable spatial variation. As illustrated in Figure 36, some parts of the country experienced a large increase in annual precipitation while others experienced a decrease (NOAA 2013b, USGCRP 2009). Precipitation has increased the most in the Northeast, Midwest, and southern Great Plains. In contrast, portions of the Southeast, the Southwest, and the Rocky Mountain states have experienced decreases (USGCRP 2009). Precipitation trends have also varied seasonally. For example, precipitation decreased throughout the year in the Northwest (with the exception of spring), whereas precipitation in the Southwest decreased in summer and fall but increased in winter and spring (USGCRP 2009).
Figure 36. Observed changes in annual precipitation in the United States (1991–2011) The colors on the map show annual precipitation changes (percent) for 1991–2011 compared to 1901–1960 average. Source: NOAA 2013b

U.S. ENERGY SECTOR VULNERABILITIES TO CLIMATE CHANGE AND EXTREME WEATHER
A-6
Projected changes: Precipitation patterns will continue to change during the 21st century. Average annual precipitation is generally projected to increase, particularly in the northern states, but less precipitation is projected for the southern states, especially the Southwest (NOAA 2013b, USGCRP 2009, IPCC 2007a). Average annual precipitation is projected to increase in Alaska in all seasons (USGCRP 2009).
Figure 37. Projected changes in precipitation by season Projected percent change in seasonal precipitation for 2041–2070 compared to 1971–2000, under an A2 emissions scenario. Source: NOAA 2013b
Seasonal trends in precipitation may be more relevant than annual trends for understanding regional water availability. As shown in Figure 37, the summer is expected to be drier for most of the United States (NOAA 2013b). The winter and spring are expected to be much wetter in the northern half of the country. By the end of the century, winter precipitation in the Northeast is projected to increase 20%–30%, whereas annual precipitation in that part of the country is only projected to increase by about 10%. Less winter and spring precipitation is projected for the Southwest over this century (USGCRP 2009).
Snowpack, Runoff, and Streamflow
Historic trends: Temperature and precipitation patterns affect snowpack, runoff, and streamflow. Mountain snowpack is an important component of the water cycle in the western states, often serving as a natural reservoir storing water in the winter and releasing it in spring and early summer when the snow melts. Millions of people in the West depend on the springtime melting of mountain snowpack for power generation, irrigation, and domestic and industrial use (EPA 2010a). Runoff, excess water from rainfall or snowmelt that does not evaporate, flows over the land and ends up as streamflow. Streamflow influences the amount of water available for power generation, irrigation, domestic supply, and other competing uses.
The fraction of precipitation falling as rain rather than snow has increased in many parts of the United States during the past 50 years (USGCRP 2009), reducing total snowpack and increasing the risk of water shortages in the summer and fall. Total seasonal snowfall has generally decreased in southern and some western areas (Kunkel et al. 2009b), increased in the northern Plains and Great Lakes (Kunkel et al. 2009a, Kunkel et al. 2009b), and not changed in other areas, such as the Sierra Nevada (Christy 2012). In 2012, the nation experienced the third smallest winter snow cover extent in recorded history. Below average snowpack was observed for much of the western United States (NOAA 2013c). This is particularly relevant to the energy sector in areas with snowmelt-driven watersheds, such as the West, where the fraction of precipitation falling as rain increased by almost 10% over the past five decades (Knowles et al. 2006). During roughly the same period, the April 1st snow water equivalent (SWE) declined at most measurement sites in the West. The average decline in the Cascade Mountains was 25% (USGCRP 2009), with losses at some measurement sites exceeding 75% (EPA 2010a).
As a result of earlier snowmelt, since the mid 20th century seasonal runoff has been occurring up to 20 days earlier in the West and up to 14 days earlier in the Northeast (USGCRP 2009). The lack of snowfall across the Rockies, Great Plains and Midwest was a precursor to the record breaking droughts that impacted two-thirds of the United States during the summer and fall of 2012 (NOAA 2013c).
Generally, regions and seasons that have experienced increased rainfall have also experienced increased streamflow. Just as precipitation has increased in the Northeast and Midwest during the last century, so has average annual runoff (USGCRP 2009). However, streamflow in the snowmelt-driven Rocky Mountain region has decreased by approximately 2% during the last century (IPCC 2007a).
Projected changes: As temperatures increase, more precipitation is expected to fall as rain, not snow, particularly in the Northeast and Northwest and in mountainous regions across the United States (USGCRP 2009), reducing the extent and depth of snowpack. Snowpack in the mountains of the western and southwestern states are projected to decrease significantly by mid-century (USGCRP 2009, IPCC 2007a). By the 2040s, April 1st SWE in the Cascade Mountains is projected to decrease by as much as 40% (USGCRP 2009).
Due to reductions in snowpack, earlier snowmelt, and changes in snowfall patterns, average winter and spring streamflows are projected to increase in the western states, summer streamflows are projected to decrease (IPCC 2007a), and peak runoff is projected to continue to occur

U.S. ENERGY SECTOR VULNERABILITIES TO CLIMATE CHANGE AND EXTREME WEATHER
A-7
earlier (USGCRP 2009). Under a higher emissions scenario (A2), peak runoff at the end of the century in snowmelt-driven streams is projected to occur as much as 25 to 35 days earlier compared to 1951–1980 (USGCRP 2009).
Although wet regions will generally become wetter and dry regions will become drier (USGCRP 2009), changes in streamflow are projected to vary spatially and seasonally. The direction of change varies for some regions over time. For example the Upper Colorado, Lower Colorado, Rio Grande, and Arkansas River basins are projected to experience an increase in average annual runoff in the very near-term (2010–2024), but a decrease by mid-century (2025–2039). By mid-century, runoff is projected to decrease in the Apalachicola-Chattahoochee-Flint River Basin (near the borders of Alabama, Georgia, and Florida). This region has struggled since 1990 with challenges due to ongoing water scarcity.
Finally, low flows (the 10th percentile of daily river flow) in rivers across the United States are projected to decrease by the 2040s in both a lower (B1) and higher (A2) emissions scenario by 4% and 12%, respectively, and by 15% (B1) or 19% (A2) by 2080. The greatest decreases in low river flows (reduced river flow for the lowest 10% of daily river flows) are projected for southern and southeastern regions of the United States, where flows are projected to decrease by more than 25% in a lower emissions scenario, and by more than 50% (in some parts of the Southeast) in a higher emissions scenario (van Vliet et al. 2012).
Droughts
Historic trends: Since the beginning of the 20th century, there has been little change in drought trends at the national level. However, drought conditions vary regionally. Certain regions have experienced more frequent and intense droughts (NOAA 2013b, USGCRP 2009). During the past 40 years, much of the Southwest, southern Great Plains, and Southeast experienced an increase in drought conditions (USGCRP 2009, CCSP 2008b), whereas the Northeast, Great Plains, and Midwest experienced a decrease (USGCRP 2009). The first decade of the 21st century was particularly dry in the western states (CCSP 2008b). In 2012, more than 60% of the contiguous United States experienced drought conditions (NOAA 2013c).
Projected changes: A greater risk of drought is expected in the future, with dryer summers and longer periods between rainfall events (IPCC 2007d). Under higher emissions scenarios, widespread drought is projected to become more common over most of the central and southern United States (Dai 2012, Hoerling et al. 2012b, Schwalm et al. 2012b, Wehner et al. 2011, Cayan et al. 2010). Overall, the frequency, intensity, and duration of
droughts are likely to increase and water levels are likely to decrease (USGCRP 2009, CCSP 2008a).
Groundwater Levels
Historic trends: In many parts of the United States, groundwater is being depleted at rates faster than it is being recharged, including in the High Plains (the location of the Ogallala aquifer), the California Central Valley, the Chicago-Milwaukee area, west-central Florida, and the desert Southwest, among others (USGS 2013a). In parts of Kansas, Oklahoma, and Texas groundwater levels were more than 130 feet (40 meters) lower in 2007 than in 1950 (UT Austin 2012).
Projected changes: The impact of climate change on groundwater recharge and availability is not well understood. However, a combination of changes in precipitation and increases in evaporation rates, droughts, and competition for water may decrease groundwater availability, particularly in the central and western states, as heavily utilized aquifers experience reduced recharge rates (IPCC 2007a).
By the end of the century, natural groundwater recharge in the Ogallala aquifer is projected to decrease by more than 20%, under warming of 4.5°F (2.5°C) or greater (IPCC 2007a).
Increasing Storms, Floods and Sea Level Rise Chapter 3 provides an overview of recent trends and projections for sea level rise and increasing frequency and intensity of storms and flooding in the United States. Additional detail is provided below on the historic and projected trends by impact type, with reference to specific regional examples.
Tropical Storms, Hurricanes, and Winter Storms
Historic trends: The number of land-falling tropical storms and hurricanes in the United States since 1900 has fluctuated over the course of the century (NHC 2012). However, the intensity of hurricanes and tropical storms since the 1970s has increased (IPCC 2012, USGCRP 2009, IPCC 2007d). In 2012, the number of storms that reached hurricane strength was above average, while the number of major hurricanes (i.e., Category 3 or above) was below average (NOAA 2013c).
One metric for characterizing the strength of a tropical cyclone is the Accumulated Cyclone Energy (ACE) Index. According to the ACE index, there was no noticeable trend in storm intensity from 1950–2009, although storm intensity has increased more recently, from 1990–2009 (EPA 2010a). A second metric, the Power Dissipation Index (PDI), shows a strong upward trend in intensity since 1995 (EPA 2010a). Using the same index, the U.S. Climate Change Science Program (CCSP) concluded in

U.S. ENERGY SECTOR VULNERABILITIES TO CLIMATE CHANGE AND EXTREME WEATHER
A-8
2008 that hurricane intensity in Atlantic has substantially increased since 1970 (CCSP 2008b). It is worth noting, however, that technological advances have continually improved monitoring and detecting capabilities, so the increase may be, in part or entirely, an artifact of improved detection.
Winter storms have increased in frequency from 1901–2000 in the Northeast and upper Midwest, and their storm tracks suggest a northward shift (Wang et al. 2012, CCSP 2008b). Winter storms in the South and southern Midwest regions have decreased in frequency during the same period (CCSP 2008b).
Projected changes: Tropical storm wind speeds and the intensity of hurricanes are projected to increase (including higher peak wind speeds, more rain, and a larger storm surge) as atmospheric and sea surface temperatures rise (NOAA 2013b, CCES 2012, USGCRP 2009, CCSP 2008b, IPCC 2007d). If sea surface temperatures rise by 3°F (1.6°C), some projections indicate that tropical wind speeds could increase by as much as 13%, with 10%–31% more precipitation (CCSP 2008a). Other reports suggest that for each 1.8°F (1°C) increase in tropical sea surface temperature, wind speeds of the strongest hurricanes could increase by 1%–8% and rainfall rates of hurricanes could increase by 6%–18% (CCSP 2008b). Recent analyses suggest an increase in intensity and in the number of the most intense hurricanes over this century (Figure 38).
Figure 38. Projected changes in Atlantic hurricane frequency by category The chart shows model projections of percentage changes in Atlantic hurricane and tropical storm frequencies for different storm categories for the period 2081–2100 compared with the period 2001–2020. Source: Bender et al. 2010 However, there remain significant uncertainties due to the complexities associated with the atmospheric conditions that lead to a hurricane; it is difficult to predict exactly how climate change will affect the occurrence of hurricanes (IPCC 2012, USGCRP 2009). According to the Intergovernmental Panel on Climate Change, the intensity
of these storms is likely to increase (IPCC 2012), as shown in Figure 38. Other research suggests that fewer hurricanes will form, but those that do will be stronger (Category 4 or 5) (CCES 2012, Knutson et al. 2010).
Winter storms are expected to shift storm tracks northward due to changes in atmospheric circulation, although the intensity and frequency of winter storms are highly uncertain (NOAA 2013b, USGCRP 2009). Snowfall along the downwind coasts of the Great Lakes could increase as warming temperatures enhance lake-effect snow (USGCRP 2009). Some studies have shown that there is a trend towards stronger North-Atlantic storms that could increase the intensity of winter extratropical cyclones (e.g., nor’easters), although this is not conclusive (CCSP 2008a).
Sea Level Rise (SLR)
Historic trends: Globally, absolute sea level rose at an average rate of 0.07 inches (1.8 mm) per year from 1880–2011, but from 1993–2011 the average sea level rose at a rate of 0.11–0.13 inches (2.8–2.2 mm) per year (EPA 2012a). The rate of global sea level rise over the last twenty years is double the rate observed over the last century (Church and White 2011). Relative sea level, the combination of SLR and local land sinking, rose along much of the U.S. coastline in the period 1958–2008, particularly the Mid-Atlantic and parts of the Gulf Coast, where some stations registered increases of more than 8 inches (20 cm) (USGCRP 2009). Relative sea level is estimated to be rising at a rate of 0.11 inches/year (3 mm/year) in Florida and 0.17 inches/year (4.3 mm/year) in the northeastern states (Kopytko and Perkins 2011).
Projected changes: Continued global sea level rise will affect most coastal regions of the United States. Future sea level rise over the rest of this century is projected to increase at a faster rate than over the last century (NOAA 2012f, Willis et al. 2010). The projected range of global average sea level rise is described by NOAA with a range of scenarios from lowest to highest (NOAA 2012f). The lowest projection, a linear extrapolation of historic sea level rise over the 20th century, anticipates 8 inches (0.2 meters) rise by 2100 relative to 1992 levels (NOAA 2012f). The highest projection, based on the highest level of plausible contributing factors, anticipates 6.6 feet (2 meters) of rise by 2100 (NOAA 2012f). A confidence interval of greater than 90% is ascribed to this range. An intermediate-low to intermediate-high range for projections of global average sea level rise is 1–4 feet (0.25–1.2 meters), based on a set of intermediate assumptions (NOAA 2012f). Other recent work also suggests that a rise in sea level of 4 feet (1.2 meters) by the end of the century is possible (Rahmstorf et al. 2012,

U.S. ENERGY SECTOR VULNERABILITIES TO CLIMATE CHANGE AND EXTREME WEATHER
A-9
Gladstone et al. 2012, Jevrejeva et al. 2012, Katsman et al. 2011).
Projections of relative sea level rise also vary by region. For example, assuming a 2 foot (0.6 meters) rise in global average sea levels by the end of the century, relative sea level may rise 2.3 feet (0.7 meters) in New York City, 2.9 feet (0.9 meters) in Hampton Roads, Virginia, 3.5 (1.1 meters) feet in Galveston, Texas, and only 1 foot (0.3 meters) in Neah Bay, Washington (USGCRP 2009).One study of the West Coast found that relative sea level rise in California could range between 0.5–8 inches (1.3–20 cm) by 2030, between 3–15 inches (8–38 cm) by 2050, and between 14–47 inches (36–119 cm) by the end of the century, depending on the rate of sea level rise and location along the coast (NRC 2012).
Heavy Precipitation and Downpours
Historic trends: Heavy downpours have increased (NOAA 2013b, USGCRP 2009), and the fraction of rainfall coming from intense single-day events has also increased (EPA 2010a). Since the beginning of the 20th century, total rainfall during the most intense precipitation events in the United States has increased by about 20% (Groisman et al. 2004). Since 1991, the amount of rain falling in intense precipitation events has been above average throughout the continental United States. There are clear trends toward very heavy precipitation for the nation as a whole, and particularly in the Northeast and Midwest, as illustrated by Figure 39 (USGCRP 2009).
Projected changes: As air temperatures increase, the water-holding capacity of the air increases according to the Clausius-Clapeyron relationship. Typically, with each 1.8°F (1°C) increase in temperature, the water holding capacity of the air increases by 7% (Trenberth 2011). Across the United States, more frequent and intense heavy downpours (and a higher proportion of total rainfall coming from heavy precipitation events) are projected to continue (IPCC 2012, CCSP 2008a, IPCC 2007a). Heavy downpours are projected to account for an increasingly large portion of total precipitation in regions such as the Southwest (NOAA 2013b, Wehner 2012). High-rainfall events which today occur once every twenty years may occur once every four to fifteen years by the end of the century in the United States, depending on location, with the largest increases projected to occur in the Northeast, Midwest, Northwest, and Alaska (Kharin et al. 2013, USGCRP 2009). Such events are also expected to become more intense, with between 10–25% greater precipitation falling in the heaviest events (USGCRP 2009).
Figure 39. Percentage change in very heavy precipitation, 1958–2007 The map shows percent increases in the amount of precipitation falling in very heavy events (defined as the heaviest 1% of all daily events) for each region. Source: USGCRP 2009
Floods
Historic trends: Changes in the frequency, intensity, and duration of floods have been observed in many parts the United States due to changes in the timing and amount of precipitation (Hirsch and Ryberg 2012, Figure 40), although these changes vary by region. Measurements of stream gauges with historical records of at least 85 years show that the greatest increases in peak streamflows have occurred in the upper Midwest (specifically, the Red River of the North), and in the Northeast (especially in New York, New Jersey, and eastern Pennsylvania) (Hirsch and Ryberg 2012). However, streamflows in the Rocky Mountains and the Southwest have shown significant declines (Hirsch and Ryberg 2012).

U.S. ENERGY SECTOR VULNERABILITIES TO CLIMATE CHANGE AND EXTREME WEATHER
A-10
Figure 40. Trends in flood magnitude The map shows the trend magnitude (triangle size) and direction (green = increasing trend; brown = decreasing trend) of annual flood magnitude from the 1920s through 2008. Source: Hirsch and Ryberg 2012
Projected changes: Floods are projected to increase in frequency and intensity in some regions of the United States (USGCRP 2009, CCSP 2008b). Floods are projected to increase in areas that are expected to receive increased annual precipitation, such as the Midwest and the Northeast (USGCRP 2009, CCSP 2008b). Coastal flooding resulting from accelerating sea level rise and storm surge is also more likely (USGCRP 2009). In New York City, under a higher emissions scenario (A2), a coastal flood event that is currently categorized as a once-in-a-century event is projected to be twice as likely to occur by mid-century, and is projected to occur 10 times as often by 2100 (USGCRP 2009).

U.S. ENERGY SECTOR VULNERABILITIES TO CLIMATE CHANGE AND EXTREME WEATHER
R-1
REFERENCES Ackerman, F., E.A. Stanton, C. Hope, and S. Alberth. 2008. “The Cost of Climate Change.” Natural Resources Defense
Council. http://www.nrdc.org/globalwarming/cost/cost.pdf.
Adams, S. 2010. “Hualapai Must Be Dry to Fly.” Daily Miner, October 21, 2010. http://www.kingmandailyminer.com/main.asp?SectionID=1&SubsectionID=1&ArticleID=40780.
ADEC (Alaska Department of Environmental Conservation). 2010. Alaska’s Climate Change Strategy: Addressing Impacts in Alaska. Final report submitted by the Adaptation Advisory Group to the Alaska Climate Change Sub-Cabinet. http://www.climatechange.alaska.gov/aag/docs/aag_all_rpt_27jan10.pdf.
ADNR (Alaska Department of Natural Resources). 2004. “Appendix D: History of the Alaska Department of Natural Resources, Tundra Travel Management 1969-2003.” In Tundra Travel and the Modeling Project, prepared by P. Bradwell, A. Macalady, S. Wall. Anchorage, AK: Alaska Department of Natural Resources. http://dnr.alaska.gov/mlw/tundra/AppendixD.pdf.
AMAP (Arctic Monitoring and Assessment Programme). 2004. Impacts of a Warming Arctic: Arctic Climate Impact Assessment (ACIA). Cambridge: Cambridge University Press. http://amap.no/acia/.
AMS (American Meteorological Society). 2006. “Recent Trends in Cloudiness over the United States.” Bulletin of the American Meteorological Society 87(5): 597–606. DOI:10.1175.
AMS. 2009. “Mitigating New York City’s Heat Island: Integrating Stakeholder Perspectives and Scientific Evaluation.” Bulletin of the American Meteorological Society 90: 1297–312. DOI:10.1175/2009BAMS2308.1.
ANL. 2008. Climate Change Impacts on the Electric Power System in the Western United States. Thomas D. Veselka. Argonne, IL. http://www.dis.anl.gov/news/WECC_ClimateChange.html.
ANL. 2009a. Consumptive Water Use in the Production of Ethanol and Petroleum Gasoline. ANL/ESD/09-1, Argonne, IL. http://www.transportation.anl.gov/pdfs/AF/557.pdf.
ANL. 2009b. Produced water volumes and management practices in the United States. ANL/EVS/R-091. http://www.netl.doe.gov/technologies/coalpower/ewr/water/pdfs/anl%20produced%20water%20volumes%20sep09.pdf.
ANL. 2010. Water Management Technologies Used by Marcellus Shale Gas Producers. Washington, DC: U.S. Department of Energy. http://fracfocus.org/sites/default/files/publications/water_management_in_the_marcellus.pdf.
ANL. 2011. “Shale Gas - The Energy-Water Nexus.” Presentation at the 2011 AWRA Spring Specialty Conference, Baltimore, MD, April 18–20, 2011. http://aquadoc.typepad.com/files/hartoawrashalegas.pdf.
AP (Associated Press). 2011a. “Wallow Fire threatens power supplies in N.M., Texas.” SantaFeNewMexican, June 8. http://www.sfnewmexican.com/LocalNews/Arizona-wildfire-threatens-power-supply#.Uc2LGjtayaU.
AP. 2011b. “Nearly 1 million acres burned in Arizona fires.” Scripps TV Station Group. http://www.abc15.com/dpp/news/state/nearly-1-million-acres-burned-in-arizona-fires.
API (American Petroleum Institute). 2000. Overview of Exploration and Production Waste Volumes and Waste Management Practices in the United States. Prepared by ICF Consulting for the American Petroleum Institute, Washington, DC, May 2000.
ASA (American Soybean Association). 2012. “Low Water Levels Disrupting Barge Traffic on Mississippi River.” Southeast Farm Press, August 10. http://southeastfarmpress.com/soybeans/low-water-levels-disrupting-barge-traffic-mississippi-river.
Averyt K., J. Fisher, A. Huber-Lee, A. Lewis, J. Macknick, N. Madden, J. Rogers, and S. Tellinghuisen. 2011. “Freshwater use by U.S. power plants: Electricity’s thirst for a precious resource, A report of the Energy and Water in a Warming World initiative.” Union of Concerned Scientists, Cambridge, MA. http://www.ucsusa.org/assets/documents/clean_energy/ew3/ew3-freshwater-use-by-us-power-plants.pdf.
Barringer, F. 2010. “Lake Mead Hits Record Low Level.” New York Times Green Blog, October 18, 2010. http://green.blogs.nytimes.com/2010/10/18/lake-mead-hits-record-low-level/?gwh=E5256E3C9A879E3C21E056DB22849D41.

U.S. ENERGY SECTOR VULNERABILITIES TO CLIMATE CHANGE AND EXTREME WEATHER
R-2
Bartok, B. 2010. “Changes in solar energy availability for south-eastern Europe with respect to global warming.” Physics and Chemistry of the Earth, Parts A/B/C 2010;35(1-2):63e9.
Bender, M.A., T. R. Knutson, R.E. Tuleya, J. J. Sirutis, G.A. Vecchi, S.T. Garner, I.M. Held. 2010. “Modeled Impact of Anthropogenic Warming on the Frequency of Intense Atlantic Hurricanes.” Science, 22 January 2010: Vol. 327. no. 5964, pp. 454 - 458 DOI: 10.1126/science.1180568. http://www.gfdl.noaa.gov/21st-century-projections-of-intense-hurricanes.
Beshears, E. 2007. “Obstacle to More Power: Hot Water - River Temperature So High that Duke Energy Curtails Work at Two Plants.” Charlotte Observer, August 12, 2007.
Bevelhimer, M.S., V. Alavian, B. Miller, and G. Hauser. 1997. “Modeling Thermal Effects of Operational and Structural Modifications at a Hydropower Facility on a Premier Trout Stream in Southwestern Montana.” WaterPower97: Proceedings of the International Conference on Hydropower (1): 40–49.
Bigg, M. 2007. “River Flows cut to Fight Southeast Drought.” Reuters, November 16, 2007. http://www.reuters.com/article/2007/11/19/environment-usa-drought-dc-idUSN1641201520071119.
BLM (Bureau of Land Management). 2009. Draft Environmental Impact Statement for the Ely Energy Center. NV-040-09-001 EIS. http://www.blm.gov/nv/st/en/fo/ely_field_office/blm_programs/energy/on_line_transmission/ ely_energy_center.html.
BPA (Bonneville Power Administration). 2010. 2010 Annual Report. Portland, OR: Bonneville Power Administration. http://www.bpa.gov/Finance/FinancialInformation/AnnualReports/Documents/AR2010.pdf.
Breslow, P. B., and D. J. Sailor. 2002. “Vulnerability of Wind Power Resources to Climate Change in the Continental United States.” Renewable Energy 27(4): 585–98.
BrightSource. 2012. “Ivanpah Project Facts.” Oakland, CA: BrightSource. http://www.brightsourceenergy.com/stuff/contentmgr/files/0/8a69e55a233e0b7edfe14b9f77f5eb8d/folder/ivanpah_fact_sheet.10.12.pdf.
BrightSource. 2013. "Generating Clean Energy Reliably and Responsibly." Oakland, California: BrightSource. http://www.brightsourceenergy.com/
BSEE (U.S. Bureau of Safety and Environmental Enforcement). 2012a. “Tropical Storm/Hurricane Isaac Information.” http://www.bsee.gov/Hurricanes/2012/Isaac-Activity.aspx.
BSEE. 2012b. “Technology Assessment & Research (TA&R) Project Categories: Hurricane Katrina and Rita Projects.” http://www.bsee.gov/Research-and-Training/Technology-Assessment-and-Research/tarprojectcategories/Hurricane-Katrina-and-Rita-Projects.aspx.
Burkett. V. 2011. “Global Climate Change Implications for Coastal and Offshore Oil and Gas Development.” Energy Policy 39 (12): 7719–25.
Cart, J. 2012. “Drought has Mississippi River Barge Traffic all Choked Up.” Los Angeles Times, September 1, 2012. http://articles.latimes.com/2012/sep/01/nation/la-na-mississippi-river-20120902.
Cayan, D.R., T. Das, D.W. Pierce, T.P. Barnett, M. Tyree, and A. Gershunov. 2010. “Future dryness in the southwest US and the hydrology of the early 21st century drought.” Proceedings of the National Academy of Sciences of the United States of America 107, 39 21271-21276 doi: 10.1073/pnas.0912391107.
CCCC (California Climate Change Center). 2006. Climate Change and Electricity Demand in California. CEC-500-2005-201-SF. Sacramento, CA: California Energy Commission. http://www.energy.ca.gov/2005publications/CEC-500-2005-201/CEC-500-2005-201-SF.PDF.
CCES (Center for Climate and Energy Solutions). 2012. Impacts and Adaptation Options in the Gulf Coast. Arlington, VA: Center for Climate and Energy Solutions. http://www.c2es.org/publications/gulf-coast-impacts-adaptation-options.
CCSP (U.S. Climate Change Science Program). 2007a. “Effects of climate change on energy production and distribution in the United States.” In Effects of Climate Change on Energy Production and Use in the United States, Synthesis and Assessment Product 4.5, by Bull, S.R., D.E. Bilello, J. Ekmann, M.J. Sale, and D.K. Schmalzer. 8−44. Washington, DC: U.S. Climate Change Science Program.

U.S. ENERGY SECTOR VULNERABILITIES TO CLIMATE CHANGE AND EXTREME WEATHER
R-3
CCSP. 2007b. “Effects of climate change on energy use in the United States.” In Effects of Climate Change on Energy Production and Use in the United States, Synthesis and Assessment Product 4.5., by Scott, M.J., and Y.J. Huang. Washington, DC: U.S. Climate Change Science Program.
CCSP. 2008a. “Causes of Observed Changes in Extremes and Projections of Future Changes.” In Weather and Climate Extremes in a Changing Climate: Regions of Focus: North America, Hawaii, Caribbean, and U.S. Pacific Islands, Synthesis and Assessment Product 3.3., edited by Karl, T.R., G.A. Meehl, C.D. Miller, S.J. Hassol, A.M. Waple, and W.L. Murray, 81–116. Washington, DC: U.S. Department of Commerce. http://downloads.climatescience.gov/sap/sap3-3/sap3-3-final-all.pdf.
CCSP. 2008b. “Weather and Climate Extremes in a Changing Climate.” In Regions of Focus: North America, Hawaii, Caribbean, and U.S. Pacific Islands, edited by Karl, T.R., G.A. Meehl, C.D. Miller, S.J. Hassol, A.M. Waple, and W.L. Murray, 164.: Department of Commerce,. Washington, DC.
CCSP. 2008c. Impacts of climate change and variability on transportation systems and infrastructure: Gulf Coast Study, Phase I. In: Savonis, M.J., Burkett, V.R., Potter, J.R. (Eds.), Synthesis and Assessment Product 4.7, U.S. Department of Transportation, Washington, DC.
CEC (California Energy Commission). 2005. Integrated Energy Policy Report. CEC-100-2005-007. Sacramento, CA: California Energy Commission. http://www.energy.ca.gov/2005publications/CEC-100-2005-007/CEC-100-2005-007-CMF.PDF.
CEC. 2006. Cost and Value of Water Use at Combined-Cycle Power Plants. CEC-500-2006-034. Sacramento, CA: California Energy Commission. http://www.energy.ca.gov/2006publications/CEC-500-2006-034/CEC-500-2006-034.PDF.
CEC. 2009. Impacts of Climate Change on Residential Electricity Consumption: Evidence from Billing Data. Sacramento, CA: California Energy Commission. http://www.nber.org/chapters/c11991.pdf.
CEC. 2012. Estimating Risk to California Energy Infrastructure from Projected Climate Change. CEC-500-2012-057. Sacramento, CA: California Energy Commission. http://www.energy.ca.gov/2012publications/CEC-500-2012-057/CEC-500-2012-057.pdf.
CEIC (Carnegie Mellon Electricity Industry Center). 2006. “Transmission Line Reliability: Climate Change and Extreme Weather.” Carnegie Mellon Electricity Industry Center Working Paper CEIC-05-06. Pittsburgh, PA: Carnegie Mellon Electricity Industry Center. http://www.ce.cmu.edu/greendesign/docs/ceic_05_06.pdf.
CEQ (Council on Environmental Quality). 2011. National Action Plan: Priorities for Managing Freshwater Resources in a Changing Climate. Washington, DC: White House. http://www.whitehouse.gov/sites/default/files/microsites/ceq/2011_national_action_plan.pdf.
CEQ. 2012. National Fish, Wildlife and Plants Climate Adaptation Strategy. Washington, DC: Council on Environmental Quality, Association of Fish and Wildlife Agencies, Great Lakes Indian Fish and Wildlife Commission, National Oceanic and Atmospheric Administration, and U.S. Fish and Wildlife Service. http://www.wildlifeadaptationstrategy.gov/pdf/NFWPCAS-Final.pdf.
CEQ. 2013a. Climate Change Adaptation Task Force. http://www.whitehouse.gov/administration/eop/ceq/initiatives/adaptation.
CEQ. 2013b. Leading by Example in Environmental, Energy, and Economic Performance. Sustainability Performance Plans. http://sustainability.performance.gov/.
CEQ. 2013c. National Ocean Policy Implementation Plan. National Ocean Council. Washington, DC: Council on Environmental Quality and Office of Science and Technology Policy. http://www.whitehouse.gov/sites/default/files/national_ocean_policy_implementation_plan.pdf.
Chiu, Y., B. Walseth, S. Suh, and E. Chiu. 2009. “Water Embodied in Bioethanol in the United States.” Environmental Science and Technology. http://pubs.acs.org/doi/pdfplus/10.1021/es8031067.
Chow, T.T., W. He, J. Ji, and A. Chan. 2007. “Performance Evaluation of Photovoltaic-Thermosyphon System for Subtropical Climate Application.” Solar Energy Vol 81 123-130.
Christy, J.R.. 2012. “Searching for information in 133 years of California snowfall observations.” Journal of Hydrometeorology 13, 895-912 doi: 10.1175/JHM-D-11-040.1.

U.S. ENERGY SECTOR VULNERABILITIES TO CLIMATE CHANGE AND EXTREME WEATHER
R-4
Church, J.A. and N.J. White. 2011. “Sea-level rise from the late 19th to the early 21st century.” Surveys in Geophysics 32, 585-602 doi: 10.1007/s10712-011-9119-1.
CIER (Center for Integrative Environmental Research) at the University of Maryland. 2007. The US Economic Impacts of Climate Change and the Costs of Inaction. College Park, MD: University of Maryland. http://www.cier.umd.edu/documents/US%20Economic%20Impacts%20of%20Climate%20Change%20and%20the%20Costs%20of%20Inaction.pdf.
CIG (Climate Impacts Group). 2009. The Washington Climate Change Impacts Assessment. edited by M. McGuire Elsner, J. Littell, and L. Whitely Binder. Seattle, WA: Center for Science in the Earth System, Joint Institute for the Study of the Atmosphere and Oceans, University of Washington. http://cses.washington.edu/db/pdf/wacciareport681.pdf.
CISO (California ISO). 2013. Annual Report on Market Issues & Performance. April 2013. http://www.caiso.com/Documents/2012AnnualReport-MarketIssue-Performance.pdf.
City of New York. 2013.PlaNYC: A Stronger, More Resilient New York. The City of New York: New York. http://nytelecom.vo.llnwd.net/o15/agencies/sirr/SIRR_singles_Lo_res.pdf.
Cloern, J.E., N. Knowles, L.R. Brown, D. Cayan, M.D. Dettinger. 2011. Projected Evolution of California’s San Francisco Bay-Delta-River System in a Century of Climate Change. PLoS ONE 6(9): e24465.doi:10.1371/journal.pone.0024465.
Cole, C. 2012. “Uranium mine set to reopen.” Arizona Daily Sun. http://azdailysun.com/news/local/state-and-regional/uranium-mine-set-to-reopen/article_50b5ddfe-2d62-561f-9028-62b601216705.html.
Cooley, H., J. Fulton, and P. Gleick. 2011. Water for Energy: Future Water Needs for Electricity in the Intermountain West (Summary and Conclusions). Oakland, CA: The Pacific Institute. http://www.pacinst.org/reports/water_for_energy/summary_and_conclusions.pdf.
CRS (Congressional Research Service). 2009. Water Issues of Concentrating Solar Power (CSP) Electricity in the U.S. Southwest. Washington, DC: Congressional Research Service. 7-5700 R40631.
CRS. 2010. Energy’s Water Demand: Trends, Vulnerabilities, and Management. 7-5700 R41507. Washington, DC: Congressional Research Service. http://www.fas.org/sgp/crs/misc/R41507.pdf.
CRS. 2012. Weather-Related Power Outages and Electric System Resiliency. 5-5700 R42696 Washington D.C.: Congressional Research Service. http://www.fas.org/sgp/crs/misc/R42696.pdf.
Cutforth H.W., and D. Judiesch. 2007. “Long-term changes to incoming solar energy on the Canadian Prairie.” Agricultural and Forest Meteorology 2007;145:167e75.
Dai, A. 2012. “Increasing drought under global warming in observations and models.” Nature Climate Change doi: 10.1038/nclimate1633. http://www.nature.com/nclimate/journal/vaop/ncurrent/full/nclimate1633.html?utm_sour ce=feedblitz&utm_medium=FeedBlitzEmail&utm_content=559845&utm_campaign=0].
Davcock, C., DesJardins, and S. Fennel. 2004. “Generation cost forecasting using on–line thermodynamic models”. Proceedings of Electric Power. March 30-April 1. Baltimore, MD.
Davis, S., S. Diegel, and R. Boundy. 2008. Transportation Energy Data Book. US DOE/EERE, Edition 27, ed.: Oak Ridge National Laboratory, Oak Ridge, Tennessee.
Deschênes, O. and M. Greenstone. 2011. “Climate change, mortality, and adaptation: Evidence from annual fluctuations in weather in the US.” American Economic Journal: Applied Economics 3, 152-185. http://www.econ.ucsb.edu/~olivier/DG_AEJ_AE_2011.pdf
Dell, J. J., and P. Pasateris, 2010. Adaptation in the Oil and Gas Industry to Projected Impacts of Climate Change. Society of Petroleum Engineers, SPE-126307. http://www.onepetro.org/mslib/servlet/onepetropreview?id=SPE-126307-MS.
DHS (U.S. Department of Homeland Security). 2009. National Infrastructure Protection Plan: Partnering to enhance protection and resiliency. Washington, DC: Department of Homeland Security. http://www.dhs.gov/xlibrary/assets/NIPP_Plan.pdf.
Diffenbaugh, N. S., T.W. Hertel, M. Scherer, and M. Verma. 2012. “Response of corn markets to climate volatility under alternative energy futures.” Nature Climate Change 2514–18 (2012) doi:10.1038/nclimate1491.

U.S. ENERGY SECTOR VULNERABILITIES TO CLIMATE CHANGE AND EXTREME WEATHER
R-5
Dittrick, P. 2012. “Drought raising water costs, scarcity concerns for shale plays.” Oil & Gas Journal. July 30, 2012. http://www.ogj.com/articles/print/vol-110/issue-7d/general-interest/drought-raising-water-costs.html.
DOE (U.S. Department of Energy). 2004. Hurricane Jeanne Situation Report #3. Washington, DC: U.S. Department of Energy, Office of Energy Assurance. September 27. https://www.oe.netl.doe.gov/docs/jeanne/hurrjeanne_sitrept_092704_1000.pdf.
DOE. 2006. Energy Demands on Water Resources: Report to Congress on the Interdependency of Energy and Water. Albuquerque, NM: Sandia National Laboratories. http://www.sandia.gov/energy-water/docs/121-RptToCongress-EWwEIAcomments-FINAL.pdf.
DOE. 2007. Deliveries of Coal from the Powder River Basin: Events and Trends 2005-2007. Prepared by the Office of Electricity Delivery and Energy Reliability. Washington, DC: U.S. Department of Energy. www.oe.netl.doe.gov/docs/Final-Coal-Study_101507.pdf.
DOE. 2008a. The Smart Grid: An Introduction. Prepared by the Office of Electricity Delivery and Energy Reliability. Washington, DC: U.S. Department of Energy. http://energy.gov/sites/prod/files/oeprod/DocumentsandMedia/DOE_SG_Book_Single_Pages%281%29.pdf.
DOE. 2008b. Strategic Petroleum Reserve Annual Report for Calendar Year 2008. http://www.fossil.energy.gov/programs/reserves/publications/Pubs-SPR/Annual_Report_2008.pdf.
DOE. 2009. Modern Shale Gas Development in the United States: A Primer. Washington, DC: U.S. Department of Energy. http://www.netl.doe.gov/technologies/oil-gas/publications/EPreports/Shale_Gas_Primer_2009.pdf.
DOE. 2010. Hardening and Resiliency U.S. Energy Industry Response to Recent Hurricane Seasons. Office of Electricity Delivery and Energy Reliability. U.S. Department of Energy. August 2010. http://www.oe.netl.doe.gov/docs/HR-Report-final-081710.pdf.
DOE. 2011a. Report on the First Quadrennial Technology Review. Washington, DC: U.S. Department of Energy. http://energy.gov/sites/prod/files/QTR_report.pdf.
DOE. 2011b. “SPR Risk Governance: Mission Readiness 24/7.” Presentation at PMI-GNO Dinner Meeting, presented by W.C. Gibson. U.S. Department of Energy, Strategic Petroleum Reserve, April 20.
DOE. 2011c. Dams and Energy Sectors Interdependency Study. Washington, DC: U.S. Department of Energy and Department of Homeland Security. http://energy.gov/sites/prod/files/Dams-Energy%20Interdependency%20Study.pdf.
DOE. 2012a. Hurricane Sandy Situation Report # 5. Washington, DC: U.S. Department of Energy, Office of Electricity Delivery and Energy Reliability. http://www.oe.netl.doe.gov/docs/2012_SitRep5_Sandy_10302012_300PM_v_1.pdf.
DOE. 2012b. Hurricane Sandy-Nor’easter Situation Report #13. Washington, DC: U.S. Department of Energy, Office of Electricity Delivery and Energy Reliability. http://www.oe.netl.doe.gov/docs/SitRep13_Sandy-Nor'easter_120312_300PM.pdf.
DOE. 2012c. Strategic Petroleum Reserve - Profile. U.S. Department of Energy, Office of Fossil Energy. October 16, 2012. http://fossil.energy.gov/programs/reserves/spr/.
DOE. 2012d. “Building Sector Expenditures: Building Energy Prices, by Year and Major Fuel Type.” In Buildings Energy Data Book. U.S. Department of Energy, Office of Energy Efficiency and Renewable Energy. http://buildingsdatabook.eren.doe.gov/TableView.aspx?table=1.2.1.
DOE. 2012e. Photovoltaic (PV) Pricing Trends: Historical, Recent, and Near-Term Projections. SunShot. U.S. Department of Energy, Office of Energy Efficiency and Renewable Energy. http://www.nrel.gov/docs/fy13osti/56776.pdf.
DOE. 2012f. Wind Program Accomplishments. Wind Program. Department of Energy, Office of Energy Efficiency and Renewable Energy. http://www1.eere.energy.gov/wind/pdfs/wind_accomplishments.pdf.
DOE. 2013a. Comparing the Impacts of Northeast Hurricanes on Energy Infrastructure. U.S. Department of Energy, Office of Electricity Delivery & Energy Reliability. April, 2013. http://energy.gov/oe/downloads/comparing-impacts-northeast-hurricanes-energy-infrastructure-april-2013.
DOE. 2013b. “Electric Disturbance Events (OE-417).” U.S. Department of Energy, Office of Electricity Delivery & Energy Reliability. http://www.oe.netl.doe.gov/oe417.aspx.

U.S. ENERGY SECTOR VULNERABILITIES TO CLIMATE CHANGE AND EXTREME WEATHER
R-6
DOE. 2013c. Northeast Blizzard Situation Report # 6. U.S. Department of Energy, Office of Electricity Delivery & Energy Reliability. February 11, 2013. http://www.oe.netl.doe.gov/emergency_sit_rpt.aspx.
DOT (U.S. Department of Transportation). 2012. ExxonMobil Silvertip Pipeline Crude Oil Release into the Yellowstone River in Laurel, MT on 7/1/2011. Pipelines and Hazardous Materials Safety Administration, Office of Pipeline Safety, Western Region.
Duffy, P.B., and C. Tebaldi. 2012. “Increasing prevalence of extreme summer temperatures in the U.S.” Climatic Change 111, 487-495 doi: 10.1007/s10584-012-0396-6.
Durmayaz, A. and O.S. Sogut (2006). “Influence of cooling water temperature on the efficiency of a pressurized-water reactor nuclear-power plant.” International Journal of Energy Research 30: 799-810.
Eaton, J. 2012. “Record Heat, Drought Pose Problems for U.S. Electric Power.” National Geographic Daily News, August 17. http://news.nationalgeographic.com/news/energy/2012/08/120817-record-heat-drought-pose-problems-for-electric-power-grid/.
EIA (U.S. Department of Energy, Energy Information Administration). 2006. Annual Energy Outlook 2006: With Projections to 2030. Washington, DC: U.S. Department of Energy. http://www.scag.ca.gov/rcp/pdf/publications/1_2006AnnualEnergyOutlook.pdf.
EIA. 2011a. Annual Coal Report 2010. Table 26. Washington, DC: U.S. Department of Energy. http://www.eia.gov/coal/annual/pdf/table26.pdf.
EIA. 2011b. “Texas Heat Wave, August 2011: Nature and Effects of an Electricity Supply Shortage (9 Sept 2011).” Today in Energy. http://www.eia.gov/todayinenergy/detail.cfm?id=3010.
EIA. 2011c. “Coal Stocks at Power Plants are Likely Sufficient Despite River Flooding.” Energy Information Administration. May 31, 2011. http://www.eia.gov/todayinenergy/detail.cfm?id=1590.
EIA. 2011d. “Frequently Asked Questions: How much electricity is used for cooling in the United States?” Washington, DC: U.S. Department of Energy. http://www.eia.gov/tools/faqs/faq.cfm?id=98&t=3.
EIA. 2011e. Review of Emerging Resources: U.S. Shale Gas and Shale Oil Plays. Washington, DC: U.S. Department of Energy. http://www.eia.gov/analysis/studies/usshalegas/.
EIA. 2012a. Annual Energy Outlook 2013 (Early Release). Washington, DC: U.S. Department of Energy. http://www.eia.gov/forecasts/aeo/er/executive_summary.cfm.
EIA. 2012b. Electric Power Monthly (March 2012). Washington, DC: U.S. Department of Energy. http://www.eia.gov/electricity/monthly/current_year/march2012.pdf.
EIA. 2012c. Annual Energy Outlook 2012: With Projections to 2035. Washington, DC: U.S. Department of Energy. http://www.eia.gov/forecasts/aeo/pdf/0383(2012).pdf.
EIA. 2012d. “Frequently Asked Questions.” U.S. Energy Information Administration. http://www.eia.gov/tools/faqs/faq.cfm?id=667&t=2.
EIA. 2012e. “Rail Deliveries of Oil and Petroleum Products Up 38% in First Half of 2012.” U.S. Energy Information Administration. Accessed July 26. http://www.eia.gov/todayinenergy/detail.cfm?id=7270.
EIA. 2012f. “Worst Drought in Decade Could Affect U.S. Energy Markets.” U.S. Energy Information Administration. August 28, 2012. http://www.eia.gov/todayinenergy/detail.cfm?id=7730.
EIA. 2012g. Annual Coal Report 2011. Table 1. Washington, DC: U.S. Department of Energy. http://www.eia.gov/coal/annual/pdf/acr.pdf.
EIA. 2012h. 2011 Domestic Uranium Production Report. Washington, DC: U.S. Department of Energy. May 9, 2012. http://www.eia.gov/uranium/production/annual/pdf/dupr.pdf.
EIA. 2012i. “Annual Electric Generator Report- EIA-860 data file.” U.S. Energy Information Administration. September 24, 2012. www.eia.gov/cneaf/electricity/page/eia860.html.
EIA. 2012j “How much electricity is lost in transmission and distribution in the United States?” U.S. Energy Information Administration. July 9, 2012. http://www.eia.gov/tools/faqs/faq.cfm?id=105&t=3.

U.S. ENERGY SECTOR VULNERABILITIES TO CLIMATE CHANGE AND EXTREME WEATHER
R-7
EIA. 2012k. “Gulf of Mexico Fact Sheet.” Data released August 7. Energy Information Administration. http://www.eia.gov/special/gulf_of_mexico/.
EIA. 2012l. Coal Transportation Rates to the Electric Power Sector: Trends, 2001-2010. Washington, DC: U.S. Department of Energy. http://www.eia.gov/coal/transportationrates/trend-coal.cfm.
EIA. 2012m. New York/New Jersey Intra Harbor Petroleum Supplies Following Hurricane Sandy: Summary of Impacts Through November 13, 2012. Washington, DC: U.S. Department of Energy. http://www.eia.gov/special/disruptions/hurricane/sandy/pdf/petroleum_terminal_survey.pdf.
EIA. 2013a. “Residential Energy Consumption Survey (RECS). AIA Climate Zones — RECS 1978-2005.” Washington, DC: U.S. Department of Energy. http://www.eia.gov/consumption/residential/maps.cfm.
EIA. 2013b. “State Energy Profiles Mapping Tool.” U.S. Department of Energy. http://www.eia.gov/state/.
Eilperin, J. 2012. "Climate change challenges power plant operations." The Salt Lake Tribune. http://www.sltrib.com/sltrib/world/54861581-68/nuclear-river-plant-power.html.csp.
Ellis, B. 2012. “Oil Companies Desperately Seek Water Amid Kansas Drought.” CNN Money. August 10, 2012. http://money.cnn.com/2012/08/10/news/economy/kansas-oil-boom-drought/index.html.
Entergy. 2010. Building a Resilient Energy Gulf Coast: Executive Report. Washington, DC: Entergy. http://www.entergy.com/content/our_community/environment/GulfCoastAdaptation/Building_a_Resilient_Gulf_Coast.pdf.
EPA (U.S. Environmental Protection Agency). 2008. “Clean Watershed Needs Survey (CWNS).” Washington, DC: U.S. Environmental Protection Agency. www.epa.gov/owm/mtb/cwns/.
EPA. 2010a. Climate Change Indicators in the United States. EPA 430-R-10-007. Washington, DC: U.S. Environmental Protection Agency.
EPA. 2010b. Coalbed Methane Extraction: Detailed Study Report. EPA-820-R-10-022 http://water.epa.gov/lawsregs/lawsguidance/cwa/304m/upload/cbm_report_2011.pdf
EPA. 2011. Produced Water Reuse and Recycling Challenges and Opportunities Across Major Shale Plays. Hydraulic Fracturing Study Technical Workshop #4 – Water Resources Management, March 29–30. http://www.epa.gov/hfstudy/09_Mantell_-_Reuse_508.pdf.
EPA. 2012a. Climate Change Indicators in the United States. Washington, DC: U.S. Environmental Protection Agency. http://www.epa.gov/climatechange/science/indicators/weather-climate/temperature.html.
EPA. 2012b. “Future Climate Change.” Washington, DC: U.S. Environmental Protection Agency. http://epa.gov/climatechange/science/future.html.
EPA. 2013. “Coalbed Methane Extraction (CBM).” Washington, DC: U.S. Environmental Protection Agency. http://water.epa.gov/scitech/wastetech/guide/cbm_index.cfm
EPRI (Electric Power Research Institute). 2002. Water and Sustainability, Vol. 4: US Electricity Consumption for Water Supply and Treatment—The Next Half Century. By Goldstein, R., and Smith, W. Palo Alto, CA: Electric Power Research Institute.
EPRI. 2011. Water Use for Electricity Generation and Other Sectors: Recent Changes (1985–2005) and Future Projections (2005–2030). 1023676. Palo Alto, CA: Electric Power Research Institute. http://www.epri.com/abstracts/Pages/ProductAbstract.aspx?ProductId=000000000001023676.
Faeth, P. 2012. “U.S. Energy Security and Water: The Challenges We Face.” Environment, January-February. http://www.environmentmagazine.org/Archives/Back%20Issues/2012/January-February%202012/US-Energy-Full.html.
FERC (Federal Energy Regulatory Commission). 1996. Final Environmental Impact Statement: Proposed Modifications to the Lower Mokelumne River Project. Project No. 2916-004, FERC/FEIS-0067. FERC eLIbrary, Accession No. 20080607-0026. Washington, DC: Federal Energy Regulatory Commission.
FERC. 2012. Arizona-Southern California Outages on September 8, 2011 Causes and Recommendations. Washington, DC: Federal Energy Regulatory Commission. http://www.ferc.gov/legal/staff-reports/04-27-2012-ferc-nerc-report.pdf.

U.S. ENERGY SECTOR VULNERABILITIES TO CLIMATE CHANGE AND EXTREME WEATHER
R-8
FERC. 2013. Office of Energy Projects Energy Infrastructure Update For January 2013. Washington, DC: Federal Energy Regulatory Commission. http://www.ferc.gov/legal/staff-reports/2013/jan-energy-infrastructure.pdf.
Fidje, A. and T. Martinsen. 2006. “Effects of climate change on the utilization of solar cells in the Nordic region.” Institute for Energy Technology (IFE), Insituttveien. Kjeller, Norway. http://www.ife.no/en/ife/departments/energy_systems/files/effects-of-climate-change-on-the-utilization-of-solar-cells-in-the-nordic-region.
Fowler, T. 2011. “More power plant woes likely if Texas drought drags into winter.” Fuelfix.com. http://fuelfix.com/blog/2011/08/24/more-power-plant-woes-likely-if-texas-drought-drags-into-winter/.
GAO (Government Accountability Office). 2010. A Better and Coordinated Understanding of Water Resources Could Help Mitigate the Impacts of Potential Oil Shale Development. GAO-11-35. Report to Congressional Requesters. Washington, DC: U.S. Government Accountability Office. http://www.gao.gov/assets/320/311896.pdf.
GAO. 2012. Information on Shale Resources, Development, and Environmental and Public Health Risks. GAO-12-732. Report to Congressional Requesters. Washington, DC: U.S. Government Accountability Office. http://www.gao.gov/assets/650/647791.pdf
Gladstone, R.M., V. Lee, J. Rougier, A.J. Payne, H. Hellmer, A. Le Brocq, A. Shepherd, T.L. Edwards, J. Gregory, and S.L. Cornford. 2012. “Calibrated prediction of Pine Island Glacier retreat during the 21st and 22nd centuries with a coupled flowline model.” Earth and Planetary Science Letters, 333, 191-199.
Green, K. 2011. “East Texas Drought: Falling Lake Levels Affect Recreational Use.” Longview News-Journal. July 27, 2011.
Groisman, P.Y., R.W. Knight, T.R. Karl, D.R. Easterling, B. Sun, J.H. Lawrimore. 2004. “Contemporary Changes of the Hydrological Cycle Over the Contiguous United States: Trends Derived from In Situ Observations.” Journal of Hydrometeorology 5(1): 64–85.
Guégan, M., C. B. Uvo, and K. Madani. 2012. “Developing a module for estimating climate warming effects on hydropower pricing in California.” Energy Policy 42: 261–71. ISSN 0301-4215, 10.1016/j.enpol.2011.11.083.
Gupta, S.D, S. Kundu, and A. Mallik. 2012. “Monitoring of Sag & Temperature in the Electrical Power Transmission lines.” International Journal of Recent Technology and Engineering 1(4): 43-5. http://www.ijrte.org/attachments/File/v1i4/D0329091412.pdf.
Hadley, S., D. Erickson III, J. Hernandex, C. Broniak, and T.J. Blasing. 2006. “Responses of energy use to climate change: A climate modeling study.” Geophysical Research Letters 33, L17703, doi:10.1029/2006GL026652. http://www.researchgate.net/publication/228819814_Atmospheric_events_disrupting_coastal_upwelling_in_the_southwestern_Caribbean/file/9fcfd502521e5d9e22.pdf.
Hamlet, A., S. Lee, K. Mickelson, and M. Elsen. 2010. “Effects of projected climate change on energy supply and demand in the Pacific Northwest and Washington State.” Climate Change 102:103-128.
Hargreaves, S. 2012. "Drought strains U.S. oil production." CNN Money. July 31, 2012. http://money.cnn.com/2012/07/31/news/economy/drought-oil-us/index.htm.
Harsem, Ø., A. Eide, and K. Heen. 2011. “Factors Influencing Future Oil and Gas Prospects in the Arctic.” Energy Policy 39(12): 8037–45.
Hauenstein, W. 2005. “Hydropower and Climate Change - A Reciprocal Relation: Institutional Energy Issues in Switzerland.” Mountain Research and Development, 25, 321-325.
Hayhoe, K., M. Robson, J. Rogula, M. Auffhammer, N. Miller, J. VanDorn, and D. Wuebbles. 2010. “An Integrated Framework for Quantifying and Valuing Climate Change Impacts on Urban Energy and Infrastructure: A Chicago Case Study.” Journal of Great Lakes Research 36(2): 94–105.
Hirsch, R. M. and K. R. Ryberg. 2012. “Has the Magnitude of Floods Across the USA Changed with Global CO2 Levels?” Hydrological Sciences Journal 57: 1–9.
Hoerling, M., H. Diaz, R.D.D. Easterling, J. Eischeid, X.W. Quan, and R. Webb. 2012. “Is a Transition to Semi-Permanent Drought Conditions Imminent in the Great Plains?” Journal of Climate (submitted).

U.S. ENERGY SECTOR VULNERABILITIES TO CLIMATE CHANGE AND EXTREME WEATHER
R-9
Huld, T., Gottschalg, R., Beyer, H.G., and M. Topic. 2010. “Mapping the performance of PV modules, effects of module type and data averaging.” Solar Energy 84(2): 324-338. doi: 10.1016/j.solener.2009.12.002.
IHS CERA (IHS Cambridge Energy Research Associates) 2010. Fueling North America’s Energy Future: The Unconventional Natural Gas Revolution and the Carbon Agenda. Cambridge, Massachusetts: IHS Cambridge Energy Research Associates. http://www.anga.us/media/content/F7CEF91B-C242-11F8-265AC0573BFC90D8/files/ihs%20cera%20fueling%20the%20future.pdf.
IPCC (Intergovernmental Panel on Climate Change). 2000. Special Report on Emissions Scenarios, Summary for Policymakers. Edited by Nakicenovic, N., and R. Swart. Cambridge, UK: Cambridge University Press.
IPCC. 2007a. Climate Change 2007: Impacts, Adaptation and Vulnerability. Contribution of Working Group II to the Fourth Assessment Report, edited by M.L. Parry, O.F. Canziani, J.P. Palutikof, P.J. van der Linden and C.E. Hanson. Cambridge, UK: Cambridge University Press.
IPCC. 2007b. “Polar regions (Arctic and Antarctic).” In Climate Change 2007: Impacts, Adaptation and Vulnerability. Contribution of Working Group II to the Fourth Assessment Report, edited by M.L. Parry, O.F. Canziani, J.P. Palutikof, P.J. van der Linden and C.E. Hanson, 653–85. Cambridge, UK: Cambridge University Press.
IPCC. 2007c. Climate Change 2007: The Physical Science Basis. Contribution of Working Group I to the Fourth Assessment Report of the Intergovernmental Panel on Climate Change. Cambridge, UK: Cambridge University Press.
IPCC. 2007d. “Chapter 3.” In IPCC AR4 Synthesis Report, Summary for Policy Makers. Contribution of Working Groups I, II and III to the Fourth Assessment Report of the Intergovernmental Panel on Climate Change, edited by Pachauri, R.K. and Reisinger, A. Geneva, Switzerland: IPCC Secretariat.
IPCC. 2012. Managing the Risks of Extreme Events and Disasters to Advance Climate Change Adaptation. Special Report of Working Groups I and II of the Intergovernmental Panel on Climate Change, edited by C.B. Field, V. Barros, T.F. Stocker, D. Qin, D.J. Dokken, K.L. Ebi, M.D. Mastrandrea, K.J. Mach, G.K. Plattner, S.K. Allen, M. Tignor, and P.M. Midgley. Cambridge, UK: Cambridge University Press. http://ipcc-wg2.gov/SREX/.
Isaac, M., and D. P. V. Vuuren. 2009. “Modeling Global Residential Sector Energy Demand for Heating and Air Conditioning in the Context of Climate Change.” Energy Policy 37: 507–521.
Jager, H.I., W. Van Winkle, and B.D. Holcomb. 1999. “Would hydrologic climate changes in Sierra Nevada streams influence trout persistence?” Transactions of the American Fisheries Society 128: 222–240.
Jevrejeva, S., J.C. Moore, and A. Grinsted. 2012. Sea level projections to AD2500 with a new generation of climate change scenarios. Global and Planetary Change, 80-81, 14-20 doi: 10.1016/j.gloplacha.2011.09.006.
Karl, T.R., B.E. Gleason, M.J. Menne, J.R. McMahon, J. R.R. Heim, M.J. Brewer, K.E. Kunkel, D.S. Arndt, J.L. Privette, J.J. Bates, P.Y. Groisman, and D.R. Easterling. 2012. U.S. temperature and drought: Anomalies of spring and summer 2011-12 and trends. EOS Transactions, AGU, 93, 473.
Katsman, C.A., A. Sterl, J.J. Beersma, H.W. van den Brink, W. Hazeleger, R.E. Kopp, D. Kroon, J. Kwadijk, R. Lammersen, J. Lowe, M. Oppenheimer, H.-P. Plag, J. Ridley, H. von Storch, D.G. Vaughan, P. Vellinga, L.L.A. Vermeersen, R.S.W. van de Wal, and R. Weisse. 2011. Exploring high-end scenarios for local sea level rise to develop flood protection strategies for a low-lying delta - the Netherlands as an example. Climatic Change doi: 10.1007/s10584-011-0037-5.
Kay, J.E., M.M. Holland, and A. Jahn. 2011. Inter-annual to multi-decadal Arctic sea ice extent trends in a warming world. Geophysical Research Letters, 38, 6 doi: 24 10.1029/2011GL048008. http://www.agu.org/pubs/crossref/2011/2011GL048008.shtml.
Kharin, V.V., F.W. Zwiers, X. Zhang, M. Wehrner. 2013. “Changes in Temperature and Precipitation Extremes in the CMIP5 Ensemble.” Climatic Change 119: 345–357.
Knowles, N., M.D. Dettinger, and D.R. Cayan. 2006. “Trends in Snowfall versus Rainfall in the Western United States.” Journal of Climate 19: 4545–59.
Knutson, T. R., J.L. McBride, J. Chan, K. Emanuel, and G. Holland. 2010. “Tropical Cyclones and Climate Change.” Nature Geoscience 3.3: 157–63.

U.S. ENERGY SECTOR VULNERABILITIES TO CLIMATE CHANGE AND EXTREME WEATHER
R-10
Kobos, P.H., M. Cappelle, J. Krumhansl, T. Dewers, A. McNemar, and Borns. 2011. “Combining power plant water needs and carbon dioxide storage using saline formations: Implications for carbon dioxide and water management practices.” International Journal of Greenhouse Gas Control 5:899-910.
Kopytko, N. and J. Perkins. 2011. “Climate Change, Nuclear Power, and the Adaptation Mitigation Dilemma.” Energy Policy 39: 318–33.
Krier, R. 2012. “Extreme Heat, Drought, Show Vulnerability of Nuclear Power Plants.” Inside Climate News, August 15, 2012. http://insideclimatenews.org/news/20120815/nuclear-power-plants-energy-nrc-drought-weather-heat-water?utm_source=feedburner&utm_medium=feed&utm_campaign=Feed%3A%20solveclimate%2Fblog%20%28InsideClimate%20News%29.
Kunkel, K.E., D. Easterling, L. Ensor, K.G. Hubbard, M. Palecki, K. Redmond, and D. Robinson. 2009a. A new look at lake-effect snowfall trends in the Laurentian Great Lakes using a temporally homogeneous data set. Journal of Great Lakes Research, 35, 14 23-29 doi: 10.1016/j.jglr.2008.11.003.
Kunkel, K.E., D. Easterling, L. Ensor, K.G. Hubbard, M. Palecki, K. Redmond, and D. Robinson. 2009b. Trends in twentieth-century US snowfall using a quality-controlled dataset. Journal of Atmospheric and Oceanic Technology, 26, 33-44 doi: 17 10.1175/2008JTECHA1138.1.
Kunkel, K.E., T.R. Karl, H. Brooks, J. Kossin, J. Lawrimore, D. Arndt, L. Bosart, D. Changnon, S.L. Cutter, N. Doesken, K. Emanuel, P.Ya. Groisman, R.W. Katz, T. Knutson, J. O’Brien, C. J. Paciorek, T. Peterson, K. Redmond, D. Robinson, J. Trapp, R. Vose, S. Weaver, M. Wehner, K. Wolter, and D. Wuebbles. 2012h. “Monitoring and understanding changes in extreme storm statistics: state of knowledge.” Bulletin of the American Meteorological Society (in press).
Lackstrom, K., K. Dow, B. Haywood, A. Brennan, N. Kettle, and A. Brosius. 2012. “Engaging Climate-sensitive sectors in the Carolinas.” Technical Report: CISA-2012-03: Carolinas Integrated Sciences and Assessments, 180 pp.
Larsen, P.H., Goldsmith, S., Smith, O. Wilson, M.L., Strzepek, K., Chinowsky, P, and B. Saylor. 2008. “Estimating future costs for Alaska public infrastructure at risk from climate change.” Global Environmental Change. doi:10.1016/j.gloenvcha.2008.03.005. http://www.climatechange.alaska.gov/aag/docs/O97F18069.pdf.
Lee, M. 2011. “Parched Texans Impose Water-Use Limits for Fracking Gas Wells.” Bloomberg Business Week, October 6. http://www.businessweek.com/news/2011-10-06/parched-texans-impose-water-use-limits-for-fracking-gas-wells.html.
Levinson R. and H. Akbari. 2010. “Potential Benefits of Cool Roofs on Commercial Buildings: Conserving Energy, Saving Money, and Reducing Emission of Greenhouse Gases and Air Pollutants.” Energy Efficiency 3(1): 53–109.
Linnerud, K., T. K. Mideksa, G. S. Eskeland. 2011. “The Impact of Climate Change on Nuclear Power Supply.” The Energy Journal 32(1): 149.
Lubchenco, J. and T.R. Karl. 2012. “Predicting and Managing Extreme Weather Events.” Physics Today 65(3): 31. DOI: 10.1063/PT.3.1475.
Mansur, E., R. Mendelsohn, and W. Morrison. 2005. A Discrete-Continuous Choice Model of Climate Change Impacts on Energy. New Haven, CT: Yale University.
Mansur, E., R. Mendelsohn, and W. Morrison, 2008. “Climate Change Adaptation: A Study of Fuel Choice and Consumption in the U.S. Energy Sector.” Journal of Environmental Economics and Management, 55(2): 175.193. http://www.dartmouth.edu/~mansur/papers/mansur_mendelsohn_morrison_climate.pdf
Maulbetsch, J. and M. DiFilippo. 2006. Cost and Value of Water Use at Combined-Cycle Power Plants. CEC-500-2006-034. Sacramento, CA: California Energy Commission.
McCullough, D.A., J. M. Bartholow, H. I. Jager, R. L. Beschta, E. F. Cheslak, M. L. Deas, J. L. Ebersole, J. S. Foott, S. L. Johnson, W. J. Kimmerer, K. R. Marine, M. G. Mesa, J. H. Petersen, Y. Souchon, K. F. Tiffan, and W. A. Wurtsbaugh. 2009. “Research in thermal biology: Burning questions for coldwater stream fishes.” Reviews in Fisheries Science 17(1): 90-115.
McGurty, J. 2012. “UPDATE 6-Outages, floods hit two N.J. refineries; others restart.” Reuters, October 30, 2012. http://www.reuters.com/article/2012/10/30/storm-sandy-refining-idUSL3E8LU3LQ20121030.
U.S. ENERGY SECTOR VULNERABILITIES TO CLIMATE CHANGE AND EXTREME WEATHER
R-11
McMahon, J. and S.K. Price. 2011. Water and Energy Interactions. Annual Review of Environment and Resources, Vol. 36, pp. 163-191, 2011.
Mehta, V., D. Rheinheimer, D. Yates, D. Purkey, J. Viers, C. Young and J. Mount. 2011. “Potential Impacts on Hydrology and Hydropower Production Under Climate Warming of the Sierra Nevada.” Journal of Water and Climate Change 2(1): 29–43. DOI:10.2166/wcc.2011.054.
Meyers, S., A. Williams, and P. Chan. 2011. Energy and Economic Impacts of Federal Energy and Water Conservation Standards Adopted from 1987 Through 2010. LBNL-5291E. Berkeley, CA: Lawrence Berkeley National Laboratory. http://eetd.lbl.gov/publications/energy-and-economic-impacts-us-federal-energy-and-water-conservation-standards-adopted-1987-through.
Miller, N., K. Hayhoe, J. Jin, and M. Auffhammer. 2008. “Climate, Extreme Heat, and Electricity Demand in California.” Journal of Applied Meteorology 47: 1834–44.
NASA (National Aeronautics and Space Administration). 2012. “Arctic Sea Ice Extent Settles at Record Seasonal Minimum.” Arctic Sea Ice News and Analysis, September 19, 2012. http://nsidc.org/arcticseaicenews/2012/09/arctic-sea-ice-extent-settles-at-record-seasonal-minimum/.
NASA. 2013a. “Cloud Climatology.” International Satellite Cloud Climatology Project. http://isccp.giss.nasa.gov/role.html.
NASA. 2013b. “The Earth’s Climate System Constantly Adjusts.” Clouds and Radiation. http://earthobservatory.nasa.gov/Features/Clouds/.
NEI (Nuclear Energy Institute). 2012. Through the Decades: History of US Nuclear Energy Facilities Responding to Extreme Natural Challenges. Nuclear Energy Institute. http://www.nei.org/CorporateSite/media/filefolder/COMM/Natural-Disasters-Through-the-Decades_121312.pdf?ext=.pdf.
NETL (National Energy Technology Laboratory). 2008. Estimating Freshwater Needs to Meet Future Thermoelectric Generation Requirements. DOE/NETL-400/2008/1339. http://www.netl.doe.gov/technologies/coalpower/ewr/pubs/2008_Water_Needs_Analysis-Final_10-2-2008.pdf.
NETL. 2009a. Impact of Drought on U.S. Steam Electric Power Plant Cooling Water Intakes and Related Water Resource Management Issues. Technical Report DOE/NET-2009/1364, National Energy Technology Laboratory.
NETL. 2009b. Use of Non-Traditional Water for Power Plant Applications: An Overview of DOE/NETL R&D Efforts. DOE/NETL-311/040609. Pittsburgh, PA: National Energy Technology Laboratory. http://www.netl.doe.gov/technologies/coalpower/ewr/water/pdfs/Use%20of%20Nontraditional%20Water%20for%20Power%20Plant%20Applications.pdf.
NETL. 2010a. Cost and Performance Baseline for Fossil Energy Plants-Volume 1: Bituminous Coal and Natural Gas to Electricity-Revision 2. DOE/NETL-2010/1397. Pittsburgh, PA: National Energy Technology Laboratory.
NETL. 2010b. Water Vulnerabilities for Existing Coal-Fired Power Plants. DOE/NETL-2010/1429. Pittsburgh, PA: National Energy Technology Laboratory. http://www.netl.doe.gov/technologies/coalpower/ewr/water/pdfs/DOENETL-2010-1429%20WaterVulnerabilities.pdf.
NETL. 2010c. Research Addressing Power Plant Water Management to Minimize Water Use while Providing Reliable Electricity Generation. Pittsburgh, PA: National Energy Technology Laboratory. http://www.netl.doe.gov/technologies/coalpower/ewr/water/pdfs/Water%20Energy%20Overview_2010.pdf.
NETL. 2010d. Estimating Freshwater Needs to Meet Future Thermoelectric Generation Requirements 2010 Update. DOE/NETL-400/2010/1339. Pittsburgh, PA: National Energy Technology Laboratory.
NETL. 2013. “Physical, Biological, and Chemical Implications of Midwinter Pumping of Tundra Ponds.” National Energy Technology Laboratory. Accessed February 26, 2013. www.netl.doe.gov/technologies/oil-gas/Petroleum/projects/Environmental/Reg_Streamlining/41248_3_03_2.htm.
NHC (National Hurricane Center). 2012. “Tropical Cyclone Climatology.” National Hurricane Center. http://www.nhc.noaa.gov/climo/#uss.
NIFC (National Interagency Fire Center). 2012. “Year-to-date statistics 2012.” National Interagency Fire Center. http://www.nifc.gov/fireInfo/fireInfo_stats_totalFires.html.

U.S. ENERGY SECTOR VULNERABILITIES TO CLIMATE CHANGE AND EXTREME WEATHER
R-12
NOAA (National Oceanic and Atmospheric Administration). 2008. “National Weather Service Weather Forecast Office: Little Rock, AR, Yearly Report. Heavy Rain on March 17-19, 2008 (Pictures).” U.S. Department of Commerce, National Oceanic and Atmospheric Administration. http://www.srh.noaa.gov/lzk/?n=rain0308bpics1yr.htm.
NOAA. 2010. State of the Climate in 2009. Silver Spring, MD: U.S. Department of Commerce. http://www.noaanews.noaa.gov/stories2010/20100728_stateoftheclimate.html.
NOAA. 2012a. “The Gulf Region’s Contribution to U.S. Energy Production.” National Oceanic and Atmospheric Administration. http://stateofthecoast.noaa.gov/energy/gulfenergy.html.
NOAA. 2012b. “Graph of Contiguous U.S. Extremes in Minimum Temperature Summer, 1910 to 2011.” National Oceanic and Atmospheric Administration. http://www.ncdc.noaa.gov/extremes/cei/graph/2/06-08.
NOAA. 2012c. State of the Climate National Overview. National Oceanic and Atmospheric Administration, National Climatic Data Center. http://www.ncdc.noaa.gov/sotc/national/2012/7.
NOAA. 2012d. “Global Hazards – June 2012.” National Oceanic and Atmospheric Administration, National Climatic Data Center. http://www.ncdc.noaa.gov/sotc/hazards/2012/6#storms.
NOAA. 2012e. “NWS (National Weather Service) Baltimore/Washington: The Derecho of June 29, 2012.” National Oceanic and Atmospheric Administration. http://www.erh.noaa.gov/lwx/events/svrwx_20120629/.
NOAA. 2012f. Global Sea Level Rise Scenarios for the United States National Climate Assessment. Parris, A., P. Bromirski, V. Burkett, D. R. Cayan, M. Culver, J. Hall, R. Horton, K. Knuuti, R. Moss, J. Obeysekera, A. Sallenger, and J. Weiss. National Oceanic and Atmospheric Administration Tech Memo OAR CPO-1.
NOAA. 2012g. “NWS (National Weather Service) Jackson, MS: 2012 Mississippi River low water event.” National Oceanic and Atmospheric Administration. http://www.srh.noaa.gov/jan/?n=2012_msriver_lowwaterevent.
NOAA. 2012h. “Ocean Explorer: Map of the northern Gulf of Mexico showing the nearly 4,000 active oil and gas platforms.” National Oceanic and Atmospheric Administration. http://oceanexplorer.noaa.gov/explorations/06mexico/background/oil/media/platform_600.html.
NOAA. 2012i. “Preliminary Water Level vs. Predicted Plot: The Battery, NY from 2012/10/29 – 2012/10/30.” National Oceanic and Atmospheric Administration. http://www.erh.noaa.gov/okx/StormEvents/sandy/Sandy_Battery.jpg.
NOAA. 2012j. “Tides and Currents for The Battery, NY.” National Oceanic and Atmospheric Administration. http://tidesandcurrents.noaa.gov/noaatidepredictions/NOAATidesFacade.jsp?Stationid=8518750.
NOAA. 2012k. “Extreme Weather 2011: Texas, New Mexico, Arizona wildfires Spring-Fall, 2011.” National Oceanic and Atmospheric Administration. http://www.noaa.gov/extreme2011/wildfire.html.
NOAA. 2013a. “Billion-Dollar Weather/Climate Disasters.” National Oceanic and Atmospheric Administration. http://www.ncdc.noaa.gov/billions/events.
NOAA. 2013b. Regional Climate Trends and Scenarios for the U.S. National Climate Assessment. Part 9. Climate of the Contiguous United States. Kunkel, K.E, L.E. Stevens, S.E. Stevens, L. Sun, E. Janssen, D. Wuebbles, and J.G. Dobson. NOAA Technical Report. National Environmental Satellite, Data, and Information Service (NESDIS) 142-9, 78 pp. http://scenarios.globalchange.gov/sites/default/files/NOAA_NESDIS_Tech_Report_142-9-Climate_of_the_Contiguous_United_States_3.pdf.
NOAA. 2013c. State of the Climate: National Overview for Annual 2012. National Oceanic and Atmospheric Administration. http://www.ncdc.noaa.gov/sotc/national/2012/13.
NOAA. 2013d. “Historical Hurricane Tracks.” National Oceanic and Atmospheric Administration. http://www.csc.noaa.gov/hurricanes/#.
NPA (Nebraska Power Association). 2011. “Missouri River Flooding of 2011.” http://www.nepower.org/our-business/resource-mix/missouri-river-flooding-of-2011/.
NPCC (Northwest Power and Conservation Council). 2010a. Sixth Northwest Power Plan, Appendix L. Climate Change and Power Planning, Report 2010-09. Portland, OR: Northwest Power and Conservation Council. http://www.nwcouncil.org/media/6326/SixthPowerPlan_Appendix_L.pdf.

U.S. ENERGY SECTOR VULNERABILITIES TO CLIMATE CHANGE AND EXTREME WEATHER
R-13
NPCC. 2010b. Sixth Northwest Power Plan, Appendix C. Demand Forecast, Report 2010-09. Portland, OR: Northwest Power and Conservation Council. http://www.nwcouncil.org/media/6299/SixthPowerPlan_Appendix_C.pdf.
NPCC. 2010c. Sixth Northwest Power Plan, Chapter 3. Electricity Demand Forecast, Report 2010-09. Portland, OR: Northwest Power and Conservation Council. http://www.nwcouncil.org/media/6362/SixthPowerPlan_Ch3.pdf.
NPS (National Park Service). 2013. “Large Fires & Fatalities.” Fire and Aviation Management, National Park Service. U.S. Department of the Interior. http://www.nps.gov/fire/wildland-fire/learning-center/fireside-chats/history-timeline.cfm.
NRC (National Research Council). 2008. Water Implications of Biofuels Production in the United States. National Academies Press, Washington, DC, pp. 19-25.
NRC. 2012. Sea-Level Rise for the Coasts of California, Oregon, and Washington: Past, Present, and Future. Committee on Sea Level Rise in California Oregon and Washington, Board on Earth Sciences and Resources, Ocean Studies Board, and the Division on Earth and Life Studies. Washington, DC: The National Academies Press.
NREL (National Renewable Energy Laboratory). 2011. A Review of Operational Water Consumption and Withdrawal Factors for Electricity Generating Technologies. NREL Report No. TP-6A20-50900. Golden, CO: National Renewable Energy Laboratory. http://www.nrel.gov/docs/fy11osti/50900.pdf.
NREL. 2012. Renewable Electricity Futures Study. Edited by M. Hand, S. Baldwin, E. DeMeo, J.M. Reilly, T. Mai, D. Arent, G. Porro, M. Meshek, D. Sandor. NREL/TP-6A20-52409. Golden, CO: National Renewable Energy Laboratory. http://www.nrel.gov/analysis/re_futures/.
NSIDC (National Snow and Ice Data Center). 2012. “Arctic sea ice reaches lowest extent for the year and the satellite record.” http://nsidc.org/news/press/2012_seaiceminimum.html.
Oluwajobi, F.I., O.S. Ale, and A. Ariyanninuloa. 2012. “Effect of Sag on Transmission Line.” ISSN 2141-7016. Journal of Emerging Trends in Engineering and Applied Sciences 3(4): 627-30. http://jeteas.scholarlinkresearch.org/articles/Effect%20of%20Sag%20on%20Transmission%20Line.pdf.
Omubo-Pepple, V.B., C. Israel-Cookey, G.I. Alaminokuma. 2009. Effects of Temperature, Solar Flux and Relative Humidity on the Efficient Conversion of Solar Energy to Electricity. European Journal of Scientific Research. ISSN 1450-216X Vol.35 No.2 (2009), pp.173-180. http://content.imamu.edu.sa/Scholars/it/VisualBasic/ejsr_35_2_02.pdf.
ORNL (Oak Ridge National Laboratory). 2012a. Climate Change and Energy Supply and Use. Technical Report for the U.S. Department of Energy in Support of the National Climate Assessment Report. Oak Ridge, TN: Oak Ridge National Laboratory. http://www.esd.ornl.gov/eess/EnergySupplyUse.pdf.
ORNL. 2012b. Climate Change and Infrastructure, Urban Systems, and Vulnerabilities. Oak Ridge, TN: Oak Ridge National Laboratory. http://www.esd.ornl.gov/eess/Infrastructure.pdf.
Pan, Z., M. Segal, R.W. Arritt, and E.S. Takle. 2004. “On the Potential Change in Solar Radiation Over the U.S. Due to Increases of Atmospheric Greenhouse Gases.” Renewable Energy 29: 1923–28.
PBS (Public Broadcasting Service). 2008. “Flooded Refinery.” Photo shared through PBS NewsHour photostream on flickr. http://www.flickr.com/photos/newshour/2866893962/.
PNNL (Pacific Northwest National Laboratory). 2012. Climate and Energy-Water-Land System Interactions. Technical Input Report to the U.S. Department of Energy in support of the National Climate Assessment. Report No. PNNL-21185. Richland, WA: Pacific Northwest National Laboratory. http://www.pnnl.gov/main/publications/external/technical_reports/PNNL-21185.pdf.
PPIC (Public Policy Institute of California). 2008. Adaptation of California’s Electricity Sector to Climate Change. San Francisco, CA: Public Policy Institute of California. http://www.ppic.org/content/pubs/report/R_1108EVR.pdf.
Preston, B.L., R.M. Westaway, and E.J. Yuen. 2011. “Climate adaptation planning in practice: an evaluation of adaptation plans from three developed nations.” Mitigation and Adaptation Strategies for Global Change 16, 407-438.
Pryor, S.C., R.J. Barthelmie, D.T. Young, E.S. Takle, R.W. Arritt, D. Flory, W.J. Gutowski, A. Nunes, J. Roads. 2009. “Wind Speed Trends Over the Contiguous United States.” DOI:10.1029/2008JD011416. Journal of Geophysical Research 114.

U.S. ENERGY SECTOR VULNERABILITIES TO CLIMATE CHANGE AND EXTREME WEATHER
R-14
Pryor, S.C., and R.J. Barthelmie. 2010. “Climate Change Impacts on Wind Energy: A Review.” Renewable and Sustainable Energy Reviews 14: 430−437.
Pryor, S.C., and R.J. Barthelmie. 2011. “Assessing Climate Change Impacts on the Near-Term Stability of the Wind Energy Resource over the United States.” Proceedings of the National Academy of Sciences, May 2, 2011.
Quinlan, P. 2010. “Lake Mead’s Water Level Plunges as 11-Year Drought Lingers.” New York Times, August 13, 2010. http://www.nytimes.com/gwire/2010/08/12/12greenwire-lake-meads-water-level-plunges-as-11-year-drou-29594.html?pagewanted=all.
Radziemska, E. 2003. “The effect of temperature on the power drop in crystalline silicon solar cells.” Renewable Energy. Volume 28, Issue 1, January 2003, Pages 1–12.
Rahmstorf, S., M. Perrette, and M. Vermeer. 2012. Testing the robustness of semi-empirical sea level projections. Climate Dynamics 39, 861-875 doi: 10.1007/s00382-38 011-1226-7. http://dx.doi.org/10.1007/s00382-011-1226-7.
Reuters. 2011. “Factbox – Energy Facilities Near Swollen Mississippi River.” Reuters. May 11, 2011. http://www.reuters.com/article/2011/05/12/usa-flooding-refineries-idUSN1022997520110512.
Rosenzweig, C., and Tubiello, F.N. 2007. Adaptation and mitigation strategies in agriculture: an analysis of potential synergies. Paper 25. Washington, DC: National Aeronautics and Space Administration. http://digitalcommons.unl.edu/cgi/viewcontent.cgi?article=1024&context=nasapub.
Sailor, D.J. 2001. “Relating Residential and Commercial Sector Electricity Loads to Climate – Evaluating State Level Sensitivities and Vulnerabilities.” Energy 26: 645−57.
Sailor, D.J. and A.A Pavlova. 2003. “Air Conditioning Market Saturation and Long-Term Response of Residential Cooling Energy Demand to Climate Change.” ISSN 0360-5442, 10.1016/S0360-5442(03)00033-1. Energy 28(9): 941−51.
Sailor, D.J., M. Smith, and M. Hart. 2008. “Climate Change Implications for Wind Power Resources in the Northwest United States.” Renewable Energy 33(11): 2393−406.
Sanders, K.T., and Webber, M. 2012. “Evaluating the energy consumed for water use in the United States.” DOI:10.1088/1748-9326/7/3/034034. Environmental Research Letters 7(2012) 034034. http://industrializedcyclist.com/ENERGYFORWATER.pdf.
Sathaye, J.A., L.L. Dale, P.H. Larsen, G.A. Fitts, K. Koy, S.M. Lewis, and A.F.P. de Lucena. 2013. “Estimating impacts of warming temperatures on California’s electricity System.” Global Environmental Change. ISSN 0959-3780, 10.1016/j.gloenvcha.2012.12.005.
Schwalm, C., C. Williams, and K. Schaefer. 2012a. “Hundred-Year Forecast: Drought.” New York Times, August 11, 2012. http://www.nytimes.com/2012/08/12/opinion/sunday/extreme-weather-and-drought-are-here-to-stay.html?_r=0.
Schwalm, C.R., C.A. Williams, K. Schaefer, D. Baldocchi, T.A. Black, A.H. Goldstein, B.E. Law, W.C. Oechel, and R.L. Scott. 2012b. “Reduction in carbon uptake during turn of the century drought in western North America.” Nature Geoscience, 5, 551-556 doi: 10.1038/ngeo1529. http://www.nature.com/ngeo/journal/v5/n8/full/ngeo1529.html.
SDG&E (San Diego Gas & Electric). 2007. “SDG&E completes service restoration to all fire-impacted customers.” SDG&E Press Release, Nov 13. http://www.sdge.com/newsroom/press-releases/2007-11-13/sdge-completes-service-restoration-all-fire-impacted-customers.
SPE (Society of Petroleum Engineers). 2010. “Adaptation in the Oil and Gas Industry to Projected Impacts of Climate Change.” Presented at the SPE International Conference on Health, Safety and Environment in Oil and Gas Exploration and Production, Rio de Janeiro, Brazil, April 12−14, 2010.
Spracklen, D.V., L.J. Mickley, J.A. Logan, R.C. Hudman, R. Yevich, M.D. Flannigan and A.L. Westerling. 2009. “Impacts of Climate Change from 2000 to 2050 on wildfire activity and carbonaceous aerosol concentrations in the western United States.” Journal of Geophysical Research, 114, D20301. http://ulmo.ucmerced.edu/pdffiles/08JGR_Spracklenetal_submitted.pdf.
Station, C. 2012. “Drought Stressed Corn 001.” Photo shared on flickr. http://www.flickr.com/photos/70377872@N04/7640160698/.

U.S. ENERGY SECTOR VULNERABILITIES TO CLIMATE CHANGE AND EXTREME WEATHER
R-15
Stone, K.C., P.G. Hunt, K.B. Cantrell, K.S. Ro. 2008. The potential impacts of biomass feedstock production on water resource availability. Florence, SC: United States Department of Agriculture, Agricultural Research Service, Coastal Plains Soil, Water, and Plant Research Center. http://www.circleofblue.org/waternews/wp-content/uploads/2010/09/J_BioresTech_Jan2010_-_potential_water_avail_impacts_of_biomass_production.pdf.
Strauss, B.H., R. Ziemlinski, J.L. Weiss, and J.T. Overpeck. 2012. Tidally adjusted estimates of topographic vulnerability to sea level rise and flooding for the contiguous United States. Environmental Research Letters, 7 doi: 10.1088/1748-9326/7/1/014033.
Stroeve, J.C., V. Kattsov, A. Barrett, M. Serreze, T. Pavlova, M. Holland, and W.N. Meier. 2012. Trends in Arctic sea ice extent from CMIP5, CMIP3 and observations. Geophysical Research Letters 39, 7 doi: 10.1029/2012GL052676.
Tetra Tech. 2008. California’s Coastal Power Plants: Alternative Cooling System Analysis. Oakland, CA: California Ocean Protection Council. http://www.opc.ca.gov/webmaster/ftp/project_pages/OTC/engineering%20study/CA_Power_Plant_Analysis_Complete.pdf.
Tetra Tech. 2009. Final Report: Bay Shore Power Plant, Intake and Thermal Discharge NPDES Compliance Option Evaluation. Pasadena, CA: Tetra Tech. http://www.westernlakeerie.org/Bayshore_tetra_tech_EvalFinal0309.pdf.
Tidwell, V.C., P.H. Kobos, L.A. Malczynski, G. Klise, and C.R. Castillo. 2012. “Exploring the Water-Thermoelectric Power Nexus.” Journal of Water Planning and Management 138(5), 491–501.
Tidwell, V., J. Macknick, K. Zemlick, J. Sanchez, and T. Woldeyesus. 2013. “Transitioning to Zero Freshwater Withdrawal for Thermoelectric Generation in the United States.” (submitted). Accompanying presentation given at American Geophysical Union Fall 2012 Meeting available at http://www.nrel.gov/docs/fy13osti/57444.pdf.
Trenberth, K. 2011. “Changes in Precipitation with Climate Change.” DOI: 10.3354/cr00953. Climate Research 47(2011): 123–138. http://www.int-res.com/articles/cr_oa/c047p123.pdf.
TWDB (Texas Water Development Board). 2012. 2012 State Water Plan. Austin, TX: Texas Water Development Board. http://www.twdb.state.tx.us/waterplanning/swp/2012/.
USDA (U.S. Department of Agriculture). 2010. Study of Rural Transportation Issues. With U.S. Department of Commerce. www.ams.usda.gov/AMSv1.0/getfile?dDocName=STELPRDC5084108.
USGCRP (U.S. Global Change Research Program). 2009. Global Climate Change Impacts in the United States. Edited by Karl, T. R., J. M. Melillo, and T. C. Peterson. Cambridge, UK: Cambridge University Press.
USGS (United States Geological Survey). 2000. Water Produced with Coal-Bed Methane. USGS Fact Sheet FS-156-00. November 2000. http://pubs.usgs.gov/fs/fs-0156-00/fs-0156-00.pdf
USGS. 2003. Groundwater Depletion Across the Nation. USGS Fact Sheet-103-03. United States Geological Survey. http://pubs.usgs.gov/fs/fs-103-03/JBartolinoFS(2.13.04).pdf.
USGS. 2004. Estimated Use of Water in the United States in 2000: U.S. Geological Survey Circular 1268. Reston, VA: United States Geological Survey. http://pubs.usgs.gov/circ/2004/circ1268/pdf/circular1268.pdf.
USGS. 2005. “Methods for Estimating Water Withdrawals for Mining in the United States, 2005.” Scientific Investigations Report: 2009–5053.
USGS. 2008. “90 Billion Barrels of Oil and 1,670 Trillion Cubic Feet of Natural Gas Assessed in the Arctic.” U.S. Geological Survey. July 23, 2008. http://www.usgs.gov/newsroom/article.asp?ID=1980&from=rss_home#.UEo0laRYt6M.
USGS. 2009. Estimated Use of Water in the United States in 2005: U.S. Geological Survey Circular 1344. Reston, VA: United States Geological Survey. http://pubs.usgs.gov/circ/1344/pdf/c1344.pdf.
USGS. 2013a. Groundwater Depletion in the United States (1900-2008). U.S. Geological Survey Scientific Investigations Report 2013-5079. http://pubs.usgs.gov/sir/2013/5079.
USGS. 2013b. “Oil Shale.” Updated January 31, 2013. Washington, DC: U.S. Geological Survey. http://energy.usgs.gov/OilGas/UnconventionalOilGas/OilShale.aspx.

U.S. ENERGY SECTOR VULNERABILITIES TO CLIMATE CHANGE AND EXTREME WEATHER
R-16
USNRC (U.S. Nuclear Regulatory Commission). 2006. “Power Reactor Status Report for August 2, 2006.” U.S. Nuclear Regulatory Commission. http://www.nrc.gov/reading-rm/doc-collections/event-status/reactor-status/2006/20060802ps.html.
USNRC. 2011. “NRC Tracking Flooding at Two Nebraska Nuclear Power Plants.” U.S. Nuclear Regulatory Commission. http://pbadupws.nrc.gov/docs/ML1117/ML11174A137.pdf.
USNRC. 2012. “Power Reactor Status Reports for 2012.” NRC Library. http://www.nrc.gov/reading-rm/doc-collections/event-status/reactor-status/2012/#August.
U.S. Census Bureau. 2013. “USA Trade Online.” Accessed June 23, 2013. https://usatrade.census.gov/.
UT Austin (University of Texas at Austin). 2012. “Groundwater Depletion in Semiarid Regions of Texas and California Threatens U.S. Food Security.” ScienceDaily, May 28, 2012. http://www.sciencedaily.com /releases/2012/05/120528154857.htm.
van Vliet, M.T.H, J.R. Yearsley, F. Ludwig, S. Vögel, D.P. Lettenmaier, and P. Kabat. 2012. “Vulnerability of U.S. and European Electricity Supply to Climate Change.” Nature Climate Change, June 3, 2012. DOI: 10.1038/nclimate1546.
Wald, M. 2012a. “Heat Shuts Down a Coastal Reactor.” New York Times Green Blog, August 13, 2012. http://green.blogs.nytimes.com/2012/08/13/heat-shuts-down-a-coastal-reactor/.
Wald, M. 2012b. “So, How Hot Was it?” New York Times Green Blog, July 17, 2012. http://green.blogs.nytimes.com/2012/07/17/so-how-hot-was-it/.
Walton, B. 2010. “Low Water May Halt Hoover Dam’s Power.” Circle of Blue. September 22, 2010. http://www.circleofblue.org/waternews/2010/world/low-water-may-still-hoover-dam%E2%80%99s-power/.
Wang, M. and J.E. Overland. 2009. A sea ice free summer Arctic within 30 years. Geophysical Research Letters, 36, 5, http://www.agu.org/pubs/crossref/2009/2009GL037820.shtml.
Wang, X.L., Y. Feng, G. Compo, V. Swail, F. Zwiers, R. Allan, and P. Sardeshmukh. 2012. Trends and low frequency variability of extra-tropical cyclone activity in the ensemble of twentieth century reanalysis. Climate Dynamics, 1-26 doi: 10.1007/s00382-012-1450-9
Watson, I.C., O. Morin, and L. Henthorne. 2003. Desalting Handbook for Planners, 3rd Ed. Washington, DC: U.S. Department of the Interior. http://www.usbr.gov/research/AWT/reportpdfs/report072.pdf.
Wehner, M., D.R. Easterling, J.H. Lawrimore, R.R. Heim Jr, R.S. Vose, and B.D. Santer. 2011. Projections of Future Drought in the Continental United States and Mexico. Journal of Hydrometeorology, 12, 1359-1377 doi: 10.1175/2011JHM1351.1. http://journals.ametsoc.org/doi/abs/10.1175/2011JHM1351.1.
Wehner, M.F. 2012. Very extreme seasonal precipitation in the NARCCAP ensemble: Model performance and projections. Climate Dynamics 1, 03 doi: 10.1007/s00382-012-12 1393-1.
Willett, L. 2009. “Barge Tow Loaded with Coal.” Photo shared on flickr. http://www.flickr.com/photos/lance_mountain/4033563450/.
Williams, C. 2011. “Uranium mine under consideration in eastern Oregon.” Sustainable Business Oregon. http://sustainablebusinessoregon.com/articles/2011/09/uranium-mine-under-consideration-in.html.
Williams, R.H., L. Guangjian, T. Kreutz, E. Larson. 2011. “Alternatives for Decarbonizing Existing USA Coal Power Plant Sites.” Energy Procedia 4:1843-1850.
Willis, J.S.K., D. Chamber, C.Y. Kuo, and C. Shum. 2010. Global sea level rise: Recent progress and challenges for the decade to come. Oceanography, 23.
WMO (World Meteorological Organization). 2013. The Global Climate 2001-2010: a decade of climate extremes. http://library.wmo.int/pmb_ged/wmo_1103_en.pdf.
Woodall, B. 2009. “NV Energy Postpones Plans for Coal Plant in Nevada.” Reuters. February 9, 2009. http://www.reuters.com/article/2009/02/09/us-utilities-nvenergy-coal-idUSTRE5187D020090209.
Wu, M., M. Mintz, M. Wang, and S. Arora. 2009. “Water Consumption in the Production of Ethanol and Petroleum Gasoline.” Environmental Management 44: 981–97.

U.S. ENERGY SECTOR VULNERABILITIES TO CLIMATE CHANGE AND EXTREME WEATHER
R-17
Wu, M., M. Mintz, M. Wang, S. Arora, and Y. Chiu. 2011. Consumptive Water Use in the Production of Ethanol and Petroleum Gasoline – 2011 Update. ANL/ESD/09-1-Update. Argonne, IL: Argonne National Laboratory.
Wu, M. and K. Peng. 2011. Developing a Tool to Estimate Water Use in Electric Power Generation in the United States. ANL/ESD/11-2-Update, Argonne National Laboratory, Argonne IL.
Yang, J., M. Xu, X. Zhang, Q. Hu, M. Sommerfeld, and Y. Chen. 2010. “Life-cycle analysis on biodiesel production from microalgae: Water footprint and nutrients balance.” Bioresource Technology. DOI:10.1016/j.biortech.2010.07.017.


