This Annual report covers the Financial Year starting 1st july,2013 to 30th june,2014. The report highlights the activities of the County Executive in each of the ten departments. The County Executive comprises of the Office of the Governor and the ten departments - The Body Chapter 1
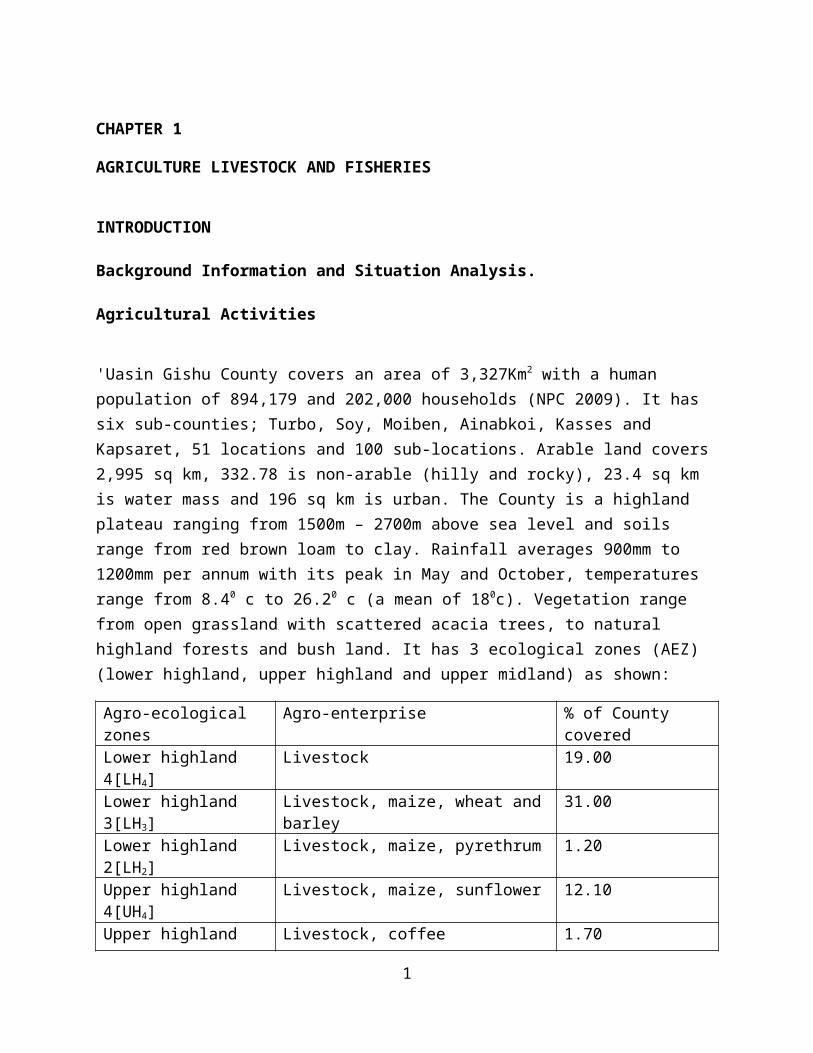
CHAPTER 1 AGRICULTURE LIVESTOCK AND FISHERIES INTRODUCTION Background Information and Situation Analysis. Agricultural Activities 'Uasin Gishu County covers an area of 3,327Km 2 with a human population of 894,179 and 202,000 households (NPC 2009). It has six sub-counties; Turbo, Soy, Moiben, Ainabkoi, Kasses and Kapsaret, 51 locations and 100 sub-locations. Arable land covers 2,995 sq km, 332.78 is non-arable (hilly and rocky), 23.4 sq km is water mass and 196 sq km is urban. The County is a highland plateau ranging from 1500m – 2700m above sea level and soils range from red brown loam to clay. Rainfall averages 900mm to 1200mm per annum with its peak in May and October, temperatures range from 8.4 0 c to 26.2 0 c (a mean of 18 0 c). Vegetation range from open grassland with scattered acacia trees, to natural highland forests and bush land. It has 3 ecological zones (AEZ) (lower highland, upper highland and upper midland) as shown: Agro-ecological zones Agro-enterprise % of County covered Lower highland 4[LH 4 ] Livestock 19.00 Lower highland 3[LH 3 ] Livestock, maize, wheat and barley 31.00 Lower highland 2[LH 2 ] Livestock, maize, pyrethrum 1.20 Upper highland 4[UH 4 ] Livestock, maize, sunflower 12.10 Upper highland Livestock, coffee 1.70 1
Transcript
CHAPTER 1
AGRICULTURE LIVESTOCK AND FISHERIES
INTRODUCTION
Background Information and Situation Analysis.
Agricultural Activities
'Uasin Gishu County covers an area of 3,327Km2 with a human population of 894,179 and 202,000 households (NPC 2009). It has six sub-counties; Turbo, Soy, Moiben, Ainabkoi, Kasses and Kapsaret, 51 locations and 100 sub-locations. Arable land covers 2,995 sq km, 332.78 is non-arable (hilly and rocky), 23.4 sq km is water mass and 196 sq km is urban. The County is a highland plateau ranging from 1500m – 2700m above sea level and soils range from red brown loam to clay. Rainfall averages 900mm to 1200mm per annum with its peak in May and October, temperatures range from 8.40 c to 26.20 c (a mean of 180c). Vegetation range from open grassland with scattered acacia trees, to natural highland forests and bush land. It has 3 ecological zones (AEZ) (lower highland, upper highland and upper midland) as shown:
Agro-ecological zones Agro-enterprise % of County covered
Lower highland 4[LH4] Livestock 19.00
Lower highland 3[LH3] Livestock, maize, wheat and barley 31.00
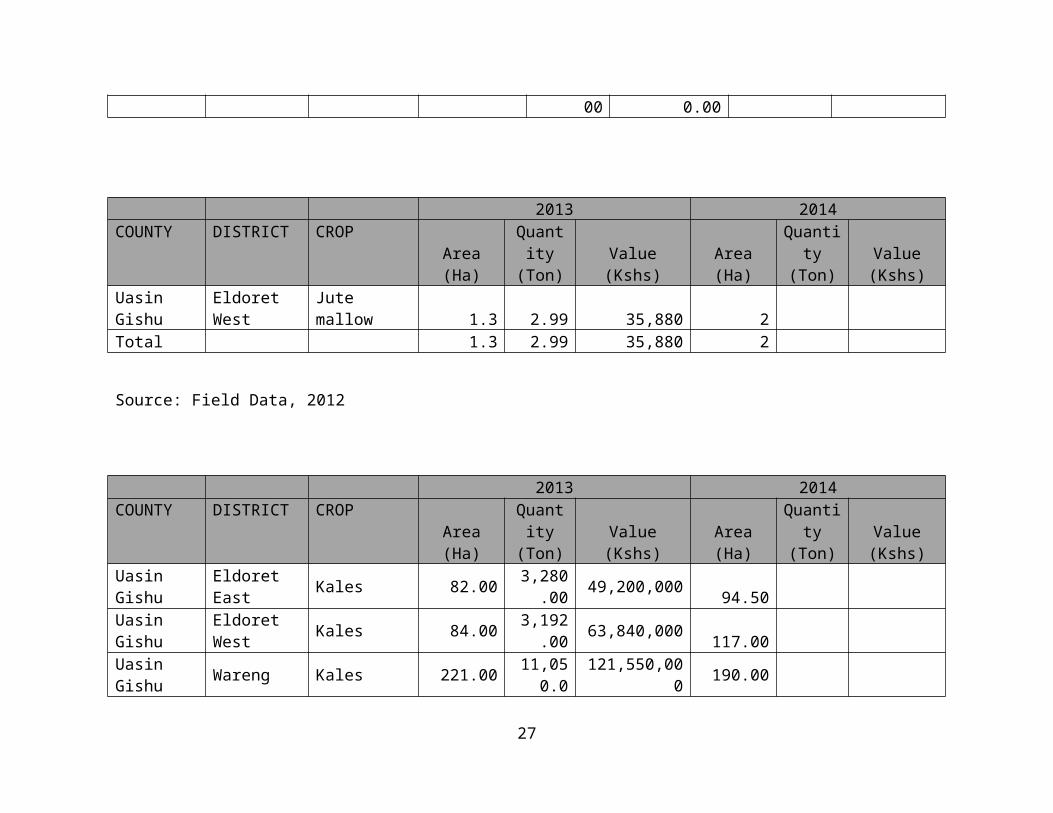
The prices of most vegetable were relatively low due to availability of the leafy vegetables in the
markets. This was as a result of the fact that most vegetables are produced under rain fed. During
the first quarter tomatoes were available and were fetching low prices of between Kshs 30 and
50. The situation changed in the second quarter where prices went up to 100ksh per kilogram.
This is attributed to the fact that most tomatoes are produced outdoor and during the rainy season
diseases like blight affect production. On the other hand, onions prices remained stable
throughout the reporting period. This is because Uasin Gishu is a major importer of onions
mainly from western and central.Marketing of export crops like French beans, snow peas, sugar
snaps, passion fruits and chillies is through contracted buyers whereby the buying price is as per
the contract signed. For French beans the prices are 50/- per kilogram, snow peas, 60/- per
kilogram, passion fruits 70/- per kilogram, chillies dried 60/-,local vegetables for processing
30/- .The major buyers who have signed contracts with farmers are CANKEN International, East
African Growers, Mace foods limited and Equatorial fresh.
Programmes of the Year
The Uasin Gishu county government allocated 30 million for Horticulture Business Strategy to
facilitate various activities. The crops under the strategy are snow peas, sugar snaps, passion
fruits, chillies, bananas, avocadoes, potatoes and French beans. The activities to be undertaken
include:
I. Capacity building of staff and farmers
II. Construction of fruit tree nurseries, grading sheds, charcoal coolers and diffuse light stores
III. Market linkages with local buyers and exporters
24
IV. Value addition of vegetables and fruits
V. Establishment of 30 ward fruit tree nurseries for tissue culture bananas, grafted passion
fruits and grafted avocadoes
VI. Establishment of model farms of vegetables and fruits
VII. Installation of drip irrigation on the model farms
Progress of Activities
I. 30 farmers and 10 staff trained on nursery establishment and management at Chebororwa ATC
II. 90 farmers and 10 staff trained on production of potatoes, export vegetables and fruits and global gap requirements
III. 5 exporters have been brought on board to sign contracts with farmers
IV. Procurement process of materials such as screen nets for fruit tree nurseries ,vegetable seeds, agrochemicals and fruit seedlings has been initiated
V. Construction of grading shed, charcoal coolers and diffuse light store is on going
VI. Construction of a county fruit tree nursery has been completed
VII. 4500 seedlings of passion fruit and 2000 seedlings of avocadoes have been issued to farmer groups in all the wards
Staff Training
4 technical staff members were trained on Global gap and internal auditing by Fresh Produce
Exporters of Kenya and BeureauVeritas at Chebororwa ATC. It was sponsored by USAID
program under the Kenya Horticulture Competitive program. Another 3 staff will attend a similar
training at Mabanga ATC starting on 28th July 2014.
25
Main Collaborators in Horticulture Industry
The main collaborators in Horticulture industry are:
H.C.D.A - Licensing of fruit tree nurseries and exporters and export market linkages
K.V.D.A. – construction of water pans and dams
Ministry of Water and Irrigation – Construction of water pans, irrigation schemes and dams
Kephis – Phytosanitary certification of export produce
KenInvest – Identification of possible areas of investments in horticulture
E.P.C. – Identification of export markets and logistics of how to export
Exporters – marketing of export produce
Agrodealers – provision of agrochemicals and fertilizer
KENAFF – Collaboration on potato seed production
K.H.C.P – Collaboration on passion fruit value chain
A.S.D.S.P – Collaboration on passion fruit value chain
G-North – provision of dam liners, greenhouses and irrigation equipment
Amiran- provision of irrigation equipment, greenhouse
Hortipro – provision of irrigation equipment and screenhouses
26
AGRIBUSINESS SECTION
Agricultural Credit
S/No.
INSTITUTION PRODUCT AVAILABLE TO FARMERS
INTEREST RATES
%
REMARKS
1. AFC Maize & wheat
seasonal credit
Livestock and fisheries
development loans.
Seasonal crop credit
Horticulture and floriculture
loans
Cash crop loans
Water development loans
10%
Available for those
who meet stated
requirements
Available to
individual farmers as
well as groups
Need collateral for
individual farmers
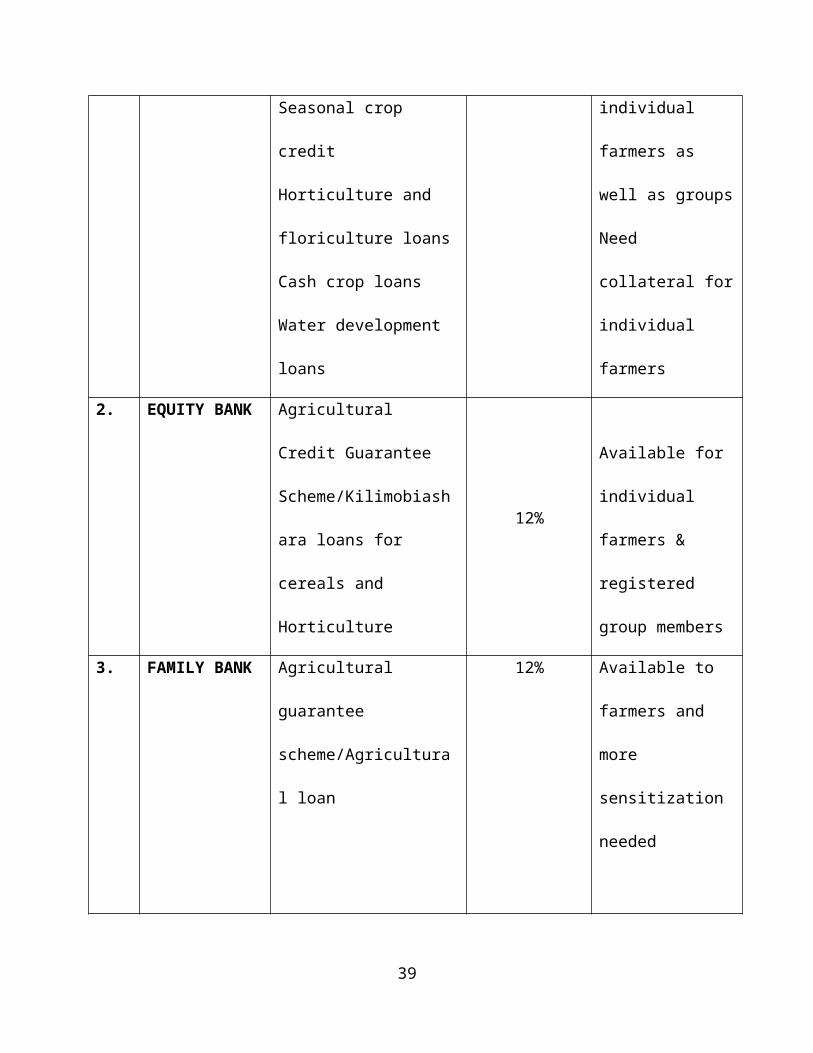
2. EQUITY BANK Agricultural Credit
Guarantee
Scheme/Kilimobiashara
loans for cereals and
Horticulture
12%
Available for
individual farmers &
registered group
members
3. FAMILY BANK Agricultural guarantee
scheme/Agricultural loan
12% Available to farmers
and more
sensitization needed
27
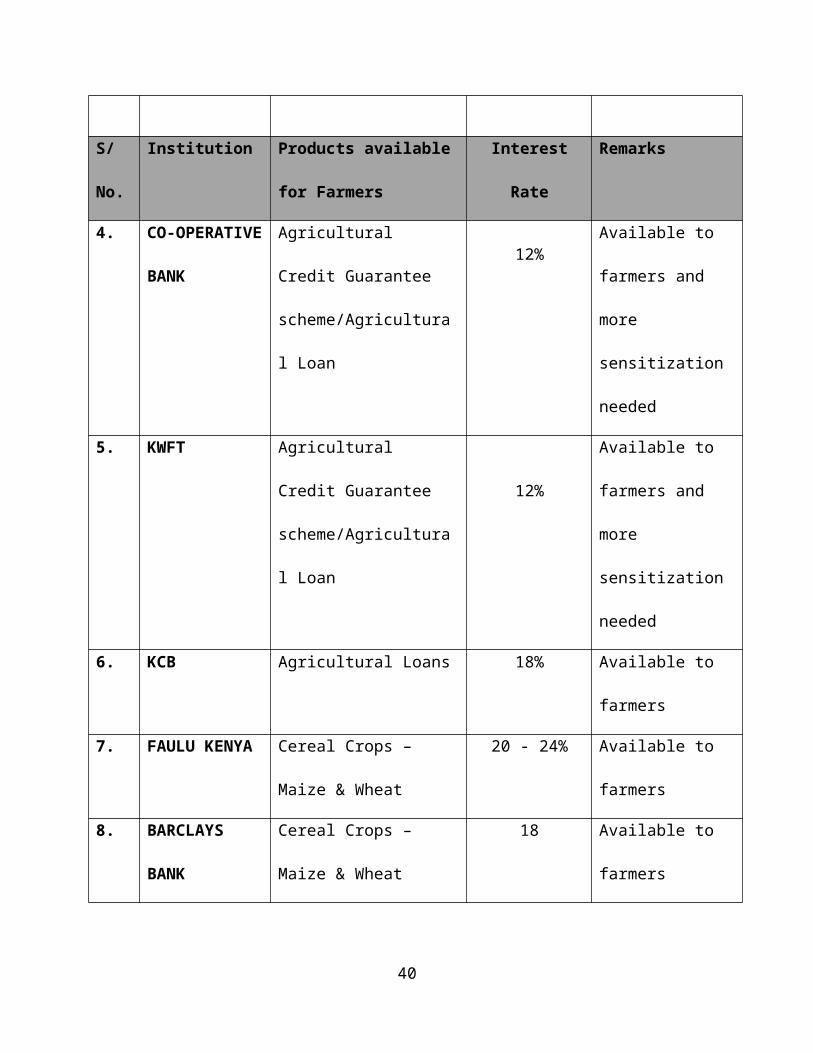
S/
No.
Institution Products available for
FarmersInterest Rate
Remarks
4. CO-
OPERATIVE
BANK
Agricultural Credit
Guarantee
scheme/Agricultural Loan
12% Available to farmers
and more
sensitization needed
5. KWFT Agricultural Credit
Guarantee
scheme/Agricultural Loan
12%
Available to farmers
and more
sensitization needed
6. KCB Agricultural Loans 18% Available to farmers
7. FAULU KENYA Cereal Crops –Maize &
Wheat
20 - 24% Available to farmers
8. BARCLAYS
BANK
Cereal Crops –Maize &
Wheat
18 Available to farmers
Remarks
28
Most financial institutions are offering agricultural credit to farmers in the county. Equity bank,
Family bank, Co-operative bank and KWFT are collaborating with ministry of agriculture in
is also financing agricultural activities in the county.
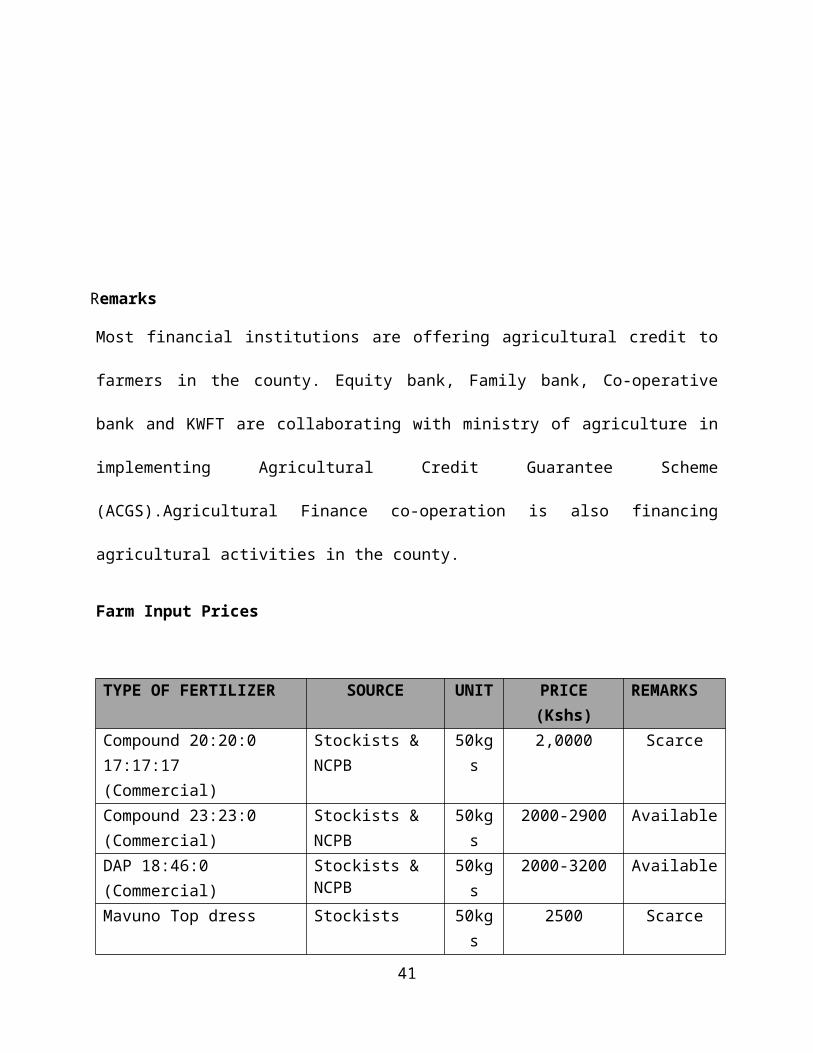
Farm Input Prices
TYPE OF FERTILIZER SOURCE UNIT PRICE (Kshs) REMARKS
Compound 20:20:017:17:17(Commercial)
Stockists & NCPB 50kgs 2,0000 Scarce
Compound 23:23:0(Commercial)
Stockists & NCPB 50kgs 2000-2900 Available
DAP 18:46:0(Commercial)
Stockists & NCPB 50kgs 2000-3200 Available
Mavuno Top dress Stockists 50kgs 2500 Scarce
CAN 26%(Commercial)
Stockists & NCPB 50kgs 1500-2350Available
SSP Stockists & NCPB 50kgs 1900 Available
Foliar feeds(Diamond foliars)
Stockist 5lt0.5lt
50080
Available
Fertilizer
Remarks
The government subsidized fertilizer regulated the fertilizer market and made fertilizer affordable
to many small scale farmers. Planting fertilizer DAP was sold to farmers @ Kshs 2000 per 50kgs
bag and top dressing fertilizers was sold at Kshs 1,500 per 50kgs.
29
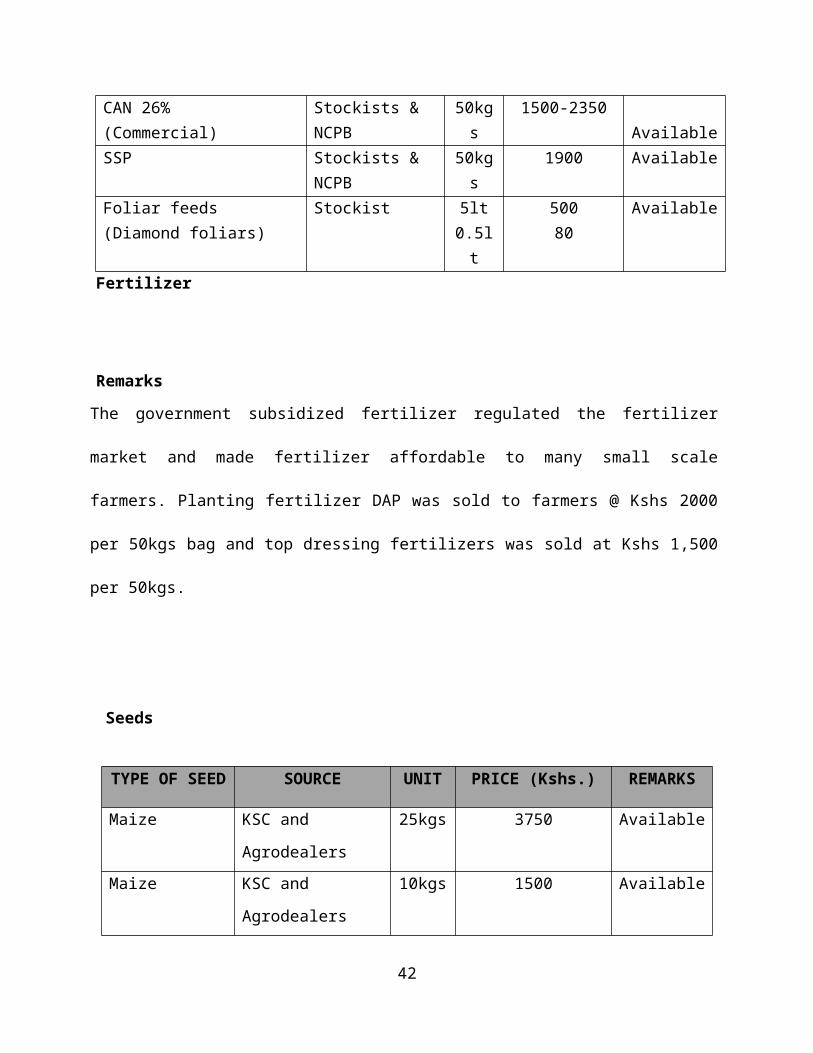
Seeds
TYPE OF SEED SOURCE UNIT PRICE (Kshs.) REMARKS
Maize KSC and Agrodealers 25kgs 3750 Available
Maize KSC and Agrodealers 10kgs 1500 Available
Maize KSC and Agrodealers 2kgs 300 Available
Beans KSC and Agrodealers 2kgs 420 Available
Irish potatoes Local Farmers 50kgs 1,500 Available
Cow peas KSC and Agrodealers 2kgs 280 Available
Sorghum KSC and Agrodealers 2kgs 250-280 Available
Gloria F1 KSC and Agrodealers 10g 580 Available
Copenhagen KSC and Agrodealers 25g 100 Available
Collards KSC and Agrodealers 50g 140 Available
Spinach KSC and Agrodealers 100g 185 Available
Tomatoes KSC and Agrodealers 10g 200 Available
Carrots KSC and Agrodealers 20g 70 Available
A. Nightshade KSC and Agrodealers 10g 80 Available
Bulb onions KSC and Agrodealers 50g 310 Available
Capsicum KSC and Agrodealers 50g 350 Available
Remarks
All vegetable seeds were available in most stockist shops
Major Agrochemicals
CHEMICAL UNIT PRICE REMARKS
30
HERBICIDES
Pre-magram gold 5 litres 6,200 Available
Lasso+Atrazine 1 litre 1600 Not available
Gramoxone 5 litres 1250 Available
Round up 1 litre 1300 Available
2,4 – D Amine 1 litre 650 Available
Wipe out 1 litre 1300 Available
Murphamine 72 1 litre 600 Available
Tata moto 70wp 1kg - Not demanded
Tata panida 50 EC 1 litre - Not demanded
Herbikil 1 litre 900 Available
Farmuronwp 500gms - Available
FUNGICIDES
Tata master 72 100gms 1450 Available
Dithane M45 200gms 2000 Available
Miltraz 40gms 180 Available
Ridomil 50gms 180-220 Available
Oshothane 200gms 200 Available
Farm cozeb 1kg 750-800 Available
Cyclone 100 mls 200 Available
PESTICIDES
Karate 2.5 WG 40gms 200 Available
Dimethoate 100mls 150 Available
31
Diazinon 28mls 70-80 Available
Actellic super 1kg 800 Available
Orgor 40 E C 100gms 150 Available
Dimex 40 EC 28mls - Not available
Malathion 2% 1kg 140 Available
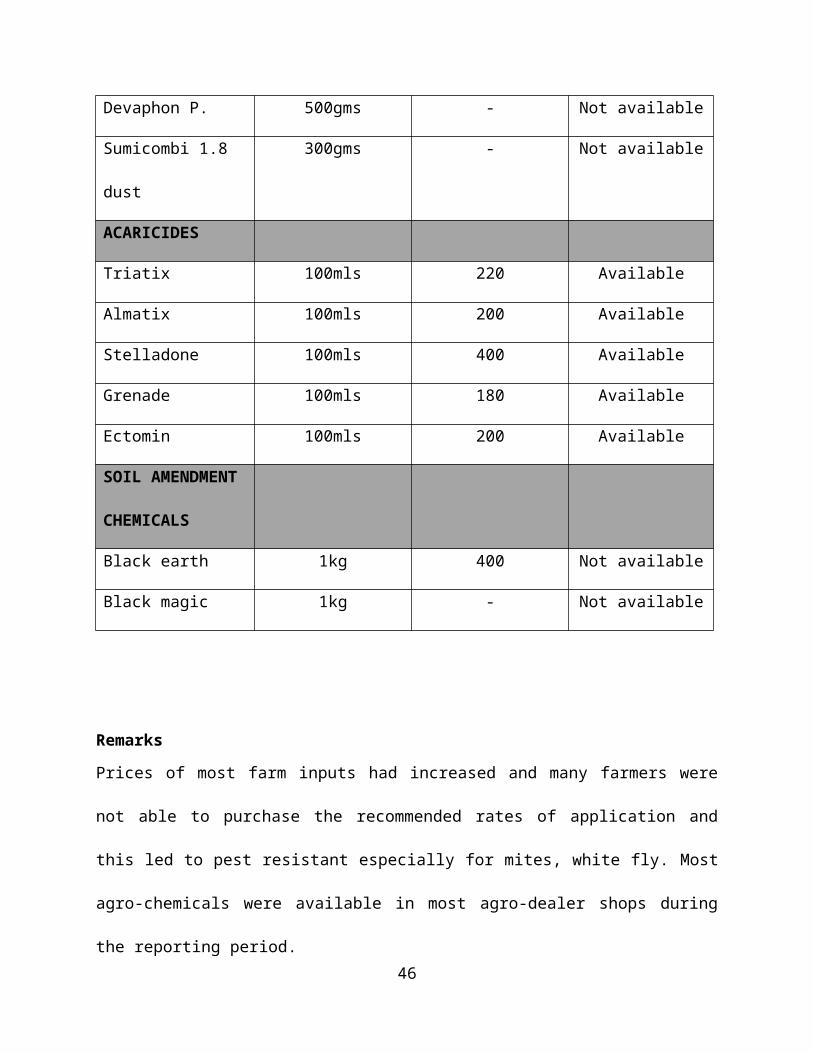
Devaphon P. 500gms - Not available
Sumicombi 1.8 dust 300gms - Not available
ACARICIDES
Triatix 100mls 220 Available
Almatix 100mls 200 Available
Stelladone 100mls 400 Available
Grenade 100mls 180 Available
Ectomin 100mls 200 Available
SOIL
AMENDMENT
CHEMICALS
Black earth 1kg 400 Not available
Black magic 1kg - Not available
Remarks
32
Prices of most farm inputs had increased and many farmers were not able to purchase the
recommended rates of application and this led to pest resistant especially for mites, white fly.
Most agro-chemicals were available in most agro-dealer shops during the reporting period.
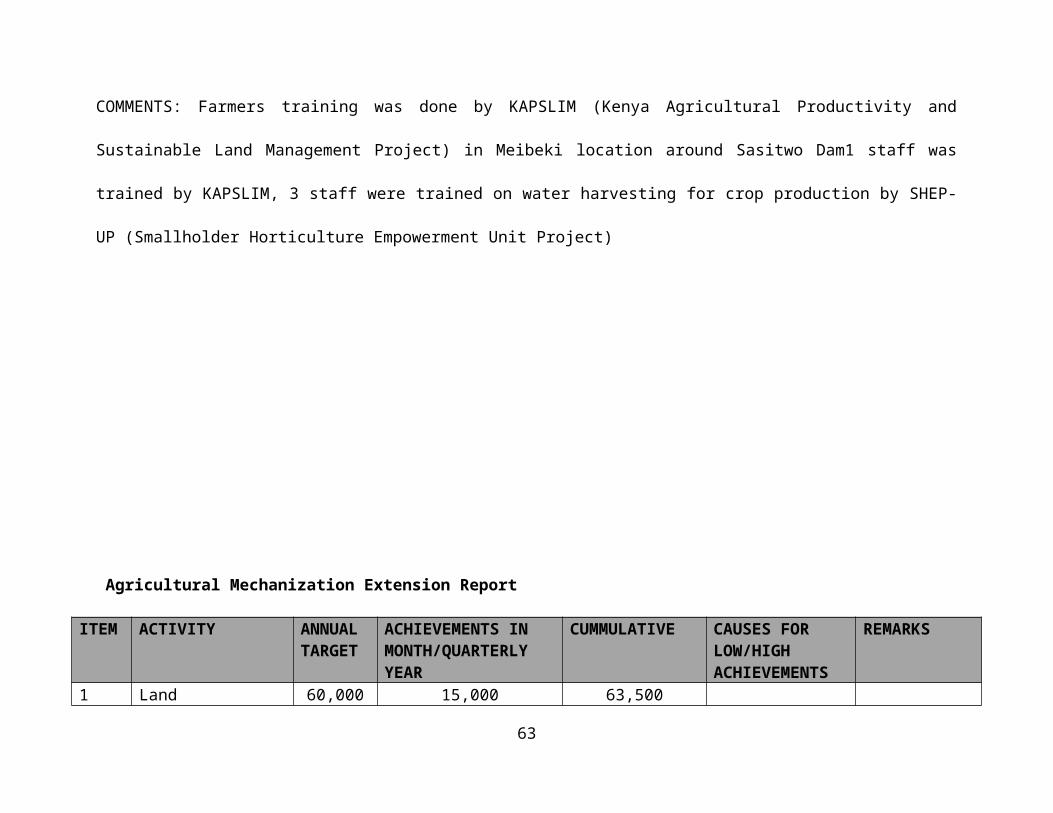
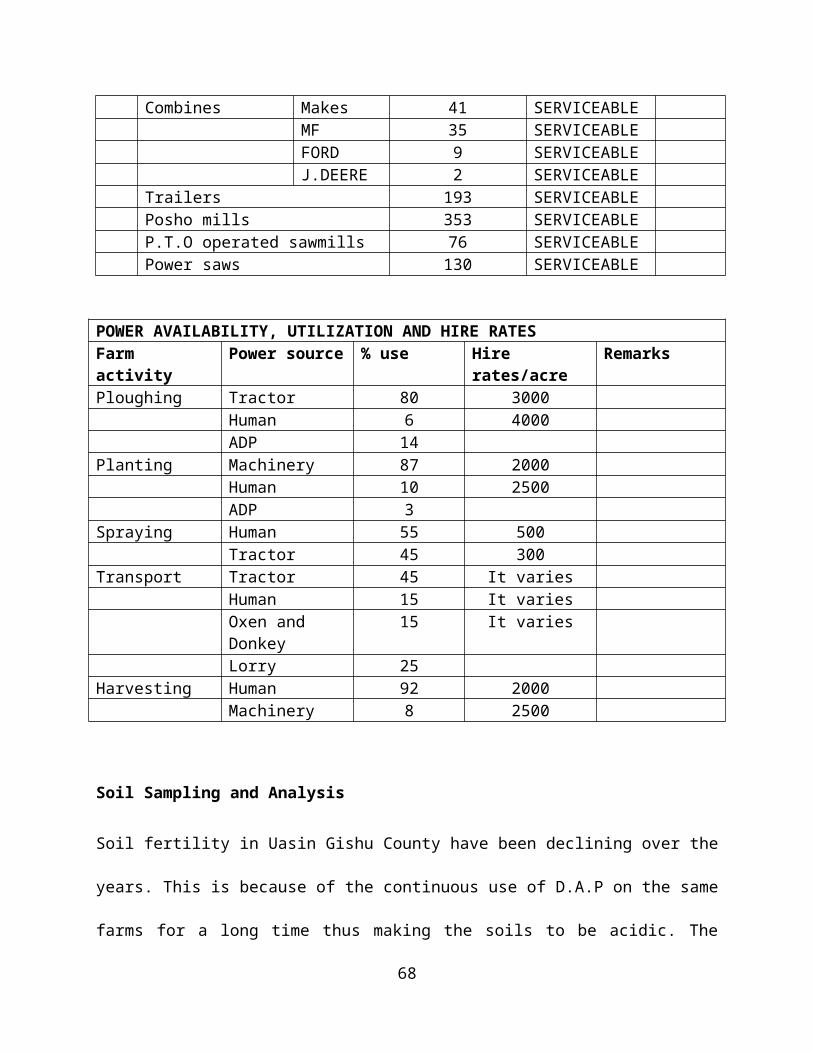
Cost of Agricultural Mechanization
Rates/Acre/bag in Kshs
Activity Tractor Oxen Hand Remarks
Opening new land 3500-4000 Tractors used
1st Ploughing 3000 2000 Tractor
2nd Ploughing 2500 2000 Tractor
Harrowing 15000 Tractor
Planting 1500 1000(Furrows
)
2000 Tractor
Weeding 2000
Spraying & weeding 1200-1500 400
Shelling 50-60/=/Bag 60/= /Bag
On-farm transport 50/=/ Bag 30-50/=/Bag 30-50/= /Bag
Off-farm transport 100=/Bag 50-100/= /Bag
Remarks
Most farm operations are mechanized; family and hired labor are available but is
expensiveProper planter calibration should be done to ensure the right plant population. The
above mechanization costs are fairly high for farmers.
33
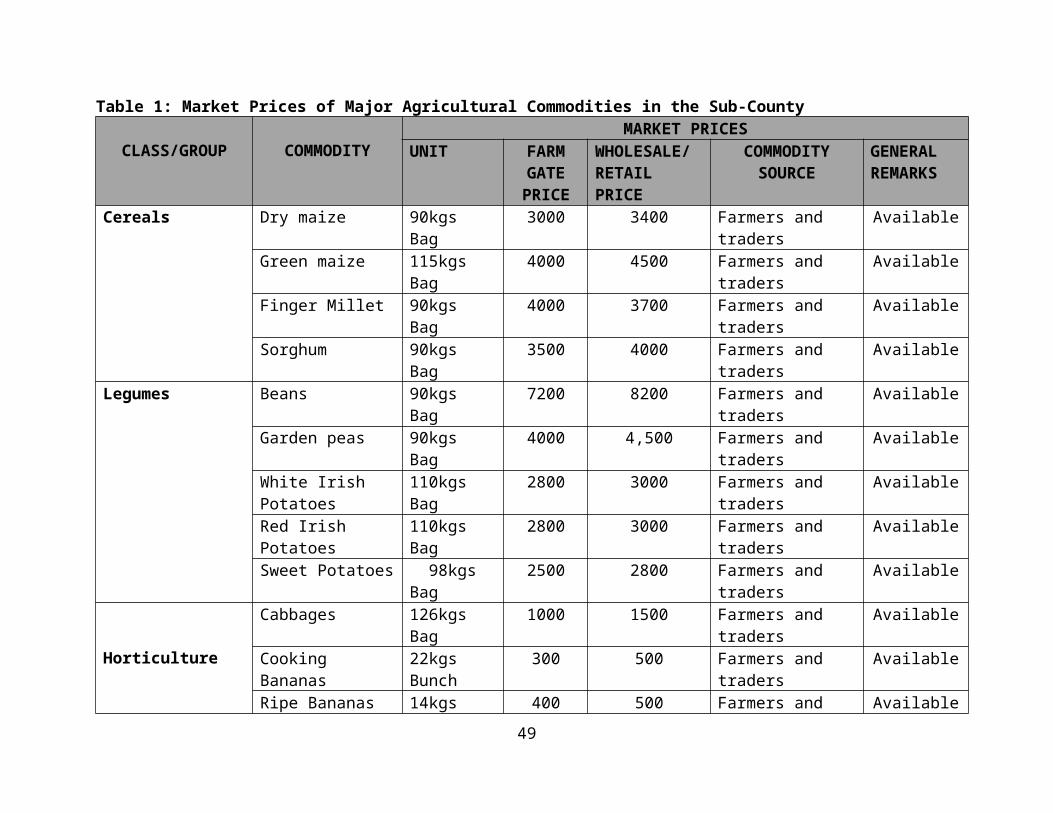
Table 1: Market Prices of Major Agricultural Commodities in the Sub-County
CLASS/GROUP COMMODITYMARKET PRICES
UNIT FARM GATE PRICE
WHOLESALE/RETAIL PRICE
COMMODITYSOURCE
GENERAL REMARKS
Cereals Dry maize 90kgs Bag 3000 3400 Farmers and traders AvailableGreen maize 115kgs Bag 4000 4500 Farmers and traders AvailableFinger Millet 90kgs Bag 4000 3700 Farmers and traders AvailableSorghum 90kgs Bag 3500 4000 Farmers and traders Available
Legumes Beans 90kgs Bag 7200 8200 Farmers and traders AvailableGarden peas 90kgs Bag 4000 4,500 Farmers and traders AvailableWhite Irish Potatoes 110kgs Bag 2800 3000 Farmers and traders AvailableRed Irish Potatoes 110kgs Bag 2800 3000 Farmers and traders AvailableSweet Potatoes 98kgs Bag 2500 2800 Farmers and traders Available
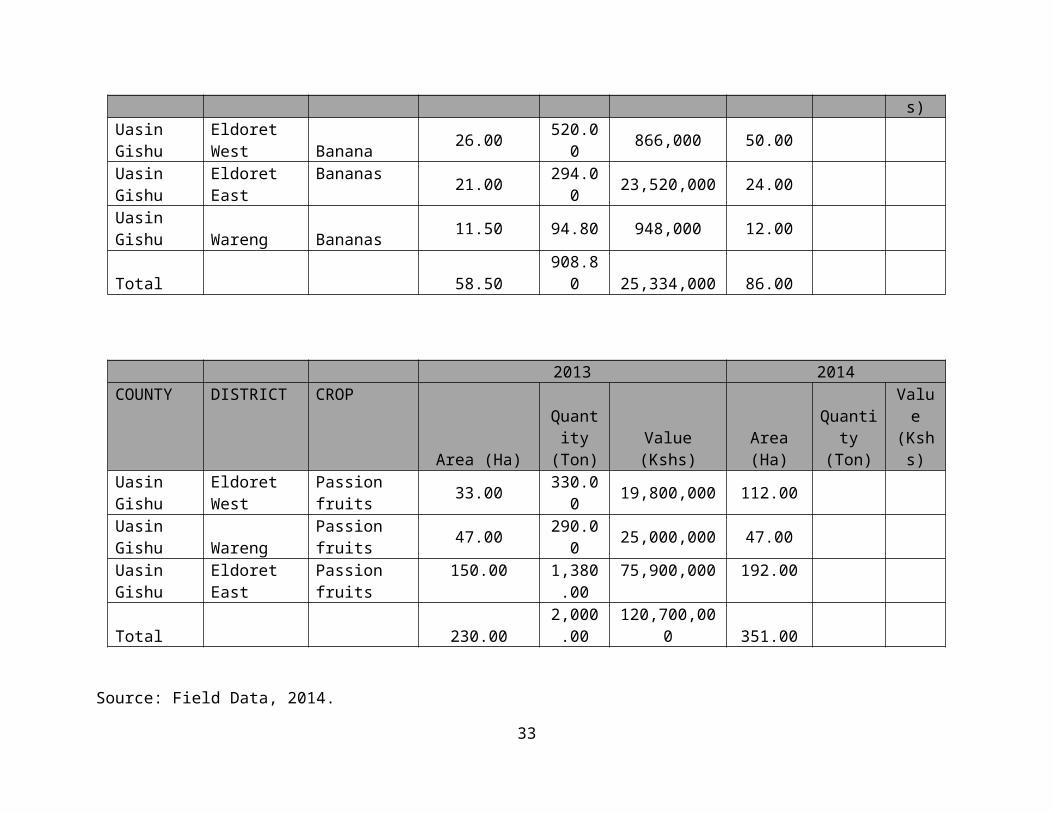
Horticulture
Cabbages 126kgs Bag 1000 1500 Farmers and traders AvailableCooking Bananas 22kgs Bunch 300 500 Farmers and traders AvailableRipe Bananas 14kgs Bunch 400 500 Farmers and traders AvailableCarrots 138kgs Bag 3000 3500 Farmers and traders AvailableTomatoes 64kgs Crate 4000 4500 Farmers and traders AvailableBulb Onions 13kgs Net 780 1000 Farmers and traders AvailableCapsicum 50kgs Net 1500 2000 Farmers and traders AvailableBrinjals 44kgs Bag 1320 2200 Farmers and traders AvailablePassion Fruits 50kgs Bag 3000 6000 Farmers and traders AvailableOranges 93kgs Bag 400 450 Traders AvailableMangoes (Local) 125kgs Bag - 3600 Traders AvailableKales 50kgs Bag 700 900 Traders AvailablePineapples kg (One) 30 50 Traders AvailableAvocadoes kg 800 1200 Traders Available
Local vegetablesBlack night shade 1kg 40 80 Within and Outside
the countyAvailable
34
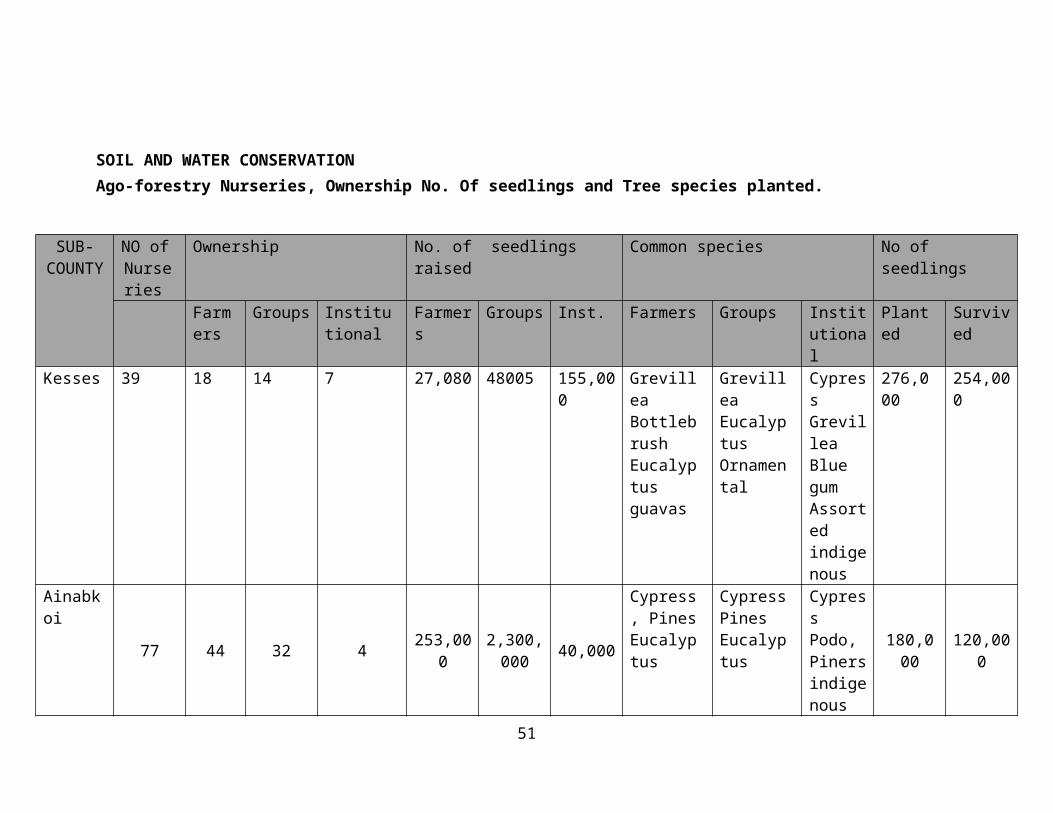
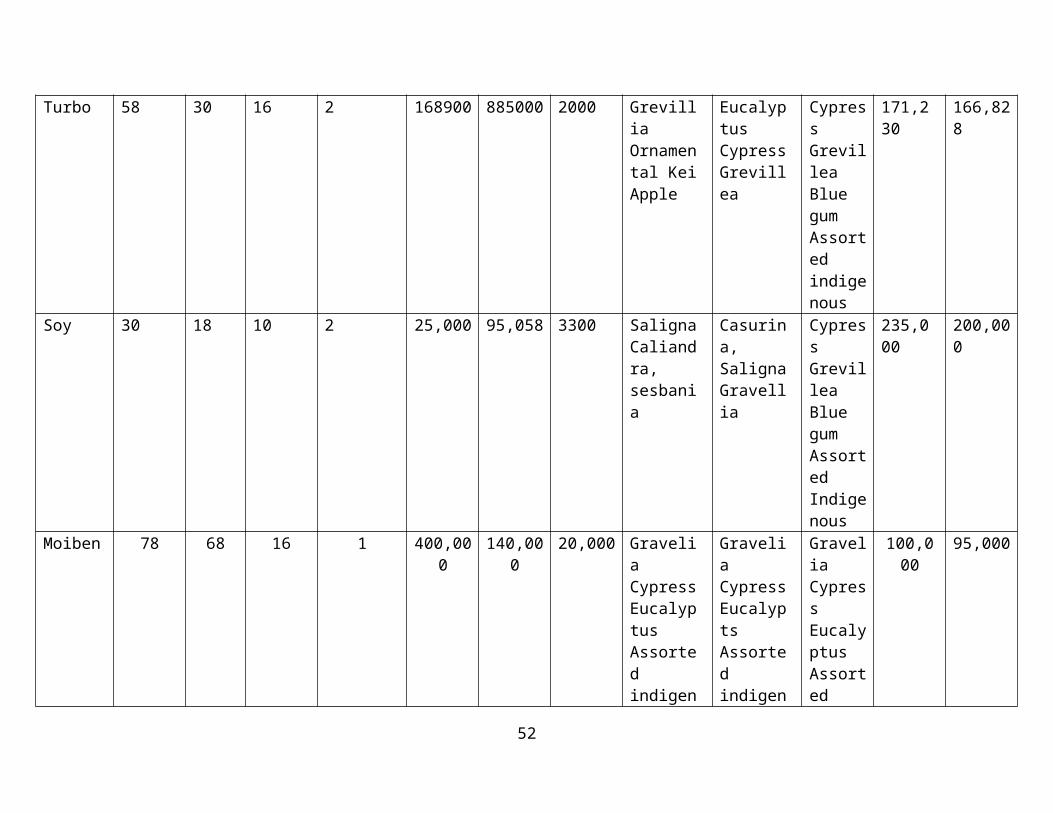
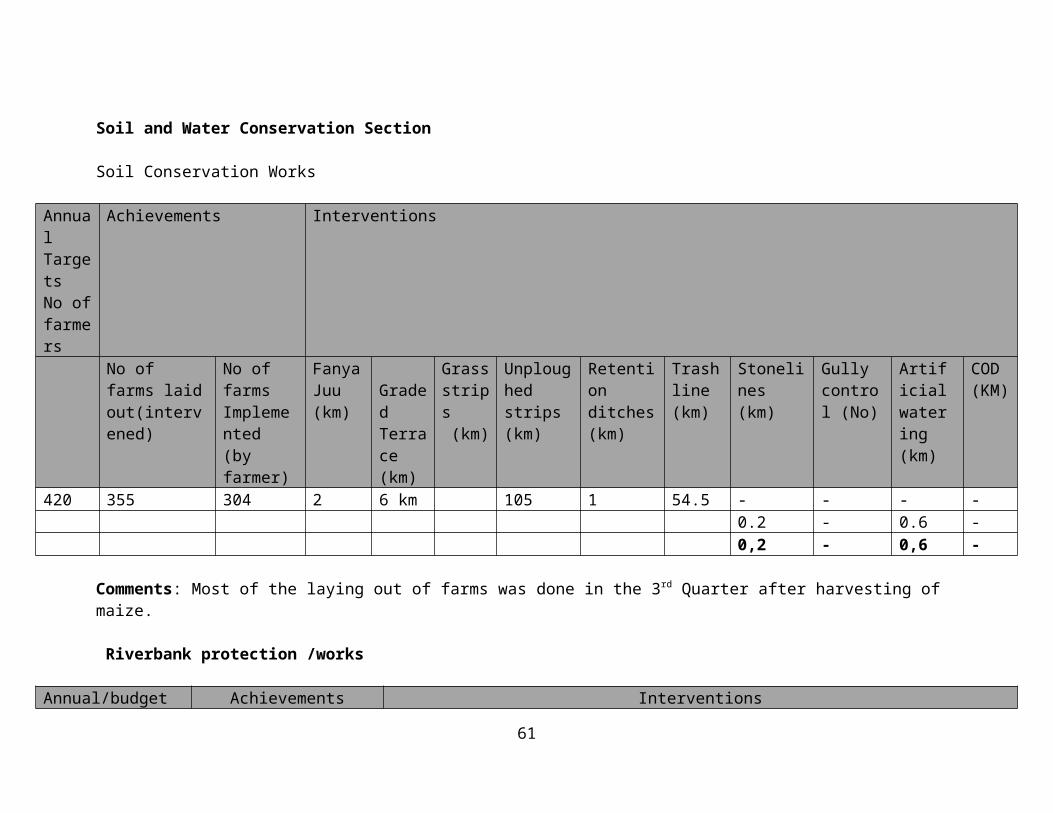
SOIL AND WATER CONSERVATION
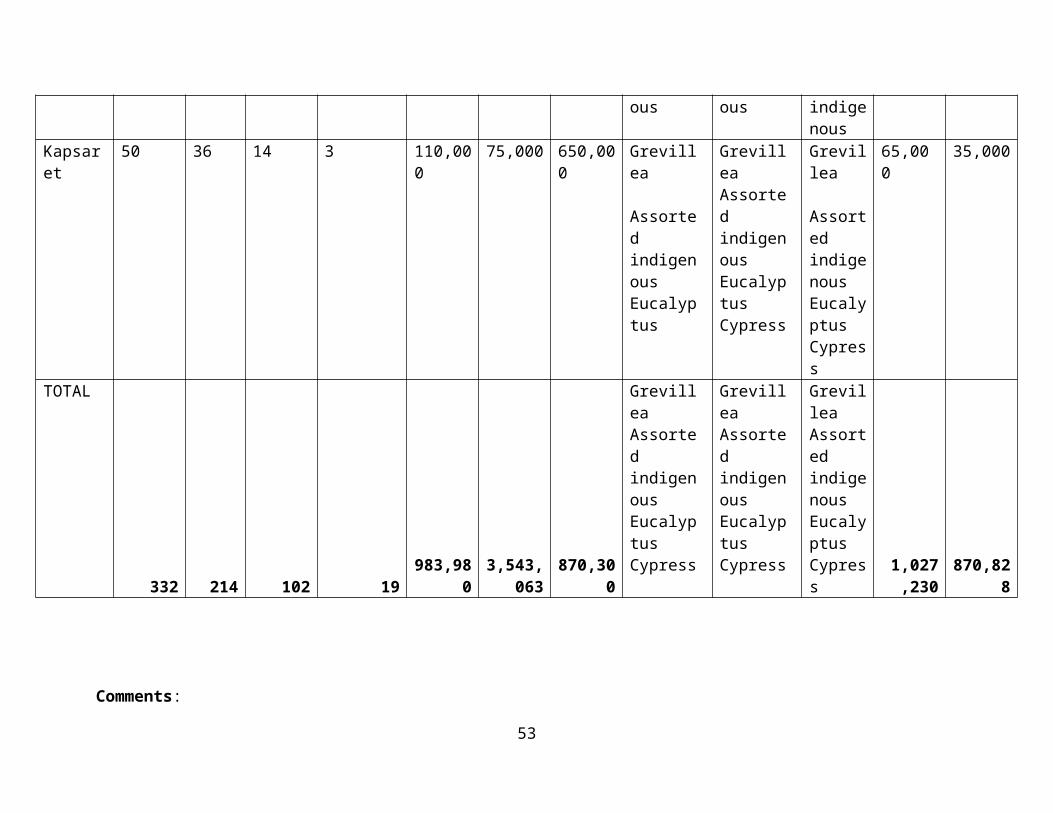
Ago-forestry Nurseries, Ownership No. Of seedlings and Tree species planted.
SUB-COUNT
Y
NO of Nurseries
Ownership No. of seedlings raised Common species No of seedlings
More farmers are establishing tree nurseries due to the high demand of tree seedlings.Prices of poly tubes has gone high nurseries are
also multi purposes and tree seed availability is a challenge.
37
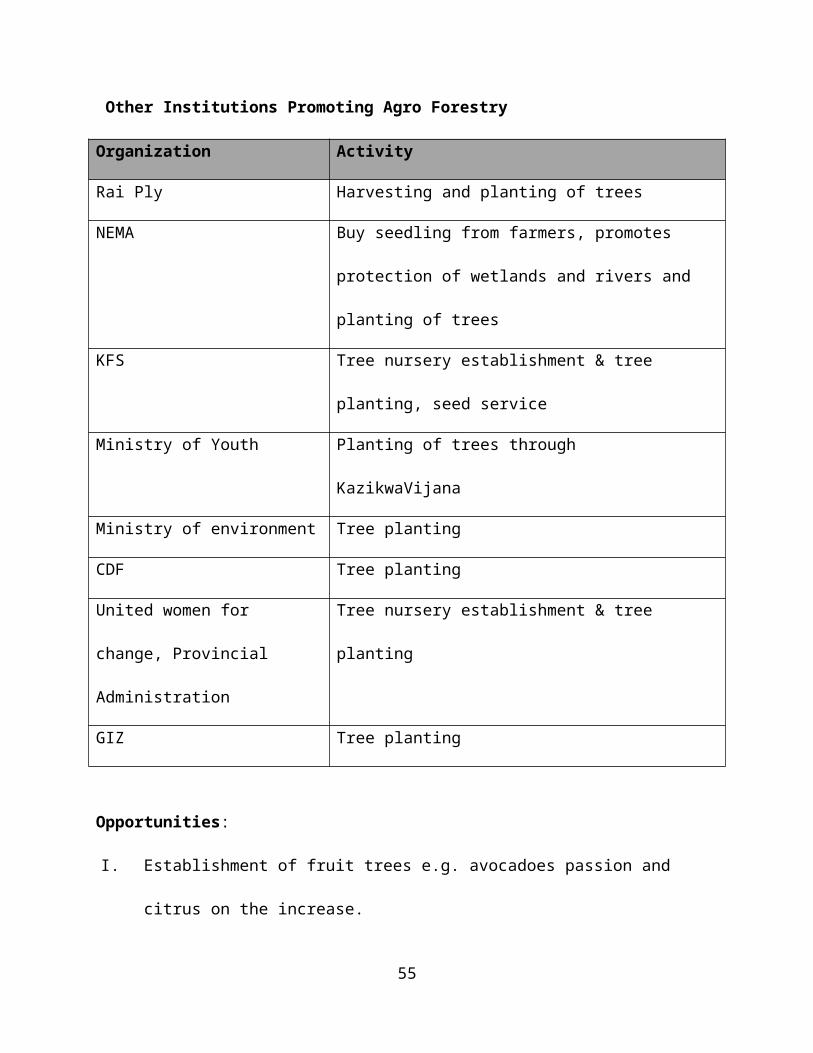
Other Institutions Promoting Agro Forestry
Organization Activity
Rai Ply Harvesting and planting of trees
NEMA Buy seedling from farmers, promotes protection of
wetlands and rivers and planting of trees
KFS Tree nursery establishment & tree planting, seed service
Ministry of Youth Planting of trees through KazikwaVijana
Ministry of environment Tree planting
CDF Tree planting
United women for change,
Provincial Administration
Tree nursery establishment & tree planting
GIZ Tree planting
Opportunities:
I. Establishment of fruit trees e.g. avocadoes passion and citrus on the increase.
II. The 10% tree cover per farm rule creates a good opportunity for increase in tree planting
III. Tree enterprise good for income generation especially for out of school youth
IV. High demand for wood products hence establishment of new fast growing woodlots.
V. Landscaping, ornamentals, shrubs and flowers on the increase hence a good opportunity
for income generation near Eldoret Municipality.
Challenges: I. Competition for land space by crops, livestock enterprises and agro forestry trees
II. Lack of seeds especially for indigenous trees.
III. Seed harvesting technology limited.
38
IV. Unprotected trees are damaged by livestock during grazing and there is a need to
sensitize the farmers on the importance of protecting the tree seedlings to increase the
survival rate.
V. Farmers’ conflict arising from common boundary eucalyptus trees.
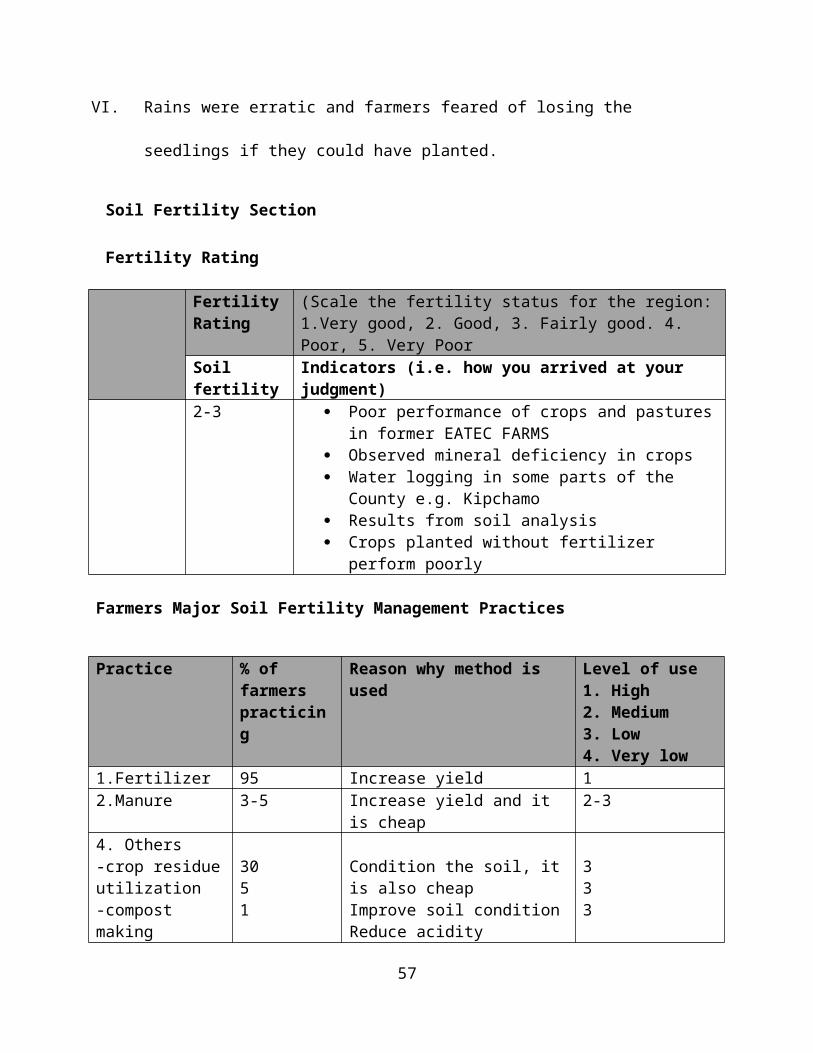
VI. Rains were erratic and farmers feared of losing the seedlings if they could have planted.
Soil Fertility Section
Fertility Rating
Fertility Rating
(Scale the fertility status for the region: 1.Very good, 2. Good, 3. Fairly good. 4. Poor, 5. Very Poor
Soil fertility Indicators (i.e. how you arrived at your judgment)
2-3 Poor performance of crops and pastures in former EATEC FARMS
Observed mineral deficiency in crops Water logging in some parts of the County e.g.
Kipchamo Results from soil analysis Crops planted without fertilizer perform poorly
Farmers Major Soil Fertility Management Practices
Practice % of farmers practicing
Reason why method is used Level of use1. High2. Medium3. Low4. Very low
1.Fertilizer 95 Increase yield 12.Manure 3-5 Increase yield and it is cheap 2-34. Others-crop residue utilization-compost making-liming
3051
Condition the soil, it is also cheapImprove soil conditionReduce acidity
333
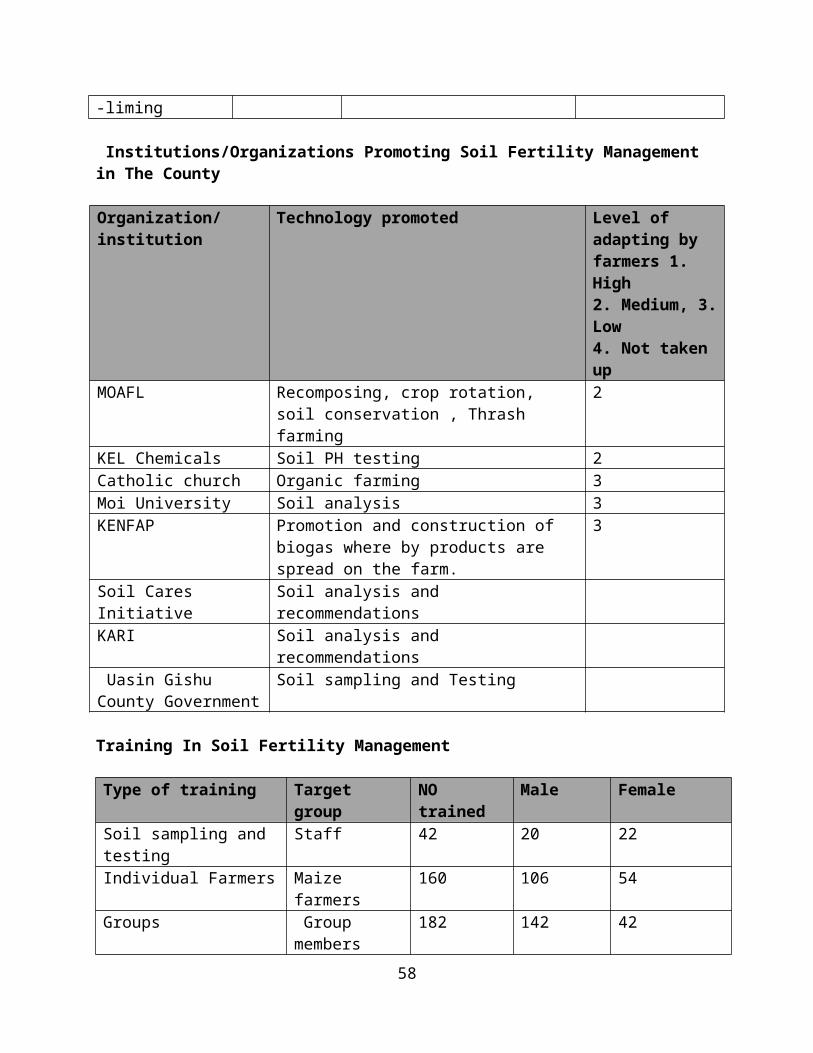
Institutions/Organizations Promoting Soil Fertility Management in The County
39
Organization/institution
Technology promoted Level of adapting by farmers 1. High2. Medium, 3. Low4. Not taken up
MOAFL Recomposing, crop rotation, soil conservation , Thrash farming
2
KEL Chemicals Soil PH testing 2Catholic church Organic farming 3Moi University Soil analysis 3KENFAP Promotion and construction of biogas where
by products are spread on the farm.3
Soil Cares Initiative Soil analysis and recommendationsKARI Soil analysis and recommendations Uasin Gishu County Government
Soil sampling and Testing
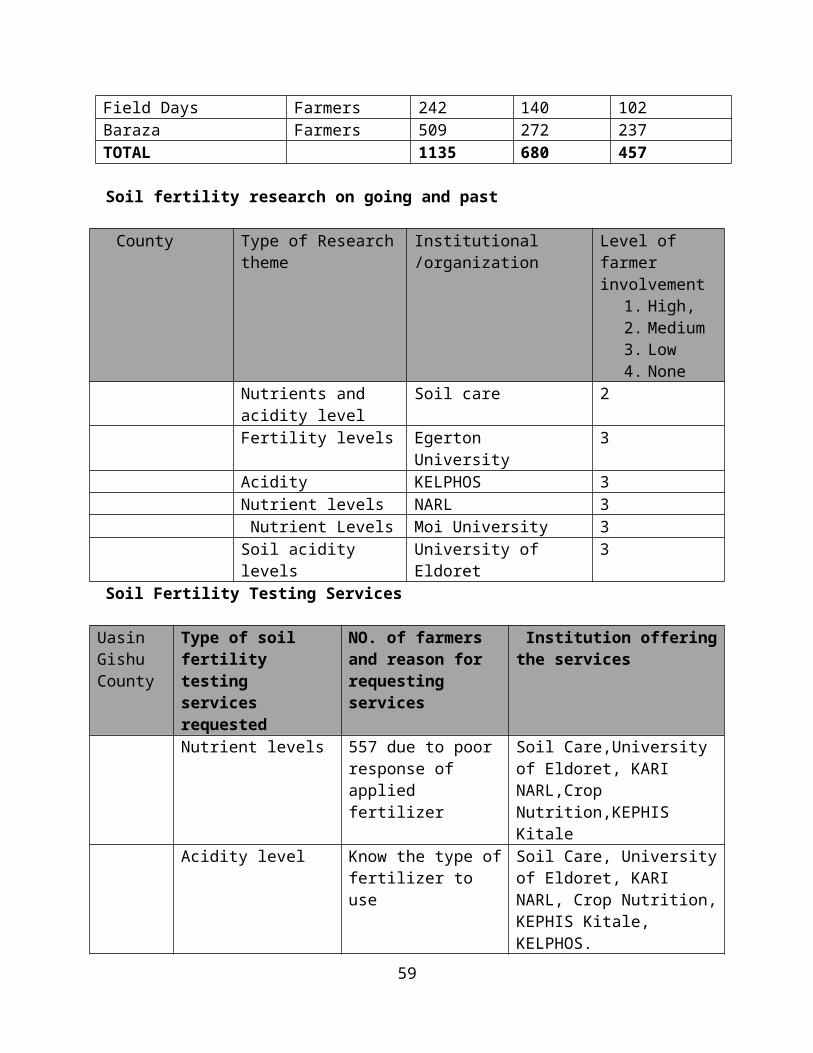
Training In Soil Fertility Management
Type of training Target group NO trained Male FemaleSoil sampling and testing Staff 42 20 22Individual Farmers Maize farmers 160 106 54Groups Group members 182 142 42Field Days Farmers 242 140 102Baraza Farmers 509 272 237TOTAL 1135 680 457
Soil fertility research on going and past
County Type of Research theme Institutional /organization Level of farmer involvement
1. High,2. Medium3. Low4. None
Nutrients and acidity level
Soil care 2
Fertility levels Egerton University 3Acidity KELPHOS 3Nutrient levels NARL 3 Nutrient Levels Moi University 3Soil acidity levels University of Eldoret 3
Soil Fertility Testing Services
40
Uasin Gishu County
Type of soil fertility testing services requested
NO. of farmers and reason for requesting services
Institution offering the services
Nutrient levels 557 due to poor response of applied fertilizer
Soil Care,University of Eldoret, KARI NARL,Crop Nutrition,KEPHIS Kitale
Acidity level Know the type of fertilizer to use
Soil Care, University of Eldoret, KARI NARL, Crop Nutrition, KEPHIS Kitale, KELPHOS.
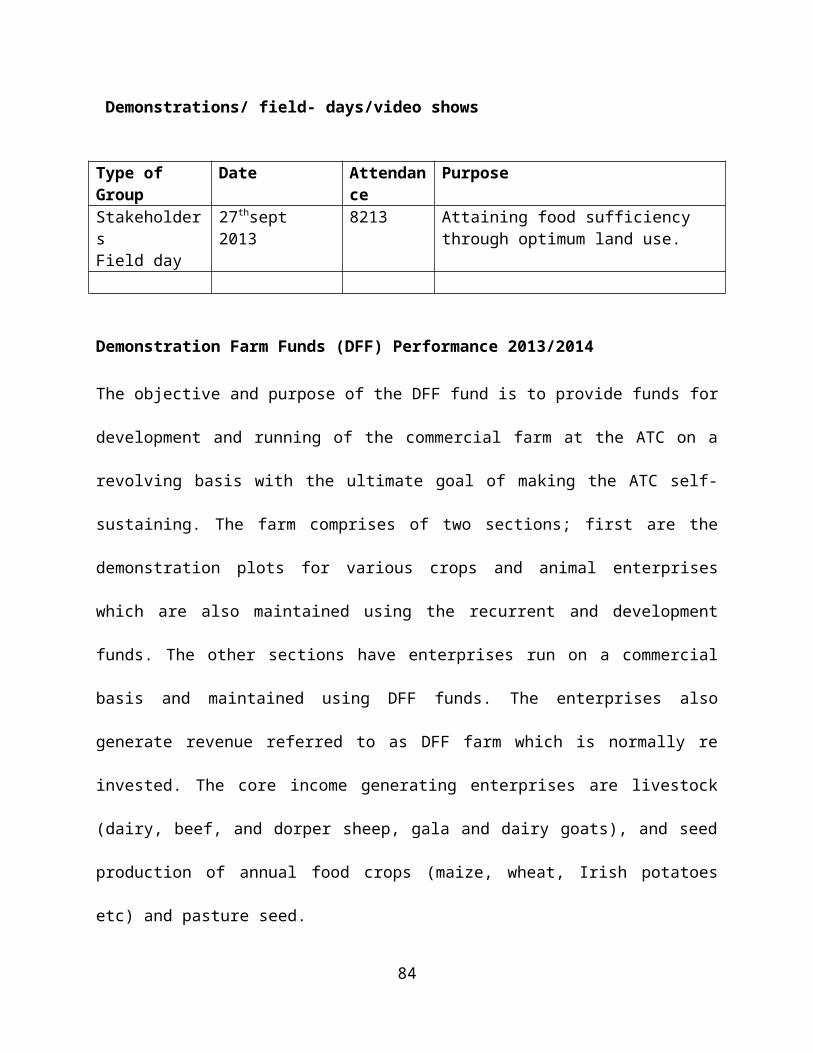
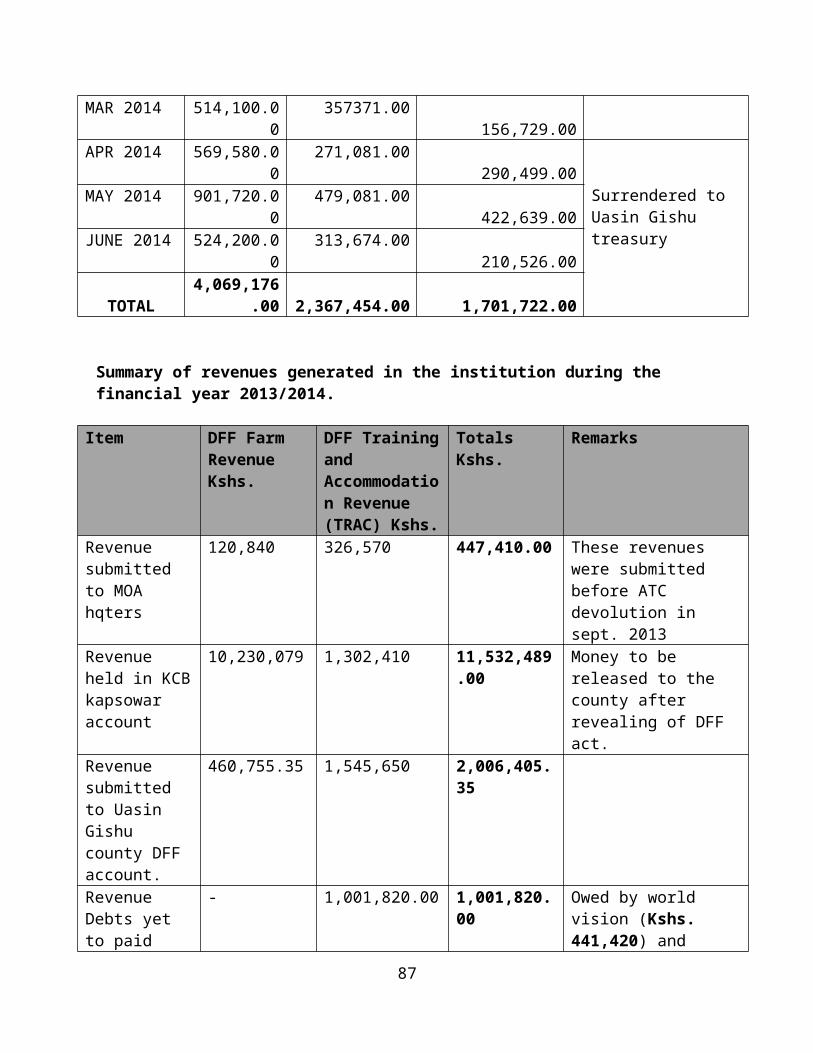
The objective and purpose of the DFF fund is to provide funds for development and running of
the commercial farm at the ATC on a revolving basis with the ultimate goal of making the ATC
self-sustaining. The farm comprises of two sections; first are the demonstration plots for various
crops and animal enterprises which are also maintained using the recurrent and development
funds. The other sections have enterprises run on a commercial basis and maintained using DFF
funds. The enterprises also generate revenue referred to as DFF farm which is normally re
invested. The core income generating enterprises are livestock (dairy, beef, and dorper sheep,
gala and dairy goats), and seed production of annual food crops (maize, wheat, Irish potatoes etc)
and pasture seed.
58
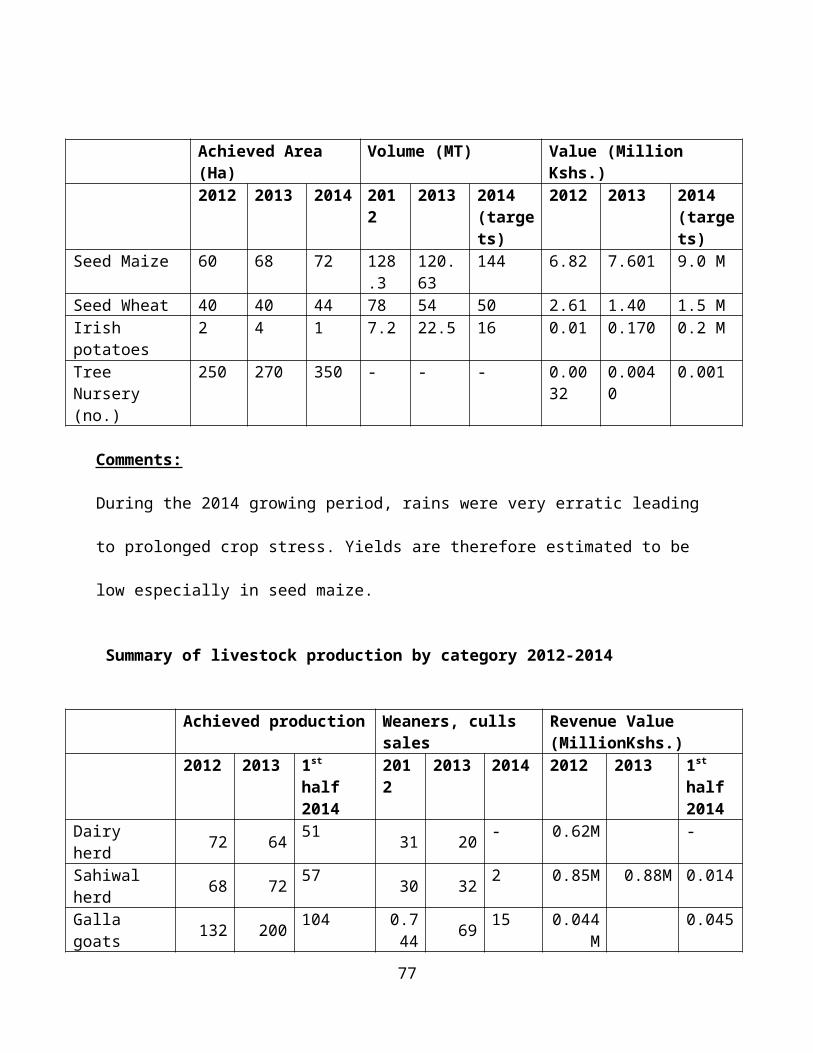
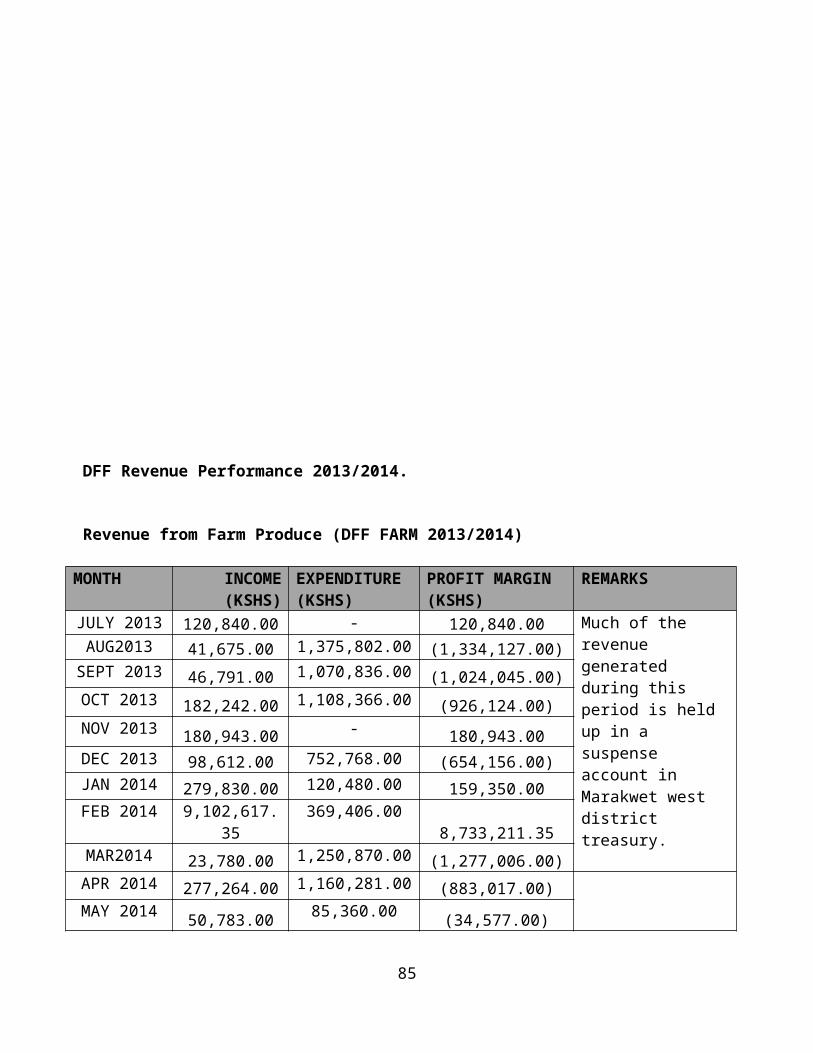
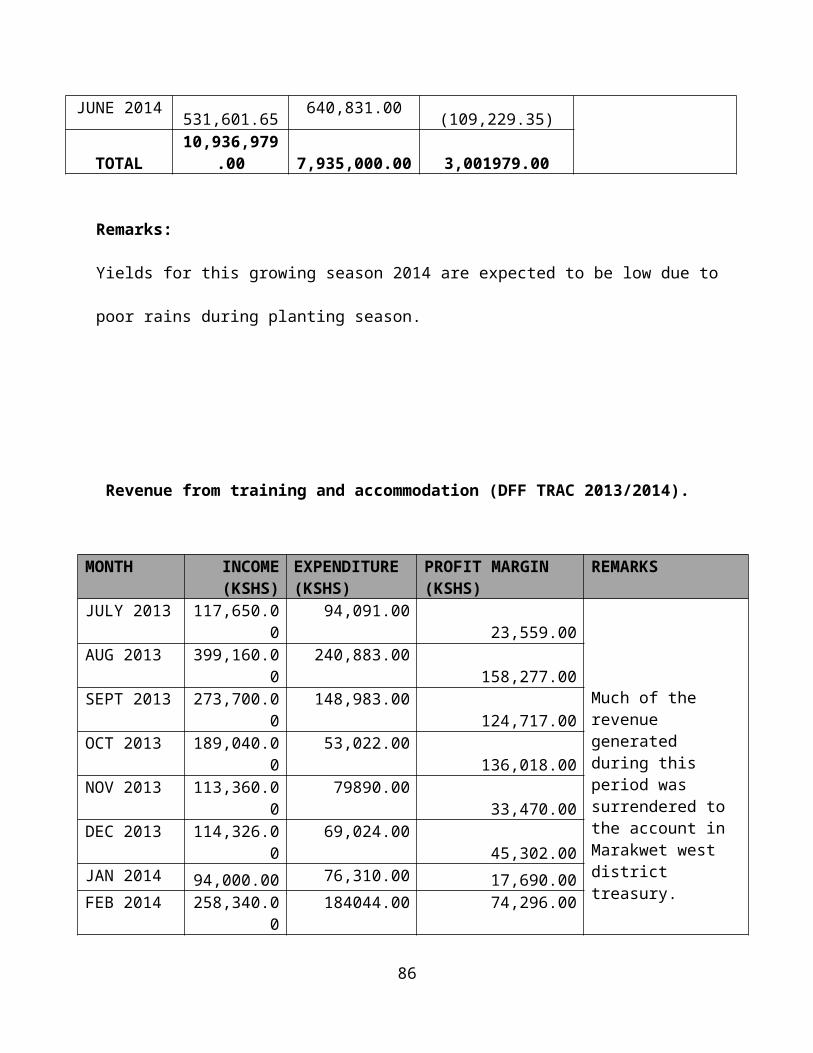
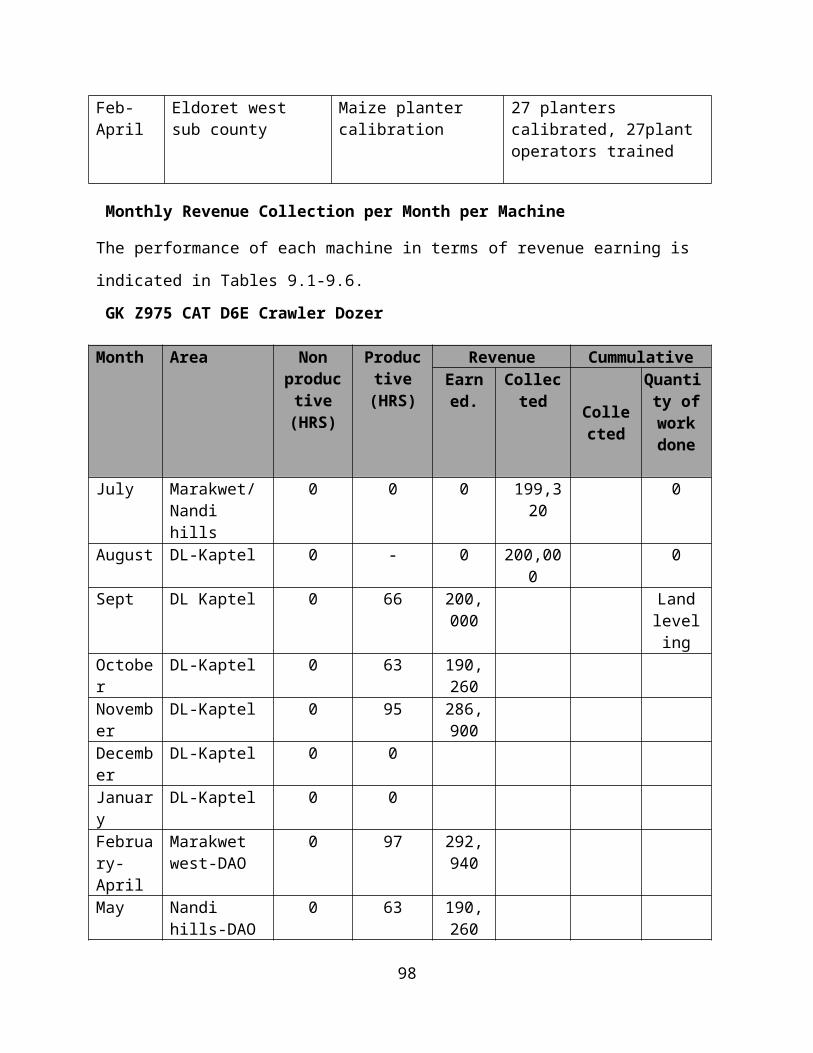
DFF Revenue Performance 2013/2014.
Revenue from Farm Produce (DFF FARM 2013/2014)
MONTH INCOME (KSHS)
EXPENDITURE (KSHS)
PROFIT MARGIN (KSHS)
REMARKS
JULY 2013 120,840.00 - 120,840.00 Much of the revenue generated during this period is held up in a suspense account in Marakwet west district treasury.
The house rent collected and banked during the financial year was Kshs 542,400
House Rent Collections
Month July Aug Sept Oct Nov Dec Jan Feb March
April May June Total
Revenue collected
86,600
26,500
71,100 53,900
34,800 32,000 10,300
20,000
0 59,400
101,800
46,000
542,400
72
DEPARTMENT OF LIVESTOCK PRODUCTION
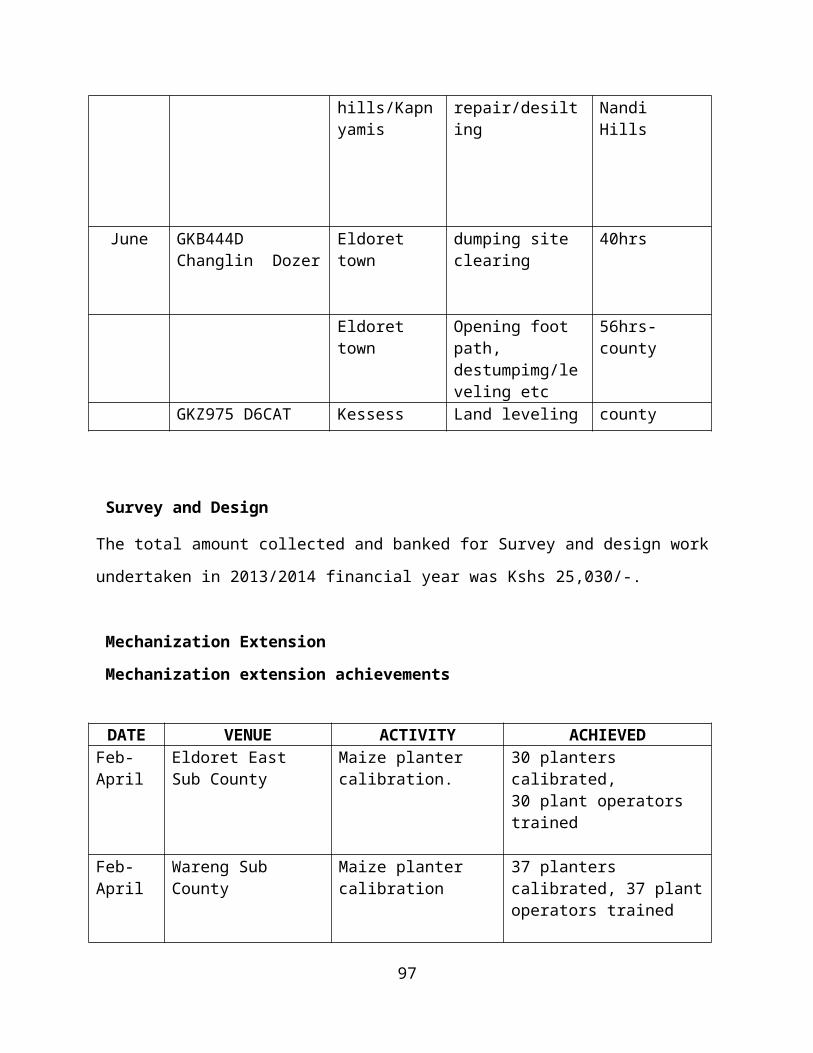
Extension Section
TYPE ACTIVITY PLANNED
ACHIEVED
PARTICIPATION
REMARKS
M F Total
Field days 12 26 1872 1248
3120 Mainly during Q1,2,4
Demonstration 34 71 603 323 926 ‘’
Individual farm visits 600 659 356 303 659 ‘’
Farmer trainings 6 14 447 210 657 ‘’
Advisory group visits 4 6 50 34 84 ‘’
Public barazas 12 16 646 261 907
Supervision/backstopping 12 28 7 6 13 Q1,2,3&4
Participating & holding,ASK show, Agri-businessTrade fair& livestock breeders show
2 3 720 320 1040 In Q2 and 3
Breeders show did not take place this year.
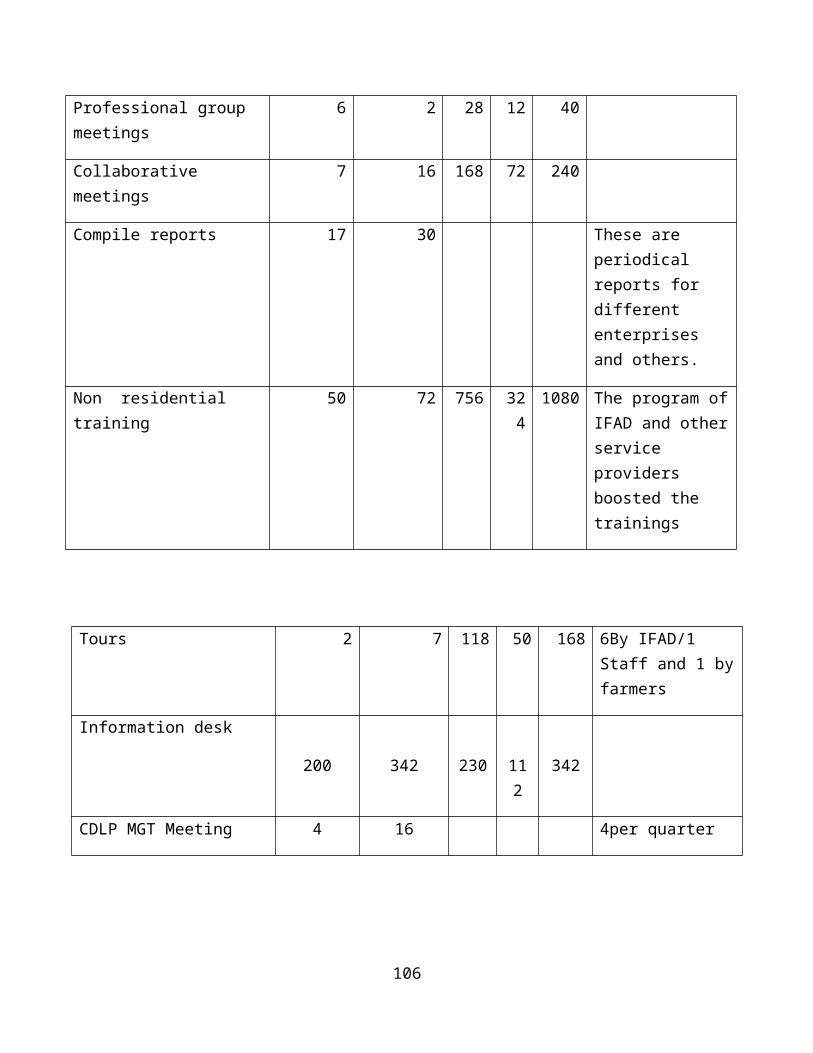
Professional group meetings 6 2 28 12 40
Collaborative meetings 7 16 168 72 240
Compile reports 17 30 These are periodical reports for different enterprises and others.
Non residential training 50 72 756 324 1080 The program of IFAD and other service providers boosted the trainings
73
Tours 2 7 118 50 168 6By IFAD/1 Staff and 1 by farmers
Information desk
200 342 230 112 342
CDLP MGT Meeting 4 16 4per quarter
Feeding And Livestock Nutrition
General Overview of the Feeds and Feeding Situation
The quality and quantity of pasture and fodder was good during the first half part of the year and
became good during the last two quarters as a result of the heavy rain experienced in the fourth
quarter.The natural pasture lasted up to January 2014 while much of the conserved forage last up
to April 2014. The factors affecting access and availability of livestock feeds are high cost of
commercial feeds, seasonality and inadequate feed conservation and utilization of crop residues.
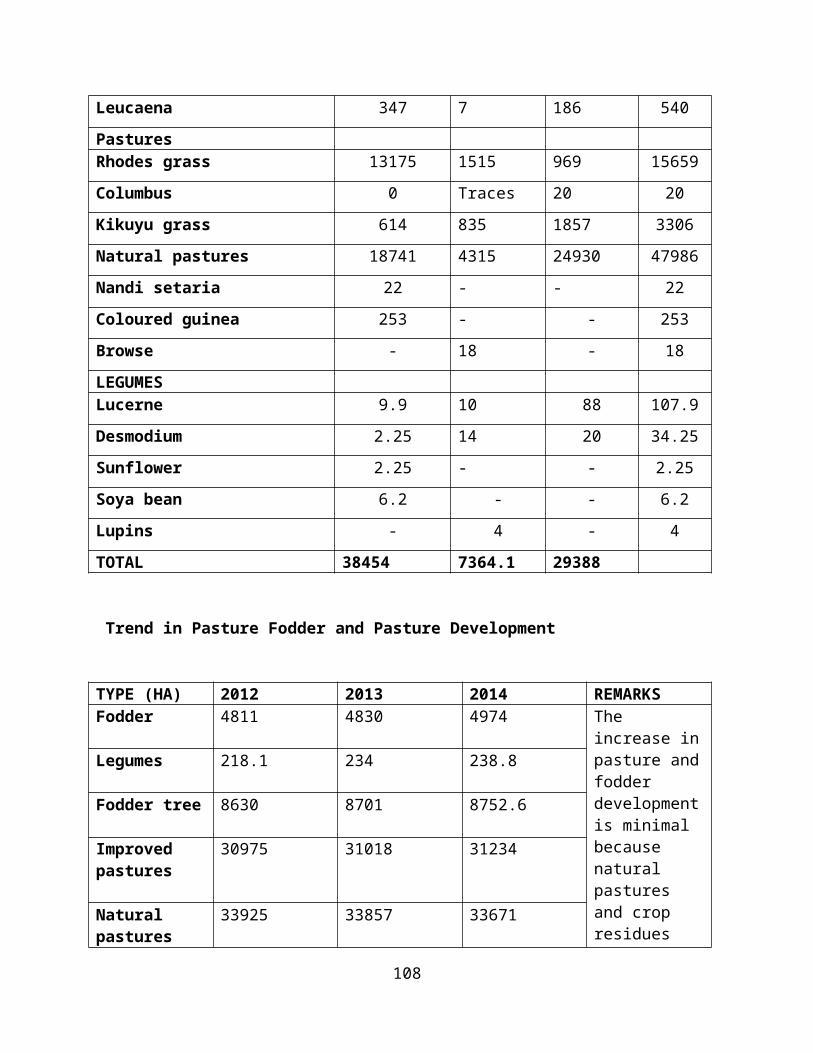
Hectares of Improved, Natural Pastures and Fodder by Type Sub Countys (Ha)
TYPE OF PASTURE/FODDER Sub countiesTotalSoy &Turbo Kapseret
&KessesAinabkoi & Moiben
Nappier grass 2849 130 525 3504
Sweet potato vines 186 22 100 308
Oats 500 190 690
Silage maize 707 287 994
Yellow maize 11.1 3.1 14.2
FODDER TREESCalliandra 460.6 9 602 1062.6
Sesbania 597 5 61 664
74
Leucaena 347 7 186 540
PasturesRhodes grass 13175 1515 969 15659
Columbus 0 Traces 20 20
Kikuyu grass 614 835 1857 3306
Natural pastures 18741 4315 24930 47986
Nandi setaria 22 - - 22
Coloured guinea 253 - - 253
Browse - 18 - 18
LEGUMESLucerne 9.9 10 88 107.9
Desmodium 2.25 14 20 34.25
Sunflower 2.25 - - 2.25
Soya bean 6.2 - - 6.2
Lupins - 4 - 4
TOTAL 38454 7364.1 29388
Trend in Pasture Fodder and Pasture Development
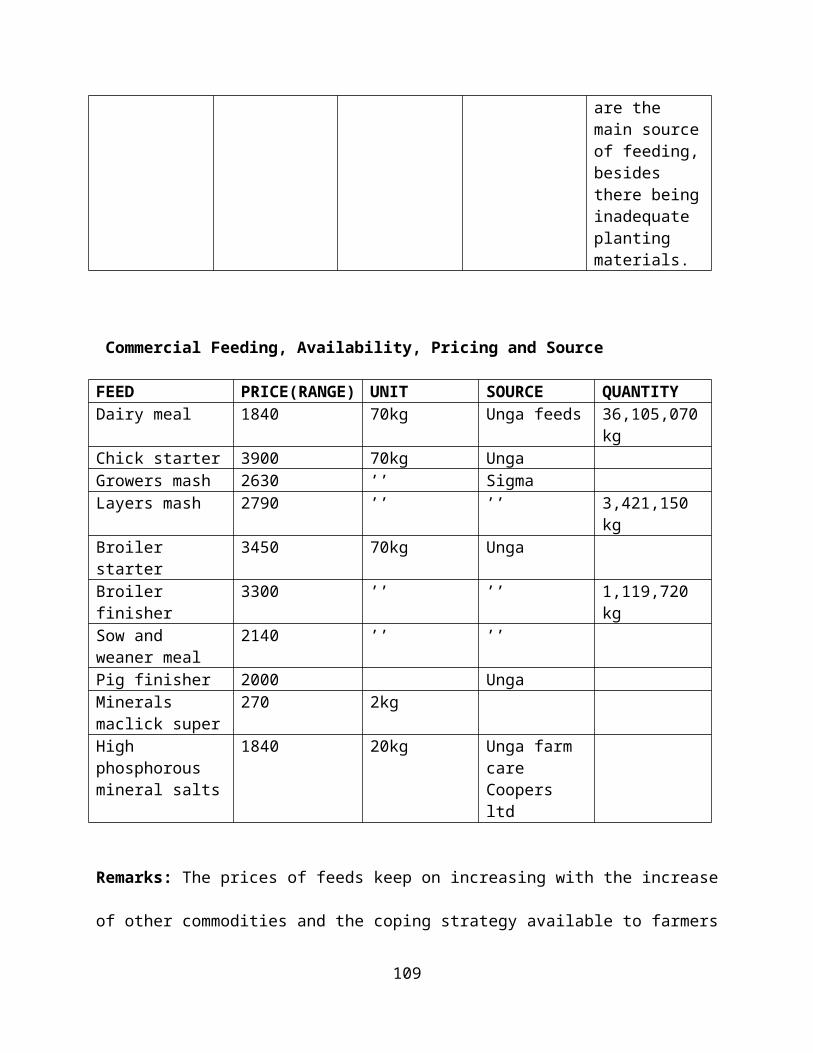
TYPE (HA) 2012 2013 2014 REMARKSFodder 4811 4830 4974 The increase in
pasture and fodder development is minimal because natural pastures and crop residues are the main source of feeding, besides there being inadequate planting materials.
Legumes 218.1 234 238.8
Fodder tree 8630 8701 8752.6
Improved pastures
30975 31018 31234
Natural pastures
33925 33857 33671
Commercial Feeding, Availability, Pricing and Source
Low quality genetics Artificial Insemination (AI) and embryo transfer technologies
Weak linkages between livestock research, extension services and farmers
Weak linkages between livestock research, extension services and farmers
Low Investment and Inadequate Value Addition
Poor Market Access (inadequate market information, processing facilities - milk processing plants/coolers), the average market price is low due to the lack of a strong and coordinated farmers’ voice.
Poor infrastructure with regard to road network for marketing dairy animals and dairy products
Increased land fragmentation, settlement and division of land.
Expensive and inadequate breeding stock
Increased cost of production due to VAT among other input charges. Weak linkages between livestock research, extension services and farmers Weak linkages between livestock research, extension services and farmers Low Investment and Inadequate Value Addition Poor Market Access (inadequate market information, processing facilities - milk
processing plants/coolers), the average market price is low due to the lack of a strong and coordinated farmers’ voice.
Poor infrastructure with regard to road network for marketing dairy animals and dairy products
Increased land fragmentation, settlement and division of land. Expensive and inadequate breeding stock Increased cost of production due to VATamong other input charges.
Dairy Management
84
Intensive Zero Grazing system
Sub county Number of FarmersSoy 250Turbo 275Kapseret 375Kesses 438Ainabkoi 375Moiben 500Total 2213
Remarks
There is an upward trend in the number of farmers practicing zero-grazing due to decreasing land
sizes and the contribution made by FAO/ACK/GOK restocking and RADIO ;SDCP and EAAPP
programme in terms of trainings and demonstrations. The demand for milk in the residential
estates and processing plants and milk bars which offer improved prices has also encouraged the
increase.
Bull Schemes
There are no bull schemes in the county
Sources of breeding stocks
85
Source (Farm) Type of breed PriceMakongi farmBaraka farmSarah Boit’s farmOkwiri’s farmChepkoileluniv.collegeOther small scaleKerita Farm(Kesses) Eldoret Polytechnic (tendering)Cheluget (Kapsaret)Lazarus Kerich (Kesses)John Chepkiswet (Kesses)Cllr. MainaKapkoiKipsinende
Comments: The prices of hives have continued to increase over the last five years, due to increased prices of timber. This has limited
the demand especially for the Langstroth hive which need be accompanied with a centrifuge.
Bee Products Processing Centers
There are no bee product processing centers in the county. Farmers use heat and sieving methods of refining honey e.g Muungano
women group (Soy) and Toretgei self help group(Turbo). The two are NMK funded. KVDA has honey refinery at Rokocho [Iten] and
has an annual target of 50 tonnes of refined honey from the region. It purchases crude honey from the farmers at Ksh.90 -110/kg
depending on the quality and process for sell at the following prices:-
Quantity Price/unit1kg bottle 450
500gm bottle 250300 gm 17050gm 6020 gm 30
Comments: Packaged in various sizes to meet the demands of all categories of consumers.
Demonstration Apiaries /groups
No.
Sub county
Name of group Year started
No. of members
Type of hive
Total No. hives
Remarks
1. Soy Kiplombe,
Maombi. W.g.,
2004
2003
25
18
Langtroth
“
50
60
All these Groups are Active
89
Moiben
Kapseret
Mungano. W.g
Lamaiywet, bee- keepersTwiganyuki YG
Mwangaza women group
Moiyen SHG
2003
-
2006
2002
20
-
25
20
KTBH
“Langstroth
Langstroth
58
2042
18Process honey
Comments: Muungano is a Njaa Marufuku Kenya funded group.
Honey Bee Pests and Diseases
Disease/pest Damage caused Season/period Control measuresBirds Feed on bee Throughout the year By scaring awayBlack ants Disturbance wet season -greasing wires, keep grass shortSafari ants Eat bees/brood Throughout the year -Greasing wires, keep grass shortLizards, rats and frogs
Disturbance, eat bees & destroy hives Dry season Grease wire, Bush clearance & frequent inspection
Sugar ants Feed on honeycause disturbance
Dry Season Grease wireKeeping grass short
Wax moth Eat combs & pollen Dry Season -greasing wires - Bush clearance-Hive inspection
Beetles Eat pollen Dry season Regular inspection
Above pests have less effect in properly set and managed apiaries
90
Common pest reported was safari ants & wax moth and farmers advised accordingly
There were a number of absconding cases.
1. Beekeepers Co-Operative Societies and Groups
No beekeeping cooperative societies
2. Constraints and Suggested Solutions
Constraints Suggested solution1. Inadequate field livestock
staff2. Expensive bee-keeping
equipment such as Langstroth and harvesting suit.
3. Inadequate capital investment
4. Lack of organized markets for honey & beeswax.
1.Employment of more staff and training through group approach2. Encouraged to from groups and make their own hives.3.Form groups and apply credit from micro – financiers4.Form co-operative societies
Projections, Future targets, objectives and goals
Activity Objective Target-Promote value addition and marketing of honey-Promote wax production
Improve living standard of beekeeping farmers and food security
Farmers in all sub counties
91
SHEEP INDUSTRY
Introduction
The county has a high potential for sheep production although farmers have not fully commercialized the enterprise. Breeds kept are crosses and rearing grazing systems range from tethering to communal grazing. Upgrading of sheep is encouraged by use of doper rams.
WOOL PRODUCTION
Farmers have not commercialized wool production and this exposes some of them to exploitation by shearers who charge 10/= per kg and take the wool free of charge. The largest percentage of wool processed by Rupa mills is still sourced outside Uasin Gishu county i.e. Molo, West Pokot, Marakwet, Nakuru and Nyahururu
Wool Production figures
Sub county Quantity produced –kg Price/kg RemarksSoy 760 150 -
Sub county Quantity produced –kg Price/kg Value-ksh. RemarksSoy 760 150 11,4000 Sold to Rupa
Mills.Most wool sheep are in Kesses especially Kondoo farm where its cold. The total value could be low to the farmer who sells at farm gate price of upto 100/= per kg.
Turbo 2000 150 300,000Ainabkoi 3175 150 47,6250
Moiben 3000 150 450,000Kesses 7,546 150 1,131,900
Kapseret 3,066 150
459,900Total 18787 150 2,932,050
GOAT INDUSTRY
Goat production is the second income earner to dairy production. Most meat goats are found in large-scale farms. Small scale farmers
are encouraged to keep dairy goats for milk supply and income generating and are showing keen interest.
Population figures
Sub county EA – Goat Toggenburg Kenya Alphine Saanen Galla TotalSoy 12714 106 14 11 497 13342
Marketing Situation and the Prices of Poultry and Poultry Products
Poultry product Price(kshs) RemarksExotic eggs per tray 270-360 AvailableLocal eggs per try 390-450 AvailableBroiler per piece 400-500 Available, the market has been unpredictable
always at the pick in December.Local bird per piece 350-800 AvailableCockerel /cocks 450-1000 Available
96
CONSTRAINTS AND POSSIBLE SOLUTIONS
Constraints
High cost of feeds.
Unpredictable market.
Disease out breaks.
Inadequate adoption of technologies, which leads to poor management
practices.
Theft of the birds.
Possible solutions
Continuous trainings and demonstrations on proper management practices
Formation of poultry lobby groups for market access.
Farmers to be reminded always to strictly follow vaccination programmes and good
poultry husbandry practices
Strengthen collaboration amongst all the relevant stakeholders for provision of holistic
packages.
The farmers to put more measures in security.
PIG INDUSTRY
Pig production is concentrated within the municipality and the local authorities. Most of these
pigs are housed and kept under poor management. Some pigs are kept under free-range
system especially in the municipality. Over the review period the municipal council has
made law enforcement to eradicate pigs on free range from the municipality.
Pig population figures
Sub county Sows Boars Gilts Weaners Piglets TotalSoy 70 23 102 270 338 803
Goat skin 13682 6516 3744 3180 25606Sheep skin 22503 9481 5721 4488 18967Total 55625 24489 13502 11100 79976Remarks: calf skin is lumped together with hides. Earn about 3,706,880 during the year under review.
103
AVERAGE PRICES (ksh/kg)
Grade I II III IV Average PricesHides 20-30 15-25 10-20 5-15 35Calf skinGoat skin 30-70 25-65 20-60 15-55 42.50Sheep skin ’’ ’’ ’’ ’’ ’’
LIVESTOCK IMPROVEMENT AND UPGRADING
Farmers are encouraged to improve and upgrade their livestock through use of quality breeding stock, AI and livestock registration.
Livestock movement –In the county Into the County
SSP No of animals Origin Purpose RemarksBovine 126 Baringo central Slaughter
102 Nandi south Slaughter67 Baringo north Slaughter502 Marakwet east slaughter46 Nakuru breeding27 Nandi central Breeding25 Molo Breeding45 Koibatek Breeding104 Keiyo south Slaughter
Ovine/Caprine 1036 Turkana south Slaughter97 Transnzoia Slaughter809 Keiyo Slaughter670 Pokot central Slaughter570 Turkana central Slaughter120 Baringo central Slaughter
Remarks: The high no. of unoccupied hives is possibly due to increased use of chemical in horticultural farms and poor management by some farmers, for instance infestation of wax moth.
Comments on population and production trends: Reduction in honey production is attributed to climate change and increased use of pesticides and herbicides in crop farms


![1 Factories Act, 1948 - Sauda.Comsauda.com/companion/pdf/cs/Executive/Sample Chapter/New Syllabus... · Annual Leave with wages! ... [Chapter # 1] Factories Act, 1948 (7.7 Answer:](https://static.documents.pub/doc/80x56/5ac84bde7f8b9acb7c8c8d47/1-factories-act-1948-sauda-chapternew-syllabusannual-leave-with-wages-.jpg)


