68
Lending support to rural America® | 2014 ANNUAL REPORT | mafc.com Our Roots Go Deep
| Date post: | 08-Apr-2016 |
| Category: |
Documents |
| Upload: | midatlantic-farm-credit |
| View: | 213 times |
| Download: | 0 times |

Lending support to rural America® | 2014 A N N UA L R E P O R T | mafc.com
Our Roots Go Deep

MidAtlantic Farm Credit, ACA
TABLE OF CONTENTSTABLE OF CONTENTS
President’s MessagePresident’s Message 1-71-7
Report of ManagementReport of Management 99
Report onReport onInternal Control OverInternal Control Over Financial ReportingFinancial Reporting 1010
Consolidated Five-YearConsolidated Five-Year Summary of SelectedSummary of SelectedFinancial DataFinancial Data 1111
Management’s Discussion andManagement’s Discussion andAnalysis of Financial ConditionAnalysis of Financial Conditionand Results of Operationsand Results of Operations 13-2513-25
Disclosure Required byDisclosure Required by Farm Credit AdministrationFarm Credit AdministrationRegulations 26-31Regulations 26-31
Report of theReport of theAudit CommitteeAudit Committee 32
Report of IndependentReport of Independent Certified Public AccountantsCertified Public Accountants 33
ConsolidatedConsolidatedFinancial StatementsFinancial Statements 34-38
Notes to the ConsolidatedNotes to the ConsolidatedFinancial StatementsFinancial Statements 39-63
Board of Directors andBoard of Directors andManagement TeamManagement Team 64-65

1
“A tree stands strong not by its fruits or branches, but by the depth of its roots.” Anthony Liccione
I doubt I need to explain the value of strong roots to you. As people
tied to the land, and to agriculture, we all understand that the deeper
and more branched out a root system is, the more likely it is to grow
and flourish, no matter what the conditions around it. A strong root
system will protect a tree for generations—whether there is a drought,
a flood, or exceptional wind.
I often think about the importance of roots as I drive through the
beautiful territory that we serve. Towering trees and healthy
looking crops are just the beginning of the roots that are here—
in addition to those literal roots, we have farms that have
been here for hundreds of years. I see old farmhouses
that have been passed from generation to generation,
lovingly restored—or even sold to new families
who want to put down roots of their own and
raise their families in our community.
Roots are important to a family, and to a business.
They represent where you’ve come from, where
you want to be, and how well prepared you are to
withstand the challenges and stress of the future.
Our roots are in agriculture, and serving rural
America. We’re proud of our roots, and what
they represent.
I hope you’ll read this annual report, to see just
how important our roots are to us.
MidAtlantic Farm Credit, ACA
Bob Frazee, CEO
PRESIDENT’S MESSAGEPRESIDENT’S MESSAGE
1

2 MidAtlantic Farm Credit, ACA
2010 2011 2012 2013 2014 2010 2011 2012 2013 2014 2010 2011 2012 2013 2014
Net Income(in millions)
Operating Expenses as a Percentage of
Net Interest and Noninterest Income
(in percent)
Acceptable Credit Quality
(in percent)
$50.
3
$4
5.2
$5
1.7
$68
.0
$
67.0
34%
3
6%
3
6%
33%
3
7%
9
3.0%
94.4
%
94.
7%
97
.1%
96
.9%
Mary Crum, Frederick County, Maryland

The root of the matter.
I can’t give an overview of 2014 without starting with
our profits. The past year was the most profitable year in
MidAtlantic’s 14 year history, allowing us to return the most
patronage ever.
When I think about the millions and millions of dollars that
we returned to our borrowers this past year—$33.7 million
to be exact—I think about how lucky I am to work for a
cooperative that returns its profits. That $33.7 million is all
in cash—cash that goes back into our communities, where
it helps other local businesses; cash that can be used to
pay down debt, to upgrade equipment, to expand already
growing businesses. That’s a lot of money to pay out in a
year—I’m grateful for the strong direction of our board,
and the ongoing commitment of our staff, both of which
combine to make it happen.
We have distributed this cash to our members and still kept
our permanent capital levels at over 15 percent. This, in my
opinion, is the very root of being a cooperative—sharing
2010 2011 2012 2013 2014 2010 2011 2012 2013 2014 2010 2011 2012 2013 2014 2010 2011 2012 2013 2014
DeclaredPatronage
Distribution(in millions)
Largest CommodityConcentration
(in percent)
Net Loans(in millions)
Members’ Equity(in millions)
$25.
8
$2
5.6
$28
.5
$38
.1
$25.
9
Cash
Gra
in/C
rops
2
0%
Cash
Gra
in/C
rops
22%
Cash
Gra
in/C
rops
25%
Cash
Gra
in/C
rops
25%
Cash
Gra
in/C
rops
26%
$2,2
61.9
$
2,15
7.8
$2,
126.
4
$2,1
74.0
$2
,252
.0
$396
.5
$42
0.7
$45
0.9
$
489.
3
$
518.
0
PRESIDENT’S MESSAGEPRESIDENT’S MESSAGE
3MidAtlantic Farm Credit, ACA
Missy, Tyler and Jeremy McDonald, Frederick County, Virginia
Jim Wertman, Bucks County, Pennsylvania
Jim, Joel and Andy Younker, Berks County, Pennsylvania

profits with the members who use the cooperative’s services,
while keeping enough in reserves to ensure strength and
stability for the long term support of our members. Farm
Credit is committed to those cooperative principles, and I’m
proud to work for an organization that serves its members in
such a measurable fashion.
Branching out.
As much as we like to record strong earnings, we also want
to create the strongest association possible. For us, that
means focusing on programs and services that directly
address our customers’ changing needs.
One of those programs is our crop insurance program.
Risk management is a very important tool, both for our
association to guard against risk in our portfolio, and for our
individual borrowers to manage their operations.
In 2014, our crop insurance department insured over 374,000
acres in our five-state territory. While we don’t require
the purchase of our crop insurance, we are pleased that
hundreds and hundreds of our borrowers chose our program
for their risk management needs.
Our crop insurance department is staffed by very talented
individuals, all of whom are committed to serving our
customers. And they have served our customers well—
since 2010, we have paid out over $38 million in claims
4 MidAtlantic Farm Credit, ACA
Daryl and Andrew Hilsher, Longenecker’s Hatchery, Lancaster County, Pennsylvania
in our footprint. It’s nice to know that our customers had
that income to fall back on—because we, more than any
other lender, understand the significance of managing an
operation for the long run.
Even with all of the challenges—input prices, land values,
weather events—we know that a lot of people would like
to get back to their roots and start farming on their own. It
doesn’t matter if the operator is a fifth generation farmer, a
military veteran who would like to reconnect to the soil, or
a new farmer who is the first person in decades who wants
to own a farm—no matter who you are, there are specific
challenges to starting in business today.
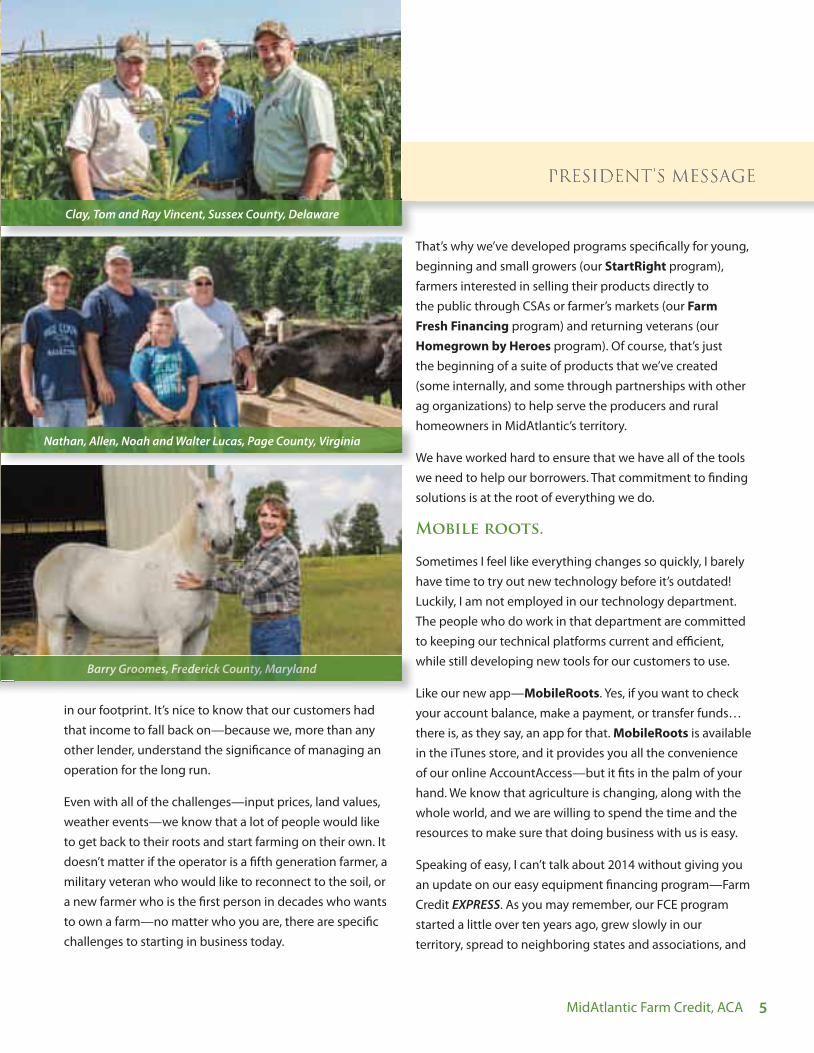
That’s why we’ve developed programs specifically for young,
beginning and small growers (our StartRight program),
farmers interested in selling their products directly to
the public through CSAs or farmer’s markets (our Farm
Fresh Financing program) and returning veterans (our
Homegrown by Heroes program). Of course, that’s just
the beginning of a suite of products that we’ve created
(some internally, and some through partnerships with other
ag organizations) to help serve the producers and rural
homeowners in MidAtlantic’s territory.
We have worked hard to ensure that we have all of the tools
we need to help our borrowers. That commitment to finding
solutions is at the root of everything we do.
Mobile roots.
Sometimes I feel like everything changes so quickly, I barely
have time to try out new technology before it’s outdated!
Luckily, I am not employed in our technology department.
The people who do work in that department are committed
to keeping our technical platforms current and efficient,
while still developing new tools for our customers to use.
Like our new app—MobileRoots. Yes, if you want to check
your account balance, make a payment, or transfer funds…
there is, as they say, an app for that. MobileRoots is available
in the iTunes store, and it provides you all the convenience
of our online AccountAccess—but it fits in the palm of your
hand. We know that agriculture is changing, along with the
whole world, and we are willing to spend the time and the
resources to make sure that doing business with us is easy.
Speaking of easy, I can’t talk about 2014 without giving you
an update on our easy equipment financing program—Farm
Credit EXPRESS. As you may remember, our FCE program
started a little over ten years ago, grew slowly in our
territory, spread to neighboring states and associations, and
5MidAtlantic Farm Credit, ACA
PRESIDENT’S MESSAGEPRESIDENT’S MESSAGE
Baarrry y GrGrGrrrroooooooooomememmememem ss,s,s,ssss FFFFrrererrreeeeereer dedededeeedeeririirickckck CCCCououountttttnnttn y,y,y, MMMMMMMMMaarylaaaaanana dd
Clay, Tom and Ray Vincent, Sussex County, Delaware
Nathan, Allen, Noah and Walter Lucas, Page County, Virginia

The sons of Brian and Jessica Perez in their family greenhouse, Maryland
6 MidAtlantic Farm Credit, ACA
became a district-wide program in 2013. Farm Credit EXPRESS
is now available throughout the AgFirst bank district, from
Pennsylvania to Florida, and as far west as Ohio to Louisiana.
The program continues to do well throughout the district,
and our FCE staff continues to do a great job administering
the program, and processing the many loan applications we
get daily. In 2014, our team approved and closed 3,130 notes
throughout the district, for over $135 million. What I think
is most exciting is that of those 3,130 notes, over 1,500 of
them—that’s almost half—were to customers who had not
been doing business with Farm Credit.
Obviously, the success of the Farm Credit EXPRESS program
is greater than just MidAtlantic. Its success certainly helps
us—when the AgFirst district bank is successful, we get a
patronage payment from them (which we’re then able to pass
on to you), and of course we receive fees for the work we do
for the other associations, but for me, it’s part of something
even larger—it’s part of Farm Credit being able to serve
agriculture and rural America across the country. I believe
in the products that we’re using here in our territory—like
Farm Credit EXPRESS—and if our experience can help other
associations in our system, I think it’s our duty to share. We’re
not a commercial lender, and we’re not run by stock price—
our mission is to serve all of rural America, and I think it’s
important that we do that in any way that we can.

7MidAtlantic Farm Credit, ACA
Our roots go deep.
The Farm Credit System is a unique entity—we’re locally
owned (you’re one of our owners—you can’t get much
more local than that!), and yet we’re all connected too. That
structure causes some challenges, but it also presents some
unique benefits to our borrowers. It provides the service of a
small community bank, with the financial stability and access
to products of a national institution.
In 2016, the Farm Credit System is going to celebrate
100 years of finding that balance, providing financing to
agriculture and rural America.
There have been a lot of ups and downs during those 100
years…both for agriculture, and for Farm Credit. Like any
other business, we have faced our challenges, learned from
them, made changes so as to avoid them in the future, and
emerged stronger than ever as a result.
We have an independent and arm’s length regulator in the
Farm Credit Association (created in 1933); we have the Farm
Credit Funding Corporation (created in 1983), which issues
and markets our debt securities; and we have an independent
System Insurance Corporation (created in 1987), which
ensures the timely payment of principal and interest on those
notes and bonds. It’s a more complex structure than it was
in 1916, but it hasn’t changed completely, either: the values
that first set us apart—values like a cooperative structure, and
governance by our member/borrowers—are still intact, and
an important part of what makes us different.
I think that Farm Credit today is exactly what the signers of
the first Federal Farm Loan Act of 1916 envisioned: a strong
and stable network of local finance providers, experts in
agriculture, committed to being here for that industry in
good times and in bad. I’m proud to say that MidAtlantic Farm
Credit is part of that network, and we are adding to the rich
legacy of rural business and agricultural operations in our
territory today.
You are a part of that legacy as well. Thank you for choosing
Farm Credit as your financing partner in 2014; I look forward
to a successful partnership in future years.
J. Robert Frazee
March 11, 2015 Chief Executive Officer
PRESIDENT’S MESSAGEPRESIDENT’S MESSAGE
Derek and Lisa Bennsky, Warren County, Virginia
Amish farmers in Lancaster County, Pennsylvania
Rebecca, Leon, Kaitlyn, Samantha & Wendy Snyder, Berks County, Pennsylvania

FINANCIAL SECTION

9MidAtlantic Farm Credit, ACA
M. Wayne Lambertson
Chairman of the Board
J. Robert Frazee
Chief Executive Officer
John E. Wheeler, Jr.
Chief Financial Officer
REPORT OF MANAGEMENT
The accompanying consolidated financial statements and related financial information appearing throughout this annual report have been prepared by management of MidAtlantic Farm Credit, ACA in accordance with generally accepted accounting principles appropriate in the circumstances. Amounts which must be based on estimates represent the best estimates and judgments of management. Management is responsible for the integrity, objectivity, consistency, and fair presentation of the consolidated financial statements and financial information contained in this report.
Management maintains and depends upon an internal accounting control system designed to provide reasonable assurance that transactions are properly authorized and recorded, that the financial records are reliable as the basis for the preparation of all financial statements, and that the assets of the Association are safeguarded. The design and implementation of all systems of internal control are based on judgments required to evaluate the costs of controls in relation to the expected benefits and to determine the appropriate balance between these costs and benefits. The Association maintains an internal audit program to monitor compliance with the systems of internal accounting control. Audits of the accounting records, accounting systems and internal controls are performed and internal audit reports, including appropriate recommendations for improvement, are submitted to the Board of Directors.
The consolidated financial statements have been audited by independent certified public accountants, whose report appears elsewhere in this annual report. The Association is also subject to examination by the Farm Credit Administration.
The consolidated financial statements, in the opinion of management, fairly present the financial condition of the Association. The undersigned certify that we have reviewed the 2014 Annual Report of MidAtlantic Farm Credit, ACA, that the report has been prepared under the oversight of the audit committee of the Board of Directors and in accordance with all applicable statutory or regulatory requirements, and that the information contained herein is true, accurate, and complete to the best of our knowledge and belief.
M. Wayne Lambertson Chairman of the Board
J. Robert Frazee Chief Executive Officer
John E. Wheeler, Jr. Chief Financial Officer
March 11, 2015
10 MidAtlantic Farm Credit, ACA
Report on Internal Control Over Financial Reporting
The Association’s principal executives and principal financial officers, or persons performing similar functions, are responsible for establishing and maintaining adequate internal control over financial reporting for the Association’s Consolidated Financial Statements. For purposes of this report, “internal control over financial reporting” is defined as a process designed by, or under the supervision of the Association’s principal executives and principal financial officers, or persons performing similar functions, and effected by its Board of Directors, management and other personnel, to provide reasonable assurance regarding the reliability of financial reporting information and the preparation of the Consolidated Financial Statements for external purposes in accordance with accounting principles generally accepted in the United States of America and includes those policies and procedures that: (1) pertain to the maintenance of records that in reasonable detail accurately and fairly reflect the transactions and dispositions of the assets of the Association, (2) provide reasonable assurance that transactions are recorded as necessary to permit preparation of financial information in accordance with accounting principles generally accepted in the United States of America, and that receipts and expenditures are being made only in accordance with authorizations of management and directors of the Association, and (3) provide reasonable assurance regarding prevention or timely detection of unauthorized acquisition, use or disposition of the Association’s assets that could have a material effect on its Consolidated Financial Statements.
The Association’s management has completed an assessment of the effectiveness of internal control over financial reporting as of December 31, 2014. In making the assessment, management used the framework in Internal Control — Integrated Framework (2013), promulgated by the Committee of Sponsoring Organizations of the Treadway Commission, commonly referred to as the “COSO” criteria.
Based on the assessment performed, the Association’s management concluded that as of December 31, 2014, the internal control over financial reporting was effective based upon the COSO criteria. Additionally, based on this assessment, the Association determined that there were no material weaknesses in the internal control over financial reporting as of December 31, 2014.
J. Robert Frazee Chief Executive Officer
John E. Wheeler Jr. Chief Financial Officer
March 11, 2015
J. Robert Frazee
Chief Executive Officer
John E. Wheeler, Jr.
Chief Financial Officer

11MidAtlantic Farm Credit, ACA
Consolidated Five-Year Summary of Selected Financial Data
December 31,(dollars in thousands) 2014 2013 2012 2011 2010
Balance Sheet DataCash 2,615$ 2,540$ 5,984$ 3,238$ 5,316$ Loans 2,276,982 2,197,662 2,144,241 2,168,894 2,279,313 Less: allowance for loan losses (24,954) (23,730) (17,853) (11,075) (17,421) Net loans 2,252,028 2,173,932 2,126,388 2,157,819 2,261,892 Investments in other Farm Credit institutions 25,079 24,840 26,367 34,513 34,916 Other property owned 844 841 3,009 1,895 1,338 Other assets 67,242 70,014 51,576 54,341 57,508 Total assets 2,347,808$ 2,272,167$ 2,213,324$ 2,251,806$ 2,360,970$ Notes payable to AgFirst Farm Credit Bank* 1,760,410$ 1,724,627$ 1,714,965$ 1,784,988$ 1,917,156$Accrued interest payable and other liabilities with maturities of less than one year 69,371 58,251 47,478 46,121 47,296 Total liabilities 1,829,781 1,782,878 1,762,443 1,831,109 1,964,452 Capital stock and participation certificates 9,743 9,656 9,498 9,444 9,273 Retained earnings Allocated 292,021 271,212 239,421 207,881 188,125 Unallocated 216,797 208,798 202,563 203,892 199,534 Accumulated other comprehensive income (loss) (534) (377) (601) (520) (414) Total members' equity 518,027 489,289 450,881 420,697 396,518 Total liabilities and members' equity 2,347,808$ 2,272,167$ 2,213,324$ 2,251,806$ 2,360,970$ Statement of Income DataNet interest income 67,835$ 67,926$ 67,635$ 68,799$ 63,076$ Provision for loan losses 125 6,067 9,000 14,550 11,600 Noninterest income (expense), net (700) 6,126 (6,957) (9,078) (1,222) Net income 67,010$ 67,985$ 51,678$ 45,171$ 50,254$ Key Financial Ratios Rate of return on average: Total assets 2.94% 3.09% 2.32% 1.96% 2.17% Total members' equity 13.18% 14.36% 11.73% 10.91% 12.90%Net interest income as a percentage of average earning assets 3.04% 3.16% 3.14% 3.07% 2.79%Net (chargeoffs) recoveries to average loans 0.05% (0.01)% (0.10)% (0.93)% (0.67)%Total members' equity to total assets 22.06% 21.53% 20.37% 18.68% 16.79%Debt to members' equity (:1) 3.53 3.64 3.91 4.35 4.95 Allowance for loan losses to loans 1.10% 1.08% 0.83% 0.51% 0.76%Permanent capital ratio 20.98% 20.21% 18.12% 16.57% 15.23%Total surplus ratio 20.61% 19.83% 17.73% 16.19% 14.79%Core surplus ratio 20.61% 19.68% 17.57% 16.00% 14.21%Net Income Distribution Estimated patronage refunds: Cash 15,000$ 20,925$ 10,500$ 10,000$ 10,000$ Qualified allocated retained earnings — — 2,549 — — Nonqualified allocated retained earnings 10,856 25,136 15,474 15,599 15,756 Nonqualified retained earnings 34,982 25,424 22,829 15,034 16,277
* General financing agreement is renewable on a one-year cycle. The next renewal date is January 1, 2016.

12 MidAtlantic Farm Credit, ACA
13MidAtlantic Farm Credit, ACA
Management’s Discussion and Analysis
of Financial Condition and Results of Operations (dollars in thousands, except as noted)
GENERAL OVERVIEW
The following commentary summarizes the financial condition and results of operations of MidAtlantic Farm Credit, ACA, (Association) for the year ended December 31, 2014 with comparisons to the years ended December 31, 2013 and December 31, 2012. This information should be read in conjunction with the Consolidated Financial Statements, Notes to the Consolidated Financial Statements and other sections in this Annual Report. The accompanying consolidated financial statements were prepared under the oversight of the Audit Committee of the Board of Directors. For a list of the Audit Committee members, refer to the “Report of the Audit Committee” contained in this Annual Report. Information in any part of this Annual Report may be incorporated by reference in answer or partial answer to any other item of the Annual Report.
The Association is an institution of the Farm Credit System (System), which was created by Congress in 1916 and has served agricultural producers for almost 100 years. The System’s mission is to maintain and improve the income and well-being of American farmers, ranchers, and producers or harvesters of aquatic products and farm-related businesses. The System is the largest agricultural lending organization in the United States. The System is regulated by the Farm Credit Administration, (FCA), which is an independent safety and soundness regulator.
The Association is a cooperative, which is owned by the members (also referred to throughout this Annual Report as stockholders or shareholders) served. The territory of the Association extends across a diverse agricultural region of Delaware, Maryland, Pennsylvania, Virginia and West Virginia. Refer to Note 1, Organization and Operations, of the Notes to the Consolidated Financial Statements for counties in the Association’s territory. The Association provides credit to farmers, ranchers, rural residents, and agribusinesses. Our success begins with our extensive agricultural experience and knowledge of the market.
The Association obtains funding from AgFirst Farm Credit Bank (AgFirst or Bank). The Association is materially affected and shareholder investment in the Association may be materially affected by the financial condition and results of operations of the Bank. Copies of the Bank’s Annual and Quarterly Reports are on the AgFirst website, www.agfirst.com, or may be obtained at no charge by calling 1-800-845-1745, extension 2832, or writing Susanne Caughman, AgFirst Farm Credit Bank, P.O. Box 1499, Columbia, SC 29202.
Copies of the Association’s Annual and Quarterly reports are also available upon request free of charge on the Association’s website, www.mafc.com, or by calling 1-800-333-7950, or
writing John E. Wheeler, Jr., Chief Financial Officer, MidAtlantic Farm Credit, ACA, 45 Aileron Court, Westminster, MD, 21157-3022. The Association prepares an electronic version of the Annual Report, which is available on the website, within 75 days after the end of the fiscal year and distributes the Annual Reports to shareholders within 90 days after the end of the fiscal year. The Association prepares an electronic version of the Quarterly report, which is available on the internet, within 40 days after the end of each fiscal quarter, except that no report needs to be prepared for the fiscal quarter that coincides with the end of the fiscal year of the Association.
FORWARD LOOKING INFORMATION
This annual information statement contains forward-looking statements. These statements are not guarantees of future performance and involve certain risks, uncertainties and assumptions that are difficult to predict. Words such as “anticipates,” “believes,” “could,” “estimates,” “may,” “should,” “will,” or other variations of these terms are intended to identify the forward-looking statements. These statements are based on assumptions and analyses made in light of experience and other historical trends, current conditions, and expected future developments. However, actual results and developments may differ materially from our expectations and predictions due to a number of risks and uncertainties, many of which are beyond our control. These risks and uncertainties include, but are not limited to:
• political, legal, regulatory and economic conditions and developments in the United States and abroad;
• economic fluctuations in the agricultural, rural utility, international, and farm-related business sectors;
• weather-related, disease, and other adverse climatic or biological conditions that periodically occur that impact agricultural productivity and income;
• changes in United States government support of the agricultural industry and the Farm Credit System, as a government-sponsored enterprise, as well as investor and rating-agency reactions to events involving other government-sponsored enterprises and other financial institutions; and
• actions taken by the Federal Reserve System in implementing monetary policy.
AGRICULTURAL OUTLOOK
The following United States Department of Agriculture (USDA) analysis provides a general understanding of the U.S.
14 MidAtlantic Farm Credit, ACA
Management’s Discussion and Analysis
of Financial Condition and Results of Operations (dollars in thousands, except as noted)
agricultural economic outlook. However, this outlook does not take into account all aspects of the Association’s business. References to USDA information in this section refer to the U.S. agricultural market data and are not limited to information/data for the Association.
The February 2015 USDA forecast estimates 2014 farmers’ net cash income, which is a measure of the cash income after payment of business expenses, at $115.1 billion, down $16.0 billion from 2013 and up $17.6 billion from its 10-year average of $97.5 billion. The decline in net cash income in 2014 was primarily due to decreases in crop receipts of $20.3 billion, farm-related income of $4.2 billion and a $17.7 billion increase in cash expenses, partially offset by an increase in livestock receipts of $26.4 billion.
The February 2015 USDA forecast for the farm economy, as a whole, forecasts 2015 farmers’ net cash income to decrease to $89.4 billion, a $25.7 billion decrease from 2014, and $8.1 billion below the 10-year average. The forecasted decrease in farmers’ net cash income for 2015 is primarily due to an expected decrease in cash receipts of $25.8 billion.
For 2015, the USDA projects crop receipts will decrease $15.6 billion, primarily due to an approximate $6.7 billion decline in corn receipts. Corn used for grain is expected to see drops in both quantity sold and price in 2015. Livestock receipts are predicted to decrease in 2015 primarily due to decreased dairy and hog receipts despite anticipated record high cattle receipts.
The following table sets forth the commodity prices per bushel for certain crops and by hundredweight for poultry and milk from December 31, 2010 to December 31, 2014:
The USDA’s income outlook varies depending on farm size and commodity specialties. The USDA classifies all farms into four primary categories: small family farms (gross cash farm income (GCFI) less than $350 thousand), midsize family farms (GCFI between $350 thousand and under $1 million), large-scale family farms (GCFI of $1 million or more), and nonfamily farms (principal operator or individuals related to the operator do not own a majority of the business). Approximately 97 percent of U.S. farms are family farms and the remaining 3 percent are nonfamily farms. The family farms produce 85 percent of the value of agricultural output and the nonfamily farms produce the remaining 15 percent of agricultural output. The small family farms represent about 89 percent of all U.S. farms, hold 59 percent of farm assets and account for 23 percent of the value of production. Approximately 62 percent of production occurs on 8 percent of family farms classified as midsize or large-scale.
According to the USDA February 2015 forecast, the growth in the values of farm sector assets, debt, and equity are forecasted to moderate in 2015. The slowdown reflects the expectation of a second year of declining net farm income and stable to small reductions in farmland values. Farm sector assets are expected
to rise from $2.99 trillion for 2014 to $3.01 trillion in 2015 primarily due to increases in the value of livestock and poultry inventories and machinery and motor vehicle assets. Overall, farm sector debt is estimated to increase from $317.7 billion in 2014 to $327.4 billion in 2015, an increase 3.05 percent. Farm business equity (assets minus debt) is expected to remain at $2.68 trillion in 2015.
Two measures of the financial health of the agricultural sector used by the USDA are the farm sector’s debt-to-asset and debt-to-equity ratios. As a result of farm assets growing slower than debt, these ratios are forecast to rise to 10.9 percent and 12.2 percent from 10.5 percent and 11.8 percent in 2013, which was the lowest value for both measures since 1954. Even though these measures of sector leverage have increased, each remains low relative to historical levels. As noted by USDA, the farm sector is better insulated from the risks associated with commodity production, changing macroeconomic conditions, as well as fluctuations in farm asset values.
As estimated by the USDA in February 2015, the System’s market share of farm business debt (defined as debt incurred by those involved in on-farm agricultural production) grew to 42.5 percent at December 31, 2013 (the latest available data), as compared with 40.7 percent at December 31, 2012. As mentioned above, overall, farm sector debt is estimated to increase from $317.7 billion in 2014 to $327.4 billion in 2015.
In general, agriculture, during the past several years, experienced favorable economic conditions driven by high commodity and livestock prices and increased farmland values during this period. To date, the Association’s financial results have remained favorable as a result of these favorable agricultural conditions. Production agriculture, however, remains a cyclical business that is heavily influenced by commodity prices and various other factors. In an environment of less favorable economic conditions in agriculture, including extensive and extended drought conditions, and without sufficient government support programs, including USDA-sponsored crop insurance programs, the Association’s financial performance and credit quality measures would likely be negatively impacted. Conditions in the general economy remain more volatile given the state of the global economy. Certain agriculture sectors, as described more fully in this Management’s Discussion and Analysis, continue to experience financial stress and could experience further financial stress in 2015. Any negative impact from these less favorable conditions should be lessened by geographic and commodity diversification and the influence of off-farm income sources supporting agricultural-related debt. However, agricultural borrowers who are more reliant on off-farm income sources may be more adversely impacted by a weakened general economy.
CRITICAL ACCOUNTING POLICIES
The financial statements are reported in conformity with accounting principles generally accepted in the United States of America. Our significant accounting policies are critical to the understanding of our results of operations and financial position because some accounting policies require us to make complex or subjective judgments and estimates that may affect the value of certain assets or liabilities. We consider these policies critical because management must make judgments about matters that
Commodity 12/31/14 12/31/13 12/31/12 12/31/11 12/31/10 Corn $3.78 $4.41 $6.87 $5.86 $4.82Soybeans $10.30 $13.00 $14.30 $11.50 $11.60Wheat $6.11 $6.73 $8.30 $7.19 $6.45Milk $20.40 $22.00 $20.90 $19.80 $16.70Poultry $113.77 $103.73 $97.94 $89.79 $84.94
15MidAtlantic Farm Credit, ACA
are inherently uncertain. For a complete discussion of significant accounting policies, see Note 2, Summary of Significant Accounting Policies, of the Notes to the Consolidated Financial Statements. The following is a summary of certain critical policies.
• Allowance for loan losses — The allowance for loan losses is maintained at a level considered adequate by management to provide for probable and estimable losses inherent in the loan portfolio. The allowance for loan losses is increased through provisions for loan losses and loan recoveries and is decreased through allowance reversals and loan charge-offs. The allowance for loan losses is determined based on a periodic evaluation of the loan portfolio by management in which numerous factors are considered, including economic and political conditions, loan portfolio composition, credit quality and prior loan loss experience.
Significant individual loans are evaluated based on the borrower’s overall financial condition, resources, and payment record, the prospects for support from any financially responsible guarantor, and, if appropriate, the estimated net realizable value of any collateral. The allowance for loan losses encompasses various judgments, evaluations and appraisals with respect to the loans and their underlying security that, by nature, contains elements of uncertainty and imprecision. Changes in the agricultural economy and their borrower repayment capacity will cause these various judgments, evaluations and appraisals to change over time. Accordingly, actual circumstances could vary widely from the Association’s expectations and predictions of those circumstances.
Management considers the following factors in determining and supporting the levels of allowance for loan losses: the concentration of lending in agriculture, combined with uncertainties in farmland values, commodity prices, exports, government assistance programs, regional economic effects and weather-related influences. Changes in the factors considered by management in the evaluation of losses in the loan portfolios could result in a change in the allowance for loan losses and could have a direct impact on the provision for loan losses and the results of operations.
• Valuation methodologies — Management applies various valuation methodologies to assets and liabilities that often involve a significant degree of judgment, particularly when liquid markets do not exist for the particular items being valued. Quoted market prices are referred to when estimating fair values for certain assets for which an observable liquid market exists, such as most investment securities. Management utilizes significant estimates and assumptions to value items for which an observable liquid market does not exist. Examples of these items include impaired loans, other property owned, pension and other postretirement benefit obligations, and certain other financial instruments. These valuations require the use of various assumptions, including, among others, discount rates, rates of return on assets, repayment rates, cash flows, default rates, costs of servicing and liquidation values. The use of different assumptions could produce significantly different results, which could have material positive or negative effects on the Association’s results of operations.
• Pensions — The Bank and its related Associations participate in defined benefit retirement plans. These plans are noncontributory and benefits are based on salary and years of service. In addition, the Bank and its related Associations also participate in defined contribution retirement savings plans. Pension expense for all plans is recorded as part of salaries and employee benefits. Pension expense for the defined benefit retirement plans is determined by actuarial valuations based on certain assumptions, including expected long-term rate of return on plan assets and discount rate. The expected return on plan assets for the year is calculated based on the composition of assets at the beginning of the year and the expected long-term rate of return on that portfolio of assets. The discount rate is used to determine the present value of our future benefit obligations. We selected the discount rate by reference to AON Hewitt (a global human resources services provider) “AA only above median corporate bond index”, actuarial analyses and industry norms.
ECONOMIC CONDITIONS
During 2014, the reduction in federal government outlays continued to impact the Association’s geographic region. Maryland, Virginia and the District of Columbia are among the slowest growing economies in the nation. In 2014, gross state product expanded 0.1 percent in Virginia, remained unchanged in Maryland, and dipped 0.5 percent in the District. Parts of Pennsylvania and West Virginia continued to benefit from state and other energy-related production. Overall, however, the Mid-Atlantic region was a laggard in economic growth with Pennsylvania, Maryland and Virginia ranking 44th, 46th and 48th, respectively, in 2014 for nonfarm employment growth. The economic forecast is that federal government spending will continue to be contained and states in our market are experiencing budget shortfalls which again is likely to foster slow economic growth.
Despite the overall regional challenges, 2014 was a good year for farmers in our region. While oil, gold and other commodity prices fell for much of the year, food prices continued to rise on average, and in some cases, the increases were large. Dairy product prices were up six percent over the recent twelve month period. Fresh fruit prices rose nearly two percent in just one month during the fourth quarter of 2014 and were up nearly seven percent on a year over year basis. While poultry prices have been virtually flat over the past year, margins in the poultry industry have increased as a result of the lower feed prices. Although grain prices slumped, yield increases and crop insurance helped to mitigate any significant effect of lower prices in our region.
The ongoing improvement of the U.S. economy suggests that the demand for value-added agricultural products will continue to rise in 2015. This increasing consumer preference for local, fresh products support the Association’s efforts related to its Farm Fresh Financing Program.
A significant number of our borrowers or family members involved in the farming operation are actively employed in off-farm professions. The Association’s geographic proximity to the Nation’s Capital results in sizable employment in the region supported by federal government related spending. The recent
16 MidAtlantic Farm Credit, ACA
Management’s Discussion and Analysis
of Financial Condition and Results of Operations (dollars in thousands, except as noted)
reductions which have surrounded federal spending have naturally restrained the spending and borrowing of members who have some reliance on this sector.
Generally, available credit to farmers and related businesses has been quite adequate with some commercial banks reentering or continuing to expand their market presence in the agricultural sector after having abruptly curtailed or exited the industry following the 2008 financial collapse. The number of active borrowers has increased slightly from 9,791 at the end of 2013 to 9,830 at the end of 2014. A seasoned, knowledgeable lending staff and the inherent value of patronage paid under the cooperative structure have positioned the Association to compete effectively for this expanded business opportunity to serve the financing needs for agriculture in the Association’s territory, while retaining current members and their business relationships.
For the year ended December 31, 2014, the credit quality of the loan portfolio remained strong as Acceptable Loans remained at 97 percent of the portfolio. During 2014, nonperforming assets as a percentage of total loans decreased almost ten percent, and decreased over five percent as a percentage of capital. Nonaccrual loans to total loans at the end of 2014 are now comparable to the level at the end of 2007 before the Great Recession which began in 2008. The Loan Loss Provision for 2014 of $125 thousand compared to $6.1 million, $9.0 million and $14.6 million for the three previous years reflects the strengthening of the quality of the portfolio. We are not seeing any increased deterioration in any particular sector of the portfolio. Lower fuel costs are favorably impacting most sectors of the portfolio. While lower grain prices have been somewhat unfavorable to this sector, high yields have generally mitigated any adverse impact. Conversely, lower grain prices have been quite favorable for the protein sector which has also continued to experience historically higher prices. Industries tied to housing such as forestry, sawmills, sod, and landscape nurseries have seen some improvement but have continued to experience reduced demand and pre-recession profitability has been somewhat compromised. Over time, the higher inputs are expected to ultimately either be passed on to the consumer or production will be cut to ensure that the supply produced will clear the market at prices that will generate an acceptable profit. Some of the sectors of the Association’s portfolio which have some reliance on off-farm income have continued to be negatively affected in conjunction with the global economic challenges. In addition, some of the borrowers classified as loan type rural residential real estate have also been adversely impacted by the economy which has put some pressure on this segment of the portfolio. While the credit quality of the Association loan portfolio is very strong, there certainly remains the potential risk of future deterioration by the factors mentioned above.
During 2014, the Association continued to target certain areas of our business with the goal of increasing market share. As in 2013, in 2014 the Association continued its expansion of its farm equipment financing program which provides an efficient electronic loan application process for farm equipment financing. The success of this program has been further realized with members who joined the Association with an equipment loan expanding their borrowing needs with a mortgage or operating loan. Continued efforts are being made to expand services, increase public knowledge of our services and
streamline our current delivery of products to enhance our existing portfolio. The Association continued to expand its recently introduced Farm Fresh Financing program that offers financing and credit options to local food organizations and “new generation” farmers, a term that refers to producers who distribute their products through local food channels and practice sustainable farming methods, often on a small scale basis. In addition, the merger at the end of 2008 further diversified the Association’s portfolio and expanded its territory.
LOAN PORTFOLIO
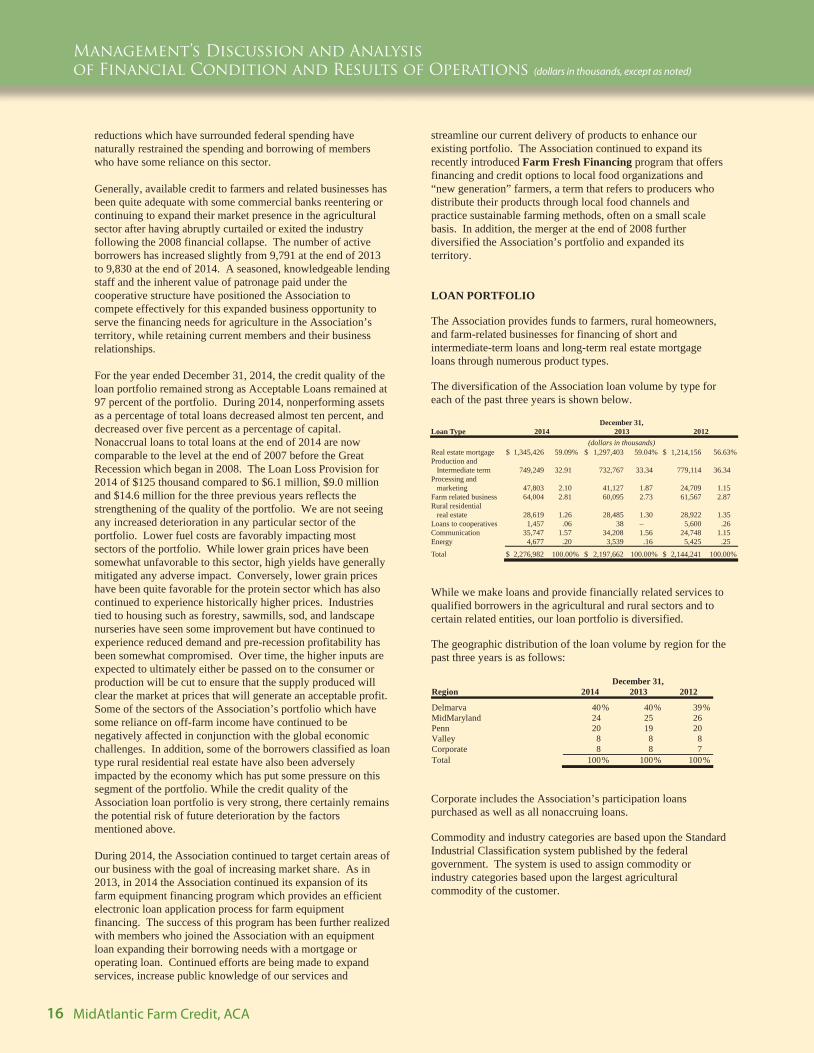
The Association provides funds to farmers, rural homeowners, and farm-related businesses for financing of short and intermediate-term loans and long-term real estate mortgage loans through numerous product types.
The diversification of the Association loan volume by type for each of the past three years is shown below.
December 31, Loan Type 2014 2013 2012
(dollars in thousands) Real estate mortgage $ 1,345,426 59.09% $ 1,297,403 59.04% $ 1,214,156 56.63%Production and
Intermediate term 749,249 32.91 732,767 33.34 779,114 36.34 Processing and
marketing 47,803 2.10 41,127 1.87 24,709 1.15 Farm related business 64,004 2.81 60,095 2.73 61,567 2.87 Rural residential
real estate 28,619 1.26 28,485 1.30 28,922 1.35 Loans to cooperatives 1,457 .06 38 – 5,600 .26 Communication 35,747 1.57 34,208 1.56 24,748 1.15 Energy 4,677 .20 3,539 .16 5,425 .25
Total $ 2,276,982 100.00% $ 2,197,662 100.00% $ 2,144,241 100.00%
While we make loans and provide financially related services to qualified borrowers in the agricultural and rural sectors and to certain related entities, our loan portfolio is diversified.
The geographic distribution of the loan volume by region for the past three years is as follows:
December 31, Region 2014 2013 2012
Delmarva 40 % 40% 39%MidMaryland 24 25 26 Penn 20 19 20 Valley 8 8 8 Corporate 8 8 7 Total 100 % 100% 100%
Corporate includes the Association’s participation loans purchased as well as all nonaccruing loans.
Commodity and industry categories are based upon the Standard Industrial Classification system published by the federal government. The system is used to assign commodity or industry categories based upon the largest agricultural commodity of the customer.
17MidAtlantic Farm Credit, ACA
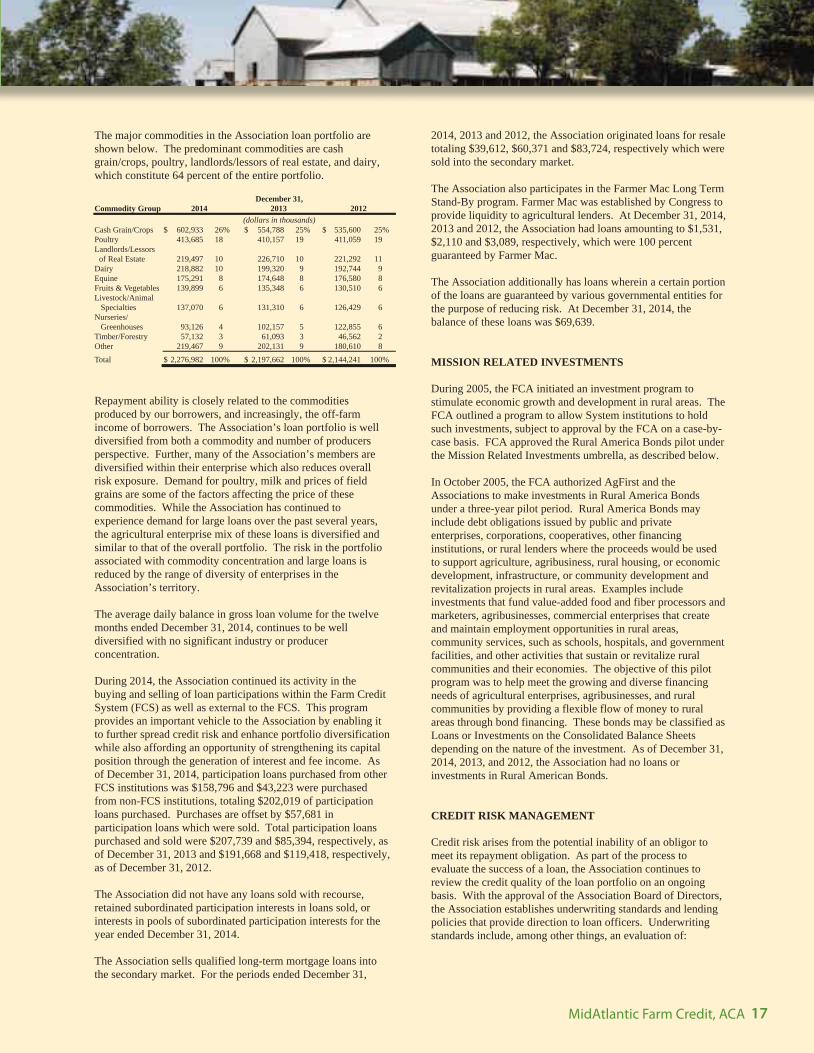
The major commodities in the Association loan portfolio are shown below. The predominant commodities are cash grain/crops, poultry, landlords/lessors of real estate, and dairy, which constitute 64 percent of the entire portfolio.
December 31, Commodity Group 2014 2013 2012
(dollars in thousands) Cash Grain/Crops $ 602,933 26% $ 554,788 25% $ 535,600 25% Poultry 413,685 18 410,157 19 411,059 19 Landlords/Lessors of Real Estate 219,497 10 226,710 10 221,292 11 Dairy 218,882 10 199,320 9 192,744 9 Equine 175,291 8 174,648 8 176,580 8 Fruits & Vegetables 139,899 6 135,348 6 130,510 6 Livestock/Animal Specialties 137,070 6 131,310 6 126,429 6 Nurseries/ Greenhouses 93,126 4 102,157 5 122,855 6 Timber/Forestry 57,132 3 61,093 3 46,562 2 Other 219,467 9 202,131 9 180,610 8 Total $ 2,276,982 100% $ 2,197,662 100% $ 2,144,241 100%
Repayment ability is closely related to the commodities produced by our borrowers, and increasingly, the off-farm income of borrowers. The Association’s loan portfolio is well diversified from both a commodity and number of producers perspective. Further, many of the Association’s members are diversified within their enterprise which also reduces overall risk exposure. Demand for poultry, milk and prices of field grains are some of the factors affecting the price of these commodities. While the Association has continued to experience demand for large loans over the past several years, the agricultural enterprise mix of these loans is diversified and similar to that of the overall portfolio. The risk in the portfolio associated with commodity concentration and large loans is reduced by the range of diversity of enterprises in the Association’s territory.
The average daily balance in gross loan volume for the twelve months ended December 31, 2014, continues to be well diversified with no significant industry or producer concentration.
During 2014, the Association continued its activity in the buying and selling of loan participations within the Farm Credit System (FCS) as well as external to the FCS. This program provides an important vehicle to the Association by enabling it to further spread credit risk and enhance portfolio diversification while also affording an opportunity of strengthening its capital position through the generation of interest and fee income. As of December 31, 2014, participation loans purchased from other FCS institutions was $158,796 and $43,223 were purchased from non-FCS institutions, totaling $202,019 of participation loans purchased. Purchases are offset by $57,681 in participation loans which were sold. Total participation loans purchased and sold were $207,739 and $85,394, respectively, as of December 31, 2013 and $191,668 and $119,418, respectively, as of December 31, 2012.
The Association did not have any loans sold with recourse, retained subordinated participation interests in loans sold, or interests in pools of subordinated participation interests for the year ended December 31, 2014.
The Association sells qualified long-term mortgage loans into the secondary market. For the periods ended December 31,
2014, 2013 and 2012, the Association originated loans for resale totaling $39,612, $60,371 and $83,724, respectively which were sold into the secondary market.
The Association also participates in the Farmer Mac Long Term Stand-By program. Farmer Mac was established by Congress to provide liquidity to agricultural lenders. At December 31, 2014, 2013 and 2012, the Association had loans amounting to $1,531, $2,110 and $3,089, respectively, which were 100 percent guaranteed by Farmer Mac.
The Association additionally has loans wherein a certain portion of the loans are guaranteed by various governmental entities for the purpose of reducing risk. At December 31, 2014, the balance of these loans was $69,639.
MISSION RELATED INVESTMENTS
During 2005, the FCA initiated an investment program to stimulate economic growth and development in rural areas. The FCA outlined a program to allow System institutions to hold such investments, subject to approval by the FCA on a case-by-case basis. FCA approved the Rural America Bonds pilot under the Mission Related Investments umbrella, as described below.
In October 2005, the FCA authorized AgFirst and the Associations to make investments in Rural America Bonds under a three-year pilot period. Rural America Bonds may include debt obligations issued by public and private enterprises, corporations, cooperatives, other financing institutions, or rural lenders where the proceeds would be used to support agriculture, agribusiness, rural housing, or economic development, infrastructure, or community development and revitalization projects in rural areas. Examples include investments that fund value-added food and fiber processors and marketers, agribusinesses, commercial enterprises that create and maintain employment opportunities in rural areas, community services, such as schools, hospitals, and government facilities, and other activities that sustain or revitalize rural communities and their economies. The objective of this pilot program was to help meet the growing and diverse financing needs of agricultural enterprises, agribusinesses, and rural communities by providing a flexible flow of money to rural areas through bond financing. These bonds may be classified as Loans or Investments on the Consolidated Balance Sheets depending on the nature of the investment. As of December 31, 2014, 2013, and 2012, the Association had no loans or investments in Rural American Bonds.
CREDIT RISK MANAGEMENT
Credit risk arises from the potential inability of an obligor to meet its repayment obligation. As part of the process to evaluate the success of a loan, the Association continues to review the credit quality of the loan portfolio on an ongoing basis. With the approval of the Association Board of Directors, the Association establishes underwriting standards and lending policies that provide direction to loan officers. Underwriting standards include, among other things, an evaluation of:

18 MidAtlantic Farm Credit, ACA
Management’s Discussion and Analysis
of Financial Condition and Results of Operations (dollars in thousands, except as noted)
Character – borrower integrity and credit history Capacity – repayment capacity of the borrower based on cash flows from operations or other sources of income Collateral – protection for the lender in the event of default and a potential secondary source of repayment Capital – ability of the operation to survive unanticipated risks Conditions – intended use of the loan funds and loan terms
The credit risk management process begins with an analysis of the borrower’s credit history, repayment capacity, and financial position. Repayment capacity focuses on the borrower’s ability to repay the loan based upon cash flows from operations or other sources of income, including non-farm income. Real estate loans must be collateralized by first liens on the real estate (collateral). As required by FCA regulations, each institution that makes loans on a collateralized basis must have collateral evaluation policies and procedures. Real estate mortgage loans may be made only in amounts up to 85 percent of the original appraised value of the property taken as collateral or up to 97 percent of the appraised value if guaranteed by a state, federal, or other governmental agency. The actual loan to appraised value when loans are made is generally lower than the statutory maximum percentage. Appraisals are required for loans of more than $250,000. In addition, each loan is assigned a credit risk rating based upon the underwriting standards. This credit risk rating process incorporates objective and subjective criteria to identify inherent strengths, weaknesses, and risks in a particular relationship.
We review the credit quality of the loan portfolio on an ongoing basis as part of our risk management practices. Each loan is classified according to the Uniform Classification System, which is used by all Farm Credit System institutions. Below are the classification definitions.
Acceptable – Assets are expected to be fully collectible and represent the highest quality. Other Assets Especially Mentioned (OAEM) – Assets are currently collectible but exhibit some potential weakness. Substandard – Assets exhibit some serious weakness in repayment capacity, equity, and/or collateral pledged on the loan. Doubtful – Assets exhibit similar weaknesses to substandard assets. However, doubtful assets have additional weaknesses in existing facts, conditions and values that make collection in full highly questionable. Loss – Assets are considered uncollectible.
The following table presents selected statistics related to the credit quality of loans including accrued interest at December 31.
Credit Quality 2014 2013 2012
Acceptable & OAEM 96.94% 97.12% 94.68%
Substandard 3.06 2.88 5.32
Doubtful – – –
Loss – – –
Total 100.00% 100.00% 100.00%
Nonperforming Assets
The Association’s loan portfolio is divided into performing and high-risk categories. A Special Assets Management Department is responsible for servicing loans classified as high-risk. The high-risk assets, including accrued interest, are detailed below:
December 31, High-risk Assets 2014 2013 2012
(dollars in thousands)Nonaccrual loans $ 25,008 $ 26,713 $ 44,739Restructured loans 19,598 18,028 16,044Accruing loans 90 days past due 257 – –Total high-risk loans 44,863 44,741 60,783Other property owned 844 841 3,009Total high-risk assets $ 45,707 $ 45,582 $ 63,792
RatiosNonaccrual loans to total loans 1.10% 1.22% 2.09%
High-risk assets to total assets 2.01% 2.07% 2.97%
Nonaccrual loans represent all loans where there is a reasonable doubt as to the collection of principal and/or future interest accruals, under the contractual terms of the loan. In substance, nonaccrual loans reflect loans where the accrual of interest has been suspended. Nonaccrual loans decreased $1,705 or 6.38 percent in 2014 after having decreased $18,026 or 40.29 percent in 2013. The significant decrease in 2013 occurred principally with settlement on large loans in the nurseries/greenhouses and fruits and vegetables sectors. Nonaccrual loans are not concentrated in any specific sector of the Association’s portfolio. Of the $25,008 in nonaccrual volume at December 31, 2014, $6,956 or 27.82 percent, compared to 25.36 percent and 23.48 percent at December 31, 2013 and 2012, respectively, was current as to scheduled principal and interest payments, but did not meet all regulatory requirements to be transferred into accrual status.
Loan restructuring is available to financially distressed borrowers. Restructuring of loans occurs when the Association grants a concession to a borrower based on either a court order or good faith in a borrower’s ability to return to financial viability. The concessions can be in the form of a modification of terms or rates, a compromise of amounts owed, or deed in lieu of foreclosure. Other receipts of assets and/or equity to pay the loan in full or in part are also considered restructured loans. The type of alternative financing structure chosen is based on minimizing the loss incurred by both the Association and the borrower.
Allowance for Loan Losses
The allowance for loan losses at each period end was considered by Association management to be adequate to absorb probable losses existing in and inherent to its loan portfolio.
19MidAtlantic Farm Credit, ACA
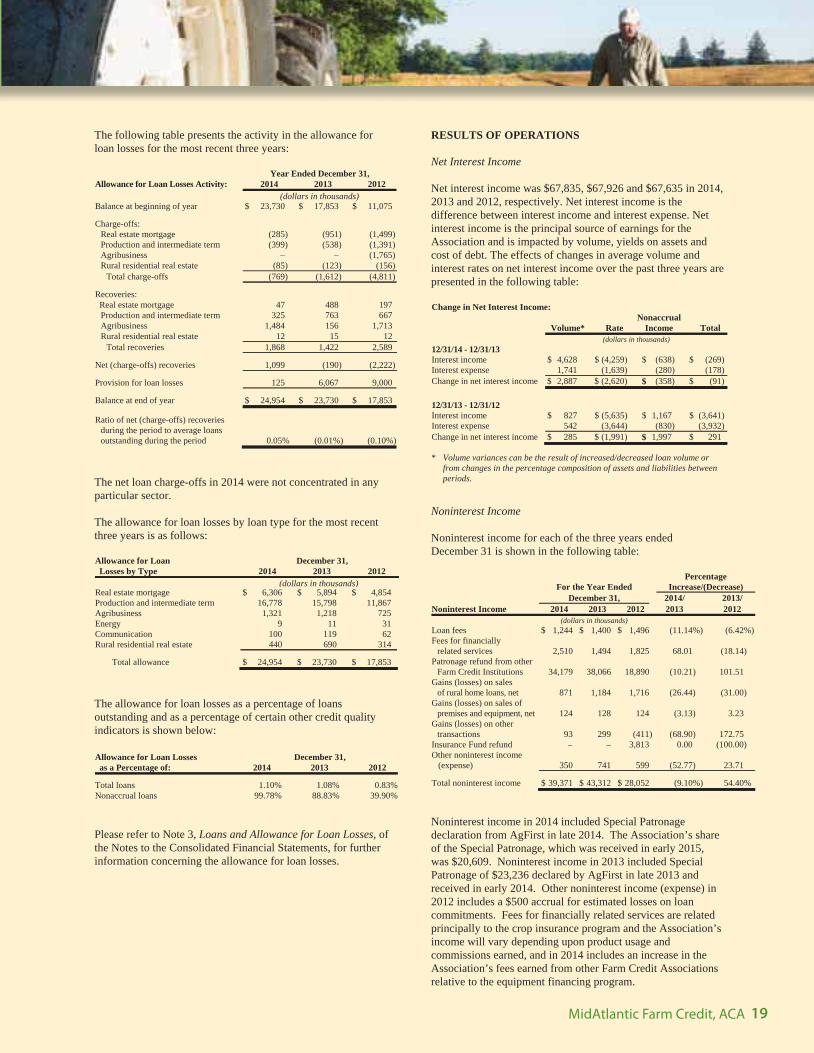
The following table presents the activity in the allowance for loan losses for the most recent three years:
Year Ended December 31, Allowance for Loan Losses Activity: 2014 2013 2012
(dollars in thousands)Balance at beginning of year $ 23,730 $ 17,853 $ 11,075
Charge-offs: Real estate mortgage (285) (951) (1,499) Production and intermediate term (399) (538) (1,391) Agribusiness – – (1,765) Rural residential real estate (85) (123) (156) Total charge-offs (769) (1,612) (4,811)
Recoveries: Real estate mortgage 47 488 197 Production and intermediate term 325 763 667 Agribusiness 1,484 156 1,713 Rural residential real estate 12 15 12 Total recoveries 1,868 1,422 2,589
Net (charge-offs) recoveries 1,099 (190) (2,222)
Provision for loan losses 125 6,067 9,000
Balance at end of year $ 24,954 $ 23,730 $ 17,853
Ratio of net (charge-offs) recoveries during the period to average loans outstanding during the period 0.05% (0.01%) (0.10%)
The net loan charge-offs in 2014 were not concentrated in any particular sector.
The allowance for loan losses by loan type for the most recent three years is as follows:
Allowance for Loan December 31, Losses by Type 2014 2013 2012
(dollars in thousands)Real estate mortgage $ 6,306 $ 5,894 $ 4,854 Production and intermediate term 16,778 15,798 11,867 Agribusiness 1,321 1,218 725 Energy 9 11 31 Communication 100 119 62 Rural residential real estate 440 690 314
Total allowance $ 24,954 $ 23,730 $ 17,853
The allowance for loan losses as a percentage of loans outstanding and as a percentage of certain other credit quality indicators is shown below:
Allowance for Loan Losses December 31, as a Percentage of: 2014 2013 2012
Total loans 1.10% 1.08% 0.83%Nonaccrual loans 99.78% 88.83% 39.90%
Please refer to Note 3, Loans and Allowance for Loan Losses, of the Notes to the Consolidated Financial Statements, for further information concerning the allowance for loan losses.
RESULTS OF OPERATIONS
Net Interest Income
Net interest income was $67,835, $67,926 and $67,635 in 2014, 2013 and 2012, respectively. Net interest income is the difference between interest income and interest expense. Net interest income is the principal source of earnings for the Association and is impacted by volume, yields on assets and cost of debt. The effects of changes in average volume and interest rates on net interest income over the past three years are presented in the following table:
Change in Net Interest Income:
Volume* Rate Nonaccrual
Income Total (dollars in thousands)
12/31/14 - 12/31/13 Interest income $ 4,628 $ (4,259) $ (638) $ (269)Interest expense 1,741 (1,639) (280) (178)Change in net interest income $ 2,887 $ (2,620) $ (358) $ (91)
12/31/13 - 12/31/12 Interest income $ 827 $ (5,635) $ 1,167 $ (3,641)Interest expense 542 (3,644) (830) (3,932)Change in net interest income $ 285 $ (1,991) $ 1,997 $ 291
* Volume variances can be the result of increased/decreased loan volume or from changes in the percentage composition of assets and liabilities between periods.
Noninterest Income
Noninterest income for each of the three years ended December 31 is shown in the following table:
Percentage For the Year Ended Increase/(Decrease)
December 31, 2014/ 2013/ Noninterest Income 2014 2013 2012 2013 2012
(dollars in thousands) Loan fees $ 1,244 $ 1,400 $ 1,496 (11.14%) (6.42%)Fees for financially related services 2,510 1,494 1,825 68.01 (18.14) Patronage refund from other Farm Credit Institutions 34,179 38,066 18,890 (10.21) 101.51 Gains (losses) on sales of rural home loans, net 871 1,184 1,716 (26.44) (31.00) Gains (losses) on sales of premises and equipment, net 124 128 124 (3.13) 3.23 Gains (losses) on other transactions 93 299 (411) (68.90) 172.75 Insurance Fund refund – – 3,813 0.00 (100.00) Other noninterest income (expense) 350 741 599 (52.77) 23.71
Total noninterest income $ 39,371 $ 43,312 $ 28,052 (9.10%) 54.40%
Noninterest income in 2014 included Special Patronage declaration from AgFirst in late 2014. The Association’s share of the Special Patronage, which was received in early 2015, was $20,609. Noninterest income in 2013 included Special Patronage of $23,236 declared by AgFirst in late 2013 and received in early 2014. Other noninterest income (expense) in 2012 includes a $500 accrual for estimated losses on loan commitments. Fees for financially related services are related principally to the crop insurance program and the Association’s income will vary depending upon product usage and commissions earned, and in 2014 includes an increase in the Association’s fees earned from other Farm Credit Associations relative to the equipment financing program.
20 MidAtlantic Farm Credit, ACA
Management’s Discussion and Analysis
of Financial Condition and Results of Operations (dollars in thousands, except as noted)
Noninterest Expense
Noninterest expense for each of the three years ended December 31 is shown in the following table:
Percentage For the Year Ended Increase/(Decrease)
December 31, 2014/ 2013/ Noninterest Expense 2014 2013 2012 2013 2012
(dollars in thousands) Salaries and employee benefits $ 27,646 $ 26,331 $ 24,202 4.99% 8.80% Occupancy and equipment 2,365 2,253 2,213 4.97 1.81 Insurance Fund premiums 2,042 1,678 908 21.69 84.80 (Gains) losses on other property owned, net (551) 707 1,129 177.93 (37.38) Other operating expenses 7,204 6,103 6,428 18.04 (5.06)
Total noninterest expense $ 38,706 $ 37,072 $ 34,880 4.41% 6.28%
Noninterest expense increased $1,634 or 4.41 percent for the year ended December 31, 2014, as compared to the same period in 2013 and increased $2,192 or 6.28 percent in 2013 compared to the 2012 year.
Salaries and employee benefits increased $1,315 or 4.99 percent in 2014 as compared to 2013. This increase is primarily attributable to 2014 salary adjustments and related employee benefit increases, and a slight increase in the number of employees. See Note 9, Employee Benefit Plans, of the Notes to the Consolidated Financial Statements, for further information.
The Insurance Fund premium increased $364 or 21.73 percent in 2014 as compared to 2013. The increase resulted from the Farm Credit System Insurance Corporation announcement in January 2014 to increase the insurance premium for 2014 effective January 1, 2014. For 2014, the insurance premium was 0.12 percent of loans (12 basis points) as compared to 0.10 percent of loans (10 basis points) for 2013. The insurance premium was 0.05 percent of loans (5 basis points) for 2012.
Occupancy and equipment and Other operating expenses increased a total of $1,100 or 18.02 percent primarily attributable to an increase in directors, travel and technology expenses and to expenses related to nonaccrual loans which was included as part of the loan loss provision in previous years. The Association’s efficiency ratio, which is calculated as Operating Expenses as a percentage of Net interest income plus Total noninterest income continues to be among the lowest in the AgFirst District and significantly below the average efficiency ratio for the District. If the Association’s Operating Expenses averaged the District average, then Operating Expenses would be approximately $4.3 million higher which would result in a decrease of the same amount to Income before income taxes, and, accordingly, would adversely impact the patronage distribution which the Association makes to stockholders.
Income Taxes
The Association recorded a provision for income taxes of $1,365 for the year ended December 31, 2014, as compared to a provision of $114 for 2013 and a provision of $129 for 2012. Refer to Note 2, Summary of Significant Accounting Policies, Income Taxes, and Note 12, Income Taxes, of the Notes to the Consolidated Financial Statements, for more information concerning Association income taxes.
Key Results of Operations Comparisons
Key results of operations comparisons for each of the twelve months ended December 31 are shown in the following table:
Key Results of For the 12 Months Ended Operations Comparisons 12/31/14 12/31/13 12/31/12
Return on average assets 2.94% 3.09% 2.32% Return on average members’ equity 13.18% 14.36% 11.73% Net interest income as a percentage of average earning assets 3.04% 3.16% 3.14% Net (charge-offs) recoveries to average loans 0.05% (0.01%) (0.10%)
A key factor in maintaining and growing the net income for future years will be an increase in Acceptable loan volume, continued improvement in net interest income and controlling loan losses, while effectively managing noninterest income and noninterest expense. The lingering economic slowdown, above average unemployment, and reduction in federal and state government spending, continue to impact certain sectors of the Association’s portfolio and could continue to adversely impact the Association until economic stability and sustained growth in the global economy is restored. In 2014, the Association recorded a provision for loan losses of $125 and charge-offs (net of recoveries) of $1,099. This was a significant decrease compared to 2013 and 2012 when the provision for loan losses totaled $6,067 and $9,000, respectively and charge-offs (net of recoveries) aggregated $190 and $2,222, respectively. The past three years have been favorably impacted by the receipt of Special Patronage distributions from AgFirst Farm Credit Bank which totaled $20,609, $24,418, and $4,730 in 2014, 2013 and 2012, respectively. The $20,609 was the Association’s share of a $175 million Special Patronage distribution from the Bank. The Association does not forecast continued receipt of these distributions. During the past few years with very low returns on fixed rate investments, the Association’s pension plans have also been negatively impacted which increased the financial accounting required impact on 2014, 2013 and 2012 employee benefits expense. The fiscal stability of the Association enables it, during these challenging times, to continue to emphasize its goals to: consistently meet the needs of our membership by providing quality loan products, generate earnings which are sufficient to fund operations, assure the adequate capitalization of the Association, and achieve an acceptable rate of return for stockholders. To meet these goals, the Association will continue its efforts of attracting and retaining high quality, competitively priced, loan volume while effectively managing credit risk in the entire loan portfolio. The Association has successfully implemented an Enterprise Risk Management (ERM) process which is expected to further aid the Association in its management of both short and long-term risks. The Association will continue to actively evaluate new or modified products, including recommendations and initiatives offered in conjunction with System projects.
LIQUIDITY AND FUNDING SOURCES
Liquidity and Funding
The principal source of funds for the Association is the borrowing relationship established with the Bank through a General Financing Agreement (GFA). The GFA utilizes the
21MidAtlantic Farm Credit, ACA
Association’s credit and fiscal performance as criteria for establishing a line of credit on which the Association may draw funds. The Bank advances the funds to the Association, creating notes payable (or direct loans) to the Bank. The Bank manages interest rate risk through direct loan pricing and asset/liability management. The notes payable are segmented into variable rate and fixed rate components. The variable rate note is utilized by the Association to fund variable rate loan advances and operating funds requirements. The fixed rate note is used specifically to fund fixed rate loan advances made by the Association. Association capital levels effectively create a borrowing margin between the amount of loans outstanding and the amount of notes payable outstanding. This margin is commonly referred to as “Loanable Funds.”
Total notes payable to the Bank at December 31, 2014, was $1,760,410 as compared to $1,724,627 at December 31, 2013 and $1,714,965 at December 31, 2012. The increase of 2.07 percent compared to December 31, 2013 was attributable to (a) the increase in loan volume, (b) successful settlement of several nonaccruing loan accounts and (c) the Association’s increase in member’s equity attributable to net income. Since the beginning of 2012, loans have increased $108,088 or 4.98 percent while Member’s Equity has increased $97,330 or 23.14 percent. The average volume of outstanding notes payable to the Bank was $1,732,495 and $1,696,115 for the years ended December 31, 2014 and 2013, respectively. Refer to Note 6, Notes Payable to AgFirst Farm Credit Bank, of the Notes to the Consolidated Financial Statements, for weighted average interest rates and maturities, and additional information concerning the Association’s notes payable.
Liquidity management is the process whereby funds are made available to meet all financial commitments including the extension of credit, payment of operating expenses and payment of debt obligations. The Association receives access to funds through its borrowing relationship with the Bank and from income generated by operations. The liquidity policy of the Association is to manage cash balances to maximize debt reduction and to increase loan volume. As borrower payments are received, they are applied to the Association’s note payable to the Bank. The Association's participation in the Farmer Mac agreements, and other secondary market programs provides additional liquidity. Sufficient liquid funds have been available to meet all financial obligations. There are no known trends likely to result in a liquidity deficiency for the Association.
The Association has a net settlement agreement with CoBank, ACB to settle transactions between the two institutions daily to an aggregate line of credit of $50 million. The Association had no other lines of credit from third party financial institutions as of December 31, 2014.
Funds Management
The Bank and the Association manage assets and liabilities to provide a broad range of loan products and funding options, which are designed to allow the Association to be competitive in all interest rate environments. The primary objective of the asset/liability management process is to provide stable and rising earnings, while maintaining adequate capital levels by managing exposure to credit and interest rate risks.
Demand for loan types is a driving force in establishing a funds management strategy. The Association offers fixed, adjustable and variable rate loan products that are marginally priced according to financial market rates. Variable rate loans may be indexed to market indices such as the Prime Rate or the 90-day London Interbank Offered Rate (LIBOR). Adjustable rate mortgages are indexed to U.S. Treasury Rates. Fixed rate loans are priced based on the current cost of System debt of similar terms to maturity.
The majority of the interest rate risk in the Association’s Consolidated Balance Sheets is transferred to the Bank through the notes payable structure. The Bank, in turn, actively utilizes funds management techniques to identify, quantify and control risk associated with the loan portfolio.
Relationship with the Bank
The Association’s statutory obligation to borrow only from the Bank is discussed in Note 6, Notes Payable to AgFirst Farm Credit Bank, of the Notes to the Consolidated Financial Statements in this Annual Report.
The Bank’s ability to access capital of the Association is discussed in Note 4, Investments in Other Farm Credit Institutions, of the Notes to the Consolidated Financial Statements.
The Bank’s role in mitigating the Association’s exposure to interest rate risk is described in the “Liquidity and Funding” section of this Management’s Discussion and Analysis and in Note 6, Notes Payable to AgFirst Farm Credit Bank, included in this Annual Report.
CAPITAL RESOURCES
Capital serves to support asset growth and provide protection against unexpected credit and interest rate risk and operating losses. Capital is also needed for future growth and investment in new products and services.
The Association Board of Directors establishes, adopts, and maintains a formal written capital adequacy plan to ensure that adequate capital is maintained for continued financial viability, to provide for growth necessary to meet the needs of members/borrowers, and to ensure that all stockholders are treated equitably. There were no material changes to the capital plan for 2014 that would affect minimum stock purchases or would have an effect on the Association’s ability to retire stock and distribute earnings.
Total members’ equity at December 31, 2014, increased 5.87 percent to $518,027 from the December 31, 2013, total of $489,289. At December 31, 2013, total members’ equity increased 8.52 percent from the December 31, 2012 total of $450,881. The 2014 increase was primarily attributed to net income net of various patronage related distributions and the net impact of capital stock/participation certificates issued/retired. See statement “Consolidated Statements of Changes in Members’ Equity” in this Annual Report for further details.
22 MidAtlantic Farm Credit, ACA
Management’s Discussion and Analysis
of Financial Condition and Results of Operations (dollars in thousands, except as noted)
FCA sets minimum regulatory capital requirements for System banks and associations. Capital adequacy is evaluated using a number of regulatory ratios. According to the FCA regulations, each institution’s permanent capital ratio is calculated by dividing permanent capital by a risk-adjusted asset base. Risk adjusted assets mean the total dollar amount of the institution’s assets adjusted by an appropriate credit conversion factor as defined by regulation. For all periods represented, the Association exceeded the minimum regulatory standard for all of the ratios.
The Association’s capital ratios as of December 31 and the FCA minimum requirements follow:
Regulatory 2014 2013 2012 Minimum
Permanent capital ratio 20.98% 20.21% 18.12% 7.00% Total surplus ratio 20.61% 19.83% 17.73% 7.00% Core surplus ratio 20.61% 19.68% 17.57% 3.50%
The increase in the Association’s permanent capital, total surplus and core surplus at December 31, 2014 was attributed to net income, net of patronage distributions, decreased investment in AgFirst stock, an increase in the Association’s capital stock and participation certificates outstanding, and an increase in loan volume outstanding. There are no trends, commitments, contingencies, or events that are likely to affect the Association’s ability to meet regulatory minimum capital standards and capital adequacy requirements.
See Note 7, Members’ Equity, of the Consolidated Financial Statements, for further information concerning capital resources.
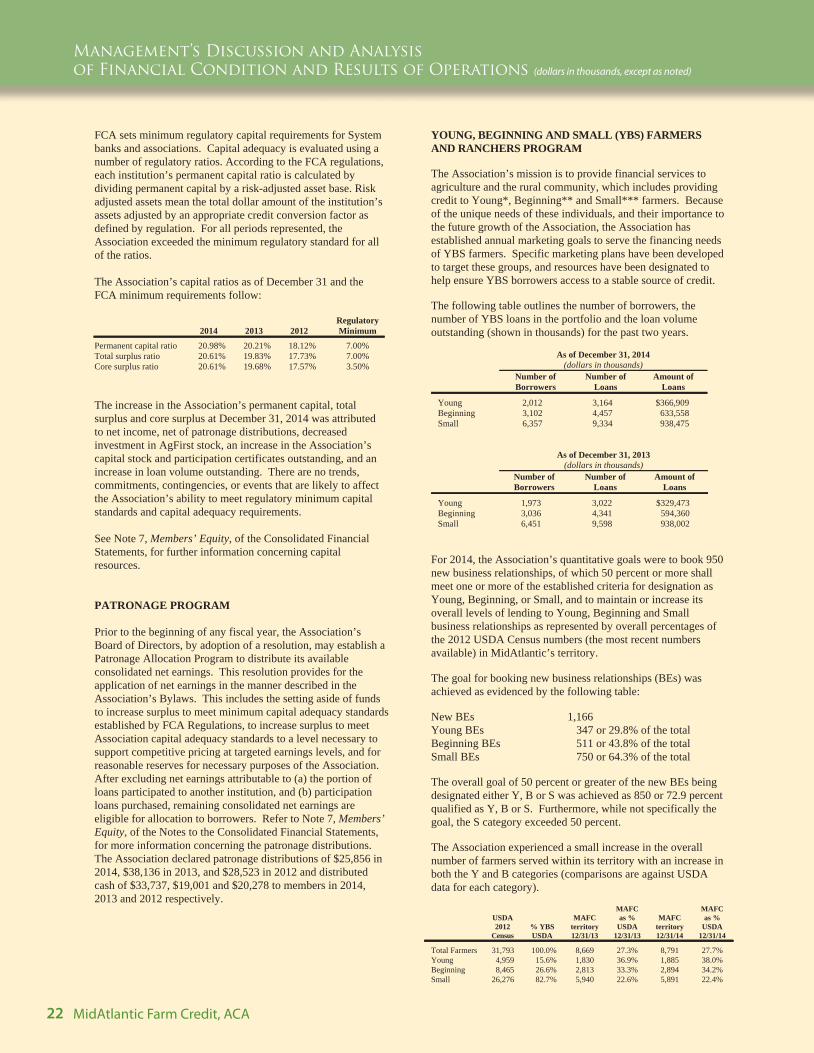
PATRONAGE PROGRAM
Prior to the beginning of any fiscal year, the Association’s Board of Directors, by adoption of a resolution, may establish a Patronage Allocation Program to distribute its available consolidated net earnings. This resolution provides for the application of net earnings in the manner described in the Association’s Bylaws. This includes the setting aside of funds to increase surplus to meet minimum capital adequacy standards established by FCA Regulations, to increase surplus to meet Association capital adequacy standards to a level necessary to support competitive pricing at targeted earnings levels, and for reasonable reserves for necessary purposes of the Association. After excluding net earnings attributable to (a) the portion of loans participated to another institution, and (b) participation loans purchased, remaining consolidated net earnings are eligible for allocation to borrowers. Refer to Note 7, Members’ Equity, of the Notes to the Consolidated Financial Statements, for more information concerning the patronage distributions. The Association declared patronage distributions of $25,856 in 2014, $38,136 in 2013, and $28,523 in 2012 and distributed cash of $33,737, $19,001 and $20,278 to members in 2014, 2013 and 2012 respectively.
YOUNG, BEGINNING AND SMALL (YBS) FARMERS AND RANCHERS PROGRAM
The Association’s mission is to provide financial services to agriculture and the rural community, which includes providing credit to Young*, Beginning** and Small*** farmers. Because of the unique needs of these individuals, and their importance to the future growth of the Association, the Association has established annual marketing goals to serve the financing needs of YBS farmers. Specific marketing plans have been developed to target these groups, and resources have been designated to help ensure YBS borrowers access to a stable source of credit.
The following table outlines the number of borrowers, the number of YBS loans in the portfolio and the loan volume outstanding (shown in thousands) for the past two years.
As of December 31, 2014 (dollars in thousands)
Number of Borrowers
Number of Loans
Amount of Loans
Young 2,012 3,164 $366,909 Beginning 3,102 4,457 633,558 Small 6,357 9,334 938,475
As of December 31, 2013 (dollars in thousands)
Number of Borrowers
Number of Loans
Amount of Loans
Young 1,973 3,022 $329,473 Beginning 3,036 4,341 594,360 Small 6,451 9,598 938,002
For 2014, the Association’s quantitative goals were to book 950 new business relationships, of which 50 percent or more shall meet one or more of the established criteria for designation as Young, Beginning, or Small, and to maintain or increase its overall levels of lending to Young, Beginning and Small business relationships as represented by overall percentages of the 2012 USDA Census numbers (the most recent numbers available) in MidAtlantic’s territory.
The goal for booking new business relationships (BEs) was achieved as evidenced by the following table:
New BEs 1,166 Young BEs 347 or 29.8% of the total Beginning BEs 511 or 43.8% of the total Small BEs 750 or 64.3% of the total
The overall goal of 50 percent or greater of the new BEs being designated either Y, B or S was achieved as 850 or 72.9 percent qualified as Y, B or S. Furthermore, while not specifically the goal, the S category exceeded 50 percent.
The Association experienced a small increase in the overall number of farmers served within its territory with an increase in both the Y and B categories (comparisons are against USDA data for each category).
USDA 2012
Census % YBS USDA
MAFC territory 12/31/13
MAFC as %
USDA 12/31/13
MAFC territory 12/31/14
MAFC as %
USDA 12/31/14
Total Farmers 31,793 100.0% 8,669 27.3% 8,791 27.7% Young 4,959 15.6% 1,830 36.9% 1,885 38.0% Beginning 8,465 26.6% 2,813 33.3% 2,894 34.2% Small 26,276 82.7% 5,940 22.6% 5,891 22.4%
23MidAtlantic Farm Credit, ACA
The working definitions of Young and Beginning include a criteria of borrower age and years farming while Small is defined by the level of agricultural sales. With the passage of time, existing borrowers will move out of these two categories regardless of any operational changes or lending activities.
The Association successfully implemented a new program in 2008, StartRight that focuses on the needs of Young, Beginning, Small and Minority farmers. Since implementation, over $171 million of StartRight loans have been booked, with over $63 million outstanding as of year-end 2014.
The StartRight program includes several outreach efforts to Young, Beginning, Small and Minority (YBSM) farmers. This outreach includes a resource center for YBSM farmers, found at www.mafc.com. It also includes a mentoring partnership program, which pairs new agricultural operators with more experienced farmers as well as various educational offerings to this group. During 2014, the Continuing Education Module of StartRight offered an online educational program called AgBiz Masters focusing on everything from macroeconomics to marketing to the importance of creating a business plan. You can read more about StartRight on the Association’s website, www.mafc.com.
In addition to our StartRight program, MidAtlantic also supports a Trade Credit program, “Farm Credit EXPRESS.” This program, supported through local equipment dealers within our territory, has further enhanced the YBS service of the Association. The “Farm Credit EXPRESS” program has also helped to increase sales by local equipment dealers, which promotes economic growth in the rural communities. The “Farm Credit EXPRESS” program has been expanded whereby the Association processes equipment financing applications for most of the other associations in the AgFirst District which enables those associations to further serve YBS borrowers in those territories.
The Association has the goal of serving YBS through extensive outreach programs that includes activities in marketing, education, training, and financial support. The Association continues previously sponsored outreach/sponsorship activities in which the Association participated for the purpose of promoting and supporting YBS efforts, as well as incorporated new outreach/sponsorships to continue building the Association’s commitment to YBS. The Association’s website,www.mafc.com, contains an entire section of information and resources specifically applicable to YBS visitors to the site.
The Association recently introduced its Farm Fresh Financing program that offers financing and credit options to local food organizations and “new generation” farmers, a term that refers to producers who distribute their products through local food channels.
The Association continues its participation in specific credit programs and partnerships that we have developed to help small farmers, young farmers and farmers just starting out. It includes programs offered by the Farm Service Agency (FSA), such as guaranteed and direct loans to qualifying borrowers. The Association has earned the distinction of a “preferred lender,” the highest status designated by FSA.
In addition to FSA guaranteed loans, the Association is also a Guaranteed Participating Lender for the Small Business Administration (SBA), which offers lending programs specifically for small borrowers, and also participates in a number of State lending programs that promote the agriculture industry and environmental stewardship. The Association also offers flexible financing options in-house for qualifying borrowers.
The Association remains fully committed to serving the financing needs of YBS borrowers and will continue to evaluate its programs and efforts in order that they will be even more effective in 2015. The Association includes YBS goals in the annual strategic plan, and reports on those goals and achievements to the board of directors on a quarterly basis.
The Association is committed to the future success of young, beginning and small farmers.
* Young farmers are defined as those farmers, ranchers, producers or harvesters of aquatic products who are age 35 or younger as of the date the loan is originally made.
** Beginning farmers are defined as those farmers, ranchers, producers or harvesters of aquatic products who have 10 years or less farming or ranching experience as of the date the loan is originally made.
*** Small farmers are defined as those farmers, ranchers, producers or harvesters of aquatic products who normally generate less than $250,000 in annual gross sales of agricultural or aquatic products at the date the loan is originally made.
REGULATORY MATTERS
For the twelve months ended December 31, 2014, the FCA took no enforcement action against the Association.
On March 31, 2014, the FCA published an interim final rule rescinding all requirements for nonbinding advisory votes on senior officer compensation at System banks and associations. The comment period for the interim rule ended on April 30, 2014 and the final rule became effective on June 18, 2014.
On July 25, 2014, the FCA published a proposed rule in the Federal Register to revise the requirements governing the eligibility of investments for System banks and associations. The public comment period ended on October 23, 2014. The stated objectives of the proposed rule are as follows:
To strengthen the safety and soundness of System banks and associations. To ensure that System banks hold sufficient liquidity to continue operations and pay maturing obligations in the event of market disruption. To enhance the ability of the System banks to supply credit to agricultural and aquatic producers. To comply with the requirements of section 939A of the Dodd-Frank Wall Street Reform and Consumer Protection Act (Dodd-Frank Act). To modernize the investment eligibility criteria for System banks.
24 MidAtlantic Farm Credit, ACA
Management’s Discussion and Analysis
of Financial Condition and Results of Operations (dollars in thousands, except as noted)
To revise the investment regulation for System associations to improve their investment management practices so they are more resilient to risk.
On September 4, 2014, the FCA published a proposed rule in the Federal Register to modify the regulatory capital requirements for System banks and associations. The public comment period was to have ended on January 2, 2015. However, the FCA extended the deadline to allow interested parties additional time to submit comments. The comment period ended on February 16, 2015. The stated objectives of the proposed rule are as follows:
To modernize capital requirements while ensuring that institutions continue to hold sufficient regulatory capital to fulfill their mission as a government-sponsored enterprise. To ensure that the System’s capital requirements are comparable to the Basel III framework and the standardized approach that the federal banking regulatory agencies have adopted, but also to ensure that the rules recognize the cooperative structure and the organization of the System. To make System regulatory capital requirements more transparent. To meet the requirements of section 939A of the Dodd-Frank Act.
On February 4, 2015, the FCA Board approved the final rule, “Disclosure to Shareholders; Pension Benefit Disclosures.” The rule amends FCA regulations to exclude employee compensation from being reported in the Summary Compensation Table (see Additional Disclosure Required by Farm Credit Administration Regulations section elsewhere in this Annual Report) if the employee would be considered a “highly compensated employee” solely because of payments related to or change(s) in value of the employee's qualified pension plan provided that the plan was available to all similarly situated employees on the same basis at the time the employee joined the plan. The rule will be effective 30 days after publication in the Federal Register during which time either one or both Houses of Congress are in session. System banks and associations must comply with the rule for compensation reported in the table for the fiscal year ending 2015, and may implement the rule retroactively for the fiscal years ended 2014 and 2013. However, retroactive application is not required. Retroactive application of the new provision requires no special permission from FCA as the rule itself contains this option. Disclosure of the change in calculation for the fiscal years to which the rule was applied retrospectively is required.
FINANCIAL REGULATORY REFORM
The Dodd-Frank Act was signed into law on July 21, 2010. While the Dodd-Frank Act represents a significant overhaul of many aspects of the regulation of the financial services industry, many of the statutory provisions of the Dodd-Frank Act are not applicable to the Farm Credit System. The Dodd-Frank Act requires various federal agencies to adopt a broad range of new implementing rules and regulations, and to prepare numerous studies and reports for Congress. The federal agencies are given significant discretion in drafting the
implementing rules and regulations, and consequently, many of the details and much of the impact of the Dodd-Frank Act may not be known for many more months or years.
The Dodd-Frank Act creates new regulators and expands the authority of the Federal Reserve Board over non-bank financial companies previously not subject to its or other bank regulators’ direct jurisdiction, particularly those that are considered systemically important to the U.S. financial system. The legislation created the Financial Oversight Council, a coordinating body of financial regulators, which is designed to monitor and pinpoint systemic risks across the financial spectrum. Nevertheless, the Dodd-Frank Act largely preserves the authority of the FCA as the System’s independent federal regulator by excluding System institutions from being considered non-bank financial companies and providing other exemptions and exclusions from certain of the law’s provisions. Also, the rules prohibiting banking entities from engaging in proprietary trading under the so-called Volcker Rule do not apply to the debt securities issued by the System.
The provisions of the Dodd-Frank Act pertaining to the regulation of derivatives transactions require more of these transactions to be cleared through a third-party central clearinghouse and traded on regulated exchanges or other multilateral platforms, and margin is required for these transactions. Derivative transactions that will not be subject to mandatory trading and clearing requirements may also be subject to minimum margin and capital requirements. As required by the Dodd-Frank Act, the Commodity Futures Trading Commission (CFTC) considered and exempted System institutions from certain of these new requirements, including mandatory clearing for many of the derivative transactions entered into by System institutions.
The aforementioned margin requirements for transactions that are not cleared should not apply to swaps entered into by the banks in connection with loans to members. On January 12, 2015, the President signed the “Terrorism Risk Insurance Program Reauthorization Act of 2015” (the “TRIA Reauthorization Act”) into law. Although primarily intended to renew a terrorism risk insurance program that was created in response to the September 11, 2001 attacks, the TRIA Reauthorization Act amends the Commodity Exchange Act to exempt swaps, for which a counterparty is a cooperative that qualifies for an exemption from mandatory clearing, from the Dodd-Frank Act’s initial and variation margin requirements for swaps that are not cleared. As discussed above, the CFTC has established a clearing exemption for swaps entered into by cooperatives in connection with loans to members, for which all System institutions qualify. By virtue of this exemption, System Institutions should qualify for the TRIA Reauthorization Act’s exemption from the Dodd-Frank Act’s initial and variation margin requirements for non-cleared swaps that are entered into in connection with loans to members. The TRIA Reauthorization Act charges the CFTC with implementing the exemption from the margin requirements via the promulgation of an interim final rule, pursuant to which public comment must be sought before a final rule is issued. To date, the CFTC has not taken any action with respect to TRIA Reauthorization Act’s margin exemption and thus it remains to be seen how the exemption will be implemented, including its scope and how it is to be claimed.
25MidAtlantic Farm Credit, ACA
Notwithstanding the above-mentioned exemptions from clearing and margin requirements for System institutions, counterparties of System institutions may require margin or other forms of credit support as a condition to entering into noncleared transactions because such transactions may subject these counterparties to more onerous capital, liquidity and other requirements absent such margin or credit support. Alternatively, these counterparties may pass on the capital and other costs associated with entering into transactions if insufficient margin or other credit support is not provided.
These new requirements may make derivative transactions more costly and less attractive as risk management tools for System institutions; and thus may impact the System’s funding and hedging strategies.
The Dodd-Frank Act also created a new federal agency called the Consumer Financial Protection Bureau (CFPB). The CFPB has the responsibility to regulate the offering of consumer financial products or services under federal consumer financial laws. The Farm Credit Administration retains the responsibility to oversee and enforce compliance by System institutions with relevant rules adopted by the CFPB.
In light of the foregoing, it is difficult to predict at this time the extent to which the Dodd-Frank Act or the forthcoming implementing rules and regulations will have an impact on the System. However, it is possible they could affect funding and hedging strategies and increase funding and hedging costs.
RECENTLY ISSUED ACCOUNTING PRONOUNCEMENTS
Please refer to Note 2, Summary of Significant Accounting Policies, in the Notes to the Consolidated Financial Statements for recently issued accounting pronouncements.

26 MidAtlantic Farm Credit, ACA
Disclosure Required by Farm Credit Administration Regulations
Description of Business
Descriptions of the territory served, persons eligible to borrow, types of lending activities engaged in, financial services offered and related Farm Credit organizations are incorporated herein by reference to Note 1, Organization and Operations, of the Consolidated Financial Statements included in this Annual Report to shareholders.
The description of significant developments that had or could have a material impact on earnings or interest rates to borrowers, acquisitions or dispositions of material assets, material changes in the manner of conducting the business, seasonal characteristics, and concentrations of assets, if any, is incorporated in “Management’s Discussion and Analysis of Financial Condition and Results of Operations” included in this Annual Report to shareholders.
Description of Property
The following table sets forth certain information regarding the properties of the reporting entity as of December 31, 2014:
Location Description Form of
Ownership
1614 Churchville Road Suite 102 Bel Air, MD 21015
Branch Operations Rented
112 East Liberty Street Charles Town, WV 25414 Satellite Office Rented
102 Morgnec Road Chestertown, MD 21620 Branch Operations Owned
379 Deep Shore Road Denton, MD 21629 Branch Operations Owned
1410 South State Street Dover, DE 19901 Branch Operations Owned
105 Railroad Avenue East New Market, MD 21631 Satellite Office Owned
925 North East Street Frederick, MD 21701 Branch Operations Owned
20816 DuPont Boulevard Georgetown, DE 19947 Branch Operations Owned
1260 Maryland Avenue Suite 109 Hagerstown, MD 21740
Branch Operations Rented
411 West Roseville Road Lancaster, PA 17601
Branch Operations Owned
158 Crimson Circle Martinsburg, WV 25403
Branch Operations Owned
1035 Ocean Highway Pocomoke, MD 21851 Branch Operations Owned
680 Robert Fulton Highway Quarryville, PA 17566 Branch Operations Owned
6546 Mid Atlantic Lane Salisbury, MD 21804 Branch Operations Owned
1513 Main Street Shoemakersville, PA 19555 Branch Operations Owned
Location DescriptionForm of
Ownership
45 Aileron Court Westminster, MD 21157 Administrative Headquarters Owned
700 Corporate Center Court Suite L Westminster, MD 21157 Branch Operations Rented
125 Prosperity Drive Winchester, VA 22602 Branch Operations Owned
1031 South Main Street Woodstock, VA 22664 Branch Operations Owned
South Main Street Woodstock, VA 22664 Unimproved 1 acre lot Owned
Rented facilities are leased by the Association at prevailing market rates from independent third parties for periods not currently exceeding five years. The Association leases approximately 4,000 square feet of its Winchester location comprising three suites. Two of the three suites are rented to Association Alliances: A New Century Realty and Farm Bureau. These alliances were formed to create opportunities for the Association membership to have real estate and insurance services available in one building. In addition, approximately 1,800 square feet at the Martinsburg location is leased. All of the Association’s leases to third parties are at prevailing market rates and expire not later than June 30, 2016.
Legal Proceedings
Information, if any, to be disclosed in this section is incorporated herein by reference to Note 11, Commitments and Contingencies, of the Consolidated Financial Statements included in this Annual Report to shareholders.
Description of Capital Structure
Information to be disclosed in this section is incorporated herein by reference to Note 7, Members’ Equity, of the Consolidated Financial Statements included in this Annual Report to shareholders.
Description of Liabilities
The description of liabilities, contingent liabilities and obligations to be disclosed in this section is incorporated herein by reference to Notes 2, 6, 9 and 11 of the Consolidated Financial Statements included in this Annual Report to shareholders.
Management’s Discussion and Analysis of Financial Condition and Results of Operations
“Management’s Discussion and Analysis of Financial Condition and Results of Operations,” which appears in this Annual Report to shareholders and is to be disclosed in this section, is incorporated herein by reference.
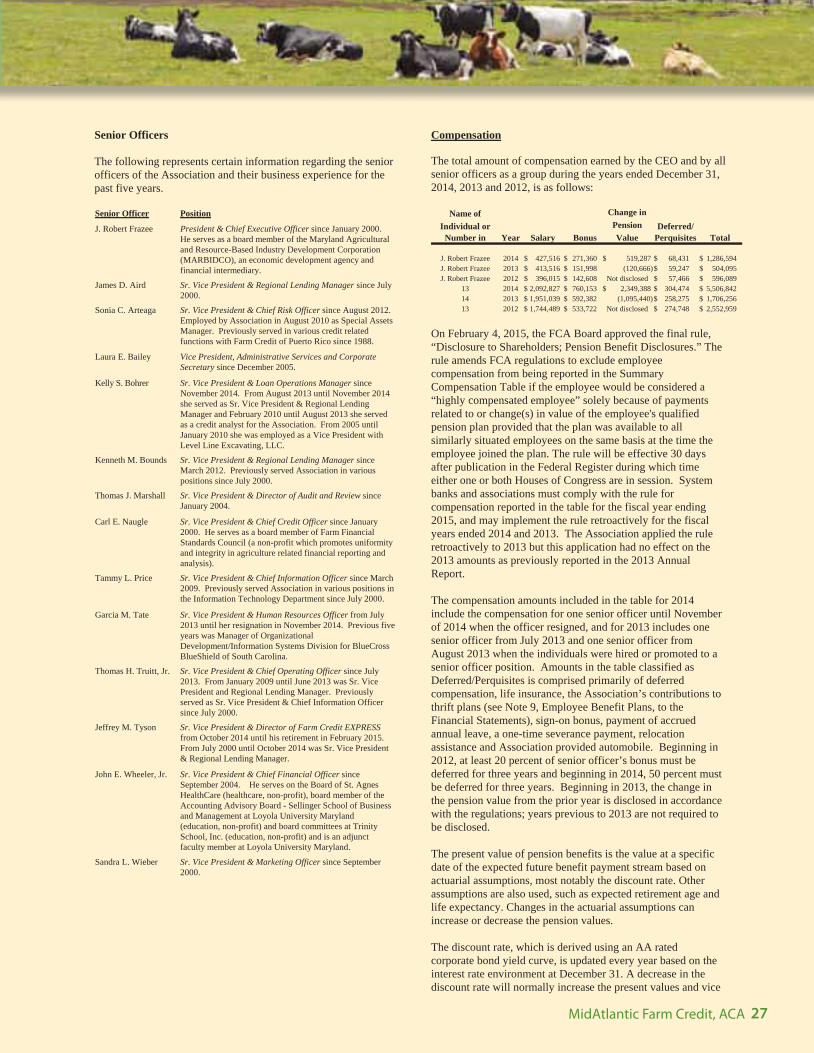
27MidAtlantic Farm Credit, ACA
Senior Officers
The following represents certain information regarding the senior officers of the Association and their business experience for the past five years.
Senior Officer Position
J. Robert Frazee President & Chief Executive Officer since January 2000. He serves as a board member of the Maryland Agricultural and Resource-Based Industry Development Corporation (MARBIDCO), an economic development agency and financial intermediary.
James D. Aird Sr. Vice President & Regional Lending Manager since July 2000.
Sonia C. Arteaga Sr. Vice President & Chief Risk Officer since August 2012. Employed by Association in August 2010 as Special Assets Manager. Previously served in various credit related functions with Farm Credit of Puerto Rico since 1988.
Laura E. Bailey Vice President, Administrative Services and Corporate Secretary since December 2005.
Kelly S. Bohrer Sr. Vice President & Loan Operations Manager since November 2014. From August 2013 until November 2014 she served as Sr. Vice President & Regional Lending Manager and February 2010 until August 2013 she served as a credit analyst for the Association. From 2005 until January 2010 she was employed as a Vice President with Level Line Excavating, LLC.
Kenneth M. Bounds Sr. Vice President & Regional Lending Manager since March 2012. Previously served Association in various positions since July 2000.
Thomas J. Marshall Sr. Vice President & Director of Audit and Review since January 2004.
Carl E. Naugle Sr. Vice President & Chief Credit Officer since January 2000. He serves as a board member of Farm Financial Standards Council (a non-profit which promotes uniformity and integrity in agriculture related financial reporting and analysis).
Tammy L. Price Sr. Vice President & Chief Information Officer since March 2009. Previously served Association in various positions inthe Information Technology Department since July 2000.
Garcia M. Tate Sr. Vice President & Human Resources Officer from July 2013 until her resignation in November 2014. Previous five years was Manager of Organizational Development/Information Systems Division for BlueCross BlueShield of South Carolina.
Thomas H. Truitt, Jr. Sr. Vice President & Chief Operating Officer since July 2013. From January 2009 until June 2013 was Sr. Vice President and Regional Lending Manager. Previously served as Sr. Vice President & Chief Information Officer since July 2000.
Jeffrey M. Tyson Sr. Vice President & Director of Farm Credit EXPRESS from October 2014 until his retirement in February 2015. From July 2000 until October 2014 was Sr. Vice President & Regional Lending Manager.
John E. Wheeler, Jr. Sr. Vice President & Chief Financial Officer since September 2004. He serves on the Board of St. Agnes HealthCare (healthcare, non-profit), board member of the Accounting Advisory Board - Sellinger School of Business and Management at Loyola University Maryland (education, non-profit) and board committees at Trinity School, Inc. (education, non-profit) and is an adjunct faculty member at Loyola University Maryland.
Sandra L. Wieber Sr. Vice President & Marketing Officer since September 2000.
Compensation
The total amount of compensation earned by the CEO and by all senior officers as a group during the years ended December 31, 2014, 2013 and 2012, is as follows:
Name of Change in Individual or Pension Deferred/
Number in Year Salary Bonus Value Perquisites Total
J. Robert Frazee 2014 $ 427,516 $ 271,360 $ 519,287 $ 68,431 $ 1,286,594 J. Robert Frazee 2013 $ 413,516 $ 151,998 (120,666)$ 59,247 $ 504,095 J. Robert Frazee 2012 $ 396,015 $ 142,608 Not disclosed $ 57,466 $ 596,089
13 2014 $ 2,092,827 $ 760,153 $ 2,349,388 $ 304,474 $ 5,506,842 14 2013 $ 1,951,039 $ 592,382 (1,095,440)$ 258,275 $ 1,706,256 13 2012 $ 1,744,489 $ 533,722 Not disclosed $ 274,748 $ 2,552,959
On February 4, 2015, the FCA Board approved the final rule, “Disclosure to Shareholders; Pension Benefit Disclosures.” The rule amends FCA regulations to exclude employee compensation from being reported in the Summary Compensation Table if the employee would be considered a “highly compensated employee” solely because of payments related to or change(s) in value of the employee's qualified pension plan provided that the plan was available to all similarly situated employees on the same basis at the time the employee joined the plan. The rule will be effective 30 days after publication in the Federal Register during which time either one or both Houses of Congress are in session. System banks and associations must comply with the rule for compensation reported in the table for the fiscal year ending 2015, and may implement the rule retroactively for the fiscal years ended 2014 and 2013. The Association applied the rule retroactively to 2013 but this application had no effect on the 2013 amounts as previously reported in the 2013 Annual Report.
The compensation amounts included in the table for 2014 include the compensation for one senior officer until November of 2014 when the officer resigned, and for 2013 includes one senior officer from July 2013 and one senior officer from August 2013 when the individuals were hired or promoted to a senior officer position. Amounts in the table classified as Deferred/Perquisites is comprised primarily of deferred compensation, life insurance, the Association’s contributions to thrift plans (see Note 9, Employee Benefit Plans, to the Financial Statements), sign-on bonus, payment of accrued annual leave, a one-time severance payment, relocation assistance and Association provided automobile. Beginning in 2012, at least 20 percent of senior officer’s bonus must be deferred for three years and beginning in 2014, 50 percent must be deferred for three years. Beginning in 2013, the change in the pension value from the prior year is disclosed in accordance with the regulations; years previous to 2013 are not required to be disclosed.
The present value of pension benefits is the value at a specific date of the expected future benefit payment stream based on actuarial assumptions, most notably the discount rate. Other assumptions are also used, such as expected retirement age and life expectancy. Changes in the actuarial assumptions can increase or decrease the pension values.
The discount rate, which is derived using an AA rated corporate bond yield curve, is updated every year based on the interest rate environment at December 31. A decrease in the discount rate will normally increase the present values and vice
28 MidAtlantic Farm Credit, ACA
Disclosure Required by Farm Credit Administration Regulations
versa. A significant decrease in the discount rate assumption from the prior year caused the pension values to increase at December 31, 2014.
Also at December 31, 2014, the life expectancy actuarial assumption was updated to reflect recent mortality studies indicating longer life expectancy. This change further increased pension values as the benefit payments are forecasted to be made for a longer time span.
In addition to base compensation, the Association offers an incentive plan to all employees. For all employees, credit quality goals, the payment of patronage distributions to the Association’s membership, and Association profit goals established in the incentive plan must be met before anyincentive is paid. Total compensation paid under the plan ranges from 0 to 75 percent of base pay at the end of the plan year for Chief Executive Officer and from 0 to 50 percent for senior officers depending upon the level of responsibility, and for all other employees, cannot exceed 20 percent of an employee’s base salary in effect at the end of the plan year. Established targets are measured at December 31, 2014 so that bonuses can be accrued in the plan year. Payment of accrued bonuses is made by March 15 following the close of the plan year.
Also, all employees are eligible to receive awards (a) based on years of service on five year, or multiple of five year, anniversaries, and (b) based on special or exemplaryperformance as defined in the plan. A copy of these plans isavailable to stockholders upon request.
Disclosure of information on the total compensation paid during 2014 to any senior officer is available to shareholders upon request.
On October 3, 2012, FCA adopted a regulation that requires all System institutions to hold advisory votes on the compensation for all senior officers and/or the CEO when the compensation of either the CEO or the senior officer group increases by 15 percent or more from the previous reporting period. In addition, the regulation requires associations to hold an advisory vote on CEO and/or senior officer compensation when 5 percent of the voting stockholders petition for the vote and to disclose the petition authority in the annual report to shareholders. The regulation became effective December 17, 2012, and the base year for determining whether there is a 15 percent or greater increase was 2013. On March 31, 2014, the FCA published an interim final rule rescinding all requirements for nonbinding advisory votes on senior officer compensation at System banks and associations. The comment period for the interim rule ended on April 30, 2014 and the final rule became effective on June 18, 2014.
Number of Actuarial PresentPension Benefits Years of Value of Payments
Table - 2014 Credited Accumulated During Last Service Benefits ² Fiscal Year
J. Robert Frazee, CEO AgFirst Retirement Plan 33 $ 2,894,718 $ –Supplemental Executive
Retirement Plan 33 $ 1,400,604 –Total $ 4,295,322 $ –
Senior Officers (excluding CEO) ¹
AgFirst Defined Benefit Retirement Plan 29.30 $ 11,932,206 $ –
AgFirst Cash Balance Retirement Plan 8.50 $ 144,558 $ –
Total $ 12,076,764 $ –
¹ The number of officers at December 31, 2014 and reflected in the chart was 12.
² The Present Value of Accumulated Benefits is based upon assumptions and valuation dates that are the same as those used for the valuation of pension liabilities in the 2014 Annual Report, see Note 9, Employee Benefit Plans.
³ Reflects average years of service for the group.
Directors
Directors and senior officers are reimbursed on an actual cost basis for all expenses incurred in the performance of official duties. Such expenses may include transportation, lodging, meals, tips, tolls, parking of cars, laundry, registration fees, and other expenses associated with travel on official business.A copy of the policy is available to shareholders of the Association upon request.
The aggregate amount of reimbursement for travel, subsistence and other related expenses for all directors as a group was $392,676 for 2014, $314,672 for 2013 and $334,638 for 2012. The Association provides computer equipment to the directors to provide for an electronic means of communication. Expenses for the equipment are accounted for in accordance with the Association’s equipment policy.
Subject to approval by the board, directors are compensated for meeting attendance and special assignments. As of December 31, 2014, an honorarium of $550 per day is paid for meetings, committee meetings (reduced to $300 if occurring on the same day as daily honorarium) and special assignments. $200 is paid for telephone conference meetings. Committee chairs receive an additional $100 for each meeting of the Committee.
In addition to the honoraria, as of December 31, 2014, directors are paid a quarterly retainer fee of $1,250 and the chair and vice-chair are paid an additional $650 and $300, respectively.Directors are compensated at a per hour rate of $20 for travel time to Board meetings in excess of one hour. Total compensation paid to directors as a group was $388,440 for 2014.
The following represents certain information regarding Association Directors and their principal occupations during the past five years:
farming with his son, has a 1,800 acre cash grain operation (600 acres owned) producing soybeans, corn, and wheat. He also has a broiler operation of 52,000 replacement pullets. He is owner/president of Amen

29MidAtlantic Farm Credit, ACA
Corner LLC (poultry), president of Twin Oak Farms, Inc. (grain), a partner and vice-president of JWL Enterprises (construction), and a partner in Don’s Seafood Restaurant. During 2014, he served 11 days at Association Board meetings and 48 days in other official activities including the Executive Committee, and was paid $30,245. His term of office is 2011 to 2015. Mr. Lambertson also currently serves on the Board of the Farm Credit Banks Funding Corporation, and served on the Farm Credit Council Board until his term expired on December 31, 2014. Days of service disclosed here for Mr. Lambertson as a member of the MidAtlantic Board do not reflect activities in his capacity as a Board member of the Farm Credit Council or the Farm Credit Banks Funding Corporation. For further information related to specific duties, compensation, and days served for the Funding Corporation, please see the Funding Corporation’s Annual Information Statement at www.farmcreditfunding.com.
Paul D. Baumgardner, Vice Chairman, owns Baumgardner’s Hay and Straw and Baumgardner Farms Landscaping. He is also a beef farmer and farms a total of 750 acres. During 2014, he served 10 days at Association Board meetings and 35 days in other official activities including the Executive Committee (Vice Chairman), Audit & Review Committee, and Governance Committee, and was paid $24,460. His term of office is 2011 to 2016.
Deborah A. Benner along with her husband, owns and operates Yippee Farms, consisting of four dairy facilities with over 975 cows and 950 heifers, and cultivating 700 acres of corn, alfalfa, rye and other grains. She serves as CEO of Yippee LLC, a holding company of Murgolo Books, a publishing subsidiary of the LLC. During 2014, Mrs. Benner served 10 days at Association Board meetings and 21 days in other official activities including the Audit & Review Committee and Governance Committee, and was paid $20,200. Her term of office is 2013 to 2016.
Brian L. Boyd owns and operates a poultry production facility producing 860,000 broilers annually in 4 poultry houses on 55 acres. He owns and operates Boyd's Custom Planting, covering 2,000+ acres per year planting soybeans and small grains. He also is the owner and operator of Brian's Ag Service (renting 10 ag bagger units to local farmers) and owner of Boyd Boys LLC (custom combining and trucking). Within the last 5 years, he was also employed as a feed mill manager. In addition, he is a Board member of Lebanon County Extension, and serves on the South Lebanon Ag Land Preserve Committee. During 2014, Mr. Boyd served 11 days at Association Board meetings and 38 days in other official activities including the Executive Committee and Human Resources Committee (Chairman), and was paid $25,750. His term of office is 2014 to 2018.
Gary L. Grossnickle, is a dairy and crop farmer, and President of Grossnickle Farms, Inc. His operation consists of 1,400 acres (650 owned) in cultivation and 250 cows and 220 replacement heifers. He is also involved in Grossnickle Limited Partnership, a real estate enterprise. During 2014, he served 11 days at Association Board meetings and 25 days in other official activities including the Audit & Review Committee and Human Resources Committee (Vice Chairman), and was paid $20,065. His term of office is 2011 to 2015.
Dale R. Hershey is a senior partner in Hershey Brothers Dairy Farm, managing the real estate and rental property aspects of the family business. Until 2010, he also managed the 300-cow dairy aspect of the business. The operation includes 225 acres of corn, alfalfa, soybeans, rye and barley. During 2014, Mr. Hershey served 11 days at Association Board meetings and 23 days in other official activities including the Human Resources Committee, and was paid $21,010. His term of office is 2011 to 2015. Mr. Hershey also serves on the Farm Credit Council Board of Directors, the AgFirst Farm Credit Bank Board of Directors (Chairman) and the AgFirst District Farm Credit Council Board (Chairman). Days of service disclosed here for Mr. Hershey as a member of the MidAtlantic Board do not reflect activities in his capacity as a Farm Credit Council Board member, or an AgFirst Board or committee member. For further information related to specific duties, compensation, and days served in those positions, please see the AgFirst Farm Credit Bank 2014 Annual Report at www.agfirst.com.
Walter C. Hopkins and his son operate a dairy and grain farm consisting of 600 milk cows, 550 replacement heifers, and 1,000 acres of corn, alfalfa, grass and small grain. He owns and serves as President of Green Acres Farm, Inc. (dairy farm), and is manager of Lyon’s LLC (land holding company). During 2014, he served 11 days at Association Board meetings and 31 days in other official activities, including the Human Resources Committee, and was paid $24,715. His term of office is 2013 to 2017. Mr. Hopkins also serves on the AgFirst Farm Credit Bank Board of Directors and Compensation Committee, the AgFirst District Farm Credit Council Board, the AgFirst District Plan Sponsor Committee, and the AgFirst/Farm Credit Bank of Texas Benefits Committee. For further information related to specific duties, compensation, and days served in those positions, please see the AgFirst Farm Credit Bank 2014 Annual Report at www.agfirst.com.
Anthony M. Ill was appointed as one of the Board’s outside directors effective January 1, 2015. He is a Certified Public Accountant (inactive), principal in Rock Glenn Advisors, LLC a consulting service, consulting in business plan development, financial planning and analysis, and related fields. His other recent professional experience includes Chief Financial and Operating Officer for Ripken Baseball, Inc. and CFO, financial recruiter, operations director, and president with firms including Planit Advertising, Inc., Stephen James Associates, Certis USA, Jewett Machine Manufacturing Company, and Banker Equipment Engineering Company. Since his appointment to the Board in January 2015, he serves on the Human Resources Committee. His term of office is January 1, 2015 through December 31, 2017.
T. Jeffery Jennings operates a farm consisting of 100 head of beef cows, 80 head of stockers, poultry facilities with capacity for 13,000 breeder hens, and 500 acres producing corn, soybeans, barley, hay, pasture, and timber. He serves on the board of the Culpeper Farmers’ Cooperative. During 2014, Mr. Jennings served 10 days at Association Board meetings and 31 days in other official activities, including the Executive Committee and the Audit & Review Committee (Chairman), and was paid $24,410. His term of office is 2011 to 2015.
Christopher J. Kurtzman served as one of the Board’s outside directors and its designated financial expert until his resignation from the Board in August, 2014. He retired from
30 MidAtlantic Farm Credit, ACA
Disclosure Required by Farm Credit Administration Regulations
McCormick & Company, Inc. in 2008 after 32 years of service. Before his employment with McCormick, he worked for Ernst & Ernst on their audit staff. He is a Certified Public Accountant (inactive). During 2014, he served 7 days at Association Board meetings and 16 days in other official activities, including the Audit & Review Committee, and was paid $14,000.
Fred R. Moore, Jr. owns and operates Fred R. Moore & Son, Inc. and Collins Wharf Sod, consisting of a 600-acre turf production and grain operation. In addition, he is a partner in a rental management firm. He also serves on the boards of the Wicomico County Farm Bureau, the Wicomico County Soil Conservation District, and the Wicomico Farm Bureau. During 2014, Mr. Moore served 11 days at Association Board meetings and 17 days in other official activities including the Audit & Review Committee (Vice Chairman), and was paid $17,360. His term of office is 2013 to 2017. He also serves on the Board and the Audit Committee of the AgFirst Farm Credit District Bank and on the AgFirst Farm Credit Council Board. Days of service disclosed here for Mr. Moore as a member of the MidAtlantic Board do not reflect activities in his capacity as a member of the AgFirst Board and committees or the AgFirst Farm Credit Council Board. For further information related to specific duties, compensation, and days served in those positions, please see the AgFirst Farm Credit Bank 2014 Annual Report at www.agfirst.com.
Dale J. Ockels along with his two brothers, operate as a family corporation tilling 4,000 acres of corn, soybeans, and small grains. They also have a 140,000 capacity poultry operation. He serves as President of Ockels’ Farms, Inc., is a partner in Ockels Acres LLC (land holding and farming), and as Treasurer of RCDG (land holding). He also serves on the boards of the Sussex County Farm Bureau, Sussex County Soil Conservation District (Treasurer), Sussex County Land Trust, and on the Delaware Governor’s Council on Agriculture. During 2014, Mr. Ockels served 9 days at Association Board meetings and 43 days in other official activities including the Executive Committee and Governance Committee (Chairman), and was paid $28,260. His term of office is 2011 to 2015.
Jennifer L. Rhodes owns and operates Deerfield Farms LLC, a 110-acre poultry and grain operation with her two sons. The operation consists of a four-house poultry farm producing 500,000 broilers annually and a grain farm producing corn, wheat and soybeans. She is also employed as the Extension Educator for Agriculture and Natural Resources, University of Maryland Extension, Queen Anne’s County, Maryland. She holds leadership positions in the following organizations: Delmarva Poultry Industry, Inc. (Board and Executive Committee member); County Board Member and State Committee Chair (poultry & eggs) for the Farm Bureau; Board member for Queen Anne’s Soil Conservation District; Board member for the non-profit Chesapeake Charities; President of the Maryland Association of County Agricultural Agents; and serves as the Governor’s appointee to represent Farm Credit on the Maryland Agricultural Commission. During 2014, Ms. Rhodes served 10 days at Association Board meetings and 32 days in other official activities including the Executive Committee, Human Resources Committee, and Governance Committee, and was paid $25,180. Her term of office is 2012 to 2016.
Ralph L. Robertson, Jr. is co-owner with his wife of a 325-acre family farm. The operation consists of contract dairy heifers, a cow-calf operation, and grain & hay cultivation. Within the last five years until his retirement on January 31, 2014, he was employed as the Program Manager for the Carroll County (MD) Agricultural Land Preservation Program. He continues to provide services to that Program on a part-time contract basis. He also currently serves as Vice-President of the New Windsor Progressive Farmers. During 2014, Mr. Robertson served 11 days at Association Board meetings and 36 days in other official activities including the Governance Committee (Vice Chairman), and was paid $24,790. His term of office is 2014 to 2018.
Paul J. Rock was one of the Board’s outside directors until his term expired on December 31, 2014, and served as its designated financial expert from August 2014 through December of 2014. He is a Certified Public Accountant and an adjunct professor at McDaniel College in Westminster, MD. He serves on the Board and on the Finance Committee of the MD 4-H Foundation and on the Board and as Treasurer for The Mission of Mercy (medical services non-profit). During 2014, he served 11 days at Association Board meetings and 23 days in other official activities including the Human Resources Committee and the Audit & Review Committee, and was paid $19,165. Mr. Rock also served on the AgFirst Farm Credit Bank District Plan Sponsor Committee. Days of service disclosed for Mr. Rock as a member of the MidAtlantic Board do not reflect activities in his capacity as a member of this committee.
Douglas D. Scott is owner and President of Walnut Hill Farms, Inc., a family-owned and managed cash-grain and vegetable operation consisting of 1,600 acres. He is also employed as a sales representative for Scott’s Seed LLC a seed and agricultural consulting agency, owned by his son. Within the last 5 years, he was previously employed as a County Executive Director with the Talbot County (MD) USDA Farm Service Agency. He left that position to return to the family farm. Mr. Scott currently holds leadership positions in: Venture Farms, Inc. (Secretary), Doug Scott, Inc. (antiques/furniture enterprise, President); Choptank Electric Coop (Board member) and Aero-Energy (Board member). After his election in 2014, he served 8 days at Association Board meetings and 7 days in other official activities including the Audit & Review Committee, and was paid $12,050. His term of office is 2014 to 2018.
Alan N. Siegfried was appointed as one of the Board’s outside directors and its designated financial expert effective January 1, 2015. He is a Certified Public Accountant and currently serves as an adjunct professor at the University of Maryland Smith School of Business. His recent professional experience includes serving as the Director of Internal Audit for the Bank-Fund Staff Federal Credit Union, and as Auditor General for the Inter-American Development Bank. He currently serves on the Board and Audit Compliance Committee of Bon Secours Health System, Inc., and a member of the UNICEF Audit Committee. Since his appointment to the Board in January 2015, he serves on the Audit and Review Committee. His term of office is January 1, 2015 through December 31, 2018.
Joseph D. Snapp is a self-employed farmer and orchardist operating and managing West Oaks Farm, LLC. His farm operation includes 200 acres in fruit production, 600 acres in

31MidAtlantic Farm Credit, ACA
row crops, 20 acres in vegetable and sweet corn production, and cow-calf production of over 400 head. The operation also includes West Oaks Farm Market, a family venture. Mr. Snapp serves as Chairman of the Board of Directors for Southern States in Winchester/Stephens City, VA. During 2014, he served 10 days at Association Board meetings and 24 days in other official activities including the Governance Committee, and was paid $21,230. His term of office is 2013 to 2017.
Lingan T. Spicer is a grain and timber farmer. The grain portion of his business consists of 900 acres producing row crops, and the timber operation consists of 1,000 acres. Before his retirement from the Board in May of 2014, he served 3 days at Association Board meetings and 11 days in other official activities including the Audit & Review Committee and was paid $6,875. His term of office was 2011 to 2014.
Fred N. West, owns and operates a poultry and grain (corn, soybeans, wheat) farm consisting of 2,400 acres (200 owned) and producing 120,000 broilers. He is a partner in F & F Farm LLC (poultry) and Fred West Farms LLC (grain). He also serves on the Board of the Sussex County chapter of the Delaware Farm Bureau. During 2014, he served 11 days at Association Board meetings and 41 days in other official activities including the Executive Committee and the Audit & Review Committee, and was paid $28,675. His term of office is 2014 to 2018.
Transactions with Senior Officers and Directors
The reporting entity’s policies on loans to and transactions with its officers and directors, to be disclosed in this section are incorporated herein by reference to Note 10, Related Party Transactions, of the Consolidated Financial Statements included in this Annual Report to shareholders. There have been no transactions between the Association and senior officers or directors which require reporting per FCA regulations.
Involvement in Certain Legal Proceedings
There were no matters which came to the attention of management or the board of directors regarding involvement of current directors or senior officers in specified legal proceedings which should be disclosed in this section. No directors or senior officers have been involved in any legal proceedings during the last five years which require reporting per FCA regulations.
Relationship with Independent Certified Public Accountants
There were no changes in or material disagreements with our independent certified public accountants on any matter of accounting principles or financial statement disclosure during this period.
For the year ended December 31, 2014, the Association paid fees and expenses of $98,656 for audit services rendered by its independent certified public accountants, PricewaterhouseCoopers LLP.
Consolidated Financial Statements
The consolidated financial statements, together with the report thereon of PricewaterhouseCoopers LLP dated March 11, 2015 and the report of management, which appear in this Annual Report to shareholders are incorporated herein by reference.
Copies of the Association’s Annual and Quarterly reports are available upon request free of charge by calling 1-800-333-7950 or writing John E. Wheeler, Jr., MidAtlantic Farm Credit, ACA, 45 Aileron Court, Westminster, Maryland 21157-3022, or accessing the website, www.mafc.com. The Association prepares an electronic version of the Annual Report which is available on the Association’s web site within 75 days after the end of the fiscal year and distributes the Annual Reports to shareholders within 90 days after the end of the fiscal year. The Association prepares an electronic version of the Quarterly report within 40 days after the end of each fiscal quarter, except that no report need be prepared for the fiscal quarter that coincides with the end of the fiscal year of the institution.
Borrower Information Regulations
Since 1972, Farm Credit Administration (FCA) regulations have required that borrower information be held in strict confidence by Farm Credit System (FCS) institutions, their directors, officers and employees. These regulations provide Farm Credit institutions clear guidelines for protecting their borrowers’ nonpublic personal information.
On November 10, 1999, the FCA Board adopted a policy that requires FCS institutions to formally inform new borrowers at loan closing of the FCA regulations on releasing borrower information and to address this information in the Annual Report to shareholders. The implementation of these measures ensures that new and existing borrowers are aware of the privacy protections afforded them through FCA regulations and Farm Credit System institution efforts.
Credit and Services to Young, Beginning, and Small Farmers and Ranchers and Producers or Harvesters of Aquatic Products
Information to be disclosed in this section is incorporated herein by reference to the similarly named section in the Management's Discussion and Analysis of Financial Condition and Results of Operations section included in this Annual Report to shareholders.
Shareholder Investment
Shareholder investment in the Association may be materially affected by the financial condition and results of operations of AgFirst Farm Credit Bank (Bank or AgFirst). Copies of the Bank’s Annual and Quarterly reports are available upon request free of charge by calling 1-800-845-1745, ext. 2832, or writing Susanne Caughman, AgFirst Farm Credit Bank, P. O. Box 1499, Columbia, SC 29202. Information concerning AgFirst Farm Credit Bank can also be obtained by going to AgFirst’s web site at www.agfirst.com. The Bank prepares an electronic version of the Annual Report, which is available on the website, within 75 days after the end of the fiscal year. The Bank prepares an electronic version of the Quarterly report within 40 days after the end of each fiscal quarter, except that no report needs to be prepared for the fiscal quarter that coincides with the end of the fiscal year of the Bank.
32 MidAtlantic Farm Credit, ACA
Report of the Audit Committee
T. Jeffery Jennings
Chairman of the Audit Committee
Members of Audit Committee
Fred R. Moore, Jr.
Vice Chairman
Deborah A. Benner
Douglas D. Scott
Alan N. Siegfried
Fred N. West
March 11, 2015
The Audit Committee of the Board of Directors (Committee) is comprised of the directors named below. None of the directors whoserve on the Committee is an employee of MidAtlantic Farm Credit (Association) and in the opinion of the Board of Directors, each is free of any relationship with the Association or management that would interfere with the director’s independent judgment on the Committee.
The Committee has adopted a written charter that has been approved by the Board of Directors. The Committee has reviewed and discussed the Association’s audited financial statements with management, which has primary responsibility for the financial statements.
PricewaterhouseCoopers LLP (PwC), the Association’s independent certified public accountants for 2014, is responsible for expressing an opinion on the conformity of the Association’s audited financial statements with accounting principles generally accepted in the United States of America. The Committee has discussed with PwC the matters that are required to be discussed by Statement on Auditing Standards No. 114 (The Auditor's Communication With Those Charged With Governance). PwC has provided to the Committee the written disclosures and the letter required by Independence Standards Board Standard No. 1 (Independence Discussions with Audit Committees), and the Committee has discussed with PwC that firm’s independence.
The Committee has also concluded that PwC’s provision of non-audit services, if any, to the Association is compatible with PwC’s independence.
Based on the considerations referred to above, the Committee recommended to the Board of Directors that the audited financial statements be included in the Association’s Annual Report for 2014. The foregoing report is provided by the following independent directors, who constitute the Committee:
33MidAtlantic Farm Credit, ACA
Report of Independent Certified Public Accountants
March 11, 2015
Report of Independent Certified Public Accountants
To the Board of Directors of MidAtlantic Farm Credit, ACA:
We have audited the accompanying consolidated financial statements of MidAtlantic Farm Credit, ACA and its subsidiaries (the “Association”), which comprise the consolidated balance sheets as of December 31, 2014, 2013 and 2012, and the related consolidated statements of income, of comprehensive income, of changes in members’ equity and of cash flows for the years then ended.
Management's Responsibility for the Consolidated Financial Statements
Management is responsible for the preparation and fair presentation of the consolidated financial statements in accordance with accounting principles generally accepted in the United States of America; this includes the design, implementation, and maintenance of internal control relevant to the preparation and fair presentation of consolidated financial statements that are free from material misstatement, whether due to fraud or error.
Certified Public Accountants’ Responsibility
Our responsibility is to express an opinion on the consolidated financial statements based on our audits. We conducted our audits in accordance with auditing standards generally accepted in the United States of America. Those standards require that we plan and perform the audit to obtain reasonable assurance about whether the consolidated financial statements are free from material misstatement.
An audit involves performing procedures to obtain audit evidence about the amounts and disclosures in the consolidated financial statements. The procedures selected depend on our judgment, including the assessment of the risks of material misstatement of the consolidated financial statements, whether due to fraud or error. In making those risk assessments, we consider internal control relevant to the Association's preparation and fair presentation of the consolidated financial statements in order to design audit procedures that are appropriate in the circumstances, but not for the purpose of expressing an opinion on the effectiveness of the Association's internal control. Accordingly, we express no such opinion. An audit also includes evaluating the appropriateness of accounting policies used and the reasonableness of significant accounting estimates made by management, as well as evaluating the overall presentation of the consolidated financial statements. We believe that the audit evidence we have obtained is sufficient and appropriate to provide a basis for our audit opinion.
Opinion
In our opinion, the consolidated financial statements referred to above present fairly, in all material respects, the financial position of MidAtlantic Farm Credit, ACA and its subsidiaries at December 31, 2014, 2013 and 2012 and the results of their operations and their cash flows for the years then ended in accordance with accounting principles generally accepted in the United States of America.

34 MidAtlantic Farm Credit, ACA
Consolidated Balance Sheets
(dollars in thousands) 2014 2013 2012
AssetsCash 2,615$ 2,540$ 5,984$
Loans 2,276,982 2,197,662 2,144,241Allowance for loan losses (24,954) (23,730) (17,853)
Net loans 2,252,028 2,173,932 2,126,388
Loans held for sale 373 68 465Accrued interest receivable 11,917 11,769 11,772Investments in other Farm Credit institutions 25,079 24,840 26,367Premises and equipment, net 12,220 12,399 12,652Other property owned 844 841 3,009Accounts receivable 35,123 37,339 18,255Other assets 7,609 8,439 8,432
Total assets 2,347,808$ 2,272,167$ 2,213,324$
LiabilitiesNotes payable to AgFirst Farm Credit Bank 1,760,410$ 1,724,627$ 1,714,965$ Accrued interest payable 3,442 3,428 3,427Patronage refunds payable 24,967 13,079 10,642Accounts payable 3,386 5,208 4,193Other liabilities 37,576 36,536 29,216
Total liabilities 1,829,781 1,782,878 1,762,443
Commitments and contingencies
Members' EquityCapital stock and participation certificates 9,743 9,656 9,498Retained earnings Allocated 292,021 271,212 239,421 Unallocated 216,797 208,798 202,563Accumulated other comprehensive income (loss) (534) (377) (601)
Total members' equity 518,027 489,289 450,881
Total liabilities and members' equity 2,347,808$ 2,272,167$ 2,213,324$
December 31,
The accompanying notes are an integral part of these consolidated financial statements.

35MidAtlantic Farm Credit, ACA
Consolidated Statements of Income
The accompanying notes are an integral part of these consolidated financial statements.
(dollars in thousands) 2014 2013 2012
Interest IncomeLoans 107,781$ 108,051$ 111,692$
Interest ExpenseNotes payable to AgFirst Farm Credit Bank 39,946 40,125 44,057
Net interest income 67,835 67,926 67,635Provision for loan losses 125 6,067 9,000
Net interest income after provision for loan losses 67,710 61,859 58,635
Noninterest IncomeLoan fees 1,244 1,400 1,496Fees for financially related services 2,510 1,494 1,825Patronage refunds from other Farm Credit institutions 34,179 38,066 18,890Gains (losses) on sales of rural home loans, net 871 1,184 1,716Gains (losses) on sales of premises and equipment, net 124 128 124Gains (losses) on other transactions 93 299 (411)Insurance Fund refunds — — 3,813Other noninterest income 350 741 599
Total noninterest income 39,371 43,312 28,052
Noninterest ExpenseSalaries and employee benefits 27,646 26,331 24,202Occupancy and equipment 2,365 2,253 2,213Insurance Fund premiums 2,042 1,678 908(Gains) losses on other property owned, net (551) 707 1,129Other operating expenses 7,204 6,103 6,428
Total noninterest expense 38,706 37,072 34,880
Income before income taxes 68,375 68,099 51,807Provision (benefit) for income taxes 1,365 114 129
Net income 67,010$ 67,985$ 51,678$
For the year ended December 31,
(dollars in thousands) 2014 2013 2012
Net income 67,010$ 67,985$ 51,678$
Other comprehensive income net of tax Employee benefit plans adjustments (157) 224 (81)
Comprehensive income 66,853$ 68,209$ 51,597$
For the year ended December 31,
Consolidated Statements of Comprehensive Income

36 MidAtlantic Farm Credit, ACA
Consolidated Statements of Changes in Members’ Equity
Capital AccumulatedStock and Other Total
Participation Comprehensive Members' (dollars in thousands) Certificates Allocated Unallocated Income (Loss) Equity
Balance at December 31, 2011 9,444$ 207,881$ 203,892$ (520)$ 420,697$ Comprehensive income 51,678 (81) 51,597Capital stock/participation certificates issued/(retired), net 54 54Patronage distribution Cash (10,500) (10,500) Qualified allocated retained earnings 2,549 (2,549) — Nonqualified allocated retained earnings 15,474 (15,474) — Nonqualified retained earnings 22,829 (22,829) —Retained earnings retired (11,066) 304 (10,762)Patronage distribution adjustment 1,754 (1,959) (205)
Balance at December 31, 2012 9,498$ 239,421$ 202,563$ (601)$ 450,881$
Comprehensive income 67,985 224 68,209Capital stock/participation certificates issued/(retired), net 158 158Patronage distribution Cash (20,925) (20,925) Nonqualified allocated retained earnings 25,136 (25,136) — Nonqualified retained earnings 25,424 (25,424) —Retained earnings retired (17,077) 370 (16,707)Patronage distribution adjustment (1,692) 9,365 7,673
Balance at December 31, 2013 9,656$ 271,212$ 208,798$ (377)$ 489,289$
Comprehensive income 67,010 (157) 66,853Capital stock/participation certificates issued/(retired), net 87 87Patronage distribution Cash (15,000) (15,000) Nonqualified allocated retained earnings 10,856 (10,856) — Nonqualified retained earnings 34,982 (34,982) —Retained earnings retired (22,939) 148 (22,791)Patronage distribution adjustment (2,090) 1,679 (411)
Balance at December 31, 2014 9,743$ 292,021$ 216,797$ (534)$ 518,027$
Retained Earnings
The accompanying notes are an integral part of these consolidated financial statements.
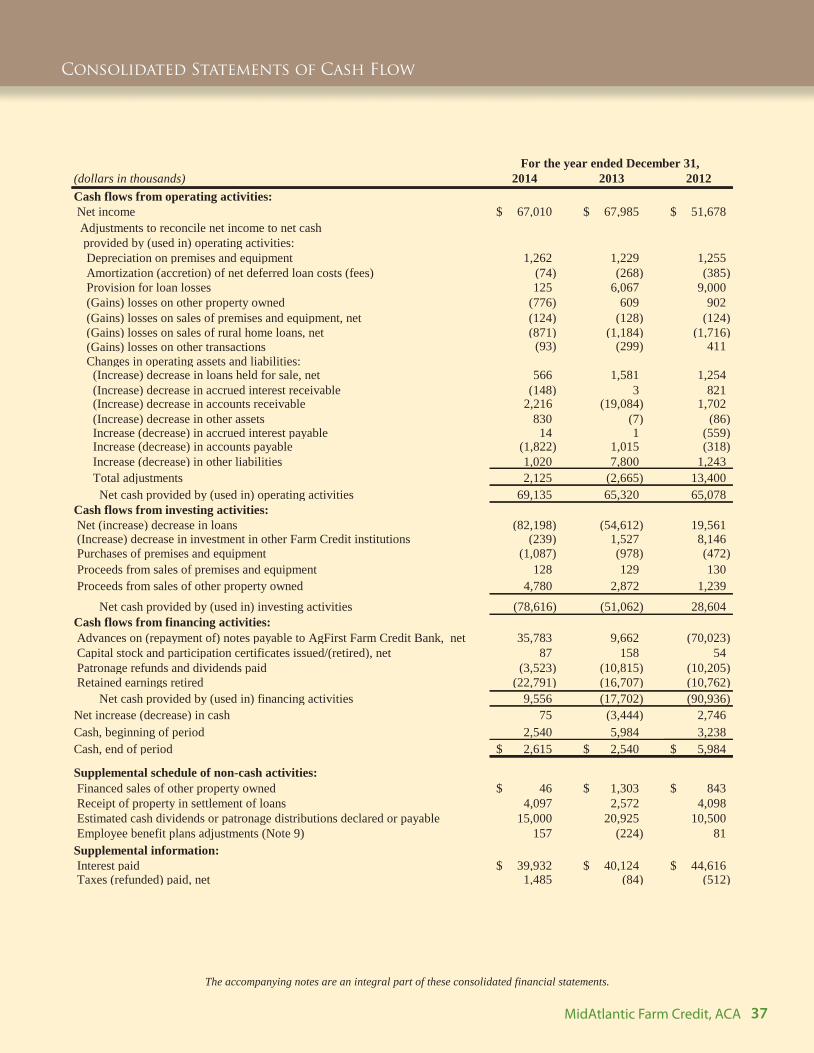
37MidAtlantic Farm Credit, ACA
Consolidated Statements of Cash Flow
(dollars in thousands) 2014 2013 2012Cash flows from operating activities: Net income 67,010$ 67,985$ 51,678$ Adjustments to reconcile net income to net cash provided by (used in) operating activities: Depreciation on premises and equipment 1,262 1,229 1,255 Amortization (accretion) of net deferred loan costs (fees) (74) (268) (385) Provision for loan losses 125 6,067 9,000 (Gains) losses on other property owned (776) 609 902 (Gains) losses on sales of premises and equipment, net (124) (128) (124) (Gains) losses on sales of rural home loans, net (871) (1,184) (1,716) (Gains) losses on other transactions (93) (299) 411 Changes in operating assets and liabilities: (Increase) decrease in loans held for sale, net 566 1,581 1,254 (Increase) decrease in accrued interest receivable (148) 3 821 (Increase) decrease in accounts receivable 2,216 (19,084) 1,702 (Increase) decrease in other assets 830 (7) (86) Increase (decrease) in accrued interest payable 14 1 (559) Increase (decrease) in accounts payable (1,822) 1,015 (318) Increase (decrease) in other liabilities 1,020 7,800 1,243 Total adjustments 2,125 (2,665) 13,400 Net cash provided by (used in) operating activities 69,135 65,320 65,078Cash flows from investing activities: Net (increase) decrease in loans (82,198) (54,612) 19,561 (Increase) decrease in investment in other Farm Credit institutions (239) 1,527 8,146 Purchases of premises and equipment (1,087) (978) (472) Proceeds from sales of premises and equipment 128 129 130 Proceeds from sales of other property owned 4,780 2,872 1,239 Net cash provided by (used in) investing activities (78,616) (51,062) 28,604Cash flows from financing activities: Advances on (repayment of) notes payable to AgFirst Farm Credit Bank, net 35,783 9,662 (70,023) Capital stock and participation certificates issued/(retired), net 87 158 54 Patronage refunds and dividends paid (3,523) (10,815) (10,205) Retained earnings retired (22,791) (16,707) (10,762) Net cash provided by (used in) financing activities 9,556 (17,702) (90,936)Net increase (decrease) in cash 75 (3,444) 2,746Cash, beginning of period 2,540 5,984 3,238Cash, end of period 2,615$ 2,540$ 5,984$
Supplemental schedule of non-cash activities: Financed sales of other property owned 46$ 1,303$ 843$ Receipt of property in settlement of loans 4,097 2,572 4,098 Estimated cash dividends or patronage distributions declared or payable 15,000 20,925 10,500 Employee benefit plans adjustments (Note 9) 157 (224) 81Supplemental information: Interest paid 39,932$ 40,124$ 44,616$ Taxes (refunded) paid, net 1,485 (84) (512)
For the year ended December 31,
The accompanying notes are an integral part of these consolidated financial statements.

38 MidAtlantic Farm Credit, ACA
Notes to the Consolidated Financial Statements (dollars in thousands, except as noted)
Note 1 — Organization and Operations
A. Organization: MidAtlantic Farm Credit, ACA (Association) is a member-owned cooperative that provides credit and credit-related services to borrowers in the counties of Kent, New Castle and Sussex in the state of Delaware; counties of Baltimore, Caroline, Carroll, Cecil, Dorchester, Frederick, Harford, Howard, Kent, Montgomery, Queen Anne’s, Somerset, Talbot, Washington, Wicomico and Worcester in the state of Maryland; counties of Berks, Bucks, Carbon, Chester, Dauphin, Delaware, Lancaster, Lebanon, Lehigh, Monroe, Montgomery, Northampton, Philadelphia, Pike and Schuylkill in the state of Pennsylvania; counties of Accomack, Clarke, Frederick, Northampton, Page, Shenandoah and Warren, in the state of Virginia; and the counties of Berkeley, Jefferson and Morgan, in the state of West Virginia.
The Association is a lending institution in the Farm Credit System (System), a nationwide network of cooperatively owned banks and associations. It was established by Acts of Congress and is subject to the provisions of the Farm Credit Act of 1971, as amended (Farm Credit Act). The System specializes in providing financing and related services to qualified borrowers for agricultural and rural purposes.
The nation is served by three Farm Credit Banks (FCBs) and one Agricultural Credit Bank (ACB), (collectively, the System Banks) each of which has specific lending authorities within its chartered territory. The ACB also has additional specific nationwide lending authorities.
Each System Bank serves one or more Agricultural Credit Associations (ACAs) that originate long-term, short-term and intermediate-term loans, Production Credit Associations (PCAs) that originate and service short- and intermediate-term loans, and/or Federal Land Credit Associations (FLCAs) that originate and service long-term real estate mortgage loans. These associations borrow a majority of the funds for their lending activities from their related bank. System Banks are also responsible for supervising the activities of associations within their districts. AgFirst and its related associations (Associations or District Associations) are collectively referred to as the AgFirst District. The District Associations jointly own all of AgFirst’s voting stock. As of year end, the District consisted of the Bank and nineteen District Associations. All nineteen were structured as ACA holding companies, with PCA and FLCA subsidiaries. FLCAs are tax-exempt while ACAs and PCAs are taxable.
The Farm Credit Administration (FCA) is delegated authority by Congress to regulate the System banks and associations. The FCA examines the activities of the associations and certain actions by the associations are subject to the prior approval of the FCA and the supervising bank.
The Farm Credit Act also established the Farm Credit System Insurance Corporation (Insurance Corporation) to administer the Farm Credit Insurance Fund (Insurance Fund). The Insurance Fund is required to be used (1) to ensure the timely payment of principal and interest on Systemwide debt obligations (Insured Debt), (2) to ensure the retirement of protected borrower capital at par or stated value, and (3) for other specified purposes. The Insurance Fund is also available for discretionary uses by the Insurance Corporation to provide assistance to certain troubled System institutions and to cover the operating expenses of the Insurance Corporation. Each System bank has been required to pay premiums, which may be passed on to the Association, into the Insurance Fund, based on its annual average adjusted outstanding Insured Debt until the assets in the Insurance Fund reach the “secure base amount.” The secure base amount is defined in the Farm Credit Act as 2.0 percent of the aggregate insured obligations (adjusted to reflect the reduced risk on loans or investments guaranteed by federal or state governments) or such other percentage of the aggregate obligations as the Insurance Corporation at its sole discretion determines to be actuarially sound. When the amount in the Insurance Fund exceeds the secure base amount, the Insurance Corporation is required to reduce premiums and may return excess funds above the secure base amount to System institutions. However, it must still ensure that reduced premiums are sufficient to maintain the level of the Insurance Fund at the secure base amount.
B. Operations: The Farm Credit Act sets forth the types of authorized lending activity and financial services that can be offered by the Association, and the persons eligible to borrow.
The Associations borrow from the Bank and in turn may originate and service short- and intermediate-term loans to their members, as well as, long-term real estate mortgage loans.
The Bank primarily lends to the District Associations in the form of a line of credit to fund the Associations’ earning assets. These lines of credit (or Direct Notes) are collateralized by a pledge of substantially all of each Association’s assets. The terms of the Direct Notes are governed by a general financing agreement between the Bank and Association. Each advance is structured such that the principal cash flow, repricing characteristics, and underlying index (if any) of the advance match those of the assets being funded. By match-funding the Association loans, the Associations’ exposure to interest rate risk is minimized.
In addition to providing loan funds, the Bank provides District Associations with banking and support services such as: accounting, human resources, information systems, and marketing. The costs of these support services are included in the interest charges to the Associations, or in
39MidAtlantic Farm Credit, ACA

40 MidAtlantic Farm Credit, ACA
Notes to the Consolidated Financial Statements (dollars in thousands, except as noted)
some cases billed directly to certain Associations that use a specific service.
The Association is authorized to provide, either directly or in participation with other lenders, credit, credit commitments, and related services to eligible borrowers. Eligible borrowers include farmers, ranchers, producers or harvesters of aquatic products, rural residents, and farm-related businesses.
The Association may sell to any System borrowing member, on an optional basis, credit or term life insurance appropriate to protect the loan commitment in the event of death of the debtor(s). The sale of other insurance necessary to protect a member’s farm or aquatic unit is permitted, but limited to hail and multi-peril crop insurance, and insurance necessary to protect the facilities and equipment of aquatic borrowers.
Note 2 — Summary of Significant Accounting Policies
The accounting and reporting policies of the Association conform with accounting principles generally accepted in the United States of America (GAAP) and prevailing practices within the banking industry. The preparation of financial statements in conformity with GAAP requires management to make estimates and assumptions that affect the amounts reported in the Consolidated Financial Statements and accompanying notes. Significant estimates are discussed in these footnotes, as applicable. Actual results may differ from these estimates.
The accompanying consolidated financial statements include the accounts of the ACA, FLCA and the PCA of the Association.
Certain amounts in the prior year financial statements may have been reclassified to conform to the current period presentation. Such reclassifications had no effect on net income or total capital as previously reported.
A. Cash: Cash represents cash on hand and on deposit at banks.
B. Loans and Allowance for Loan Losses: The Association is authorized to make long-term real estate loans with maturities of 5 to 40 years and certain short- and intermediate-term loans for agricultural production or operating purposes with maturities of not more than 10 years.
Loans are carried at their principal amount outstanding adjusted for charge-offs, premiums, discounts, deferred loan fees or costs, and derivative instruments and hedging valuation adjustments, if any. Interest on loans is accrued and credited to interest income based upon the daily principal amount outstanding. The difference in the total investment in a loan and its principal amount may be deferred as part of the carrying amount of the loan and the net difference amortized over the life of the related loan as an adjustment to interest income using the effective interest method.
Impaired loans are loans for which it is probable that all principal and interest will not be collected according to the contractual terms of the loan and are generally considered substandard or doubtful, which is in accordance with the loan rating model, as described below. Impaired loans include nonaccrual loans, restructured loans, and loans past due 90 days or more and still accruing interest. A loan is considered contractually past due when any principal repayment or interest payment required by the loan instrument is not received on or before the due date. A loan remains contractually past due until it is formally restructured or until the entire amount past due, including principal, accrued interest, and penalty interest incurred as the result of past due status, is collected or otherwise discharged in full.
Loans are generally classified as nonaccrual when principal or interest is delinquent for 90 days (unless adequately collateralized and in the process of collection) or circumstances indicate that collection of principal and/or interest is in doubt. When a loan is placed in nonaccrual status, accrued interest deemed uncollectible is reversed (if accrued in the current year) or charged against the allowance for loan losses (if accrued in the prior year).
When loans are in nonaccrual status, the interest portion of payments received in cash is recognized as interest income if collection of the recorded investment in the loan is fully expected and the loan does not have a remaining unrecovered prior charge-off associated with it. Otherwise, loan payments are applied against the recorded investment in the loan. Nonaccrual loans may be returned to accrual status when principal and interest are current, prior charge-offs have been recovered, the ability of the borrower to fulfill the contractual repayment terms is fully expected and the loan is not classified “doubtful” or “loss.”
Loans are charged off, wholly or partially, as appropriate, at the time they are determined to be uncollectible.
In cases where a borrower experiences financial difficulties and the Association makes certain concessions to the borrower such as a modification to the contractual terms of the loan, the loan is classified as a restructured loan. A restructured loan constitutes a troubled debt restructuring if for economic or legal reasons related to the debtor’s financial difficulties the Association grants a concession to the debtor that it would not otherwise consider. If the borrower’s ability to meet the revised payment schedule is uncertain, the loan is classified as a nonaccrual loan.
The allowance for loan losses is maintained at a level considered adequate by management to provide for probable and estimable losses inherent in the loan portfolio as of the report date. The allowance for loan losses is increased through provisions for loan losses and loan recoveries and is decreased through loan charge-offs and allowance reversals. A review of individual loans in each respective portfolio is performed periodically to determine the appropriateness of risk ratings and to ensure loss exposure to the Association has been identified. The allowance for loan losses is a valuation account used to reasonably estimate loan losses as of the financial statement date. Determining the appropriate allowance for loan losses balance involves significant
41MidAtlantic Farm Credit, ACA
judgment about when a loss has been incurred and the amount of that loss.
The Association considers the following factors, among others, when determining the allowance for loan losses:
• Credit risk classifications, • Collateral values, • Risk concentrations, • Weather related conditions, • Current production and economic conditions, and • Prior loan loss experience.
A specific allowance may be established for impaired loans under Financial Accounting Standards Board (FASB) guidance on accounting by creditors for impairment of a loan. Impairment of these loans is measured based on the present value of expected future cash flows discounted at the loan’s effective interest rate, the loan’s observable market price, or fair value of the collateral if the loan is collateral dependent.
A general allowance may also be established under FASB guidance on accounting for contingencies, to reflect estimated probable credit losses incurred in the remainder of the loan portfolio at the financial statement date, which excludes loans included under the specific allowance discussed above. A general allowance can be evaluated on a pool basis for those loans with similar characteristics. The level of the general allowance may be based on management’s best estimate of the likelihood of default adjusted for other relevant factors reflecting the current environment.
The credit risk rating methodology is a key component of the Association’s allowance for loan losses evaluation, and is generally incorporated into the institution’s loan underwriting standards and internal lending limit. The Association uses a two-dimensional loan rating model based on internally generated combined system risk rating guidance that incorporates a 14-point risk rating scale to identify and track the probability of borrower default and a separate scale addressing loss given default over a period of time. Probability of default is the probability that a borrower will experience a default within 12 months from the date of the determination of the risk rating. A default is considered to have occurred if the lender believes the borrower will not be able to pay its obligation in full or the borrower is past due more than 90 days. The loss given default is management’s estimate as to the anticipated economic loss on a specific loan assuming default has occurred or is expected to occur within the next 12 months.
Each of the 14 categories carries a distinct percentage of default probability. The 14-point risk rating scale provides for granularity of the probability of default, especially in the acceptable ratings. There are nine acceptable categories that range from a borrower of the highest quality to a borrower of minimally acceptable quality. The probability of default between 1 and 9 is very narrow and would reflect almost no default to a minimal default percentage. The probability of default grows more rapidly as a loan moves from a “9” to other assets especially mentioned and grows significantly as a loan moves to a substandard (viable) level. A substandard
(non-viable) rating indicates that the probability of default is almost certain.
C. Loans Held for Sale: Loans are classified as held for sale when there is intent to sell the loans within a reasonable period of time. Loans originated and intended for sale are carried at the lower of cost or fair value.
Generally, only home loans that are to be sold on the secondary mortgage market through various lenders are held for sale.
D. Other Property Owned: Other property owned, consisting of real estate, personal property and other assets acquired through a collection action, is recorded upon acquisition at fair value less estimated selling costs. Any initial reduction in the carrying amount of a loan to the fair value of the collateral received is charged to the allowance for loan losses. Revised estimates to the fair value less cost to sell are reported as adjustments to the carrying amount of the asset, provided that such adjusted value is not in excess of the carrying amount at acquisition. Income, expenses, and carrying value adjustments related to other property owned are included in Gains (Losses) from Other Property Owned, Net in the Consolidated Statements of Income.
E. Premises and Equipment: Land is carried at cost. Premises and equipment are carried at cost less accumulated depreciation. Depreciation is provided on the straight-line method over the estimated useful lives of the assets. Gains and losses on dispositions are reflected in current earnings. Maintenance and repairs are charged to expense and improvements are capitalized.
From time to time, assets classified as premises and equipment are transferred to held for sale for various reasons. These assets are carried in Other Assets at the lower of the recorded investment in the asset or fair value less estimated cost to sell based upon the property’s appraised value at the date of transfer. Any write-downs of property held for sale are recorded as other non-interest expense.
F. Investments: The Association may hold investments as described below.
Other InvestmentsAs discussed in Note 8, certain investments, consisting primarily of mutual funds, are held in trust accounts and are reported at fair value. Holding period gains and losses are included within other noninterest income on the consolidated statements of comprehensive income and the balance of these investments, totaling $1,626, is included in Other Assets on the accompanying consolidated balance sheet as of December 31, 2014.
Investment in Other Farm Credit InstitutionsThe Association is required to maintain ownership in the Bank in the form of Class B and Class C stock, as presented on the consolidated balance sheet as Investments in other Farm Credit Institutions. Accounting for this investment is on the cost plus allocated equities basis.
G. Voluntary Advance Conditional Payments: The Association is authorized under the Farm Credit Act to accept advance payments from borrowers. To the extent the
42 MidAtlantic Farm Credit, ACA
Notes to the Consolidated Financial Statements (dollars in thousands, except as noted)
borrower’s access to such advance payments is restricted, the advanced conditional payments are netted against the borrower’s related loan balance. Amounts in excess of the related loan balance and amounts to which the borrower has unrestricted access are presented as Other liabilities in the accompanying Consolidated Balance Sheets. Advanced conditional payments are not insured. Interest is generally paid by the Association on such accounts.
H. Employee Benefit Plans: The Association participates in District and multi-District sponsored benefit plans. These plans include a defined benefit final average pay retirement plan, a defined benefit cash balance retirement plan, a defined benefit other postretirement benefits plan, and a defined contribution 401(k) plan.
Multi-Employer Defined Benefit Plans Substantially all employees may participate in either the AgFirst Farm Credit Retirement Plan or the AgFirst Farm Credit Cash Balance Retirement Plan (collectively referred to as the “Plans”), which are defined benefit plans and considered multi-employer under Financial Accounting Standards Board (FASB) accounting guidance. The Plans are noncontributory and include eligible Association and District employees. The “Projected Unit Credit” actuarial method is used for financial reporting purposes. The actuarially-determined costs of the Plans are allocated to each participating entity by multiplying the Plans’ net pension expense by each institution’s eligible service cost and accumulated benefit obligation as a percentage of the total eligible service cost and total accumulated benefit obligation for all Plan participants. The cumulative excess of amounts funded by the Association over the cost allocated to the Association is reflected as prepaid retirement expense, a component of Other assets in the Association’s Consolidated Balance Sheets.
In addition to pension benefits, the Association provides certain health care and life insurance benefits for retired employees (other postretirement benefits) through a multi-District sponsored retiree healthcare plan. Substantially all employees are eligible for those benefits when they reach early retirement age while working for the Association. Certain charges related to this plan are an allocation of District charges based on the Association’s proportional share of the plan liability. Authoritative accounting guidance requires the accrual of the expected cost of providing these benefits to an employee, their beneficiaries and covered dependents during the years the employee renders service necessary to become eligible for benefits. The cumulative excess of cost allocated to the Association over the amounts funded by the Association is reflected as postretirement benefits other than pensions, a component of Other liabilities in the Association’s Consolidated Balance Sheets.
Since the foregoing plans are multi-employer, the Association does not apply the provisions of FASB guidance on employers’ accounting for defined benefit pension and other postretirement plans in its stand-alone financial statements. Rather, the effects of this guidance are reflected in the Combined Financial Statements of AgFirst Farm Credit Bank and District Associations.
Additional information for the above may be found in Note 9 of this Report and the Notes to the Combined Financial Statements of AgFirst Farm Credit Bank and District Associations’ Annual Report.
Single Employer Defined Benefit Plans The Association also sponsors a single employer defined benefit supplemental retirement plan and offers a Farm Credit Benefits Alliance Supplemental 401(k) Plan for certain key employees. These plans are nonqualified; therefore, the associated liabilities are included in the Association’s Consolidated Balance Sheets in Other liabilities.
The foregoing defined benefit plan is considered single employer, therefore the Association applies the provisions of FASB guidance on employers’ accounting for defined benefit pension and other postretirement plans in its stand-alone financial statements. See Note 9 for additional information.
Defined Contribution Plans Substantially all employees are eligible to participate in the defined contribution FCBA 401(k) Plan, subsequently referred to as the 401(k) Plan, which qualifies as a 401(k) plan as defined by the Internal Revenue Code. Employee deferrals are not to exceed the maximum deferral as determined and adjusted by the Internal Revenue Service. Company contributions to the 401(k) Plan are expensed as funded.
Additional information for the above may be found in Note 9 of this Report and the Notes to the Combined Financial Statements of AgFirst Farm Credit Bank and District Associations’ Annual Report.
I. Income Taxes: The Association evaluates tax positions taken in previous and current years according to FASB guidance. A tax position can result in a permanent reduction of income taxes payable, a deferral of income taxes otherwise currently payable to future years, or a change in the expected realizability of deferred tax assets. The term tax position also encompasses, but is not limited to, an entity’s status, including its status as a pass-through entity or tax-exempt entity.
The Association is generally subject to Federal and certain other income taxes. As previously described, the ACA holding company has two wholly-owned subsidiaries, a PCA and a FLCA. The FLCA subsidiary is exempt from federal and state income taxes as provided in the Farm Credit Act. The ACA holding company and the PCA subsidiary are subject to federal, state, and certain other income taxes.
The Association is eligible to operate as a cooperative that qualifies for tax treatment under Subchapter T of the Internal Revenue Code. Accordingly, under specified conditions, the Association can exclude from taxable income amounts distributed as qualified patronage refunds in the form of cash, stock, or allocated surplus. Provisions for income taxes are made only on those taxable earnings that will not be distributed as qualified patronage refunds. The Association distributes patronage on the basis of book income.

43MidAtlantic Farm Credit, ACA
The Association accounts for income taxes under the asset and liability method, recognizing deferred tax assets and liabilities for the expected future tax consequences of the temporary differences between the carrying amounts and tax bases of assets and liabilities. Deferred tax assets and liabilities are measured using enacted tax rates expected to apply to taxable income in the years in which those temporary differences are expected to be realized or settled.
The Association records a valuation allowance at the balance sheet dates against that portion of the Association’s deferred tax assets that, based on management’s best estimates of future events and circumstances, more likely than not (a likelihood of more than 50 percent) will not be realized. The consideration of valuation allowances involves various estimates and assumptions as to future taxable earnings, including the effects of our expected patronage program, which reduces taxable earnings.
J. Due from AgFirst Farm Credit Bank: The Association records patronage refunds from the Bank and certain District associations on an accrual basis.
K. Valuation Methodologies: FASB guidance defines fair value as the exchange price that would be received for an asset or paid to transfer a liability in an orderly transaction between market participants in the principal or most advantageous market for the asset or liability. This guidance also establishes a fair value hierarchy, which requires an entity to maximize the use of observable inputs and minimize the use of unobservable inputs when measuring fair value. It prescribes three levels of inputs that may be used to measure fair value.
Level 1 inputs to the valuation methodology are unadjusted quoted prices for identical assets or liabilities in active markets.
Level 2 inputs to the valuation methodology include quoted prices for similar assets and liabilities in active markets; quoted prices in markets that are not active; and inputs that are observable, or can be corroborated, for substantially the full term of the asset or liability.
Level 3 inputs to the valuation methodology are unobservable and supported by little or no market activity. Valuation is determined using pricing models, discounted cash flow methodologies, or similar techniques, and could include significant management judgment or estimation. Level 3 assets and liabilities also could include instruments whose price has been adjusted based on dealer quoted pricing that is different than a third-party valuation or internal model pricing.
The Association may use the Bank, internal resources or third parties to obtain fair value prices. Quoted market prices are generally used when estimating fair values of any assets or liabilities for which observable, active markets exist.
A number of methodologies may be employed to value items for which an observable active market does not exist. Examples of these items include: impaired loans, other property owned, and certain derivatives, investment securities and other financial instruments. Inputs to these valuations can
involve estimates and assumptions that require a substantial degree of judgment. Some of the assumptions used include, among others, discount rates, rates of return on assets, repayment rates, cash flows, default rates, costs of servicing, and liquidation values. The use of different assumptions could produce significantly different asset or liability values, which could have material positive or negative effects on results of operations.
Please see further discussion in Note 8.
L. Off-Balance-Sheet Credit Exposures: The credit risk associated with commitments to extend credit and letters of credit is essentially the same as that involved with extending loans to customers and is subject to normal credit policies. Collateral may be obtained based on management’s assessment of the customer’s creditworthiness. To the extent the risk can be quantified, a reserve is established.
Commitments to extend credit are agreements to lend to customers, generally having fixed expiration dates or other termination clauses that may require payment of a fee.
Letters of credit are commitments issued to guarantee the performance of a customer to a third party. These letters of credit are issued to facilitate commerce and typically result in the commitment being funded when the underlying transaction is consummated between the customer and third party.
M. Accounting Standards Updates (ASUs): In January, 2015, the FASB issued ASU 2015-01, Income Statement—Extraordinary and Unusual Items (Subtopic 225-20): Simplifying Income Statement Presentation by Eliminating the Concept of Extraordinary Items. The Update eliminates the concept of extraordinary items. Currently, if an event or transaction meets the criteria for extraordinary classification, an entity is required to segregate the extraordinary item from the results of ordinary operations and show the item separately in the income statement, net of tax, after income from continuing operations. The entity also is required to disclose applicable income taxes and either present or disclose earnings-per-share data applicable to the extraordinary item. The presentation and disclosure guidance for items that are unusual in nature or occur infrequently will be retained and will be expanded to include items that are both unusual in nature and infrequently occurring. The amendments are effective for fiscal years, and interim periods within those fiscal years, beginning after December 15, 2015. A reporting entity may apply the amendments prospectively or retrospectively to all prior periods presented in the financial statements. Early adoption is permitted provided that the guidance is applied from the beginning of the fiscal year of adoption. The effective date is the same for both public business entities and all other entities. It is expected that adoption will not have a material impact on the Association's financial condition or results of operations.
In November, 2014, the FASB issued ASU 2014-16, Derivatives and Hedging (Topic 815): Determining Whether the Host Contract in a Hybrid Financial Instrument Issued in the Form of a Share Is More Akin to Debt or to Equity. Under GAAP, features such as conversion rights, redemption rights, dividend payment
44 MidAtlantic Farm Credit, ACA
Notes to the Consolidated Financial Statements (dollars in thousands, except as noted)
preferences, and others that are included in instruments issued in the form of shares may qualify as derivatives. If so, the shares issued are considered hybrid financial instruments. To determine the proper accounting for hybrid financial instruments, investors and issuers in the instruments must determine whether the nature of the host contract containing the feature is more akin to debt or equity as well as whether the economic characteristics and risks of the embedded derivative feature are clearly and closely related to the host contract. The purpose of the update is to eliminate diversity in accounting for hybrid financial instruments by both issuers and investors. When evaluating the host contract to determine whether it is more akin to debt or equity, the reporting entity should consider all relevant terms and features of the contract, including the embedded derivative feature that is being evaluated for separation. The amendments in this Update are effective for public business entities for fiscal years, and interim periods within those fiscal years, beginning after December 15, 2015. For all other entities, the amendments in this Update are effective for fiscal years beginning after December 15, 2015, and interim periods within fiscal years beginning after December 15, 2016. Early adoption, including adoption in an interim period, is permitted. It is expected that adoption will not have a material impact on the Association's financial condition or results of operation.
In August, 2014 the FASB issued ASU 2014-15, Presentation of Financial Statements—Going Concern (Subtopic 205-40): Disclosure of Uncertainties about an Entity’s Ability to Continue as a Going Concern. The Update is intended to define management’s responsibility to evaluate whether there is substantial doubt about an organization’s ability to continue as a going concern and to provide related footnote disclosures. Under Generally Accepted Accounting Principles (GAAP), financial statements are prepared under the presumption that the reporting organization will continue to operate as a going concern, except in limited circumstances. Financial reporting under this presumption is commonly referred to as the going concern basis of accounting. The going concern basis of accounting is critical to financial reporting because it establishes the fundamental basis for measuring and classifying assets and liabilities. Currently, GAAP lacks guidance about management’s responsibility to evaluate whether there is substantial doubt about the organization’s ability to continue as a going concern or to provide related footnote disclosures. The Update provides guidance to an organization’s management, with principles and definitions that are intended to reduce diversity in the timing and content of disclosures that are commonly provided by organizations today in the financial statement footnotes. The amendments in this Update apply to all companies and not-for-profit organizations and become effective in the annual period ending after December 15, 2016, with early application permitted. It is expected that adoption will not have a material impact on the Association's financial condition or results of operations.
In August, 2014, the FASB issued ASU 2014-14, Receivables—Troubled Debt Restructurings by Creditors (Subtopic 310-40): Classification of Certain Government-Guaranteed Mortgage Loans upon Foreclosure. Currently, there is diversity in practice related to how creditors classify government-guaranteed mortgage loans, including
FHA or VA guaranteed loans, upon foreclosure. The amendments in this Update require that a mortgage loan be derecognized and that a separate other receivable be recognized upon foreclosure if the following conditions are met: 1. The loan has a government guarantee that is not separable from the loan before foreclosure; 2. At the time of foreclosure, the creditor has the intent to convey the real estate property to the guarantor and make a claim on the guarantee, and the creditor has the ability to recover under that claim; 3. At the time of foreclosure, any amount of the claim that is determined on the basis of the fair value of the real estate is fixed. Upon foreclosure, the separate other receivable should be measured based on the amount of the loan balance (principal and interest) expected to be recovered from the guarantor. The amendments in this Update are effective for public business entities for annual periods, and interim periods within those annual periods, beginning after December 15, 2014. For all other entities, the amendments in this Update are effective for annual periods ending after December 15, 2015, and interim periods beginning after December 15, 2015. It is expected that adoption will not have a material impact on the Association's financial condition or results of operations.
In June, 2014, the FASB issued ASU 2014-11, Transfers and Servicing (Topic 860): Repurchase-to-Maturity Transactions, Repurchase Financings, and Disclosures, which changes the accounting for repurchase-to-maturity transactions and repurchase financing arrangements. It also requires enhanced disclosures about repurchase agreements and other similar transactions. The new guidance aligns the accounting for repurchase-to-maturity transactions and repurchase agreements executed as a repurchase financing with the accounting for other typical repurchase agreements such that, these transactions would all be accounted for as secured borrowings. The accounting changes in this Update are effective for public companies for the first interim or annual period beginning after December 15, 2014. In addition, for public companies, the disclosure for certain transactions accounted for as a sale is effective for the first interim or annual period beginning on or after December 15, 2014, and the disclosure for transactions accounted for as secured borrowings is required to be presented for annual periods beginning after December 15, 2014, and interim periods beginning after March 15, 2015. For all other entities, all changes are effective for annual periods beginning after December 15, 2014, and interim periods beginning after December 15, 2015. Earlier application for a public company is prohibited, but all other companies and organizations may elect to apply the requirements for interim periods beginning after December 15, 2014. It is expected that adoption will not have a material impact on the Association's financial condition or results of operations, but may result in additional disclosures.
In May 2014, the FASB, responsible for U.S. Generally Accepted Accounting Principles (U.S. GAAP), and the International Accounting Standards Board (IASB), responsible for International Financial Reporting Standards (IFRS), jointly issued converged standards on the recognition of revenue from contracts with customers. Accounting Standards Update (ASU) 2014-09, “Revenue from Contracts with Customers (Topic 606)” and IFRS 15 “Revenue from Contracts with Customers” are intended to
45MidAtlantic Farm Credit, ACA
improve the financial reporting of revenue and comparability of the top line in financial statements globally and supersede substantially all previous revenue recognition guidance. The core principle of the new standards is for companies to recognize revenue to depict the transfer of goods or services to customers in amounts that reflect the consideration (that is, payment) to which the company expects to be entitled in exchange for those goods or services. The new standard also will result in enhanced disclosures about revenue, provide guidance for transactions that were not previously addressed comprehensively (for example, service revenue and contract modifications) and improve guidance for multiple-element arrangements. Because of the pervasive nature of the new guidance, the boards have established a joint transition resource group in order to aid transition to the new standard. For public entities reporting under U.S. GAAP, the amendments in the Update are effective for annual reporting periods beginning after December 15, 2016, including interim periods within that reporting period. Early application is not permitted. For nonpublic entities, the amendments are effective for annual reporting periods beginning after December 15, 2017, and interim periods within annual periods beginning after December 15, 2018. A nonpublic entity may elect to adopt this guidance earlier under certain circumstances. The amendments are to be applied retrospectively. The Association has identified ancillary revenues that will be subject to this guidance. However, because financial instruments are not within the scope of the guidance, it is expected that adoption will not have a material impact on the Association's financial condition or results of operations, but may result in additional disclosures.
In April, 2014, the FASB issued ASU 2014-08, Presentation of Financial Statements (Topic 205) and Property, Plant, and Equipment (Topic 360): Reporting Discontinued Operations and Disclosures of Disposals of Components of an Entity. The amendments in this Update change the requirements for reporting discontinued operations in Subtopic 205-20. A discontinued operation may include a component of an entity or a group of components of an entity, or a business or nonprofit activity. A disposal of a component of an entity or a group of components of an entity is required to be reported in discontinued operations only if the disposal represents a strategic shift that has (or will have) a major effect on an entity’s operations and financial results. A public business entity and a not-for-profit entity that has issued, or is a conduit bond obligor for, securities that are traded, listed, or quoted on an exchange or an over-the-counter market should apply the amendments in this Update prospectively to both of the following: 1. All disposals (or classifications as held for sale) of components of an entity that occur within annual periods beginning on or after December 15, 2014, and interim periods within those years, and 2. All businesses or nonprofit activities that, on acquisition, are classified as held for sale that occur within annual periods beginning on or after December 15, 2014, and interim periods within those years. It is expected that adoption will not have a material impact on the Association's financial condition or results of operations.
In March 2014, the FASB issued ASU 2014-06, “Technical Corrections and Improvements Related to Glossary Terms
(Master Glossary).” The amendments in this Update relate to glossary terms, cover a wide range of Topics in the Codification and are presented in four sections: Deletion of Master Glossary Terms, Addition of Master Glossary Term Links, Duplicate Master Glossary Terms, and Other Technical Corrections Related to Glossary Terms. These amendments did not have transition guidance and were effective upon issuance for both public entities and nonpublic entities.
In January 2014, the FASB issued ASU 2014-04, “Receivables—Troubled Debt Restructurings by Creditors (Subtopic 310-40): Reclassification of Residential Real Estate Collateralized Consumer Mortgage Loans upon Foreclosure.” The objective of the amendments in this Update is to reduce diversity by clarifying when an in substance repossession or foreclosure occurs, that is, when a creditor should be considered to have received physical possession of residential real estate property collateralizing a consumer mortgage loan such that the loan receivable should be derecognized and the real estate property recognized. The amendments are effective for public business entities for annual periods, and interim periods within those annual periods, beginning after December 15, 2014. For entities other than public business entities, the amendments in this Update are effective for annual periods beginning after December 15, 2014, and interim periods within annual periods beginning after December 15, 2015. An entity can elect to adopt the amendments in this Update using either a modified retrospective transition method or a prospective transition method. Early adoption is permitted. It is expected that adoption will not have a material impact on the Association's financial condition or results of operations, but may result in additional disclosures.
Note 3 — Loans and Allowance for Loan Losses
For a description of the Association’s accounting for loans, including impaired loans, and the allowance for loan losses, see Note 2 subsection B above.
Credit risk arises from the potential inability of an obligor to meet its repayment obligation which exists in outstanding loans. The Association manages credit risk associated with lending activities through an assessment of the credit risk profile of an individual obligor. The Association sets its own underwriting standards and lending policies that provide direction to loan officers and are approved by the board of directors.
The credit risk management process begins with an analysis of the obligor’s credit history, repayment capacity and financial position. Repayment capacity focuses on the obligor’s ability to repay the obligation based on cash flows from operations or other sources of income, including non-farm income. Real estate mortgage loans must be secured by first liens on the real estate collateral. As required by FCA regulations, each institution that makes loans on a secured basis must have collateral evaluation policies and procedures.
The credit risk rating process for loans uses a two-dimensional structure, incorporating a 14-point probability of default scale (see further discussion in Note 2 subsection B above) and a separate scale addressing estimated percentage loss in the event of default. The loan rating structure incorporates borrower risk
46 MidAtlantic Farm Credit, ACA
Notes to the Consolidated Financial Statements (dollars in thousands, except as noted)
and transaction risk. Borrower risk is the risk of loss driven by factors intrinsic to the borrower. The transaction risk or facility risk is related to the structure of a credit (tenor, terms, and collateral).
The Association’s loan portfolio, which includes purchased interests in loans, has been segmented by the following loan types as defined by the FCA:
Real estate mortgage loans — generally to purchase farm real estate, refinance existing mortgages, construct various facilities used in agricultural operations, or purchase other rural residential/lifestyle real estate for both full-time and part-time farmers. In addition, credit for other agricultural purposes and family needs is available to full-time and part-time farmers. Real estate mortgage loans generally have maturities ranging from five to thirty years and must be secured by first liens on the real estate. These loans may be made only in amounts up to 85 percent of the appraised value of the property taken as security or up to 97 percent of the appraised value if guaranteed by a federal, state, or other governmental agency. The actual percentage of loan-to-appraised value when loans are made is generally lower than the statutory required percentage.
Production and intermediate-term loans — for operating funds, equipment and other purposes. Eligible financing needs include operating inputs (such as labor, feed, fertilizer, and repairs), livestock, family living expenses, income taxes, debt payments on machinery or equipment, and other business-related expenses. Production loans may be made on a secured or unsecured basis and are most often made for a period of time that matches the borrower’s normal production and marketing cycle, which is typically less than 12 months. Intermediate-term loans typically finance depreciable capital assets of a farm or ranch. Examples of the uses of intermediate-term loans are to purchase or refinance farm machinery, vehicles, equipment, breeding livestock, or farm buildings, to make improvements, or to provide working capital. Intermediate-term loans are made for a specific term, generally 10 years or less. These loans may be made on a secured or unsecured basis, but are normally secured.
Loans to cooperatives — loans for any cooperative purpose other than for communication, energy, and water and waste disposal.
Processing and marketing loans — for operations to process or market the products produced by a farmer, rancher, or producer or harvester of aquatic products, or by a cooperative.
Farm-related business loans — loans to eligible borrowers that furnish certain farm-related business services to farmers or ranchers that are directly related to their agricultural production.
Rural residential real estate loans — to purchase a single-family dwelling that will be the primary residence in open country, which may include a town or village that has a population of not more than 2,500 persons. In addition, the loan may be to remodel, improve, or repair a rural home, or to refinance existing debt. These loans must be secured by a first lien on the property, except that it may be secured by a second lien if the institution also holds the first lien on the property.
Communication loans — primarily to finance rural communication companies.
Energy loans — primarily to finance electric generation, transmission and distribution systems serving rural areas.
Water and waste disposal loans — primarily to finance water and waste disposal systems serving rural areas.
International loans — primarily loans or credit enhancements to other banks to support the export of U.S. agricultural commodities or supplies. The federal government guarantees a substantial portion of these loans.
Lease receivables — the net investment for all finance leases (such as direct financing leases, leveraged leases, and sales-type leases) where the Association is the lessor.
Other (including Mission Related) — In addition to making loans to accomplish the System’s Congressionally mandated mission to finance agriculture and rural America, the Association may make investments in rural America to address the diverse needs of agriculture and rural communities across the country. The FCA approves these investments on a program or a case-by-case basis. Examples of investment programs that the FCA will consider include partnerships with agricultural and rural community lenders, investments in rural economic development and infrastructure, and investments in obligations and mortgage securities that increase the availability of affordable housing in rural America.

47MidAtlantic Farm Credit, ACA
A summary of loans outstanding at period end follows:
December 31, 2014 2013 2012
Real estate mortgage $ 1,345,426 $ 1,297,403 $ 1,214,157 Production and intermediate-term 749,249 732,767 779,114 Loans to cooperatives 1,457 38 5,600 Processing and marketing 47,803 41,127 24,709 Farm-related business 64,004 60,095 61,566 Communication 35,747 34,208 24,748 Energy and water/waste disposal 4,677 3,539 5,425 Rural residential real estate 28,619 28,485 28,922
Total Loans $ 2,276,982 $ 2,197,662 $ 2,144,241
A substantial portion of the Association’s lending activities is collateralized and the Association’s exposure to credit loss associated with lending activities is reduced accordingly.
The amount of collateral obtained, if deemed necessary upon extension of credit, is based on management’s credit evaluation of the borrower. Collateral held varies, but typically includes farmland and income-producing property, such as crops and livestock, as well as receivables. Long-term real estate loans are collateralized by the first liens on the underlying real property. Federal regulations state that long-term real estate loans are not to exceed 85 percent (97 percent, if guaranteed by a government agency) of the property’s appraised value. However, a decline in a property’s market value subsequent to loan origination or advances, or other actions necessary to protect the financial interest of the Association in the collateral, may result in loan to value ratios in excess of the regulatory maximum.
The Association may purchase or sell participation interests with other parties in order to diversify risk, manage loan volume, and comply with FCA regulations. The following tables present the principal balance of participation loans at periods ended:
December 31, 2014 Within AgFirst District Within Farm Credit System Outside Farm Credit System Total
Participations Purchased
Participations Sold
Participations Purchased
Participations Sold
Participations Purchased
Participations Sold
Participations Purchased
Participations Sold
Real estate mortgage $ 10,587 $ 300 $ – $ – $ – $ – $ 10,587 $ 300 Production and intermediate-term 32,406 39,802 13,529 17,579 32,176 – 78,111 57,381 Loans to cooperatives – – 1,470 – – – 1,470 – Processing and marketing 30,258 – 6,551 – 8,203 – 45,012 – Farm-related business – – 23,497 – 2,844 – 26,341 – Communication – – 35,814 – – – 35,814 – Energy and water/waste disposal – – 4,684 – – – 4,684 – Total $ 73,251 $ 40,102 $ 85,545 $ 17,579 $ 43,223 $ – $ 202,019 $ 57,681
December 31, 2013 Within AgFirst District Within Farm Credit System Outside Farm Credit System Total
Participations Purchased
Participations Sold
Participations Purchased
Participations Sold
Participations Purchased
Participations Sold
Participations Purchased
Participations Sold
Real estate mortgage $ 11,077 $ 900 $ – $ – $ – $ – $ 11,077 $ 900 Production and intermediate-term 48,817 62,364 4,172 22,130 39,316 – 92,305 84,494 Loans to cooperatives – – 52 – – – 52 – Processing and marketing 21,123 – 6,078 – 9,418 – 36,619 – Farm-related business 3,162 – 23,657 – 3,036 – 29,855 – Communication – – 34,284 – – – 34,284 – Energy and water/waste disposal – – 3,547 – – – 3,547 – Total $ 84,179 $ 63,264 $ 71,790 $ 22,130 $ 51,770 $ – $ 207,739 $ 85,394
December 31, 2012 Within AgFirst District Within Farm Credit System Outside Farm Credit System Total
Participations Purchased
Participations Sold
Participations Purchased
Participations Sold
Participations Purchased
Participations Sold
Participations Purchased
Participations Sold
Real estate mortgage $ – $ 4,402 $ – $ – $ – $ – $ – $ 4,402 Production and intermediate-term 50,655 87,735 13,104 27,281 52,789 – 116,548 115,016 Loans to cooperatives 3,703 – 1,902 – – – 5,605 – Processing and marketing 4,170 – 1,706 – – – 5,876 – Farm-related business 801 – 29,401 – 3,222 – 33,424 – Communication – – 24,802 – – – 24,802 – Energy and water/waste disposal – – 5,413 – – – 5,413 – Total $ 59,329 $ 92,137 $ 76,328 $ 27,281 $ 56,011 $ – $ 191,668 $ 119,418
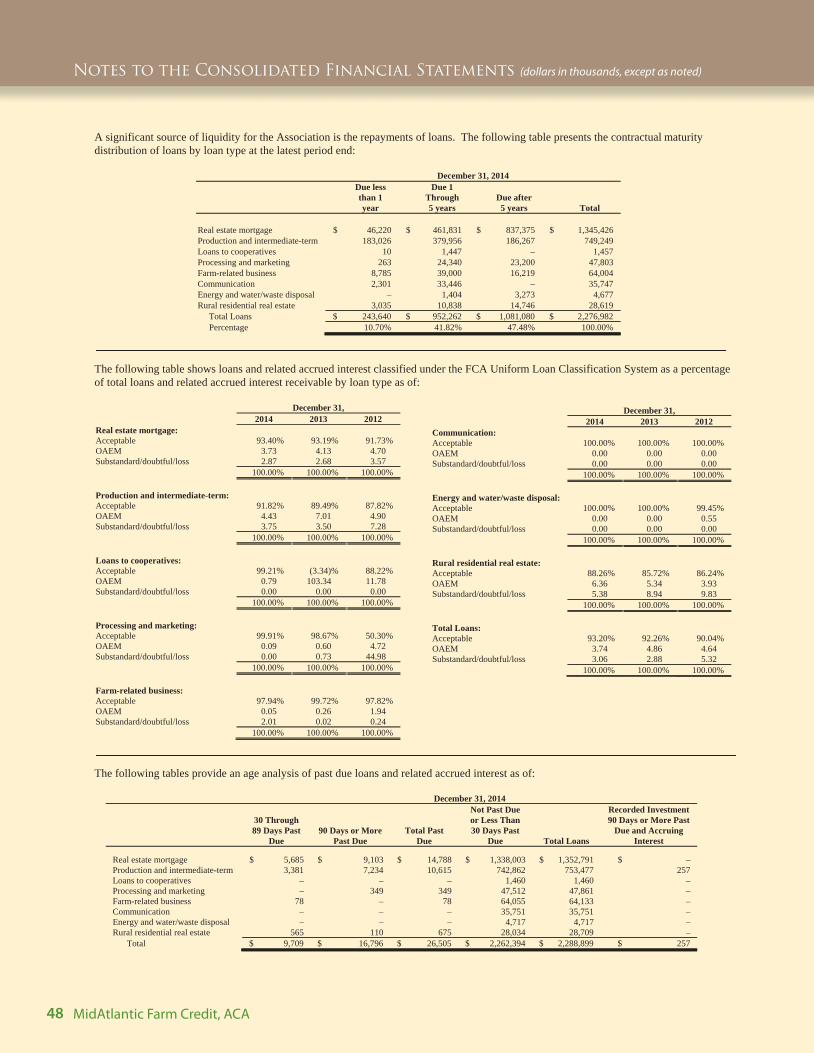
48 MidAtlantic Farm Credit, ACA
Notes to the Consolidated Financial Statements (dollars in thousands, except as noted)
A significant source of liquidity for the Association is the repayments of loans. The following table presents the contractual maturity distribution of loans by loan type at the latest period end:
December 31, 2014 Due less than 1 year
Due 1 Through 5 years
Due after 5 years Total
Real estate mortgage $ 46,220 $ 461,831 $ 837,375 $ 1,345,426 Production and intermediate-term 183,026 379,956 186,267 749,249 Loans to cooperatives 10 1,447 – 1,457 Processing and marketing 263 24,340 23,200 47,803 Farm-related business 8,785 39,000 16,219 64,004 Communication 2,301 33,446 – 35,747 Energy and water/waste disposal – 1,404 3,273 4,677 Rural residential real estate 3,035 10,838 14,746 28,619
Total Loans $ 243,640 $ 952,262 $ 1,081,080 $ 2,276,982 Percentage 10.70% 41.82% 47.48% 100.00%
The following table shows loans and related accrued interest classified under the FCA Uniform Loan Classification System as a percentage of total loans and related accrued interest receivable by loan type as of:
December 31, 2014 2013 2012 Real estate mortgage: Acceptable 93.40% 93.19% 91.73% OAEM 3.73 4.13 4.70 Substandard/doubtful/loss 2.87 2.68 3.57
100.00% 100.00% 100.00%
Production and intermediate-term: Acceptable 91.82% 89.49% 87.82% OAEM 4.43 7.01 4.90 Substandard/doubtful/loss 3.75 3.50 7.28
100.00% 100.00% 100.00%
Loans to cooperatives: Acceptable 99.21% (3.34)% 88.22% OAEM 0.79 103.34 11.78 Substandard/doubtful/loss 0.00 0.00 0.00
100.00% 100.00% 100.00%
Processing and marketing: Acceptable 99.91% 98.67% 50.30% OAEM 0.09 0.60 4.72 Substandard/doubtful/loss 0.00 0.73 44.98
100.00% 100.00% 100.00%
Farm-related business: Acceptable 97.94% 99.72% 97.82% OAEM 0.05 0.26 1.94 Substandard/doubtful/loss 2.01 0.02 0.24
100.00% 100.00% 100.00%
December 31, 2014 2013 2012Communication: Acceptable 100.00% 100.00% 100.00% OAEM 0.00 0.00 0.00 Substandard/doubtful/loss 0.00 0.00 0.00
100.00% 100.00% 100.00%
Energy and water/waste disposal: Acceptable 100.00% 100.00% 99.45% OAEM 0.00 0.00 0.55 Substandard/doubtful/loss 0.00 0.00 0.00
100.00% 100.00% 100.00%
Rural residential real estate: Acceptable 88.26% 85.72% 86.24% OAEM 6.36 5.34 3.93 Substandard/doubtful/loss 5.38 8.94 9.83
100.00% 100.00% 100.00%
Total Loans: Acceptable 93.20% 92.26% 90.04% OAEM 3.74 4.86 4.64 Substandard/doubtful/loss 3.06 2.88 5.32
100.00% 100.00% 100.00%
The following tables provide an age analysis of past due loans and related accrued interest as of:
December 31, 2014
30 Through 89 Days Past
Due 90 Days or More
Past Due Total Past
Due
Not Past Due or Less Than 30 Days Past
Due Total Loans
Recorded Investment 90 Days or More Past
Due and Accruing Interest
Real estate mortgage $ 5,685 $ 9,103 $ 14,788 $ 1,338,003 $ 1,352,791 $ – Production and intermediate-term 3,381 7,234 10,615 742,862 753,477 257 Loans to cooperatives – – – 1,460 1,460 – Processing and marketing – 349 349 47,512 47,861 – Farm-related business 78 – 78 64,055 64,133 – Communication – – – 35,751 35,751 – Energy and water/waste disposal – – – 4,717 4,717 – Rural residential real estate 565 110 675 28,034 28,709 –
Total $ 9,709 $ 16,796 $ 26,505 $ 2,262,394 $ 2,288,899 $ 257

49MidAtlantic Farm Credit, ACA
December 31, 2013
30 Through 89 Days Past
Due 90 Days or More
Past Due Total Past
Due
Not Past Due or Less Than 30 Days Past
Due Total Loans
Recorded Investment 90 Days or More Past
Due and Accruing Interest
Real estate mortgage $ 4,749 $ 6,690 $ 11,439 $ 1,292,960 $ 1,304,399 $ – Production and intermediate-term 8,747 5,206 13,953 722,883 736,836 – Loans to cooperatives – – – 48 48 – Processing and marketing – 299 299 40,860 41,159 – Farm-related business 77 10 87 60,522 60,609 – Communication – – – 34,218 34,218 – Energy and water/waste disposal – – – 3,577 3,577 – Rural residential real estate 656 573 1,229 27,356 28,585 –
Total $ 14,229 $ 12,778 $ 27,007 $ 2,182,424 $ 2,209,431 $ –
December 31, 2012
30 Through 89 Days Past
Due 90 Days or More
Past Due Total Past
Due
Not Past Due or Less Than 30 Days Past
Due Total Loans
Recorded Investment 90 Days or More Past
Due and Accruing Interest
Real estate mortgage $ 7,123 $ 11,644 $ 18,767 $ 1,202,214 $ 1,220,981 $ – Production and intermediate-term 3,583 7,858 11,441 771,993 783,434 – Loans to cooperatives – – – 5,610 5,610 – Processing and marketing 320 10,807 11,127 13,610 24,737 – Farm-related business 83 8 91 61,914 62,005 – Communication – – – 24,753 24,753 – Energy and water/waste disposal – – – 5,467 5,467 – Rural residential real estate 869 421 1,290 27,736 29,026 –
Total $ 11,978 $ 30,738 $ 42,716 $ 2,113,297 $ 2,156,013 $ –
The recorded investment in a receivable is the face amount increased or decreased by applicable accrued interest and unamortized premium, discount, finance charges, or acquisition costs and may also reflect a previous direct write-down of the investment.
Nonperforming assets (including related accrued interest) and related credit quality statistics were as follows:
December 31, 2014 2013 2012 Nonaccrual loans: Real estate mortgage $ 11,905 $ 11,542 $ 18,922 Production and intermediate-term 12,446 13,628 13,468 Processing and marketing – 299 11,127 Farm-related business (1) 9 8 Rural residential real estate 658 1,235 1,214
Total $ 25,008 $ 26,713 $ 44,739
Accruing restructured loans: Real estate mortgage $ 6,743 $ 6,557 $ 7,904 Production and intermediate-term 11,961 11,082 8,137 Rural residential real estate 894 389 3
Total $ 19,598 $ 18,028 $ 16,044
Accruing loans 90 days or more past due:Production and intermediate-term $ 257 $ – $ –
Total $ 257 $ – $ –
Total nonperforming loans $ 44,863 $ 44,741 $ 60,783 Other property owned 844 841 3,009
Total nonperforming assets $ 45,707 $ 45,582 $ 63,792
Nonaccrual loans as a percentage of total loans 1.10% 1.22% 2.09% Nonperforming assets as a percentage of total
loans and other property owned 2.01% 2.07% 2.97% Nonperforming assets as a percentage of capital 8.82% 9.32% 14.15%

50 MidAtlantic Farm Credit, ACA
Notes to the Consolidated Financial Statements (dollars in thousands, except as noted)
The following table presents information relating to impaired loans (including accrued interest) as defined in Note 2:
December 31, 2014 2013 2012
Impaired nonaccrual loans: Current as to principal and interest $ 6,956 $ 6,774 $ 10,506 Past due 18,052 19,939 34,233
Total impaired nonaccrual loans 25,008 26,713 44,739Impaired accrual loans: Restructured 19,598 18,028 16,044 90 days or more past due 257 – –
Total impaired accrual loans 19,855 18,028 16,044Total impaired loans $ 44,863 $ 44,741 $ 60,783
The following tables present additional impaired loan information at period end. Unpaid principal balance represents the contractual principal balance of the loan.
December 31, 2014 Year Ended December 31, 2014
Impaired loans: Recorded
Investment
Unpaid Principal Balance
Related Allowance
Average Impaired Loans
Interest Income Recognized on
Impaired Loans
With a related allowance for credit losses:
Real estate mortgage $ 7,019 $ 8,203 $ 1,560 $ 7,072 $ 302 Production and intermediate-term 5,954 7,191 2,776 5,999 256 Processing and marketing – – – – – Farm-related business – – – – – Rural residential real estate 658 847 174 663 28
Total $ 13,631 $ 16,241 $ 4,510 $ 13,734 $ 586
With no related allowance for credit losses:
Real estate mortgage $ 11,629 $ 12,885 $ – $ 11,716 $ 499 Production and intermediate-term 18,710 22,467 – 18,851 804 Processing and marketing – 3,045 – – – Farm-related business (1) 4 – (1) – Rural residential real estate 894 1,007 – 901 39
Total $ 31,232 $ 39,408 $ – $ 31,467 $ 1,342
Total impaired loans:Real estate mortgage $ 18,648 $ 21,088 $ 1,560 $ 18,788 $ 801 Production and intermediate-term 24,664 29,658 2,776 24,850 1,060 Processing and marketing – 3,045 – – – Farm-related business (1) 4 – (1) – Rural residential real estate 1,552 1,854 174 1,564 67
Total $ 44,863 $ 55,649 $ 4,510 $ 45,201 $ 1,928
December 31, 2013 Year Ended December 31, 2013
Impaired loans: Recorded
Investment
Unpaid Principal Balance
Related Allowance
Average Impaired Loans
Interest Income Recognized on
Impaired Loans
With a related allowance for credit losses:
Real estate mortgage $ 4,605 $ 5,569 $ 562 $ 5,328 $ 266 Production and intermediate-term 5,123 6,064 1,527 5,927 296 Processing and marketing – – – – – Farm-related business 9 11 3 11 1 Rural residential real estate 940 1,185 175 1,087 54
Total $ 10,677 $ 12,829 $ 2,267 $ 12,353 $ 617
With no related allowance for credit losses:
Real estate mortgage $ 13,494 $ 15,966 $ – $ 15,613 $ 780 Production and intermediate-term 19,587 24,202 – 22,663 1,131 Processing and marketing 299 4,155 – 346 17 Farm-related business – 4 – – – Rural residential real estate 684 794 – 793 40
Total $ 34,064 $ 45,121 $ – $ 39,415 $ 1,968
Total impaired loans:Real estate mortgage $ 18,099 $ 21,535 $ 562 $ 20,941 $ 1,046 Production and intermediate-term 24,710 30,266 1,527 28,590 1,427 Processing and marketing 299 4,155 – 346 17 Farm-related business 9 15 3 11 1 Rural residential real estate 1,624 1,979 175 1,880 94
Total $ 44,741 $ 57,950 $ 2,267 $ 51,768 $ 2,585

51MidAtlantic Farm Credit, ACA
December 31, 2012 Year Ended December 31, 2012
Impaired loans: Recorded
Investment
Unpaid Principal Balance
Related Allowance
Average Impaired Loans
Interest Income Recognized on
Impaired Loans
With a related allowance for credit losses:
Real estate mortgage $ 6,531 $ 7,616 $ 651 $ 7,759 $ 154 Production and intermediate-term 4,377 4,886 1,662 5,200 103 Processing and marketing – – – – – Farm-related business 8 20 2 10 – Rural residential real estate 530 641 95 629 12
Total $ 11,446 $ 13,163 $ 2,410 $ 13,598 $ 269
With no related allowance for credit losses:
Real estate mortgage $ 20,295 $ 24,206 $ – $ 24,112 $ 476 Production and intermediate-term 17,228 22,279 – 20,468 405 Processing and marketing 11,127 14,679 – 13,220 261 Farm-related business – 4 – (1) – Rural residential real estate 687 924 – 817 17
Total $ 49,337 $ 62,092 $ – $ 58,616 $ 1,159
Total impaired loans:Real estate mortgage $ 26,826 $ 31,822 $ 651 $ 31,871 $ 630 Production and intermediate-term 21,605 27,165 1,662 25,668 508 Processing and marketing 11,127 14,679 – 13,220 261 Farm-related business 8 24 2 9 – Rural residential real estate 1,217 1,565 95 1,446 29
Total $ 60,783 $ 75,255 $ 2,410 $ 72,214 $ 1,428
Unpaid principal balance represents the contractual principal balance of the loan.
There were no material commitments to lend additional funds to debtors whose loans were classified as impaired at each reporting period.
The following table summarizes interest income on nonaccrual and accruing restructured loans that would have been recognized under the original terms of the loans:
Year Ended December 31, 2014 2013 2012
Interest income which would have been recognized under the original loan terms $ 3,985 $ 4,606 $ 4,494 Less: interest income recognized 1,927 2,585 1,428
Foregone interest income $ 2,058 $ 2,021 $ 3,066
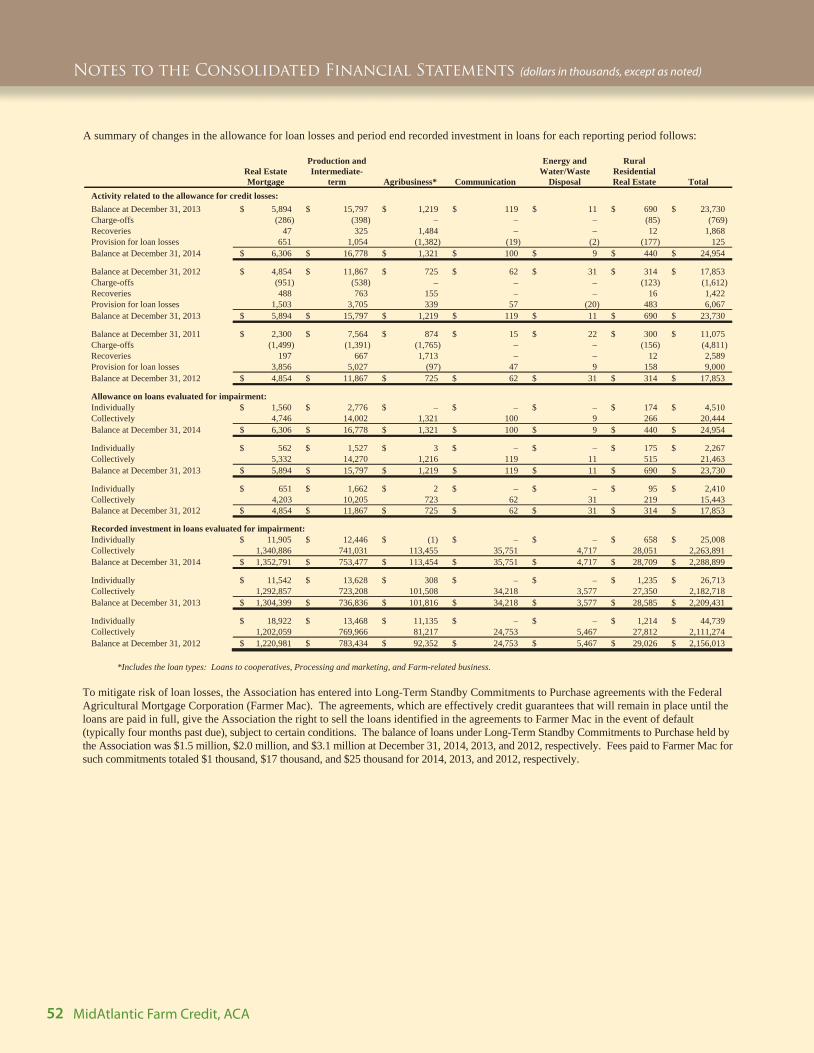
52 MidAtlantic Farm Credit, ACA
Notes to the Consolidated Financial Statements (dollars in thousands, except as noted)
A summary of changes in the allowance for loan losses and period end recorded investment in loans for each reporting period follows:
Real Estate Mortgage
Production and Intermediate-
term Agribusiness* Communication
Energy and Water/Waste
Disposal
Rural Residential Real Estate Total
Activity related to the allowance for credit losses: Balance at December 31, 2013 $ 5,894 $ 15,797 $ 1,219 $ 119 $ 11 $ 690 $ 23,730 Charge-offs (286) (398) – – – (85) (769) Recoveries 47 325 1,484 – – 12 1,868 Provision for loan losses 651 1,054 (1,382) (19) (2) (177) 125 Balance at December 31, 2014 $ 6,306 $ 16,778 $ 1,321 $ 100 $ 9 $ 440 $ 24,954
Balance at December 31, 2012 $ 4,854 $ 11,867 $ 725 $ 62 $ 31 $ 314 $ 17,853 Charge-offs (951) (538) – – – (123) (1,612) Recoveries 488 763 155 – – 16 1,422 Provision for loan losses 1,503 3,705 339 57 (20) 483 6,067 Balance at December 31, 2013 $ 5,894 $ 15,797 $ 1,219 $ 119 $ 11 $ 690 $ 23,730
Balance at December 31, 2011 $ 2,300 $ 7,564 $ 874 $ 15 $ 22 $ 300 $ 11,075 Charge-offs (1,499) (1,391) (1,765) – – (156) (4,811) Recoveries 197 667 1,713 – – 12 2,589 Provision for loan losses 3,856 5,027 (97) 47 9 158 9,000 Balance at December 31, 2012 $ 4,854 $ 11,867 $ 725 $ 62 $ 31 $ 314 $ 17,853
Allowance on loans evaluated for impairment:Individually $ 1,560 $ 2,776 $ – $ – $ – $ 174 $ 4,510 Collectively 4,746 14,002 1,321 100 9 266 20,444 Balance at December 31, 2014 $ 6,306 $ 16,778 $ 1,321 $ 100 $ 9 $ 440 $ 24,954
Individually $ 562 $ 1,527 $ 3 $ – $ – $ 175 $ 2,267 Collectively 5,332 14,270 1,216 119 11 515 21,463 Balance at December 31, 2013 $ 5,894 $ 15,797 $ 1,219 $ 119 $ 11 $ 690 $ 23,730
Individually $ 651 $ 1,662 $ 2 $ – $ – $ 95 $ 2,410 Collectively 4,203 10,205 723 62 31 219 15,443 Balance at December 31, 2012 $ 4,854 $ 11,867 $ 725 $ 62 $ 31 $ 314 $ 17,853
Recorded investment in loans evaluated for impairment:Individually $ 11,905 $ 12,446 $ (1) $ – $ – $ 658 $ 25,008 Collectively 1,340,886 741,031 113,455 35,751 4,717 28,051 2,263,891 Balance at December 31, 2014 $ 1,352,791 $ 753,477 $ 113,454 $ 35,751 $ 4,717 $ 28,709 $ 2,288,899
Individually $ 11,542 $ 13,628 $ 308 $ – $ – $ 1,235 $ 26,713 Collectively 1,292,857 723,208 101,508 34,218 3,577 27,350 2,182,718 Balance at December 31, 2013 $ 1,304,399 $ 736,836 $ 101,816 $ 34,218 $ 3,577 $ 28,585 $ 2,209,431
Individually $ 18,922 $ 13,468 $ 11,135 $ – $ – $ 1,214 $ 44,739 Collectively 1,202,059 769,966 81,217 24,753 5,467 27,812 2,111,274 Balance at December 31, 2012 $ 1,220,981 $ 783,434 $ 92,352 $ 24,753 $ 5,467 $ 29,026 $ 2,156,013
*Includes the loan types: Loans to cooperatives, Processing and marketing, and Farm-related business.
To mitigate risk of loan losses, the Association has entered into Long-Term Standby Commitments to Purchase agreements with the Federal Agricultural Mortgage Corporation (Farmer Mac). The agreements, which are effectively credit guarantees that will remain in place until the loans are paid in full, give the Association the right to sell the loans identified in the agreements to Farmer Mac in the event of default (typically four months past due), subject to certain conditions. The balance of loans under Long-Term Standby Commitments to Purchase held by the Association was $1.5 million, $2.0 million, and $3.1 million at December 31, 2014, 2013, and 2012, respectively. Fees paid to Farmer Mac for such commitments totaled $1 thousand, $17 thousand, and $25 thousand for 2014, 2013, and 2012, respectively.

53MidAtlantic Farm Credit, ACA
A restructuring of a debt constitutes a troubled debt restructuring (TDR) if the creditor for economic or legal reasons related to the debtor’s financial difficulties grants a concession to the debtor that it would not otherwise consider. The following tables present additional information about pre-modification and post-modification outstanding recorded investment and the effects of the modifications that occurred during the periods presented.
Year Ended December 31, 2014
Outstanding Recorded InvestmentInterest
Concessions Principal
Concessions Other
Concessions Total Charge-offs
Pre-modification: Real estate mortgage $ 988 $ – $ – $ 988 Production and intermediate-term 105 11,406 2 11,513 Rural residential real estate 255 49 – 304
Total $ 1,348 $ 11,455 $ 2 $ 12,805
Post-modification: Real estate mortgage $ 1,672 $ – $ – $ 1,672 $ – Production and intermediate-term 105 11,401 2 11,508 – Rural residential real estate 254 50 – 304 –
Total $ 2,031 $ 11,451 $ 2 $ 13,484 $ –
Year Ended December 31, 2013
Outstanding Recorded InvestmentInterest
Concessions Principal
Concessions Other
Concessions Total Charge-offs
Pre-modification: Real estate mortgage $ 260 $ 709 $ – $ 969 Production and intermediate-term 566 9,734 – 10,300 Rural residential real estate 130 61 – 191
Total $ 956 $ 10,504 $ – $ 11,460
Post-modification: Real estate mortgage $ 261 $ 697 $ – $ 958 $ – Production and intermediate-term 559 9,734 – 10,293 – Rural residential real estate 131 61 – 192 –
Total $ 951 $ 10,492 $ – $ 11,443 $ –
Year Ended December 31, 2012
Outstanding Recorded InvestmentInterest
Concessions Principal
Concessions Other
Concessions Total Charge-offs
Pre-modification: Real estate mortgage $ 1,018 $ 4,646 $ 592 $ 6,256 Production and intermediate-term 2,207 15,826 – 18,033 Rural residential real estate 4 382 – 386
Total $ 3,229 $ 20,854 $ 592 $ 24,675
Post-modification Real estate mortgage $ 1,024 $ 4,670 $ 607 $ 6,301 $ – Production and intermediate-term 1,414 15,986 – 17,400 – Rural residential real estate 4 382 – 386 –
Total $ 2,442 $ 21,038 $ 607 $ 24,087 $ –
Interest concessions may include interest forgiveness and interest deferment. Principal concessions may include principal forgiveness, principal deferment, and maturity extensions. Other concessions may include additional compensation received which might be in the form of cash or other assets.
The following tables present outstanding recorded investment for TDRs that occurred during the previous twelve months and for which there was a subsequent payment default during the period. Payment default is defined as a payment that was thirty days or more past due.
Year Ended December 31, Defaulted troubled debt
restructurings 2014 2013 2012
Real estate mortgage $ – $ – $ 520 Production and intermediate-term 1,174 695 674 Rural residential real estate 21 – 3
Total $ 1,195 $ 695 $ 1,197
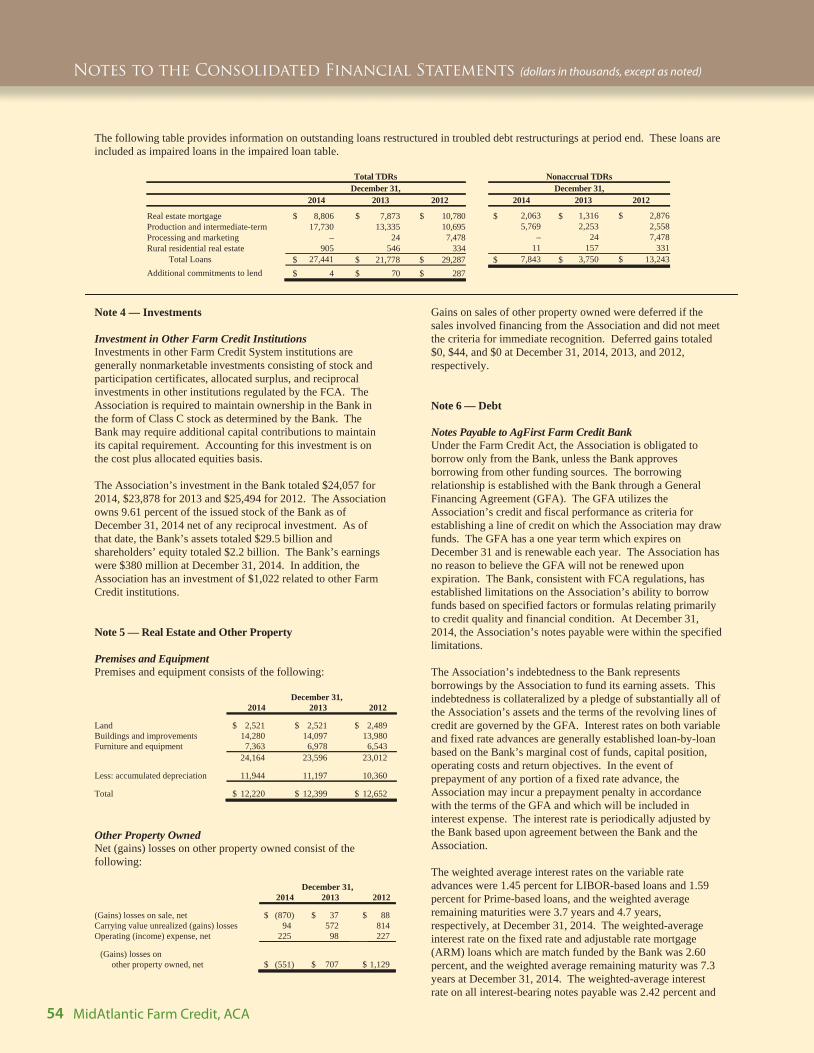
54 MidAtlantic Farm Credit, ACA
Notes to the Consolidated Financial Statements (dollars in thousands, except as noted)
The following table provides information on outstanding loans restructured in troubled debt restructurings at period end. These loans are included as impaired loans in the impaired loan table.
Total TDRs Nonaccrual TDRs December 31, December 31,
2014 2013 2012 2014 2013 2012
Real estate mortgage $ 8,806 $ 7,873 $ 10,780 $ 2,063 $ 1,316 $ 2,876Production and intermediate-term 17,730 13,335 10,695 5,769 2,253 2,558Processing and marketing – 24 7,478 – 24 7,478Rural residential real estate 905 546 334 11 157 331
Total Loans $ 27,441 $ 21,778 $ 29,287 $ 7,843 $ 3,750 $ 13,243Additional commitments to lend $ 4 $ 70 $ 287
Note 4 — Investments
Investment in Other Farm Credit Institutions Investments in other Farm Credit System institutions are generally nonmarketable investments consisting of stock and participation certificates, allocated surplus, and reciprocal investments in other institutions regulated by the FCA. The Association is required to maintain ownership in the Bank in the form of Class C stock as determined by the Bank. The Bank may require additional capital contributions to maintain its capital requirement. Accounting for this investment is on the cost plus allocated equities basis.
The Association’s investment in the Bank totaled $24,057 for 2014, $23,878 for 2013 and $25,494 for 2012. The Association owns 9.61 percent of the issued stock of the Bank as of December 31, 2014 net of any reciprocal investment. As of that date, the Bank’s assets totaled $29.5 billion and shareholders’ equity totaled $2.2 billion. The Bank’s earnings were $380 million at December 31, 2014. In addition, the Association has an investment of $1,022 related to other Farm Credit institutions.
Note 5 — Real Estate and Other Property
Premises and Equipment Premises and equipment consists of the following:
December 31, 2014 2013 2012
Land $ 2,521 $ 2,521 $ 2,489 Buildings and improvements 14,280 14,097 13,980 Furniture and equipment 7,363 6,978 6,543 24,164 23,596 23,012
Less: accumulated depreciation 11,944 11,197 10,360
Total $ 12,220 $ 12,399 $ 12,652
Other Property Owned Net (gains) losses on other property owned consist of the following:
December 31, 2014 2013 2012
(Gains) losses on sale, net $ (870) $ 37 $ 88 Carrying value unrealized (gains) losses 94 572 814 Operating (income) expense, net 225 98 227
(Gains) losses on other property owned, net $ (551) $ 707 $ 1,129
Gains on sales of other property owned were deferred if the sales involved financing from the Association and did not meet the criteria for immediate recognition. Deferred gains totaled $0, $44, and $0 at December 31, 2014, 2013, and 2012, respectively.
Note 6 — Debt
Notes Payable to AgFirst Farm Credit Bank Under the Farm Credit Act, the Association is obligated to borrow only from the Bank, unless the Bank approves borrowing from other funding sources. The borrowing relationship is established with the Bank through a General Financing Agreement (GFA). The GFA utilizes the Association’s credit and fiscal performance as criteria for establishing a line of credit on which the Association may draw funds. The GFA has a one year term which expires on December 31 and is renewable each year. The Association has no reason to believe the GFA will not be renewed upon expiration. The Bank, consistent with FCA regulations, has established limitations on the Association’s ability to borrow funds based on specified factors or formulas relating primarily to credit quality and financial condition. At December 31, 2014, the Association’s notes payable were within the specified limitations.
The Association’s indebtedness to the Bank represents borrowings by the Association to fund its earning assets. This indebtedness is collateralized by a pledge of substantially all of the Association’s assets and the terms of the revolving lines of credit are governed by the GFA. Interest rates on both variable and fixed rate advances are generally established loan-by-loan based on the Bank’s marginal cost of funds, capital position, operating costs and return objectives. In the event of prepayment of any portion of a fixed rate advance, the Association may incur a prepayment penalty in accordance with the terms of the GFA and which will be included in interest expense. The interest rate is periodically adjusted by the Bank based upon agreement between the Bank and the Association.
The weighted average interest rates on the variable rate advances were 1.45 percent for LIBOR-based loans and 1.59 percent for Prime-based loans, and the weighted average remaining maturities were 3.7 years and 4.7 years, respectively, at December 31, 2014. The weighted-average interest rate on the fixed rate and adjustable rate mortgage (ARM) loans which are match funded by the Bank was 2.60 percent, and the weighted average remaining maturity was 7.3 years at December 31, 2014. The weighted-average interest rate on all interest-bearing notes payable was 2.42 percent and
55MidAtlantic Farm Credit, ACA
the weighted-average remaining maturity was 6.8 years at December 31, 2014. Variable rate and fixed rate notes payable represent approximately 17.12 percent and 82.88 percent, respectively, of gross notes payable at December 31, 2014 (-4.70 percent and 104.70 percent of total notes payable, respectively, after consideration of netting the Association’s available equities). The weighted average maturities described above are related to matched-funded loans. The direct note itself has an annual maturity as prescribed in the GFA.
Note 7 — Members’ Equity
A description of the Association’s capitalization requirements, protection mechanisms, regulatory capitalization requirements and restrictions, and equities are provided below.
A. Capital Stock and Participation Certificates: In accordance with the Farm Credit Act and the Association’s capitalization bylaws, each borrower is required to invest in Class C stock for agricultural loans, or Class C participation certificates in the case of rural home and farm related business loans, as a condition of borrowing. The initial borrower investment, through either purchase or transfer, must equal two percent of the loan amount or one thousand dollars, whichever is less. The Association’s Board of Directors may increase the amount of investment if necessary to meet the Association’s capital needs. Loans designated for sale or sold into the Secondary Market on or after April 16, 1996 have no voting stock or participation certificate purchase requirement if sold within 180 days following the date of designation.
The borrower acquires ownership of the capital stock or participation certificates at the time the loan is made, usually as part of the loan proceeds and not as a cash investment. The aggregate par value is generally added to the principal amount of the related loan obligation. The Association retains a first lien on the stock or participation certificates owned by borrowers. Retirement of such equities will generally be at the lower of par or book value, and repayment of a loan does not automatically result in retirement of the corresponding stock or participation certificates.
B. Regulatory Capitalization Requirements and Restrictions: FCA regulations require that certain minimum standards for capital be achieved and maintained. These standards are measured based on capital as a percentage of risk-adjusted assets and off-balance-sheet commitments and surplus levels as a percentage of risk-adjusted assets.
Failure to meet the capital requirements can initiate certain mandatory and possibly additional discretionary actions by FCA that, if undertaken, could have a direct material effect on the Association’s financial statements. The Association is prohibited from reducing permanent capital by retiring stock or making certain other distributions to shareholders unless prescribed capital standards are met.
The Association’s capital ratios as of December 31 and the FCA minimum requirements follow:
Regulatory 2014 2013 2012 Minimum
Permanent capital ratio 20.98% 20.21% 18.12% 7.00% Total surplus ratio 20.61% 19.83% 17.73% 7.00% Core surplus ratio 20.61% 19.68% 17.57% 3.50%
An FCA regulation empowers it to direct a transfer of funds or equities by one or more System institutions to another System institution under specified circumstances. The Association has not been called upon to initiate any transfers and is not aware of any proposed action under this regulation.
There are currently no prohibitions in place that would prevent the Association from retiring stock, distributing earnings, or paying dividends per the statutory and regulatory restrictions, and the Association has no reason to believe any such restrictions may apply in the future.
C. Description of Equities: The Association is authorized to issue or have outstanding Classes A, C, D and E Common Stock, Class C Participation Certificates and such other classes of equity as may be provided for in amendments to the bylaws in such amounts as may be necessary to conduct the Association’s business. All stock and participation certificates have a par or face value of five dollars ($5.00) per share.
The Association had the following shares outstanding at December 31, 2014:
Shares Outstanding
Class Protected NumberAggregate Par Value
C Common/Voting No 1,819,847 $ 9,099C Participation Certificates/Nonvoting No 128,758 644
Total Capital Stock and Participation Certificates 1,948,605 $ 9,743
At-risk common stock and participation certificates are retired at the sole discretion of the Association’s Board of Directors at book value not to exceed par or face amounts, provided the minimum capital adequacy standards established by the Board are met.
Retained Earnings
The Association maintains unallocated and allocated retained earnings accounts. The minimum aggregate amount of these two accounts is determined by the Association’s Board of Directors. At the end of any fiscal year, if the retained earnings accounts would be less than the minimum amount deemed necessary to maintain adequate capital reserves to meet the commitments of the Association, earnings for the year shall be applied to the unallocated retained earnings account in such amounts deemed necessary by the Association’s Board of Directors. Unallocated retained earnings are maintained for each borrower to permit liquidation on a patronage basis.
56 MidAtlantic Farm Credit, ACA
Notes to the Consolidated Financial Statements (dollars in thousands, except as noted)
The Association maintains an allocated retained earnings account consisting of earnings held and allocated to borrowers on a patronage basis. In the event of a net loss for any fiscal year, such allocated retained earnings account will be subject to full impairment in the order specified in the bylaws beginning with the most recent allocation.
The Association has a first lien and security interest on all surplus account allocations owned by any borrowers, and all distributions thereof, as additional collateral for their indebtedness to the Association. When the debt of a borrower is in default or is in the process of final liquidation by payment or otherwise, the Association, upon approval of the Board of Directors, may order any and all surplus account allocations owned by such borrower to be applied against the indebtedness.
Allocated equities shall be retired solely at the discretion of the Board of Directors, provided that minimum capital standards established by the FCA and the Board are met. Nonqualified retained equity is considered to be permanently invested in the Association and there is no plan to revolve or retire this surplus. All nonqualified distributions are tax deductible only when redeemed.
At December 31, 2014, allocated members’ equity consisted of $108,571 of nonqualified allocated surplus and $183,450 of nonqualified retained surplus.
Dividends
The Association may declare noncumulative dividends on its capital stock and participation certificates provided the dividend rate does not exceed eight percent (8%) of the par value of the respective capital stock and participation certificates.
The rate of dividends paid on Classes A, C, D and E Common Stock and Class C Participation Certificates shall be at the same rate per share.
Dividends may not be declared if, after recording the liability, the Association would not meet its capital adequacy standards.
Patronage Distributions
Prior to the beginning of any fiscal year, the Board of Directors, by adoption of a resolution, may obligate the Association to distribute to borrowers on a patronage basis all or any portion of available net earnings for each fiscal year. Patronage distributions are based on the proportion of the borrower’s interest to the amount of interest earned by the Association on its total loans unless another proportionate patronage basis is approved by the Board.
If the Association meets its capital adequacy standards after making the patronage distributions, the patronage distributions may be in cash, authorized stock of the Association, allocations of earnings retained in an allocated members’ equity account, or any one or more of such forms of distribution. Patronage distributions of the Association’s earnings may be paid on either a qualified or nonqualified basis, or a combination of both, as determined by the Board
of Directors. A minimum of 20 percent of the total qualified patronage distribution to any borrower for any fiscal year shall always be paid in cash.
Transfer
Classes A, C, D and E Common Stocks, and Class C Participation Certificates may be transferred to persons or entities eligible to purchase or hold such equities.
Impairment
Any net losses recorded by the Association shall first be applied against unallocated members’ equity. To the extent that such losses would exceed unallocated members’ equity, such losses would be applied consistent with the Association’s bylaws and shall be borne ratably by each share of Class A, C, D and E Common Stock and Class C Participation Certificates outstanding.
Impaired stock and participation certificates shall be restored in the reverse of the impairment sequence until each share of stock and participation certificates has a book value equal to its par or face value, respectively.
Liquidation
In the event of liquidation or dissolution of the Association, any assets of the Association remaining after payment or retirement of all liabilities and payment of all accrued but unpaid dividends shall be distributed to the holders of the outstanding stock and participation certificates in the following order of priority:
First, to the holders of Class A Common, Class C Common, Class D Common Stock, Class E Common Stock, Participation Certificates pro rata in proportion to the number of shares or units of each such class of stock or participation certificates then issued and outstanding, until an amount equal to the aggregate par value or face amount of all such shares or units has been distributed to such holders;
Second, to the holders of allocated surplus evidenced by qualified written notices of allocation, in the order of year of issuance and pro rata by year of issuance, until the total amount of such allocated surplus has been distributed;
Third, to the holders of allocated surplus evidenced by nonqualified written notices of allocation, in the order of year of issuance and pro rata by year of issuance, until the total amount of such allocated surplus has been distributed; and
Fourth, insofar as is practicable, any remaining assets shall be distributed to past and present Patrons on a patronage basis in a fair and equitable manner determined by the Board or receiver.

57MidAtlantic Farm Credit, ACA
D. Other Comprehensive Income (Loss): The following tables present activity related to AOCI for the periods presented.
Changes in Accumulated Other Comprehensive income by Component (a)For the years ended December 31,
2014 2013 2012
Employee Benefit Plans: Balance at beginning of period $ (377) $ (601) $ (520)
Other comprehensive income before reclassifications (220) 129 (155) Amounts reclassified from AOCI 63 95 74
Net current period change in OCI (157) 224 (81) Balance at end of period $ (534) $ (377) $ (601)
Reclassifications Out of Accumulated Other Comprehensive Income (b) 2014 2013 2012 Income Statement Line Item
Defined Benefit Pension Plans: Periodic pension costs $ (63) $ (95) $ (74) See Note 9. Amounts reclassified $ (63) $ (95) $ (74)
(a) Amounts in parentheses indicate debits to AOCI. (b) Amounts in parentheses indicate debits to profit/loss.
Note 8 — Fair Value Measurement
Fair value is defined as the exchange price that would be received for an asset or paid to transfer a liability in an orderly transaction between market participants in the principal or most advantageous market for the asset or liability.
Accounting guidance establishes a fair value hierarchy for disclosure of fair value measurements to maximize the use of observable inputs, that is, inputs that reflect the assumptions market participants would use in pricing an asset or liability based on market data obtained from sources independent of the reporting entity. The hierarchy is based upon the transparency of inputs to the valuation of an asset or liability as of the measurement date. A financial instrument’s categorization within the hierarchy tiers is based upon the lowest level of input that is significant to the fair value measurement.
Estimating the fair value of the Association’s investment in the Bank and Other Farm Credit Institutions is not practicable because the stock is not traded. The net investment is a requirement of borrowing from the Bank and is carried at cost plus allocated equities.
The classifications within the fair value hierarchy are as follows:
Level 1 Assets held in trust funds related to deferred compensation plans are classified as Level 1. The trust funds include investments in securities that are actively traded and have quoted net asset value prices that are directly observable in the marketplace.
For cash, the carrying value is primarily utilized as a reasonable estimate of fair value.
Level 2 The Association has no Level 2 assets or liabilities measured at fair value on a recurring basis at December 31, 2014.
Level 3 Because no active market exists for the Association’s accruing loans, fair value is estimated by discounting the expected future
cash flows using the Association’s current interest rates at which similar loans currently would be made to borrowers with similar credit risk. The loan portfolio is segregated into pools of loans with homogeneous characteristics based upon repricing and credit risk. Expected future cash flows and interest rates reflecting appropriate credit risk are separately determined for each individual pool.
Fair values of loans in a nonaccrual status are estimated to be the carrying amount of the loan less specific reserves. Certain loans evaluated for impairment under FASB guidance have fair values based upon the underlying collateral, as the loans were collateral-dependent. Specific reserves were established for these loans when the value of the collateral, less estimated cost to sell, was less than the principal balance of the loan. The fair value measurement process uses independent appraisals and other market-based information, but in many cases it also requires significant input based on management's knowledge of and judgment about current market conditions, specific issues relating to the collateral and other matters.
Notes payable are segregated into pricing pools according to the types and terms of the loans (or other assets) which they fund. Fair value of the notes payable is estimated by discounting the anticipated cash flows of each pricing pool using the current rate that would be charged for additional borrowings. For purposes of this estimate it is assumed the cash flow on the notes is equal to the principal payments on the Association’s loan receivables. This assumption implies that earnings on the Association’s interest margin are used to fund operating expenses and capital expenditures.
Other property owned is classified as a Level 3 asset. The fair value is generally determined using formal appraisals of each individual property. These assets are held for sale. Costs to sell represent transaction costs and are not included as a component of the fair value of other property owned. Other property owned consists of real and personal property acquired through foreclosure or deed in lieu of foreclosure and is carried as an asset held for sale, which is generally not its highest and best use. These properties are part of the Association's credit risk mitigation efforts, not its ongoing business. In addition,
58 MidAtlantic Farm Credit, ACA
Notes to the Consolidated Financial Statements (dollars in thousands, except as noted)
FCA regulations require that these types of property be disposed of within a reasonable period of time.
For commitments to extend credit, the estimated market value of off-balance-sheet commitments is minimal since the committed rate approximates current rates offered for commitments with similar rate and maturity characteristics; therefore, the related credit risk is not significant.
There were no Level 3 assets and liabilities measured at fair value on a recurring basis for the periods presented. The Association had no transfers of assets or liabilities into or out of Level 1 or Level 2 during the periods presented.
SENSITIVITY TO CHANGES IN SIGNIFICANT UNOBSERVABLE INPUTS
Discounted cash flow or similar modeling techniques are generally used to determine the recurring fair value measurements for Level 3 assets and liabilities. Use of these techniques requires determination of relevant inputs and assumptions, some of which represent significant unobservable inputs as indicated in the tables that follow. Accordingly, changes in these unobservable inputs may have a significant impact on fair value.
Certain of these unobservable inputs will (in isolation) have a directionally consistent impact on the fair value of the instrument for a given change in that input. Alternatively, the
fair value of the instrument may move in an opposite direction for a given change in another input. Where multiple inputs are used within the valuation technique of an asset or liability, a change in one input in a certain direction may be offset by an opposite change in another input having a potentially muted impact to the overall fair value of that particular instrument. Additionally, a change in one unobservable input may result in a change to another unobservable input (that is, changes in certain inputs are interrelated with one another), which may counteract or magnify the fair value impact.
Inputs to Valuation Techniques Management determines the Association’s valuation policies and procedures. The Bank performs the majority of the Association’s valuations, and its valuation processes are calibrated annually by an independent consultant. The fair value measurements are analyzed on a quarterly basis. For other valuations, documentation is obtained for third party information, such as pricing, and periodically evaluated alongside internal information and pricing that is available.
Quoted market prices are generally not available for the instruments, presented below. Accordingly, fair values are based on judgments regarding anticipated cash flows, future expected loss experience, current economic conditions, risk characteristics of various financial instruments, and other factors. These estimates involve uncertainties and matters of judgment, and therefore cannot be determined with precision. Changes in assumptions could significantly affect the estimates.
Quantitative Information about Recurring and Nonrecurring Level 3 Fair Value Measurements at December 31, 2014
Fair Value Valuation Technique(s) Unobservable Input Range Impaired loans and other property owned $ 41,293 Appraisal Income and expense *
Comparable sales * Replacement costs * Comparability adjustments *
* Ranges for this type of input are not useful because each collateral property is unique.
Information about Other Financial Instrument Fair Value Measurements
Valuation Technique(s) Input Cash Carrying Value Par/Principal and appropriate interest yield Loans Discounted cash flow Prepayment forecasts
Probability of default Loss severity
Notes payable to AgFirst Farm Credit Bank Discounted cash flow Prepayment forecasts Probability of default Loss severity

59MidAtlantic Farm Credit, ACA
Fair values are estimated at each period end date for assets and liabilities measured at fair value on a recurring basis. Fair values are estimated at least annually, or when information suggests a significant change in value, for assets measured at fair value on a nonrecurring basis. Other Financial Instruments are not measured at fair value in the statement of financial position, but their fair values are estimated as of each period end date. The following tables summarize the carrying amounts of these assets and liabilities at period end, and their related fair values.
At or for the Year ended December 31, 2014 Total Total Fair Value
Carrying Amount Level 1 Level 2 Level 3
Fair Value
Effects On Earnings
Recurring Measurements Assets: Assets held in Trust funds $ 1,626 $ 1,626 $ – $ – $ 1,626 Recurring Assets $ 1,626 $ 1,626 $ – $ – $ 1,626
Liabilities: Recurring Liabilities $ – $ – $ – $ – $ –
Nonrecurring Measurements Assets: Impaired loans $ 40,353 $ – $ – $ 40,353 $ 40,353 $ (1,144) Other property owned 844 – – 940 940 776 Nonrecurring Assets $ 41,197 $ – $ – $ 41,293 $ 41,293 $ (368)
Other Financial Instruments Assets: Cash $ 2,615 $ 2,615 $ – $ – $ 2,615 Loans 2,212,048 – – 2,202,991 2,202,991 Other Financial Assets $ 2,214,663 $ 2,615 $ – $ 2,202,991 $ 2,205,606
Liabilities: Notes payable to AgFirst Farm Credit Bank $ 1,760,410 $ – $ – $ 1,747,340 $ 1,747,340 Other Financial Liabilities $ 1,760,410 $ – $ – $ 1,747,340 $ 1,747,340
At or for the Year ended December 31, 2013 Total Total Fair Value
Carrying Amount Level 1 Level 2 Level 3
Fair Value
Effects On Earnings
Recurring Measurements Assets: Assets held in Trust funds $ 1,375 $ 1,375 $ – $ – $ 1,375 Recurring Assets $ 1,375 $ 1,375 $ – $ – $ 1,375
Liabilities: Recurring Liabilities $ – $ – $ – $ – $ –
Nonrecurring Measurements Assets: Impaired loans $ 42,474 $ – $ – $ 42,474 $ 42,474 $ (46) Other property owned 841 – – 936 936 (609) Nonrecurring Assets $ 43,315 $ – $ – $ 43,410 $ 43,410 $ (655)
Other Financial Instruments Assets: Cash $ 2,540 $ 2,540 $ – $ – $ 2,540 Loans 2,131,458 – – 2,108,809 2,108,809 Other Financial Assets $ 2,133,998 $ 2,540 $ – $ 2,108,809 $ 2,111,349
Liabilities: Notes payable to AgFirst Farm Credit Bank $ 1,724,627 $ – $ – $ 1,699,411 $ 1,699,411 Other Financial Liabilities $ 1,724,627 $ – $ – $ 1,699,411 $ 1,699,411

60 MidAtlantic Farm Credit, ACA
Notes to the Consolidated Financial Statements (dollars in thousands, except as noted)
December 31, 2012 Total Total Fair Value
Carrying Amount Level 1 Level 2 Level 3
Fair Value
Effects On Earnings
Recurring Measurements Assets: Assets held in Trust funds $ 1,049 $ 1,049 $ – $ – $ 1,049 Recurring Assets $ 1,049 $ 1,049 $ – $ – $ 1,049
Liabilities: Recurring Liabilities $ – $ – $ – $ – $ –
Nonrecurring Measurements Assets: Impaired loans $ 58,373 $ – $ – $ 58,373 $ 58,373 $ (2,161) Other property owned 3,009 – – 3,366 3,366 (902) Nonrecurring Assets $ 61,382 $ – $ – $ 61,739 $ 61,739 $ (3,063)
Other Financial Instruments Assets: Cash $ 5,984 $ 5,984 $ – $ – $ 5,984 Loans 2,068,015 – – 2,077,497 2,077,497 Other Financial Assets $ 2,073,999 $ 5,984 $ – $ 2,077,497 $ 2,083,481
Liabilities: Notes payable to AgFirst Farm Credit Bank $ 1,714,965 $ – $ – $ 1,721,140 $ 1,721,140 Other Financial Liabilities $ 1,714,965 $ – $ – $ 1,721,140 $ 1,721,140
Note 9 — Employee Benefit Plans
The Association participates in four District sponsored benefit plans. These plans include two multiemployer defined benefit pension plans, the AgFirst Farm Credit Retirement Plan which is a final average pay plan (FAP Plan) and the AgFirst Farm Credit Cash Balance Retirement Plan which is a cash balance plan (CB Plan). In addition, the Association participates in a multiemployer defined benefit other postretirement benefits plan (OPEB Plan), the Farm Credit Benefits Alliance Retiree and Disabled Medical and Dental Plan and a defined contribution 401(k) plan. The risks of participating in these multiemployer plans are different from single-employer plans in the following aspects:
a) Assets contributed to multiemployer plans by one employer may be used to provide benefits to employees of other participating employers.
b) If a participating employer stops contributing to the plan, the unfunded obligations of the plan may be borne by the remaining participating employers.
c) If the Association chooses to stop participating in some of its multiemployer plans, the Association may be required to contribute to eliminate the underfunded status of the plan.
The Association’s participation in the multiemployer defined benefit plans for the annual periods ended December 31 are outlined in the table below. The “Percentage Funded to Projected Benefit Obligation” or “Percentage Funded to Accumulated Postretirement Benefit Obligation” represents the funded amount for the entire plan and the “Contributions” and “Percentage of Total Contributions” columns represent the Association’s respective amounts.
Pension Plan Percentage Funded to
Projected Benefit Obligation Contributions Percentage of Total
Contributions 2014 2013 2012 2014 2013 2012 2014 2013 2012
AgFirst Farm Credit Retirement Plan 84.56% 89.47% 77.35% $4,383 $5,552 $4,871 11.54% 11.04% 10.70%
AgFirst Farm Credit Cash Balance Retirement Plan 100.07% 95.06% 86.01% $358 $114 $96 7.19% 6.46% 7.06%
Other Postretirement Benefit Plan
Percentage Funded to Accumulated Postretirement Benefit Obligation Contributions
Percentage of Total Contribution
2014 2013 2012 2014 2013 2012 2014 2013 2012 Farm Credit Benefits Alliance Retiree and Disabled Medical and Dental Plans 0.00% 0.00% 0.00% $562 $493 $421 7.27% 7.10% 6.79%
The District’s multiemployer plans are not subject to ERISA and no Form 5500 is required. As such, the following information is neither available for nor applicable to the plans:
1. The Employee Identification Number (EIN) and three-digit Pension Plan Number.
2. The most recent Pension Protection Act (PPA) zone status. Among other factors, plans in the red zone are generally less than 65 percent funded, plans in the yellow zone are less than 80 percent funded, and plans in the green zone are at least 80 percent funded.
61MidAtlantic Farm Credit, ACA
3. The "FIP/RP Status" indicating whether a financial improvement plan (FIP) or a rehabilitation plan (RP) is either pending or has been implemented.
4. The expiration date(s) of collective-bargaining agreement(s).
Substantially all employees of the Association are eligible to participate in either the FAP Plan or the CB Plan. These two Plans are noncontributory and include eligible Association and other District employees. For participants hired prior to January 1, 2003, benefits are provided under the FAP Plan and are based on eligible compensation and years of service. For participants hired on or after January 1, 2003, benefits are provided under the CB Plan and are determined using a percent of eligible compensation formula. The employer contribution into the CB Plan is based on a formula of 3.00 - 5.00 percent of eligible compensation (depending on years of service) and interest credits as allocated to an employee’s theoretical account balance. The actuarially-determined costs of these plans are allocated to each participating entity, including the Association, by multiplying the plans’ net pension expense by each institution’s eligible service cost and accumulated benefit obligation as a percentage of the total eligible service cost and total accumulated benefit obligation for all plan participants. Plan expenses included in employee benefit costs were $6,076 for 2014, $5,846 for 2013, and $5,601 for 2012. The cumulative excess of amounts funded by the Association over the cost allocated to the Association is reflected as prepaid retirement expense, a component of Other assets in the Consolidated Balance Sheets.
In addition to providing pension benefits, the Association provides certain medical and dental benefits for eligible retired employees through the OPEB Plan. Substantially all of the Association employees may become eligible for the benefits if they reach early retirement age while working for the Association. Early retirement age is defined as a minimum of age 55 and 10 years of service. Employees hired after December 31, 2002, and employees who separate from service between age 50 and age 55, are required to pay the full cost of their retiree health insurance coverage. Employees who retire subsequent to December 1, 2007 are no longer provided retiree life insurance benefits. Certain Association charges related to this plan are an allocation of District charges based on the Association’s proportional share of the plan liability. This plan is unfunded with expenses paid as incurred. Postretirement benefits other than pensions included in employee benefit costs were $949 for 2014, $910 for 2013, and $750 for 2012. The cumulative excess of cost allocated to the Association over the amounts funded by the Association is reflected as postretirement benefits other than pensions, a component of Other liabilities in the Association’s Consolidated Balance Sheets.
The Association also participates in the defined contribution Farm Credit Benefit Alliance (FCBA) 401(k) Plan (401(k) Plan), which qualifies as a 401(k) plan as defined by the Internal Revenue Code. For employees hired on or prior to December 31, 2002, the Association contributes $0.50 for each $1.00 of the employee’s first 6.00 percent of contribution (based on total compensation) up to the maximum employer contribution of 3.00 percent of total compensation. For employees hired on or after January 1, 2003, the Association contributes $1.00 for each $1.00 of the employee’s first 6.00 percent of contribution up to the maximum employer contribution of 6.00 percent of total compensation. Employee deferrals are not to exceed the maximum deferral as determined and adjusted by the Internal Revenue Service. The 401(k) Plan
costs are expensed as funded. Employer contributions to this plan included in salaries and employee benefit costs were $623, $577, and $539 for the years ended December 31, 2014, 2013, and 2012, respectively.
FASB guidance further requires the determination of the fair value of plan assets and recognition of actuarial gains and losses, prior service costs or credits, and transition assets or obligations as a component of AOCI. Under the guidance, these amounts are subsequently recognized as components of net periodic benefit costs over time. For 2014, 2013, and 2012, $(157), $224 and $(81), respectively, has been recognized as a net debit, net credit, and net debit, respectively, to AOCI to reflect these elements.
The supplemental retirement plan is unfunded and had a projected benefit obligation of $1,602 and a net under-funded status of $1,602 at December 31, 2014. Net periodic pension cost was $165, $191, and $165 for 2014, 2013, and 2012, respectively. Assumptions used to determine the projected benefit obligation as of December 31, 2014 included a discount rate of 4.20 percent and a rate of compensation increase of 4.50 percent.
In November 2014, the AgFirst Plan Sponsor Committee approved and executed amendments to the CB Plan that included the following changes:
1. The Plan was closed to new participants effective as of December 31, 2014. Based on the Plan’s eligibility provisions, this change affected employees hired on or after November 4, 2014.
2. No further employer contributions will be credited to participants in the Plan effective as of January 1, 2015.
3. All participants who were not already fully vested in the Plan became fully vested as of December 31, 2014.
4. The Plan will be terminated effective as of December 31, 2015.
Following the termination of the Plan, vested benefits will be distributed to participants. Participants will continue to receive interest credits to their hypothetical cash balance accounts following the termination of the Plan through the month immediately preceding the month in which the vested benefits are distributed from the Plan.
Curtailment accounting, as prescribed in ASC 715 “Compensation – Retirement Benefits”, was initiated upon execution of the plan amendments and did not have a material impact on the Association’s financial condition or results of operations.
Beginning on January 1, 2015, for participants in the CB Plan and eligible employees hired on or after November 4, 2014, an additional employer contribution will be made to the 401(k) Plan equal to 3 percent of the participants’ eligible compensation.
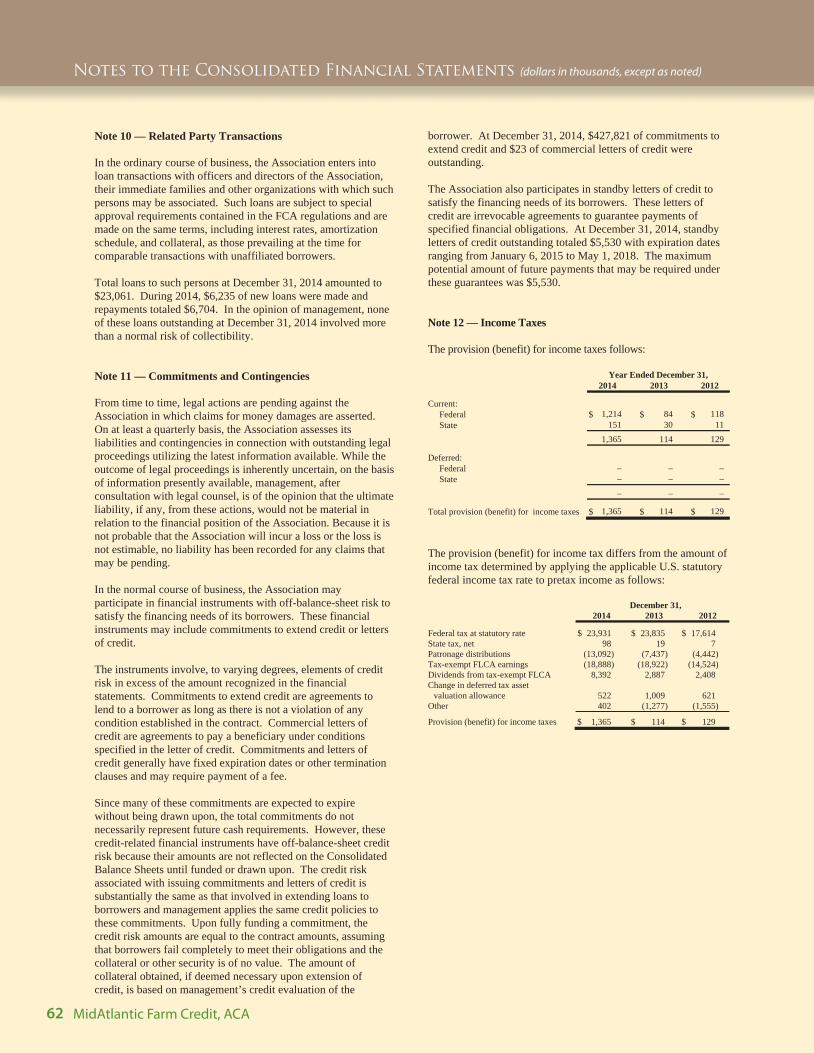
62 MidAtlantic Farm Credit, ACA
Notes to the Consolidated Financial Statements (dollars in thousands, except as noted)
Note 10 — Related Party Transactions
In the ordinary course of business, the Association enters into loan transactions with officers and directors of the Association, their immediate families and other organizations with which such persons may be associated. Such loans are subject to special approval requirements contained in the FCA regulations and are made on the same terms, including interest rates, amortization schedule, and collateral, as those prevailing at the time for comparable transactions with unaffiliated borrowers.
Total loans to such persons at December 31, 2014 amounted to $23,061. During 2014, $6,235 of new loans were made and repayments totaled $6,704. In the opinion of management, none of these loans outstanding at December 31, 2014 involved more than a normal risk of collectibility.
Note 11 — Commitments and Contingencies
From time to time, legal actions are pending against the Association in which claims for money damages are asserted. On at least a quarterly basis, the Association assesses its liabilities and contingencies in connection with outstanding legal proceedings utilizing the latest information available. While the outcome of legal proceedings is inherently uncertain, on the basis of information presently available, management, after consultation with legal counsel, is of the opinion that the ultimate liability, if any, from these actions, would not be material in relation to the financial position of the Association. Because it is not probable that the Association will incur a loss or the loss is not estimable, no liability has been recorded for any claims that may be pending.
In the normal course of business, the Association may participate in financial instruments with off-balance-sheet risk to satisfy the financing needs of its borrowers. These financial instruments may include commitments to extend credit or letters of credit.
The instruments involve, to varying degrees, elements of credit risk in excess of the amount recognized in the financial statements. Commitments to extend credit are agreements to lend to a borrower as long as there is not a violation of any condition established in the contract. Commercial letters of credit are agreements to pay a beneficiary under conditions specified in the letter of credit. Commitments and letters of credit generally have fixed expiration dates or other termination clauses and may require payment of a fee.
Since many of these commitments are expected to expire without being drawn upon, the total commitments do not necessarily represent future cash requirements. However, these credit-related financial instruments have off-balance-sheet credit risk because their amounts are not reflected on the Consolidated Balance Sheets until funded or drawn upon. The credit risk associated with issuing commitments and letters of credit is substantially the same as that involved in extending loans to borrowers and management applies the same credit policies to these commitments. Upon fully funding a commitment, the credit risk amounts are equal to the contract amounts, assuming that borrowers fail completely to meet their obligations and the collateral or other security is of no value. The amount of collateral obtained, if deemed necessary upon extension of credit, is based on management’s credit evaluation of the
borrower. At December 31, 2014, $427,821 of commitments to extend credit and $23 of commercial letters of credit were outstanding.
The Association also participates in standby letters of credit to satisfy the financing needs of its borrowers. These letters of credit are irrevocable agreements to guarantee payments of specified financial obligations. At December 31, 2014, standby letters of credit outstanding totaled $5,530 with expiration dates ranging from January 6, 2015 to May 1, 2018. The maximum potential amount of future payments that may be required under these guarantees was $5,530.
Note 12 — Income Taxes
The provision (benefit) for income taxes follows:
Year Ended December 31, 2014 2013 2012
Current: Federal $ 1,214 $ 84 $ 118 State 151 30 11
1,365 114 129
Deferred: Federal – – – State – – –
– – –
Total provision (benefit) for income taxes $ 1,365 $ 114 $ 129
The provision (benefit) for income tax differs from the amount of income tax determined by applying the applicable U.S. statutory federal income tax rate to pretax income as follows:
December 31, 2014 2013 2012
Federal tax at statutory rate $ 23,931 $ 23,835 $ 17,614 State tax, net 98 19 7 Patronage distributions (13,092) (7,437) (4,442) Tax-exempt FLCA earnings (18,888) (18,922) (14,524) Dividends from tax-exempt FLCA 8,392 2,887 2,408 Change in deferred tax asset valuation allowance 522 1,009 621 Other 402 (1,277) (1,555)
Provision (benefit) for income taxes $ 1,365 $ 114 $ 129
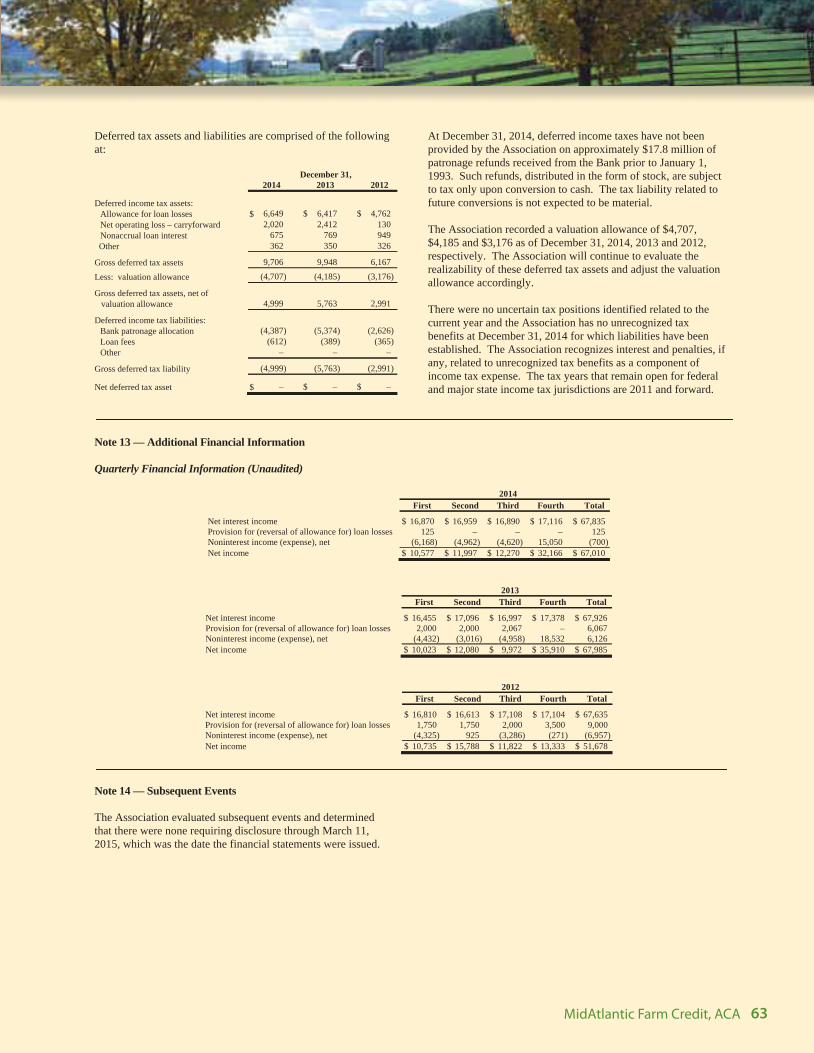
63MidAtlantic Farm Credit, ACA
Deferred tax assets and liabilities are comprised of the following at:
December 31, 2014 2013 2012
Deferred income tax assets: Allowance for loan losses $ 6,649 $ 6,417 $ 4,762 Net operating loss – carryforward 2,020 2,412 130 Nonaccrual loan interest 675 769 949 Other 362 350 326
Gross deferred tax assets 9,706 9,948 6,167
Less: valuation allowance (4,707) (4,185) (3,176)
Gross deferred tax assets, net of valuation allowance 4,999 5,763 2,991
Deferred income tax liabilities: Bank patronage allocation (4,387) (5,374) (2,626) Loan fees (612) (389) (365) Other – – –
Gross deferred tax liability (4,999) (5,763) (2,991)
Net deferred tax asset $ – $ – $ –
At December 31, 2014, deferred income taxes have not been provided by the Association on approximately $17.8 million of patronage refunds received from the Bank prior to January 1, 1993. Such refunds, distributed in the form of stock, are subject to tax only upon conversion to cash. The tax liability related to future conversions is not expected to be material.
The Association recorded a valuation allowance of $4,707, $4,185 and $3,176 as of December 31, 2014, 2013 and 2012, respectively. The Association will continue to evaluate the realizability of these deferred tax assets and adjust the valuation allowance accordingly.
There were no uncertain tax positions identified related to the current year and the Association has no unrecognized tax benefits at December 31, 2014 for which liabilities have been established. The Association recognizes interest and penalties, if any, related to unrecognized tax benefits as a component of income tax expense. The tax years that remain open for federal and major state income tax jurisdictions are 2011 and forward.
Note 13 — Additional Financial Information
Quarterly Financial Information (Unaudited)
2014 First Second Third Fourth Total
Net interest income $ 16,870 $ 16,959 $ 16,890 $ 17,116 $ 67,835 Provision for (reversal of allowance for) loan losses 125 – – – 125 Noninterest income (expense), net (6,168) (4,962) (4,620) 15,050 (700) Net income $ 10,577 $ 11,997 $ 12,270 $ 32,166 $ 67,010
2013 First Second Third Fourth Total
Net interest income $ 16,455 $ 17,096 $ 16,997 $ 17,378 $ 67,926 Provision for (reversal of allowance for) loan losses 2,000 2,000 2,067 – 6,067 Noninterest income (expense), net (4,432) (3,016) (4,958) 18,532 6,126 Net income $ 10,023 $ 12,080 $ 9,972 $ 35,910 $ 67,985
2012 First Second Third Fourth Total
Net interest income $ 16,810 $ 16,613 $ 17,108 $ 17,104 $ 67,635 Provision for (reversal of allowance for) loan losses 1,750 1,750 2,000 3,500 9,000 Noninterest income (expense), net (4,325) 925 (3,286) (271) (6,957) Net income $ 10,735 $ 15,788 $ 11,822 $ 13,333 $ 51,678
Note 14 — Subsequent Events
The Association evaluated subsequent events and determined that there were none requiring disclosure through March 11, 2015, which was the date the financial statements were issued.

64 MidAtlantic Farm Credit, ACA
Seven Cooperative Principles
MidAtlantic Farm Credit’s Board of Directors
(left to right): Dale J. Ockels; Fred R. Moore, Jr.; Brian L. Boyd; Paul D. Baumgardner, Vice Chairman; Walter C. Hopkins; Deborah A. Benner;
Fred N. West; Paul J. Rock; Dale R. Hershey; T. Jeffery Jennings; M. Wayne Lambertson, Chairman; Ralph L. Robertson, Jr.; Joseph D.
Snapp; Jennifer L. Rhodes; and Gary L. Grossnickle. Missing from photo: Anthony M. Ill, Douglas D. Scott, and Alan N. Siegfried.
1 Voluntary and open membership1 Voluntary and open membership
Cooperatives are voluntary organizations open to allCooperatives are voluntary organizations open to all
persons able to use their services and willing to accept thepersons able to use their services and willing to accept the
responsibilities of membership, without gender, social,responsibilities of membership, without gender, social,
racial, political or religious discrimination.racial, political or religious discrimination.
2 Democratic member control2 Democratic member control
Cooperatives are democratic organizations controlled byCooperatives are democratic organizations controlled by
their members, who actively participate in setting policiestheir members, who actively participate in setting policies
and making decisions. The elected representatives areand making decisions. The elected representatives are
accountable to the membership. In primary cooperatives,accountable to the membership. In primary cooperatives,
members have equal voting rights—one member, onemembers have equal voting rights—one member, one
vote—and cooperatives at other levels are organized in avote—and cooperatives at other levels are organized in a
democratic manner.democratic manner.
3 Members’ economic participation3 Members’ economic participation
Members contribute equitably to, and democraticallyMembers contribute equitably to, and democratically
control, the capital of their cooperative. At least part of thatcontrol, the capital of their cooperative. At least part of that
capital is usually the common property of the cooperative.capital is usually the common property of the cooperative.
Members usually receive limited compensation, if any,Members usually receive limited compensation, if any,
on capital subscribed as a condition of membership.on capital subscribed as a condition of membership.
Members allocate surpluses for any or all of the followingMembers allocate surpluses for any or all of the following
purposes: developing the cooperative, possibly by settingpurposes: developing the cooperative, possibly by setting
up reserves, part of which at least would be indivisible;up reserves, part of which at least would be indivisible;
benefitting members in proportion to their transactionsbenefitting members in proportion to their transactions
with the cooperative; and supporting other activitieswith the cooperative; and supporting other activities
approved by the membership.approved by the membership.
4 Autonomy and independence4 Autonomy and independence
Cooperatives are autonomous, self-help organizationsCooperatives are autonomous, self-help organizations
controlled by their members. If they enter into agreementscontrolled by their members. If they enter into agreements
with other organizations, including governments, or raisewith other organizations, including governments, or raise
capital from external sources, they do so on terms thatcapital from external sources, they do so on terms that
ensure democratic control by their members and maintainensure democratic control by their members and maintain
their cooperative autonomy.their cooperative autonomy.
5 Education, training and information5 Education, training and information
Cooperatives provide education and training for theirCooperatives provide education and training for their
members, elected representatives, managers, andmembers, elected representatives, managers, and
employees so that they can contribute effectively toemployees so that they can contribute effectively to
the development of their cooperatives. They inform thethe development of their cooperatives. They inform the
general public, particularly young people and opiniongeneral public, particularly young people and opinion
leaders, about the nature and benefits of cooperation.leaders, about the nature and benefits of cooperation.
6 Cooperation among cooperatives6 Cooperation among cooperatives
Cooperatives serve their members most effectivelyCooperatives serve their members most effectively
and strengthen the cooperative movement byand strengthen the cooperative movement by
working together through local, national, regionalworking together through local, national, regional
and international structures.and international structures.
7 Concern for community7 Concern for community
While focusing on member needs, cooperatives workWhile focusing on member needs, cooperatives work
for the sustainable development of their communitiesfor the sustainable development of their communities
through policies accepted by their members.through policies accepted by their members.

65MidAtlantic Farm Credit, ACA
MidAtlantic Farm Credit’s Senior Management Team
(left to right): Kelly S. Borhrer; Kenneth M. Bounds; J. Robert Frazee, President and CEO; Sandra L. Wieber; Carl E. Naugle;
Laura E. Bailey; Thomas J. Marshall; James D. Aird; John E. Wheeler, Jr.; Thomas H. Truitt; Sonia Arteaga; Jeffrey M. Tyson;
and Tammy L. Price.
888.339.3334
mafc.com
MidAtlantic Farm Credit, ACA
45 Aileron Court
Westminster, MD 21157-3022
PRSRT STDU.S. POSTAGE
PAIDCOLUMBIA, S.C.
PERMIT NO. 1160
MidAtlantic Farm Credit is customer
owned and customer focused.
We work every day to:
• Give our customers best-in-class solutions for their financial needs.
• Manage their association efficiently, safely and soundly.
• Be dependable, in good times and bad, for this and future generations.
• Embrace a performance-oriented culture that is diverse, inclusive, and reflective of our marketplace.
Privacy Policy
At MidAtlantic Farm Credit we recognize your expectation of privacy and
confidentiality of personal financial information when seeking the assistance of
outside professionals to obtain credit. We have taken great care in establishing and
implementing policies and procedures and have committed to an ongoing review
of those policies and procedures to protect your personal and financial information.
Your privacy is a top priority in all aspects of our business. Our employees are
informed of their responsibility to protect your confidential information and are
governed by strict standards of conduct, which prohibit unauthorized use of your
information. Security procedures and internal controls are also in place to protect
your privacy.
We collect personally identifiable information (such as name, address, SSN) only
if specifically and knowingly provided by you. We do not give, sell or transfer any
personal information to third parties, unless required by law or under such other
permissible purposes as set forth by regulation.
For more details visit mafc.com/privacy-policy.php
MIDATLANT I C


