43
Livestock Enterprise Information Dairy – By Profitability – By Herd Size Beef Hogs Statewide Data
Livestock Enterprise Information
Dairy
– By Profitability
– By Herd Size
Beef
Hogs
Statewide Data

Livestock Enterprise Information
Dairy data on slides prior to
“Dairy by herd size” does
not include Organic Production

Number of Dairy Cows
Average Farm
20
70
120
170
220
Cow #s
117 122128
140 134 140
160170 179
184
2005 2006 2007 2008 2009 2010 2011 2012 2013 2014
The average number of dairy cows up again in 2014
Pg 50-51

Number of Dairy Cows –
Median income farms
40
90
140
190
240
Cow #s
106
138 134152
162
123
184
220
152
223
2005 2006 2007 2008 2009 2010 2011 2012 2013 2014
Pg 50-51

Production &
Returns per Cow
-400
-200
0
200
400
600
800
1000
1200
1400
16,000
17,000
18,000
19,000
20,000
21,000
22,000
23,000
24,000
25,000
2005 2006 2007 2008 2009 2010 2011 2012 2013 2014
# milk/cow return/cow
Milk production up slightly - Returns up Significantly
Pg 50-51

Milk Price less Feed Cost
8.15
7.1
9.93 9.62
7.31
9.9
7.44 7.49
10.5610.22
7.99
11.8811.26
6.21
9.02
11.01
9.359.93
14.15
0
2
4
6
8
10
12
14
16
1996 1997 1998 1999 2000 2001 2002 2003 2004 2005 2006 2007 2008 2009 2010 2011 2012 2013 2014
Dolla
rs p
er
CW
T
Returns UP!!!
Pg 50-51

Dairy Cows –Costs and Gross Margin per CWT
Feed
Direct
Dir & Ovhd
Gross Margin
$0.00
$7.00
$14.00
$21.00
$28.00
Average Mid 40-60 High
$10.22 $10.34 $9.58
$15.57 $16.23$13.67
$18.38 $18.44 $17.45
$23.64 $23.39$24.61
Net Returns: $5.26 $4.95 $7.16
Pg 50

Dairy Cows – 3-yr viewCosts and Gross Margin per CWT
Feed
Direct
Dir & Ovhd
Gross Margin
$0.00
$7.00
$14.00
$21.00
$28.00
2012 2013 2014
$10.19 $10.37 $10.22
$14.86 $15.18$15.57
$17.44 $17.81 $18.38
$18.72 $19.06
$23.64
Net Returns: $1.28 $1.25 $5.26
Pg 50
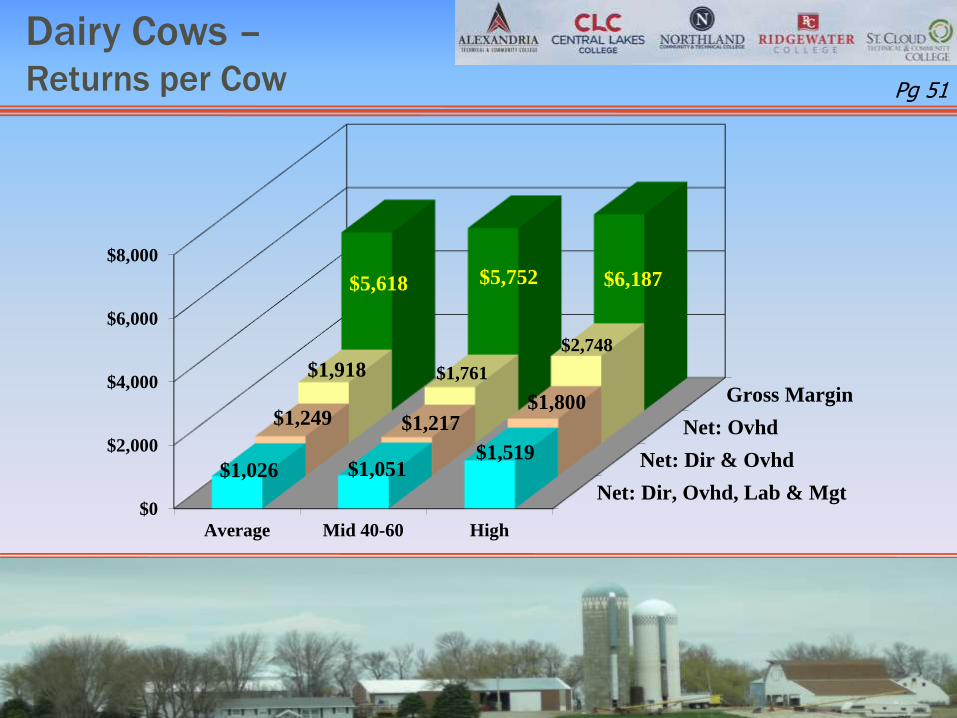
Dairy Cows –Returns per Cow
Net: Dir, Ovhd, Lab & Mgt
Net: Dir & Ovhd
Net: Ovhd
Gross Margin
$0
$2,000
$4,000
$6,000
$8,000
Average Mid 40-60 High
$1,026 $1,051$1,519
$1,249 $1,217$1,800
$1,918 $1,761
$2,748
$5,618 $5,752 $6,187
Pg 51

Dairy Cows – 3-yr viewReturns per Cow
Net: Dir, Ovhd, Lab & Mgt
Net: Dir & Ovhd
Net: Ovhd
Gross Margin
$0
$2,000
$4,000
$6,000
2012 2013 2014$89
$90
$1,026$290 $287
$1,249$879 $895
$1,918
$4,263 $4,400
$5,618
Pg 65
How About 2015?

How about 2015?
2014 % Change Est. 2015
Milk Produced 23,556 + 2% 24,027
Feed Cost $2,420.33 - 5% $2,299.31
Fuel $117.01 - 30% $81.91
Repairs $181.12 + 5% $190.18
Hired Labor $437.62 + 5% $459.50
Utilities $69.14 + 5% $72.60
Assuming all other expenses and income stay the same
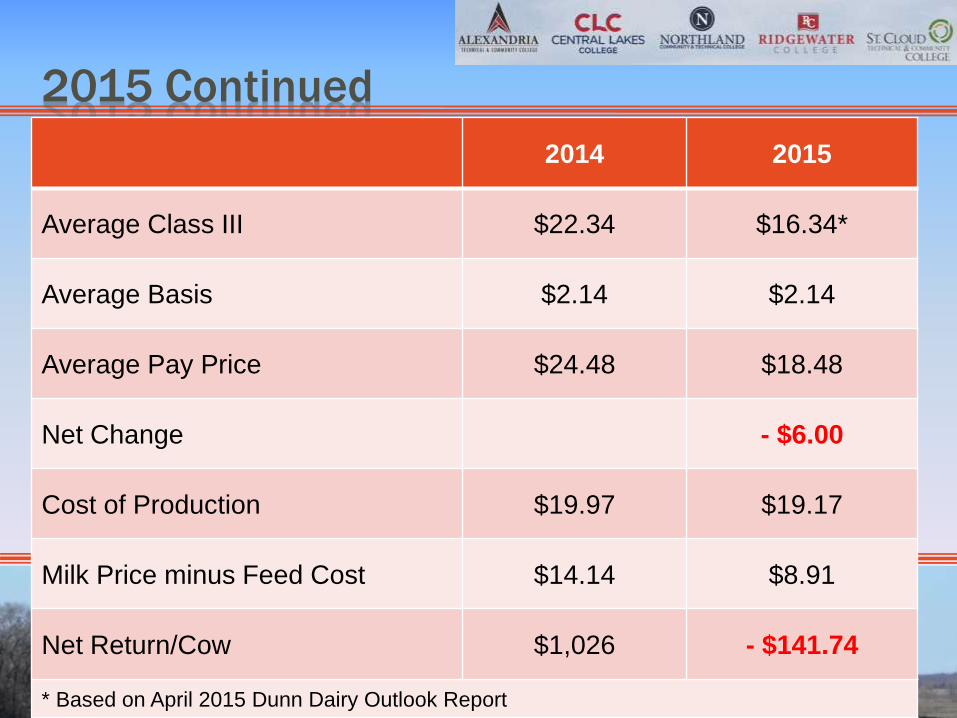
2015 Continued
2014 2015
Average Class III $22.34 $16.34*
Average Basis $2.14 $2.14
Average Pay Price $24.48 $18.48
Net Change - $6.00
Cost of Production $19.97 $19.17
Milk Price minus Feed Cost $14.14 $8.91
Net Return/Cow $1,026 - $141.74
* Based on April 2015 Dunn Dairy Outlook Report

Production &
Returns per Cow
-400
-200
0
200
400
600
800
1000
1200
1400
16,000
17,000
18,000
19,000
20,000
21,000
22,000
23,000
24,000
25,000
2006 2007 2008 2009 2010 2011 2012 2013 2014 2015
# milk/cow return/cow
Estimated 2015
Pg 50-51

Milk Price less Feed Cost
7.1
9.93 9.62
7.31
9.9
7.44 7.49
10.5610.22
7.99
11.8811.26
6.21
9.02
11.01
9.369.93
14.15
8.91
0
2
4
6
8
10
12
14
16
1997 1998 1999 2000 2001 2002 2003 2004 2005 2006 2007 2008 2009 2010 2011 2012 2013 2014 2015
Dolla
rs p
er
CW
T
Estimated 2015
Pg 50-51
Dairy Cows - MN Dairy Sort
Data by Size of Herd-- All Dairy Herds,
including Organic --
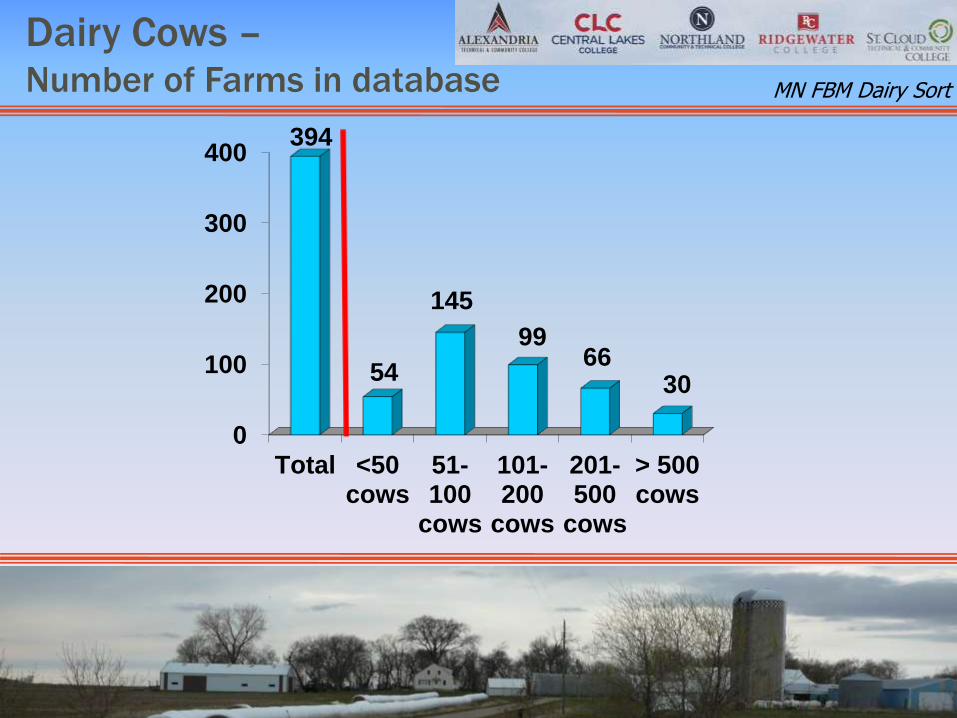
Dairy Cows –Number of Farms in database
0
100
200
300
400
Total <50cows
51-100
cows
101-200
cows
201-500
cows
> 500cows
394
54
145
9966
30
MN FBM Dairy Sort

0%
10%
20%
30%
40%
50%
60%
70%
80%
90%
100%
Total <50cows
51-100cows
101-200
cows
201-500
cows
> 500cows
396
14%
37%
25%
17%
8%
0%
5%
10%
15%
20%
25%
30%
35%
40%
45%
Total <50cows
51-100
cows
101-200
cows
201-500
cows
> 500cows
12%
5%
10%
29% 31%
44%
Dairy Cows –Number of Herds and Percent of MN Farms
Some herd data provided by the Minn Department of Ag.
MN FBM Dairy Sort

0%
10%
20%
30%
40%
50%
Total <50cows
51-100cows
101-200cows
201-500cows
> 500cows
2012 10% 3% 10% 28% 33% 35%
2013 11% 4% 9% 31% 29% 35%
2013 12% 5% 10% 29% 31% 44%
12%
5%
10%
29% 31%
44%
2012
2013
2013
Dairy Cows –Farms as percent of all MN herds MN FBM Dairy Sort

Minnesota Dairy Sort
Selected Factors - Size and Production
16625
1991621614
2401826487
38 74140
312
797
0
200
400
600
800
1000
1200
Up to 50Cows
50 - 100Cows
100-200Cows
200-500Cows
Over 500Cows
Pounds of Milk No. of Cows
MN FBM Dairy Sort

Minnesota Dairy SortSelected Factors - Cost and Price
Feed
Dir & Ovhd
Dir, Ovhd, & Lab
Gross Margin
0.00
7.00
14.00
21.00
28.00
<50 Cows 51-100 101-200 201-500 >500 Cows
11.52 10.97 10.26 10.29 9.97
19.07 18.52 18.08 18.87 18.23
21.5720.08 19.30 19.65 18.90
23.0423.87 23.65
23.86 23.57
Ave Price = $24.43 Ave Cost w Labor = $19.40
MN FBM Dairy Sort
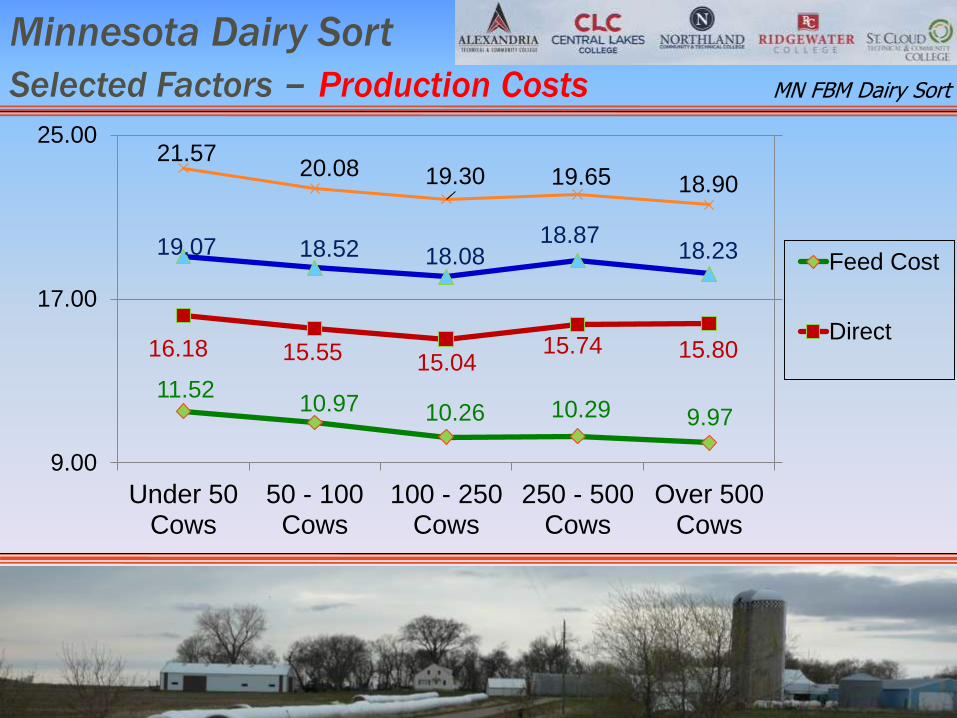
11.5210.97 10.26 10.29 9.97
16.18 15.55 15.0415.74 15.80
19.07 18.52 18.0818.87
18.23
21.5720.08 19.30 19.65 18.90
9.00
17.00
25.00
Under 50Cows
50 - 100Cows
100 - 250Cows
250 - 500Cows
Over 500Cows
Feed Cost
Direct
Minnesota Dairy Sort
Selected Factors – Production Costs MN FBM Dairy Sort

Minnesota Dairy SortHired Labor and Operator Labor/Mgmt MN FBM Dairy Sort
2.50
1.561.22
0.78 0.67
0.37
0.881.31 2.08 2.35
0.00
0.50
1.00
1.50
2.00
2.50
3.00
3.50
Up to 50Cows
50-100Cows
101-200Cows
201-500Cows
Over 500Cows
Lbr & Mgt Charge Total Hired Labor
3.022.44 2.862.532.87
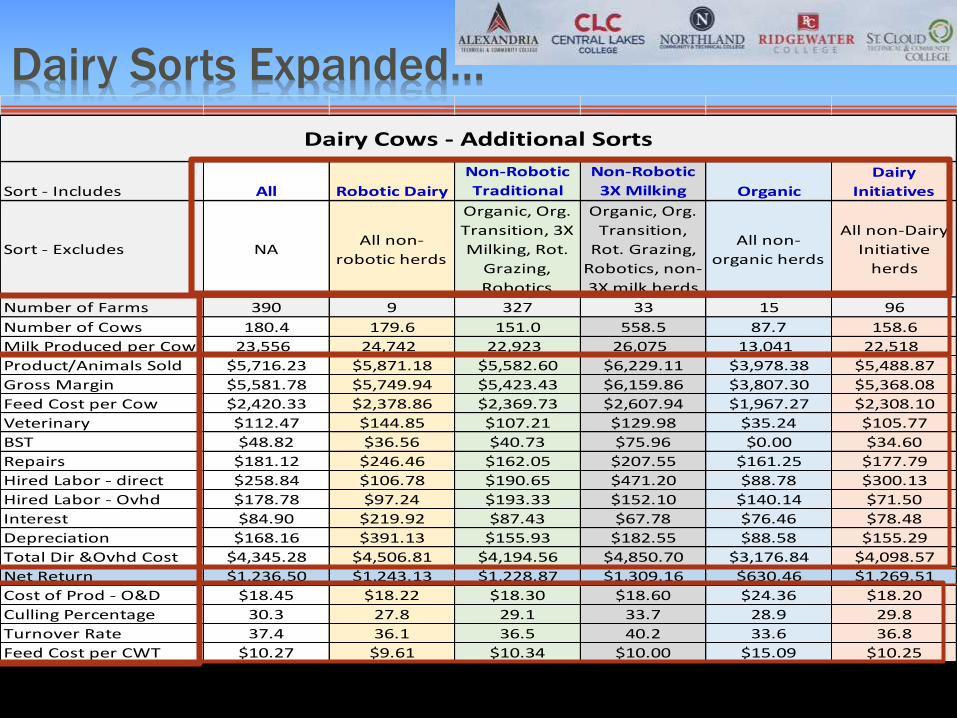
Dairy Sorts Expanded…
Sort - Includes All Robotic Dairy
Non-Robotic
Traditional
Non-Robotic
3X Milking Organic
Dairy
Initiatives
Sort - Excludes NAAll non-
robotic herds
Organic, Org.
Transition, 3X
Milking, Rot.
Grazing,
Robotics
Organic, Org.
Transition,
Rot. Grazing,
Robotics, non-
3X milk herds
All non-
organic herds
All non-Dairy
Initiative
herds
Number of Farms 390 9 327 33 15 96
Number of Cows 180.4 179.6 151.0 558.5 87.7 158.6
Milk Produced per Cow 23,556 24,742 22,923 26,075 13,041 22,518
Product/Animals Sold $5,716.23 $5,871.18 $5,582.60 $6,229.11 $3,978.38 $5,488.87
Gross Margin $5,581.78 $5,749.94 $5,423.43 $6,159.86 $3,807.30 $5,368.08
Feed Cost per Cow $2,420.33 $2,378.86 $2,369.73 $2,607.94 $1,967.27 $2,308.10
Veterinary $112.47 $144.85 $107.21 $129.98 $35.24 $105.77
BST $48.82 $36.56 $40.73 $75.96 $0.00 $34.60
Repairs $181.12 $246.46 $162.05 $207.55 $161.25 $177.79
Hired Labor - direct $258.84 $106.78 $190.65 $471.20 $88.78 $300.13
Hired Labor - Ovhd $178.78 $97.24 $193.33 $152.10 $140.14 $71.50
Interest $84.90 $219.92 $87.43 $67.78 $76.46 $78.48
Depreciation $168.16 $391.13 $155.93 $182.55 $88.58 $155.29
Total Dir &Ovhd Cost $4,345.28 $4,506.81 $4,194.56 $4,850.70 $3,176.84 $4,098.57
Net Return $1,236.50 $1,243.13 $1,228.87 $1,309.16 $630.46 $1,269.51
Cost of Prod - O&D $18.45 $18.22 $18.30 $18.60 $24.36 $18.20
Culling Percentage 30.3 27.8 29.1 33.7 28.9 29.8
Turnover Rate 37.4 36.1 36.5 40.2 33.6 36.8
Feed Cost per CWT $10.27 $9.61 $10.34 $10.00 $15.09 $10.25
Dairy Cows - Additional Sorts

Robotic Dairy Robotic All 3X Herds Vs. 3X
Milk/Cow 24,742 23,556 26,075 -1,333
Feed Cost $9.61 $10.27 $10.00 - 0.39
Vet $144.85 $112.47 $129.98 + 14.87
Supplies $346.35 $341.93 $312.05 + 34.30
Repairs $246.46 $181.12 $207.55 + 38.91
Labor (total) $410.62 $661.57 $816.48 - 405.86
Utilities $148.66 $69.14 $67.89 + 80.77
Interest $219.92 $84.90 $67.78 + 152.15
Depreciation $391.13 $166.72 $182.55 + 208.58
COP
w/Labor
$19.71 $20.09 $19.78 - .07
Lbs
Milk/FTE
2,543,980 1,611,802 1,584,551 + 959,429
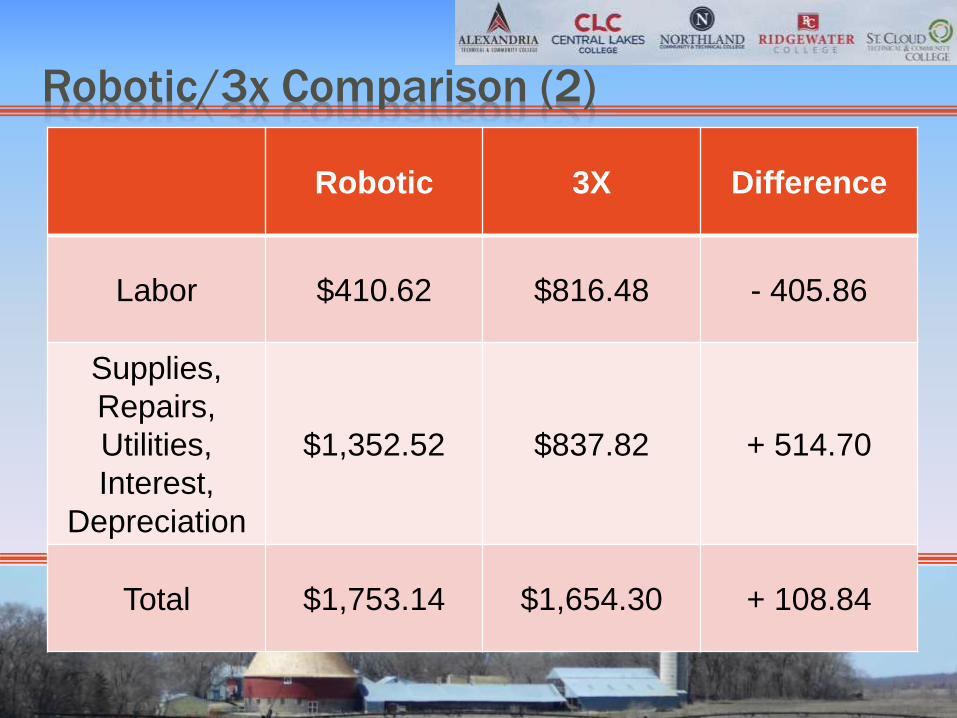
Robotic/3x Comparison (2)
Robotic 3X Difference
Labor $410.62 $816.48 - 405.86
Supplies,
Repairs,
Utilities,
Interest,
Depreciation
$1,352.52 $837.82 + 514.70
Total $1,753.14 $1,654.30 + 108.84

Robotic/3x Comparison (Labor Efficiency)
Robotic 3X Difference
Labor
Hrs/Cow26.95 45.67 59%
$/Hr $15.24 $17.88
Milk/FTE 2,543,980 1,584,551 62%

3X vs. TraditionalTraditional 3X Herds Difference
Milk/Cow 22,923 26,075 + 3,152
Hrs/Cow 39.23 45.87 + 6.64
Labor (total) $617.80 $816.48 + 198.68
Labor
Cost/CWT
Additional
Milk
$15.86
Lbs/FTE 1,627,611 1,584,511 - 43,100
Hrs/CWt .171 .176 - .005
Feed Cost $10.34 $10.00 - 0.34
COP $20.10 $19.78 - 0.32
Net Return $995.05 $1,115.98 $120.93
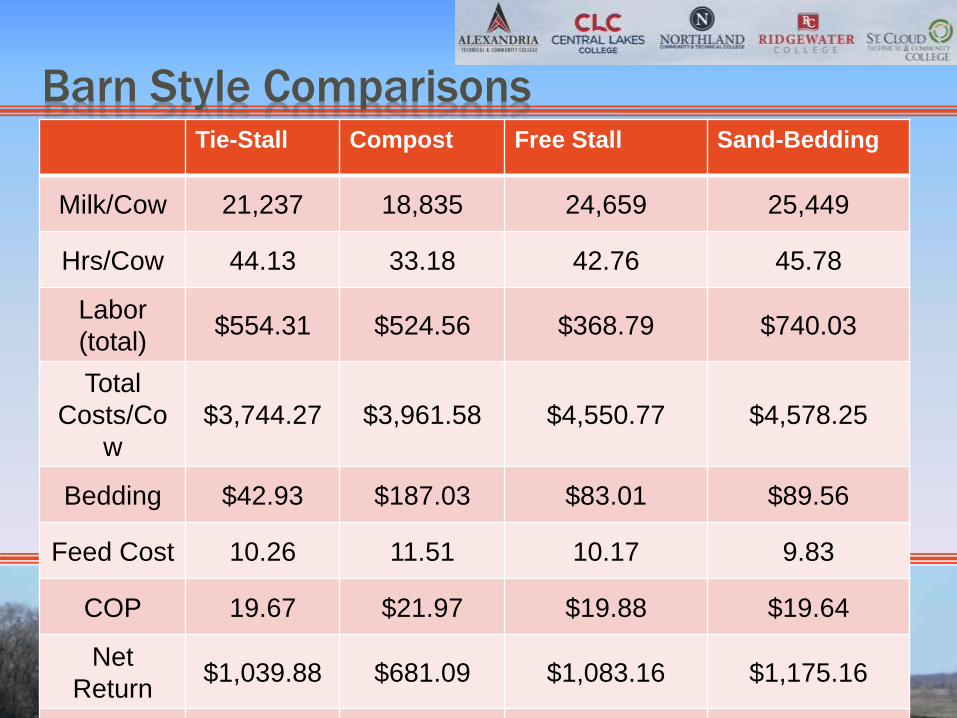
Barn Style ComparisonsTie-Stall Compost Free Stall Sand-Bedding
Milk/Cow 21,237 18,835 24,659 25,449
Hrs/Cow 44.13 33.18 42.76 45.78
Labor
(total)$554.31 $524.56 $368.79 $740.03
Total
Costs/Co
w
$3,744.27 $3,961.58 $4,550.77 $4,578.25
Bedding $42.93 $187.03 $83.01 $89.56
Feed Cost 10.26 11.51 10.17 9.83
COP 19.67 $21.97 $19.88 $19.64
Net
Return$1,039.88 $681.09 $1,083.16 $1,175.16
Avg

Bedding Comparisons (2)
0
5
10
15
20
25
Tie-Stall Compost FreeStall SandBedding
Feed
Labor
Overhead
Direct

BST vs. Non-BSTBST Non-BST Difference
Milk Produced 25,581 23,280 + 2,301
Feed Costs $10.16 $10.26 - 0.10
Total Direct Costs $16.21 $15.42 + 0.79
Overhead Costs $2.71 $2.80 - 0.09
BST Cost $0.42 $0 + 0.42
BST
Cost/Additional
Milk
$4.65
Total COP $19.95 $20.03 - 0.08

Dairy Finishing –Net Return & Price per Cwt up
82.40
100.04110.26 113.17
130.69
8.98 12.39 7.05 3.07
48.66
2010 2011 2012 2013 2014
Price Recv'd/Cwt Net Return/Cwt
Pg 57

Beef Cow-Calf Returns -Net per Cow
($200.00)
($100.00)
$0.00
$100.00
$200.00
$300.00
$400.00
$500.00
Net Return
$168.89
$61.38
($27.42)
($112.55) ($120.51)
$53.60
$127.61 $88.27
$36.61
$451.63
2005 2006 2007 2008 2009 2010 2011 2012 2013 2014
Pg 60

Beef Cow/Calf Cost of Production Trends
0
20
40
60
80
100
120
140
160
180
2009 2010 2011 2012 2013 2014
Cost of Production per CWT Produced
COP

Beef Cow-Calf –Costs and Returns of Production per Cow
Feed
Direct
Dir & Ovhd
Gross Margin
$0
$450
$900
$1,350
$1,800
Average Mid 40-60 High
$508$470 $482
$685 $618 $639
$844$737 $787
$1,295$1,183
$1,591
Net Returns: $451 $447 $804
Pg 60

Beef Cow-Calf –Costs and Returns of Production per Cow
Feed
Direct
Dir & Ovhd
Gross Margin
$0
$450
$900
$1,350
$1,800
Average Up to 50 50-100 100-200 200-500
$508 $497 $529 $548$397
$685 $676 $700 $725$581
$844 $882 $870 $866
$696
$1,295 $1,217 $1,301 $1,313 $1,340
Net Returns: $451 $335 $431 $447 $644
Pg 61
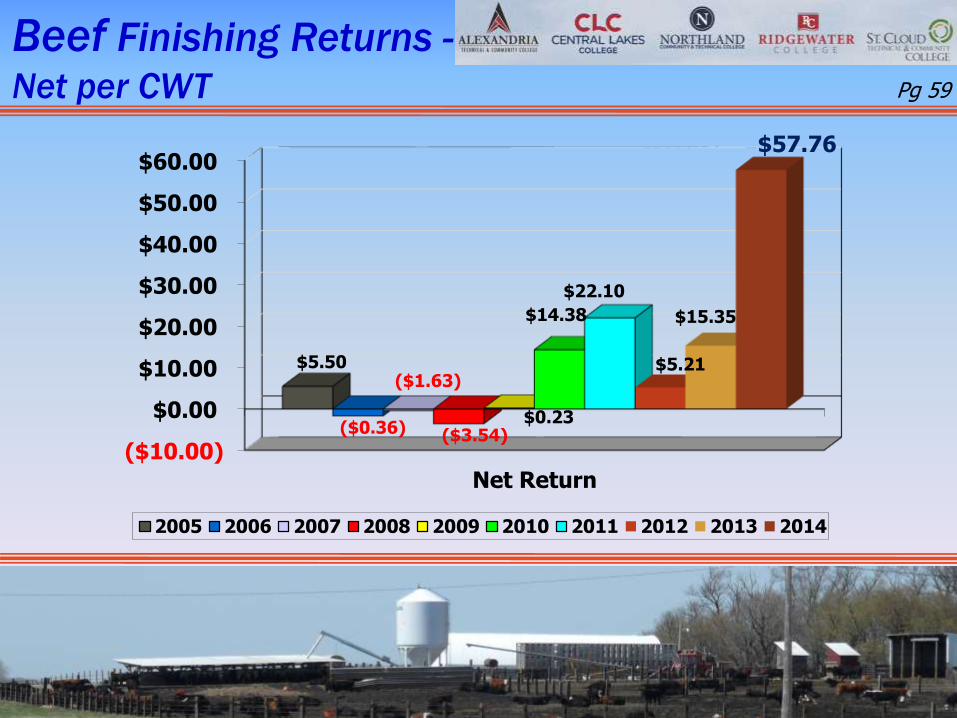
Beef Finishing Returns -Net per CWT
($10.00)
$0.00
$10.00
$20.00
$30.00
$40.00
$50.00
$60.00
Net Return
$5.50 ($1.63)
($0.36) ($3.54)$0.23
$14.38
$22.10
$5.21
$15.35
$57.76
2005 2006 2007 2008 2009 2010 2011 2012 2013 2014
Pg 59

Farrow to Finish Hogs –Net Return & Price per Cwt
54.03
71.61 69.4370.52
104.32
2.90
7.62
2.28
8.42
32.42
2010 2011 2012 2013 2014
Price Recv'd/Cwt Net Return/Cwt
Not in Report
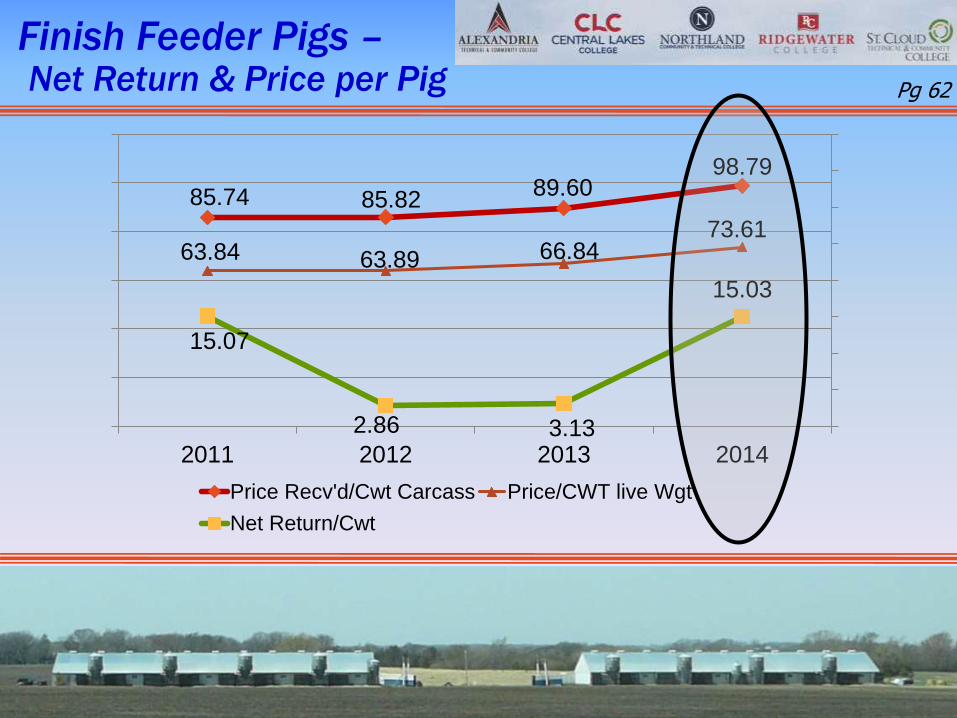
Finish Feeder Pigs –Net Return & Price per Pig
85.74 85.8289.60
98.79
63.84 63.89 66.8473.61
15.07
2.86 3.13
15.03
2011 2012 2013 2014
Price Recv'd/Cwt Carcass Price/CWT live Wgt
Net Return/Cwt
Pg 62
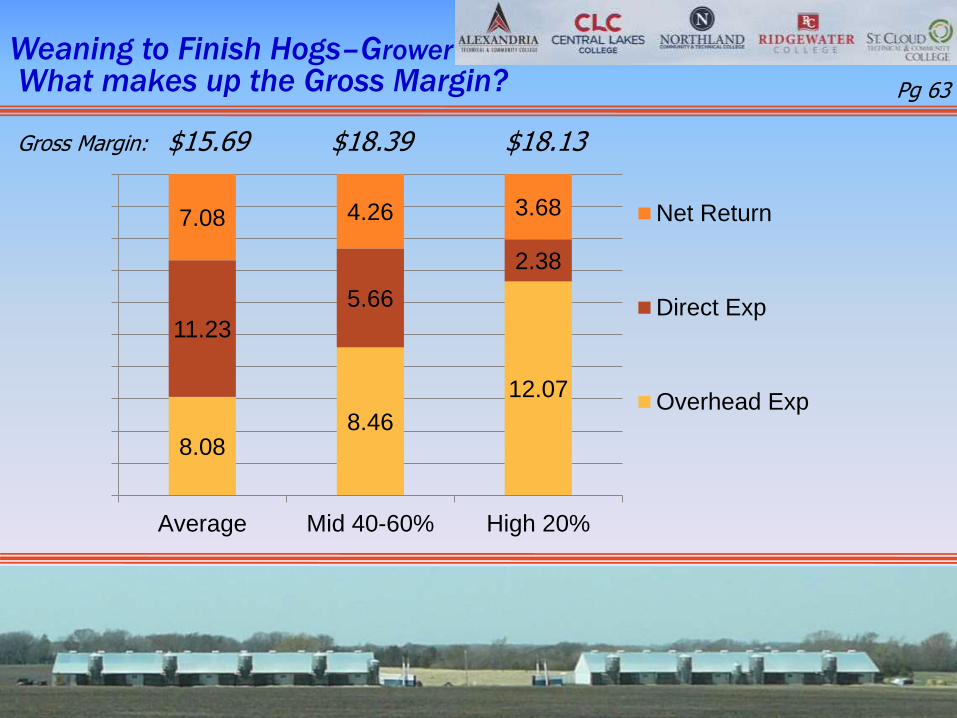
Weaning to Finish Hogs–GrowerWhat makes up the Gross Margin?
8.088.46
12.07
11.23
5.66
2.38
7.08 4.26 3.68
Average Mid 40-60% High 20%
Net Return
Direct Exp
Overhead Exp
Pg 63
Note: Sort for returns is based on Return to Overhead
Gross Margin: $15.69 $18.39 $18.13

.
In closing…

.
In closing…
Diligence in the mother of good luck.

Thank you for listening to a review of this year’s Farm Business Management Annual Report information.


