American Electric Power Development of 2014 Funding Rates for Active Employees Self-Insured Medical and Dental Plans March 2015, based on analysis performed in 2013 http://natct.internal.towerswatson.com/clients/604598/Financial/Documents/2014_Funding_rates.doc KPSC Case No. 2014-00396 Attorney General's Second Set of Data Requests Dated February 24, 2015 Item 60 Attachment 1 Page 1 of 9
Transcript
American Electric Power
Development of 2014 Funding Rates for Active Employees Self-Insured Medical and Dental Plans March 2015, based on analysis performed in 2013 http://natct.internal.towerswatson.com/clients/604598/Financial/Documents/2014_Funding_rates.doc
KPSC Case No. 2014-00396 Attorney General's Second Set of Data Requests
Dated February 24, 2015 Item 60
Attachment 1 Page 1 of 9
1
Overview This report presents 2014 rates for American Electric Power’s (AEP) self-insured medical and dental plans for active employees. The development of the recommended 2014 funding rates for the medical and dental plans is shown on Exhibits 3 and 4, with the recommended rates shown in boxes at the bottom of those exhibits. Data Sources, Methodology and Assumptions All vendors servicing AEP patients in 2012 were contacted and all provided the requested information. Claims data were obtained from the following vendors in an electronic format: Aetna, Lumenos, Magellan and Express Scripts. Enrollment data for medical plans were obtained from AEP. Dental enrollment data were obtained from Aetna. For the medical and dental plans, we analyzed 2012 enrollment and claims incurred in 2012 and paid through March 2013; we then projected the claim rates to 2014, adjusting for trend and estimating the effect of changes in plan provisions and benefit schedules. Projected administration expense fees to be charged by claims administrators were included in the development of 2014 rates. We have adjusted prescription drug claims experience for rebates expected to be received from Express Scripts under the terms of the Towers Watson Rx Collaborative. To arrive at the final 2014 monthly rates for each medical plan option, we adjust these rates for: Health risk adjustments Differences in plan design and geography These adjustments to the claim rates are illustrated in Exhibit 2 and are described in more detail below and on the following pages. Health Risk Adjustments 2012 claims for all medical plans were adjusted to a common plan design and pooled together. For the Lumenos CDHP, we included with claims experience, 50% of employees’ unused HRA dollars that were rolled over for future use. We calculated a common claim rate across the entire pool and trended to 2014 using the trend rate assumptions shown on Exhibit 2. Claim rates were determined for each individual plan (Aetna Open Choice/Open Access, Aetna HDHP and Lumenos CDHP) by neutralizing the portion of the rate differences arising from demographic, health status and geographic risk factors underlying the Aetna and Lumenos experience. These demographic and geographic risk factors were calculated using 2012 census data, while the health status scores were tabulated by Thomson Reuters. The resulting risk-adjusted rates were closer together, and the remaining differences in rates between the options can be attributed to differences in: Benefit provisions Network efficiency Miscellaneous factors such as judicious use of services covered by the medical plan
KPSC Case No. 2014-00396 Attorney General's Second Set of Data Requests
Dated February 24, 2015 Item 60
Attachment 1 Page 2 of 9
2
The risk-adjusted rates enable AEP to set employee contribution rates for Aetna and Lumenos plan options using plan cost rates that approximate what AEP would set if all employees enrolled in that option. Exhibit 2 illustrates the development of these factors. Plan Design Changes Effective January 1, 2014, AEP implemented the following program and plan design change to the medical and prescription drug benefit medical plan offerings for active employees and retirees: Changes in the Rx Formulary List Included Teladoc program AEP’s self-insured medical plan offerings to active employees and pre-65 retirees will feature the following key plan provisions in 2014:
Aetna PPO Lumenos HRA Aetna HDHP Medical (Single/Family) Annual Deductible $250/$750 $1,500/$2.250/$3,000* $2,500/$7,500 HRA Allocation/HSA Seed N/A $1,000/$1,500/$2,000 None Deductible Gap N/A $500/$750/$1,000* N/A Coinsurance 85% 85% 100% Out-of-Pocket Maximum** $2,500/$5,000 $4,000/$6,000/$8,000* $2,500/$7,500 Office Visit Copays Teladoc $20 Deductible/Coins. Deductible/Coins Primary Care Provider $20 Deductible/Coins. Deductible/Coins. Specialist $35 Deductible/Coins. Deductible/Coins. Urgent Care $50 Deductible/Coins. Deductible/Coins. ER Copays $100 Deductible/Coins. Deductible/Coins. Prescription Drugs Annual Deductible $50/$100 - Retail Combined with Medical Combined with Medical Retail Generic $5 Deductible/Coins. Deductible/Coins. Brand Preferred (min/max) 80% ($20/$100) Deductible/Coins. Deductible/Coins.
Out-of-Pocket Maximum $1,000/$3,000 Combined with Medical Combined with Medical *Individual deductibles and out-of-pocket maximums don’t exist for family tiers. **Includes HRA allocation.
KPSC Case No. 2014-00396 Attorney General's Second Set of Data Requests
Dated February 24, 2015 Item 60
Attachment 1 Page 3 of 9
3
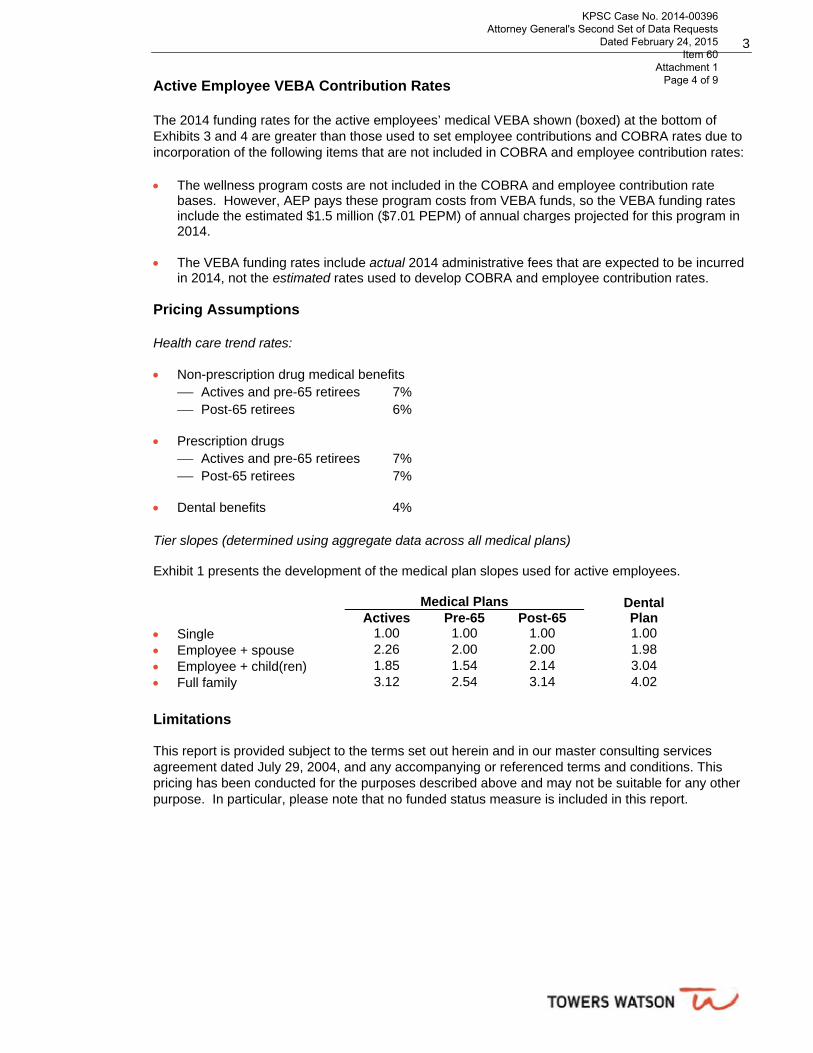
Active Employee VEBA Contribution Rates The 2014 funding rates for the active employees’ medical VEBA shown (boxed) at the bottom of Exhibits 3 and 4 are greater than those used to set employee contributions and COBRA rates due to incorporation of the following items that are not included in COBRA and employee contribution rates: The wellness program costs are not included in the COBRA and employee contribution rate
bases. However, AEP pays these program costs from VEBA funds, so the VEBA funding rates include the estimated $1.5 million ($7.01 PEPM) of annual charges projected for this program in 2014.
The VEBA funding rates include actual 2014 administrative fees that are expected to be incurred
in 2014, not the estimated rates used to develop COBRA and employee contribution rates. Pricing Assumptions Health care trend rates: Non-prescription drug medical benefits
Actives and pre-65 retirees 7% Post-65 retirees 6%
Prescription drugs
Actives and pre-65 retirees 7% Post-65 retirees 7%
Dental benefits 4% Tier slopes (determined using aggregate data across all medical plans) Exhibit 1 presents the development of the medical plan slopes used for active employees.
Medical Plans Dental Plan Actives Pre-65 Post-65
Single 1.00 1.00 1.00 1.00 Employee + spouse 2.26 2.00 2.00 1.98 Employee + child(ren) 1.85 1.54 2.14 3.04 Full family 3.12 2.54 3.14 4.02
Limitations
This report is provided subject to the terms set out herein and in our master consulting services agreement dated July 29, 2004, and any accompanying or referenced terms and conditions. This pricing has been conducted for the purposes described above and may not be suitable for any other purpose. In particular, please note that no funded status measure is included in this report.
KPSC Case No. 2014-00396 Attorney General's Second Set of Data Requests
Dated February 24, 2015 Item 60
Attachment 1 Page 4 of 9
4
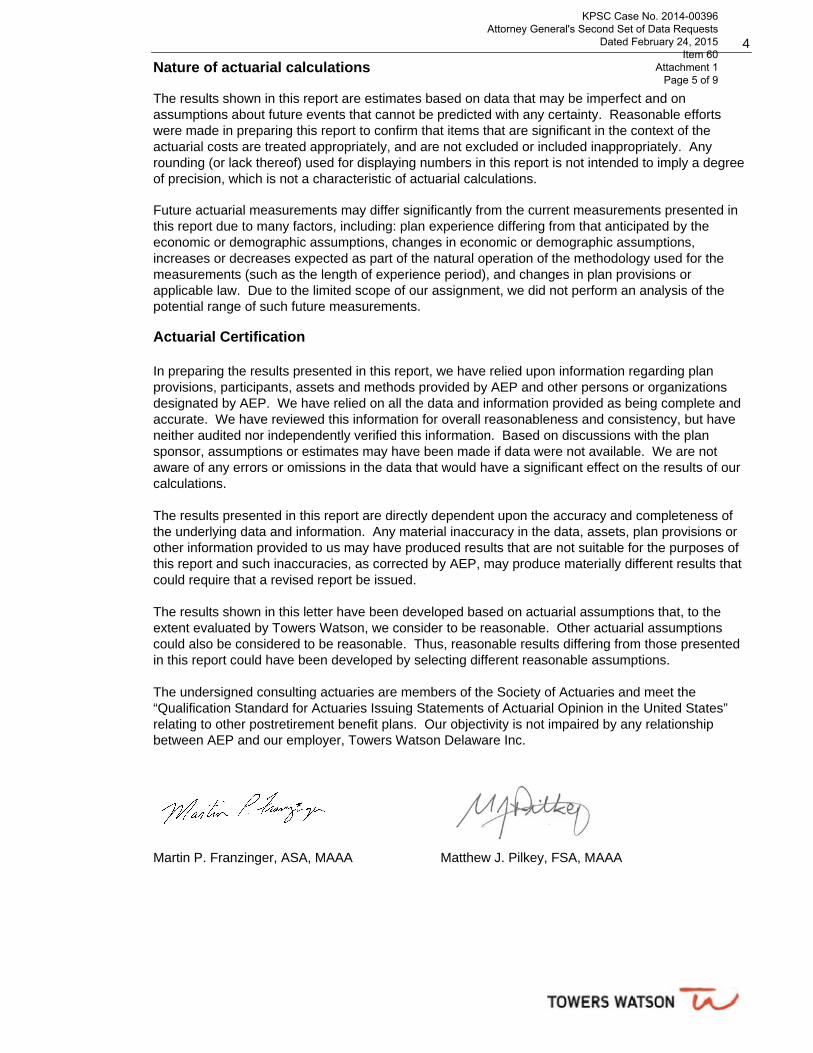
Nature of actuarial calculations The results shown in this report are estimates based on data that may be imperfect and on assumptions about future events that cannot be predicted with any certainty. Reasonable efforts were made in preparing this report to confirm that items that are significant in the context of the actuarial costs are treated appropriately, and are not excluded or included inappropriately. Any rounding (or lack thereof) used for displaying numbers in this report is not intended to imply a degree of precision, which is not a characteristic of actuarial calculations. Future actuarial measurements may differ significantly from the current measurements presented in this report due to many factors, including: plan experience differing from that anticipated by the economic or demographic assumptions, changes in economic or demographic assumptions, increases or decreases expected as part of the natural operation of the methodology used for the measurements (such as the length of experience period), and changes in plan provisions or applicable law. Due to the limited scope of our assignment, we did not perform an analysis of the potential range of such future measurements.
Actuarial Certification
In preparing the results presented in this report, we have relied upon information regarding plan provisions, participants, assets and methods provided by AEP and other persons or organizations designated by AEP. We have relied on all the data and information provided as being complete and accurate. We have reviewed this information for overall reasonableness and consistency, but have neither audited nor independently verified this information. Based on discussions with the plan sponsor, assumptions or estimates may have been made if data were not available. We are not aware of any errors or omissions in the data that would have a significant effect on the results of our calculations.
The results presented in this report are directly dependent upon the accuracy and completeness of the underlying data and information. Any material inaccuracy in the data, assets, plan provisions or other information provided to us may have produced results that are not suitable for the purposes of this report and such inaccuracies, as corrected by AEP, may produce materially different results that could require that a revised report be issued.
The results shown in this letter have been developed based on actuarial assumptions that, to the extent evaluated by Towers Watson, we consider to be reasonable. Other actuarial assumptions could also be considered to be reasonable. Thus, reasonable results differing from those presented in this report could have been developed by selecting different reasonable assumptions.
The undersigned consulting actuaries are members of the Society of Actuaries and meet the “Qualification Standard for Actuaries Issuing Statements of Actuarial Opinion in the United States” relating to other postretirement benefit plans. Our objectivity is not impaired by any relationship between AEP and our employer, Towers Watson Delaware Inc.
Martin P. Franzinger, ASA, MAAA Matthew J. Pilkey, FSA, MAAA
KPSC Case No. 2014-00396 Attorney General's Second Set of Data Requests
Dated February 24, 2015 Item 60
Attachment 1 Page 5 of 9
5
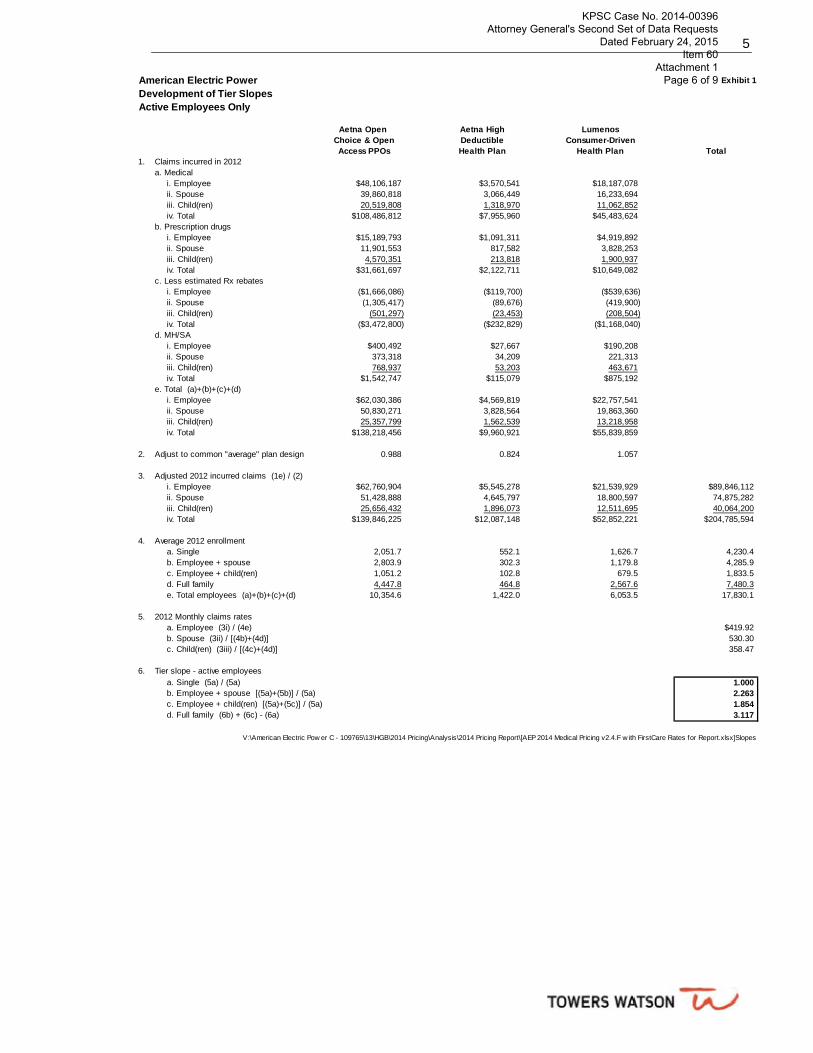
American Electric Power Exhibit 1
Development of Tier SlopesActive Employees Only
Aetna Open Aetna High LumenosChoice & Open Deductible Consumer-DrivenAccess PPOs Health Plan Health Plan Total
1. Claims incurred in 2012a. Medical
i. Employee $48,106,187 $3,570,541 $18,187,078ii. Spouse 39,860,818 3,066,449 16,233,694iii. Child(ren) 20,519,808 1,318,970 11,062,852iv. Total $108,486,812 $7,955,960 $45,483,624
b. Prescription drugsi. Employee $15,189,793 $1,091,311 $4,919,892ii. Spouse 11,901,553 817,582 3,828,253iii. Child(ren) 4,570,351 213,818 1,900,937iv. Total $31,661,697 $2,122,711 $10,649,082
c. Less estimated Rx rebatesi. Employee ($1,666,086) ($119,700) ($539,636)ii. Spouse (1,305,417) (89,676) (419,900)iii. Child(ren) (501,297) (23,453) (208,504)iv. Total ($3,472,800) ($232,829) ($1,168,040)
d. MH/SAi. Employee $400,492 $27,667 $190,208ii. Spouse 373,318 34,209 221,313iii. Child(ren) 768,937 53,203 463,671iv. Total $1,542,747 $115,079 $875,192
e. Total (a)+(b)+(c)+(d)i. Employee $62,030,386 $4,569,819 $22,757,541ii. Spouse 50,830,271 3,828,564 19,863,360iii. Child(ren) 25,357,799 1,562,539 13,218,958iv. Total $138,218,456 $9,960,921 $55,839,859
2. Adjust to common "average" plan design 0.988 0.824 1.057
6. Tier slope - active employeesa. Single (5a) / (5a) 1.000b. Employee + spouse [(5a)+(5b)] / (5a) 2.263c. Employee + child(ren) [(5a)+(5c)] / (5a) 1.854d. Full family (6b) + (6c) - (6a) 3.117
V:\American Electric Pow er C - 109765\13\HGB\2014 Pricing\Analysis\2014 Pricing Report\[AEP 2014 Medical Pricing v2.4.F w ith FirstCare Rates for Report.xlsx]Slopes
KPSC Case No. 2014-00396 Attorney General's Second Set of Data Requests
Dated February 24, 2015 Item 60
Attachment 1 Page 6 of 9
6
American Electric Power Exhibit 2
Development of Efficiency FactorsActive Employees Only
Aetna Medical PlansAetna Open Aetna High Lumenos Average Population
Choice & Open Deductible All Consumer-Driven Average PlanAccess PPOs Health Plan Aetna Health Plan Design Pooling
1. Claims incurred in 2012a. Medical $108,486,812 $7,955,960 $39,444,579b. Prescription drugs 31,661,697 2,122,711 7,802,631c. Projected prescription drug rebates (3,472,800) (232,829) (1,168,040)d. MH/SA 1,542,747 115,079 875,192e. 2012 HRA claims paid 0 0 8,885,496f. Est. PV of Rolled over HRA $ to be used 0 0 332,606g. Total $138,218,456 $9,960,921 $56,172,465
2. Adjust to common plan design within network 1.000 0.834 n/a
V:\American Electric Pow er C - 109765\13\HGB\2014 Pricing\Analysis\2014 Pricing Report\[AEP 2014 Medical Pricing v2.4.F w ith FirstCare Rates for Report.xlsx]Efficiency
KPSC Case No. 2014-00396 Attorney General's Second Set of Data Requests
Dated February 24, 2015 Item 60
Attachment 1 Page 7 of 9
7
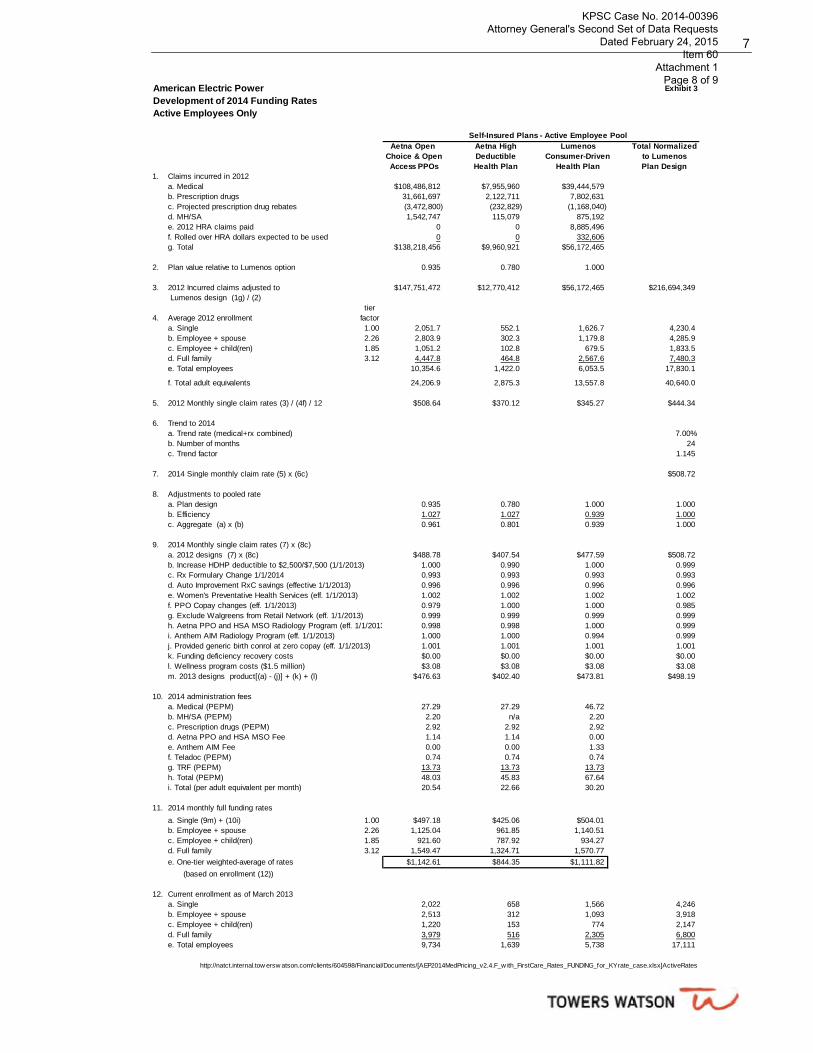
American Electric Power Exhibit 3
Development of 2014 Funding RatesActive Employees Only
Self-Insured Plans - Active Employee PoolAetna Open Aetna High Lumenos Total Normalized
Choice & Open Deductible Consumer-Driven to LumenosAccess PPOs Health Plan Health Plan Plan Design
1. Claims incurred in 2012a. Medical $108,486,812 $7,955,960 $39,444,579b. Prescription drugs 31,661,697 2,122,711 7,802,631c. Projected prescription drug rebates (3,472,800) (232,829) (1,168,040)d. MH/SA 1,542,747 115,079 875,192e. 2012 HRA claims paid 0 0 8,885,496f. Rolled over HRA dollars expected to be used 0 0 332,606g. Total $138,218,456 $9,960,921 $56,172,465
2. Plan value relative to Lumenos option 0.935 0.780 1.000
a. Single (9m) + (10i) 1.00 $497.18 $425.06 $504.01b. Employee + spouse 2.26 1,125.04 961.85 1,140.51c. Employee + child(ren) 1.85 921.60 787.92 934.27d. Full family 3.12 1,549.47 1,324.71 1,570.77
e. One-tier weighted-average of rates $1,142.61 $844.35 $1,111.82
(based on enrollment (12))
12. Current enrollment as of March 2013a. Single 2,022 658 1,566 4,246b. Employee + spouse 2,513 312 1,093 3,918c. Employee + child(ren) 1,220 153 774 2,147d. Full family 3,979 516 2,305 6,800e. Total employees 9,734 1,639 5,738 17,111