HVS.com HVS 6 Floor, Building 8-C, DLF Cyber City, Phase - II, Gurgaon 122 002, INDIA th 2014 HOTELS IN INDIA TRENDS & OPPORTUNITIES Achin Khanna Managing Director, MRICS Karan Sahani Associate
Transcript
HVS.com HVS 6 Floor, Building 8-C, DLF Cyber City, Phase - II, Gurgaon 122 002, INDIAth
2014
HOTELS IN INDIATRENDS & OPPORTUNITIES
Achin KhannaManaging Director, MRICS
Karan SahaniAssociate
PAGE 2 | 2014 HOTELS IN INDIA TRENDS & OPPORTUNITIES
creating affable diplomatic ties with neighbouring countries in Southeast Asia. That being said, the recent disconnection of bilateral talks with Pakistan coupled with the repeated cease-fire violations along the Indo-Pak border lead one to question the likelihood of a peaceful future with our neighbours.
The budget for 2014/15, which was thannounced on 10 July 2014, set the tone for
economic expansion with emphasis on development of quality infrastructure and facilitation of entrepreneurship at the rural and urban levels. On the heels of a partial recovery of the global economy, the country recorded a Real GDP Growth of 4.7% in 2013/14, a minor increase over the previous fiscal. The Industrial sector recorded the least growth: 0.65% in 2013/14, lower than the previous year's 0.96% but also substantially lower than the 7.81% recorded in 2011/12. Agriculture, on the other hand, recorded 4.7% growth in 2013/14 – a significant increase over the previous fiscal. The Services sector grew at 7.0% in 2013/14, marginally higher than the 6.9% increase recorded in 2012/13.
India's current account deficit (CAD) narrowed to 1.7% of the GDP in 2013/14 from 4.7% in 2012/13, mainly a result of the contraction in imports, especially that of gold and other non-essential items. After having witnessed a partial decline in 2012/13, the fiscal deficit expanded to 5.2% of GDP in 2013/14 as compared to 4.8% in 2012/13. This was primarily due to expenditure growing at a faster pace than revenue.
The year 2013/14 also saw the rupee being more volatile, depicted in the exchange rate to the US dollar fluctuating significantly, especially between May (`53.7/US$ on
nd2 May 2013) and August (`68.3/US$ onth28 August 2013), and averaging `60.7/US$
for the fiscal year. The rupee's volatility and decline in value has been ascribed to the supply-demand imbalance in the domestic foreign-exchange market on account of slowdown in foreign institutional investors (FII) inflows.
“A bend in the road is not the end of the road…Unless you fail to make the turn.”
– Helen Keller
Introduction
Change is inevitable, continuous and more often than not, required! As we publish this year's edition of the Trends & Opportunities report, it comes on the heels of a historic and monumental mandate that was awarded to the BJP-led National Democratic Alliance by the citizens of India in the recently concluded General Elections. In sharp contrast to last year’s greatly subdued outlook for business, there is a general sense of hope, optimism and positivity today.
The Indian hospitality sector may also want to raise a toast to cheer the official count of branded/organised hotel rooms crossing the 100,000 mark this past year. While growth in supply did indeed outpace growth in demand across some markets, early signs of a recovery were equally evident across others. Overall, financial year 2013/14 saw a marginal improvement in nationwide occupancies, thus breaking a three-year downward trend.
We have often written about the inherent cyclical nature of the hospitality business. We have also highlighted the importance of allowing new hotels to live through their gestation years before stakeholders begin demanding performance and financial returns from their investment. It is imperative that both developers and lenders understand and appreciate the uniqueness of the hotel business, if they truly intend to reap benefits from it. In one of our recent publications (Hotels in India – The Story Behind the Numbers) we had detailed the last three cycles that were witnessed by the Indian Hotel sector and had also commented on the likelihood of the next cycle being round the corner. While the following report will provide a thorough analysis of the years gone by as well as an estimation of the years ahead, we thought it important to highlight that, in our view, the tide is turning!
The Trends & Opportunities report, based on the results of the Trends & Opportunities Survey conducted by HVS annually, depicts and analyses the key trends in the hotelperformance of the country and presents
HVS' outlook with special emphasis on 13 major Indian markets. The report also outlines existing and future opportunities in the hospitality industry of specific interest to investors, developers and hotel operators.
The survey participant base has registered a significant rise since 1995/96 from 120 hotels with 18,160 rooms to a record 814 hotels with a room count of 99,301 in 2013/14, an increase of an additional 97 hotels and approximately 13,180 rooms since the last survey.
The growing number of survey participants over the years demonstrates an increase in both HVS' penetration into the market and the market's size. Moreover, a larger sample set and availability of data for two historical years have led to the 2012/13 figures undergoing a minor change across all parameters.
set the platform for inclusive and sustainablegrowth. It is also expected to focus on
Similar to previous editions of the Trends & Opportunities report, we have weighted the number of room nights to account for the new supply that was not operational for the entire fiscal in order to compute the overall occupancy and average rate. The weighted room count for 2013/14 is 95,414, up from 82,512 for 2012/13. Figure 1 illustrates survey participation for the fiscal years 1995/96 to 2013/14.
The much anticipated general elections in 2014 saw the National Democratic Alliance (NDA), led by the Bharatiya Janta Party (BJP), secure a convincing majority with 336 seats in the Lok Sabha (Lower House) out of a total of 543 elected seats. The Narendra Modi-led BJP itself secured 282 seats, propelled as they were by their development-centric agenda and a strong anti-incumbency factor against the erstwhile government. With a decisive majority, the new government is expected to focus on strengthening economic fundamentals through necessary policy formulations and amendments and
The Indian Economic Scenario – An Overview
20
40
60
80
100
120
140
160
200
400
600
800
1,000
1,200
Number of Rooms (00's) Number of Hotels Average Number of Rooms Per Hotel
151 150
131 129 124 128 129 126137 133 133 130
126 122 122 127 127120
122
18
2
12
0
18
3
12
2
21
4
16
3
23
2
18
0
21
6
17
4
25
5
19
9
27
1
25
6
19
9
21
5
28
9
21
1
31
2
23
5
33
5
25
2
34
8
26
8
35
7
31
6
49
5
34
9
49
5
40
7
58
6
46
2
69
8
55
1
86
1
71
7
99
3
81
4
1995/96
1996/97
1997/98
1998/99
1999/00
2000/01
2001/02
2002/03
2003/04
2004/05
2005/06
2006/07
2007/08
2008/09
2009/10
2010/11
2011/12
2012/13
2013/14
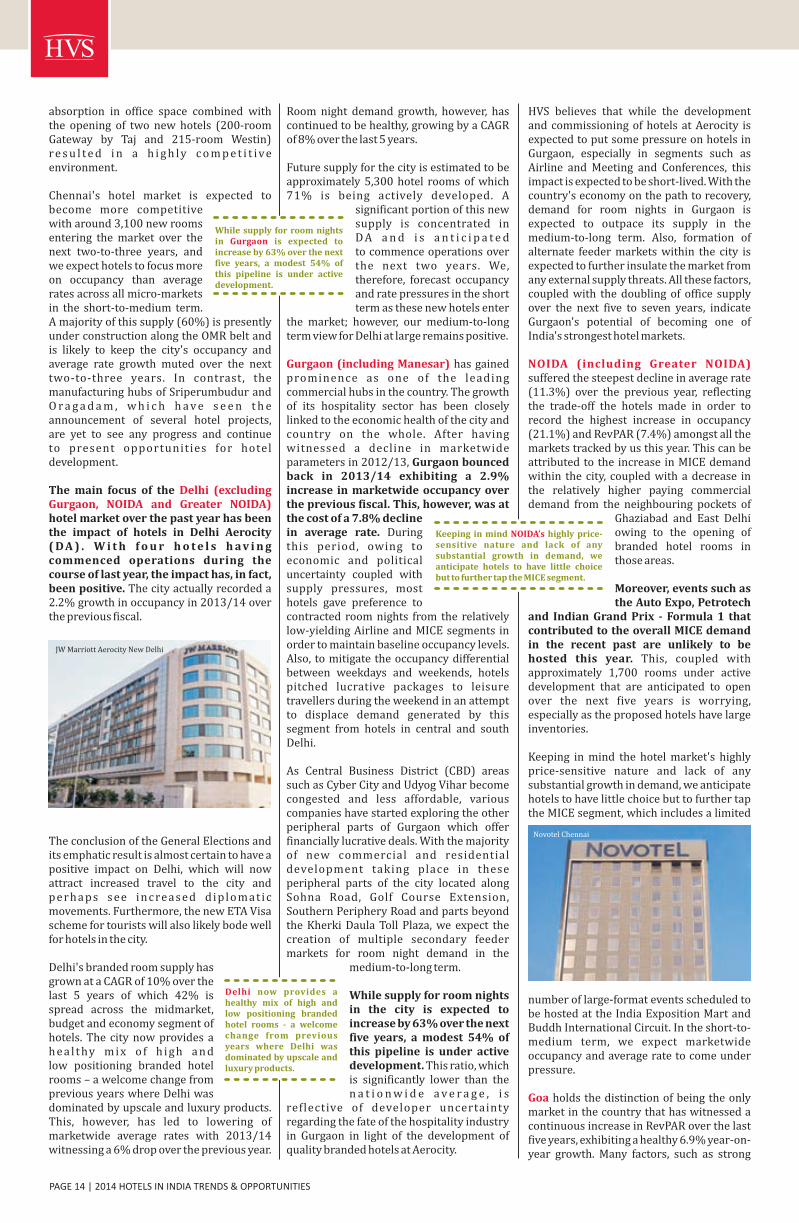
Holiday Inn Express Ahmedabad
2014 HOTELS IN INDIA TRENDS & OPPORTUNITIES | PAGE 31 Market Research and Statistics Division, Ministry of Tourism, Government of India
Figure 2: GDP Growth, Inflation and Exchange Rate – An Eight-year Trend
Figure 2 shows GDP Growth, Inflation and Exchange Rate from 2006/07 to 2013/14.
During 2013/14, FDI inflow declined by 31.8% over the previous fiscal, largely due to poor investor sentiment and political uncertainty at the time. Going forward, the Economic Survey of India forecasts India's GDP growth to be in the range of 5.4-5.9% in 2014/15 on account of an expected revival of the Industrial sector, a stabilised current account, steady capital inflows and an expected resurgence in growth from manufacturing . With the previous government having initiated a programme to revitalise some key infrastructure projects across the country and the new government also following suit, economic expansion is expected to maintain steady momentum in the medium-to-long term.
Since 2002, when India's National Tourism Policy was revamped, the country has witnessed sustained growth that has consistently outpaced the global tourism industry in terms of growth in the volume of international tourists as well as the overall growth in revenue. The main drivers of this increase have been the burgeoning Indian middle class, growth in high spending fo re i g n to u r i s t s , a n d c o o rd i n a te d government tourism campaigns like “Incredible India”.
Tourism Overview
The United Nations World Tourism Organisation in its Tourism Highlights 2014 Edition reported that the total number of International Tourist Arrivals (ITA) worldwide grew by 5% in 2013, reaching a record 1,087 million arrivals, after topping the 1 billion mark in 2012. Within that, the Asia Pacific region recorded the strongest growth at 6% in 2013.
The total contribution of Travel and Tourism to India's GDP was 6.2% (`6,631 billion) in 2013 and is projected to rise to 7.3% in 2014, according to the World Travel & Tourism Council's (WTTC's) Economic Impact 2014 – India report.
Domestic travel spends generated 80.7% of the direct Travel and Tourism GDP, with domestic tourist visits (1,145 million) registering an increase of close to 10% over 2012. Domestic demand for hotels in India has historically been higher than demand from foreigners. Though a large portion of domest ic demand orig inates from commercial activity, an increasing number of Indians are taking holidays, both within the country and overseas. Rising propensity to spend coupled with the increased proliferation of low-cost carriers has enabled increased domestic travel. The depreciation of the rupee against theUS dollar has also made international travel less viable for domestic tourists, who are now substituting foreign vacations with domestic ones. This is evident with leisure
Exchange Rate ( /US$)` GDP Growth at Factor Cost Inflation (WPI)
10.0%
20.0%
30.0%
40.0%
50.0%
60.0%
70.0%
80.0%
-
10,000
20,000
30,000
40,000
50,000
60,000
70,000
80,000
90,000
1,00,000
Available Room Nights Per Day Room Night Demand Per Day Occupancy
Source: HVS Research
Figure 3: Room Night Demand Vs Available Room Nights (1999/2000 – 2013/14)
1999/00
2000/01
2001/02
2002/03
2003/04
2004/05
2005/06
2006/07
2007/08
2008/09
2009/10
2010/11
2011/12
2012/13
2013/14
destinations such as Agra, Jaipur, Goa, Kerala and Srinagar gaining strong momentum.
International Tourist Arrivals, on the other hand, were recorded at 6.9 million in 2013, an increase of 5.9% over the previous year. Foreign Exchange Earnings (FEE) in US$ also rose by 4.0% during the same period. The top three international source markets for India continued to be USA (15.6%) followed
1by UK (11.62%) and Bangladesh (7.53%) . Stimuli such as the Tourist Visa on Arrival Scheme (VOA), which is expected to extend from 11 to 180 countries, and the relaxation of the mandatory 60-day gap between consecutive visits by foreign travellers to India, is anticipated to augment growth and bolster inbound travel in the near future.
Additionally, the budget announcement regarding the initiation of the electronic travel authorisation (ETA) across nine international airports over the next six months is also a welcome step to generate further tourist activity across the country.
As discussed in our 2013 publication, the four pillars of the hospitality business – Supply, Demand, Occupancy and Average Rate – are key indicators when assessing the past, present and future of any hotel market. On a nationwide basis, branded and/or organised supply grew at a CAGR of 17.8% over the past five years. Demand for these rooms grew at 17.6% for the same period. Resultantly, India-wide occupancies moved from 59.3% in 2011/12 to 57.8% in 2012/13 and have closed at 58.9% in 2013/14. Average Room Rates, however, have gone from `6,032 to `5,773 andare now at `5,531 for the period of
st st1 April 2013 to 31 March 2014. While occupancies have remained range-bound, average rates have declined for several years in a row. Figure 3 shows the nationwide supply and demand trends for a 15-year period.
Figures 4 and 5 present the performance of existing supply vs. the performance of new hotels that have opened over the past five years. HVS has been analysing this data now.
The Tide is Turning
53.9%57.2%
51.6%
57.2%
64.8%69.0%
71.5% 71.4% 68.8%
59.5% 59.5% 60.6% 59.3%57.8% 58.9%
PAGE 4 | HOTELS IN INDIA TRENDS & OPPORTUNITIES2014
Figure 4: Performance of Existing Hotels (2009/10 – 2013/14)
Figure 5: Performance of New Hotels (2009/10 – 2013/14)
44.2%
54.1%
63.9%62.0%
62.8%
41.8%
52.5% 53.2%
57.7%
39.0%
44.7%
52.4%
38.3%
46.6%
4,400
4,650
4,900
5,150
5,400
35.0%
40.0%
45.0%
50.0%
55.0%
60.0%
65.0%
70.0%
2009/10 2010/11 2011/12 2012/13 2013/14
New Supply in 2009/10 New Supply in 2010/11 New Supply in 2011/12 New Supply in 2012/13 New Supply in 2013/14
Average Rates (`) 2009/10 Average Rates ( ) 2010/11` Average Rates ( ) 2011/12` Average Rates ( ) 2012/13` Average Rates ( ) 2013/14`
59.3%
63.4%63.9%
62.3%
63.1%
60.3%
62.3%
60.1%
61.8%
59.4%
58.0%
60.2%
57.8%
59.0%58.9%
5,000
5,250
5,500
5,750
6,000
6,250
6,500
6,750
7,000
52.5%
55.0%
57.5%
60.0%
62.5%
65.0%
The trend continues to reflect the fact that existing hotels have grown (or at the very least sustained) their occupancies through the so-called down cycle over the past five years. When one studies a market's overall occupancy, it may seem like the numbers are declining; however, it is evident from Figure 4 that the decline is primarily a function of the new supply's lower initial-year occupancies that are in turn pulling down the marketwide average. When looked at independently, not only has existing supply proven its ability to retain and/or grow its occupancy numbers, even new supply continues to show a steady (albeit relatively paced) year on year growth in occupancies, as is visible in Figure 5. However, similar to last year, we continue to see declines in average room rates. While one may partially attribute this to markets having a larger pool of budget and midmarket hotels in their competitive set now, when we study the charts above it is clear that the advent of new supply is also causing existing hotels to cut their rates in a bid to retain business. This knee-jerk reaction is often a short-sighted approach to doing business and we discuss this in more detail in the following paragraphs.
Back to the Future!
As we look to the future, one must first pay h e e d t o p o l i t i c a l a n d e c o n o m i c developments in the last few months. The BJP-led NDA's historic victory has not only captured India's imagination but also
reinvigorated overseas interest in India, and one is beginning to witness an overall positivity in the sentiments of people, businesses and nations at large. The Indian stock markets are at their lifetime peak and financial pundits are speculating a continued and sustained bull-run, this time possibly for the medium-to-long term. The recent union budget's approval of additional FDI in the defence and insurance sectors only adds to the already approved FDI limit increases to retail. The likelihood of significant amounts of foreign money pouring into our country is now strong. Stability at the centre is therefore very likely to catalyse overall growth in the Gross Domestic Product (GDP) over the next three-to-five years.
While average room rates have declined across various prominent markets lately, absolute demand in terms of “room n i g h t s p e r d a y ” ( R P D ) cont inues to grow. Our research reveals that demand for organised rooms has grown at an average of 11.3% over the
past decade. This time period witnessed an up-cycle from 2003 to mid 2008 and a down-cycle from late 2008 to 2013. However, year-on-year demand grew in the double-digits during both cycles. This in itself is testament to the inherent strength of the sector and its continuing potential to grow, even in the face of external adversities. We are of the view that demand is likely to continue growing in the double-digits for the next three-to-five years.
Supply, however, is now going to grow ata slower pace. India had 103,855 branded/organised hotel rooms as of
st 31 March 2014. Supply – in the years going forward – is expected to grow by under 10% in 2014, about 12% in 2015 and approximately 11% in 2016. Given these demand-supply dynamics, coupled with the likelihood of overall economic growth discussed above, HVS feels quite confident in predicting a strong and s u s t a i n a b l e u p s w i n g i n i n d u s t r y performance over the next three-to-five years. While certain markets may take longer than others to reap the benefits of this forecasted upside, overall, the sector should ready itself for the next up-cycle in the near future.
Riding the Wave
Riding a wave is not just about timing the turn of the tide. It is also about employingthe most balanced approach for a sustained surf. It is therefore important that various stakeholders of the Indian hotel sector pay heed to the following thoughts. Some of these include correcting errors of the past, while others are new or innovative waysof doing business in an increasingly competitive business environment.
Hotel Operators
In our various conversations with General Managers, Directors of Sales & Marketing and Revenue heads of hotels across brands, we have repeatedly heard them worry about i n c r e a s i n g competition and the inevitability of why average room rates j u s t h a d t o b e “corrected” if they wanted to retain business. It is evident that hotels across positioning and price points have dropped rates in a bid to gain business over the last two-to-three years and “rate wars” have led to some surprising decisions being made by respectable and globally recognised brands.
Like last year, we reiterate in this year's publication – India does NOT have a rate problem! If anything, we are often too afraid to charge a fair price for the product and service being offered, because the management feels that they will lose critical business unless they offer the lowest rate in town. As we look towards the advent of an up-cycle in the near future, HVS would like to strongly urge management companies – international and domestic alike – to look one step beyond. Focusing on value creation for your guests rather than simply offering the lowest room rate needs to be the strategy going forward. Today's customer is far more informed and educated about various hotel positioning and is therefore able to appreciate the differences that exist between a budget, midmarket and upscale brand. He or she is also both able and willing to pay what's fair for products offered and
2009/10 2010/11 2011/12 2012/13 2013/14
Existing Supply of 2009/10 Existing Supply of 2010/11 Existing Supply of 2011/12 Existing Supply of 2012/13 Existing Supply of 2013/14
Average Rates ( ) 2009/10` Average Rates ( ) 2010/11` Average Rates ( ) 2011/12` Average Rates ( ) 2012/13` Average Rates ( ) 2013/14`
42.6%
Source: HVS Research
Source: HVS Research
O n a n a t i o nw i d e b a s i s , branded and/or organised supply grew at a CAGR of 17.8% over the past five years. Demand for these rooms grew at 17.6% for the same period.
While average room rates have declined across various prominent markets lately, absolute demand in terms of “room nights per day” (RPD) co n t i n u e s to g row. O u r research reveals that demand for organised rooms has grown at an average of 11.3% over the past decade.
2014 HOTELS IN INDIA TRENDS & OPPORTUNITIES | PAGE 5
services rendered. Now that this maturity is coming about in the profile of guests, maywe suggest that hotels be true to their p o s i t i o n i n g a n d t a r g e t consumers with the confidence that they have the ability to appreciate their product and services.
Additionally, please do not forget MICE! Both corporate and social consumption of hotels for events is on the rise. Hotels across positioning must pay heed to the additional revenue that the meetings and conferences segment can generate for their business. What you may have to give away in room rate could often be mitigated by way of increased F&B spends. Thirdly, domestic leisure is certainly growing and is willing to spend. Target them, encourage them and rely on them – more than you have in the past. Creating packages for the domestic consumer will help hotels across all positioning in today's India. Lastly, since earning customer loyalty is your goal, effective management of your loyalty programs will certainly help in value creation.
Implementing a combination of ideas discussed above will help you in creating value that today's well travelled, educated and discerning consumer will likely appreciate, and dropping average rates may not need to be your primary means of securing business.
Hotel Developers & Investors
Building when a market is in distress so that one may operate when the market picks up
makes common sense. However, we are often surprised when developers and investors cite poor market conditions as their primary reason for not wanting to build hotels. If your intent is to build, then commencing work on your project now would be a good
idea. It takes anywhere from three-to-five years to construct a hotel in India. Figures 6 and 7 provide a snapshot of development costs per key and construction tenures for over 200 hotels that have opened in India over the past five years.
Given the fact that the last three cycles lasted five to six years each, hotels that will start construction now will very likely open in the midst of the next up-cycle. The opportunity to open when market conditions allow for a quick ramp-up of occupancies can help a project in meeting debt service obligations in an effective fashion. Such projects also have a higher chance of breaking even more quickly as a result.
Similarly, if you are in the market to buy rather than build, negotiating deals when a market is in flux is always a better idea than trying to buy assets in a market that is on the up-swing. Given the fact that more than a few
hotels across various positioning are available for transacting lately, buyers should look to acquire now. When the tide does turn, you will end up paying a premium for the same asset(s) that you may be able to negotiate for a fairly attractive value today.
Lenders
The hotel sector is either not understood or misunderstood by banks – public and private sector alike – in India. They have traditionally either extended loans based on their prior relationship with a borrower or because they have a mandate to lend a certain amount to a certain sector in a certain year. Of late, they have been shying away from lending to hotel developers because they fear the relatively poor performance of hotels that have not been able to service their debt obligations and have ended up as Non Performing Assets (NPA) in their books.
However, not many lending institutions have recognised the fact that the problem doesn't lie in the hotel sector. Instead, it was their approach to lending ( a s e x p l a i n e d above) that was the primary reason for the situation they find themselves in today. Much like a n y t h i n g e l s e , lending based on the fundamentals of the project , the conditions of the market it will operate in, the reputation of the developer and the viability of its cash flows to service debt should all be the yardsticks for lending. Additionally, rather than fearing the down-cycle, lenders must lend during this period, so that hotels may open by the time the up-cycle arrives.
Lending to hotel developers, when done based on due diligence and based on feasibility analyses, is the right approach. Fearing the sector because one doesn't understand it is a folly.
In summary, the Indian hotel sector is very likely on the cusp of its next up-cycle! The demand for quality accommodation will continue to grow and while the inherent cyclical nature of the sector will bring about crests and troughs, the fundamentals of the sector are strong. To conclude with the surfing analogy, the tide is indeed turning! The question is - are you geared up for an interesting surfing ride?
This report presents the results of the HVS Survey on the performance of mostly branded hotels, analysed by each star grading, as well as major cities. Moreover, for each city we have presented the new supply, its market orientation and estimated the number of rooms under construction along with the probability of their development over a period of five years.
Survey Results
Source: HVS Research
Source: HVS Research
It is evident that hotels across positioning and price points have dropped rates in a bid to gain business over the last two-to-three years and “rate wars” have led to some surprising decisions being made by respectable and globally recognised brands.
As we look towards the advent of an up-cycle in the near future, HVS would like to strongly urge management companies – international and domestic alike – to look one step beyond. Focusing on value creation for your guests rather than simply offering the lowest room rate needs to be the strategy going forward.
PAGE 6 | HOTELS IN INDIA TRENDS & OPPORTUNITIES2014
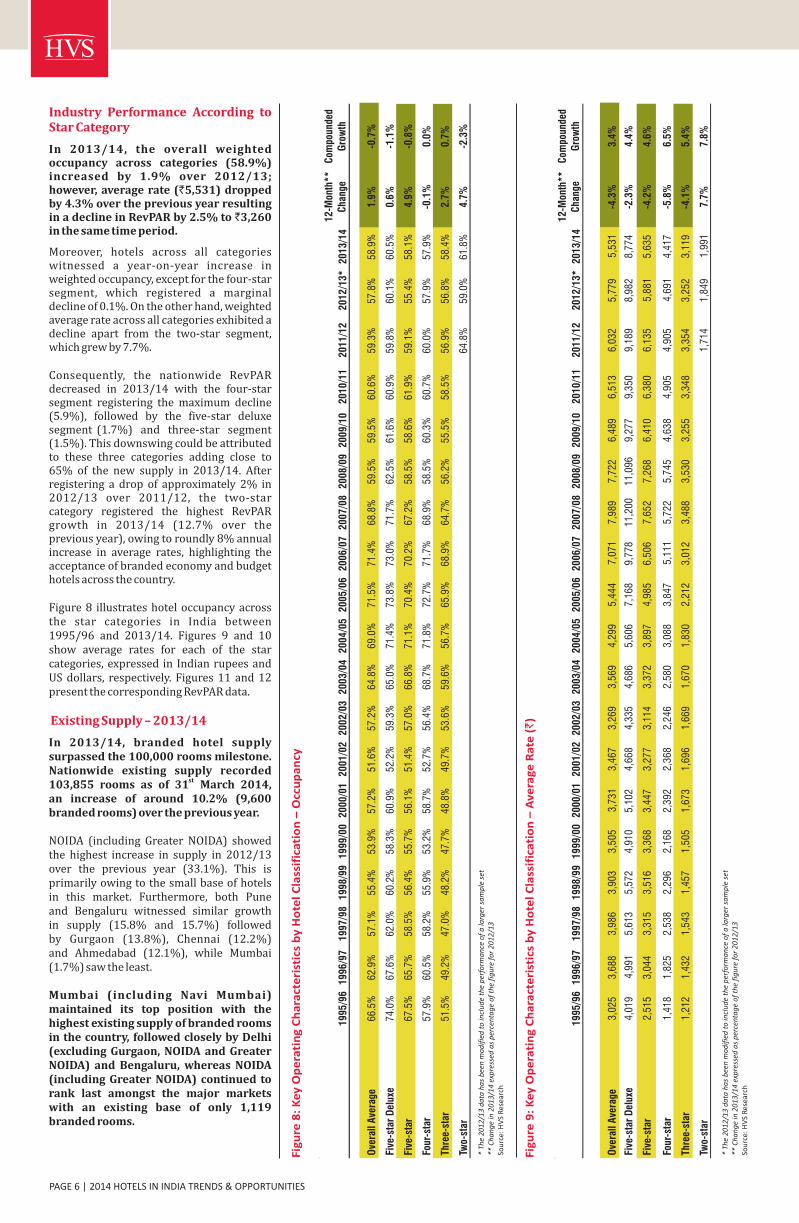
Industry Performance According to Star Category
Existing Supply – 2013/14
In 2013/14, the overall weighted occupancy across categories (58.9%) increased by 1.9% over 2012/13; however, average rate (`5,531) dropped by 4.3% over the previous year resulting in a decline in RevPAR by 2.5% to `3,260 in the same time period.
Moreover, hotels across all categories witnessed a year-on-year increase in weighted occupancy, except for the four-star segment, which registered a marginal decline of 0.1%. On the other hand, weighted average rate across all categories exhibited a decline apart from the two-star segment, which grew by 7.7%.
Consequently, the nationwide RevPAR decreased in 2013/14 with the four-star segment registering the maximum decline (5.9%), followed by the five-star deluxe segment (1.7%) and three-star segment (1.5%). This downswing could be attributed to these three categories adding close to 65% of the new supply in 2013/14. After registering a drop of approximately 2% in 2012/13 over 2011/12, the two-star category registered the highest RevPAR growth in 2013/14 (12.7% over the previous year), owing to roundly 8% annual increase in average rates, highlighting the acceptance of branded economy and budget hotels across the country.
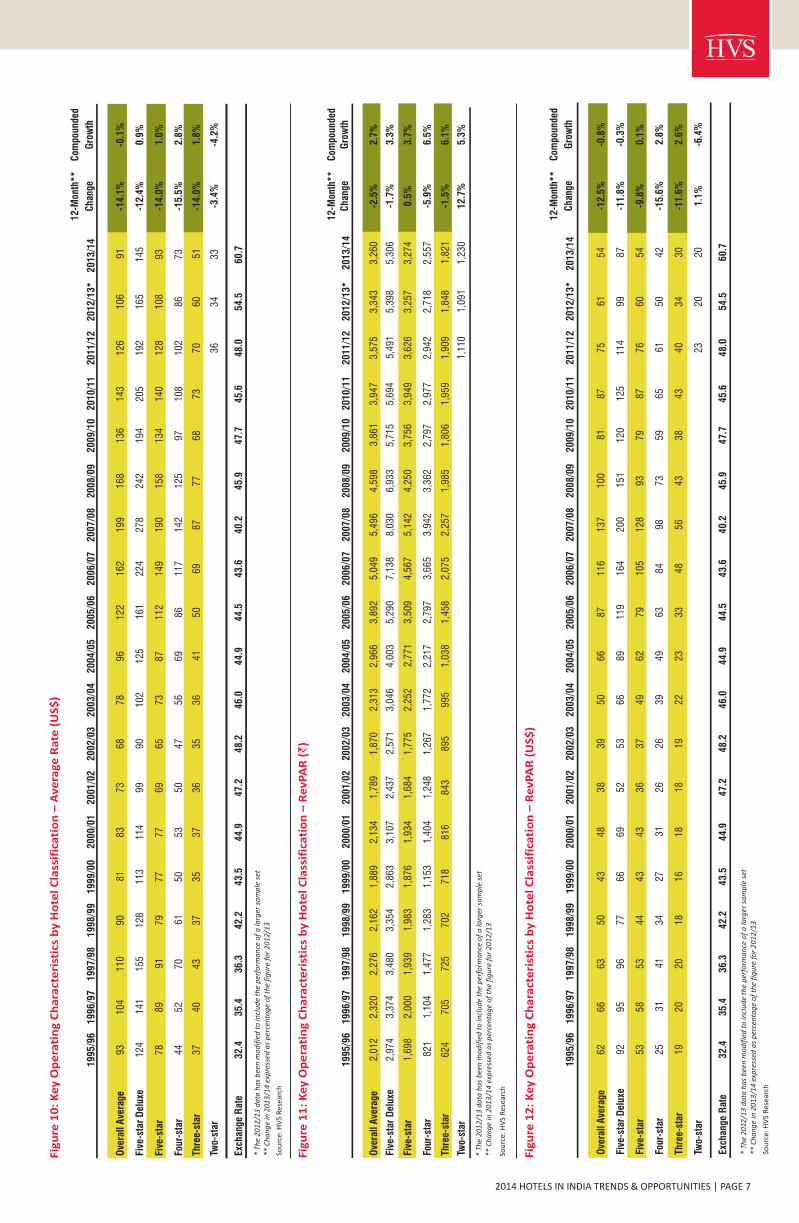
Figure 8 illustrates hotel occupancy across the star categories in India between 1995/96 and 2013/14. Figures 9 and 10 show average rates for each of the star categories, expressed in Indian rupees and US dollars, respectively. Figures 11 and 12 present the corresponding RevPAR data.
In 2013/14, branded hotel supply surpassed the 100,000 rooms milestone. Nationwide existing supply recorded
st 103,855 rooms as of 31 March 2014,an increase of around 10.2% (9,600 branded rooms) over the previous year.
NOIDA (including Greater NOIDA) showed the highest increase in supply in 2012/13 over the previous year (33.1%). This is primarily owing to the small base of hotelsin this market. Furthermore, both Puneand Bengaluru witnessed similar growthin supply (15.8% and 15.7%) followedby Gurgaon (13.8%), Chennai (12.2%)and Ahmedabad (12.1%), while Mumbai (1.7%) saw the least.
Mumbai (including Navi Mumbai) maintained its top position with the highest existing supply of branded rooms in the country, followed closely by Delhi (excluding Gurgaon, NOIDA and Greater NOIDA) and Bengaluru, whereas NOIDA (including Greater NOIDA) continued to rank last amongst the major markets with an existing base of only 1,119 branded rooms.
199
5/9
61996
/97
1997
/98
199
8/9
9199
9/0
02000
/01
2001/
02
2002/0
3200
3/04
2004
/05
2005
/06
2006
/07
2007
/08
2008
/09
2009
/10
2010
/11
2011
/12
2012
/13*
2013
/14
12-M
onth
**
Cha
nge
Com
poun
ded
Gro
wth
Ove
rall
Ave
rage
66.5
%62
.9%
57.1
%55
.4%
53.9
%57
.2%
51.6
%57
.2%
64.8
%69
.0%
71.5
%71
.4%
68.8
%59
.5%
59.5
%60
.6%
59.3
%57
.8%
58.9
%1.
9%-0
.7%
Five
-sta
r D
elux
e74
.0%
67.6
%62
.0%
60.2
%58
.3%
60.9
%52
.2%
59.3
%65
.0%
71.4
%73
.8%
73.0
%71
.7%
62.5
%61
.6%
60.9
%59
.8%
60.1
%60
.5%
0.6%
-1.1
%
Five
-sta
r 67
.5%
65.7
%58
.5%
56.4
%55
.7%
56.1
%51
.4%
57.0
%66
.8%
71.1
%70
.4%
70.2
%67
.2%
58.5
%58
.6%
61.9
%59
.1%
55.4
%58
.1%
4.9%
-0.8
%
Four
-sta
r57
.9%
60.5
%58
.2%
55.9
%53
.2%
58.7
%52
.7%
56.4
%68
.7%
71.8
%72
.7%
71.7
%68
.9%
58.5
%60
.3%
60.7
%60
.0%
57.9
%57
.9%
-0.1
%0.
0%
Thre
e-st
ar51
.5%
49.2
%47
.0%
48.2
%47
.7%
48.8
%49
.7%
53.6
%59
.6%
56.7
%65
.9%
68.9
%64
.7%
56.2
%55
.5%
58.5
%56
.9%
56.8
%58
.4%
2.7%
0.7%
Two-
star
64.8
%59
.0%
61.8
%4.
7%-2
.3%
* Th
e 2
01
2/1
3 d
ata
ha
s b
een
mo
dif
ied
to
incl
ud
e th
e p
erfo
rma
nce
of
a la
rger
sa
mp
le s
et**
Ch
an
ge
in 2
01
3/1
4 e
xpre
ssed
as
per
cent
ag
e o
f th
e fi
gu
re f
or
20
12
/13
Sou
rce:
HV
S R
esea
rch
1995
/96
1996
/97
19
97/9
819
98/9
919
99/0
020
00/0
120
01/0
220
02/0
320
03/0
420
04/0
520
05/0
620
06/0
72
00
7/0
82
00
8/0
92
00
9/1
02
01
0/1
12
01
1/1
22
01
2/1
3*
20
13
/14
12
-Mon
th*
*
Cha
nge
Com
poun
ded
Gro
wth
Ove
rall
Ave
rage
3,02
53,
688
3,98
63,
903
3,50
53,
731
3,46
73,
269
3,56
94,
299
5,44
47,
071
7,98
97,
722
6,48
96,
513
6,03
25,
779
5,53
1-4
.3%
3.4
%
Five
-sta
r D
elux
e4,
019
4,99
15,
613
5,57
24,
910
5,10
24,
668
4,33
54,
686
5,60
67,
168
9,77
811
,200
11,0
969,
277
9,35
09,
189
8,98
28,
774
-2.3
%4
.4%
Five
-sta
r 2,
515
3,04
43,
315
3,51
63,
368
3,44
73,
277
3,11
43,
372
3,89
74,
985
6,50
67,
652
7,26
86,
410
6,38
06,
135
5,88
15,
635
-4.2
%4
.6%
Four
-sta
r1,
418
1,82
52,
538
2,29
62,
168
2,39
22,
368
2,24
62,
580
3,08
83,
847
5,11
15,
722
5,74
54,
638
4,90
54,
905
4,69
14,
417
-5.8
%6
.5%
Thre
e-st
ar1,
212
1,43
21,
543
1,45
71,
505
1,67
31,
696
1,66
91,
670
1,83
02,
212
3,01
23,
488
3,53
03,
255
3,34
83,
354
3,25
23,
119
-4.1
%5
.4%
Two-
star
1,71
41,
849
1,99
17
.7%
7.8
%
* Th
e 2
01
2/1
3 d
ata
ha
s b
een
mo
dif
ied
to
incl
ud
e th
e p
erfo
rma
nce
of
a la
rger
sa
mp
le s
et**
Ch
an
ge
in 2
01
3/1
4 e
xpre
ssed
as
per
cent
ag
e o
f th
e fi
gu
re f
or
20
12
/13
Sou
rce:
HV
S R
esea
rch
Fig
ure
9:
Ke
y O
pe
rati
ng
Ch
ara
cte
rist
ics
by
Ho
tel
Cla
ssif
ica
tio
n –
Av
era
ge R
ate
(`
)
Fig
ure
8:
Ke
y O
pe
rati
ng
Ch
ara
cte
rist
ics
by
Ho
tel
Cla
ssif
ica
tio
n –
Occ
up
an
cy
2014 HOTELS IN INDIA TRENDS & OPPORTUNITIES | PAGE 7
Fig
ure
11
: K
ey
Op
era
tin
g C
ha
ract
eri
stic
s b
y H
ote
l C
lass
ific
ati
on
– R
ev
PAR
()
`
Fig
ure
12
: K
ey
Op
era
tin
g C
ha
ract
eri
stic
s b
y H
ote
l C
lass
ific
ati
on
– R
ev
PAR
(U
S$
)
Fig
ure
10
: K
ey
Op
era
tin
g C
ha
ract
eri
stic
s b
y H
ote
l C
lass
ific
ati
on
– A
vera
ge R
ate
(U
S$
)
1995
/96
1996
/97
1997
/98
1998
/99
1999
/00
2000
/01
2001
/02
2002
/03
2003
/04
2004
/05
2005
/06
2006
/07
2007
/08
2008
/09
2009
/10
2010
/11
2011
/12
2012/1
3*
2013/1
4
12-M
onth
**
Cha
nge
Com
poun
ded
Gro
wth
Ove
rall
Ave
rage
9310
411
090
8183
7368
7896
122
162
199
168
136
143
126
106
91-1
4.1
%-0
.1%
Five
-sta
r D
elux
e12
414
115
512
811
311
499
9010
212
516
122
427
824
219
420
519
216
514
5-1
2.4
%0.9
%
Five
-sta
r 78
8991
7977
7769
6573
8711
214
919
015
813
414
012
810
893
-14.0
%1.0
%
Four
-sta
r44
5270
6150
5350
4756
6986
117
142
125
9710
810
286
73-1
5.5
%2.8
%
Thre
e-st
ar37
4043
3735
3736
3536
4150
6987
7768
7370
6051
-14.0
%1.8
%
Two-
star
3634
33-3
.4%
-4.2
%
Exch
ange
Rat
e32
.435
.436
.342
.243
.544
.947
.248
.246
.044
.944
.543
.640
.245
.947
.745
.648
.054.5
60.7
* Th
e 2
01
2/1
3 d
ata
ha
s b
een
mo
dif
ied
to
incl
ud
e th
e p
erfo
rma
nce
of
a la
rger
sa
mp
le s
et**
Ch
an
ge
in 2
01
3/1
4 e
xpre
ssed
as
per
cent
ag
e o
f th
e fi
gu
re f
or
20
12
/13
Sou
rce:
HV
S R
esea
rch
1995
/96
1996
/97
1997
/98
1998
/99
1999
/00
2000
/01
2001
/02
2002
/03
2003
/04
2004
/05
2005
/06
2006
/07
2007
/08
2008
/09
2009
/10
2010
/11
2011
/12
2012/1
3*
2013/1
4
Com
poun
ded
Gro
wth
Ove
rall
Ave
rage
6266
6350
4348
3839
5066
8711
613
710
081
8775
6154
-0.8
%
Five
-sta
r D
elux
e92
9596
7766
6952
5366
8911
916
420
015
112
012
511
499
87-0
.3%
Five
-sta
r53
5853
4443
4336
3749
6279
105
128
9379
8776
6054
0.1
%
Four
-sta
r25
3141
3427
3126
2639
4963
8498
7359
6561
5042
2.8
%
Thre
e-st
ar19
2020
1816
1818
1922
2333
4856
4338
4340
3430
2.6
%
Two-
star
2320
20
12-M
onth
**
Cha
nge
-12.5
%
-11.8
%
-9.8
%
-15.6
%
-11.6
%
1.1
%-6
.4%
Exch
ange
Rat
e32
.435
.436
.342
.243
.544
.947
.248
.246
.044
.944
.543
.640
.245
.947
.745
.648
.054.5
* Th
e 2
01
2/1
3 d
ata
ha
s b
een
mo
dif
ied
to
incl
ud
e th
e p
erfo
rma
nce
of
a la
rger
sa
mp
le s
et**
Ch
an
ge
in 2
01
3/1
4 e
xpre
ssed
as
per
cent
ag
e o
f th
e fi
gu
re f
or
20
12
/13
Sou
rce:
HV
S R
esea
rch
1
995/
9619
96/9
719
97/9
819
98/9
919
99/
0020
00/0
120
01/0
220
02/0
320
03/0
420
04/0
520
05/0
620
06/0
720
07/0
820
08/0
920
09/1
020
10/1
120
11/1
22012/1
3*
2013/1
4
12-M
onth
**
Cha
nge
Com
poun
ded
Gro
wth
Ove
rall
Ave
rage
2,01
22,
320
2,27
62,
162
1,88
92,
134
1,78
91,
870
2,31
32,
966
3,89
25,
049
5,49
64,
598
3,86
13,
947
3,57
53,
343
Five
-sta
r D
elux
e2,
974
3,37
43,
480
3,35
42,
863
3,10
72,
437
2,57
13,
046
4,00
35,
290
7,13
88,
030
6,93
35,
715
5,69
45,
491
5,39
8
Five
-sta
r 1,
698
2,00
01,
939
1,98
31,
876
1,93
41,
684
1,77
52,
252
2,77
13,
509
4,56
75,
142
4,25
03,
756
3,94
93,
626
3,25
7
Four
-sta
r82
11,
104
1,47
71,
283
1,15
31,
404
1,24
81,
267
1,77
22,
217
2,79
73,
665
3,94
23,
362
2,79
72,
977
2,94
22,
718
Thre
e-st
ar62
470
572
570
271
881
684
389
599
51,
038
1,45
82,
075
2,25
71,
985
1,80
61,
959
1,90
91,
848
Two-
star
1,11
01,
091
* Th
e 2
01
2/1
3 d
ata
ha
s b
een
mo
dif
ied
to
incl
ud
e th
e p
erfo
rma
nce
of
a la
rger
sa
mp
le s
et**
Ch
an
ge
in 2
01
3/1
4 e
xpre
ssed
as
per
cent
ag
e o
f th
e fi
gu
re f
or
20
12
/13
Sou
rce:
HV
S R
esea
rch
-2.5
%2.7
%
-1.7
%3.3
%
0.5
%3.7
%
-5.9
%6.5
%
-1.5
%6.1
%
12.7
%5.3
%
3,26
0
5,30
6
3,27
4
2,55
7
1,82
1
1,23
0
60.7
PAGE 8 | HOTELS IN INDIA TRENDS & OPPORTUNITIES2014
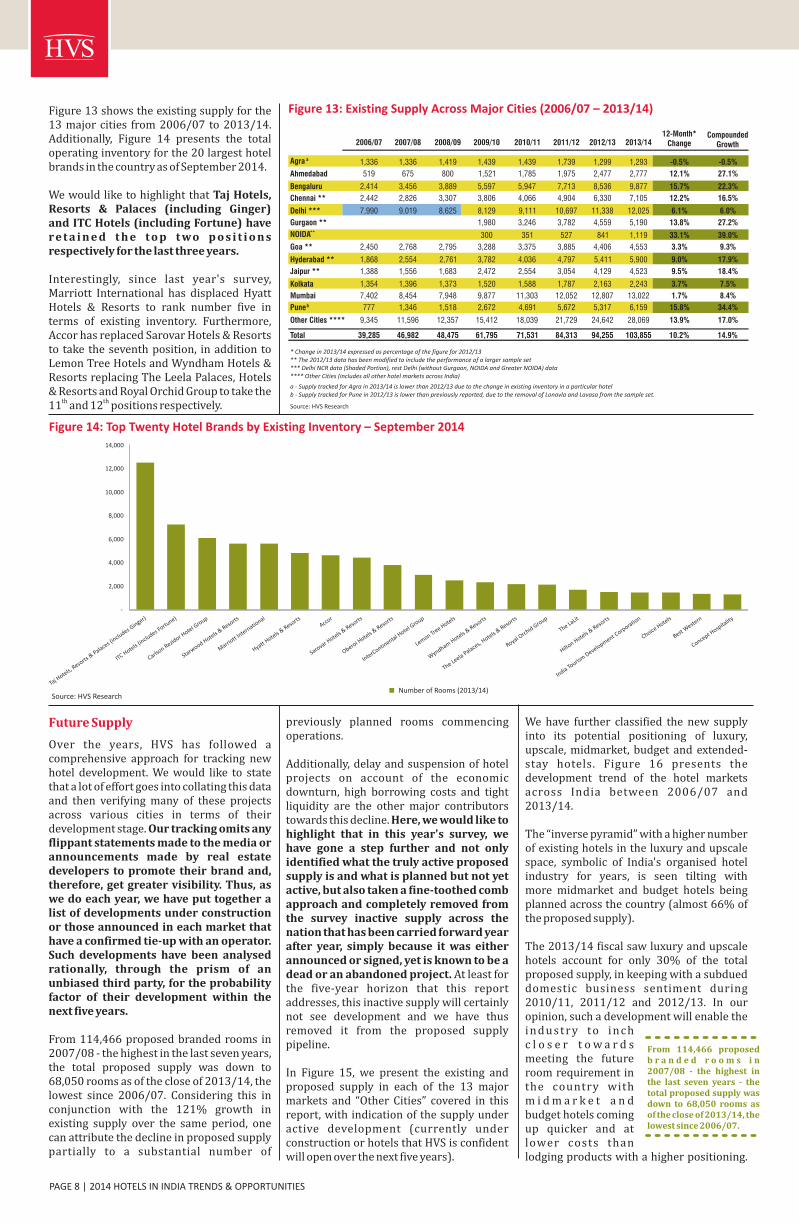
Figure 13: Existing Supply Across Major Cities (2006/07 – 2013/14)
* Change in 2013/14 expressed as percentage of the figure for 2012/13** The 2012/13 data has been modified to include the performance of a larger sample set*** Delhi NCR data (Shaded Portion), rest Delhi (without Gurgaon, NOIDA and Greater NOIDA) data**** Other Cities (includes all other hotel markets across India)
a - Supply tracked for Agra in 2013/14 is lower than 2012/13 due to the change in existing inventory in a particular hotelb - Supply tracked for Pune in 2012/13 is lower than previously reported, due to the removal of Lonavla and Lavasa from the sample set.
Source: HVS Research
2,000
4,000
6,000
8,000
10,000
12,000
14,000
Figure 14: Top Twenty Hotel Brands by Existing Inventory – September 2014
Number of Rooms (2013/14)
We have further classified the new supply into its potential positioning of luxury, upscale, midmarket, budget and extended-stay hotels. Figure 16 presents the development trend of the hotel markets across India between 2006/07 and 2013/14.
The “inverse pyramid” with a higher number of existing hotels in the luxury and upscale space, symbolic of India's organised hotel industry for years, is seen tilting with more midmarket and budget hotels being planned across the country (almost 66% of the proposed supply).
The 2013/14 fiscal saw luxury and upscale hotels account for only 30% of the total proposed supply, in keeping with a subdued domestic business sentiment during 2010/11, 2011/12 and 2012/13. In our opinion, such a development will enable the i n d u s t r y to i n c h c l o s e r t o w a r d s meeting the future room requirement in the country with m i d m a r k e t a n d budget hotels coming up quicker and at lower costs than lodging products with a higher positioning.
Future Supply
Over the years, HVS has followed a comprehensive approach for tracking new hotel development. We would like to state that a lot of effort goes into collating this data and then verifying many of these projects across various cities in terms of their development stage. Our tracking omits any flippant statements made to the media or announcements made by real estate developers to promote their brand and, therefore, get greater visibility. Thus, as we do each year, we have put together a list of developments under construction or those announced in each market that have a confirmed tie-up with an operator. Such developments have been analysed rationally, through the prism of an unbiased third party, for the probability factor of their development within the next five years.
From 114,466 proposed branded rooms in 2007/08 - the highest in the last seven years, the total proposed supply was down to 68,050 rooms as of the close of 2013/14, the lowest since 2006/07. Considering this in conjunction with the 121% growth in existing supply over the same period, one can attribute the decline in proposed supply partially to a substantial number of
previously planned rooms commencing operations.
Additionally, delay and suspension of hotel projects on account of the economic downturn, high borrowing costs and tight liquidity are the other major contributors towards this decline. Here, we would like to highlight that in this year's survey, we have gone a step further and not only identified what the truly active proposed supply is and what is planned but not yet active, but also taken a fine-toothed comb approach and completely removed from the survey inactive supply across the nation that has been carried forward year after year, simply because it was either announced or signed, yet is known to be a dead or an abandoned project. At least for the five-year horizon that this report addresses, this inactive supply will certainly not see development and we have thus removed it from the proposed supply pipeline.
In Figure 15, we present the existing and proposed supply in each of the 13 major markets and “Other Cities” covered in this report, with indication of the supply under active development (currently under construction or hotels that HVS is confident will open over the next five years).
Figure 13 shows the existing supply for the 13 major cities from 2006/07 to 2013/14. Additionally, Figure 14 presents the total operating inventory for the 20 largest hotel brands in the country as of September 2014.
We would like to highlight that Taj Hotels, Resorts & Palaces (including Ginger)and ITC Hotels (including Fortune) have re t a i n e d t h e to p t wo p o s i t i o n s respectively for the last three years.
Interestingly, since last year's survey, Marriott International has displaced Hyatt Hotels & Resorts to rank number five in terms of existing inventory. Furthermore, Accor has replaced Sarovar Hotels & Resorts to take the seventh position, in addition to Lemon Tree Hotels and Wyndham Hotels & Resorts replacing The Leela Palaces, Hotels & Resorts and Royal Orchid Group to take the
th th 11 and 12 positions respectively.
Taj H
otels, Reso
rts &
Palaces (includes G
inger)
ITC Hotels (includes F
ortune)
Carlson Rezid
or Hotel G
roup
Starwood Hotels &
Resorts
Hyatt Hotels &
Resorts
Accor
Sarovar Hotels &
Resorts
Oberoi Hotels &
Resorts
InterContin
ental Hotel G
roup
Lemon Tree Hotels
Wyndham Hotels & Reso
rts
The Leela Palaces, Hotels &
Resorts
Royal Orchid Group
The LaLit
Best Weste
rn
Concept Hosp
itality
Marriott
International
Hilton Hotels &
Resorts
India Touris
m Development Corporatio
n
Choice Hotels
Source: HVS Research
From 114,466 proposed b r a n d e d r o o m s i n 2007/08 - the highest in the last seven years - the total proposed supply was down to 68,050 rooms as of the close of 2013/14, the lowest since 2006/07.
2014 HOTELS IN INDIA TRENDS & OPPORTUNITIES | PAGE 9
Figure 15: Proposed Branded Hotel Rooms Across Major Cities (2013/14 – 2018/19)
Existing Supply
2013/14
Proposed
Supply
Increase in
Future Supply
Active Development
of Supply Luxury Upscale Midmarket Budget Extended Stay
Existing Supply Proposed Supply Active Development of Supply
2013/14
82%
86%
66%
80%
71%
54%
70%
68%
78%
82%
72%
49%
72%
71%
69%
Source: HVS Research
2,777
9,877
7,105
12,025
5,190
1,119
4,553
5,900
4,523
2,243
13,022
6,159
1,293
2,109
3,955
14,458
10,205
15,817
6,943
2,810
6,103
8,165
5,929
4,109
16,920
8,048
-
2,000
4,000
6,000
8,000
10,000
12,000
14,000
16,000
18,000
Ahmedabad
Agra
Bengalu
ru
Chennai
Delhi
Gurgaon
NOIDA
Goa
Hydera
bad
Jaip
ur
Kolkata
Mum
bai
Pune
* The supply for 2018/19 has been computed by adding the active future supply to the existing base of rooms in 2013/14.
PAGE 10 | HOTELS IN INDIA TRENDS & OPPORTUNITIES2014
Figu
re 1
9:
Key
Op
era
tin
g C
har
acte
rist
ics
by
Maj
or
Cit
ies
- O
ccu
pan
cy
In comparison to our last year's survey, Mumbai (including Navi Mumbai) displaced Bengaluru with the highest future supply in the country in 2013/14 with a total of 7,896 proposed rooms. However, in terms of active development of supply, Ahmedabad recorded the top position (86%), closely followed by Agra and Jaipur at 82%. Once again, NOIDA (including Greater NOIDA) saw the highest increase in future supply (215%) on an existing base of just 1,119 rooms in 2013/14, followed by Kolkata at 115% on a existing base of 2,243 rooms.
The countrywide active development of supply was lower in 2013/14 when compared to the previous fiscal in absolute terms. We anticipate a little over 45,000 branded rooms to be developed over the next five years, taking the total supply to about 150,700 rooms by 2018/19. Figure 17 displays branded supply across major cities for 2013/14 and 2018/19. Additionally, Figure 18 (on page 10) presents the increase in hotel room supply in India from 2000/01 through 2013/14, and then further illustrates the proposed new supply through 2018/19.
Overall, Kolkata retained its position as the best-performing hotel market in terms of occupancy (72.0%) in 2013/14, while Mumbai (including Navi Mumbai) registered the highest average rate (`7,105) and Goa recorded the highest RevPAR (`4,778) amongst the 13 major markets being tracked in this report.
In 2013/14, most hotel markets witnessed an increase in occupancy with the exception of Chennai and also Jaipur, which displayed muted growth. However, on the other hand, hotel markets other than Goa and Agra witnessed a drop in average rate, a testament to our belief that domestic tourism will be a driving force for the industry going forward. Agra, NOIDA (including Greater NOIDA) and Goa were the only major hotel markets in the country to record notable RevPAR growths in 2013/14. Chennai was the only hotel market to have declined in both occupancy (7.5%) and average rate (9.2%) owing to a notable growth in supply (12.2%).
Even though NOIDA (including Greater NOIDA) witnessed the highest growth in supply (33.1%) in 2013/14, it recorded the highest increase in occupancy (21.1%) due to a rise in demand from the MICE segment, consequently resulting in the highest RevPAR growth (7.4%) across the country.
Figure 19 illustrates hotel occupancy for 13 key cities in India between 1995/96 and 2013/14. Figures 20 and 21 show average rates for each of these hotel markets, expressed in Indian rupees and US dollars, respectively. Figures 22 and 23 present the corresponding RevPAR data for each city.
Industry Performance by Major Cities
Figure 18: Growth of Room Supply – India(2000/01 – 2018/19)
24,905
103,855
150,702
-
20,000
40,000
60,000
80,000
100,000
120,000
140,000
160,000
180,000
200,000
2000/01 2013/14 2018/19
Number of Rooms Trendline
12-M
onth
**C
ompo
unde
d
1995
/96
199
6/9
719
97/9
819
98/9
919
99/0
020
00/0
120
01/0
2200
2/03
2003
/04
2004
/05
2005
/06
2006
/07
2007
/08
2008
/09
2009
/10
2010
/11
2011
/12
2012
/13*
2013
/14
Cha
nge
Gro
wth
Agr
a47
.6%
51.7
%46
.1%
46.4
%40
.1%
42.5
%33
.7%
30.7
%50
.0%
57.1
%56
.0%
58.9
%58
.3%
52.4
%55
.9%
60.2
%57
.1%
58.9
%60
.6%
2.9%
1.3%
Ahm
edab
ad55
.7%
65.8
%71
.8%
58.0
%50
.8%
55.8
%53
.2%
53.8
%63
.2%
68.3
%69
.1%
67.9
%73
.3%
61.2
%58
.2%
54.3
%59
.9%
53.7
%54
.2%
0.9%
-0.2
%
Ben
galu
ru71
.3%
67.2
%61
.2%
59.0
%64
.4%
69.8
%64
.3%
72.0
%78
.5%
81.4
%76
.7%
72.5
%65
.3%
54.6
%53
.2%
58.4
%56
.6%
55.6
%58
.7%
5.6%
-1.1
%
Che
nnai
84.6
%80
.2%
68.4
%64
.7%
65.3
%64
.6%
56.5
%58
.3%
66.6
%72
.9%
78.2
%74
.7%
72.8
%63
.1%
62.1
%67
.2%
65.7
%60
.0%
55.5
%-7
.5%
-2.3
%
68.3
%68
.7%
63.8
%61
.7%
63.1
%2.
2%-0
.7%
Gur
gaon
66.0
%66
.5%
62.0
%58
.0%
59.6
%2.
9%-2
.5%
NO
IDA
74.0
%80
.7%
56.2
%44
.4%
53.8
%21
.1%
-7.7
%
Goa
62.1
%58
.4%
59.2
%58
.6%
53.3
%60
.6%
53.6
%60
.5%
59.3
%62
.5%
67.8
%72
.8%
72.2
%61
.1%
65.1
%67
.7%
68.5
%68
.9%
70.2
%1.
8%0.
7%
Hyd
erab
ad58
.1%
54.8
%53
.4%
66.0
%61
.3%
69.1
%68
.0%
68.9
%75
.9%
78.7
%82
.0%
72.1
%65
.7%
55.8
%53
.3%
57.1
%54
.0%
49.3
%53
.0%
7.5%
-0.5
%
Jaip
ur52
.2%
58.4
%51
.7%
45.6
%47
.0%
55.0
%48
.3%
44.9
%58
.8%
67.2
%65
.7%
65.5
%64
.7%
54.1
%57
.3%
57.7
%55
.2%
54.7
%54
.7%
0.0%
0.3%
Kol
kata
63.8
%55
.9%
61.8
%57
.8%
54.8
%62
.9%
66.4
%65
.4%
62.8
%69
.0%
76.4
%75
.5%
73.9
%69
.5%
67.5
%68
.3%
70.0
%71
.5%
72.0
%0.
6%0.
7%
Mum
bai
81.0
%73
.0%
65.3
%67
.6%
64.5
%64
.6%
52.0
%63
.4%
69.7
%72
.0%
76.2
%77
.9%
74.6
%60
.6%
62.5
%62
.4%
63.7
%64
.3%
66.9
%4.
0%-1
.1%
Pun
e
71.0
%68
.9%
86.4
%83
.1%
83.4
%69
.5%
62.2
%50
.9%
46.7
%51
.3%
58.2
%58
.3%
0.2%
-1.8
%
Del
hia
71.7
%67
.3%
60.2
%54
.1%
52.9
%58
.9%
53.3
%60
.4%
73.1
%79
.1%
80.8
%76
.9%
73.9
%67
.3%
Source: HVS Research
* Th
e 2
01
2/1
3 d
ata
ha
s b
een
mo
dif
ied
to
incl
ud
e th
e p
erfo
rma
nce
of
a la
rger
sa
mp
le s
et**
Ch
an
ge
in 2
01
3/1
4 e
xpre
ssed
as
per
cent
ag
e o
f th
e fi
gu
re f
or
20
12
/13
a Del
hi N
CR
da
ta (
Sha
ded
Po
rtio
n)
fro
m 1
99
5/9
6 t
o 2
00
8/0
9, D
elh
i (w
ith
ou
t G
urg
ao
n, N
OID
A a
nd
Gre
ate
r N
OID
A)
da
ta f
rom
20
09
/10
to
20
13
/14
Sou
rce:
HV
S R
esea
rch
A
gra
49
52
56
50
38
35
39
41
53
67
81
108
131
116
12
11
37
12
41
12
103
Ahm
edabad
66
76
50
53
62
61
50
45
52
62
70
81
108
104
95
94
82
72
60
Bengalu
ru71
89
95
81
70
80
79
78
105
166
197
239
244
207
13
81
49
13
11
09
89
Chennai
86
100
110
89
79
85
75
67
72
83
98
123
158
145
12
01
24
11
51
00
81
Delh
ia
94
113
135
111
95
101
92
85
93
114
155
211
259
214
18
51
89
17
01
36
114
Gurg
aon
17
31
66
15
91
25
104
NO
IDA
15
71
70
15
51
23
98
Goa
69
66
63
73
63
65
57
57
67
89
108
133
155
137
11
81
33
12
81
20
112
Hydera
bad
46
45
45
39
43
52
51
53
60
84
109
137
156
137
10
81
14
10
58
973
Jaip
ur
47
52
68
62
45
65
62
57
65
77
99
121
141
130
95
10
49
98
976
Kolk
ata
96
100
109
88
82
82
72
61
66
72
87
121
163
146
12
81
41
12
61
12
93
Mum
bai
159
176
170
138
130
124
104
87
95
107
136
200
272
233
17
71
80
16
51
39
117
Pune
54
61
78
110
150
197
163
12
21
09
87
71
63
Exchange R
ate
32.4
35.4
36.3
42.2
43.5
44.9
47.2
48.2
46.0
44.9
44.5
43.6
40.2
45.9
47
.74
5.6
48
.05
4.5
60.7
12-M
onth
**C
hang
eC
ompo
unde
dG
row
th19
95/9
619
96/
97199
7/9
8199
8/9
9199
9/00
2000
/01
2001
/02
2002
/03
2003
/04
2004
/05
2005
/06
2006
/07
2007
/08
2008
/09
2009
/10
2010
/11
2011
/12
2012
/13*
2013
/14
Agr
a1,
593
1,82
62,
027
1,90
61,
638
1,58
61,
840
1,95
42,
431
3,01
23,
622
4,71
55,
262
5,32
25,
773
6,24
35,
958
6,12
66,
254
2.1%
7.9%
Ahm
edab
ad2,
132
2,67
81,
833
2,22
02,
705
2,73
62,
354
2,16
42,
410
2,78
73,
111
3,52
64,
351
4,75
44,
540
4,28
53,
917
3,90
43,
614
-7.4
%3.
0%
Ben
galu
ru2,
300
3,13
63,
451
3,25
43,
025
3,60
23,
735
3,75
24,
832
7,47
08,
762
10,4
069,
827
9,49
56,
597
6,77
66,
293
5,96
05,
427
-8.9
%4.
9%
Che
nnai
2,77
93,
540
3,97
73,
600
3,42
43,
796
3,53
53,
224
3,32
33,
714
4,35
75,
378
6,34
06,
677
5,71
05,
632
5,52
45,
440
4,94
2-9
.2%
3.2%
Del
hia
3,05
44,
007
4,91
34,
626
4,11
54,
526
4,33
84,
089
4,26
95,
103
6,90
99,
192
10,4
299,
811
8,83
48,
634
8,17
47,
387
6,94
3-6
.0%
4.7%
Gur
gaon
8,24
77,
554
7,63
96,
831
6,29
6-7
.8%
-6.5
%
NO
IDA
7,49
67,
752
7,41
66,
724
5,96
4-1
1.3%
-5.6
%
Goa
2,22
02,
347
2,30
32,
863
2,72
72,
914
2,67
62,
754
3,08
63,
985
4,80
45,
801
6,25
56,
271
5,61
36,
056
6,16
26,
513
6,80
84.
5%6.
4%
Hyd
erab
ad1,
499
1,60
41,
646
1,57
91,
867
2,31
62,
414
2,54
12,
774
3,77
24,
870
5,96
26,
271
6,29
75,
146
5,17
35,
026
4,85
44,
437
-8.6
%6.
2%
Jaip
ur1,
518
1,83
62,
473
2,53
32,
514
2,90
22,
949
2,72
82,
980
3,46
14,
407
5,28
55,
664
5,98
24,
539
4,71
84,
727
4,84
34,
626
-4.5
%6.
4%
Kol
kata
3,10
43,
556
3,95
13,
888
3,55
73,
698
3,40
92,
917
3,02
13,
240
3,88
75,
288
6,57
56,
686
6,08
76,
408
6,04
96,
093
5,63
9-7
.4%
3.4%
Mum
bai
5,13
76,
229
6,16
96,
297
5,66
15,
555
4,93
24,
184
4,35
64,
822
6,04
18,
738
10,9
3210
,679
8,42
88,
194
7,92
37,
550
7,10
5-5
.9%
1.8%
Pun
e2,
603
2,80
53,
521
4,91
56,
523
7,94
67,
493
5,81
04,
949
4,16
33,
861
3,83
7-0
.6%
3.6%
Figu
re 2
0:
Key
Op
era
tin
g C
har
acte
rist
ics
by
Maj
or
Cit
ies
– A
vera
ge R
ate
()`
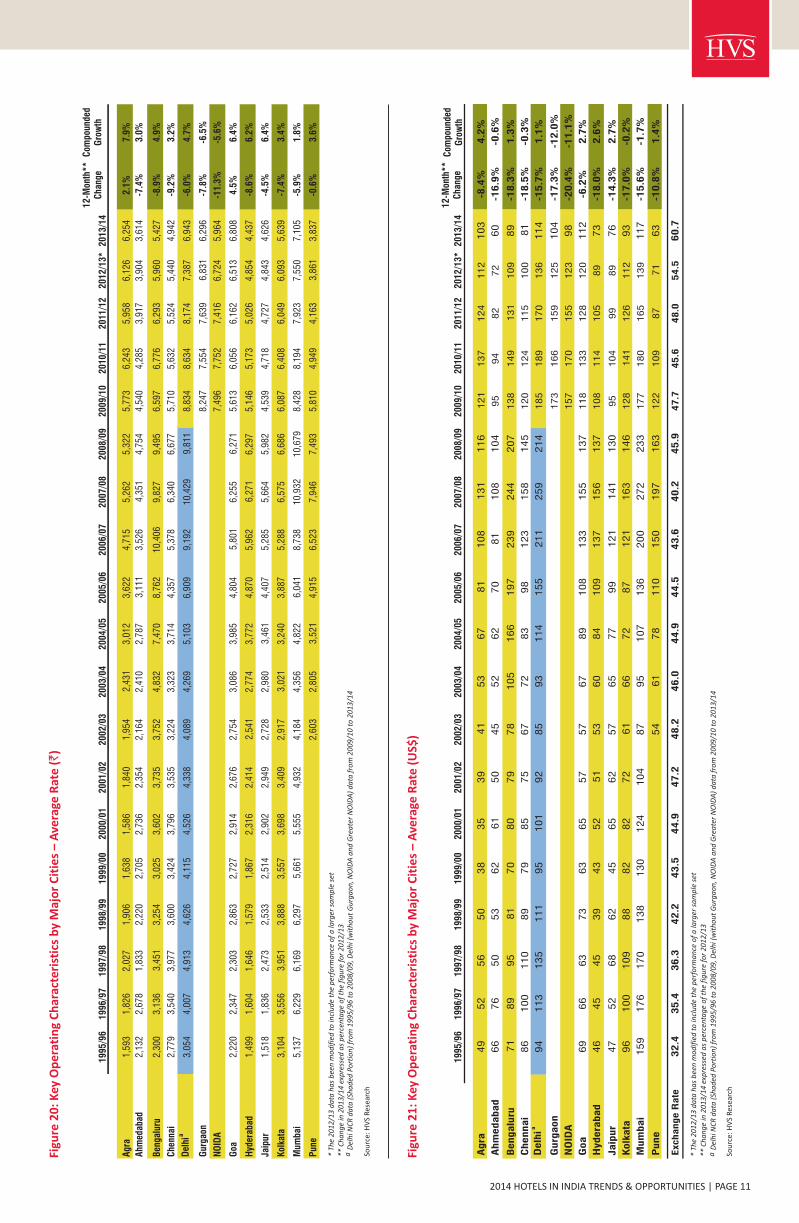
2014 HOTELS IN INDIA TRENDS & OPPORTUNITIES | PAGE 11
Figu
re 2
1:
Key
Op
era
tin
g C
har
acte
rist
ics
by
Maj
or
Cit
ies
– A
vera
ge R
ate
(U
S$)
-8.4
%4.2
%
-16.9
%-0
.6%
-18.3
%1.3
%
-18.5
%-0
.3%
-15.7
%1.1
%
-17.3
%-1
2.0
%
-20.4
%-1
1.1
%
-6.2
%2.7
%
-18.0
%2.6
%
-14.3
%2.7
%
-17.0
%-0
.2%
-15.6
%-1
.7%
-10.8
%1.4
%
12-M
onth
**C
hang
eC
ompo
unde
dG
row
th19
95/9
619
96/
97199
7/9
8199
8/9
9199
9/00
2000
/01
2001
/02
2002
/03
2003
/04
2004
/05
2005
/06
2006
/07
2007
/08
2008
/09
2009
/10
2010
/11
2011
/12
2012
/13*
2013
/14
* Th
e 2
01
2/1
3 d
ata
ha
s b
een
mo
dif
ied
to
incl
ud
e th
e p
erfo
rma
nce
of
a la
rger
sa
mp
le s
et**
Ch
an
ge
in 2
01
3/1
4 e
xpre
ssed
as
per
cent
ag
e o
f th
e fi
gu
re f
or
20
12
/13
a D
elh
i NC
R d
ata
(Sh
ad
ed P
ort
ion
) fr
om
19
95
/96
to
20
08
/09
, Del
hi (
wit
ho
ut
Gu
rga
on
, NO
IDA
an
d G
rea
ter
NO
IDA
) d
ata
fro
m 2
00
9/1
0 t
o 2
01
3/1
4
Sou
rce:
HV
S R
esea
rch
PAGE 12 | HOTELS IN INDIA TRENDS & OPPORTUNITIES2014
Figu
re 2
3:
Key
Op
era
tin
g C
har
acte
rist
ics
by
Maj
or
Cit
y –
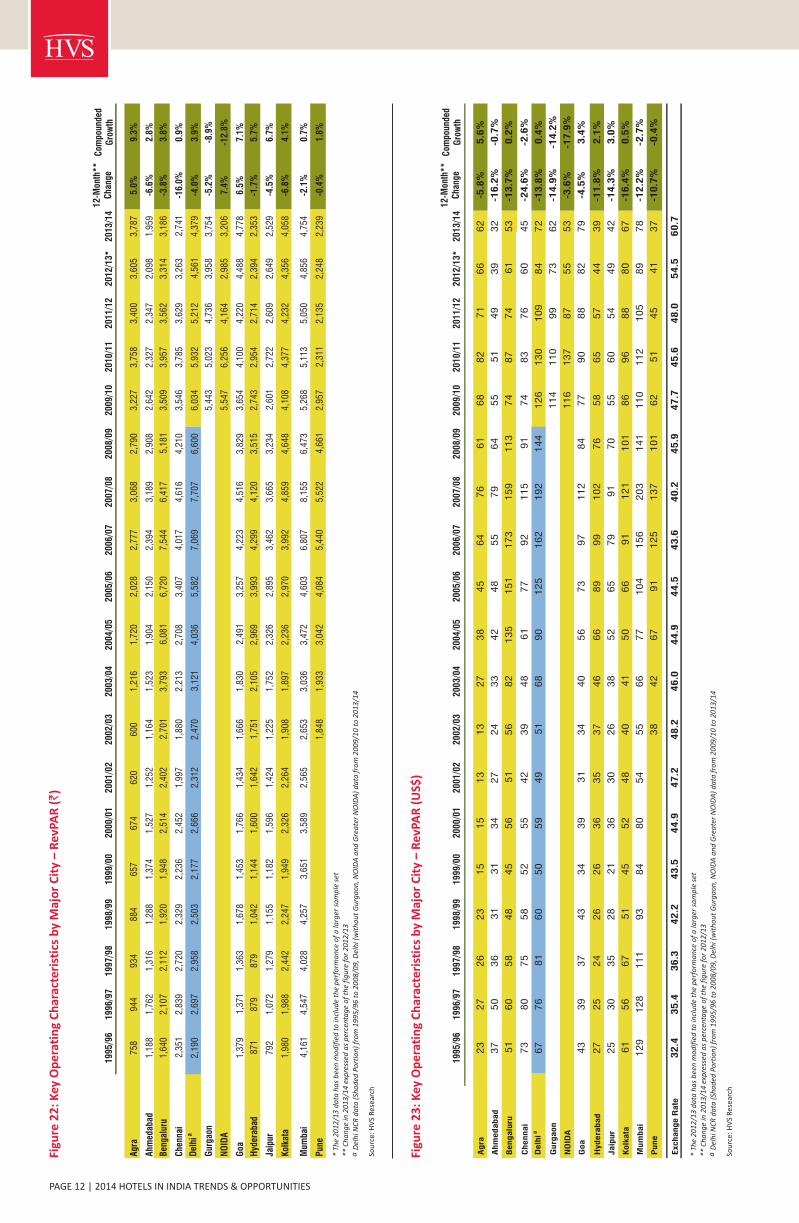
Rev
PAR
(U
S$)
Figu
re 2
2:
Key
Op
era
tin
g C
har
acte
rist
ics
by
Maj
or
Cit
y –
Rev
PAR
()
`
12-M
onth
**C
hang
eC
ompo
unde
dG
row
th19
95/9
619
96/9
719
97/9
819
98/9
919
99/0
020
00/0
120
01/0
220
02/0
320
03/0
420
04/0
520
05/0
620
06/0
720
07/0
820
08/0
920
09/1
020
10/1
120
11/1
220
12/1
3*20
13/1
4
Agr
a75
894
493
488
465
767
462
060
01,
216
1,72
02,
028
2,77
73,
068
2,79
03,
227
3,75
83,
400
3,60
53,
787
5.0%
9.3%
Ahm
edab
ad1,
188
1,76
21,
316
1,28
81,
374
1,52
71,
252
1,16
41,
523
1,90
42,
150
2,39
43,
189
2,90
82,
642
2,32
72,
347
2,09
81,
959
-6.6
%2.
8%
Ben
galu
ru1,
640
2,10
72,
112
1,92
01,
948
2,51
42,
402
2,70
13,
793
6,08
16,
720
7,54
46,
417
5,18
13,
509
3,95
73,
562
3,31
43,
186
-3.8
%3.
8%
Che
nnai
2,35
12,
839
2,72
02,
329
2,23
62,
452
1,99
71,
880
2,21
32,
708
3,40
74,
017
4,61
64,
210
3,54
63,
785
3,62
93,
263
2,74
1-1
6.0%
0.9%
Del
hia
2,19
02,
697
2,95
82,
503
2,17
72,
666
2,31
22,
470
3,12
14,
036
5,58
27,
069
7,70
76,
600
6,03
45,
932
5,21
24,
561
4,37
9-4
.0%
3.9%
Gur
gaon
5,44
35,
023
4,73
63,
958
3,75
4-5
.2%
-8.9
%
NO
IDA
5,54
76,
256
4,16
42,
985
3,20
67.
4%-1
2.8%
Goa
1,37
91,
371
1,36
31,
678
1,45
31,
766
1,43
41,
666
1,83
02,
491
3,25
74,
223
4,51
63,
829
3,65
44,
100
4,22
04,
488
4,77
86.
5%7.
1%
Hyd
erab
ad87
187
987
91,
042
1,14
41,
600
1,64
21,
751
2,10
52,
969
3,99
34,
299
4,12
03,
515
2,74
32,
954
2,71
42,
394
2,35
3-1
.7%
5.7%
Jaip
ur79
21,
072
1,27
91,
155
1,18
21,
596
1,42
41,
225
1,75
22,
326
2,89
53,
462
3,66
53,
234
2,60
12,
722
2,60
92,
649
2,52
9-4
.5%
6.7%
Kol
kata
1,98
01,
988
2,44
22,
247
1,94
92,
326
2,26
41,
908
1,89
72,
236
2,97
03,
992
4,85
94,
648
4,10
84,
377
4,23
24,
356
4,05
8-6
.8%
4.1%
Mum
bai
4,16
14,
547
4,02
84,
257
3,65
13,
589
2,56
52,
653
3,03
63,
472
4,60
36,
807
8,15
56,
473
5,26
85,
113
5,05
04,
856
4,75
4-2
.1%
0.7%
Pun
e1,
848
1,93
33,
042
4,08
45,
440
5,52
24,
661
2,95
72,
311
2,13
52,
248
2,23
9-0
.4%
1.8%
* Th
e 2
01
2/1
3 d
ata
ha
s b
een
mo
dif
ied
to
incl
ud
e th
e p
erfo
rma
nce
of
a la
rger
sa
mp
le s
et**
Ch
an
ge
in 2
01
3/1
4 e
xpre
ssed
as
per
cent
ag
e o
f th
e fi
gu
re f
or
20
12
/13
a D
elh
i NC
R d
ata
(Sh
ad
ed P
ort
ion
) fr
om
19
95
/96
to
20
08
/09
, Del
hi (
wit
ho
ut
Gu
rga
on
, NO
IDA
an
d G
rea
ter
NO
IDA
) d
ata
fro
m 2
00
9/1
0 t
o 2
01
3/1
4
Sou
rce:
HV
S R
esea
rch
A
gra
23
27
26
23
15
15
13
13
27
38
45
64
76
61
68
82
71
66
62
-5.8
%5
.6%
Ahm
edabad
37
50
36
31
31
34
27
24
33
42
48
55
79
64
55
51
49
39
32
-16
.2%
-0.7
%
Bengalu
ru5
16
05
84
845
56
51
56
82
135
151
173
159
113
74
87
74
61
53
-13
.7%
0.2
%
Chennai
73
80
75
58
52
55
42
39
48
61
77
92
115
91
74
83
76
60
45
-24
.6%
-2.6
%
Delh
ia6
77
68
16
050
59
49
51
68
90
125
162
192
144
126
130
109
84
72
-13
.8%
0.4
%
Gurg
aon
114
110
99
73
62
-14
.9%
-14
.2%
NO
IDA
116
137
87
55
53
-3.6
%-1
7.9
%
Goa
43
39
37
43
34
39
31
34
40
56
73
97
112
84
77
90
88
82
79
-4.5
%3
.4%
Hydera
bad
27
25
24
26
26
36
35
37
46
66
89
99
102
76
58
65
57
44
39
-11
.8%
2.1
%
Jaip
ur
25
30
35
28
21
36
30
26
38
52
65
79
91
70
55
60
54
49
42
-14
.3%
3.0
%
Kolk
ata
61
56
67
51
45
52
48
40
41
50
66
91
121
101
86
96
88
80
67
-16
.4%
0.5
%
Mum
bai
12
91
28
11
19
384
80
54
55
66
77
104
156
203
141
110
112
105
89
78
-12
.2%
-2.7
%
Pune
38
42
67
91
125
137
101
62
51
45
41
37
-10
.7%
-0.4
%
Exchange R
ate
32
.43
5.4
36
.34
2.2
43
.54
4.9
47
.24
8.2
46
.04
4.9
44
.54
3.6
40
.24
5.9
47
.74
5.6
48
.05
4.5
60
.7
12-M
onth
**C
hang
eC
ompo
unde
dG
row
th19
95/9
619
96/9
719
97/9
819
98/9
919
99/0
020
00/0
120
01/0
220
02/0
320
03/0
420
04/0
520
05/0
620
06/0
720
07/0
820
08/0
920
09/1
020
10/1
120
11/1
220
12/1
3*20
13/1
4
* Th
e 2
01
2/1
3 d
ata
ha
s b
een
mo
dif
ied
to
incl
ud
e th
e p
erfo
rma
nce
of
a la
rger
sa
mp
le s
et**
Ch
an
ge
in 2
01
3/1
4 e
xpre
ssed
as
per
cent
ag
e o
f th
e fi
gu
re f
or
20
12
/13
a D
elh
i NC
R d
ata
(Sh
ad
ed P
ort
ion
) fr
om
19
95
/96
to
20
08
/09
, Del
hi (
wit
ho
ut
Gu
rga
on
, NO
IDA
an
d G
rea
ter
NO
IDA
) d
ata
fro
m 2
00
9/1
0 t
o 2
01
3/1
4
Sou
rce:
HV
S R
esea
rch
2014 HOTELS IN INDIA TRENDS & OPPORTUNITIES | PAGE 13
However, in spite of such a large increase in supply, occupancy actually grew by 6% in 2013/14 over 2012/13. Average rates, however, have shown decline, dropping by
approximately 9% over the previous year. This may primarily be attributed to new supply being of a lower positioning coupled with average rate pressures being faced by older hotels.
Future supply for Bengaluru is estimated to be approximately 7,000 hotel rooms of which only 66% is being actively developed. With overall business sentiment in the city anticipated to further improve in the coming year, we forecast growth in occupancy; however, average rates are expected to remain under pressure in the short term.
Amongst the major hotel markets tracked in this report, recorded the highest decline in RevPAR (16.0%) in 2013/14 when compared to 2012/13. Steep decrease in both average rate and occupancy (9.2% and 7.5% respectively) resulted in the sharpest RevPAR drop the city has witnessed in the last five years. After having witnessed a hefty increase in supply in 2012/13 (29.1%), the city continued to expand its supply base and recorded a double-digit growth (12.2%) in its second consecutive year (2013/14).
Additionally, moderation in the growth of demand (a meagre 3.8% in 2013/14) primarily due to the slowdown in the manufacturing industry, particularly in the automobile sector, augmented the pressure on average rates, with hotels scrambling to maintain occupancy levels in an increasingly competitive space.
With increasing supply, Chennai is segregating into distinct micro-markets. CBD, which has the highest concentration of independently run hotels, saw a
significant drop in average rates accompanied by a m a r g i n a l d e c r e a s e i n occupancy as most hotels focused on adopting a volume-driven strategy. In c o n t ra s t , G u i n dy, wh i c h witnessed the largest influx of supply, saw an erosion in both occupancy and average rates leading to a sharp decline in
RevPAR. OMR, the IT corridor of the city, saw the highest decline in RevPAR amongstall micro-markets in 2013/14, as slow
Chennai
Demand in Ahmedabad is generated mainly in the Commercial segment from the traditional CBD areas of Ashram Road and CG Road together with several Grade A office spaces that have developed along SG Highway. The city also caters to a fair quantum of Extended-Stay demand emanating from the growing industrial clusters of Sanand-Bol and Changodar. HVS believes that in addition to Sanand-Bol, hotels will start focusing on the planned Japanese industrial estate in Vithalapur. Major companies such as Maruti Suzuki, Honda and Mitsubishi Aluminum Company have announced plans to set up new plants at this estate, which is located 65 kilometres northwest of Ahmedabad.
Traditionally, the city's hotels had catered to some demand from the MICE segment generated by large-scale conventions such as the biennial Vibrant Gujarat Summit and related events held at Mahatma Mandir in
Gandhinagar. Going forth, in addition to such summits, we expect the new hotels offering medium-to-large-scale meeting facil it ies to attract several conferences and social events to the city.
With an impending supply of 1,372 rooms (86% of which is actively under construction) likely to enter the market over the next few years, we expect both occupancy and average rates to remain under pressure in the short term. In the long term, as supply pressure eases and the city continues to exhibit strong demand growth, we anticipate the market conditions to improve.
, over the years, has emerged as one of India's most important commercialdestinations, home to the offices of several top global conglomerates that have formed large bases in different parts of the city.
Bengaluru is divided into well-defined independent micro-markets with overlap in room-night demand being primarily limited to the Extended-Stay segment. This segment, in fact, has grown substantially over the last two years and we are of the opinion that the city requires more branded Extended-Stay accommodation across different positioning.
Bengaluru has historically seen a high percentage of upscale room supply; however, this is now changing with an increasing number of Economy and B u d g e t h o t e l s h a v i n g r e c e n t l y c o m m e n c e d operations. With their no frills service-design and low cost of operations, these hotels are ideally suited to cater to low-paying IT/ITeS demand which the city thrives on.The 2013/14 fiscal saw the addition of approximately 1,350 branded rooms.
Bengaluru
City Trends
Agra
Ahmedabad
A “must-see” leisure destination in India, recorded an occupancy of 60.6%
in 2013/14 (an increase of 2.9% when c o m p a re d t o t h e p re v i o u s ye a r ) , accompanied by a moderate increase in average rate (2.1%). A city highly dependent on the Leisure segment owing to the presence of three world her i tage monuments, Agra has witnessed a slight change in its customer mix over the last two years. The slowdown in the growth of the Foreign Leisure segment has been cushioned by the rise in the Individual Domestic Leisure and MICE segments courtesy the improved road connectivity t o D e l h i - N C R . G o i n g f o r t h , t h e commencement of electronic travel authorisation (ETA) to citizens of 180 countries is likely to provide a fillip to foreign traffic to Agra, an essential component of the famous “Golden Triangle” itinerary.
Agra remains the only major hotel market that has not witnessed growth in branded hotel supply in 2012/13 and 2013/14. We are tracking a proposed supply of 990 rooms of which 82% is actively under development. A unique feature is that all of this supply is anticipated in the midmarket and budget space. HVS believes that this development trend presents an excellent opportunity for the hotel market to continue to tap demand from the rising Domestic Leisure segment in the country.
However, the destination still lacks an international airport. Plans for construction of a new civilian terminal announced in 2013 are yet to see any headway. Overall, the growing middle class and the anticipated boost from the ETA schemes together with the development of suitable hotel products leads us to believe that Agra will continue on its growth trajectory in the long run.
witnessed a 12.1% increase in supply in 2013/14 over the previous year. Despite this double-digit growth in supply, the city maintained its occupancy level as a result of robust growth in demand (13.1%). This increase in demand was primarily driven by the emerging business district of SG Highway along with new manufacturing plants being set up in the industrial belt of Sanand-Bol located on the western periphery of the city. However, hotels faced stiff competition causing rate to decline by 7.4% in 2013/14 as compared to 2012/13.
The Gateway Hotel IT Expressway Chennai
The Ritz Carlton Bengaluru
Agra remains the only major hotel market that has not witnessed growth in b r a n d e d h o t e l supply in 2012/13 and 2013/14.
F u t u r e s u p p l y f o r Bengaluru is estimated to be approximately 7,000 hotel rooms of which only 66% is being actively developed.
Chennai's hotel market is expected to become more competitive with around 3,100 new rooms entering the market over the next two-to-three years, and we expect hotels to focus more on occupancy than average rates across all micro-markets in the short-to-medium term.
HVS believes that while the development and commissioning of hotels at Aerocity is expected to put some pressure on hotels in Gurgaon, especially in segments such as Airline and Meeting and Conferences, this impact is expected to be short-lived. With the country's economy on the path to recovery, demand for room nights in Gurgaon is expected to outpace its supply in the medium-to-long term. Also, formation of alternate feeder markets within the city is expected to further insulate the market from any external supply threats. All these factors, coupled with the doubling of office supply over the next five to seven years, indicate Gurgaon's potential of becoming one of India's strongest hotel markets.
suffered the steepest decline in average rate (11.3%) over the previous year, reflecting the trade-off the hotels made in order to record the highest increase in occupancy (21.1%) and RevPAR (7.4%) amongst all the markets tracked by us this year. This can be attributed to the increase in MICE demand within the city, coupled with a decrease in the relatively higher paying commercial demand from the neighbouring pockets of
Ghaziabad and East Delhi owing to the opening of branded hotel rooms in those areas.
Moreover, events such as the Auto Expo, Petrotech
and Indian Grand Prix - Formula 1 that contributed to the overall MICE demand in the recent past are unlikely to be hosted this year. This, coupled with approximately 1,700 rooms under active development that are anticipated to open over the next five years is worrying, especially as the proposed hotels have large inventories.
Keeping in mind the hotel market's highly price-sensitive nature and lack of any substantial growth in demand, we anticipate hotels to have little choice but to further tap the MICE segment, which includes a limited
number of large-format events scheduled to be hosted at the India Exposition Mart and Buddh International Circuit. In the short-to-medium term, we expect marketwide occupancy and average rate to come under pressure.
holds the distinction of being the only market in the country that has witnessed a continuous increase in RevPAR over the last five years, exhibiting a healthy 6.9% year-on-year growth. Many factors, such as strong
NOIDA (including Greater NOIDA)
Goa
Room night demand growth, however, has continued to be healthy, growing by a CAGR of 8% over the last 5 years.
Future supply for the city is estimated to be approximately 5,300 hotel rooms of which 71% is being actively developed. A
significant portion of this new supply is concentrated inD A a n d i s a n t i c i p a t e d to commence operations over the next two years. We, therefore, forecast occupancy and rate pressures in the short term as these new hotels enter
the market; however, our medium-to-long term view for Delhi at large remains positive.
has gained prominence as one of the leading commercial hubs in the country. The growth of its hospitality sector has been closely linked to the economic health of the city and country on the whole. After having witnessed a decline in marketwide parameters in 2012/13, Gurgaon bounced back in 2013/14 exhibiting a 2.9% increase in marketwide occupancy over the previous fiscal. This, however, was at the cost of a 7.8% decline in average rate. During this period, owing to economic and political uncertainty coupled with supply pressures, most hotels gave preference to contracted room nights from the relatively low-yielding Airline and MICE segments in order to maintain baseline occupancy levels. Also, to mitigate the occupancy differential between weekdays and weekends, hotels pitched lucrative packages to leisure travellers during the weekend in an attempt to displace demand generated by this segment from hotels in central and south Delhi.
As Central Business District (CBD) areas such as Cyber City and Udyog Vihar become congested and less affordable, various companies have started exploring the other peripheral parts of Gurgaon which offer financially lucrative deals. With the majority of new commercial and residential development taking place in these peripheral parts of the city located along Sohna Road, Golf Course Extension, Southern Periphery Road and parts beyond the Kherki Daula Toll Plaza, we expect the creation of multiple secondary feeder markets for room night demand in the
medium-to-long term.
While supply for room nights in the city is expected to increase by 63% over the next five years, a modest 54% of this pipeline is under active development. This ratio, which is significantly lower than the n a t i o n w i d e a v e r a g e , i s
reflective of developer uncertainty regarding the fate of the hospitality industry in Gurgaon in light of the development of quality branded hotels at Aerocity.
Gurgaon (including Manesar)
absorption in office space combined withthe opening of two new hotels (200-room Gateway by Taj and 215-room Westin) r e s u l t e d i n a h i g h ly c o m p e t i t ive environment.
Chennai's hotel market is expected to become more competitive with around 3,100 new rooms entering the market over the next two-to-three years, and we expect hotels to focus more on occupancy than average rates across all micro-markets in the short-to-medium term. A majority of this supply (60%) is presently under construction along the OMR belt and is likely to keep the city's occupancy and average rate growth muted over the next two-to-three years. In contrast, the manufacturing hubs of Sriperumbudur and O r a g a d a m , w h i c h h a v e s e e n t h e announcement of several hotel projects,are yet to see any progress and continueto present opportunities for hotel development.
The main focus of the
hotel market over the past year has beenthe impact of hotels in Delhi Aerocity ( DA ) . W i t h f o u r h o t e l s h a v i n g commenced operations during the course of last year, the impact has, in fact, been positive. The city actually recorded a 2.2% growth in occupancy in 2013/14 over the previous fiscal.
The conclusion of the General Elections and its emphatic result is almost certain to have a positive impact on Delhi, which will now attract increased travel to the city and perhaps see increased diplomatic movements. Furthermore, the new ETA Visa scheme for tourists will also likely bode well for hotels in the city.
Delhi's branded room supply has grown at a CAGR of 10% over the last 5 years of which 42% is spread across the midmarket, budget and economy segment of hotels. The city now provides a h e a l t hy m i x o f h i gh a n dlow positioning branded hotel rooms – a welcome change from previous years where Delhi was dominated by upscale and luxury products. This, however, has led to lowering of marketwide average rates with 2013/14 witnessing a 6% drop over the previous year.
Delhi (excluding Gurgaon, NOIDA and Greater NOIDA)
PAGE 14 | HOTELS IN INDIA TRENDS & OPPORTUNITIES2014
Novotel Chennai
JW Marriott Aerocity New Delhi
Delhi now provides a healthy mix of high and low positioning branded hotel rooms - a welcome change from previous years where Delhi was dominated by upscale and luxury products.
While supply for room nights in is expected to increase by 63% over the next five years, a modest 54% of this pipeline is under active development.
Gurgaon
Keeping in mind highly price-sensitive nature and lack of any substantial growth in demand, we anticipate hotels to have little choice but to further tap the MICE segment.
NOIDA’s
2014 HOTELS IN INDIA TRENDS & OPPORTUNITIES | PAGE 15
growth in charter movements, an upswing in domestic consumption patterns and the promising growth in the Meeting and Conferences segment, have favourably impacted India's most preferred leisure destination.
In 2013/14, on account of a 5.2% growth in demand for room nights a l o n g w i t h a 3 . 3 % growth in its supply, both marketwide occupancy and average rate for Goa increased by 1.8% and 4.5%, respectively. Even with a strong base of unbranded supply, the latent demand for branded rooms became apparent during this period with absorption levels of newly commissioned hotels touching the 65% mark, a number that was significantly higher than the nationwide average.
On the supply front, of approximately 2,291 rooms that are proposed to be developed, about 68% are under active development and are likely to enter the market over the next three-to-four years.
Going forward, as year-on-year growth in demand for room nights is expected to outpace its supply, the uptrend in market performance is likely to continue in the short-to-medium term.
While demand and supply dynamics are anticipated to pan out positively for the hotel market in Goa, a major hurdle in its sustainable growth continues to be the lack of quality infrastructure. Even though the government has taken measures such as the development of a new terminal at Dabolim airport, a lot more needs to be done, especially in light of the increasing competition Goa faces from other beach destinations in India and South Asia.
After continuing to see a drop in room night demand for the last two years, witnessed a 7.5% growth in marketwide occupancy in 2013/14. This is indicative of the recovery the city is anticipated to make post the conclusion of Telangana political crisis that had plagued the city for the last few years.
Hyderabad offers some of the country's best infrastructure in terms of road connectivity, airport access and planned developments, especially in its periphery areas like
Hyderabad
Gachibowli and HITEC City. It is also home to the India's only branded convention centre – Hyderabad International Convention Centre (HICC). The improved political situation should hopefully help HICC, which had witnessed a drastic drop in the number of events hosted over the last two years.
A v e r a g e r a t e s i n Hyderabad, however, continue to witness year-on-year decline. Hotels have opted to adopt volume-based strategies especially in the wake of
the slowdown in demand. Furthermore, approximately 60% of the recently opened supply in the city is spread across the midmarket, budget and economy segment of hotels. This has led to a further lowering of marketwide average rates.
Hyderabad is slated to add approximately 2,900 hotel rooms over the next five years of which approximately 78% are under active development. Our forecast for the city in the short term is for occupancy to improve with average rates still being under some pressure. As HICC starts hosting more events and Hyderabad's association with political issues of the past fade from memory, we anticipate overall RevPAR for the city to improve.
, one of the top leisure markets in the country and an integral part of the Golden Triangle itinerary, recorded an increase of 9.5% in supply in 2013/14 over the previous year. In contrast to 2012/13, where the city saw the addition of upscale/luxury hotels, it witnessed the introduction of hotels positioned in the economy and budget space such as Ibis, Ginger and Regenta Central in 2013/14. Demand during 2013/14 also increased by 9.5% resulting in the citywide occupancy remaining unchanged over the previous fiscal. The growth in demand was led primarily by the Domestic Leisure and MICE segments. The burgeoning middle class and growth of domestic travellers compensated for the slow increase in the Foreign Leisure segment in the city.
Jaipur continued to grow as a popular weddings and conference destination with hotels such as the Fairmont, Marriott and Radisson BLU playing host to several large-scale events. However, the price sensitive nature of MICE demand coupled with the opening of lower-positioning hotels resulted in a decline in the city's average rate by 4.5% in 2013/14.
Going forward, over the next two-to-three years, we expect an addition of about 1,400 rooms in the city. With an anticipated double-digit growth in supply, occupancy and average rates are likely to remain under pressure in the short term. However, with the continuing growth of the Domestic Leisure segment and the likely impetus in the Foreign Leisure segment from the ETA facility for citizens of 180 countries, we expect Jaipur to continue to grow as a strong Leisure market.
Jaipur
Kolkata
Mumbai
is the only city in the country that has recorded occupancy levels northward of 70% in the last three years in spite of a 12% CAGR increase in supply during the same period. This is testament to strong growthin new room night demand coupled with previously unaccommodated demand that was being catered to by the unorganised sector of hotels.
Average rate growth, however, has been muted. While the previous fiscal (2012/13) witnessed negligible growth in average rate, 2013/14 witnessed a sharp decline of approximately 7%. Hotels have felt threatened by the entry of new supply in the past year, almost all of which has been in the midmarket segment. Consequently, in order to maintain their previous occupancy levels, older hotels have dropped average rate.
While areas like Salt Lake have seen a spurt of commercial development and the setting up new offices, other periphery areas like Rajarhat (New Town) remain untapped. There have been plans of developing a large world-class convention centre in Rajarhat; however, currently there has been no progress on this project.
Future supply for the city is estimated to be approximately 2,500 hotel rooms of which 72% are under active development. A large percentage of this new supply is upscale in nature and, therefore, the city now faces a situation of being over-supplied in this segment. Given the nature of demand in the city which primarily stems from the low-paying PSU and IT/ITeS segments, Budget and Economy hotel developments are the need of the hour.
We forecast pressure on both occupancy and average rate for Kolkata in the short term with the entry of six new hotels over the next 2-3 years. As supply pressure eases and areas like Rajarhat start developing, hotel market performances are likely to improve.
continues to retain its position as the largest hotel market in the country. As the commercial capital of India, the growth
in year-on-year accommodated demand continues to be robust. Successfully absorbing the CAGR 3.9% increase in supply over the last three years, the city-wide occupancy has grown by 2.5% CAGR during this time. Even though Mumbai achieved the highest average rate (`7,096) amongst the cities tracked by us in this survey, the city has seen a correction in average rate with most
The Gateway Resort Damdama Lake Gurgaon
Radisson Blu Hotel Guwahati
Goa holds the distinction of being the only market in the country that has witnessed a continuous increase in RevPAR over the last five years, exhibiting a healthy 6.9% year-on-year growth.
PAGE 16 | HOTELS IN INDIA TRENDS & OPPORTUNITIES2014
their development is expected to be slow paced.
Over the last few years, Navi Mumbai has witnessed a notable increase in commercial activity, with developments such as Jawaharlal Nehru Port (JNPT), Mindspace, Millennium Business Park and the Reliance Technology Park that have heavily contributed to the growth in hotel demand. Going forward commercial development in
areas in and around CBD Belapur and the proposed Seawoods project in addition the proposed Exhibition C e n t re a re ex p e c te d to augment Commercial and MICE demand.
In the long-term, this market's growth largely hinges on the development of the new international airport at Panvel that has already witnessed several delays and is yet to commence construction. In the short-to-medium term, we expect marketwide occupancies to increase; however, we expect average rate to remain under pressure.
Despite a double-digit growth in supply (15.8%), Pune maintained its occupancy in 2013/14. Moreover, further decline in average rate was arrested in 2013/14, a first since 2009/10 for this otherwise seemingly free-falling market. Healthy growth in demand (15.8%) has aided the city's hotels to grow their occupancy base with minimal rate correction despite increasing supply. This increase in demand has been mainly seen in the MICE, Commercial and Extended-Stay segments.
The city has successfully established itself as a popular MICE destination for large-scale corporate events and weddings in the country over the past few years. Also, despite the slowdown in the auto-manufacturing sector, Commercial and Extended-Stay segments saw strong increases owing to the rising IT/ITeS sector especially in the city's eastern and western parts. Several large companies are choosing to set up their back office operations in Pune, owing to the availability of large floor plates in commercial buildings, lower rentals when compared to Mumbai, relatively good connectivity and a burgeoning talent pool emanating from several educational institutions present in the city. Going forth, we expect this trend to continue.Rise in industrial output in April-May this year also leads us to believe that growth in
Pune,
properties giving precedence to occupancy over average rate.
A notable observation is the resurgence of demand amongst the South Mumbai hotels that witnessed an increase in occupancy by approximately 7% over the previous year, whereas average rate exhibited a marginal drop of 0.4% at the same time. This demand stemmed from the Leisure, Social MICE and Commercial segments. In 2013/14, Central and North Mumbai hotels displayed an increase in occupancy of 4% over the previous year; however, average rate witnessed a drop of approximately 7%. Over the last few years, the various micro-markets in Mumbai have seen continuous additions to office stock that has further fueled demand for hotels. Majority of the new supply expected to enter the Mumbai market is located in BKC, Andheri, Juhu and Santa Cruz. In 2013/14, Mumbai recorded the least supply increase across the country, with additions primarily being on account of expansions and renovations at various hotels. However, increase in supply over the short term includes the JW Marriott and the Taj Airport Hotel at the two airports and Radisson Blu Plaza in Kanjurmarg. In the medium-to-long term, there is the likelihood of hotel developments at the Mumbai International Airport , Bandra-Kurla Complex and Lower Parel.
The newly opened Terminal 2 and the proposed convention centre currently being developed near the domestic airport are further expected to augment Airline and MICE demand for the city. Moreover, with improvements in infrastructure such as the development of the Metro and Monorail, up gradation of the existing Airport and opening of the Santa Cruz-Chembur Link Road and Eastern Freeway, our outlook for Mumbai remains optimistic.
Navi Mumbai was developed to facilitate the decongestion of Mumbai and has grown rapidly in the past few years with the proliferation of residential and commercial units in addition to a planned international airport. However, it faces poor connectivity with Mumbai, with only two road links and a single rail line between the cities.
The Navi Mumbai hotel market continues to be dependent on several unbranded hotels with Commercial and Extended-Stay demand contributing over 90% of the accommodated demand. In 2012/13, majority of Navi Mumbai's planned supply entered the market, with the opening of hotels such as the Ibis, Country Inn & Suites and Royal Tulip. The total number of branded rooms recorded in 2013/14 was approximately 1,000 (located in Vashi, CBD Belapur, Kharghar, Mahape, Kopar Khairane, Turbhe and Palm Beach Road). In the next few years, approximately 800 branded rooms ranging from budget to midmarket categories have been proposed; however,
Novotel Pune
the manufacturing sector, a major contributor of demand to hotels, is on the anvil.
On the supply front, the year 2014/15 is expected to be a unique one for Pune city as no large branded hotel is anticipated to commence operations in the first half of the fiscal. With a slowdown in supply and a continued increase in demand, we expect occupancy across the eastern and central micro-markets to pick up. We also anticipate average rate to improve gradually as hotels get the much-needed break from new-supply pressure. Considering over 50% of the proposed supply currently being tracked by us is planned in Hinjewadi, we are of the opinion that over the next two-to-three years, occupancy and rate pressure will shift to the west before stabilising in the long term.
In recent years, we have highlighted various trends and opportunities impacting the Indian Hospitality sector. These have, in the last three-to-five years, included the beginning of hotel transactions and rebranding of hotels ; increased awareness in Indian hotel owners; growth in domestic travel; emergence of institutional hospitality players; growth of the previously untapped MICE segment; the creation of newer Leisure markets and last, but not least, focus on environmental sustainability within hotels. We conclude this year's publication by drawing attention to a few additional trends and opportunities that every hospitality industry stakeholder must pay heed to.
Social Media
It's an on-line world and has been for some time now. While the emergence of social media may not be a brand-new trend, its impact on the hospitality sector continues to gain momentum with each passing year. S o c i a l m e d i a platforms such as Facebook, Twitter, LinkedIn, Instagram, Pinterest, Google+, Zomato, Tripadvisor, etc. are increasingly influencing the decisions that today's consumers are inclined to take. Not surprisingly therefore, most hotel companies are spending time, money and effort in engaging with their target audience and are keeping them abreast of current happenings via these media.
Use of social media to promote Room, F&B and Spa experiences is a rising trend and is expected to grow in the future. While benchmarking a hotel or restaurant's popularity and success may not be entirely possible simply by correlating it to its Tripadvisor ratings just yet, one cannot deny the fact that a vast majority of guests – corporate and leisure alike – do conduct online research before making their hotel
Future Trends & Opportunities
A notable observation is the r e s u r g e n c e o f d e m a n d amongst the South hotels that witnessed an increase in occupancy by approximately 7% over the previous year.
Mumbai
Social media tools are providing operators a greater and faster out-reach, thereby enabling them to connect with their audience in real-time.
2014 HOTELS IN INDIA TRENDS & OPPORTUNITIES | PAGE 17
ultimately allowing the nation's economy to work towards a trade surplus. Clearly this can significantly contribute to the growth and success of the Hotel sector.
Technology – Critical to the nation's growth, technology and its export will continue to play a key role in the economic future of India.
The hotel sector, too, is largely dependent on technology for its success. From in-room iPads and docking stations to state-of-the-art Point of Sale systems that allow hotel operators to track consumer likes, dislikes and spend behaviors, today's hotels are increasingly using technology in their daily operations. Making guest experiences more memorable with technology as an aid is a trend that will only grow with time.
A Potential Threat
While the new government has indeed chosen to pay attention to tourism and we find this to be a promising sign for our sector, it is also a little worrisome when “political adventurism” sometimes takes precedence over “common sense”. The recent talk about prohibition in Kerala or a Goa minister's unnecessary comments about a proposed ban on swimwear are more political gimmicks than real issues at hand. The government of the day would be well advised to move beyond such posturing and hopefully concentrate on issues such as safety of the female traveller so that we may truly see Indian Hospitality flourish.
In Conclusion
To summarise, the decisive outcome of the 2014 elections is expected to improve investor confidence in the country. India's strong economic fundamentals coupled with a stable political situation will help revive growth in the medium–to-long term. The Indian Hospitality sector is very likely on the cusp of a much awaited growth trajectory and we end this year's publication on a note of hope and optimism.
Taj in Bengaluru, The Fairmont and the Marriott in Jaipur are a few examples that have contributed to the creation and/or growth of MICE demand across these cities. Mumbai has two large facilities opening shortly at the JW Marriott and Sahara Star located at the two terminals of the airport. India can now aspire to present itself as an interesting MICE destination to consumers from across the world.
The Prime Minister's Five Ts
To build “Brand India”, the newly appointed Prime Minister laid out his Five Ts – Tradition, Talent, Tourism, Trade and Technology – as the watchwords for India's future. We are of the view that all these pillars have a direct correlation with the future of India's hospitality sector.
Tradition – Indian hospitality has long been revered for its deep-rooted philosophy of
serving with humility and grace. Indeed, hospitality is tradition in India. As the sector grows in size and scale, staying true to our age-old tradition of “Atithi Devo Bhava” could prove to be one of the differentiators
that separate the successful from the not-so-successful hotels of tomorrow.
Talent – Perhaps the single largest challenge that the Indian Hospitality sector faces today is the lack of trained, experienced and motivated talent. The talent that does exist gets poached and stolen by better-paying alternatives. The sector will have to take serious and immediate steps towards training, growing and retaining a talent pool if it intends to continue delivering quality service to the guests of tomorrow. In fact, recognising the urgent need for training, HVS India has recently launched HVS Professional Skills Development, a business divison that aims to provide superior Learning and Development solutions across the hospitality industry.
Tourism – No ruling government in the history of India has put Tourism on their main agenda. With the new government acknowledging India's largely untapped
potential as a major tourist destination, we foresee a new ray of hope for the hospitality sector. C o u p l e d w i t h t h e E TA ,the government has also identified close to 50 tourist circuits that include medical, wellness, religious, beach and
archeological tourism. Tourism is being taken seriously and that in itself is an opportunity for growth!
Trade – Promoting India as an investment destination is an important part of the new government's agenda. Raising the FDI bar across various industries is a welcome step forward. Encouraging growth in the manufacturing sector with his recent “Make in India” slogan, the ModiGovernment's plans are targeted at
stay and/or F&B spend decisions. These tools are providing operators a greater and faster out-reach, thereby enabling them to connect with their audience in real-time. The ability of such platforms to assist hotel owners and operators today – if utilised correctly – is immense.
REITs
The first draft guidelines of Real Estate Investment Trusts (REITs) for India were released in 2008. After years of non-action by the state and central authorities, REITs were formally approved, and that too in this year's budget. REITs have been on the wish-list of the Indian real estate industry for long and are expected to add vibrancy to the sector with a prospective increase in institutional investors and retail buyers. Furthermore, they are likely to bring in globally-accepted practices to real estate funding and revive the interest of both global and domestic investors in the sector.
Addit ional ly, REITs wi l l provide an alternate source of funding to hotels, which could earlier only look for banks and financial institutions for investments: with the introduction of REITs, funding of new projects and expansions will be made more accessible. We view this as an interesting opportunity for hotel developers of today and tomorrow.
Electronic Travel Authorisation
Electronic Travel Authorisation (ETA), a facility to issue visa on arrival for tourists from 180 countries, is likely to be introduced later this year. The Union government plans to roll out ETA across nine airports: Delhi, Mumbai, Kolkata, Chennai, Hyderabad, Bangalore, Kochi, Thiruvananthapuram and Goa. Presently, India gets less than seven million foreign tourists a year.
We believe the ETA facility will help boost commercial, leisure and MICE tourism across the country. While this presents a strong opportunity for growth in Foreign Tourist Arrivals, this alone may not suffice and larger issues such as safety & security, hygiene & cleanliness, infrastructure d eve l o p m e n t a n d e f fe c t ive marketing of India as a destination would need to contribute equally in enticing the prospective inbound tourist.
MICE
We continue to believe that there are significant opportunities in the MICE segment across various hotel positioning. With the announcement of a world-class convention facility to be developed in Goa in the recent union budget, we believe this to be a starting point for other destinations to follow suit.
JW Marriott Aerocity and Kempinski Ambience in Delhi, ITC Grand Chola in Chennai, Sheraton Brigade and Vivanta by
REITs have been on the wish-list of the Indian real estate industry for long and are expected to add vibrancy to the sector with a prospective increase in institutional investors and retail buyers.
We believe the ETA facility will help boost commercial, leisure and MICE tourism across the country.
Holiday Inn Amritsar
With HVS by your side, you achieve success for your
Achin Khanna, MRICS Managing Director - Consulting & Valuation, HVS South Asia [email protected]
Natwar Nagar Managing Director - Executive Search, HVS India [email protected]
Mansi Bhatnagar Managing Director - Marketing Communication, HVS India [email protected]
Monisha Dewan Managing Director - Professional Skills Development, HVS India [email protected]
HVS.com
TH11 HOTEL INVESTMENT CONFERENCE - SOUTH ASIA (HICSA) 2015
JW MARRIOTT AEROCITY NEW DELHI
7-8 April, 2015
BLOCK YOUR DATES
Hosted by
For participation, please write to [email protected] OR log on to www.hicsaconference.com
PLATINUM PARTNERS
PATRONS
GOLD PARTNERS
SUPPORTED BY
Arjun Sharma, Managing Director, Le Passage to India
Arne Sorenson, President & CEO, Marriott International
Kapil Chopra, President, The Oberoi Group
Louie Schwartzberg, Founder, Moving Art
Mark Hoplamazian*, President & CEO, Hyatt Hotels Corporation
Michael Evans, Chief Operating Officer, MGM Hakkasan Hospitality
Priya Paul, Chairperson, The Park Hotels
Steve Rushmore, Founder & President, HVS Global Hospitality Services
* TBA
HOTEL OPERATIONS SUMMIT INDIA 2015
BLOCK YOUR DATES
For registration visit: www.hosiconference.com or email: [email protected]
Hosted by
6TH APRIL, NEW DELHI
Generalmanager’S
IN FOCUS
THE golf challenge
th5 April
Trends in Numbers - “Acche din aayege”Thinking Like an Asset ManagerHow to Get Them to Sleep with YouHot Seat for GM’sUnderstanding Sales: Paradigm Shift in Hospitality
Agenda
HVS.com HVS 6 Floor, Building 8-C, DLF Cyber City, Phase - II, Gurgaon 122 002, INDIAth
About HVSHVS
www.hvs.com
is the world's leading consulting and services organisation focused on the hotel,
restaurant, shared ownership, gaming, and leisure industries. Established in 1980,
the company performs more than 2,500 assignments per year for virtually every
major industry participant. HVS principals are regarded as the leading professionals
in their respective regions of the globe. Through a worldwide network of 34 offices
staffed by 450 seasoned industry professionals, HVS provides an unparalleled range
of complementary services for the hospitality industry. For further information
regarding our expertise and specifics about our services, please visit .
About Consulting and Valuation Over the last decade, we have established ourselves as market leaders and the scope
of our professional services has expanded to include a wide range of consulting
activities, all geared to enhance economic returns and asset value for our clients.
The Consulting and Valuation team comprises of highly experienced industry
professionals offering the utmost level of expertise and credibility. Our consultants
understand the hotel business and have received qualifications from leading
hospitality schools across the world, while also possessing actual hotel operating
experience.
OUR SERVICES
As part of our Consulting and Valuation services, we offer the following:
??Feasibility Studies and Return-on-Investment Analyses?Development Strategy Recommendations?Valuations (Single Asset and Portfolio)?Market Entry Strategy Studies?Land Bid Evaluations and Residual Land Valuations?Investment and Transaction Advisory Services (Buy and Sell Side)?Operator Search and Management Contract Negotiations?Operating Budget Reviews
Market Studies
A c h i n K h a n n a i s t h e M a n a g i n g D i r e c t o r o f Consulting & Valuation at HVS South Asia. He is a M e m b e r o f t h e R o y a l Institution of Chartered Surveyors (MRICS). Over the
past seven years at HVS, Achin has directed a large number of assignments, performed economic feasibility analyses and large scale portfolio valuations, successfully conducted operator searches and management contract negotiations. He has extensive experience in conducting hotel v a l u a t i o n s , b o t h i n I n d i a a n d internationally. His clients include public and private sector banks, private equity firms, real estate developers, hotel companies and state agencies. Prior to joining HVS, Achin spent ten years in the United States working across various roles in hotel operations, revenue management, f ra n c h i s e re l a t i o n s a n d b u s i n e s s development. Achin holds a Bachelor of Science in Hospitality Management from Widener University, Chester, PA and a MBA from The University of Phoenix, Arizona, USA.
About the Authors
Karan Sahani is an Associate – Consulting & Valuation with HVS South Asia’s head office in New Delhi and has worked on mult iple feasibi l i ty studies, market studies and valuations in India and
internationally. Prior to his tenure with HVS, he was associated with the Taj Group and has worked in the corporate sales and marketing and revenue management streams. Karan holds a Bachelor of Arts (Hons.) in Hospitality Management from the Institute of Hotel Management, Aurangabad (University of Huddersfield, UK) in addition to multiple specialised certifications in Hospitality Marketing and Revenue Management from Harvard Business School and Cornell University.
Notable contributions were made by Shamsher Singh Mann, Anirudh Katre, Pooja Goel, Yashaas Rajan Arora and Rishabh Thapar of the Consulting and Valuation team. Editing support was provided by Deepika Thadani and overall guidance and direction was offered by Manav Thadani.
Superior results through unrivalled hospitality intelligence.Everywhere.