177
ANNUAL REPORT 2014 ingenuity at work
ANNUAL REPORT 2014
ingenuity at work
REGISTERED OFFICE
Interserve Plc Interserve House Ruscombe Park Twyford
Reading Berkshire RG10 9JU
T. +44 (0)118 932 0123 F. +44 (0)118 932 0206
www.interserve.com
Interserve Plc A
NN
UA
L REPO
RT 2014
INTERSERVE ANNUAL REPORT 2014 OVERVIEW 2014 IN SUMMARY
CONTENTS
FINANCIAL STATEMENTSINDEPENDENT AUDITORS’ REPORT 103
CONSOLIDATED FINANCIAL STATEMENTS 108
NOTES TO THE CONSOLIDATED FINANCIAL STATEMENTS
114
COMPANY FINANCIAL STATEMENTS 153
NOTES TO THE COMPANY FINANCIAL STATEMENTS
154
PRINCIPAL GROUP UNDERTAKINGS 161
FIVE-YEAR ANALYSIS 166
SHAREHOLDER INFORMATION 168
GOVERNANCEDIRECTORS 48
ADVISERS 51
DIRECTORS’ REPORT 52
CORPORATE GOVERNANCE 60
AUDIT COMMITTEE REPORT 68
DIRECTORS’ REMUNERATION REPORT 74
DIRECTORS’ RESPONSIBILITY STATEMENT 102
STRATEGIC REPORTOUR STRATEGY 04
OPERATIONS AT A GLANCE 06
OUR BUSINESS MODEL 08
OUR MODEL IN ACTION 10
WHERE WE OPERATE 12
PROTECTING OUR BUSINESS 14
PERFORMANCE 18
OPERATIONAL REVIEW 20
PRINCIPAL RISKS AND UNCERTAINTIES 30
SUSTAINABILITY REVIEW 32
FINANCIAL REVIEW 42
OVERVIEW HIGHLIGHTS 01
DELIVERING SHAREHOLDER VALUE 01
CHAIRMAN’S STATEMENT 02
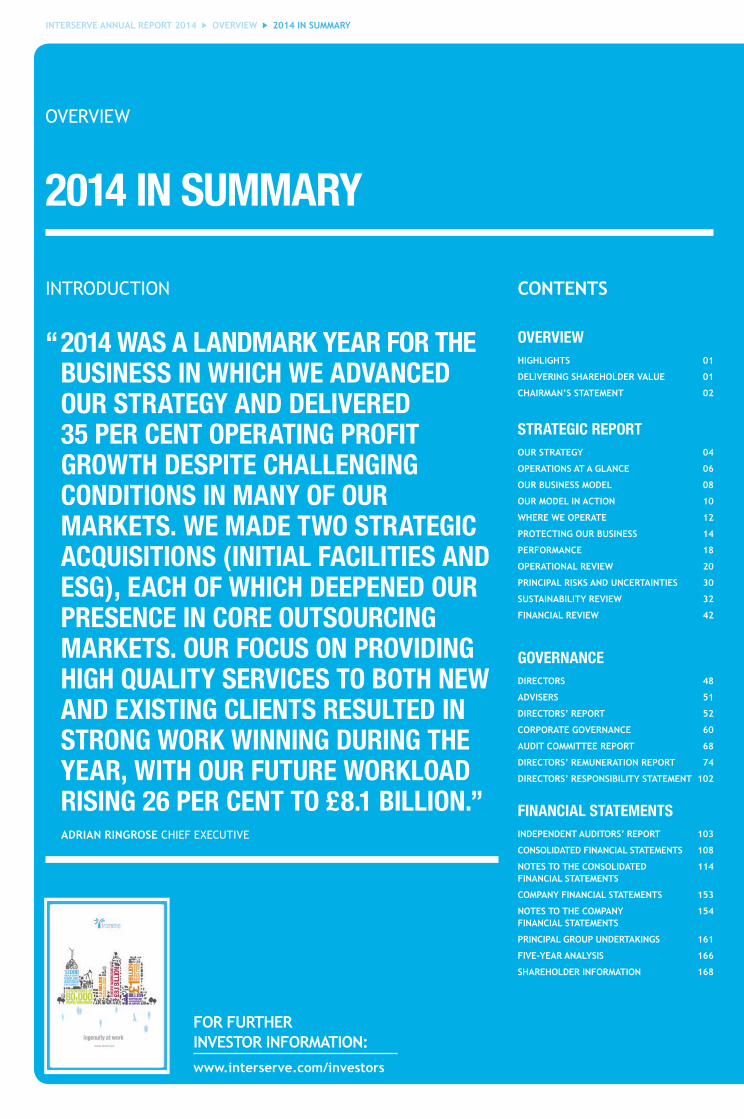
“ 2014 WAS A LANDMARK YEAR FOR THE BUSINESS IN WHICH WE ADVANCED OUR STRATEGY AND DELIVERED 35 PER CENT OPERATING PROFIT GROWTH DESPITE CHALLENGING CONDITIONS IN MANY OF OUR MARKETS. WE MADE TWO STRATEGIC ACQUISITIONS (INITIAL FACILITIES AND ESG), EACH OF WHICH DEEPENED OUR PRESENCE IN CORE OUTSOURCING MARKETS. OUR FOCUS ON PROVIDING HIGH QUALITY SERVICES TO BOTH NEW AND EXISTING CLIENTS RESULTED IN STRONG WORK WINNING DURING THE YEAR, WITH OUR FUTURE WORKLOAD RISING 26 PER CENT TO £8.1 BILLION.”
INTRODUCTION
ADRIAN RINGROSE CHIEF EXECUTIVE
FOR FURTHER INVESTOR INFORMATION: www.interserve.com/investors
2014 IN SUMMARY
OVERVIEW
10339 INT – AR14 0 Cover AW01 tp.indd 1 19/03/2015 16:31
ANNUAL REPORT 2014
ingenuity at work
REGISTERED OFFICE
Interserve Plc Interserve House Ruscombe Park Twyford
Reading Berkshire RG10 9JU
T. +44 (0)118 932 0123 F. +44 (0)118 932 0206
www.interserve.com
Interserve Plc A
NN
UA
L REPO
RT 2014
INTERSERVE ANNUAL REPORT 2014 OVERVIEW 2014 IN SUMMARY
CONTENTS
FINANCIAL STATEMENTSINDEPENDENT AUDITORS’ REPORT 103
CONSOLIDATED FINANCIAL STATEMENTS 108
NOTES TO THE CONSOLIDATED FINANCIAL STATEMENTS
114
COMPANY FINANCIAL STATEMENTS 153
NOTES TO THE COMPANY FINANCIAL STATEMENTS
154
PRINCIPAL GROUP UNDERTAKINGS 161
FIVE-YEAR ANALYSIS 166
SHAREHOLDER INFORMATION 168
GOVERNANCEDIRECTORS 48
ADVISERS 51
DIRECTORS’ REPORT 52
CORPORATE GOVERNANCE 60
AUDIT COMMITTEE REPORT 68
DIRECTORS’ REMUNERATION REPORT 74
DIRECTORS’ RESPONSIBILITY STATEMENT 102
STRATEGIC REPORTOUR STRATEGY 04
OPERATIONS AT A GLANCE 06
OUR BUSINESS MODEL 08
OUR MODEL IN ACTION 10
WHERE WE OPERATE 12
PROTECTING OUR BUSINESS 14
PERFORMANCE 18
OPERATIONAL REVIEW 20
PRINCIPAL RISKS AND UNCERTAINTIES 30
SUSTAINABILITY REVIEW 32
FINANCIAL REVIEW 42
OVERVIEW HIGHLIGHTS 01
DELIVERING SHAREHOLDER VALUE 01
CHAIRMAN’S STATEMENT 02
“ 2014 WAS A LANDMARK YEAR FOR THE BUSINESS IN WHICH WE ADVANCED OUR STRATEGY AND DELIVERED 35 PER CENT OPERATING PROFIT GROWTH DESPITE CHALLENGING CONDITIONS IN MANY OF OUR MARKETS. WE MADE TWO STRATEGIC ACQUISITIONS (INITIAL FACILITIES AND ESG), EACH OF WHICH DEEPENED OUR PRESENCE IN CORE OUTSOURCING MARKETS. OUR FOCUS ON PROVIDING HIGH QUALITY SERVICES TO BOTH NEW AND EXISTING CLIENTS RESULTED IN STRONG WORK WINNING DURING THE YEAR, WITH OUR FUTURE WORKLOAD RISING 26 PER CENT TO £8.1 BILLION.”
INTRODUCTION
ADRIAN RINGROSE CHIEF EXECUTIVE
FOR FURTHER INVESTOR INFORMATION: www.interserve.com/investors
2014 IN SUMMARY
OVERVIEW
10339 INT – AR14 0 Cover AW01 tp.indd 1 19/03/2015 16:31

Achieve sustainable growth
Create places that benefit peopleO
UTC
OM
ES
Build more skills and more opportunities
Deliver public service in the public interest
Generate a positive environmental impact
REC
ENT
WO
RK
HO
W W
E D
O IT
READ THE STORY ON PAGE READ THE STORY ON PAGE READ THE STORY ON PAGE READ THE STORY ON PAGE READ THE STORY ON PAGE34
04 06 08 10
26 22 25 29
OU
R VA
LUES
OU
R V
ISIO
N
DELIVERING SHAREHOLDER VALUE
SOCIAL VALUE MAPPING DLR CONTRACT ADDS TO TRANSPORT SECTOR GROWTH
BUILDING QATAR’S BIGGEST MALL AT DOHA FESTIVAL CITY
PARAGON FITS OUT MARKEL’S ‘WALKIE TALKIE’ LONDON OFFICE
BUILDING ADVANCED MEDICAL AND TESTING FACILITIES
OUR BUSINESS MODEL
READ MORE ON PAGE
OPERATIONS AT A GLANCE
READ MORE ON PAGE
OUR MODEL IN ACTION
READ MORE ON PAGE
PROTECTING OUR BUSINESS
READ MORE ON PAGE
WHERE WE OPERATE
READ MORE ON PAGE
OUR STRATEGY
READ MORE ON PAGE
• TAKE PRIDE IN WHAT YOU DO • EVERYONE HAS A VOICE • DO THE RIGHT THING• BRING BETTER TO LIFE
TO REDEFINE THE FUTURE FOR PEOPLE AND PLACES
INTERSERVE ANNUAL REPORT 2014 OVERVIEW DELIVERING SHAREHOLDER VALUE
12 14
COMMUNITY CENTRE
This Annual Report was printed in the UK by CPI Colour Limited, using vegetable based inks. The printer and paper mill are accredited with ISO 14001 Environmental management Systems and are Forest Stewardship Council chain-of-custody registered. ®
The paper is 100% recycled, produced from de-inked post consumer waste. The silk laminate used on the outer cover is bio-degradable. www.accruefulton.com
Designed and produced by
10339 INT – AR14 0 Cover AW01 tp.indd 2 20/03/2015 13:41

INTERSERVE ANNUAL REPORT 2014 OVERVIEW HIGHLIGHTS 01
HIGHLIGHTS
*�This�Annual�Report�includes�a�number�of�non-statutory�measures�to�reflect�the�impact�of�non-trading�and�non-recurring�items.�See�note�33�to�the�consolidated�financial�statements�for�a�reconciliation�of�these�measures�to�their�statutory�equivalents and note 11 for calculation of earnings per share.
FULL-YEAR DIVIDEND
23.0p +7%HEADLINE TOTAL OPERATING PROFIT*
£117.2m +35%
HEADLINE PRE-TAX PROFIT*
£106.2m +31%
HEADLINE EARNINGS PER SHARE*
58.8p +23%
REVENUE
£2,913.0m +33%PROFIT BEFORE TAX
£61.9m -9%
Revenue growth of 33 per cent (organic growth of 10 per cent)
Total�operating�profit�growth�of�35�per�cent� (organic growth of 9 per cent)
Headline earnings per share growth of 23 per cent (organic growth of 14 per cent)
Full-year dividend: Recommended increase of 7 per cent to 23.0p
£4.1 billion of new business won in 2014
Record future workload of £8.1 billion, up 26 per cent
OVERVIEW
GO
VERNA
NCE
STRATEGIC REPO
RT FIN
AN
CIAL STATEM
ENTS
02 INTERSERVE ANNUAL REPORT 2014 OVERVIEW
OVERVIEW
CHAIRMAN’S STATEMENT
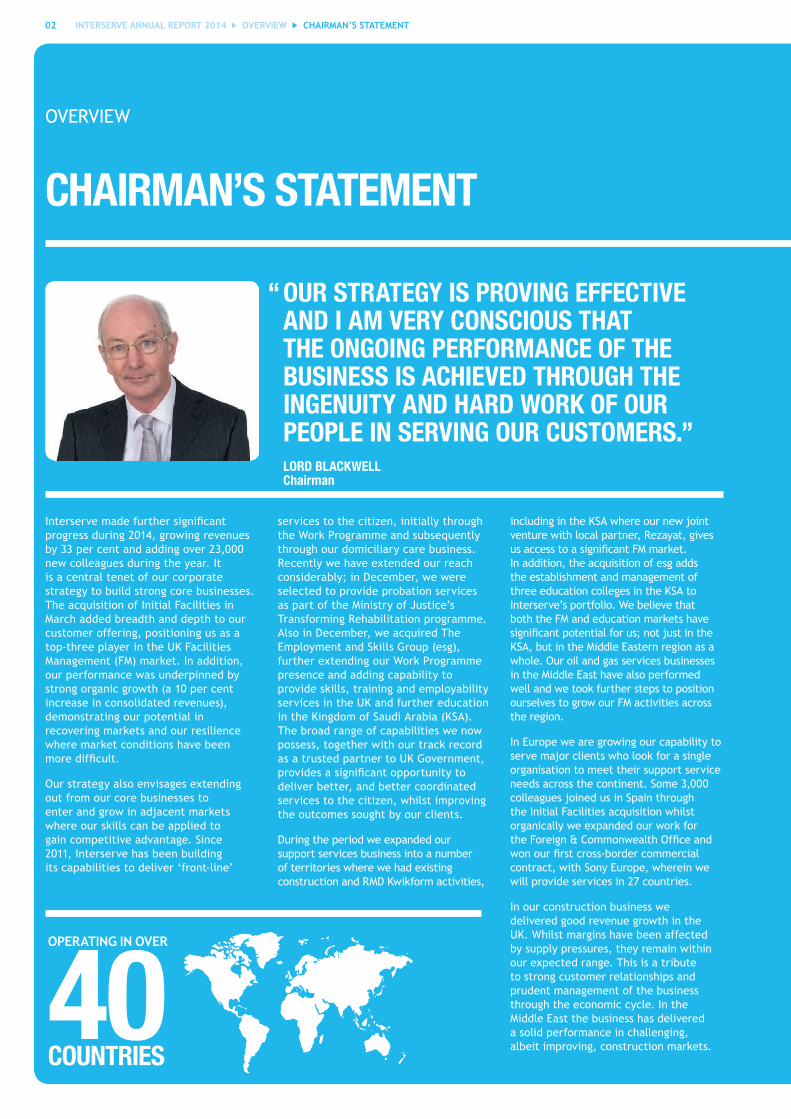
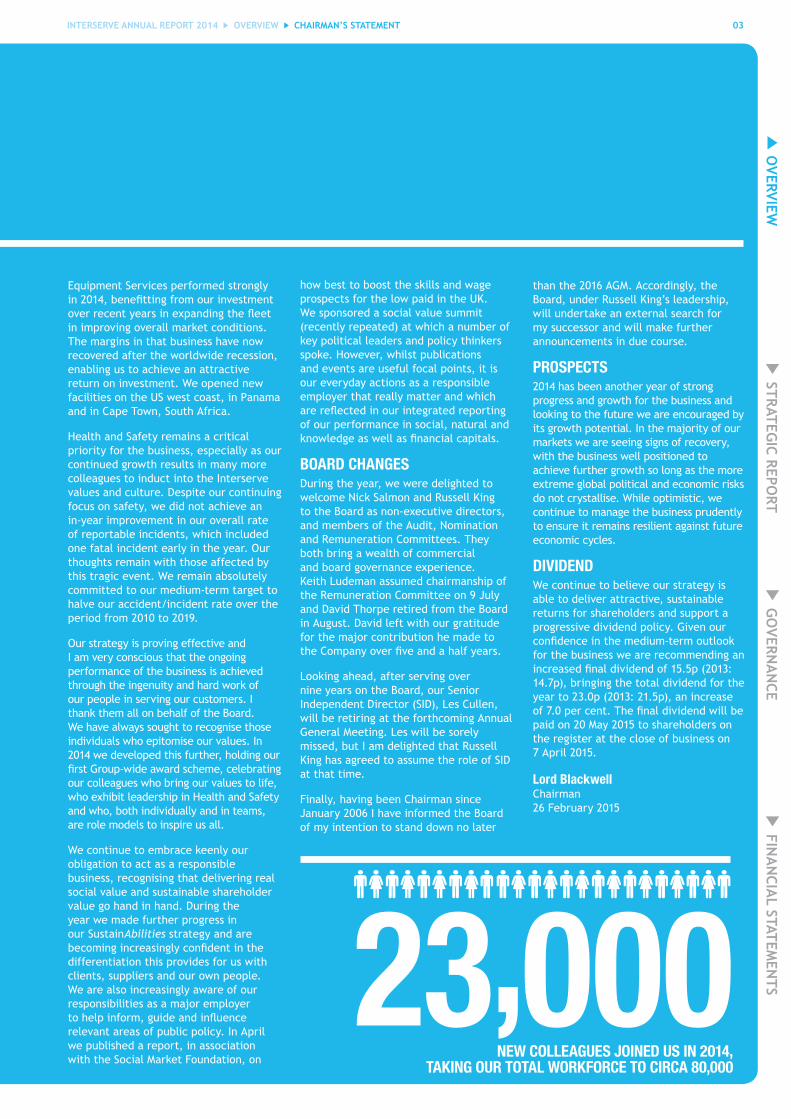
Interserve�made�further�significant�progress during 2014, growing revenues by 33 per cent and adding over 23,000 new colleagues during the year. It is a central tenet of our corporate strategy to build strong core businesses. The acquisition of Initial Facilities in March added breadth and depth to our customer offering, positioning us as a top-three player in the UK Facilities Management (FM) market. In addition, our performance was underpinned by strong organic growth (a 10 per cent increase in consolidated revenues), demonstrating our potential in recovering markets and our resilience where market conditions have been more�difficult.
Our strategy also envisages extending out from our core businesses to enter and grow in adjacent markets where our skills can be applied to gain competitive advantage. Since 2011, Interserve has been building its capabilities to deliver ‘front-line’
“ OUR STRATEGY IS PROVING EFFECTIVE AND I AM VERY CONSCIOUS THAT THE ONGOING PERFORMANCE OF THE BUSINESS IS ACHIEVED THROUGH THE INGENUITY AND HARD WORK OF OUR PEOPLE IN SERVING OUR CUSTOMERS.”
LORD BLACKWELL Chairman
services to the citizen, initially through the Work Programme and subsequently through our domiciliary care business. Recently we have extended our reach considerably; in December, we were selected to provide probation services as part of the Ministry of Justice’s Transforming Rehabilitation programme. Also in December, we acquired The Employment and Skills Group (esg), further extending our Work Programme presence and adding capability to provide skills, training and employability services in the UK and further education in the Kingdom of Saudi Arabia (KSA). The broad range of capabilities we now possess, together with our track record as a trusted partner to UK Government, provides�a�significant�opportunity�to�deliver better, and better coordinated services to the citizen, whilst improving the outcomes sought by our clients.
During the period we expanded our support services business into a number of territories where we had existing construction and RMD Kwikform activities,
including in the KSA where our new joint venture with local partner, Rezayat, gives us�access�to�a�significant�FM�market.�In addition, the acquisition of esg adds the establishment and management of three education colleges in the KSA to Interserve’s portfolio. We believe that both the FM and education markets have significant�potential�for�us;�not�just�in�the�KSA, but in the Middle Eastern region as a whole. Our oil and gas services businesses in the Middle East have also performed well and we took further steps to position ourselves to grow our FM activities across the region.
In Europe we are growing our capability to serve major clients who look for a single organisation to meet their support service needs across the continent. Some 3,000 colleagues joined us in Spain through the Initial Facilities acquisition whilst organically we expanded our work for the�Foreign�&�Commonwealth�Office�and�won�our�first�cross-border�commercial�contract, with Sony Europe, wherein we will provide services in 27 countries.
In our construction business we delivered good revenue growth in the UK. Whilst margins have been affected by supply pressures, they remain within our expected range. This is a tribute to strong customer relationships and prudent management of the business through the economic cycle. In the Middle East the business has delivered a solid performance in challenging, albeit improving, construction markets. COUNTRIES
40OPERATING IN OVER
CHAIRMAN’S STATEMENT
INTERSERVE ANNUAL REPORT 2014 OVERVIEW 03
Equipment Services performed strongly in�2014,�benefitting�from�our�investment�over�recent�years�in�expanding�the�fleet�in improving overall market conditions. The margins in that business have now recovered after the worldwide recession, enabling us to achieve an attractive return on investment. We opened new facilities on the US west coast, in Panama and in Cape Town, South Africa.
Health and Safety remains a critical priority for the business, especially as our continued growth results in many more colleagues to induct into the Interserve values and culture. Despite our continuing focus on safety, we did not achieve an in-year improvement in our overall rate of reportable incidents, which included one fatal incident early in the year. Our thoughts remain with those affected by this tragic event. We remain absolutely committed to our medium-term target to halve our accident/incident rate over the period from 2010 to 2019.
Our strategy is proving effective and I am very conscious that the ongoing performance of the business is achieved through the ingenuity and hard work of our people in serving our customers. I thank them all on behalf of the Board. We have always sought to recognise those individuals who epitomise our values. In 2014 we developed this further, holding our first�Group-wide�award�scheme,�celebrating�our colleagues who bring our values to life, who exhibit leadership in Health and Safety and who, both individually and in teams, are role models to inspire us all.
We continue to embrace keenly our obligation to act as a responsible business, recognising that delivering real social value and sustainable shareholder value go hand in hand. During the year we made further progress in our SustainAbilities strategy and are becoming�increasingly�confident�in�the�differentiation this provides for us with clients, suppliers and our own people. We are also increasingly aware of our responsibilities as a major employer to�help�inform,�guide�and�influence�relevant areas of public policy. In April we published a report, in association with the Social Market Foundation, on
how best to boost the skills and wage prospects for the low paid in the UK. We sponsored a social value summit (recently repeated) at which a number of key political leaders and policy thinkers spoke. However, whilst publications and events are useful focal points, it is our everyday actions as a responsible employer that really matter and which are�reflected�in�our�integrated�reporting�of our performance in social, natural and knowledge�as�well�as�financial�capitals.
BOARD CHANGESDuring the year, we were delighted to welcome Nick Salmon and Russell King to the Board as non-executive directors, and members of the Audit, Nomination and Remuneration Committees. They both bring a wealth of commercial and board governance experience. Keith Ludeman assumed chairmanship of the Remuneration Committee on 9 July and David Thorpe retired from the Board in August. David left with our gratitude for the major contribution he made to the�Company�over�five�and�a�half�years.�
Looking ahead, after serving over nine years on the Board, our Senior Independent Director (SID), Les Cullen, will be retiring at the forthcoming Annual General Meeting. Les will be sorely missed, but I am delighted that Russell King has agreed to assume the role of SID at that time.
Finally, having been Chairman since January 2006 I have informed the Board of my intention to stand down no later
than the 2016 AGM. Accordingly, the Board, under Russell King’s leadership, will undertake an external search for my successor and will make further announcements in due course.
PROSPECTS2014 has been another year of strong progress and growth for the business and looking to the future we are encouraged by its growth potential. In the majority of our markets we are seeing signs of recovery, with the business well positioned to achieve further growth so long as the more extreme global political and economic risks do not crystallise. While optimistic, we continue to manage the business prudently to ensure it remains resilient against future economic cycles.
DIVIDENDWe continue to believe our strategy is able to deliver attractive, sustainable returns for shareholders and support a progressive dividend policy. Given our confidence�in�the�medium-term�outlook�for the business we are recommending an increased�final�dividend�of�15.5p�(2013:�14.7p), bringing the total dividend for the year�to�23.0p�(2013:�21.5p),�an�increase�of�7.0�per�cent.�The�final�dividend�will�be�paid�on�20�May�2015�to�shareholders�on�the register at the close of business on 7�April�2015.
Lord BlackwellChairman 26�February�2015
CHAIRMAN’S STATEMENT
NEW COLLEAGUES JOINED US IN 2014, TAKING OUR TOTAL WORKFORCE TO CIRCA 80,000
23,000
OVERVIEW
GO
VERNA
NCE
STRATEGIC REPO
RT FIN
AN
CIAL STATEM
ENTS

04 INTERSERVE ANNUAL REPORT 2014 STRATEGIC REPORT OUR STRATEGY
OUR STRATEGY
STRATEGIC REPORT
STRATEGY
• Focus on long-term, added-value client relationships
• Understand client dynamics in depth
• Advise, manage and deliver outsourced services
• Framework agreements
• Public-private partnerships
• Capture emerging opportunities for increasingly integrated solutions
• Organic growth supplemented by selective accretive acquisitions
• Growth with market expansion, displacement and client relationship management
• Extend our full range of services across existing markets
• Enter new growth markets with attractive fundamentals
• Operate in a range of markets to diversify and reduce risk
BUILD STRONG CORE BUSINESSES
CAPTURE RELATED EXPANSION OPPORTUNITIES
EXPAND INTERNATIONALLY

INTERSERVE ANNUAL REPORT 2014 STRATEGIC REPORT 05OUR STRATEGY
Create places that benefit people
Delivering places and services that enhance people’s lives, that can be valued, that contribute to individuals’ wellbeing and that are designed and built for the future.
Deliver public service in the public interest
Setting ourselves apart by delivering services that benefit people and demonstrating the value our employees offer society.
Build more skills and more opportunities
Building the skills of employees and stakeholders by sharing know-how, providing opportunities for self-improvement and making a positive and productive contribution to society.
Generate a positive environmental impact
Moving beyond compliance towards making a positive and restorative contribution to the environment through every project.
Achieve sustainable growth
Building a profitable business that takes into account the true costs of business and delivers sustained value for all.
• Attractive UK medium-term demand environment
– Structural growth in outsourcing
– Rising population, increasing pressure on ageing infrastructure
–�Drive�for�public-sector�efficiencies
• Demand for increased integration and efficiencies across the asset life cycle
• Consolidation
• Enhancing existing offering or market extension through acquisition
• Evolving boundaries and expanding addressable markets
• Emerging and high-growth markets
• Opportunities arising from recovering economies
• Transferable skills in project and change management
• Leveraging existing relationships
MARKET OUTCOMES – DELIVERING SUSTAINABLE SHAREHOLDER VALUE
OVERVIEW
GO
VERNA
NCE
STRATEGIC REPO
RT FIN
AN
CIAL STATEM
ENTS
06 INTERSERVE ANNUAL REPORT 2014 STRATEGIC REPORT OPERATIONS AT A GLANCE
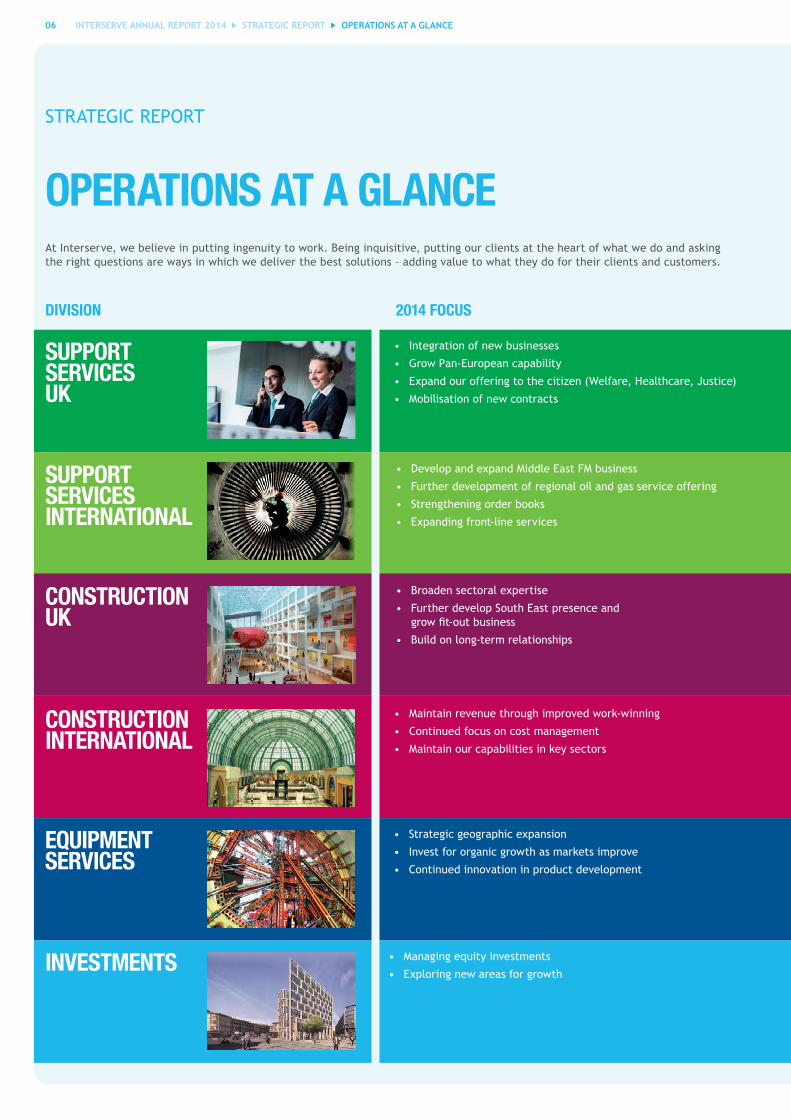
OPERATIONS AT A GLANCE
• Integration of new businesses
• Grow Pan-European capability
• Expand our offering to the citizen (Welfare, Healthcare, Justice)
• Mobilisation of new contracts
• Develop and expand Middle East FM business
• Further development of regional oil and gas service offering
• Strengthening order books
• Expanding front-line services
• Broaden sectoral expertise
• Further develop South East presence and � grow�fit-out�business
• Build on long-term relationships
• Maintain revenue through improved work-winning
• Continued focus on cost management
• Maintain our capabilities in key sectors
• Strategic geographic expansion
• Invest for organic growth as markets improve
• Continued innovation in product development
• Managing equity investments
• Exploring new areas for growth
SUPPORT SERVICES UK
SUPPORT SERVICES INTERNATIONAL
CONSTRUCTION UK
CONSTRUCTION INTERNATIONAL
EQUIPMENT SERVICES
INVESTMENTS
DIVISION 2014 FOCUS
At Interserve, we believe in putting ingenuity to work. Being inquisitive, putting our clients at the heart of what we do and asking the right questions are ways in which we deliver the best solutions – adding value to what they do for their clients and customers.
STRATEGIC REPORT

INTERSERVE ANNUAL REPORT 2014 STRATEGIC REPORT 07OPERATIONS AT A GLANCE
WHERE NEXTHOW WE PERFORMED
• Strong work winning – Ministry of Justice, Sony Europe, Docklands Light Railway and Defence Infrastructure Organisation
• Integration of Initial Facilities and completion of esg acquisition
• Providing wider suite of services to our customers – probation services, training and welfare
• Rebalanced public/private sector mix
• Good organic revenue growth
• Established new partnership with Rezayat to build FM capability in Saudi Arabia
• Improving margins
• Development of oil and gas offering across the Middle East region
• Good revenue growth in a recovering market
• Built on new business areas (e.g. energy from waste) and added new framework agreements
• Maintained margins in target range, despite supply chain pressures in a recovering market
• Order book growth as markets improve, notably in Dubai and Abu Dhabi
• Margins continue to be impacted by competitive pressures
• Opened new sites (California, Colombia and South Africa)
•� Investment�in�new�fleet�facilitating volume growth
• New ground shoring offering in UK
• Further margin development due to strong operational leverage and unit pricing
• Product innovation (3D modelling)
• Continued effective management of project investments
• Bidding on new PF2 opportunities
• New property development opportunities (Co-op building, Newcastle; Torphichen Street, Edinburgh) and progressing the Haymarket development in Edinburgh
• Continued revenue growth in the medium term delivered through:
– Leveraging of enlarged private-sector capabilities
– Building on success of new business streams
•� Margin�development:�stable�at�5%
• Revenue growth delivered by:
– Broader geographic offering
– Developing new service offering
– New partnerships
– Increased investment in business development
•� Margin�progress:�strengthening�towards�7%�to�8%�range
• Build on new sector offering
• Continue volume growth and build on strong work-winning
• Margins expected to remain in target range (1.5%�to�2%)�due�to�continued�supply�chain� cost pressures
• Volume growth in recovering markets (boosted by infrastructure spending for Dubai’s Expo 2020 and the 2022 World Cup in Qatar)
•� �Margin�development:�trend�towards�6%
•� �Demand-led�revenue�growth,�benefitting�from�2014�investment�in�fleet�expansion�
• Further geographic expansion
•� Margin�development:�to�15%�in�the�medium-term
• Accessing more PF2 opportunities
• Strategic business development leadership
• Investment portfolio management for third parties
The�Group’s�future�growth�is�based�on�attractive�demand�drivers�in�our�markets�and�our�financial�strength�to�supplement� organic growth with acquisitions.
OVERVIEW
GO
VERNA
NCE
STRATEGIC REPO
RT FIN
AN
CIAL STATEM
ENTS

08 INTERSERVE ANNUAL REPORT 2014 STRATEGIC REPORT OUR BUSINESS MODEL
OUR BUSINESS MODEL
STRATEGIC REPORT
WHAT WE DOINPUTS
NaturalCapital
• Raw materials
• Water
• Energy
• Land
KnowledgeCapital
• Skills
• Experience
• Talent
• Innovation
• Understanding our customers
SocialCapital
• Employees
• Suppliers
• Customers
• Citizens
• Communities
FinancialCapital
• Share capital
• Borrowings
• Cash generated from operations
SUPPORT SERVICES Facilities management
Front-line services
Estate management
Industrial services
Oil and gas services
EQUIPMENT SERVICESDesign
Engineering
Propping and shoring solutions
CONSTRUCTIONBuilding
Infrastructure
Engineering services
Fit-out
ConsultingSy
stem
s &
Pro
cess
esSu
pply
Cha
in M
anag
emen
tPr
ojec
t Man
agem
ent &
Del
iver
y
The success of our business is dependent on trust, our reputation and delivering great service to our customers. This is what our Business Model is designed to support.
VALUE RE-INVESTED
INTERSERVE ANNUAL REPORT 2014 STRATEGIC REPORT 09OUR BUSINESS MODEL
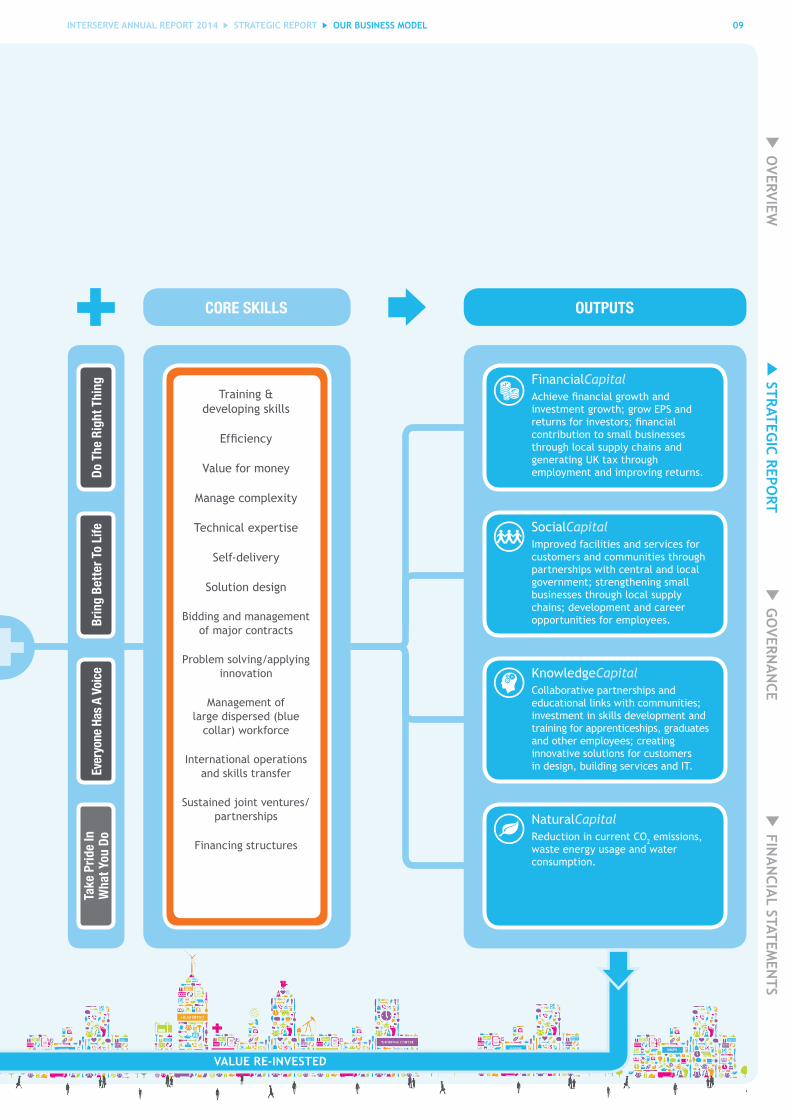
CORE SKILLS OUTPUTS
NaturalCapitalReduction in current CO2 emissions, waste energy usage and water consumption.
KnowledgeCapitalCollaborative partnerships and educational links with communities; investment in skills development and training for apprenticeships, graduates and other employees; creating innovative solutions for customers in design, building services and IT.
SocialCapitalImproved facilities and services for customers and communities through partnerships with central and local government; strengthening small businesses through local supply chains; development and career opportunities for employees.
FinancialCapitalAchieve�financial�growth�and�investment growth; grow EPS and returns�for�investors;�financial�contribution to small businesses through local supply chains and generating UK tax through employment and improving returns.
Training & developing skills
Efficiency
Value for money
Manage complexity
Technical expertise
Self-delivery
Solution design
Bidding and management of major contracts
Problem solving/applying innovation
Management of large dispersed (blue
collar) workforce
International operations and skills transfer
Sustained joint ventures/partnerships
Financing structures
Take
Prid
e In
W
hat Y
ou D
o Ev
eryo
ne H
as A
Voi
ceBr
ing
Bett
er T
o Li
feDo
The
Rig
ht T
hing
VALUE RE-INVESTED
OVERVIEW
GO
VERNA
NCE
STRATEGIC REPO
RT FIN
AN
CIAL STATEM
ENTS
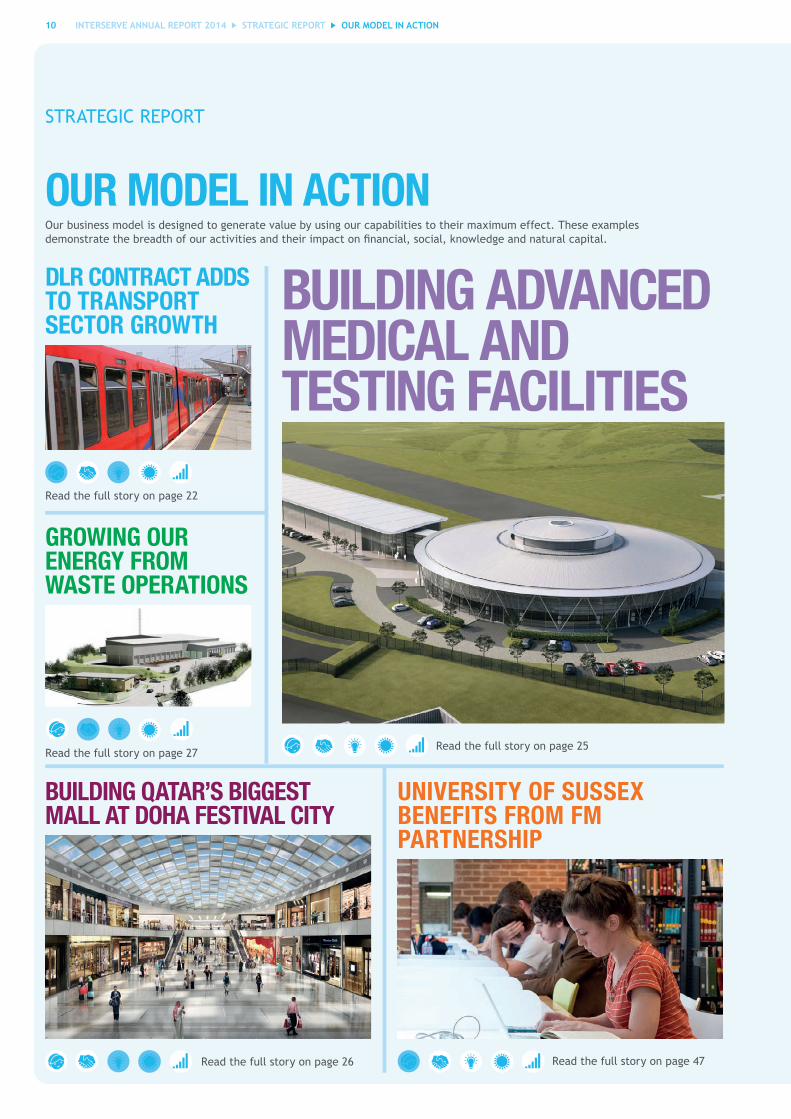
10 INTERSERVE ANNUAL REPORT 2014 STRATEGIC REPORT OUR MODEL IN ACTION
Our business model is designed to generate value by using our capabilities to their maximum effect. These examples demonstrate�the�breadth�of�our�activities�and�their�impact�on�financial,�social,�knowledge�and�natural�capital.
STRATEGIC REPORT
OUR MODEL IN ACTION
DLR CONTRACT ADDS TO TRANSPORT SECTOR GROWTH
BUILDING ADVANCED MEDICAL AND TESTING FACILITIES
Read�the�full�story�on�page�25
BUILDING QATAR’S BIGGEST MALL AT DOHA FESTIVAL CITY
GROWING OUR ENERGY FROM WASTE OPERATIONS
UNIVERSITY OF SUSSEX BENEFITS FROM FM PARTNERSHIP
Read the full story on page 22
Read the full story on page 26
Read the full story on page 27
Read the full story on page 47

INTERSERVE ANNUAL REPORT 2014 STRATEGIC REPORT 11OUR MODEL IN ACTION
Principal outcomes
PARAGON FITS OUT MARKEL’S ‘WALKIE TALKIE’ LONDON OFFICE
SOCIAL VALUE MAPPING
MORE SKILLS, MORE OPPORTUNITIES AT KHANSAHEB TRAINING SCHOOL, DUBAI
BUILDING FOR THE FUTURE
Create places that�benefit�people
Build more skills and more opportunities
Deliver public service in the public interest
Generate a positive environmental impact
Achieve sustainable growth
11
3D MODELLING KEY TO NEW ABU DHABI AIRPORT TERMINAL
Read the full story on page 29
Read the full story on page 36
Read the full story on page 34
Read�the�full�story�on�page�35
Read the full story on page 41
OVERVIEW
GO
VERNA
NCE
STRATEGIC REPO
RT FIN
AN
CIAL STATEM
ENTS
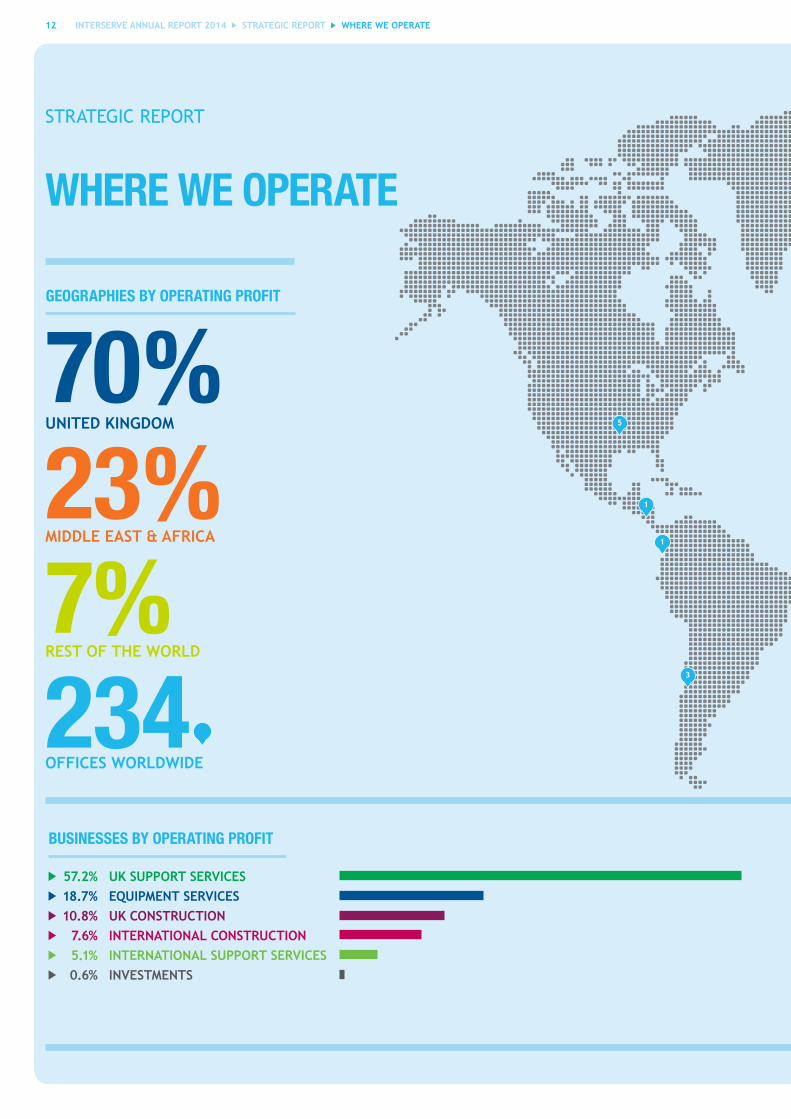
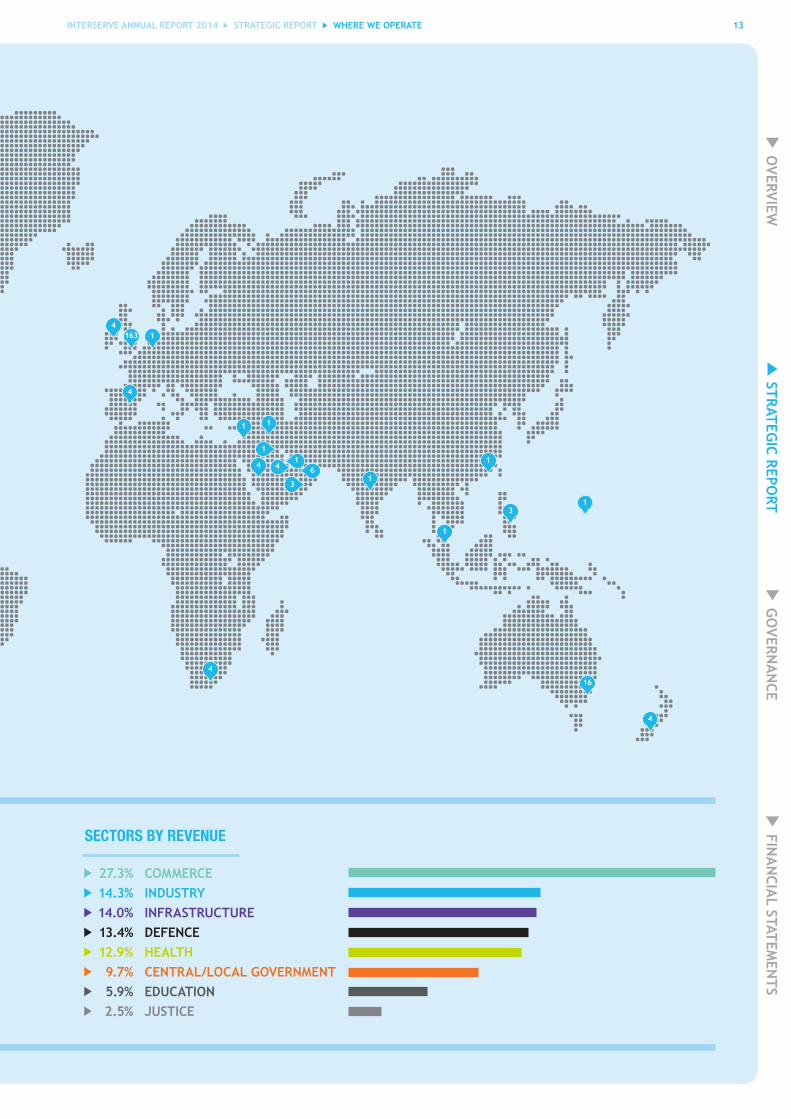
12 INTERSERVE ANNUAL REPORT 2014 STRATEGIC REPORT WHERE WE OPERATE
WHERE WE OPERATE
234
70%UNITED KINGDOM
23%MIDDLE EAST & AFRICA
OFFICES WORLDWIDE
7%REST OF THE WORLD
GEOGRAPHIES BY OPERATING PROFIT
BUSINESSES BY OPERATING PROFIT
57.2% UK SUPPORT SERVICES 18.7% EQUIPMENT SERVICES 10.8% UK CONSTRUCTION 7.6% INTERNATIONAL CONSTRUCTION 5.1% INTERNATIONAL SUPPORT SERVICES 0.6% INVESTMENTS
STRATEGIC REPORT
5
3
1
1
INTERSERVE ANNUAL REPORT 2014 STRATEGIC REPORT 13WHERE WE OPERATE
SECTORS BY REVENUE
27.3% COMMERCE 14.3% INDUSTRY 14.0% INFRASTRUCTURE 13.4% DEFENCE 12.9% HEALTH 9.7% CENTRAL/LOCAL GOVERNMENT 5.9% EDUCATION 2.5% JUSTICE
OVERVIEW
GO
VERNA
NCE
STRATEGIC REPO
RT FIN
AN
CIAL STATEM
ENTS
4
1634
1
3
46
4
3
1
1
1
1
1
1
1
4
4
1
16

14 INTERSERVE ANNUAL REPORT 2014 STRATEGIC REPORT PROTECTING OUR BUSINESS
PROTECTING OUR BUSINESS
STRATEGIC REPORT
This is a summary of the risks facing our business. For greater detail, see Principal Risks and Uncertainties on pages 30 and 31.
We focus on those material issues which enable the Group to sustain growth into the future.
What�is�material�is�defined�as�an�issue�that�would�impact�our�Board�and�committee�decisions,�based�on:
• impact on the business; • the degree to which our primary stakeholders are concerned with it; and •� the�extent�to�which�it�is�likely�to�grow�in�significance�and�impact�in�the�future.
Through�this�process,�14�material�topics�were�identified,�all�of�which�are�key�issues�affecting�the�performance�and�long-term�viability of the Group.
• REPUTATIONAL RISK
• FINANCING STRUCTURE
• HEALTH & SAFETY
• MERGERS & ACQUISITIONS
• COMPETITIVE LANDSCAPE
• STABILITY/REGIME CHANGE/POLICY CHANGE
• PENSION DEFICIT
• IT SYSTEMS/SECURITY
• MOBILISATION OF NEW CONTRACTS
• INVESTMENT LEVELS IN OIL & GAS INDUSTRY
• RATE OF INFRASTRUCTURE DEMAND
• EMPLOYEE SKILLS
• WORKERS’ COST AND AVAILABILITY
• ENVIRONMENTAL RISKS
FinancialCapital SocialCapital KnowledgeCapital NaturalCapital
INTERSERVE ANNUAL REPORT 2014 STRATEGIC REPORT 15PROTECTING OUR BUSINESS
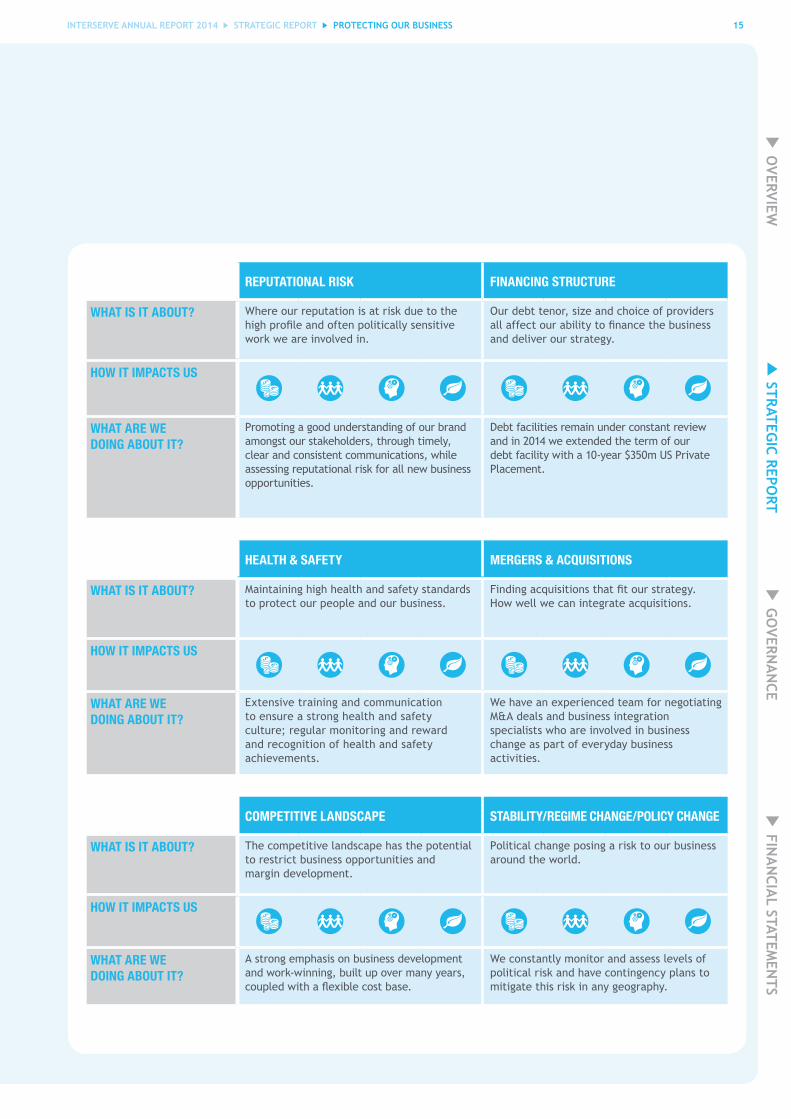
REPUTATIONAL RISK FINANCING STRUCTURE
WHAT IS IT ABOUT? Where our reputation is at risk due to the high�profile�and�often�politically�sensitive�work we are involved in.
Our debt tenor, size and choice of providers all�affect�our�ability�to�finance�the�business�and deliver our strategy.
HOW IT IMPACTS US
WHAT ARE WE DOING ABOUT IT?
Promoting a good understanding of our brand amongst our stakeholders, through timely, clear and consistent communications, while assessing reputational risk for all new business opportunities.
Debt facilities remain under constant review and in 2014 we extended the term of our debt�facility�with�a�10-year�$350m�US�Private�Placement.
HEALTH & SAFETY MERGERS & ACQUISITIONS
WHAT IS IT ABOUT? Maintaining high health and safety standards to protect our people and our business.
Finding�acquisitions�that�fit�our�strategy.� How well we can integrate acquisitions.
HOW IT IMPACTS US
WHAT ARE WE DOING ABOUT IT?
Extensive training and communication to ensure a strong health and safety culture; regular monitoring and reward and recognition of health and safety achievements.
We have an experienced team for negotiating M&A deals and business integration specialists who are involved in business change as part of everyday business activities.
COMPETITIVE LANDSCAPE STABILITY/REGIME CHANGE/POLICY CHANGE
WHAT IS IT ABOUT? The competitive landscape has the potential to restrict business opportunities and margin development.
Political change posing a risk to our business around the world.
HOW IT IMPACTS US
WHAT ARE WE DOING ABOUT IT?
A strong emphasis on business development and work-winning, built up over many years, coupled�with�a�flexible�cost�base.
We constantly monitor and assess levels of political risk and have contingency plans to mitigate this risk in any geography.
OVERVIEW
GO
VERNA
NCE
STRATEGIC REPO
RT FIN
AN
CIAL STATEM
ENTS
16 INTERSERVE ANNUAL REPORT 2014 STRATEGIC REPORT PROTECTING OUR BUSINESS
PROTECTING OUR BUSINESS CONTINUED
STRATEGIC REPORT
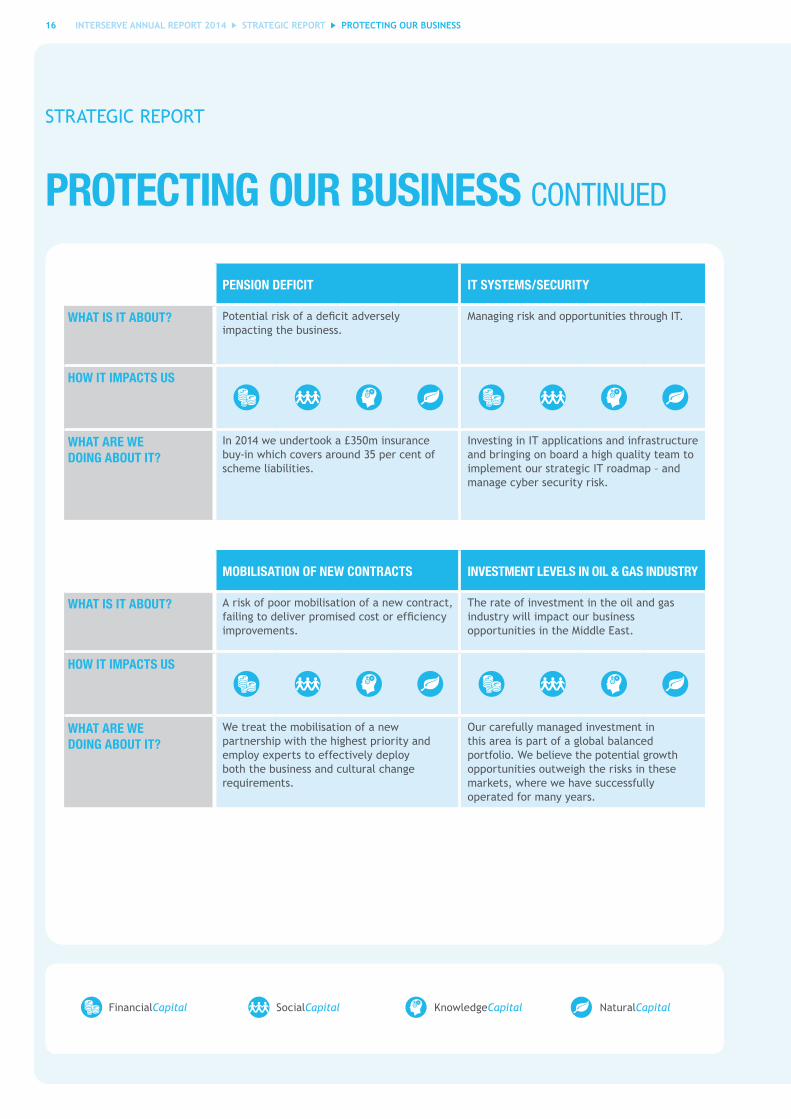
PENSION DEFICIT IT SYSTEMS/SECURITY
WHAT IS IT ABOUT? Potential�risk�of�a�deficit�adversely� impacting the business.
Managing risk and opportunities through IT.
HOW IT IMPACTS US
WHAT ARE WE DOING ABOUT IT?
In�2014�we�undertook�a�£350m�insurance�buy-in�which�covers�around�35�per�cent�of�scheme liabilities.
Investing in IT applications and infrastructure and bringing on board a high quality team to implement our strategic IT roadmap – and manage cyber security risk.
MOBILISATION OF NEW CONTRACTS INVESTMENT LEVELS IN OIL & GAS INDUSTRY
WHAT IS IT ABOUT? A risk of poor mobilisation of a new contract, failing�to�deliver�promised�cost�or�efficiency�improvements.
The rate of investment in the oil and gas industry will impact our business opportunities in the Middle East.
HOW IT IMPACTS US
WHAT ARE WE DOING ABOUT IT?
We treat the mobilisation of a new partnership with the highest priority and employ experts to effectively deploy both the business and cultural change requirements.
Our carefully managed investment in this area is part of a global balanced portfolio. We believe the potential growth opportunities outweigh the risks in these markets, where we have successfully operated for many years.
FinancialCapital SocialCapital KnowledgeCapital NaturalCapital

INTERSERVE ANNUAL REPORT 2014 STRATEGIC REPORT 17PROTECTING OUR BUSINESS
PROTECTING OUR BUSINESS CONTINUED
RATE OF INFRASTRUCTURE DEMAND EMPLOYEE SKILLS
WHAT IS IT ABOUT? Much of our construction market, both in the UK and Middle East, is governed by the rate of infrastructure spend.
Ensuring both our existing and future workforce have the necessary skills required to provide our services.
HOW IT IMPACTS US
WHAT ARE WE DOING ABOUT IT?
We monitor infrastructure planning closely and spread risk through diverse and flexible�operations.�We�seek�long-term�framework agreements where possible, but also selectively target new markets such as Energy from Waste.
We are committed to providing skills development and training to our current employees through work experience, graduate and apprenticeship schemes, and management training. We work with organisations such as the Social Market Foundation and the Skills Commission to lead the debate with Government on training for the UK workforce of tomorrow.
WORKERS’ COST AND AVAILABILITY ENVIRONMENTAL RISKS
WHAT IS IT ABOUT? This is especially relevant to the Middle East, where the scale and pace of construction projects require a need to import skilled labour and varying cost and availability can be an issue.
Ensuring our business is well placed to face the challenges brought about by climate change and other environmental issues and thereby responding to our customers’ evolving needs.
HOW IT IMPACTS US
WHAT ARE WE DOING ABOUT IT?
Interserve’s associates have well established recruitment services as well as the scale to support a large labour force across the Middle East. We are very conscious of workers’ rights issues and monitor involving standards and costs of compliance very closely.
Our SustainAbilities�Plan�identifies�a�number�of�specific�and�challenging�targets�in�areas�including waste, emissions, recycling and water use. For more information visit www.sustainabilities.interserve.com.
OVERVIEW
GO
VERNA
NCE
STRATEGIC REPO
RT FIN
AN
CIAL STATEM
ENTS

18 INTERSERVE ANNUAL REPORT 2014 STRATEGIC REPORT PERFORMANCE
PERFORMANCE
STRATEGIC REPORT
1. Future workload comprises forward orders and pipeline. Forward orders are those for which we have secured contracts in place and pipeline covers contracts�for�which�we�are�in�bilateral�negotiations�and�on�which�final�terms�are being agreed.
2.�See�note�33�on�page�152�for�a�definition�of�gross�operating�cash�conversion.
3. Accident Incident Rate is based on the number of injuries meeting the RIDDOR reporting requirements per 100,000 workforce and includes associate entities.
4.� �Staff�turnover�measures�the�proportion�of�managerial,�technical�and�office-based staff leaving voluntarily over the course of the period. This measure will�be�modified�in�future�periods�to�include�all�employees.�
5.�Apprentices�and�graduates�employed�in�the�UK.�
We use a set of financial and non-financial KPIs to measure critical aspects of the Group’s performance. These KPIs are aligned with:
• Achieving the Group’s strategic objectives of delivering a substantial future workload and generating strong earnings growth and cash conversion.
• The�Group’s�key�behavioural�goals,�specifically�regarding�our�employees�and�the�health�and�safety�of�everyone� working both directly and indirectly for Interserve.
HEADLINE EARNINGS PER SHARE
Target: Double headline EPS over the five years to 2015
2014 58.8p
2013 47.7p
FUTURE WORKLOAD1
Target: Visibility over 70% of next 12 months’ revenue (market consensus)
2014 74%
2013 75%
GROSS OPERATING CASH CONVERSION2
Target: 100% over medium-term
2014 61.7%
2013 92.1%
ACCIDENT INCIDENT RATE3
Target: Halve the rate by 2020 from a 2010 base
2014 209
2013 201
VOLUNTARY EMPLOYEE TURNOVER4
Target: Reduce voluntary employee turnover to under 10% by 2018
2014 13.3%
2013 8.6%
APPRENTICESHIPS & GRADUATE INTAKE5
Target: Double the number of apprenticeships, traineeships and graduate training opportunities
2014 331
2013 231
KPIs

INTERSERVE ANNUAL REPORT 2014 STRATEGIC REPORT 19PERFORMANCE
PERFORMANCE
As we continue to embed our SustainAbilities Plan into our corporate strategy, there are a number of evolving measures upon which we will be reporting in future periods.
EMERGING MEASURES
Social Capital Target 2014 Performance
Employee volunteering UK 15%�by� 2016
3.6%
ROW 2.4%
Sustainable procurement strategy By 2014 ✔
Health & Wellbeing programme By 2014 ✔
Knowledge Capital Target 2014 Performance
Apprenticeships, traineeships, graduates (number on programme) 500� by 2018
320
Work placements Placements 1,000/yr 422
Experience n/a 654
Total 1,000/yr 1,076
Sustainability targets in managers’ appraisals 100 by 2014
762
2014 Performance vs. 2013
Natural Capital Absolute Relative
Water consumption (m3) (relative metric: m3/£m1) UK 20%�reduction by 2016
-4.3% -10.0%
ROW +12.9% +4.6%
Construction waste (tonnes) (relative metric: tonnes/£m1) UK 25%�reduction by 2016
+4.7% -1.6%
ROW -10.0% -16.6%
Total carbon emissions (tonnes CO2e) (relative metric: CO2e/£m1) UK 50%�reduction by 2020
+6.3% -0.1%
ROW +0.2% -7.1%
1£m revenue includes share of associate and joint venture revenues.
Previously�quoted�2013�figures�have�been�restated�to�take�into�account�significant�acquisitions�and�include�our�international�operations. These�figures�form�our�2013�baseline�for�measuring�performance�against�SustainAbilities targets.
OVERVIEW
GO
VERNA
NCE
STRATEGIC REPO
RT FIN
AN
CIAL STATEM
ENTS
20 INTERSERVE ANNUAL REPORT 2014 STRATEGIC REPORT OPERATIONAL REVIEW
OPERATIONAL REVIEW
STRATEGIC REPORT
“ 2014 WAS A GOOD YEAR FOR INTERSERVE. WE STRENGTHENED OUR BUSINESS BOTH ORGANICALLY AND THROUGH ACQUISITIONS AND EXPANDED OUR REACH IN A NUMBER OF UK AND INTERNATIONAL MARKETS.”
ADRIAN RINGROSE Chief Executive
INTERSERVE ANNUAL REPORT 2014 STRATEGIC REPORT 21OPERATIONAL REVIEW
OVERVIEWInterserve serves the needs of its broad client-base by providing a range of integrated services in the outsourcing and construction markets. Our success is founded on the skills and ingenuity of our people, and so we invest extensively in the development and training of our 80,000 strong team to ensure we continue to retain and attract the right people. In this way we can apply our collective knowledge and experience to meet our customers’ needs and develop lasting, long-term relationships.
2014 was a good year for Interserve. We strengthened our business both organically and through the acquisitions of Initial Facilities (March) and esg (December). Overall we grew our headcount by more than 40 per cent and expanded our reach in a number of UK and international markets.
We delivered organic headline earnings per share growth of 14 per cent in the face of mixed market conditions, supported by targeted investment and a continued focus on the factors that differentiate us as a business. This growth was complemented by the performance of recently acquired businesses which, in aggregate, boosted our total earnings per share growth to 23 per cent and delivered healthy returns on invested capital. This strong performance, together with our record�future�workload�(up�26�per�cent)�and�confidence�in�our�medium-term prospects underpins the recommended increase in dividend, which we have grown by a compound annual growth�rate�of�over�five�per�cent�over�the�last�10�years.
Sustainability remains fundamental to the business. Our commitment to making positive contributions in natural, social and knowledge capital as well as through ‘conventional’ financial�performance�is�an�increasingly�strong�differentiator�with clients, investors, our people and our supply chain. During the year we made substantial progress against our ambitious sustainability targets and continued to invest in skills, research and events; positioning Interserve as both a thought leader and leading practitioner in this sphere.
We segment our results into four main areas - Support Services, Construction, Equipment Services and Investments - all of which are supported by central Group Services.
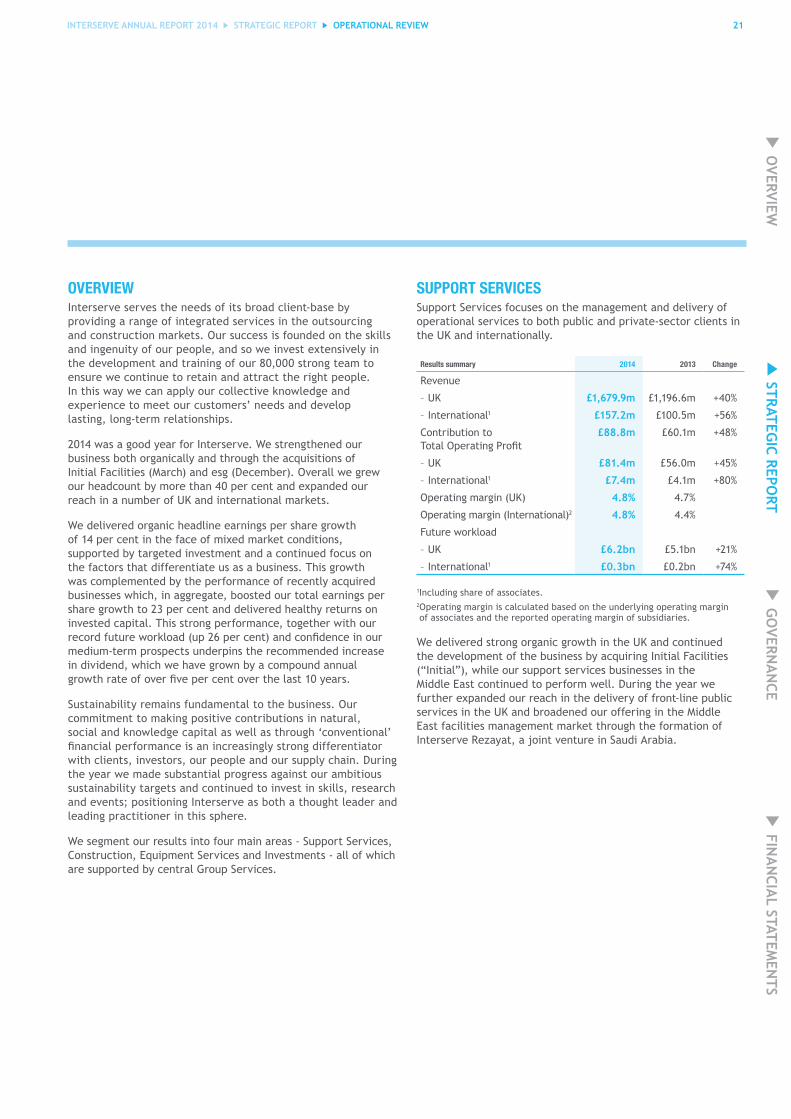
SUPPORT SERVICESSupport Services focuses on the management and delivery of operational services to both public and private-sector clients in the UK and internationally.
Results summary 2014 2013 Change
Revenue
– UK £1,679.9m £1,196.6m +40%
– International1 £157.2m £100.5m +56%
Contribution to Total�Operating�Profit
£88.8m £60.1m +48%
– UK £81.4m £56.0m +45%
– International1 £7.4m £4.1m +80%
Operating margin (UK) 4.8% 4.7%
Operating margin (International)2 4.8% 4.4%
Future workload
– UK £6.2bn £5.1bn +21%
– International1 £0.3bn £0.2bn +74%
1Including share of associates.2 Operating margin is calculated based on the underlying operating margin of associates and the reported operating margin of subsidiaries.
We delivered strong organic growth in the UK and continued the development of the business by acquiring Initial Facilities (“Initial”), while our support services businesses in the Middle East continued to perform well. During the year we further expanded our reach in the delivery of front-line public services in the UK and broadened our offering in the Middle East facilities management market through the formation of Interserve Rezayat, a joint venture in Saudi Arabia.
OVERVIEW
GO
VERNA
NCE
STRATEGIC REPO
RT FIN
AN
CIAL STATEM
ENTS
22 INTERSERVE ANNUAL REPORT 2014 STRATEGIC REPORT OPERATIONAL REVIEW
OPERATIONAL REVIEW CONTINUED
UKWe�delivered�strong�operating�profit�growth,�up�45�per�cent�to�£81.4�million.�Our strong organic performance (up 9 per cent) was bolstered by the acquisition of Initial as we made further strategic progress on a number of fronts and built on a key aspect of our growth strategy: to broaden our offering in front-line services.
In recent years we have built capability in healthcare, welfare-to-work and justice. Our welfare-to-work business, which operates in multiple UK regions providing personalised support and training, supported over 7,000 customers into employment during the year. Our healthcare business, which provides care in the home for high acuity patients, grew�well,�benefitting�from�increased�investment and is well-placed to expand further�during�2015.�Towards�the�end�of�the year we added to our welfare offering through the acquisition of The Employment and Skills Group (esg). We also started to
mobilise new contracts in the justice sector after we secured seven-year contracts worth £622 million in aggregate to provide probation and rehabilitation services for low�and�medium-risk�offenders�in�five�areas�of�England�from�February�2015�as�part�of�the Ministry of Justice’s (MoJ) Transforming Rehabilitation (TR) programme.
We remain one of the Ministry of Defence’s (MoD) key delivery partners, having�won�a�new�five-year,�£322�million�contract to manage its National Training Estate (NTE) with the option to extend for�a�further�five�years.�Our�defence�FM portfolio includes Welbeck Defence Sixth Form College, the Defence Communication Services Agency and the Permanent Joint Overseas Bases (Falklands, Ascension, Cyprus, Gibraltar). We were, though, unsuccessful in our bids for the Next Generation Estates Contracts which, together with the more limited scope of the new NTE contract will result in a net reduction in the scale of our defence business in the near term.
Our work-winning was strong during the year (£2.0 billion) and we achieved a number of notable successes that reflect�the�diversity�of�our�capabilities�including: The Docklands Light Railway (DLR), Exterion Media, Southampton NHS Trust and the Royal National Lifeboat Institution.
Initial’s performance in 2014 was in line with�the�Board’s�expectations.�The�first�wave of integration and re-branding of the business is complete, with the final�phase�due�to�complete�in�2015.�As�anticipated, following the acquisition we have been able to further develop our portfolio of private-sector clients, for instance in the transport sector where we have developed and strengthened our presence through contract wins and extensions. In the UK we now provide cleaning at 16 major Network Rail stations and recently agreed a two-year extension of our contract for services for London Underground. We also won a new contract to deliver cleaning and
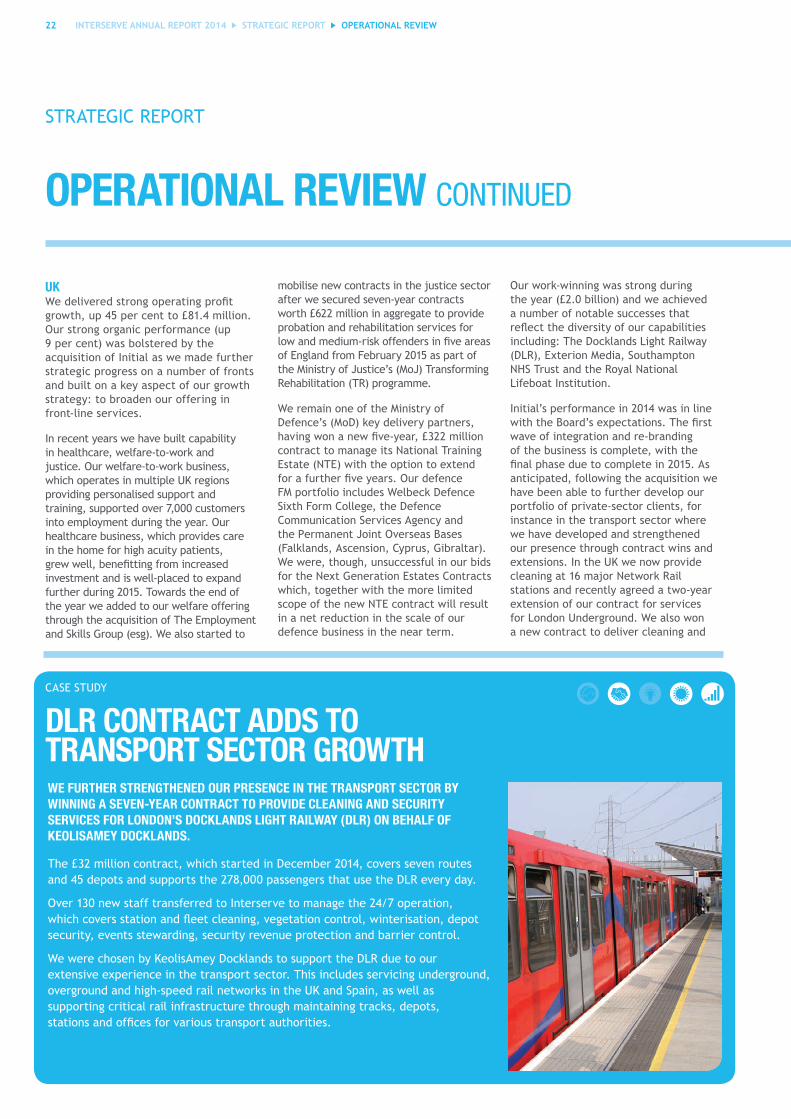
WE FURTHER STRENGTHENED OUR PRESENCE IN THE TRANSPORT SECTOR BY WINNING A SEVEN-YEAR CONTRACT TO PROVIDE CLEANING AND SECURITY SERVICES FOR LONDON’S DOCKLANDS LIGHT RAILWAY (DLR) ON BEHALF OF KEOLISAMEY DOCKLANDS.
The £32 million contract, which started in December 2014, covers seven routes and�45�depots�and�supports�the�278,000�passengers�that�use�the�DLR�every�day.
Over 130 new staff transferred to Interserve to manage the 24/7 operation, which�covers�station�and�fleet�cleaning,�vegetation�control,�winterisation,�depot�security, events stewarding, security revenue protection and barrier control.
We were chosen by KeolisAmey Docklands to support the DLR due to our extensive experience in the transport sector. This includes servicing underground, overground and high-speed rail networks in the UK and Spain, as well as supporting critical rail infrastructure through maintaining tracks, depots, stations�and�offices�for�various�transport�authorities.
CASE STUDY
DLR CONTRACT ADDS TO TRANSPORT SECTOR GROWTH
STRATEGIC REPORT
INTERSERVE ANNUAL REPORT 2014 STRATEGIC REPORT 23OPERATIONAL REVIEW
security services for the Docklands Light Railway.�We�added�to�our�significant�transport operations in Spain, covering the rail and aviation markets for clients including Iberia, Alstom and Renfe, by winning a contract to provide cleaning, maintenance and assistance to passengers with restricted mobility for Spanish airport operator, Aena.
Our enlarged UK Support Services business now has a broader customer proposition and the ability to cross-sell more services to existing clients, growing single-service contracts into multi-service Facilities Management (FM) packages. Examples of this include winning�a�£35�million�contract�extension�with B&Q to provide services across its entire 361-store estate, up from 182 stores. We also grew the scope and size of FM contracts with Alliance Boots and Southwark Council and added to contracts with Co-op Midlands, CBRE and Deutsche Bank.
As a consequence of the developments outlined above, our revenue is now split evenly between the public and private sectors.
We�successfully�mobilised�our�five-year�facilities management contract with the BBC. This involves the management and delivery of services at over 150�locations�across�the�UK�including�New Broadcasting House in London and MediaCityUK in Salford, where we are responsible for services ranging from critical broadcast engineering to business continuity planning.
We have also expanded our capability to serve several of our pan-European clients. Our contract with the Foreign &�Commonwealth�Office�(FCO)�was�expanded – and extended by two years - to deliver support services in France, in addition to the FM services we already provide to the FCO’s UK estate and to 14 diplomatic missions across Europe. Our reach was further developed through our appointment by Sony Europe to support their business in 27 countries, providing services at 40 locations.
International Internationally we provide a broad range of facilities management services in sectors such as hospitality, leisure, education, defence and retail and, through esg, the operation of further education colleges in Saudi Arabia. We also offer maintenance, turnaround services and training to the oil and gas sector in the United Arab Emirates (UAE), Qatar and Oman.
A mix of contract wins with new and existing customers, particularly those in the oil and gas, defence and education sectors, delivered very strong organic operating�profit�growth�of�37�per�cent�which, together with the full-year impact of businesses acquired during 2013, resulted in overall growth in operating profit�of�80�per�cent�to�£7.4�million.�
Highlights during the year included winning a new three-year contract to provide Qatar Shell GTL with a range of�mechanical�services�and�a�five-year�facilities management contract with ExxonMobil in Qatar. We also secured a three-year extension to our longstanding logistics�and�oilfield�services�contract�with Occidental Petroleum in Oman. Other contract wins included two mechanical services contracts with the UAE military, consultancy work for Dubai’s Roads and Transport authority and FM contracts for several schools and colleges in Qatar.
In Saudi Arabia we won contracts to manage services at the Information Technology and Communications Complex (ITCC) and King Abdullah Financial District in Riyadh. We are also encouraged by the prospects for our recently launched joint venture with the Rezayat Group (Interserve Rezayat) which will deliver facilities management services in Saudi Arabia. The addition of esg to the Group also creates a platform to extend front-line services into Saudi Arabia, where we operate three further education colleges under the Colleges of Excellence programme, which complements our existing safety and management skills training activities in Qatar and Oman.
With our new businesses, TOCO and Adyard (each acquired during 2013 in Oman and the UAE, respectively) joining our longstanding Madina operations (based in Qatar), we have developed greater reach and capability across the oil and gas services sector in the Gulf region, opening up access to a wider pool of customers and pan-regional, as well as national, opportunities. TOCO and Adyard delivered strong work winning and started�2015�with�record�order�books.�Key�new wins included contracts with ZADCO, NABORS, GASCO, Hyundai Engineering & Construction Co., Asia Gulf Power Service, TAPCO, Gulf Petrochemical Services�and�Enerflex.
INCREASE IN GROUP HEADLINE TOTAL OPERATING PROFIT OF 35 PER CENT TO
£117.2 MILLION
OVERVIEW
GO
VERNA
NCE
STRATEGIC REPO
RT FIN
AN
CIAL STATEM
ENTS

24 INTERSERVE ANNUAL REPORT 2014 STRATEGIC REPORT
OPERATIONAL REVIEW CONTINUED
CONSTRUCTIONWe offer design, development, consultancy and construction services to create whole-life, sustainable solutions for building and infrastructure projects. Our focus is on forming long-term relationships and delivering repeat business through commercial structures such as framework agreements and project-financed�schemes.
Our presence in the Middle East is structured through longstanding joint-venture partnerships, enabling us to form enduring relationships with clients and to combine our international experience with our partners’ local knowledge to deliver outstanding service.
Results summary 2014 2013 Change
Revenue
– UK £970.7m £802.2m +21%
– International1 £207.9m £215.9m -4%
Contribution to Total�Operating�Profit
£26.2m £27.8m -6%
– UK £15.4m £14.7m +5%
– International1 £10.8m £13.1m -18%
Operating margin (UK) 1.6% 1.8%
Operating margin (International)2 4.7% 5.1%
Future workload
– UK £1.4bn £1.0bn +39%
– International1 £0.3bn £0.2bn +37%
1Share of associates.2 Operating margin is calculated based on the underlying operating margin of associates.
UKAgainst a backdrop of improving demand but also of increasing supply chain pressures, we performed well, growing revenue 21 per cent to £970.7 million. This growth was boosted by a strong performance from Paragon, the London-based specialist fit-out�and�refurbishment�business�we�acquired�in�2013,�and�by�our�growing�Energy�from�Waste�(EfW)�activities.�It�also�reflects�a robust performance from our traditional regional building activities.�Operating�profit�rose�to�£15.4�million�at�a�margin�of�1.6 per cent.
Future workload grew 39 per cent to £1.4 billion (FY 2013: £1.0�billion),�benefitting�from�our�successful�targeting�of�a�mixture of new and existing frameworks, and from selective opportunities in the private sector.
We made further progress in the EfW market, entering (in joint venture with Shanks Group plc) into an agreement with Derby City and Derbyshire County Councils to build and operate a new waste�treatment�facility�in�the�city�under�a�27-year,�£950�million�Public Private Partnership (PPP) contract. This contract adds to a pipeline of EfW projects that we already have underway in
Glasgow, Peterborough, Rotherham and East Lothian (signed in early�2015)�together�with�a�number�of�other�opportunities�in�this�growing sector.
Much of our work for the public sector is channelled through framework agreements in the health and education sectors, which provide a strong foundation and good visibility for our business.
In�education,�we�were�confirmed�as�preferred�bidder�in�the�Priority School Building Programme to develop seven secondary schools across Hertfordshire, Luton and Reading. We also won contracts to build facilities for the universities in Birmingham, Southampton and Wolverhampton. These projects extend our track record in this sector where we have now completed the construction�of�over�50�educational�facilities.
We�won�significant�work�in�the�health�sector�during�the�year,�including contracts to design and build a high-energy proton beam cancer therapy facility for the Christie NHS Foundation Trust in Manchester and a centre of excellence for the Scottish National Blood Transfusion Service in Edinburgh.
During the year we were awarded a place on the Highways Agency’s�four-year,�£5�billion�collaborative�delivery�framework�schemes�valued�between�£25�million�and�£50�million,�which�will provide us with opportunities on a large programme of infrastructure investment over the coming years.
Our credentials in building advanced production testing facilities were reinforced through a number of new awards, such�as�for�a�research�and�assembly�plant�–�Factory�2050�–�at�the�University�of�Sheffield’s�Advanced�Manufacturing�Research�Centre. This was further reinforced by the award of a contract to build an advanced experimental station and electron microscopy facility at Diamond Light Source in Oxfordshire.
Combining�our�project�finance�and�construction�skills,�we�secured�two further major city development schemes featuring a range of retail and leisure clients: a project to develop and build a 150-room�Premier�Inn�hotel�in�central�Edinburgh�and�the�development of a mixed-use project on the site of the former Co-op building in Newcastle city centre.
Paragon�continues�to�thrive,�benefitting�from�both�a�buoyant�London�office�fit-out�market,�and�from�the�additional�client�base and balance sheet strength provided by the Group since acquisition. Since becoming part of Interserve, Paragon has won more�than�£160�million�of�new�work,�including�contracts�to�fit�out�three�floors�of�Markel�Insurance’s�Fenchurch�Street�offices�and BMW’s UK headquarters in Farnborough.
In July we were delighted to be named Contractor of the Year by industry journal Construction News, highlighting our leading position within the UK construction market and the excellent teamwork demonstrated by our people.
OPERATIONAL REVIEW
STRATEGIC REPORT

INTERSERVE ANNUAL REPORT 2014 STRATEGIC REPORT 25
OPERATIONAL REVIEW CONTINUED
INTERSERVE’S ABILITY TO DESIGN, BUILD AND DELIVER ADVANCED MEDICAL AND PRODUCTION TESTING FACILITIES WAS FURTHER REINFORCED DURING THE YEAR THROUGH A NUMBER OF SIGNIFICANT CONTRACT WINS.
We won a contract to build a next generation aerospace factory�at�the�University�of�Sheffield’s�Advanced�Manufacturing�Research�Centre�–�known�as�Factory�2050�–�which�will�be�the�UK’s�first�fully�reconfigurable�assembly�and component research factory.
We were also awarded a contract to design, construct and co-ordinate a high-energy proton beam cancer
therapy facility for the Christie NHS Foundation Trust in Manchester. Full Level 2 Building Information Modelling (BIM) is being used throughout the design process on the facility, which will offer a specialist form of radiotherapy to very precisely target certain cancers when it becomes operational in 2018.
Other awards included contracts to build an advanced experimental station and electron microscopy facility at Diamond Light Source on the Harwell Oxford Campus. In addition, we are also building a new testing and processing facility for the Scottish National Blood Transfusion Service.
CASE STUDY
BUILDING ADVANCED MEDICAL AND TESTING FACILITIES
OPERATIONAL REVIEW
OVERVIEW
GO
VERNA
NCE
STRATEGIC REPO
RT FIN
AN
CIAL STATEM
ENTS

26 INTERSERVE ANNUAL REPORT 2014 STRATEGIC REPORT
Set to open in September 2016, Doha Festival City will�feature�a�250,000�square�metre�mall�housing�over�550�stores,�85�restaurants�and�cafes,�car�showrooms,� a hotel and convention centre. It will also include state-of-the-art cinemas, a snow park and an 8,000 space car park.
Phase 1 of the 430,000 square metre Doha Festival City development�saw�the�opening�of�Qatar’s�first�Ikea�store.�Phase 2 comprises the enabling works to basement and ground�floor�levels,�and�Phases�3,�4�and�5,�the�remaining�mall�construction�and�finishing�work.
The joint venture was previously awarded the mall's substructure works contract for the construction of basement�and�ground�floor�levels.
CASE STUDY
BUILDING QATAR’S BIGGEST MALL AT DOHA FESTIVAL CITY
OPERATIONAL REVIEW CONTINUED
OPERATIONAL REVIEW
STRATEGIC REPORT
OUR ASSOCIATE CONSTRUCTION BUSINESS IN QATAR, GULF CONTRACTING COMPANY (GCC), WAS AWARDED A £325 MILLION CONTRACT IN JOINT VENTURE WITH ALEC QATAR TO DELIVER THE MAIN WORKS FOR DOHA FESTIVAL CITY, THE COUNTRY’S LARGEST EVER MIXED-USE RETAIL AND LEISURE DEVELOPMENT.
INTERSERVE ANNUAL REPORT 2014 STRATEGIC REPORT 27
InternationalInternational Construction performed as expected in challenging, albeit slowly improving markets, in which competition remains high. Volumes increased slightly on a constant currency basis (up 1 per cent) and strong work winning led to growth in the order book of 37 per cent at the year end compared to the end of 2013.
Key contract wins in the UAE included work with Halliburton, DP World, the UAE Roads and Transport Authority, Meraas and the RIVA Group. We completed work on ‘The Beach’ retail and entertainment village and started work on the £110 million redevelopment, expansion and upgrade of the Mall of the Emirates, on behalf of longstanding client, Majid Al Futtaim.
In Qatar we were awarded a £323 million contract, in joint venture, to build Doha Festival City, which will be Qatar's largest retail and entertainment development. We also won work on the Msheireb Heart of Doha redevelopment and a project to build a central energy plant at Education City for the Qatar Foundation.
In Oman, contract wins included the civil engineering works for the�expansion�of�the�Sohar�refinery�for�Petrofac/Daelim�and�an�extension to the Muscat City Centre mall for Majid Al Futtaim. We further developed our power and water portfolio by winning the civil engineering works to a seawater reverse osmosis plant in�Barka�for�Osmoflo.�
EQUIPMENT SERVICESEquipment Services operates globally, designing, hiring and selling formwork and falsework solutions for use in infrastructure and building projects. Our activities have a broad geographic spread, the mix of which can change quickly, hence we�manage�our�equipment�fleet�globally,�thereby�combining�our scale and expertise with agility and responsiveness to meet customers’ needs.
Results summary 2014 2013 Change
Revenue £195.5m £169.6m +15%
Contribution to Total�Operating�Profit
£26.6m £20.1m +32%
Operating margin 13.6% 11.9%
Performance�in�the�period�was�strong,�increasing�profit�by�32 per cent to £26.6 million (FY 2013: £20.1 million) with operating margins gaining 170 basis points as this operationally-geared�business�benefitted�from�increased�activity�in�global�infrastructure�markets�and�from�the�significant�investment�we�have made over the last two years to facilitate growth.
We further extended our reach during the year, opening new branches in South Africa (Cape Town and Nelspruit), the United States (San Leandro, California) and Panama (Panama City) but also downsized in weaker markets, such as Australia, relocating our�fleet�to�exploit�opportunities�and�keeping�our�cost�base�responsive�to�demand�fluctuations.
CASE STUDY
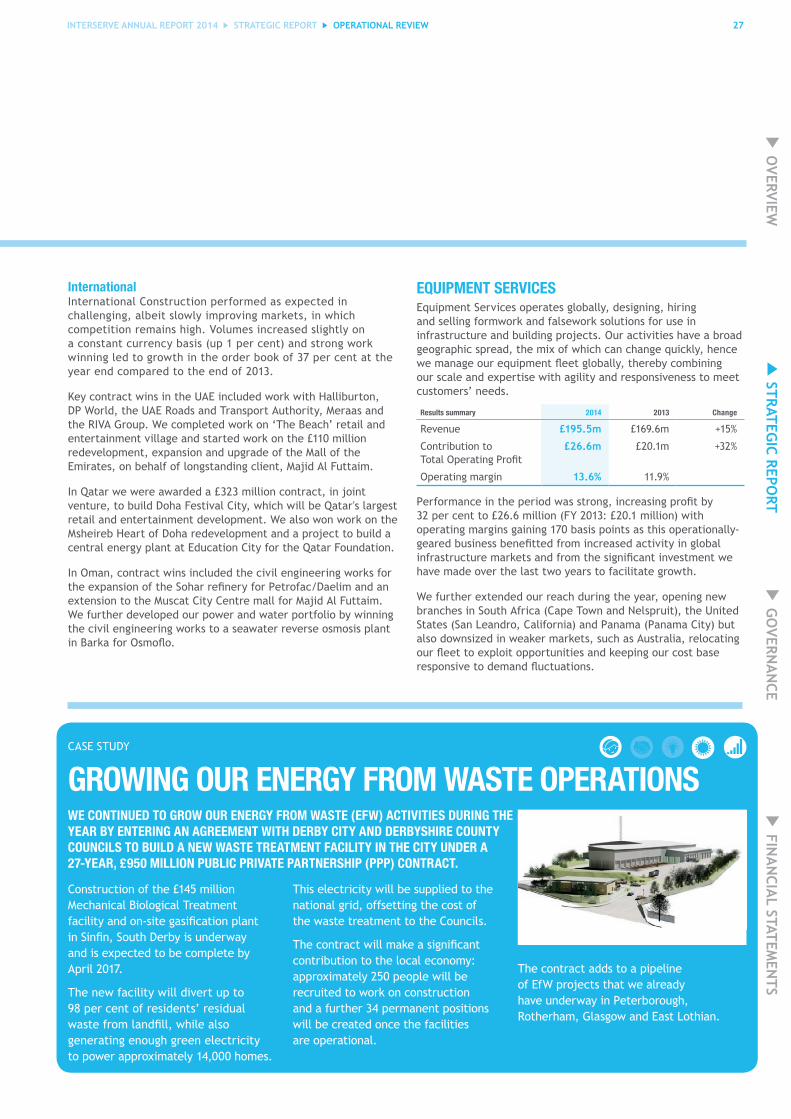
GROWING OUR ENERGY FROM WASTE OPERATIONS
Construction�of�the�£145�million�Mechanical Biological Treatment facility�and�on-site�gasification�plant�in�Sinfin,�South�Derby�is�underway�and is expected to be complete by April 2017.
The new facility will divert up to 98 per cent of residents’ residual waste�from�landfill,�while�also�generating enough green electricity to power approximately 14,000 homes.
This electricity will be supplied to the national grid, offsetting the cost of the waste treatment to the Councils.
The�contract�will�make�a�significant�contribution to the local economy: approximately�250�people�will�be�recruited to work on construction and a further 34 permanent positions will be created once the facilities are operational.
The contract adds to a pipeline of EfW projects that we already have underway in Peterborough, Rotherham, Glasgow and East Lothian.
OPERATIONAL REVIEW CONTINUED
OPERATIONAL REVIEW
WE CONTINUED TO GROW OUR ENERGY FROM WASTE (EFW) ACTIVITIES DURING THE YEAR BY ENTERING AN AGREEMENT WITH DERBY CITY AND DERBYSHIRE COUNTY COUNCILS TO BUILD A NEW WASTE TREATMENT FACILITY IN THE CITY UNDER A 27-YEAR, £950 MILLION PUBLIC PRIVATE PARTNERSHIP (PPP) CONTRACT.
OVERVIEW
GO
VERNA
NCE
STRATEGIC REPO
RT FIN
AN
CIAL STATEM
ENTS
28 INTERSERVE ANNUAL REPORT 2014 STRATEGIC REPORT
OPERATIONAL REVIEW CONTINUED
OPERATIONAL REVIEW
STRATEGIC REPORT
Middle East and AfricaWe�continue�to�see�strong�growth�in�the�Middle�East,�benefitting�from�increased�demand�in�the�UAE,�with�business�confidence�growing in Dubai and ongoing work on large projects including the�Midfield�Terminal�project�at�Abu�Dhabi�airport.�We�are�well�positioned to take advantage of opportunities in Qatar as new large-scale infrastructure projects gear up, while Oman has also seen�a�significant�increase�in�demand,�boosted�by�projects�such�as the Nizwa Mosque, which was completed during the period. After very strong levels of demand in 2013 our activity in Saudi Arabia�continued�to�grow,�boosted�by�significant�new�contract�wins, including work to supply a new transportation complex being built in Mecca and early wins on major projects such as the King Abdullah Financial District and Riyadh metro.
Asia-PacificDemand�continued�to�weaken�gradually�in�Australia,�reflecting�more subdued economic conditions emerging in the last 12 to 18 months and the completion of a number of major energy and mining projects in Western Australia.
Elsewhere�in�the�Asia-Pacific�region�demand�grew,�with�Hong�Kong�particularly�buoyant�due�to�a�series�of�significant�transport�infrastructure projects including the Macau Bridge and West Kowloon Rail Terminus. We traded strongly in New Zealand through a broad base of projects across both the North and South islands. We also performed well in the Philippines, in both the commercial and power sectors, helped by new contracts including the Davao power plant: a project that should stand us in�good�stead�to�benefit�from�further�investment�in�the�sector.
EuropeWe�performed�very�well�in�the�UK,�benefitting�from�our�role�in the development of a leisure and entertainment complex being built near Birmingham and from work on sizeable rail improvement projects in Reading and on the Stockley Viaduct project near Heathrow airport. Other notable contract wins include work on Scotland’s new Forth Bridge and the bridge deck to support the Friargate development in Coventry, while our Ascent-s Safety Screen was used on a number of new high-rise developments.
The market remained slow across much of mainland Europe. We took further action on our cost base in Ireland and Spain reflecting�persistent�weakness�in�domestic�demand,�but�also�made further progress in developing export opportunities, in particular to other Spanish-speaking markets, such as Panama and Colombia.
AmericasWe operate in the USA, Colombia, Panama, Chile and export into Peru. The recovery in the US construction market has been somewhat slower than anticipated and government investment remains sluggish. However, our expansion in California is now bearing fruit, with ongoing work on a number of sizeable commercial developments in the Bay Area and downtown San Francisco. We continued our expansion in Latin America, by developing and investing in our businesses in Colombia and Panama. Performance in Chile was subdued due in large part to low copper prices suppressing general economic activity.
INVESTMENTSInvestments leads the Group’s project-investment activities and manages our equity investments both in Public Private Partnership (PPP) and private-sector projects.
2014 2013
Contribution�to�Total�Operating�Profit £0.8m £0.8m
Interest received on subordinated debt investments
£0.8m £0.6m
Total £1.6m £1.4m
Exceptional�profit�from�PFI�disposals £nil £3.6m
Our strategy includes combining our investment, development and�project�management�skills�to�finance�and�deliver�projects�over many years. In recent years we have extended this from our core PFI activities into selective private-sector commercial developments and now have an aggregate portfolio (invested and committed) of £47 million.
Having�achieved�a�number�of�financing�and�planning�milestones,�we started work in February 2014 on the Haymarket development in central Edinburgh, which will become one of the city’s largest mixed-use commercial developments. During the year we also invested in projects to redevelop the Alder Hey Children’s Hospital and a centre of excellence for the Scottish National Blood Transfusion Service in Edinburgh.
We�were�appointed�preferred�bidder�to�finance,�design,�build�and provide FM services for seven secondary schools across Hertfordshire,�Luton�and�Reading,�the�first�batch�to�be�procured�under the Priority School Building Programme, part of the government’s PF2 initiative.
Our�presence�in�Yorkshire�has�grown�significantly�in�recent�years and during the year we completed work on the last of three major developments for West Yorkshire Police to provide a modern working environment for over 1,000 police officers�and�civilian�staff,�built�to�the�highest�energy�and�sustainability standards.

INTERSERVE ANNUAL REPORT 2014 STRATEGIC REPORT 29
OPERATIONAL REVIEW CONTINUED
OPERATIONAL REVIEW
OUR INTERIOR FIT-OUT BUSINESS, PARAGON, COMPLETED THE OFFICE REFURBISHMENT FOR INSURANCE FIRM MARKEL AT THE ‘WALKIE TALKIE’ BUILDING, THE NEWEST COMMERCIAL SKY SCRAPER IN LONDON’S FINANCIAL DISTRICT.
The�project,�which�spans�three�floors�of�the�34-storey,�525-feet�tall�building,�included�fitting�out�open-plan�offices,�flexible�meeting�spaces,�two�commercial�kitchens,�a�15,000�square�foot�staff�canteen�and�a�reception�area.�
Paragon also created a boardroom, an executive suite including�several�offices,�private�dining�rooms�as�well� as a range of executive video conferencing rooms. A number of breakout spaces and business lounges were also�created�over�the�three�floors,�which�are�linked�by� a new feature staircase.
Due to the complexity of transporting a large amount of�equipment�and�delicate�furnishings�and�fittings�up�25�floors,�Paragon�worked�closely�with�specialist�subcontractors to prefabricate and preassemble as much of the project as possible.
The project, which lasted 34 weeks, was handed over in December 2014.
CASE STUDY
PARAGON FITS OUT MARKEL’S ‘WALKIE TALKIE’ LONDON OFFICE
GROUP SERVICESAll�central�costs,�including�those�related�to�our�financing�and�central bidding activities, are disclosed within the Group Services segment.
Group�Services’�costs�in�2014�were�£25.2�million�(FY�2013:� £22.1 million), accommodating an increased investment in back-office�capabilities,�IT�infrastructure,�people�development�and communications.
We anticipate this increased level of investment will continue in the medium term, as we ensure that we continue to scale our support and assurance functions appropriately with the growth of our operational businesses.
OUTLOOKAgainst a backdrop of uncertainty in many of our markets, we remain�confident�in�our�strategy�of�managing�and�diversifying�risk�and focussing our resources on markets with strong long-term growth drivers. Our attractive positioning in our core markets and our ability to identify, invest in and deliver on attractive project and corporate opportunities is a powerful differentiator.
We expect our Support Services business to make further progress as we continue to win new work and extend relationships with existing clients. Our increased private-sector exposure should act as a counterweight to any temporary hiatus in further government outsourcing, which we expect to resume and accelerate after the UK General Election, with particular emphasis on front-line public services. We believe that the spread of our activities in the Middle East support services market will mitigate against the potential impact of continued weakness�in�the�oil�price�during�2015.
In Construction we expect to see further volume growth in the�UK�in�2015,�much�of�which�is�visible�in�our�future�workload,�although margins will likely remain close to current levels. In the Middle East we expect to make volume progress as we deliver contracted orders and continue to pursue opportunities across various sectors.
We expect Equipment Services to continue to grow in expanding�global�construction�markets�and�to�benefit�from�further operational gearing.
While optimistic, we continue to manage the business prudently to ensure it remains resilient against future economic cycles.
OVERVIEW
GO
VERNA
NCE
STRATEGIC REPO
RT FIN
AN
CIAL STATEM
ENTS

30 INTERSERVE ANNUAL REPORT 2014 STRATEGIC REPORT PRINCIPAL RISKS AND UNCERTAINTIES
PRINCIPAL RISKS AND UNCERTAINTIES
STRATEGIC REPORT
We operate in a business environment in which a number of risks and uncertainties exist. While it is not possible to eliminate these completely, the established risk-management and internal control procedures, which are regularly reviewed by the Group Risk Committee on behalf of the Board, are designed to manage their effects and thus contribute to the creation of value for the Group’s shareholders as we pursue our business objectives.
The Group continues to be dependent on effective maintenance of its systems and controls. Over and above that, the principal risks and uncertainties which the Group addresses through its risk-management measures are detailed below.
RISK POTENTIAL IMPACT MITIGATION AND MONITORING
BUSINESS, ECONOMIC AND POLITICAL ENVIRONMENT
Among the changes which could affect our business are:
• shifts in the economic climate both in the UK and internationally, including changes in the oil and gas industry;
• alterations in the UK government’s policy with regard to expenditure on improving public infrastructure, buildings, services and modes of service delivery and delays in or cancellation of the procurement of government-related projects;
• the imposition of unusually onerous contract conditions by major clients;
• changes in our competitors’ behaviour;
• �a�deterioration�in�the�profile�of�our�counterparty�risk;�and
• civil unrest and/or shifts in the political climate in some of the regions in which we operate
any one or more of which might result in a failure to win new or�sufficiently�profitable�contracts�in�our�chosen�markets�or�to�complete�contracts�with�sufficient�profitability.
We seek to mitigate these risks by fostering long-term relationships with our clients and partners, our governmental/quasi-governmental medium-to-long-term revenue streams, the development of additional capabilities to meet anticipated demand in new growth areas, careful supply chain management and by operating in various regions of the world, including the Middle East, where we are able to transfer resources to maximum effect between the differing economies of that region.
We�also�have�in�place�committed�financing�with�long�maturity dates.
We constantly monitor market conditions and assess our capabilities in comparison to those of our competitors. Whether we win, lose or retain a contract we analyse the reasons for our success or shortcomings and feed the information back at both tactical and strategic levels. We also constantly monitor our cost base and take action to ensure it is suitable given the prevailing market environment.
We have also set ourselves the goals of delivering sustainability solutions to our clients, ensuring that we and our suppliers uphold the highest standards in equality, diversity, human rights and ethics, playing an active role in the communities in which we operate and placing sustainability at the heart of our business.
MAJOR CONTRACTS
As we focus on large-volume relationships with certain major clients�for�a�significant�part�of�our�revenue,�termination�of�one or more of the associated contracts would be likely to reduce�our�revenue�and�profit.�In�addition,�the�management�of such contracts entails potential risks including mis-pricing, inaccurate�specification,�failure�to�appreciate�risks�being�taken on, poor control of costs or of service delivery, sub-contractor insolvency and failure to recover, in part or in full, payments due for work undertaken.
In PFI/PPP contracts, which can last for periods of around 30 years, there may be increases in costs, including wage inflation,�beyond�those�anticipated.
Among our mitigation strategies are targeting work within, or complementary to, our existing competencies, the fostering of long-term relationships with clients, operating an authority matrix for the approval of large bids, monthly management reporting with key performance indicators at contract and business level, the use of monthly cost-value reconciliation, supply chain management and ensuring that periodic benchmarking and/or market testing are included in long-term contracts PFI/PPP contracts.
OPERATING SYSTEM
We enjoy demonstrable success in working with third parties both through joint ventures and associated companies in the UK and abroad. This success results in a material proportion of�our�profits�and�cash�flow�being�generated�from�businesses�in which we do not have overall control. Any weakening of our strong relationships with these business partners could have�an�effect�on�our�profits�and�cash�flow.
We have a proven track record of developing and re-enforcing such�relationships�in�a�mutually�beneficial�way�over�a�long�period of time and our experience of this places us well to preserve existing relationships and create new ones as part of our business model. The measures taken to limit risk in this area include: board representation, shareholders’ agreements, management secondments, local borrowings and rights of audit in addition to investing time in personal relationships.
INTERSERVE ANNUAL REPORT 2014 STRATEGIC REPORT 31PRINCIPAL RISKS AND UNCERTAINTIES
PRINCIPAL RISKS AND UNCERTAINTIES
RISK POTENTIAL IMPACT MITIGATION AND MONITORING
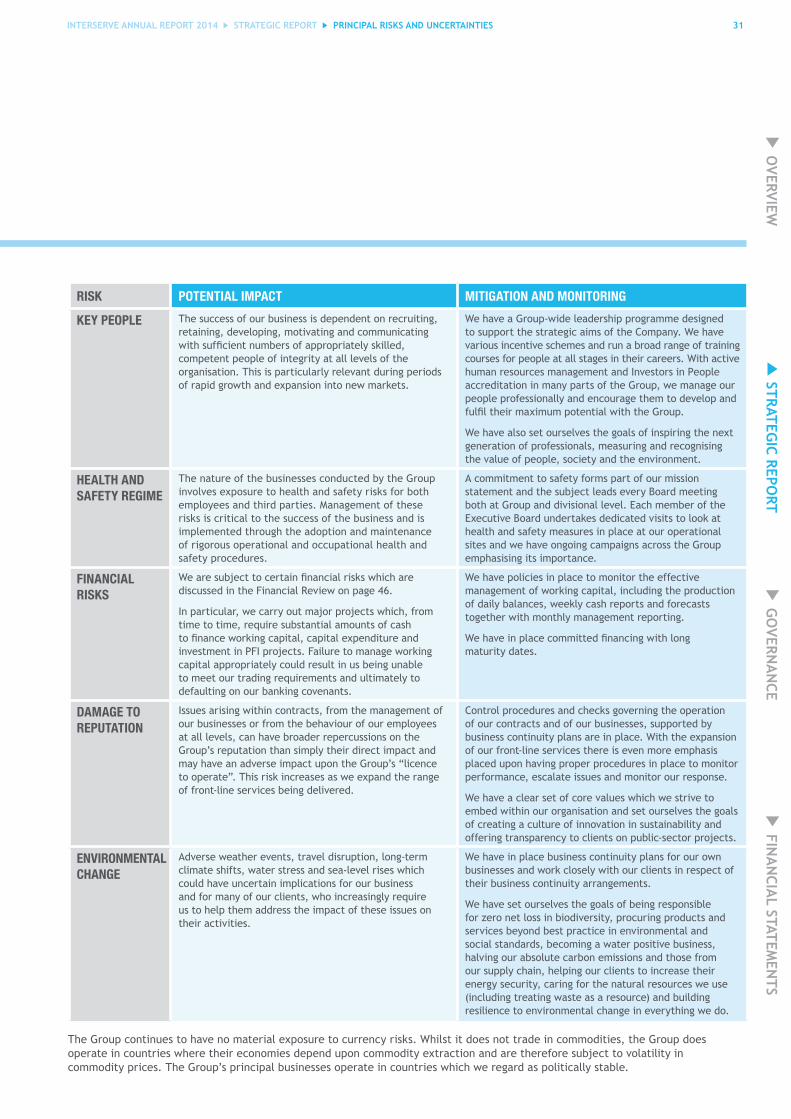
KEY PEOPLE The success of our business is dependent on recruiting, retaining, developing, motivating and communicating with�sufficient�numbers�of�appropriately�skilled,�competent people of integrity at all levels of the organisation. This is particularly relevant during periods of rapid growth and expansion into new markets.
We have a Group-wide leadership programme designed to support the strategic aims of the Company. We have various incentive schemes and run a broad range of training courses for people at all stages in their careers. With active human resources management and Investors in People accreditation in many parts of the Group, we manage our people professionally and encourage them to develop and fulfil�their�maximum�potential�with�the�Group.
We have also set ourselves the goals of inspiring the next generation of professionals, measuring and recognising the value of people, society and the environment.
HEALTH AND SAFETY REGIME
The nature of the businesses conducted by the Group involves exposure to health and safety risks for both employees and third parties. Management of these risks is critical to the success of the business and is implemented through the adoption and maintenance of rigorous operational and occupational health and safety procedures.
A commitment to safety forms part of our mission statement and the subject leads every Board meeting both at Group and divisional level. Each member of the Executive Board undertakes dedicated visits to look at health and safety measures in place at our operational sites and we have ongoing campaigns across the Group emphasising its importance.
FINANCIAL RISKS
We�are�subject�to�certain�financial�risks�which�are�discussed in the Financial Review on page 46.
In particular, we carry out major projects which, from time to time, require substantial amounts of cash to�finance�working�capital,�capital�expenditure�and�investment in PFI projects. Failure to manage working capital appropriately could result in us being unable to meet our trading requirements and ultimately to defaulting on our banking covenants.
We have policies in place to monitor the effective management of working capital, including the production of daily balances, weekly cash reports and forecasts together with monthly management reporting.
We�have�in�place�committed�financing�with�long maturity dates.
DAMAGE TO REPUTATION
Issues arising within contracts, from the management of our businesses or from the behaviour of our employees at all levels, can have broader repercussions on the Group’s reputation than simply their direct impact and may have an adverse impact upon the Group’s “licence to operate”. This risk increases as we expand the range of front-line services being delivered.
Control procedures and checks governing the operation of our contracts and of our businesses, supported by business continuity plans are in place. With the expansion of our front-line services there is even more emphasis placed upon having proper procedures in place to monitor performance, escalate issues and monitor our response.
We have a clear set of core values which we strive to embed within our organisation and set ourselves the goals of creating a culture of innovation in sustainability and offering transparency to clients on public-sector projects.
ENVIRONMENTAL CHANGE
Adverse weather events, travel disruption, long-term climate shifts, water stress and sea-level rises which could have uncertain implications for our business and for many of our clients, who increasingly require us to help them address the impact of these issues on their activities.
We have in place business continuity plans for our own businesses and work closely with our clients in respect of their business continuity arrangements.
We have set ourselves the goals of being responsible for zero net loss in biodiversity, procuring products and services beyond best practice in environmental and social standards, becoming a water positive business, halving our absolute carbon emissions and those from our supply chain, helping our clients to increase their energy security, caring for the natural resources we use (including treating waste as a resource) and building resilience to environmental change in everything we do.
The Group continues to have no material exposure to currency risks. Whilst it does not trade in commodities, the Group does operate in countries where their economies depend upon commodity extraction and are therefore subject to volatility in commodity prices. The Group’s principal businesses operate in countries which we regard as politically stable.
OVERVIEW
GO
VERNA
NCE
STRATEGIC REPO
RT FIN
AN
CIAL STATEM
ENTS

32 INTERSERVE ANNUAL REPORT 2014 STRATEGIC REPORT SUSTAINABILITY REVIEW
STRATEGIC REPORT
SUSTAINABILITY REVIEW
In 2013 we launched SustainAbilities,�a�single,�unified�plan�to embed sustainability in every aspect of how we operate. SustainAbilities recognises that a business must be sustainable to�be�successful,�and�that�financial�success�depends�on�a�broad range of factors: the strength of our reputation, our relationship with our employees, customers and communities, and how we conduct our operations. Our decision making needs�to�take�account�of�these�to�ensure�we�have�firm�foundations in place for future growth. Sustainability can no longer be viewed as an optional extra or compliance-driven corporate governance, but fundamental good business sense, building strong business relationships, reducing waste, minimising energy consumption, investing in skills, reducing risk�and�giving�confidence�to�customers.�
SustainAbilities is our ambitious, Group-wide plan setting out five�outcomes,�15�goals�and�48�targets�over�the�period�2013�to 2020. It is much more than a corporate social responsibility plan, rather a strategy which is embedded into our daily activities and one which puts sustainability at the forefront of our decision making, managing risks and realising opportunities for�sustainable�and�profitable�growth.
It was for this reason that Interserve participated in the International Integrated Reporting Council’s (IIRC) Pilot Programme and, in 2013, our Annual Report was one of the
first�to�showcase�this�thinking.�Our�strategy�and�business�model�was�redrawn�to�recognise�not�only�financial�performance�but�also�non-financial�factors�–�what�we�call�the�‘capitals’�–�social,�knowledge,�natural�and�financial.�This�enabled�us�to�articulate�how these are at the heart of our business.
MEASURING NON-FINANCIAL PERFORMANCEWhile�measuring�financial�performance�is�a�well-established�part�of�our�annual�financial�reporting�process,�to�measure�these�non-financial�‘capitals’�requires�a�new�approach�and�a�broader�set�of�data. To achieve this we have designed, built and implemented a new IT system, called Insight, which has enabled us to source data from across the business to assess progress against the SustainAbilities Plan.
Set�out�here�are�the�first�results�from�our�SustainAbilities Plan. Covering the year ended 31 December 2014, compared with our�baseline�2013�year,�they�represent�significant�effort�in�the�collection�and�collation�of�over�175,000�items�of�data,�and�the implementation of numerous site-level and Group-wide initiatives to drive improvement and behavioural change in the business. More detailed analysis of our progress against the SustainAbilities�Plan�will�be�available�in�our�2015�Progress� Report which will be published later in the year.
While�2013�was�a�baseline�year,�where�we�identified�and�captured relevant data to establish the benchmarks for our future�performance,�2014�has�been�the�first�year�of�truly�measurable, comparable progress towards our goals. During our review of data we discovered a number of imperfections and omissions in our original 2013 baseline, which we have consequently corrected. We have also amended the baselines to�reflect�the�transformational�impact�of�our�acquisitions�during the year. We now believe that we have meaningful comparatives and a robust baseline against which to measure our�progress.�As�our�confidence�in�the�completeness�and�accuracy of our various measures increases, we will move towards external assurance of our reported progress.
“ SUSTAINABILITY IS AT THE FOREFRONT OF OUR DECISION MAKING AS WE MANAGE RISKS AND REALISE OPPORTUNITIES FOR SUSTAINABLE AND PROFITABLE GROWTH.”
TIM HAYWOOD Group Finance Director & Head of Sustainability
THE FOUR CAPITALS• Socialcapital – the contribution to communities, local
employment, wellbeing, networks and interactions that enable societies to function and thrive
• Knowledgecapital – the know-how, skills, capabilities, innovation and experience possessed by society and organisations
• Naturalcapital – everything we rely on from the natural environment to provide a resource or service, e.g. land, air and water
• Financialcapital – the money used to generate an income or invested, for the purpose of economic growth
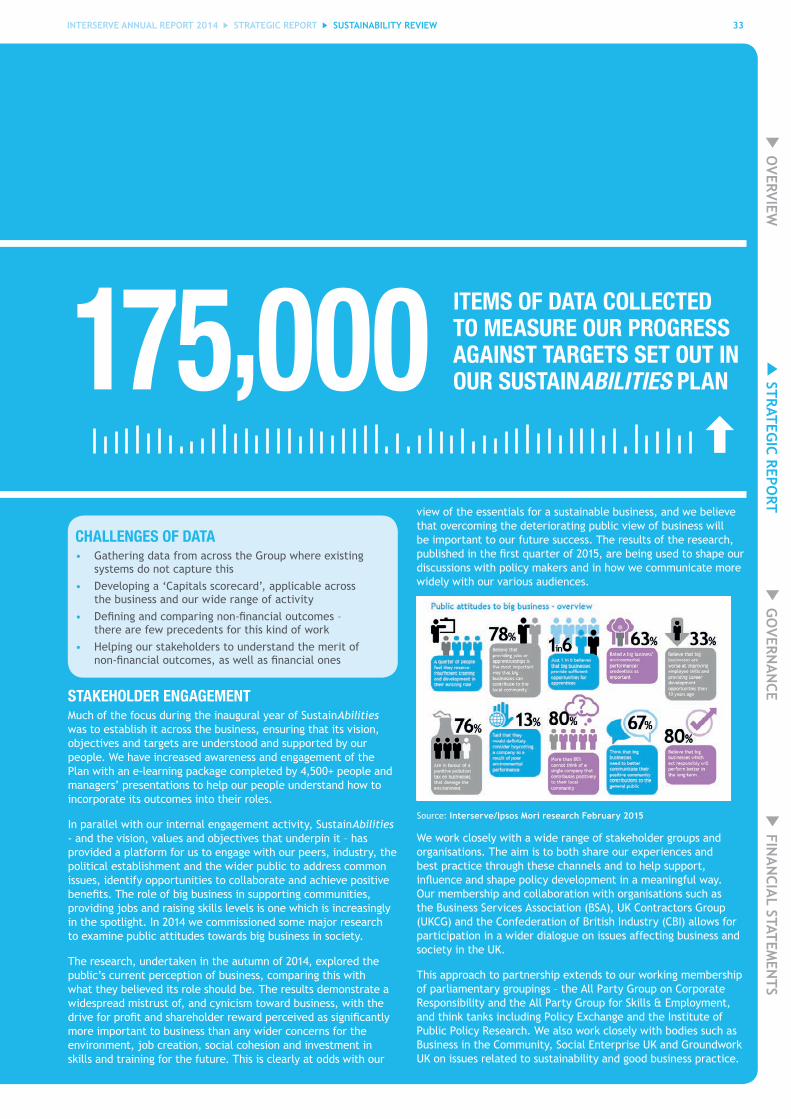
INTERSERVE ANNUAL REPORT 2014 STRATEGIC REPORT 33SUSTAINABILITY REVIEW
STAKEHOLDER ENGAGEMENT Much of the focus during the inaugural year of SustainAbilities was to establish it across the business, ensuring that its vision, objectives and targets are understood and supported by our people. We have increased awareness and engagement of the Plan�with�an�e-learning�package�completed�by�4,500+�people�and�managers’ presentations to help our people understand how to incorporate its outcomes into their roles.
In parallel with our internal engagement activity, SustainAbilities - and the vision, values and objectives that underpin it – has provided a platform for us to engage with our peers, industry, the political establishment and the wider public to address common issues, identify opportunities to collaborate and achieve positive benefits.�The�role�of�big�business�in�supporting�communities,�providing jobs and raising skills levels is one which is increasingly in the spotlight. In 2014 we commissioned some major research to examine public attitudes towards big business in society.
The research, undertaken in the autumn of 2014, explored the public’s current perception of business, comparing this with what they believed its role should be. The results demonstrate a widespread mistrust of, and cynicism toward business, with the drive�for�profit�and�shareholder�reward�perceived�as�significantly�more important to business than any wider concerns for the environment, job creation, social cohesion and investment in skills and training for the future. This is clearly at odds with our
CHALLENGES OF DATA• Gathering data from across the Group where existing
systems do not capture this
• Developing a ‘Capitals scorecard’, applicable across the business and our wide range of activity
• �Defining�and�comparing�non-financial�outcomes�–� there are few precedents for this kind of work
• Helping our stakeholders to understand the merit of non-financial�outcomes,�as�well�as�financial�ones
Source: Interserve/Ipsos Mori research February 2015
view of the essentials for a sustainable business, and we believe that overcoming the deteriorating public view of business will be important to our future success. The results of the research, published�in�the�first�quarter�of�2015,�are�being�used�to�shape�our�discussions with policy makers and in how we communicate more widely with our various audiences.
We work closely with a wide range of stakeholder groups and organisations. The aim is to both share our experiences and best practice through these channels and to help support, influence�and�shape�policy�development�in�a�meaningful�way.�Our membership and collaboration with organisations such as the Business Services Association (BSA), UK Contractors Group (UKCG) and the Confederation of British Industry (CBI) allows for participation in a wider dialogue on issues affecting business and society in the UK.
This approach to partnership extends to our working membership of parliamentary groupings – the All Party Group on Corporate Responsibility and the All Party Group for Skills & Employment, and think tanks including Policy Exchange and the Institute of Public Policy Research. We also work closely with bodies such as Business in the Community, Social Enterprise UK and Groundwork UK on issues related to sustainability and good business practice.
ITEMS OF DATA COLLECTED TO MEASURE OUR PROGRESS AGAINST TARGETS SET OUT IN OUR SUSTAINABILITIES PLAN175,000
OVERVIEW
GO
VERNA
NCE
STRATEGIC REPO
RT FIN
AN
CIAL STATEM
ENTS

34 INTERSERVE ANNUAL REPORT 2014 STRATEGIC REPORT
Our work on SustainAbilities has also been recognised by industry and during 2014 we were awarded the British Quality Foundation’s Sustainable Future Achievement Award for demonstrating how our policies are embedded across the organisation and have improved the sustainability of our business practices. In addition we were Highly Commended in the Finance for the Future Awards recognising the role of finance�in�supporting�sustainable�business.�We�have�also�maintained our listing in the FTSE4Good Index.
SOCIAL CAPITAL As a major provider of public services and facilities, we are dedicated to supporting public agencies, the third sector and delivering public services directly to the citizen while having a positive impact on the communities we interact with. Public interest, therefore, is at the heart of what we do. We are evidencing this through our commitment to using SMEs, tracking local supply chain spend, setting clear targets on community engagement, increasing the employability skills of young people and providing real opportunities for disadvantaged groups.
We are also working with Government to help incorporate sustainability targets such as these into public procurement through the implementation of the Social Value Act. Our activity has also focused on raising awareness of the importance of considering social capital in decision making, understanding methods for measuring social capital and opportunities to have a positive impact.
• �In�2014,�we�convened�the�UK’s�first�Social�Value�Summit� in partnership with Social Enterprise UK to share and learn from existing good practice across sectors in relation to social value.
• �In�February�2015�we�hosted�the�second�Social�Value� Summit to examine progress, where we launched our Social Value Mapping Tool.
Our work to support social capital includes adopting new business models. We extended our network of relationships with third-sector organisations by forming Purple Futures, an Interserve-led partnership for the provision of probation and rehabilitation services�in�five�areas�of�the�UK�(Cheshire�and�Greater�Manchester;�Hampshire; Humberside, Lincolnshire and West Yorkshire; Merseyside and West Yorkshire). This new business model will see us working in partnership with the housing charity Shelter; the drug and alcohol treatment charity AddAction; P3, the national charity providing social inclusion services to people with complex needs; and 3SC, a social enterprise that will build and manage the voluntary sector supply chain on our behalf. Where we bring business expertise and investment capability, our third-sector partners bring experience in service delivery and community engagement.�We�manage�the�financial�risks�of�the�contracts,�allowing�our�partners�to�benefit�from�the�stable�cash�flow�a�company of our size and scale can provide. We have created and published a ‘Charity Charter’ which sets out what we can offer our Volunteering, Community and Social Enterprise (VCSE) partners and, in turn, what we expect from them.
STRATEGIC REPORT
SUSTAINABILITY REVIEW
CASE STUDY
SOCIAL VALUE MAPPING WE BELIEVE OUR SUCCESS CAN ONLY BE JUDGED IF SEEN IN THE CONTEXT OF THE LOCATIONS WHERE WE OPERATE AND THE SOCIAL AND ECONOMIC CONDITIONS THAT EXIST DURING OUR BUSINESS OPERATIONS.
Our Social Value Mapping Tool has been developed to combine data from our business systems with publicly available data to create a contextual picture or map of the impacts we have. We are bringing anonymous spatial data on payroll and supplier spend, employee skills, skills progression, education standards, together with public socio-economic data sets on multiple indices of deprivations, reported crime, education standards and house price values. In 2014�we�developed�the�proof�of�concept�for�the�tool�and�in�2015�we will be looking to roll it out to key parts of the UK business and begin to develop its predictive capability.
SUSTAINABILITY REVIEW CONTINUED

INTERSERVE ANNUAL REPORT 2014 STRATEGIC REPORT 35
• We signed up to BITC’s Ban the Box campaign to give people with criminal convictions a second chance at fulfilling�their�potential�by�giving�them�fair�access�to�employment opportunities.
• �Landmarc,�our�partnership�with�American�training�firm�PAE, launched a venture with X Forces to help hundreds of ex-service personnel into the world of business. As well as providing mentors to work with X Forces’ entrepreneurs, Landmarc�also�gives�access�to�office�and�meeting�space,� to help get new businesses on their feet.
Community engagementSocial capital is inherently linked to local circumstances, issues and communities. Our community engagement is structured to help local groups and communities tackle local issues by providing support for our people to make a difference in their community through the Interserve Employee Foundation (IEF). The IEF was established with the aim of improving the quality of life for people in the communities where we operate through enlisting their skills, capabilities, resources and enthusiasm and encouraging our people all over the world to engage in community and charitable activities.
Employees receive two days of time per year to participate in a community volunteering project/charitable activity. In 2014 3.1 per cent of employees supported projects through volunteering during company time, a total of 1,912 volunteering days.
The�charities�and�good�causes�supported�by�IEF�reflect�the� wide scope of our operations and of the interests and concerns of our staff. Examples of support in 2014 include:
• A team of cyclists from our Construction division raised over £160,000 for charities following the London to Paris bike�ride�in�May�2014.�Some�65�employees�took�part�in� the�challenge�which�saw�the�team�cycle�275�miles�over� three days.
• �Colleagues�in�Birmingham�collected�nearly�3,500�items� of food (1.6 tonnes) for the Birmingham Central Foodbank, enough�to�provide�over�750�meals�for�families�in�need� over the Christmas period. The donation is the largest ever provided to the Foodbank from a single company.
• �55�employees�gave�their�time�to�support�Just�Around�the�Corner (JAC), a Berkshire charity that uses the restorative effects of horse riding as a therapy to support children and families affected by mental health problems by building paths, fencing paddocks, digging vegetable allotments and weather-proofing�buildings.
Social Capital Target2014
Performance
Employee volunteering UK15%�by�2016
3.6%
ROW 2.4%
Sustainable procurement strategy By 2014 �Health & Wellbeing programme By 2014 �
SUSTAINABILITY REVIEW
CASE STUDY
BUILDING FOR THE FUTURE
THIS INITIATIVE WAS FOUNDED IN 2007 BY PARENTS OF DISABLED CHILDREN, WHO DISCOVERED THERE WAS NO SUITABLE PLAY AREA FOR CHILDREN WITH DISABILITIES ANYWHERE IN THE WOKINGHAM BOROUGH.
Once the charity secured a building, Interserve staff applied to the Interserve Employee Foundation for a grant which would be used to carry out necessary work. The building needed to be made safe and wheelchair accessible. Work was also needed to transform it into a bright, engaging environment where the children could play.�The�charity�directors�awarded�£7,500�towards�the�costs. Staff from our Developments division, along with Facilities Management employees at Slough Borough Council,�gave�a�total�of�75�days�of�their�time�to�undertake�the majority of work. They also used supplier and local trades and business contacts to secure materials at cost value as well as getting some of the materials donated. The facility was opened by Their Royal Highnesses The Earl and Countess of Wessex in May 2014.
OVERVIEW
GO
VERNA
NCE
STRATEGIC REPO
RT FIN
AN
CIAL STATEM
ENTS

36 INTERSERVE ANNUAL REPORT 2014 STRATEGIC REPORT
STRATEGIC REPORT
SUSTAINABILITY REVIEW
KNOWLEDGE CAPITALWe are now one of the largest private employers in the UK, with a worldwide workforce of over 80,000 throughout 40 countries. In turn we support thousands of SMEs through our supply chain, supporting hundreds of thousands more. Our areas of specialism, particularly within construction and engineering, demand a skilled workforce. Our long-term sustainability depends on a pool of educated, work-ready labour which can meet the growing needs of our business. We are therefore committed to sharing know-how, increasing levels of skills and training and providing opportunities for self-improvement to add to society’s collective pool of knowledge.
Knowledge Capital Target 2014 Performance
Apprenticeships, traineeships, graduates (number on programme)
500by 2018 320
Number of training days UK n/a 12,159
ROW n/a 39,950
Work placements Placements 1,000/yr 422
Experience n/a 654
Total 1,000/yr 1,076
Sustainability targets in managers’ appraisals
100 762
Under our group-wide Innovation Programme this year we launched a ‘Big Ideas Hunt’ to encourage employees to bring our strapline ‘ingenuity at work’ to life, and contribute innovative ideas to improve our business. Over 400 ideas were submitted, largely captured through our new employee portal, MyInterserve. These were shortlisted by the Innovation Steering Board, with employees then voting for their top 10 ideas.
We also expanded the level of support for Early Career entrants into our business. This Group-wide programme focusing on the next�generation�of�Interserve�professionals�has�seen�a�significant�increase in opportunities for graduates, apprentices and work placements. In 2014 we had 320 apprentices, trainees and graduates on the programme across the Group. As part of our drive to increase both awareness and work-readiness of future school leavers, we delivered work experience events to a total of 1,076 participants. This was split between 422 students on formal�work�placements�and�654�students�who�attended�work�experience�workshops�to�help�define�and�develop�essential�employability skills.
A further element in our mission to bring closer together the worlds of education and business was the establishment of the Interserve�Academies�Trust�(IAT)�–�a�not-for-profit�charitable�organisation, with the aim of becoming a multi-academy sponsor. In July, the Department for Education approved the IAT as the sponsor of Crawshaw Academy in Leeds, a mixed
CASE STUDY
MORE SKILLS, MORE OPPORTUNITIES AT KHANSAHEB TRAINING SCHOOL, DUBAIPROVIDING CONSTRUCTION WORKERS WITH GREATER EXPERTISE AND WIDER CAREER OPPORTUNITIES, INTERSERVE’S ASSOCIATE CIVIL ENGINEERING BUSINESS IN DUBAI IS PAVING THE WAY WITH THE ESTABLISHMENT OF ITS OWN IN-HOUSE TRADES TRAINING SCHOOL.
Opened in March 2014, the Khansaheb Training Centre runs a full trades training curriculum�taught�by�CITB�qualified�tutors.�The�centre�trains�160�employees�per�month, on a 12-day structured curriculum for each trade. Over 1,700 of our people have�already�benefitted.�The�curriculum�covers�key�site�skills,�such�as�masonry,�block-laying,�plastering,�tiling�and�paving,�steel�fixing,�carpentry�and�supervisory�skills. Health and safety is also a critical component of the training, which includes demonstrated, practical tutorials with mentorship and ongoing peer review on how to get the job done, the safe way. As well as noticing a steady increase in quality, and health and safety performance, managers have seen a dramatic increase in employee engagement. Site supervisors reported a jump in the pride in workmanship, motivation and team work of those who had been through the training.
SUSTAINABILITY REVIEW CONTINUED

INTERSERVE ANNUAL REPORT 2014 STRATEGIC REPORT 37SUSTAINABILITY REVIEW
school for 12–18 year olds. The Trust assumed management of the Academy in September and is delivering a curriculum that seeks to equip school leavers with the necessary skills to thrive in the workplace.
Our people strategy is based around capability, leadership and people experience. Leadership development is an important part of our commitment to developing our people and maintaining our ability to sustain and grow our business. This year, we have launched new waves of our Trusted Partner Programme, now in its fourth year and aimed at our leadership population one and two tiers beneath our Executive Board; and our Ingenuity at Work Programme, in its second year and aimed at our leadership population three and four tiers beneath our Executive Board. These programmes focus on business projects that support near-term business performance and effectiveness as well as progress us towards our longer term business goals.
Career development and access to opportunities for training and skills development is an important focus for the Group. Over�the�past�year�we’ve�provided�52,109�training�days�for� our�people.�We’ve�also�invested�resources�in�defining�development pathways across our business from operational into management and strategic roles to clearly illustrate the potential development opportunities available to our people, whatever their level within the organisation.
In addition to the activity we’ve undertaken this year internally, we were keen to contribute to the wider debate about skills, productivity and pay. We wanted to investigate ways to unlock untapped potential in the workforce by giving the right support and opportunities to progress. We recognised this was a challenge that was bigger than any single company or sector and joined forces with the Social Market Foundation (SMF) to examine how skills could be put at the heart of tackling the low wage / limited opportunities cycle. As a result a report was launched in April calling for a radical new government-backed ‘Skills for Progress’ scheme to boost the skills and wages of those trapped in low pay.
We co-founded the FM Supply Chain Sustainability School, which was set up last year. This has enabled us to work in collaboration with our supply chain and help it to help us achieve our targets.
In December, we acquired The Employment and Skills Group (esg), further strengthening our focus on education and skills. esg is one of the UK’s largest private-sector providers of training and employment services and also provides vocational training in three new further education colleges in Saudi Arabia under the Kingdom’s Colleges of Excellence programme. With approximately 700 employees, esg supports over�65,000�people�a�year�into�work�or�training.�
CASE STUDY
LIGHT GAUGE STEEL ROLLED OUT IN OMAN
INTERSERVE’S OMAN-BASED CONSTRUCTION BUSINESS, DOUGLAS OHI, PARTNERED WITH LEADING STEEL PROVIDER, THE HADLEY GROUP, TO OFFER CLIENTS LIGHT GAUGE STEEL (LGS) – GALVANISED STEEL SHEETS ROLLED INTO DIFFERENT SECTIONS TO FORM A BUILDING’S STRUCTURAL FRAMEWORK.
The majority of the light-weight framing solution is manufactured from recycled steel with cold rolled sections of steel supplied in pre-cut bespoke lengths, reducing material wastage. LGS takes less time to construct and uses fewer natural resources than the traditional steel alternative. On-site noise pollution is also vastly reduced because cutting is virtually eliminated, reducing CO2 emissions. The use of LSG also reduces construction time by around 30 per cent and has long-term�environmental�benefits,�with�better�thermal�insulation compared to a traditional build. Steel is 100 per cent recyclable and uses 60 per cent less energy to convert from scrap than iron ore. Douglas OHI and the Hadley Group recycle all galvanised steel removed in the production process and only source from suppliers who can prove the use of old steel to make new.
OVERVIEW
GO
VERNA
NCE
STRATEGIC REPO
RT FIN
AN
CIAL STATEM
ENTS

38 INTERSERVE ANNUAL REPORT 2014 STRATEGIC REPORT SUSTAINABILITY REVIEW
STRATEGIC REPORT
NATURAL CAPITALWorking with clients in the built environment, we take our social and environmental responsibilities very seriously and through our SustainAbilities Plan have made a commitment to go beyond compliance and aim to make a positive difference both through our own operations and the work we undertake for clients.
We�have�identified�the�following�key�environmental�risks/opportunities�for�our�SustainAbilities programme to address:
– CO2e emissions from our use of energy including electricity, gas, fuel and travel– Waste management – generation, treatment and disposal– Water use and scarcity – Damage to natural ecosystems – biodiversity, air, land and water
Natural Capital Target
Absolute 2014 Performance vs. 2013
2014 2013* Absolute Relative
Total carbon emissions UK50%�reduction�by�2020
65.2 61.3 +6.3% -0.1%Metric: tonnes CO2e (000’s) ROW 224.1 223.6 +0.2% -7.1%Emissions from energy use on permanent sites UK
50%�reduction�by�20208.7 8.5 +2.6% -3.5%
Metric: tonnes CO2e (000’s) ROW 54.9 50.7 +8.3% +0.4%Emissions from business travel UK
30%�reduction�by�201649.7 46.1 +7.9% +1.5%
Metric: tonnes CO2e (000’s) ROW 89.0 70.8 +25.8% +16.5%Emissions from construction site-based electricity generation UK
30%�reduction�by�20161.5 2.0 -25.8% -30.2%
Metric: tonnes CO2e (000’s) ROW not currently available – we are developing processes to report this
Total water consumption UK 20%�reduction�by�2016 50.3 52.5 -4.3% -10.0%Metric: m3 (000’s) ROW 1,741.6 1,542.9 +12.9% +4.6%Construction waste UK
25%�reduction�by�201640.1 38.8 +4.7% -1.6%
Metric: tonnes (000’s) ROW 165.2 183.5 -10.0% -16.6%Office waste UK
50%�reduction�by�20161.2 1.3 -5.7% -11.3%
Metric: tonnes (000’s) ROW 3.9 3.6 +8.5% +0.5%
*�Previously�quoted�2013�figures�have�been�restated�to�take�into�account�significant�acquisitions�and�include�our�international�operations.�These�figures�form�our�2013 baseline for measuring performance against SustainAbilities targets.
Our overall environmental performance has shown some positive outcomes during 2014. Total carbon emissions including emissions from�our�international�subsidiaries�and�associates�increased�1.5�per�cent�to�289,251�tonnes�CO2e in 2014 (2013: 284,883), this equates to�a�4.8�per�cent�relative�reduction.�This�figure�can�be�broken�down�as�53�per�cent�Scope�1�(152,559�tonnes),�19�per�cent�Scope�2�(54,505�tonnes)�and�28�per�cent�Scope�3�(82,184).�
Scope 1 emissions are the direct emissions associated with fuel that we use and fugitive emissions. Scope 2 emissions are indirect emissions associated with the energy we use, predominantly emissions from the generation of the electricity we use. Scope 3 emissions�are�indirect�supply�chain�emissions�from�goods�and�services�we�use,�including�flights,�rail�and�grey�fleet�mileage.
In the UK we have achieved absolute reductions in our water consumption (down 4.3 per cent) and carbon emissions from construction�site-based�electricity�(down�25.8�per�cent).�Emissions�from�business�travel�and�fixed�locations�have�remained�broadly�consistent despite organic growth.
Our international operations, where we include natural capital impacts of accommodation for our c30,000 staff, account for the majority�of�our�environmental�impact.�However,�this�has�been�the�first�year�we�have�had�detailed�data�from�this�region�and�we� consider this to be an area of considerable opportunity for future reductions. We also recognise achieving the behavioural and operational�changes�required�to�meet�our�targets�will�take�time.�From�an�international�perspective,�there�was�significant�progress� made during 2014 in terms of employee engagement and understanding of our sustainability strategy. Every business has processes in�place�to�report�on�its�performance�and�a�more�comprehensive�set�of�data�to�use�to�take�decisions�on�during�2015.�
Our Khansaheb business in the UAE has reduced construction waste produced by over 20,000 tonnes compared to its 2013 baseline. This has been achieved in part through better planning for materials and site logistics due to the implementation of the ‘K’ standard and improved working practices through the introduction of the trade training school.
SUSTAINABILITY REVIEW CONTINUED
INTERSERVE ANNUAL REPORT 2014 STRATEGIC REPORT 39SUSTAINABILITY REVIEW
The achievements in the UK Construction site-based electricity emissions reductions are as a result of innovation and adopting new working practices and technologies. Our construction business developed and implemented a hybrid power system that enables us to reduce generator capacity on site and to further supplement it with photovoltaic, wind and other renewable sources.
We have developed a travel plan framework that can be used across the Group and provides a hierarchy for travel choices. We�are�also�targeting�local�emission�vehicles�within�our�fleet�and improving our IT infrastructure to support the use of alternatives to travel including desktop and video conferencing where practicable.
Working with Smiths Gore, Jacobs SKM and the University of Exeter, Landmarc has developed a pilot natural capital decision support tool that enables more intelligent land-use and environmental resource planning for our work on the Ministry of�Defence's�(MoD)�220,000�hectare�training�estate.�The�first�operational tool of its kind, it contains a mixture of natural capital, ecosystem services and constraint datasets covering two pilot training areas, Barry Budden in Scotland and Dartmoor in the South West.
We are committed to helping our clients by delivering our services in a way that minimises energy use and offers them ideas, expertise and solutions to build their resilience to energy outages, price spikes and scarcity.
FINANCIAL CAPITALAlongside�financial�performance,�our�commercial�and�procurement�decisions�have�a�significant�influence�over�our�achievement of the goals and targets within the SustainAbilities Plan. Over the past year we have focused on strengthening sustainable procurement policies and procedures. All UK operating divisions have incorporated sustainable procurement requirements into their supplier codes of conduct and have reviewed or adopted sustainable, ethical and responsible procurement policies.
During 2014 sustainability was further embedded into our tendering processes, which now includes more rigorous supplier selection criteria and relationship management, audits and risk management. Sustainability targets have also been integrated into the annual performance appraisals of central procurement staff. Our Al Manjara joinery business in Gulf Contracting achieved Forest Stewardship Council (FSC) certification�during�2014�for�supply�of�timber�products.�
Ultimately, sustainable growth recognises that value represents more�than�money�–�that�a�profitable�business�is�one�that�takes�into account the true cost and wider considerations of business to deliver sustained value for all. It is an aspiration increasingly shared by our customers and our stakeholders, and one which we have proven, through successive periods of improving financial�results.
OUR PEOPLEHealth and safetyInterserve adopts a formal and proactive approach to the management of health and safety throughout our operations. Senior directors have responsibility for health and safety in each division and together with divisional Heads of Safety meet quarterly to review performance and the various health and safety initiatives being undertaken. During the year we established a Board-level Serious Health and Safety Incident Committee to review our incident investigations and oversee the implementation of any improvement recommendations.
Our standard is for all operating businesses to implement safety management systems that meet the OHSAS 18001 standard. Across the world 93 per cent of our employees work under safety management�systems�certified�to�this�standard.�To�support�our�management systems, in the Middle East we have launched our Brownfield�Hotwork�Gold�Standard�and�our�Life�Saving�Rules�to�provide clear guidance on standards to operating staff.
Safety�performance�is�clearly�defined�as�a�line-management�responsibility and, together with formal management systems, we provide appropriate training and professional support to ensure managers are able to effectively discharge their duties. Proactive site visits and safety inspections are carried out by directors, management teams and safety advisers. Members of the Executive Board carried out a total of 126 site safety visits during the year and across the Group a total over 1,300 management safety tours were recorded. As a result of these and other�inspections�over�126,000�unsafe�conditions�were�identified�and corrected, preventing potential incidents.
We are regularly recognised for our contributions to delivering high standards of health and safety and in 2014 this included:
• Industrial Services achieved the British Safety Council Sword of Honour
• �Madina�received�RasGas�certificate�of�appreciation�for�commitment�to�achieving�25�million�man�hours�without� a lost-time incident
• Gulf Contracting received recognition from JGC Barzan Onshore�Project�for�contribution�to�‘250,000�observations’
• 31 RoSPA awards: three Presidents Award (for between 10 and 14 Gold Awards), 10 Gold Medals (for between five�and�nine�Gold�Awards),�and�12�Gold�Awards
• Carys Marwood received a RoSPA Guardian Angel Award.
The result of this proactive approach is that over the year our overall accident rates have reduced by eight per cent for lost-time injuries and 18 per cent for fatal and major injuries. However, our reportable�injury�incidence�rate�increased�by�five�per�cent�and�during the year we suffered one incident in the Middle East in which an individual suffered fatal injuries. A full investigation was carried out into the circumstances of the incident to ensure that lessons could be learned to prevent recurrence.
OVERVIEW
GO
VERNA
NCE
STRATEGIC REPO
RT FIN
AN
CIAL STATEM
ENTS
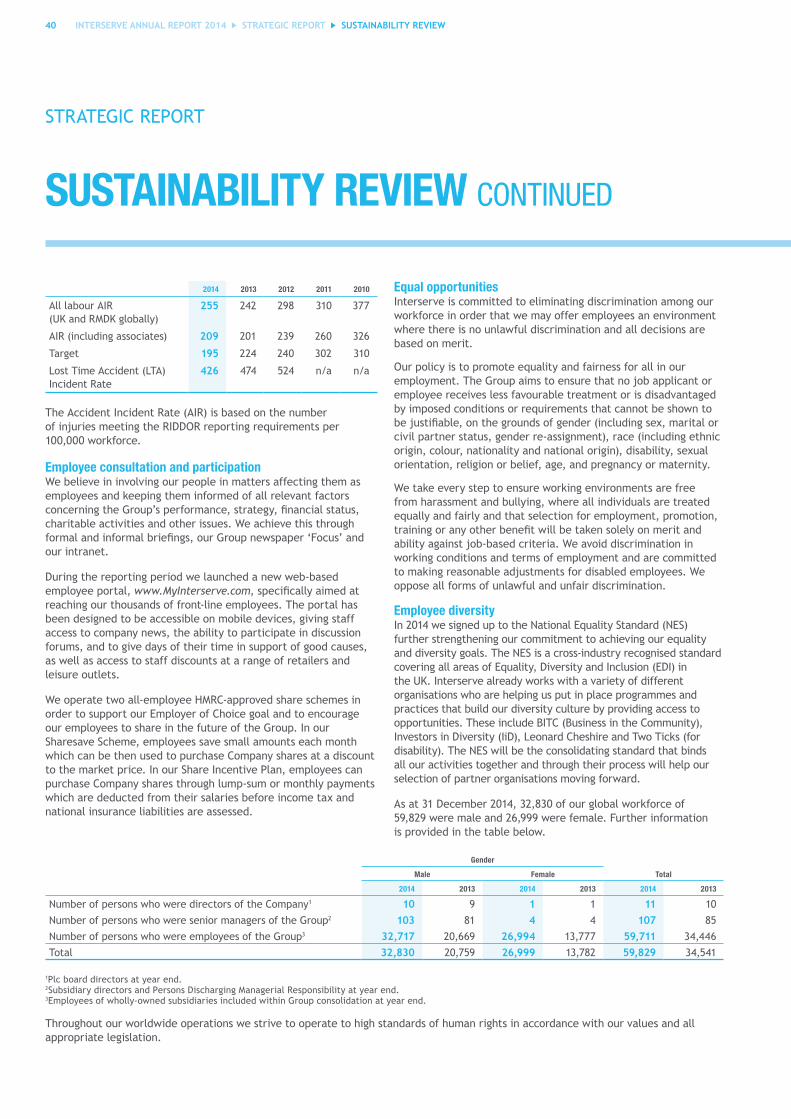
40 INTERSERVE ANNUAL REPORT 2014 STRATEGIC REPORT SUSTAINABILITY REVIEW
2014 2013 2012 2011 2010
All labour AIR (UK and RMDK globally)
255 242 298 310 377
AIR (including associates) 209 201 239 260 326
Target 195 224 240 302 310
Lost Time Accident (LTA) Incident Rate
426 474 524 n/a n/a
The Accident Incident Rate (AIR) is based on the number of injuries meeting the RIDDOR reporting requirements per 100,000 workforce.
Employee consultation and participationWe believe in involving our people in matters affecting them as employees and keeping them informed of all relevant factors concerning�the�Group’s�performance,�strategy,�financial�status,�charitable activities and other issues. We achieve this through formal�and�informal�briefings,�our�Group�newspaper�‘Focus’�and�our intranet.
During the reporting period we launched a new web-based employee portal, www.MyInterserve.com,�specifically�aimed�at�reaching our thousands of front-line employees. The portal has been designed to be accessible on mobile devices, giving staff access to company news, the ability to participate in discussion forums, and to give days of their time in support of good causes, as well as access to staff discounts at a range of retailers and leisure outlets.
We operate two all-employee HMRC-approved share schemes in order to support our Employer of Choice goal and to encourage our employees to share in the future of the Group. In our Sharesave Scheme, employees save small amounts each month which can be then used to purchase Company shares at a discount to the market price. In our Share Incentive Plan, employees can purchase Company shares through lump-sum or monthly payments which are deducted from their salaries before income tax and national insurance liabilities are assessed.
Equal opportunitiesInterserve is committed to eliminating discrimination among our workforce in order that we may offer employees an environment where there is no unlawful discrimination and all decisions are based on merit.
Our policy is to promote equality and fairness for all in our employment. The Group aims to ensure that no job applicant or employee receives less favourable treatment or is disadvantaged by imposed conditions or requirements that cannot be shown to be�justifiable,�on�the�grounds�of�gender�(including�sex,�marital�or�civil partner status, gender re-assignment), race (including ethnic origin, colour, nationality and national origin), disability, sexual orientation, religion or belief, age, and pregnancy or maternity.
We take every step to ensure working environments are free from harassment and bullying, where all individuals are treated equally and fairly and that selection for employment, promotion, training�or�any�other�benefit�will�be�taken�solely�on�merit�and�ability against job-based criteria. We avoid discrimination in working conditions and terms of employment and are committed to making reasonable adjustments for disabled employees. We oppose all forms of unlawful and unfair discrimination.
Employee diversityIn 2014 we signed up to the National Equality Standard (NES) further strengthening our commitment to achieving our equality and diversity goals. The NES is a cross-industry recognised standard covering all areas of Equality, Diversity and Inclusion (EDI) in the UK. Interserve already works with a variety of different organisations who are helping us put in place programmes and practices that build our diversity culture by providing access to opportunities. These include BITC (Business in the Community), Investors in Diversity (IiD), Leonard Cheshire and Two Ticks (for disability). The NES will be the consolidating standard that binds all our activities together and through their process will help our selection of partner organisations moving forward.
As at 31 December 2014, 32,830 of our global workforce of 59,829�were�male�and�26,999�were�female.�Further�information� is provided in the table below.
SUSTAINABILITY REVIEW CONTINUED
STRATEGIC REPORT
Gender
TotalMale Female
2014 2013 2014 2013 2014 2013
Number of persons who were directors of the Company1 10 9 1 1 11 10
Number of persons who were senior managers of the Group2 103 81 4 4 107 85
Number of persons who were employees of the Group3 32,717 20,669 26,994 13,777 59,711 34,446
Total 32,830 20,759 26,999 13,782 59,829 34,541
1Plc board directors at year end.2Subsidiary directors and Persons Discharging Managerial Responsibility at year end.3Employees of wholly-owned subsidiaries included within Group consolidation at year end.
Throughout our worldwide operations we strive to operate to high standards of human rights in accordance with our values and all appropriate legislation.

INTERSERVE ANNUAL REPORT 2014 STRATEGIC REPORT 41SUSTAINABILITY REVIEW
Our Equipment Services business, RMD Kwikform, has provided a range of shoring, propping and formwork solutions for the complex design and geometry of the 630,000 square metre main terminal building, which features a huge curved roof.
Curving horizontally and vertically, construction of the terminal building relies on achieving millimetre accuracy for the installation of specially fabricated segments to form steel arches and a central girder. As part of the construction planning process, RMD Kwikform engineers - working with the steel roof sub-contractor - used 3D modelling to design bespoke components for the phased erection of the arches.
This process included the design of a heavy-duty support system for the erection of the steel arches and a jacking frame. To ensure the frame was able to cope with the large loading forces and high winds and heat, the engineering teams used the latest modelling technology before components were then fabricated and tested.
RMD Kwikform also designed and supplied the support towers,�which�varied�in�height�from�15�to�45�metres.�
CASE STUDY
3D MODELLING KEY TO NEW ABU DHABI AIRPORT TERMINAL
CURRENTLY UNDER CONSTRUCTION, THE NEW MIDFIELD TERMINAL COMPLEX (MTC) AT ABU DHABI INTERNATIONAL AIRPORT WILL HAVE THE CAPACITY TO HANDLE MORE THAN 20 MILLION PASSENGERS A YEAR WHEN IT OPENS IN JULY 2017.
OVERVIEW
GO
VERNA
NCE
STRATEGIC REPO
RT FIN
AN
CIAL STATEM
ENTS

42 INTERSERVE ANNUAL REPORT 2014 STRATEGIC REPORT FINANCIAL REVIEW
STRATEGIC REPORT
SUMMARYFinancial highlights of 2014 included:
• �A�strong�trading�performance�with�Revenue�up�33�per�cent�(10�per�cent�organic)�and�Headline�Total�Operating�Profit�up� 35�per�cent�(9�per�cent�organic).
• Increase in Headline earnings per share of 23 per cent.
• Investment of £271.4 million in acquisitions to broaden our UK Facilities Management (FM) footprint (Initial Facilities) and enhance our skills and Welfare-to-Work expertise (esg).
• Further strengthening the balance sheet for the long term by:
• �enhancing�our�debt�facilities�with�a�10-year�$350�million�US�private�placement�and�extension�of�our�existing�bank� facilities to 2019; and
• completing�a�pension�buy-in�transaction�for�c35�per�cent�of�the�liabilities�of�the�Interserve�Pension�Scheme.
• Further investment for growth in capex and working capital.
REVENUE AND OPERATING PROFITConsolidated revenues increased by 33 per cent compared with 2013, and total gross revenues (including our share of joint ventures and associates) by 28 per cent.
UK Support Services, boosted by the March acquisition of Initial Facilities, delivered a strong performance with a 40 per cent increase in revenues (3 per cent organic). The International Support Services division revenues also increased sharply to £157.2�million�as�we�continued�the�integration�of�our�regional�services�offering�and�benefitted�from�a�full-year�contribution�of�Adyard. The upturn in UK Construction market activity levels and�a�strong�performance�by�our�Paragon�fit-out�business�helped�drive an increase in revenues of 21 per cent (18 per cent organic). Middle East construction markets remained resilient with 1 per cent revenue growth on a constant currency basis. Equipment Services�benefitted�from�further�investment�and�generally�improving�markets�to�show�revenue�growth�of�15�per�cent.
Full-year operating margin of 4.0 per cent (2013: 4.0 per cent) reflects�a�number�of�differing�trends�within�divisions.�Support�Services UK delivered an operating margin of 4.8 per cent, a slight improvement on the 2013 outturn of 4.7 per cent. International Support Services made further progress with margins rising to 4.8 per cent (2013: 4.4 per cent). UK Construction margins fell to 1.6 per cent (2013: 1.8 per cent), remaining within our guided range�but�reflecting�the�supply�chain�pressures�currently�present�within the market. Margins in our International Construction operations�held�up�well�in�difficult�markets,�declining�slightly�to�4.7�per�cent�(2013:�5.1�per�cent).�Market�conditions�and�tender�opportunities are generally improved from 2013 but markets remain�tight.�Equipment�Services�continued�to�show�the�benefits�of a high operational gearing as margins rose further to 13.6 per cent (2013: 11.9 per cent).
Average and closing exchange rates used in the preparation of these results were:
Average rates Closing rates
2014 2013 2014 2013
US dollar 1.65 1.57 1.55 1.65
Australian dollar 1.83 1.63 1.90 1.86
Qatar Rial 5.99 5.72 5.65 6.00
Omani Rial 0.63 0.60 0.60 0.63
UAE Dirham 6.04 5.76 5.70 6.06
At 2013 average rates the Group would have generated an additional�£2.3�million�of�Total�Operating�Profit.
INVESTMENT REVENUE AND FINANCE COSTSThe net interest charge for the year of £11.0 million can be analysed as follows:
£million 2014 2013
Net interest on Group debt (12.1) (4.8)
Interest receivable from PFI sub-debt 0.8 0.6
Pension�finance�credit/(charge) 0.3 (1.4)
Group net interest charge (11.0) (5.6)
Driven predominantly by the acquisition of Initial Facilities, the average net debt for the year was £240.8 million (2013: £14.9 million) and this increase can be seen in the higher net interest charge on Group debt. Allowing for the timing of the payment of the consideration for Initial Facilities, there was no material difference between average and year end net debt levels.
FINANCIAL REVIEW
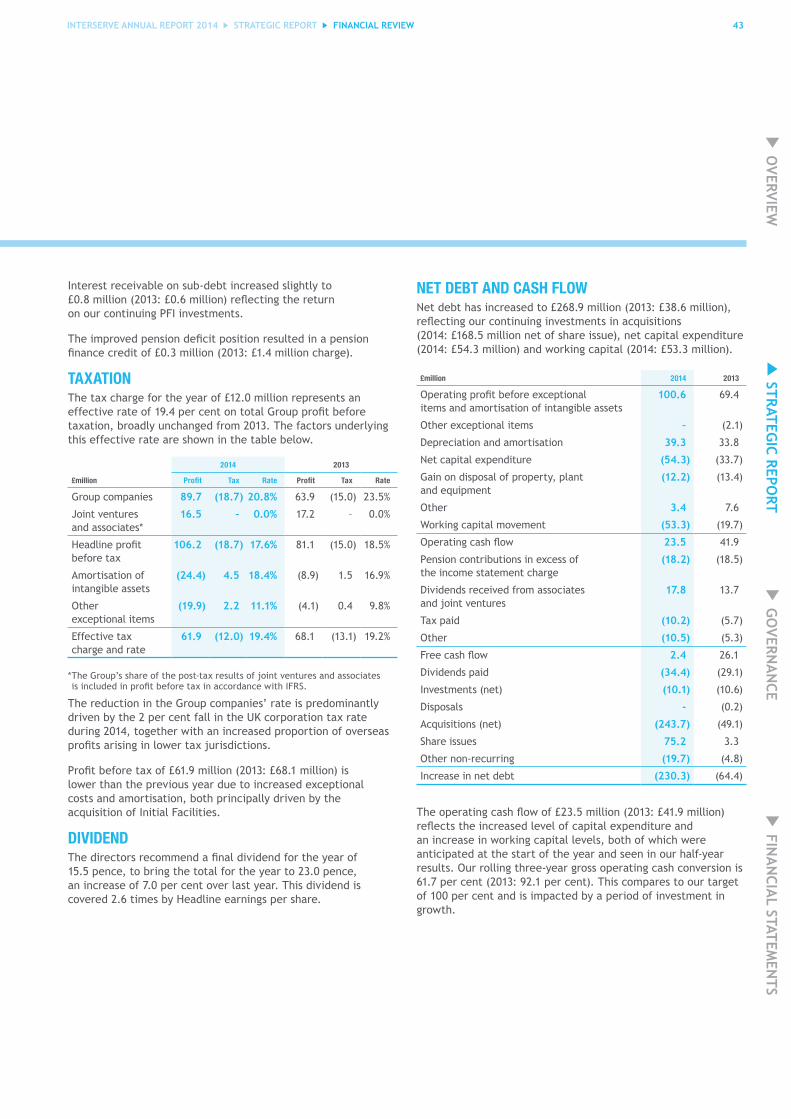
INTERSERVE ANNUAL REPORT 2014 STRATEGIC REPORT 43FINANCIAL REVIEW
Interest receivable on sub-debt increased slightly to £0.8�million�(2013:�£0.6�million)�reflecting�the�return� on our continuing PFI investments.
The�improved�pension�deficit�position�resulted�in�a�pension�finance�credit�of�£0.3�million�(2013:�£1.4�million�charge).
TAXATIONThe tax charge for the year of £12.0 million represents an effective�rate�of�19.4�per�cent�on�total�Group�profit�before�taxation, broadly unchanged from 2013. The factors underlying this effective rate are shown in the table below.
£million
2014 2013
Profit Tax Rate Profit Tax Rate
Group companies 89.7 (18.7) 20.8% 63.9 (15.0) 23.5%
Joint ventures and associates*
16.5 – 0.0% 17.2 – 0.0%
Headline�profit�before tax
106.2 (18.7) 17.6% 81.1 (15.0) 18.5%
Amortisation of intangible assets
(24.4) 4.5 18.4% (8.9) 1.5 16.9%
Other exceptional items
(19.9) 2.2 11.1% (4.1) 0.4 9.8%
Effective tax charge and rate
61.9 (12.0) 19.4% 68.1 (13.1) 19.2%
* The Group’s share of the post-tax results of joint ventures and associates is�included�in�profit�before�tax�in�accordance�with�IFRS.
The reduction in the Group companies’ rate is predominantly driven by the 2 per cent fall in the UK corporation tax rate during 2014, together with an increased proportion of overseas profits�arising�in�lower�tax�jurisdictions.
Profit�before�tax�of�£61.9�million�(2013:�£68.1�million)�is� lower than the previous year due to increased exceptional costs and amortisation, both principally driven by the acquisition of Initial Facilities.
DIVIDENDThe�directors�recommend�a�final�dividend�for�the�year�of� 15.5�pence,�to�bring�the�total�for�the�year�to�23.0�pence,� an increase of 7.0 per cent over last year. This dividend is covered 2.6 times by Headline earnings per share.
NET DEBT AND CASH FLOWNet debt has increased to £268.9 million (2013: £38.6 million), reflecting�our�continuing�investments�in�acquisitions� (2014:�£168.5�million�net�of�share�issue),�net�capital�expenditure�(2014:�£54.3�million)�and�working�capital�(2014:�£53.3�million).
£million 2014 2013
Operating�profit�before�exceptional� items and amortisation of intangible assets
100.6 69.4
Other exceptional items – (2.1)
Depreciation and amortisation 39.3 33.8
Net capital expenditure (54.3) (33.7)
Gain on disposal of property, plant and equipment
(12.2) (13.4)
Other 3.4 7.6
Working capital movement (53.3) (19.7)
Operating�cash�flow 23.5 41.9
Pension contributions in excess of the income statement charge
(18.2) (18.5)
Dividends received from associates and joint ventures
17.8 13.7
Tax paid (10.2) (5.7)
Other (10.5) (5.3)
Free�cash�flow 2.4 26.1
Dividends paid (34.4) (29.1)
Investments (net) (10.1) (10.6)
Disposals - (0.2)
Acquisitions (net) (243.7) (49.1)
Share issues 75.2 3.3
Other non-recurring (19.7) (4.8)
Increase in net debt (230.3) (64.4)
The�operating�cash�flow�of�£23.5�million�(2013:�£41.9�million)�reflects�the�increased�level�of�capital�expenditure�and�an increase in working capital levels, both of which were anticipated at the start of the year and seen in our half-year results. Our rolling three-year gross operating cash conversion is 61.7 per cent (2013: 92.1 per cent). This compares to our target of 100 per cent and is impacted by a period of investment in growth.
OVERVIEW
GO
VERNA
NCE
STRATEGIC REPO
RT FIN
AN
CIAL STATEM
ENTS
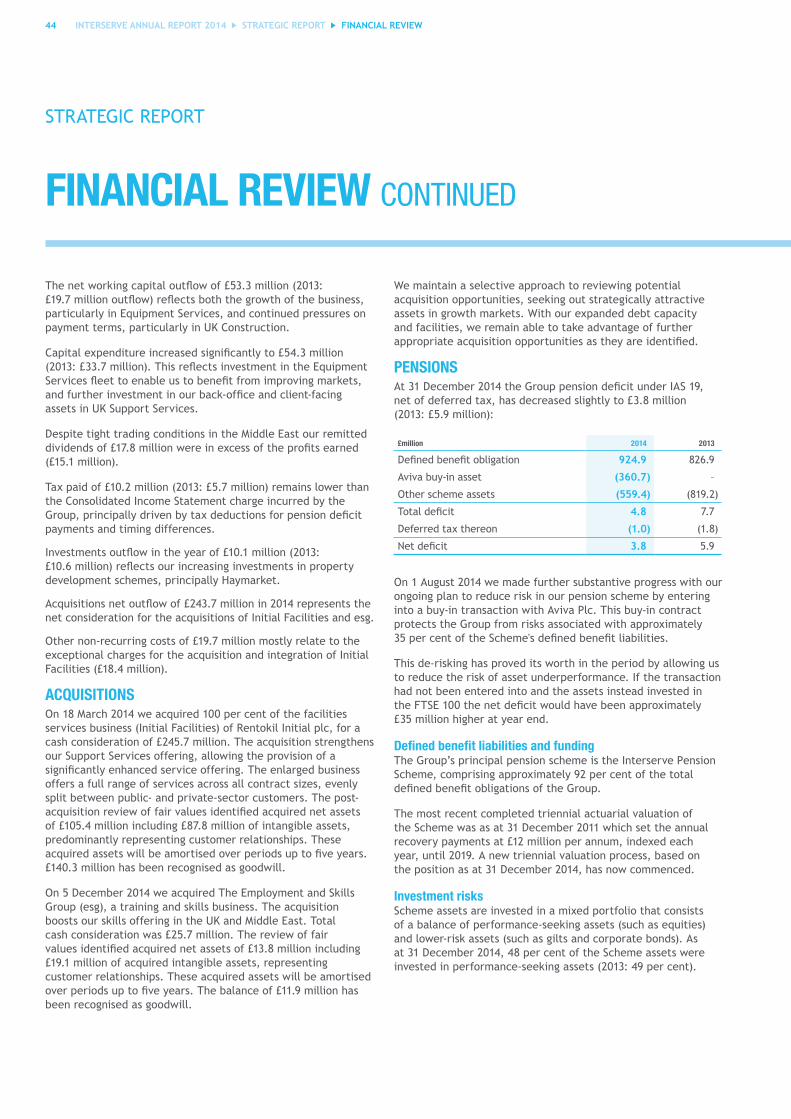
44 INTERSERVE ANNUAL REPORT 2014 STRATEGIC REPORT
The�net�working�capital�outflow�of�£53.3�million�(2013:�£19.7�million�outflow)�reflects�both�the�growth�of�the�business,�particularly in Equipment Services, and continued pressures on payment terms, particularly in UK Construction.
Capital�expenditure�increased�significantly�to�£54.3�million�(2013:�£33.7�million).�This�reflects�investment�in�the�Equipment�Services�fleet�to�enable�us�to�benefit�from�improving�markets,�and�further�investment�in�our�back-office�and�client-facing�assets in UK Support Services.
Despite tight trading conditions in the Middle East our remitted dividends�of�£17.8�million�were�in�excess�of�the�profits�earned�(£15.1�million).
Tax�paid�of�£10.2�million�(2013:�£5.7�million)�remains�lower�than�the Consolidated Income Statement charge incurred by the Group,�principally�driven�by�tax�deductions�for�pension�deficit�payments and timing differences.
Investments�outflow�in�the�year�of�£10.1�million�(2013:�£10.6�million)�reflects�our�increasing�investments�in�property�development schemes, principally Haymarket.
Acquisitions�net�outflow�of�£243.7�million�in�2014�represents�the�net consideration for the acquisitions of Initial Facilities and esg.
Other non-recurring costs of £19.7 million mostly relate to the exceptional charges for the acquisition and integration of Initial Facilities (£18.4 million).
ACQUISITIONSOn 18 March 2014 we acquired 100 per cent of the facilities services business (Initial Facilities) of Rentokil Initial plc, for a cash�consideration�of�£245.7�million.�The�acquisition�strengthens�our Support Services offering, allowing the provision of a significantly�enhanced�service�offering.�The�enlarged�business�offers a full range of services across all contract sizes, evenly split between public- and private-sector customers. The post-acquisition�review�of�fair�values�identified�acquired�net�assets�of�£105.4�million�including�£87.8�million�of�intangible�assets,�predominantly representing customer relationships. These acquired�assets�will�be�amortised�over�periods�up�to�five�years.�£140.3 million has been recognised as goodwill.
On�5�December�2014�we�acquired�The�Employment�and�Skills�Group (esg), a training and skills business. The acquisition boosts our skills offering in the UK and Middle East. Total cash�consideration�was�£25.7�million.�The�review�of�fair�values�identified�acquired�net�assets�of�£13.8�million�including�£19.1 million of acquired intangible assets, representing customer relationships. These acquired assets will be amortised over�periods�up�to�five�years.�The�balance�of�£11.9�million�has�been recognised as goodwill.
We maintain a selective approach to reviewing potential acquisition opportunities, seeking out strategically attractive assets in growth markets. With our expanded debt capacity and facilities, we remain able to take advantage of further appropriate�acquisition�opportunities�as�they�are�identified.
PENSIONSAt�31�December�2014�the�Group�pension�deficit�under�IAS�19,� net of deferred tax, has decreased slightly to £3.8 million (2013:�£5.9�million):�
£million 2014 2013
Defined�benefit�obligation 924.9 826.9
Aviva buy-in asset (360.7) –
Other scheme assets (559.4) (819.2)
Total�deficit 4.8 7.7
Deferred tax thereon (1.0) (1.8)
Net�deficit 3.8 5.9
On 1 August 2014 we made further substantive progress with our ongoing plan to reduce risk in our pension scheme by entering into a buy-in transaction with Aviva Plc. This buy-in contract protects the Group from risks associated with approximately 35�per�cent�of�the�Scheme's�defined�benefit�liabilities.�
This de-risking has proved its worth in the period by allowing us to reduce the risk of asset underperformance. If the transaction had not been entered into and the assets instead invested in the�FTSE�100�the�net�deficit�would�have�been�approximately� £35�million�higher�at�year�end.
Defined benefit liabilities and fundingThe Group’s principal pension scheme is the Interserve Pension Scheme, comprising approximately 92 per cent of the total defined�benefit�obligations�of�the�Group.�
The most recent completed triennial actuarial valuation of the Scheme was as at 31 December 2011 which set the annual recovery payments at £12 million per annum, indexed each year, until 2019. A new triennial valuation process, based on the position as at 31 December 2014, has now commenced.
Investment risksScheme assets are invested in a mixed portfolio that consists of a balance of performance-seeking assets (such as equities) and lower-risk assets (such as gilts and corporate bonds). As at 31 December 2014, 48 per cent of the Scheme assets were invested in performance-seeking assets (2013: 49 per cent).
FINANCIAL REVIEW
STRATEGIC REPORT
FINANCIAL REVIEW CONTINUED

INTERSERVE ANNUAL REPORT 2014 STRATEGIC REPORT 45FINANCIAL REVIEW
The agreed investment objectives of the Scheme are:
• �to�secure,�with�a�high�degree�of�certainty,�liabilities�in�respect�of�all�defined�benefit�members;�and
• to adopt a long-term strategy which aims to capture outperformance from equities and move gradually into bonds�to�reflect�the�increasing�maturity�of�the�defined�benefit�membership�with�a�view�to�reducing�the�volatility� of investment returns.
The�majority�of�equities�held�by�the�Scheme�are�in�international�blue-chip�entities.�The�aim�is�to�hold�a�globally�diversified� portfolio�of�equities,�with�an�ultimate�target�of�50�per�cent�of�equities�being�held�in�UK�and�50�per�cent�in�US,�European�and� Asia-Pacific�equities.
IAS 19 assumptions and sensitivitiesAssumptions adopted in assessment of the income statement charge and funding position under IAS 19 are reviewed by our actuarial advisers, Lane Clark & Peacock LLP.
The�principal�sensitivities�to�the�assumptions�made�with�regard�to�the�balance�sheet�deficit�are�as�follows:
Assumption adopted
Sensitivity Indicative change in liabilities2014 2013
Key financial assumptionsDiscount rate 3.6% 4.5% +/-�0.5% -/+�6% -/+�£55mRPI / CPI 3.1% / 2.1% 3.4%�/�2.4% +/-�0.5% +/-�8% +/- £73m
Life expectancy (years)Current pensioners1
Men 87.5 87.4
+ 1 year +3% +£30mWomen 89.5 89.4
Future pensioners2
Men 89.3 89.2Women 91.0 90.9
1Life�expectancy�of�a�current�pensioner�aged�65.2Life�expectancy�at�age�65�for�an�employee�currently�aged�45.
Opening deficit
£ mill
ion
Service cost & administration
expenses
Contributions Tax movement
Change in liabilities
Return on assets
Closing deficit
Movement in net pension deficit
0.0
-100
-60
-40
-20
-120
-80
5.9 3.89.2
87.1
27.8
0.8
71.4
}
OVERVIEW
GO
VERNA
NCE
STRATEGIC REPO
RT FIN
AN
CIAL STATEM
ENTS
46 INTERSERVE ANNUAL REPORT 2014 STRATEGIC REPORT
TREASURY RISK MANAGEMENTWe operate a centralised Treasury function whose primary role is to manage interest rate, liquidity and foreign exchange risks. The�Treasury�function�is�not�a�profit�centre�and�it�does�not�enter�into�speculative�transactions.�It�aims�to�reduce�financial�risk� by the use of hedging instruments, operating within a framework of policies and guidelines approved by the Board.
Liquidity riskWe�seek�to�maintain�sufficient�facilities�to�ensure�access�to�funding�for�our�current�and�anticipated�future�requirements,� determined from budgets and medium-term plans.
Following�the�acquisition�of�Initial�Facilities,�and�the�resulting�step�change�in�Group�debt,�we�have�put�in�place�a�$350�million�US�private�placement.�These�loan�instruments�have�a�weighted�average�maturity�of�mid-2024�and�are�fully�hedged�into�a�fixed�interest�rate�sterling�amount.�Additionally�we�have�access�to�committed�revolving�bank�facilities�totalling�£250�million,�which�were�extended�during the year until February 2019.
Our�aggregate�finance�facilities�therefore�stand�at�c£450�million�with�£250�million�of�this�available�until�February�2019�and�the�remainder available on average until mid-2024.
Market price riskThe objectives of our interest rate policy are to match funding costs with operational revenue performance and to ensure that adequate interest cover is maintained, in line with Board-approved targets and banking covenants.
Our�borrowings�under�the�US�private�placement�are�denominated�in�US�dollars�and�subject�to�fixed�interest�rates.�These�are� fully�hedged�back�into�a�sterling�fixed�rate�with�FX�swaps�lasting�for�the�duration�of�the�loan�period.�
Our�other�borrowings�are�principally�denominated�in�sterling�and�mostly�subject�to�floating�rates�of�interest�linked�to�LIBOR.� We have in place interest rate caps and swaps which limit interest rate risk. The weighted average duration to maturity of these instruments is approximately seven months.
Foreign currency riskTransactional currency translationThe revenues and costs of our trading entities are typically denominated in their functional currency. Where a material trade is transacted in a non-functional currency, the entity is required to take out instruments through the centralised Treasury function to offset the currency exposure. The instruments used will normally be forward currency contracts. The impact of retranslating any entity’s non-functional currency balances into its functional currency was not material.
Consolidation currency translationWe do not hedge the impact of translating overseas entities' trading results or net assets into the consolidation currency.
In�preparing�the�consolidated�financial�statements,�profits�and�losses�from�overseas�activities�are�translated�at�the�average� exchange rates applying during the year. The average rates used in this process are disclosed on page 42.
The balance sheets of our overseas entities are translated at the year-end exchange rates. The impact of changes in the year-end exchange�rates,�compared�to�the�rates�used�in�preparing�the�2013�consolidated�financial�statements,�has�led�to�an�increase�in�consolidated net assets of £12.8 million (2013: £13.0 million decrease).
FINANCIAL REVIEW
STRATEGIC REPORT
FINANCIAL REVIEW CONTINUED
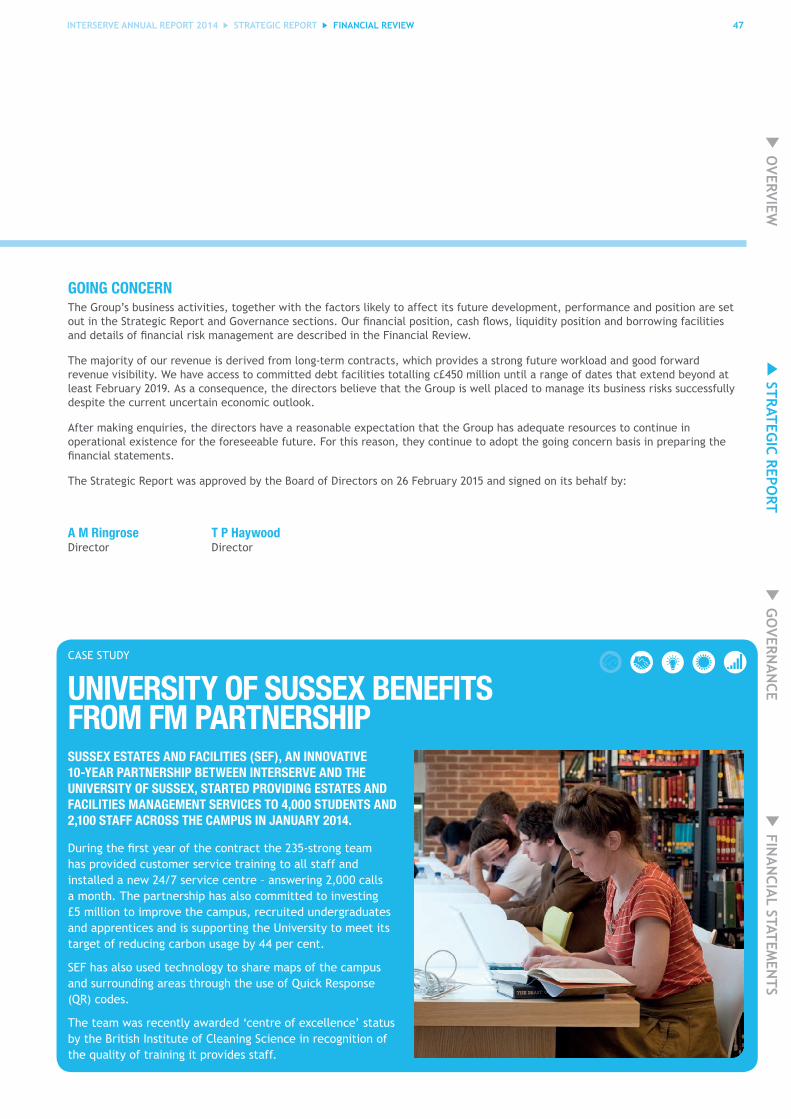
INTERSERVE ANNUAL REPORT 2014 STRATEGIC REPORT 47
GOING CONCERN The Group’s business activities, together with the factors likely to affect its future development, performance and position are set out�in�the�Strategic�Report�and�Governance�sections.�Our�financial�position,�cash�flows,�liquidity�position�and�borrowing�facilities� and�details�of�financial�risk�management�are�described�in�the�Financial�Review.
The majority of our revenue is derived from long-term contracts, which provides a strong future workload and good forward revenue�visibility.�We�have�access�to�committed�debt�facilities�totalling�c£450�million�until�a�range�of�dates�that�extend�beyond�at�least February 2019. As a consequence, the directors believe that the Group is well placed to manage its business risks successfully despite the current uncertain economic outlook.
After making enquiries, the directors have a reasonable expectation that the Group has adequate resources to continue in operational existence for the foreseeable future. For this reason, they continue to adopt the going concern basis in preparing the financial�statements.
The�Strategic�Report�was�approved�by�the�Board�of�Directors�on�26�February�2015�and�signed�on�its�behalf�by:
A M Ringrose T P HaywoodDirector Director
FINANCIAL REVIEW
SUSSEX ESTATES AND FACILITIES (SEF), AN INNOVATIVE 10-YEAR PARTNERSHIP BETWEEN INTERSERVE AND THE UNIVERSITY OF SUSSEX, STARTED PROVIDING ESTATES AND FACILITIES MANAGEMENT SERVICES TO 4,000 STUDENTS AND 2,100 STAFF ACROSS THE CAMPUS IN JANUARY 2014.
During�the�first�year�of�the�contract�the�235-strong�team�has provided customer service training to all staff and installed a new 24/7 service centre – answering 2,000 calls a month. The partnership has also committed to investing £5�million�to�improve�the�campus,�recruited�undergraduates�and apprentices and is supporting the University to meet its target of reducing carbon usage by 44 per cent.
SEF has also used technology to share maps of the campus and surrounding areas through the use of Quick Response (QR) codes.
The team was recently awarded ‘centre of excellence’ status by the British Institute of Cleaning Science in recognition of the quality of training it provides staff.
CASE STUDY
UNIVERSITY OF SUSSEX BENEFITS FROM FM PARTNERSHIP
OVERVIEW
GO
VERNA
NCE
STRATEGIC REPO
RT FIN
AN
CIAL STATEM
ENTS

48 INTERSERVE ANNUAL REPORT 2014 GOVERNANCE DIRECTORS
GOVERNANCE
DIRECTORS
NORMAN BLACKWELL (LORD BLACKWELL) 1 3 ChairmanNorman was appointed Chairman of Interserve in January 2006 having joined the Group as a non-executive director the previous September. A former partner of McKinsey & Company, Norman was Head of the Prime Minister’s Policy Unit from 1995 to 1997 and was appointed a life peer in 1997. He was appointed Chairman of Lloyds Banking Group in April 2014, having served as a non-executive director since June 2012. He was also Chairman of Lloyds’ insurance business, Scottish Widows, from September 2012 to June 2014. Norman has held a number of other senior positions in banking and insurance including Director of Group Development at NatWest and Senior Independent Director at Standard Life. Other past business roles include non-executive directorships at Halma, SEGRO and the Dixons Group. He has also served on the boards of OFCOM, the Centre for Policy Studies and the Office of Fair Trading. Norman also chairs the Nomination Committee.
ADRIAN RINGROSE 1
Chief ExecutiveAdrian has been Chief Executive of Interserve since 2003 during which time the Group has developed significantly, from c15,000 to c80,000 people, with operations in over 40 countries providing services to governments and a range of commercial and industrial clients. Adrian’s background is in commercial management and business development. Prior to leading Interserve he spent time in the outsourcing and utilities sectors. Adrian is a member of the CBI President’s Committee and was for four years chairman of the CBI’s Public Services Strategy Board until late 2013. He is also a past President of the Business Services Association. He is a member of the Chartered Institute of Marketing, a Fellow of the Chartered Management Institute and a Fellow of the Institute of Directors. He is an adviser to the University of Liverpool from where he has a degree in Political Theory and Institutions.
TIM HAYWOODGroup Finance DirectorTim joined Interserve as Group Finance Director in November 2010 and was previously Finance Director of St Modwen Properties. He is also a non-executive director of Tarsus Group. Earlier roles include Group Finance Director at Hagemeyer UK and senior finance director and financial controller positions in Williams Holdings. Tim is a Fellow of the Institute of Chartered Accountants in England and Wales. Since 2011 he has also been Head of Sustainability, launching Interserve’s SustainAbilities Plan in March 2013. He is a member of the sustainability committee of the Institute of Chartered Accountants in England and Wales and of the Enterprise Leadership Team of Business in the Community.
1 Member of the Nomination Committee
2 Member of the Audit Committee
3 Member of the Remuneration Committee
4 Senior Independent Director
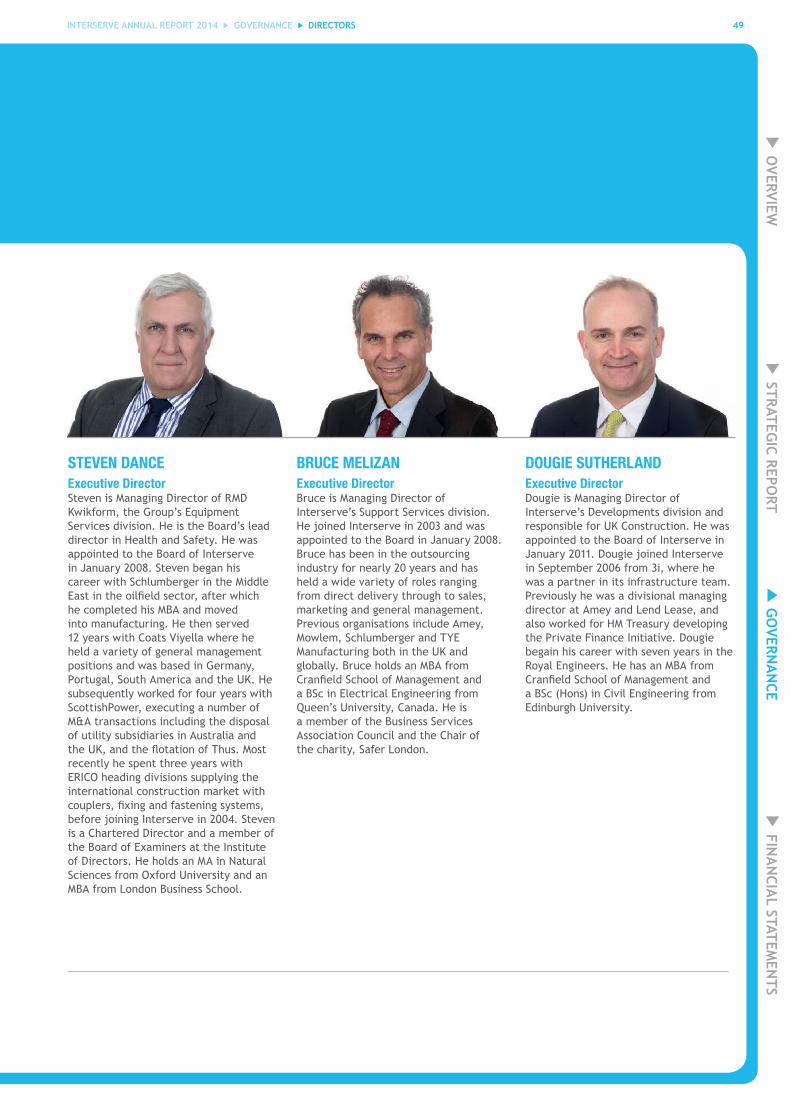
INTERSERVE ANNUAL REPORT 2014 GOVERNANCE 49DIRECTORS
STEVEN DANCEExecutive Director Steven is Managing Director of RMD Kwikform, the Group’s Equipment Services division. He is the Board’s lead director in Health and Safety. He was appointed to the Board of Interserve in January 2008. Steven began his career with Schlumberger in the Middle East in the oilfield sector, after which he completed his MBA and moved into manufacturing. He then served 12 years with Coats Viyella where he held a variety of general management positions and was based in Germany, Portugal, South America and the UK. He subsequently worked for four years with ScottishPower, executing a number of M&A transactions including the disposal of utility subsidiaries in Australia and the UK, and the flotation of Thus. Most recently he spent three years with ERICO heading divisions supplying the international construction market with couplers, fixing and fastening systems, before joining Interserve in 2004. Steven is a Chartered Director and a member of the Board of Examiners at the Institute of Directors. He holds an MA in Natural Sciences from Oxford University and an MBA from London Business School.
BRUCE MELIZANExecutive Director Bruce is Managing Director of Interserve’s Support Services division. He joined Interserve in 2003 and was appointed to the Board in January 2008. Bruce has been in the outsourcing industry for nearly 20 years and has held a wide variety of roles ranging from direct delivery through to sales, marketing and general management. Previous organisations include Amey, Mowlem, Schlumberger and TYE Manufacturing both in the UK and globally. Bruce holds an MBA from Cranfield School of Management and a BSc in Electrical Engineering from Queen’s University, Canada. He is a member of the Business Services Association Council and the Chair of the charity, Safer London.
DOUGIE SUTHERLANDExecutive DirectorDougie is Managing Director of Interserve’s Developments division and responsible for UK Construction. He was appointed to the Board of Interserve in January 2011. Dougie joined Interserve in September 2006 from 3i, where he was a partner in its infrastructure team. Previously he was a divisional managing director at Amey and Lend Lease, and also worked for HM Treasury developing the Private Finance Initiative. Dougie begain his career with seven years in the Royal Engineers. He has an MBA from Cranfield School of Management and a BSc (Hons) in Civil Engineering from Edinburgh University.
OVERVIEW
GO
VERNA
NCE
FINA
NCIA
L STATEMEN
TS STRATEG
IC REPORT

50 INTERSERVE ANNUAL REPORT 2014 GOVERNANCE
GOVERNANCE
LES CULLEN 1 2 3 4
Non-Executive DirectorLes brings a wealth of experience from a number of senior financial roles in the UK and internationally. He joined Interserve as a non-executive director in October 2005. He is a non-executive director of F&C Global Smaller Companies. He has held the post of Group Finance Director at De La Rue, Inchcape and Prudential. Les became Senior Independent Director in May 2013.
ANNE FAHY 1 2 3
Non-Executive DirectorAnne was appointed as non-executive director of Interserve on 1 January 2013. She is also Chief Financial Officer of BP’s Aviation Fuels business. During her 26 years at BP Anne has gained extensive experience of global business, developing markets, risk management, internal control, compliance and strategy development in BP’s aviation, petrochemicals, trading and retail sectors. Anne is a Fellow of the Institute of Chartered Accountants in Ireland having worked at KPMG in Ireland and Australia prior to joining BP in 1988. Anne has chaired the Audit Committee since May 2013.
RUSSELL KING 1 2 3
Non-Executive DirectorRussell joined Interserve as a non-executive director on 1 September 2014. He is Non-Executive Chairman of Hummingbird Resources, Senior Independent Director and Remuneration Committee Chairman of both Aggreko and Spectris, and a non-executive director of Sepura. Until June 2014 Russell was Chairman of GeoProMining. Between 2007 and late 2009 he was a non-executive director of Anglo Platinum and Chairman of Bergteamet between 2011 and 2012. Russell held various general management roles at ICI, followed by eight years at Anglo American as Executive Vice President of Group Human Resources and Business Development, and from 2009 as Chief Strategy Officer.
GOVERNANCE
DIRECTORS CONTINUED
1 Member of the Nomination Committee
2 Member of the Audit Committee
3 Member of the Remuneration Committee
4 Senior Independent Director
DIRECTORS

INTERSERVE ANNUAL REPORT 2014 GOVERNANCE 51
KEITH LUDEMAN 1 2 3
Non-Executive DirectorKeith was appointed as non-executive director of Interserve in January 2011. He is non-executive Chairman of Eversholt Rail Group and Bristol Water, a director of European Rail Finance (GB) and a director/trustee of the London Transport Museum. Keith is also a former non-executive director of Network Rail, Network Rail Infrastructure and Network Rail Consulting. Keith has many years’ experience in the rail and bus service industries, including some 15 years with Go-Ahead Group, of which he was Chief Executive for five years and where he was responsible for the negotiation and operation of complex public-service contracts and the management and motivation of large workforces. His early career included nine years working with Greater Manchester Transport and three years working on transport policy in Hong Kong. Keith has chaired the Remuneration Committee since July 2014.
NICK SALMON 1 2 3
Non-Executive DirectorNick was appointed as non-executive director of Interserve on 1 August 2014. He brings a wealth of experience from a number of senior roles. In October 2014 Nick was appointed as a non-executive director of Elementis and became Senior Independent Director in December 2014. He has also been appointed as a non-executive director of Acal with effect from 1 March 2015. Nick served as the Senior Independent Director of United Utilities Group from 2007 to 2014. He was Chief Executive of Cookson Group from 2004 until the end of 2012 and prior to that an Executive Vice President of Alstom SA and Chief Executive of Babcock International Group.
DIRECTORS
ADVISERSGroup Company SecretaryTrevor Bradbury
Registered OfficeInterserve House Ruscombe Park Twyford Reading Berkshire RG10 9JU T +44 (0)118 932 0123 F +44 (0)118 932 0206 [email protected] www.interserve.com
Registered Number88456
Registrar and Share Transfer OfficeCapita Asset Services The Registry 34 Beckenham Road Beckenham Kent BR3 4TU T +44 (0)20 8639 3399 F +44 (0)1484 600911 [email protected] www.capitashareportal.com
AuditorsGrant Thornton UK LLP
StockbrokersJ.P. Morgan Cazenove Limited Numis Securities Limited
LawyersAshurst LLP
OVERVIEW
GO
VERNA
NCE
FINA
NCIA
L STATEMEN
TS STRATEG
IC REPORT
52 INTERSERVE ANNUAL REPORT 2014 GOVERNANCE
GOVERNANCE
DIRECTORS’ REPORT
DIRECTORS’ REPORT
The directors present their report and the audited consolidated financial statements for the year ended 31 December 2014.
SCOPE OF REPORTINGFor the purposes of compliance with paragraphs 4.1.5R(2) and 4.1.8R of the Disclosure and Transparency Rules of the Financial Conduct Authority (the “FCA”), the required content of the “management report” can be found in the Strategic Report and this Directors’ Report (including the sections of the Annual Report and Accounts incorporated by reference).
The directors’ responsibility for the preparation of the Annual Report and Financial Statements, which forms part of this report, and the statement by the auditors about their reporting responsibilities, are set out on pages 102, and 103 to 107, respectively, of this Annual Report.
A review of the development of the Group and its future prospects is included in the Chairman’s Statement, which is incorporated into this Directors’ Report by reference. The Group’s business model and strategy are summarised in the Strategic Report.
The FCA’s Disclosure and Transparency Rules also require certain information to be included in a corporate governance statement in the Directors’ Report. Information that fulfils the requirements of the corporate governance statement can be found in the Corporate Governance report and the Audit Committee Report, which are incorporated into this Directors’ Report by reference.
For the purpose of paragraph 9.8.4CR of the FCA’s Listing Rules, the information required to be disclosed by paragraph 9.8.4R can be found in the following locations:
Section of LR 9.8.4R Topic Location
(1) Amount of interest capitalized Not applicable
(2) Publication of unaudited financial information Not applicable
(4) Details of long-term incentive schemes Directors’ Remuneration Report
(5) Waiver of emoluments by a director Directors’ Remuneration Report
(6) Waiver of future emoluments by a director Directors’ Remuneration Report
(7) Non-pre-emptive issues of equity for cash Not applicable
(8) Item (7) in relation to major subsidiary undertakings Not applicable
(9) Parent participation in a placing by a listed subsidiary Not applicable
(10) Contracts of significance Directors’ Report
(11) Provision of services by a controlling shareholder Not applicable
(12) Shareholder waivers of dividends Directors’ Report
(13) Shareholder waivers of future dividends Directors’ Report
(14) Agreements with controlling shareholders Not applicable
All the information cross-referenced above is hereby incorporated by reference into this Directors’ Report.
Disclosure of financial risk management objectives and policies is made on page 46 of the Strategic Report.
TREVOR BRADBURY Company Secretary
INTERSERVE ANNUAL REPORT 2014 GOVERNANCE 53DIRECTORS’ REPORT
THE COMPANYLegal formInterserve Plc (the “Company”) is a company incorporated in the United Kingdom with company number 88456. The principal subsidiaries and associated undertakings are listed on pages 161 to 165.
BranchesThe Company, through various subsidiaries, has established branches in a number of different countries in which the Group operates.
Amendment of the Articles of AssociationThe Company’s constitution, known as the Articles of Association, is essentially a contract between the Company and its shareholders, governing the management of the Company. A copy of the Articles can be obtained on request from the Company Secretary. The Articles may only be changed by special resolution of shareholders which requires, on a vote on a show of hands, at least three-quarters of the shareholders or proxies present at the meeting to be in favour of the resolution or, on a poll, at least three-quarters in nominal value of the votes cast by shareholders or their proxies to be in favour of the resolution.
FINANCIAL RESULTSThe Group’s Consolidated Income Statement set out on page 108 shows Group profit before taxation of £61.9 million (2013: £68.1 million). The detailed results of the Group are given in the financial statements on pages 108 to 152 and further comments on divisional results are given in the Operational Review on pages 20 to 29.
There have been no post balance sheet events that require disclosure or adjustment in the financial statements.
DIVIDENDSAn interim dividend of 7.5p per 10p ordinary share (2013: 6.8p) was paid on 23 October 2014. The directors recommend a final dividend of 15.5p per 10p ordinary share, making a total distribution for the year ended 31 December 2014 of 23.0p per 10p ordinary share (2013: 21.5p). Subject to approval of shareholders at the Annual General Meeting (“AGM”) on 12 May 2015, the final dividend will be paid on 20 May 2015 to shareholders appearing on the register at the close of business on 7 April 2015. The shares will be quoted ex-dividend on 2 April 2015.
The Company’s dividend reinvestment plan continues to be available to eligible shareholders. Further details of the plan are set out in the Shareholder Information section on page 169.
Capita Trustees Limited, the trustee of the Interserve Employee Benefit Trust (the “Trust”), waived its right to receive a dividend over 612,479 shares held by the Trust in the name of Capita IRG Trustees (Nominees) Limited in respect of the dividend paid in May 2014 (May 2013: 368,601 shares) and 513,629 shares in respect of the dividend paid in October 2014 (October 2013: 647,411 shares).
DIRECTORS AND DIRECTORS’ INTERESTS
The following have served as directors during the year:
Lord Blackwell* (Group Chairman) Adrian Ringrose (Chief Executive) Les Cullen* (Senior Independent Director) Steven Dance Anne Fahy* Tim Haywood Russell King*1 Keith Ludeman* Bruce Melizan Nick Salmon*2 Dougie Sutherland David Thorpe*3
*Non-executive director1Appointed to the Board on 1 September 20142Appointed to the Board on 1 August 20143Resigned from the Board on 31 August 2014
The biographical details of the directors of the Company are given on pages 48 to 51.
The powers of the directors, and their service contracts and terms of appointment, are described in the Corporate Governance report.
The directors’ beneficial interests in, and options to acquire, ordinary shares in the Company, are set out in the Directors’ Remuneration Report on pages 95 to 99 of this Annual Report and Financial Statements.
The directors do not have any interest in any other Group company, other than as directors. No director has, or has had, a material interest, directly or indirectly, at any time during the year under review in any contract significant to the Company’s business.
OVERVIEW
GO
VERNA
NCE
FINA
NCIA
L STATEMEN
TS STRATEG
IC REPORT
54 INTERSERVE ANNUAL REPORT 2014 GOVERNANCE
GOVERNANCE
APPOINTMENT AND REPLACEMENT OF DIRECTORSThe Board must comprise of not less than three and no more than twelve directors. Directors may be appointed by shareholders (by ordinary resolution) or by the Board.
Under the Company’s Articles of Association, any director appointed by the Board since the last AGM may only hold office until the date of the next AGM, at which time that director must stand for election by shareholders. Russell King and and Nick Salmon will therefore be standing for election at the AGM on 12 May 2015.
The Articles also require one-third of the directors to retire by rotation at each AGM. Any director who has not retired by rotation must retire at the third AGM after his or her last appointment or re-appointment. However, in accordance with the Corporate Governance Code, which requires all directors of FTSE 350 companies to be subject to annual re-election by shareholders, the Board has again decided that all the directors (save for Les Cullen who will not be standing for re-election) will be subject to election or re-election at this year’s AGM.
No person other than a director retiring at a general meeting shall, unless recommended by the directors for election, be eligible for election to the office of director unless, not less than seven nor more than 21 days beforehand, the Company has been given notice, executed by a shareholder eligible to vote at the meeting, of his intention to propose such person for election together with a notice executed by that person of his willingness to be elected.
The Company may, by ordinary resolution, of which special notice has been given in accordance with section 312 of the Companies Act 2006 (the “2006 Act”), remove any director before the expiration of his period of office and may, by ordinary resolution, appoint another person in his stead.
DIRECTORS’ INDEMNITIES AND INSURANCEAs permitted by the Company’s Articles of Association, qualifying third-party indemnities have been in place throughout the period under review and remain in force at the date of this report in respect of liabilities suffered or incurred by each director. The Company also undertakes to loan such funds to a director as it, in its reasonable discretion, considers appropriate for the director to meet expenditure incurred by him in defending any criminal or civil proceeding or in connection with any application under section 661(3) or 1157 of the 2006 Act on terms which require repayment by the director of amounts so advanced upon conviction of final judgment being given against him. The deeds of indemnity are available for inspection by shareholders at the Company’s registered office. The Company also maintains an appropriate level of directors’ and officers’ insurance in respect of legal actions against the directors. Neither the qualifying third-party indemnities nor the insurance provide cover where the director has acted fraudulently or dishonestly.
On 26 September 2007 the rules of the Interserve Pension Scheme were amended in order to provide the directors of Interserve Trustees Limited, the corporate trustee of the Interserve Pension Scheme, with a qualifying pension scheme indemnity to the extent that insurance has not been taken out by the trustee to cover its liabilities, or such liabilities cannot be paid from the proceeds of any insurance taken out by the trustee. That qualifying pension scheme indemnity remains in force at the date of this report and is available for inspection by shareholders at the Company’s registered office.
In January 2011 an indemnity was given to the trustees of the Douglas Group Compass Pension Plan for any claim, costs, loss, damages and expenses which may be made against them or which they may pay or incur (save as a consequence of breach of trust committed knowingly and intentionally or as a result of negligence) in connection with the administration of the Plan and the winding-up of the Plan. Two of the trustees were also directors of one or more Group subsidiary companies. This Plan was formally wound up on 7 January 2011 but the indemnity remains in force.
In January 2012 an indemnity was given to the trustees of the Interserve Retirement Plan against all and any claims, costs, damages and expenses which may be made against them or which they may pay or incur in connection with their administration of the Plan and the winding-up of the Plan (other than liabilities arising as a consequence of breach of trust committed knowingly and intentionally). One of the trustees was also a director of various Group subsidiary companies. This Plan was formally wound up 31 January 2012 but the indemnity remains in force.
EMPLOYEESThe average number of persons, including directors, employed by the Group and their remuneration, is set out in note 6 to the financial statements. A breakdown of employee diversity, as required by the 2006 Act, can be viewed on page 40 of the Sustainability Review section of the Strategic Report. The Group’s statement with regard to its employees, including its disclosure on employee consultation, equal opportunities and diversity, is set out within the Sustainability Review on page 40.
GREENHOUSE GAS EMISSIONS In this section we report on greenhouse gas (“GHG”) emissions in accordance with the Companies Act 2006 (Strategic Report and Directors’ Report) Regulations 2013.
A range of approaches can be taken to determine the boundaries of an organisation for the purposes of GHG reporting including ‘financial control’, ‘operational control or ‘equity share’. We report using the financial control approach to define our organisational boundary.
DIRECTORS’ REPORT
DIRECTORS’ REPORT CONTINUED
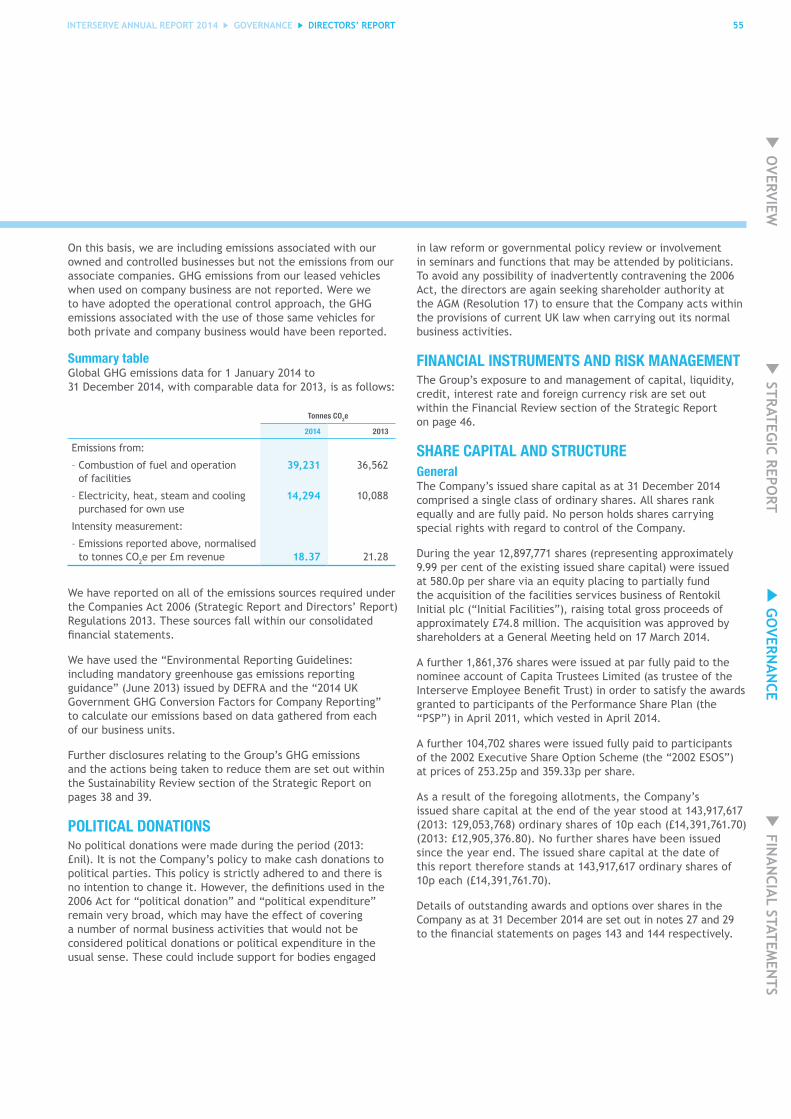
INTERSERVE ANNUAL REPORT 2014 GOVERNANCE 55
On this basis, we are including emissions associated with our owned and controlled businesses but not the emissions from our associate companies. GHG emissions from our leased vehicles when used on company business are not reported. Were we to have adopted the operational control approach, the GHG emissions associated with the use of those same vehicles for both private and company business would have been reported.
Summary tableGlobal GHG emissions data for 1 January 2014 to 31 December 2014, with comparable data for 2013, is as follows:
Tonnes CO2e
2014 2013
Emissions from:
– Combustion of fuel and operation of facilities
39,231 36,562
– Electricity, heat, steam and cooling purchased for own use
14,294 10,088
Intensity measurement:
– Emissions reported above, normalised to tonnes CO2e per £m revenue 18.37 21.28
We have reported on all of the emissions sources required under the Companies Act 2006 (Strategic Report and Directors’ Report) Regulations 2013. These sources fall within our consolidated financial statements.
We have used the “Environmental Reporting Guidelines: including mandatory greenhouse gas emissions reporting guidance” (June 2013) issued by DEFRA and the “2014 UK Government GHG Conversion Factors for Company Reporting” to calculate our emissions based on data gathered from each of our business units.
Further disclosures relating to the Group’s GHG emissions and the actions being taken to reduce them are set out within the Sustainability Review section of the Strategic Report on pages 38 and 39.
POLITICAL DONATIONSNo political donations were made during the period (2013: £nil). It is not the Company’s policy to make cash donations to political parties. This policy is strictly adhered to and there is no intention to change it. However, the definitions used in the 2006 Act for “political donation” and “political expenditure” remain very broad, which may have the effect of covering a number of normal business activities that would not be considered political donations or political expenditure in the usual sense. These could include support for bodies engaged
in law reform or governmental policy review or involvement in seminars and functions that may be attended by politicians. To avoid any possibility of inadvertently contravening the 2006 Act, the directors are again seeking shareholder authority at the AGM (Resolution 17) to ensure that the Company acts within the provisions of current UK law when carrying out its normal business activities.
FINANCIAL INSTRUMENTS AND RISK MANAGEMENTThe Group’s exposure to and management of capital, liquidity, credit, interest rate and foreign currency risk are set out within the Financial Review section of the Strategic Report on page 46.
SHARE CAPITAL AND STRUCTUREGeneralThe Company’s issued share capital as at 31 December 2014 comprised a single class of ordinary shares. All shares rank equally and are fully paid. No person holds shares carrying special rights with regard to control of the Company.
During the year 12,897,771 shares (representing approximately 9.99 per cent of the existing issued share capital) were issued at 580.0p per share via an equity placing to partially fund the acquisition of the facilities services business of Rentokil Initial plc (“Initial Facilities”), raising total gross proceeds of approximately £74.8 million. The acquisition was approved by shareholders at a General Meeting held on 17 March 2014.
A further 1,861,376 shares were issued at par fully paid to the nominee account of Capita Trustees Limited (as trustee of the Interserve Employee Benefit Trust) in order to satisfy the awards granted to participants of the Performance Share Plan (the “PSP”) in April 2011, which vested in April 2014.
A further 104,702 shares were issued fully paid to participants of the 2002 Executive Share Option Scheme (the “2002 ESOS”) at prices of 253.25p and 359.33p per share.
As a result of the foregoing allotments, the Company’s issued share capital at the end of the year stood at 143,917,617 (2013: 129,053,768) ordinary shares of 10p each (£14,391,761.70) (2013: £12,905,376.80). No further shares have been issued since the year end. The issued share capital at the date of this report therefore stands at 143,917,617 ordinary shares of 10p each (£14,391,761.70).
Details of outstanding awards and options over shares in the Company as at 31 December 2014 are set out in notes 27 and 29 to the financial statements on pages 143 and 144 respectively.
DIRECTORS’ REPORT
OVERVIEW
GO
VERNA
NCE
FINA
NCIA
L STATEMEN
TS STRATEG
IC REPORT
56 INTERSERVE ANNUAL REPORT 2014 GOVERNANCE
GOVERNANCE
Issue of sharesSection 551 of the 2006 Act provides that the directors may not allot shares unless empowered to do so by the shareholders. A resolution giving such authority was passed at the AGM held on 13 May 2014. The AGM authorities were used in 2014 in relation to the issue of shares pursuant to the acquisition of Initial Facilities and the satisfaction of awards granted to participants of the PSP and the 2002 ESOS, as described above.
In accordance with the Share Capital Management Guidelines published in July 2014 by The Investment Association, following its merger with ABI Investment Affairs, the directors propose Resolution 19 set out in the Notice of AGM to renew the authority granted to them at the 2014 AGM to allot shares up to an aggregate nominal value of one-third of the Company’s issued share capital plus a further one-third (i.e. two-thirds in all) where the allotment is in connection with a rights issue.
Under section 561 of the 2006 Act, if the directors wish to allot unissued shares for cash (other than pursuant to an employee share scheme) they must first offer them to existing shareholders in proportion to their holdings (a pre-emptive offer). Resolution 20 set out in the Notice of AGM will be proposed as a special resolution in order to renew the directors’ authority to allot shares for cash other than by way of rights to existing shareholders. By restricting such authority to an aggregate nominal value of no more than five per cent of the Company’s total issued equity capital, the Company will be in compliance with the Pre-Emption Group’s Statement of Principles (the “Principles”).
Shareholders should note that the Listing Rules of the FCA do not require shareholders’ specific approval for each issue of shares for cash on a non-pre-emptive basis to the extent that under section 570 of the 2006 Act the provisions of section 561 are disapplied generally. If given, this authority will expire on the date of the next AGM of the Company. The Principles also request that in any rolling three-year period a company does not make non-pre-emptive issues for cash or of equity securities exceeding 7.5 per cent of the company’s issued share capital without prior consultation with shareholders.
The percentages of shares issued by the Company on a non-pre-emptive basis in 2014 and in the period 2012 to 2014 pursuant to employee share schemes (calculated by reference to the Company’s closing issued share capital at 31 December 2014), were 1.4 per cent and 3.6 per cent respectively.
Save for issues of shares in respect of various employee share schemes, the directors have no current plans to make use of the renewed authorities sought by Resolutions 19 and 20 although they consider their renewal appropriate in order to retain maximum flexibility to take advantage of business opportunities as they arise.
Purchase of own sharesThe Company has authority under a shareholders’ resolution passed at the 2014 AGM to repurchase up to 14,200,458 of the Company’s ordinary shares in the market. The shares may be purchased at a price ranging between the nominal value for each share and an amount equal to the higher of (i) 105 per cent of the average of the middle-market price of an ordinary share for the five business days immediately preceding the date on which the Company agrees to buy the shares concerned and (ii) the higher of the price of the last independent trade and the highest independent current bid on the London Stock Exchange at the time the purchase is carried out. This authority expires at the conclusion of the forthcoming AGM on 12 May 2015. No shares have been repurchased by the Company under the authority granted at the 2014 AGM.
Resolution 21 set out in the Notice of AGM will be proposed as a special resolution in order to renew this authority. Although the directors have no immediate plans to do so, they believe it is prudent to seek general authority from shareholders to be able to act if circumstances were to arise in which they considered such purchases to be desirable. This power will only be exercised if and when, in the light of market conditions prevailing at that time, the directors believe that such purchases would increase earnings per share and would be for the benefit of shareholders generally. Any shares purchased under this authority will be cancelled (unless the directors determine that they are to be held as treasury shares) and the number of shares in issue will be reduced accordingly.
Whilst the Company does not presently hold shares in treasury, the Treasury Shares Regulations allow shares purchased by the Company out of distributable profits to be held as treasury shares, which may then be cancelled, sold for cash or used to meet the Company’s obligations under its employee share schemes. The authority sought by this resolution is intended to apply equally to shares to be held by the Company as treasury shares in accordance with the Treasury Shares Regulations.
SHAREHOLDERS’ RIGHTSGeneralThe rights attaching to the ordinary shares are set out in the 2006 Act and the Company’s Articles of Association.
A shareholder whose name appears on the register of members may choose whether those shares are evidenced by share certificates (certificated form) or held in electronic form (uncertificated) in CREST.
VotingSubject to the restrictions set out below, a shareholder is entitled to attend (or appoint another person as his representative (a “proxy”) to attend) and to exercise all or any of his rights to speak, ask questions and vote at any general meeting of the Company. A shareholder may also appoint more than one proxy, provided that each proxy is appointed to exercise the rights attached to a different share or shares held by that shareholder. A proxy need not be a shareholder of the Company.
DIRECTORS’ REPORT
DIRECTORS’ REPORT CONTINUED

INTERSERVE ANNUAL REPORT 2014 GOVERNANCE 57
The right to appoint a proxy does not apply to a person who has been nominated under section 146 of the 2006 Act to enjoy information rights (a “Nominated Person”). He/she may, however, have a right under an agreement with the registered shareholder holding the shares on his/her behalf to be appointed (or to have someone else appointed) as a proxy. Alternatively, if a Nominated Person does not have such a right, or does not wish to exercise it, he/she may have a right under such an agreement to give instructions to the person holding the shares as to the exercise of voting rights.
In accordance with section 327 of the 2006 Act, in order to be valid, any form of proxy sent by the Company to shareholders or any proxy registered electronically in relation to any general meeting must be delivered to the Company’s registrars not later than 48 hours before the time fixed for holding the meeting (or any adjourned meeting). In calculating the 48-hour period no account shall be taken of any part of a day that is not a working day. Full details of the deadlines for exercising voting rights in respect of the 2015 AGM are set out in the Notice of AGM.
Subject to any rights or restrictions for the time being attached to any class or classes of shares and to any other provisions of the Articles of Association or statutes, on a vote on a resolution at a general meeting on a show of hands every shareholder present in person, every proxy present who has been duly appointed by one or more shareholders entitled to vote on the resolution and every authorised representative of a corporation which is a shareholder of the Company entitled to vote on the resolution, shall have one vote. If a proxy has been duly appointed by more than one shareholder and has been instructed by one or more of those shareholders to vote for the resolution and by one or more of those shareholders to vote against it, that proxy shall have one vote for and one vote against the resolution. On a poll, every shareholder present in person or by proxy shall have one vote for every share held.
A resolution put to the vote at a general meeting shall be decided on a show of hands unless the notice of the meeting specifies that a poll will be called on such resolution or a poll is (before the resolution is put to the vote on a show of hands or on the declaration of the results of the show of hands) directed by the Chairman or demanded in accordance with the Articles of Association.
If a person fails to give the Company any information required by a notice served on him by the Company under section 793 of the 2006 Act (which confers upon public companies the power to require information to be supplied in respect of a person’s interests in the Company’s shares) then the Company may, no sooner than 21 days later, and after warning that person, serve a disenfranchisement notice upon the shareholder registered as the holder of the shares in respect of which the section 793 notice was given. Unless the information required by the section 793 notice is given within 14 days, such holder will not be entitled to receive notice of any general meeting or attend
any such meeting of the Company and shall not be entitled to exercise, either personally or by proxy, the votes attaching to such shares in respect of which the disenfranchisement notice has been given unless and until the information required by the section 793 notice has been provided.
The Company operates a number of employee share schemes. Under some of these arrangements, shares are held by trustees on behalf of employees. The employees are not entitled to exercise directly any voting or other control rights. The trustees abstain from voting on these shares.
General meetingsNo business may be transacted at a general meeting unless a quorum is present consisting of not less than two shareholders present in person or by proxy or by two duly authorised representatives of a corporation. Two proxies of the same shareholder or two duly authorised representatives of the same corporation will not constitute a quorum.
An AGM must be called on at least 21 days’ clear notice. All other general meetings are also required to be held on at least 21 days’ clear notice unless the Company offers shareholders an electronic voting facility and a special resolution reducing the period of notice to not less than 14 days has been passed. The directors are proposing Resolution 22 set out in the Notice of AGM to renew the authority obtained at last year’s AGM to reduce the notice period for general meetings (other than AGMs) to at least 14 days. It is intended that this shorter notice period will only be used for non-routine business and where merited in the interests of shareholders as a whole.
The business of an AGM is to receive and consider the accounts and balance sheets and the reports of the directors and auditors, to elect directors in place of those retiring, to elect auditors and fix their remuneration and to declare a dividend.
Providing that notice is given to the Company no later than six weeks before an AGM or no later than the date on which the notice of an AGM is given, shareholders representing at least five per cent of the total voting rights of all the shareholders who have a right to vote at the AGM or at least 100 shareholders who have that right and who hold shares in the Company on which there has been paid up an average sum per shareholder of at least £100, may require the Company to include an item in the business to be dealt with at the AGM.
DividendsSubject to the provisions of the 2006 Act, the Company may, by ordinary resolution, declare a dividend to be paid to the shareholders but the amount of the dividend may not exceed the amount recommended by the directors. The directors may also pay interim dividends on any class of shares on any dates and in any amounts and in respect of any periods as appear to the directors to be justified by the distributable profits of the Company.
DIRECTORS’ REPORT
OVERVIEW
GO
VERNA
NCE
FINA
NCIA
L STATEMEN
TS STRATEG
IC REPORT
58 INTERSERVE ANNUAL REPORT 2014 GOVERNANCE
GOVERNANCE
LiquidationIf the Company is wound up the liquidator may, with the sanction of a special resolution of the Company, and any other sanction required by law, divide amongst the shareholders the whole or any part of the assets of the Company. He may, for such purposes, set such value as he deems fair upon any property to be divided and may determine how such division shall be carried out as between the shareholders or different classes of shareholders. The liquidator may also transfer the whole or any part of such assets to trustees to be held in trust for the benefit of the shareholders. No shareholder can be compelled to accept any shares or other securities which would give him any liability.
Modification of rightsIf at any time the capital of the Company is divided into different classes of shares, the rights attached to any class or any of such rights may be modified, abrogated, or varied either:
(a) with the consent of the holders of 75 per cent of the issued shares of that class; or
(b) with the sanction of a special resolution passed at a separate general meeting of the holders of the shares of the class.
The rights attached to any class of shares shall not (unless otherwise provided by the terms of issue of the shares of that class or by the terms upon which such shares are for the time being held) be deemed to be modified or varied by the creation or issue of further shares ranking pari passu therewith.
The Company may, by ordinary resolution, convert any paid-up shares into stock and reconvert any stock into paid-up shares of any denomination.
Transfer of sharesThere are no specific restrictions on the transfer of securities in the Company, or on the size of a shareholder’s holding, which are both governed by the Articles of Association and prevailing legislation. In accordance with the Listing, Prospectus, and Disclosure and Transparency Rules of the FCA, certain employees are required to seek the approval of the Company to deal in its shares.
The Company is not aware of any agreements between its shareholders that may result in restrictions on the transfer of securities or on voting rights.
Subject to the 2006 Act, the directors may refuse to register any transfer of any share which is not fully paid (whether certificated or uncertificated), provided that the refusal does not prevent dealing in shares in the Company from taking place on an open and proper basis.
The directors may also decline to register the transfer of any certificated share unless the instrument of transfer is duly stamped (if stampable) and accompanied by the certificate of the shares to which it relates and such other evidence as the directors may reasonably require to show the right of the transferor to make the transfer.
Transfers of uncertificated shares must be conducted through CREST and the directors can refuse to register transfers in accordance with the regulations governing the operation of CREST.
All share transfers must be registered as soon as practicable.
SUBSTANTIAL SHAREHOLDINGSAs at 31 December 2014 the Company had been notified, pursuant to paragraph 5 of the FCA’s Disclosure and Transparency Rules, of the following notifiable voting rights in its ordinary share capital:
Name of holderNumber of
ordinary sharesPercentage of
total voting rightsNature
of holding
Standard Life Investments Ltd
14,422,796 10.0 Direct andindirect
Old Mutual Plc 11,489,129 8.0 Indirect
Mondrian Investment Partners Ltd
7,212,846 5.0 Indirect
Between the year end and the date of this report (being a date not more than one month prior to the date of the AGM Notice), the Company has been notified that the interests in the voting rights have changed as follows:
• Standard Life Investments Ltd – increase to 17,487,526 shares (12.2 per cent); and
• Henderson Global Investors Ltd – increase to 7,503,276 shares (5.2 per cent – previously below 5.0 per cent) (indirect holding).
SIGNIFICANT AGREEMENTS – CHANGE OF CONTROL PROVISIONSThe following significant agreements contain provisions entitling the counterparties to exercise termination rights in the event of a change of control in the Company:
• Under the terms of the banking facility agreements detailed on page 46 of the Strategic Report, if any person, or group of persons acting in concert, gains control of the Company, any lender (i) is no longer obliged to fund any loan, save for a rollover loan; and (ii) may, by not less than 15 days’ notice, cancel its commitment under the facility and declare its participation in all outstanding loans, together with accrued interest and all other amounts payable under the facility, immediately due and repayable.
• Under the terms of the Note Purchase Agreement in relation to the US private placement detailed on page 46 of the Strategic Report, upon a change of control the Company is required to make an offer to all noteholders to prepay the entire unpaid principal amount of the notes, together with interest.
• The Group’s share schemes also contain provisions relating to the vesting and exercising of awards/options in the event of a change of control of the Group. These are set out on page 84 the Directors’ Remuneration Report.
DIRECTORS’ REPORT
DIRECTORS’ REPORT CONTINUED

INTERSERVE ANNUAL REPORT 2014 GOVERNANCE 59
AUDITORSResolutions to re-appoint Grant Thornton UK LLP as the Company’s auditors and to authorise the directors to determine their remuneration will be proposed at the forthcoming AGM.
Statement of disclosure of information to auditorsThe directors in office at the date of approval of this report confirm that:
(a) so far as they are each aware, there is no relevant audit information of which the Company’s auditors are unaware; and
(b) they have each made such enquiries of their fellow directors and of the Company’s auditors and have each taken such other steps as were required by their duty as a director of the Company to exercise due care, skill and diligence in order to make themselves aware of any relevant audit information and to establish that the Company’s auditors are aware of that information.
This confirmation is given and should be interpreted in accordance with the provisions of section 418 of the 2006 Act.
ANNUAL GENERAL MEETING The resolutions to be proposed at the AGM to be held on 12 May 2015, together with the explanatory notes, appear in the separate Notice of Annual General Meeting accompanying this Annual Report. The Notice is also available on our website at www.interserve.com.
APPROVALThis report was approved by the Board of Directors on 26 February 2015 and signed on its behalf by:
Trevor Bradbury Company Secretary26 February 2015
Interserve HouseRuscombe ParkTwyfordReadingBerkshireRG10 9JU
DIRECTORS’ REPORT
CAUTIONARY STATEMENTThe Directors’ Report has been prepared solely for existing members of the Company in compliance with UK company law and the Listing, Prospectus, and Disclosure and Transparency Rules of the FCA. The Company, the directors and employees accept no responsibility to any other person for anything contained in the Directors’ Report. The directors’ liability for the Directors’ Report is limited, as provided in the 2006 Act. The Company’s auditors report to the Board whether, in their opinion, the information given in the Directors’ Report is consistent with the financial statements, but the Directors’ Report is not audited. Statements made in this Directors’ Report reflect the knowledge and information available at the time of its preparation. The Directors’ Report contains forward-looking statements in respect of the Group’s operations, performance, prospects and financial condition. By their nature, these statements involve uncertainty. In particular, outcomes often differ from plans or expectations expressed through forward-looking statements, and such differences may be significant. Assurance cannot be given that any particular expectation will be met. No responsibility is accepted to update or revise any forward-looking statement, resulting from new information, future events or otherwise. Liability arising from anything in this Annual Report and Financial Statements shall be governed by English law. Nothing in this Annual Report and Financial Statements should be construed as a profit forecast.
OVERVIEW
GO
VERNA
NCE
FINA
NCIA
L STATEMEN
TS STRATEG
IC REPORT
60 INTERSERVE ANNUAL REPORT 2014 GOVERNANCE
GOVERNANCE
CORPORATE GOVERNANCE
CORPORATE GOVERNANCE
Dear Shareholder
Our role as a Board is to provide entrepreneurial leadership within an appropriate governance framework, set the standards of behaviour, values and ethics by which the business is expected to operate and to call to account those who do not abide by those principles.
As in previous years, the Board has had strong engagement in reviewing and developing our business strategy within this framework. Our continued focus is on building strong core businesses and growing in adjacent markets and geographies that draw upon our distinctive commercial skills. Our success rests upon our ability to deliver outstanding service and innovative solutions to our existing and potential customers. This in turn depends on motivated and experienced employees supported by systems and processes that are strongly aligned with our values.
For shareholders our aim is to deliver above market growth with a strong balance sheet and resilient profitability from our portfolio of established and growing businesses, supporting a continued progressive dividend policy. We therefore set ourselves stretching financial objectives while maintaining our prudent risk appetite.
As we continue to expand, our front-line service offering our continued “licence to operate” relies increasingly on maintaining the trust and confidence of our wider stakeholder base. SustainAbilities, our vision for creating a sustainable business, is helping us establish stronger ties with the communities in which we work. The components of that plan and our progress in meeting its ambitious goals and targets are an important component of this report.
One of the goals within our SustainAbilities Plan is further developing the diversity of our senior management to reflect the diversity of the business, with specific measures and targets to measure progress. The diversity agenda is an important element of our people strategy and the practices which we have implemented over recent years. These have included training in diversity and inclusion awareness for the managers at divisional board level and above, monitoring female participation in senior leadership programmes, and developing mentoring and coaching for women alongside our ‘Women in Interserve’ support network.
To perform the Board’s role effectively we believe we need a strong and diverse Board, with an open culture of debate and challenge, with all directors appointed on merit for the experience and insights they can bring to the Board and their commitment to our values.
We again refreshed the Board composition during the course of year, with David Thorpe retiring and Nick Salmon and Russell King joining as non-executive directors. Whilst we did not achieve parity of numbers between the executive and non-executive directors until the latter part of the year, the strength and independence of our non-executives, our open style of debate and my observations of the manner in which the Board functions satisfied me that there was an effective governance check within the Board.
In making the two new appointments to the Board we again engaged the Zygos Partnership, an international search firm with a strong diversity record in board-level appointments, with a remit to identify a long list of candidates that would support our diversity objectives. The final appointments reflected the need to balance a range of criteria, including both relevance and diversity of past experience. We will continue to monitor our success in developing the diversity of the Board as part of the annual evaluation of Board effectiveness.
As was the case last year, all directors wishing to remain in office will seek re-election at the AGM.
Lord Blackwell Chairman
LORD BLACKWELLChairman
GOVERNANCE
INTERSERVE ANNUAL REPORT 2014 GOVERNANCE 61CORPORATE GOVERNANCE
COMPLIANCE WITH THE CODEThe Financial Conduct Authority requires the Company to disclose how it has applied the principles of the UK Corporate Governance Code published in September 2012 (the “Code”) and whether there has been compliance with its provisions throughout the financial year. In the case of non-compliance, the Company must specify those provisions with which it has not complied and give reasons for this. The Code may be found on the Financial Reporting Council’s website (www.frc.org.uk).
The directors consider that the Company has complied fully with the provisions of the Code applicable to it throughout the accounting period ended 31 December 2014 with the following exception:
• Provision B.1.2 of the Code requires at least half the board, excluding the Chairman, to comprise non-executive directors determined by the board to be independent. Until 1 August 2014, the Board comprised five executive and four non-executive directors plus the Chairman. Nick Salmon and Russell King were appointed as non-executive directors on 1 August 2014 and 1 September 2014, respectively, and David Thorpe resigned as a non-executive director on 31 August 2014. As at the year end the Board comprised five executive and five non-executive directors plus the Chairman and therefore now complies with Provision B.1.2 of the Code.
Whilst non-executive and executive parity was not achieved until towards the end of 2014, the Board was satisfied that the strength and independence of the non-executives, its open style of debate and the manner in which the Board functions meant that no one individual or small group of individuals could dominate Board decision making.
LEADERSHIP The Board Operation of the Board The Board has a formal schedule of matters reserved for its decision, whilst day-to-day operational decisions are managed by the Executive Board, as referred to on page 64.
In order to facilitate the efficient use of its time the Board has delegated certain of its powers to Board committees, details of which are set out later in this report. From time to time the Board also establishes certain other committees to deal with a specific issue which the Board has approved.
Key matters dealt with by the Board during the course of the year, in addition to the ongoing monitoring of operational and financial performance of the Group, were:
• setting the health and safety targets for the Group and monitoring performance on a monthly basis;
• reviewing the health and safety systems of the International division with reference to the kind of work undertaken, the safety culture of the businesses, challenges specific to working in the Middle East environment, how improvements were planned to be achieved, the delivery of safety management and leadership, how competence is assessed and the way in which reward and discipline is used to drive safety improvement;
• the acquisitions of Initial Facilities and The Employment and Skills Group (esg);
• reviewing the Group’s strategic direction, governance, ethics, values and risk management. In particular, the Board satisfied itself with regard to the concentration risk arising from the number of projects secured in the energy-from-waste market and the increased reputational risk arising from the expansion of the Group’s front-line service delivery – most notably in relation to its success in securing 25 per cent of the Transferring Rehabilitation Programme;
• reviewing the communication of the Company’s brand both internally and externally;
• ongoing monitoring of key contracts where outcomes could impact financial performance;
• reviewing progress against the HR strategy;
• reviewing the strategy for the Group’s UK construction business, in light of the expected upturn in the UK construction market, and the potential for its expansion into selected overseas markets;
• setting the Group’s annual budget and plan;
• approval of the annual and half-year report;
• declaration of the interim dividend and recommendation of the final dividend;
• ensuring the maintenance of a sound system of internal controls and an effective risk management and assurance strategy; and
• monitoring progress against the Group’s SustainAbilities Plan.
The Board also undertook a visit to the Group’s oil and gas services operations in Abu Dhabi and the oil and gas services, equipment services, training and construction operations in Oman.
OVERVIEW
GO
VERNA
NCE
FINA
NCIA
L STATEMEN
TS STRATEG
IC REPORT
62 INTERSERVE ANNUAL REPORT 2014 GOVERNANCE
GOVERNANCE
CORPORATE GOVERNANCE
Division of responsibilitiesThe role of the Group Chairman and Chief Executive are split and clearly defined in written terms of reference.
The role of the ChairmanThe Group Chairman is responsible for the leadership of the Board and creating the conditions for overall Board and individual director effectiveness, both inside and outside the boardroom. The Group Chairman regularly considers succession planning and the Board’s composition with the Nomination Committee and ensures effective communication with shareholders and other stakeholders.
The Group Chairman, assisted by the Company Secretary, sets the agenda for Board meetings and ensures that Board members receive timely information and are briefed on issues arising at Board meetings to assist them in making an effective contribution.
The role of the Chief ExecutiveThe Chief Executive bears primary responsibility for the management of the Group and in leading the formulation of and, once set by the Board, implementing strategy. The Chief Executive chairs the Executive Board and Risk Committee, leads the executive management team and investor communications and is responsible for social and ethical matters within the Group.
The role of the Company SecretaryThe Company Secretary is responsible for distributing Board papers and other information sufficiently far in advance of each meeting for the directors to be properly briefed, presenting certain papers to the Board and its committees, advising on Board procedures and ensuring the Board follows them.
The Board papers include information from management on financial, business and corporate issues. Matters requiring Board and committee approval are generally the subject of a written proposal and circulated as part of the Board papers. The Company Secretary plays a key role in the good governance of the Company and in particular by supporting the Group Chairman on all board matters pertaining to governance.
Non-executive director independence and appointmentsThe Group Chairman and the non-executive directors are considered by the Board to be independent in character and judgement and free from any relationships or circumstances which are likely to affect, or could appear to affect, their judgement.
Les Cullen, who will not be standing for re-election at the 2015 AGM, completed a term of nine years as a non-executive director on 1 October 2014. Notwithstanding this period in office, the Board continues to regard Mr Cullen as independent both in thought and in action.
The non-executive directors have complementary skills, experience and qualifications in a wide range of economic sectors and so are able to bring independent judgement to bear on matters for consideration.
Nick Salmon and Russell King were appointed as non-executive directors on 1 August 2014 and 1 September 2014, respectively. On 31 August 2014 David Thorpe resigned as a director. Keith Ludeman succeeded David as chair of the Remuneration Committee on 9 July 2014.
The Senior Independent Director is available to shareholders should they have any concerns which contact through other channels has failed to resolve or for which such contact may be inappropriate. He also provides a sounding board for the Chairman and serves as an intermediary for the other directors when necessary.
As at 31 December 2014 the Board comprised 11 members: the Group Chairman, five executive and five non-executive directors.
Non-executive directors and the Group Chairman are required to confirm, on appointment, that they have sufficient time to meet what is expected of them and to seek the committee chairman’s agreement, or in the case of the Group Chairman, the Senior Independent Director’s agreement, before accepting additional commitments that might impact upon the time they are able to devote to their role as a non-executive director of the Company. The letters of appointment of the non-executive directors and the Group Chairman specify the anticipated level of time commitment.
The terms and conditions of appointment of the non-executive directors and the Group Chairman are available for inspection at the Company’s registered office during normal business hours.
BOARD EFFECTIVENESS Meetings The Board normally meets monthly throughout the year and on an ad hoc basis to consider any matters which are time-critical. Attendance at Board and committee meetings is set out in the table below.
Board Audit Remuneration Nomination
Number of Meetings 14 6 12 6
Lord Blackwell 14 12 6
L G Cullen 14 6 12 6
S L Dance 13
A K Fahy 14 6 12 6
T P Haywood 14
R J King1 4 1 4 2
K L Ludeman 14 6 12 6
B A Melizan 13
A M Ringrose 14 6
N R Salmon2 5 2 5 2
D I Sutherland 14
D A Thorpe3 9 4 7 3
1Appointed on 1 September 20142Appointed on 1 August 20143Resigned on 31 August 2014
CORPORATE GOVERNANCE CONTINUED
INTERSERVE ANNUAL REPORT 2014 GOVERNANCE 63CORPORATE GOVERNANCE
The Board also holds a strategy day in January each year to review the strategic direction of the Group.
The Group Chairman held two formal sessions with the non-executive directors without any executive directors being present and a number of informal discussions both with and without the Chief Executive being present. The non-executive directors also met once during the year, under the chairmanship of the Senior Independent Director, without either the Group Chairman or the executive directors being present.
Board induction, time commitment and developmentA tailored induction programme was arranged by the Company Secretary for Nick Salmon and Russell King, which included refresher training on the duties of a listed company director delivered by the Company Secretary and a series of site visits encompassing a representative cross-section of most of the Group’s UK operations accompanied by the executive director responsible for that part of the Group.
An ongoing programme of site visits, staff meetings and business presentations provides additional opportunities for the Chairman and non-executive directors to visit various operations of the Group and to receive insight and feedback from employees.
During the year under review the non-executive directors have attended a number of seminars and/or other non-executive forums relevant to their roles.
In April the Chairman was appointed as Chairman of the Lloyds Banking Group, having previously served as a non-executive director for nearly two years.
Performance evaluation During the course of the year the performance of the directors was reviewed by the Group Chairman and the Chief Executive and, in the case of the Chief Executive, by the Group Chairman, having consulted with other directors. The Group Chairman’s performance was reviewed by the Senior Independent Director who held separate meetings with each of the directors and the Company Secretary. As part of this review process the Chairman met with the directors individually to review performance and review and agree any development and training needs.
The overall time commitment of the non-executive directors in the attendance of Board meetings/visits was in the order of 22 days in addition to the time taken to read Board papers and attendance at three meetings held by the Group Chairman.
The Board appointed Independent Audit to undertake the Board evaluation for 2013, the outcome of which was presented to the Board in April 2014. The evaluation highlighted that the Board was operating effectively, aided by its collegiate approach, and brings a wider perspective to the business, reducing the risk of executive groupthink. The tone of the meetings enables the detailed operational discussions which are necessary, given the nature of the Group’s business, without compromising strategic consideration. It highlighted the shift in emphasis from operational to more time being spent on Group-wide and
strategic matters as the Group continues to grow, and that investment in building Group management and capability, whilst work-in-progress, would enable and require a shift in the way the Board exercises its oversight and leadership.
The review also identified that the executive reward system was due a revision in order to renew the link between incentives and longer-term strategic goals.
In view of the externally facilitated Board evaluation in 2013 the Board conducted an internal evaluation of its performance in 2014 which concluded that the Board continued to operate effectively and that the diversity of skills and experience of the Board had been maintained.
Board strategy was considered to be clear and well communicated. The balance between operational and strategic matters at meetings was considered to be appropriate, with the impact on the Company’s risk profile of changes in strategy, major new projects and other significant commitments being appropriately assessed. Risk assessments were thought to be well integrated into the decision-making process which was enhanced by the Board’s skills, knowledge, experience and the level of support provided to it.
Further progress has been made in the development of the Group’s infrastructure and organisation.
Reporting on the crystallisation of significant risks to the Board was considered to be generally good.
The Board’s safety culture and its values were considered to be well communicated, with the leadership style, management structure, HR policies and reward systems all playing their part in supporting the risk management and internal control systems.
The Audit, Remuneration and Nomination committees carried out a self-evaluation of their performance against their terms of reference and also reviewed those terms of reference.
Information and supportIndividual directors may, after consultation with the Group Chairman, take independent legal advice in furtherance of their duties at the Company’s expense up to a limit of £10,000 in relation to any one event. In the case of the Group Chairman he must consult with the Senior Independent Director. All directors have access to the advice and services of the Company Secretary, whose appointment or removal is a matter reserved for the approval of the Board or any duly delegated committee thereof.
Election and re-electionRussell King and Nick Salmon will submit themselves for election by shareholders at the AGM on 12 May 2015. With the exception of Les Cullen, all remaining directors will submit themselves for re-election at the AGM.
Biographical details for each of the directors standing for election or re-election are set out on pages 48 to 51.
OVERVIEW
GO
VERNA
NCE
FINA
NCIA
L STATEMEN
TS STRATEG
IC REPORT

64 INTERSERVE ANNUAL REPORT 2014 GOVERNANCE
GOVERNANCE
EXECUTIVE BOARDThe Executive Board, which, during the year, comprised the executive directors together with Trevor Bradbury (Group Company Secretary), George Franks (Managing Director of Interserve International), Robin O’Kelly (Director of Communications), Ian Renhard (Managing Director of UK Construction) and Catherine Ward (Group Director of Human Resources), is chaired by the Chief Executive.
The Executive Board, which met 11 times during the course of the year, is responsible for the operational management and delivery against budget and forecast of the Group, implementing resolutions of the Board, formulation of strategy, annual budgets and other proposals for consideration by the Board, the identification and evaluation for consideration by the Board of risks faced by the Group and for designing, operating and monitoring a suitable system of internal control embracing the policies adopted by the Board. It is also responsible for devising and, once approved by the Board, implementing suitable policies and monitoring procedures for health and safety, environmental, social and ethical, treasury, human resources and information technology.
AUDIT COMMITTEEDetails of the Audit Committee are included in the Audit Committee Report on pages 68 to 73 and are incorporated into this Corporate Governance report by reference.
NOMINATION COMMITTEEThe Nomination Committee is chaired by the Group Chairman and the majority of the members are independent non-executive directors. External consultants are used for new appointments. The committee keeps the Board structure, size and composition, balance of skills and knowledge and experience (both executive and non-executive) under review and makes recommendations for any changes to the Board.
The committee’s terms of reference set out clearly its authority and duties, and are available on the Company’s website at www.interserve.com and on request.
Overview of activitiesBusiness conducted during the year included recommendations to the Board for the re-election of retiring directors at the AGM, selecting candidates for two non-executive director appointments, reviewing the Board structure and composition and senior management succession and development up to and including those at Board level, and Board succession planning. The effectiveness of the committee and its terms of reference were also reviewed.
The Company’s policy relating to the terms of appointment and remuneration of the executive and non-executive directors is detailed in the Directors’ Remuneration Report on pages 74 to 101.
For the recruitment of the two non-executive director positions the committee again engaged the Zygos Partnership, an international search firm which focuses upon board level appointments and well known for its strong diversity record. There are no other connections between Zygos and the Company.
As well as personal characteristics, the candidate specifications for the non-executive positions required strong industry experience, including an understanding of major complex contracts, as well as plc board level experience.
From the long list identified by Zygos, eight potential candidates who best matched the above criteria were selected by the committee for further evaluation. Each of these was then interviewed by the Chairman and at least one other committee member. After taking references the two preferred candidates were recommended to the Board for appointment.
The committee also undertook a review of senior management succession planning and the annual review of senior management talent. Consideration was also given to the diversity (ethnicity and gender) and the age profile of the workforce down to two levels below the Executive Board.
Development below Board level is covered in the Knowledge Capital section of the Sustainability Review.
Diversity at senior level The Group’s Diversity Policy states that diversity in all its forms is fundamental to the Group’s business. It is available on the website at www.interserve.com/about-us/policies. The goal is to recruit, motivate, develop and retain outstanding people that reflect the diversity of the communities in which the Group operates.
The Board monitors the extent to which the Group is meeting this objective and is committed to taking action where necessary or helpful to promote equal opportunity.
The success in developing the diversity of the Board is monitored as part of our annual evaluation of Board effectiveness.
We have increased the diversity of the Board and would expect our diversity policy to lead to greater diversity on the Board and divisional boards over time. We have also set ourselves the target of having boards that better reflect the diversity of our business by 2016 and are tracking diversity measures against this goal.
CORPORATE GOVERNANCE CONTINUED
CORPORATE GOVERNANCE
INTERSERVE ANNUAL REPORT 2014 GOVERNANCE 65
Along with many in our sector, there is more work to do on improving the representation of women on our boards given that that the pipeline of candidates at senior levels (both internally and externally) is for roles which, traditionally, have not had a diverse entry - although this is improving. Our ongoing programmes seek to ensure a diverse entry and career management to retain and progress employees through their career paths.
We have also taken the following steps aimed at improving the diversity of our senior level roles:
• our Group talent and succession process for the top 300 managers includes reviewing and monitoring progress of female talent;
• ongoing monitoring of all appointments by gender and ethnicity for roles at £75,000 per annum and above;
• as part of external recruitment for senior appointments, executive search firms are instructed to provide diverse shortlists;
• data monitoring the diversity mix across the Group is included within the HR data set presented to the Executive Board and the Board on a quarterly basis;
• the diversity of participant nominations to senior leadership development programmes are monitored and actively ensure female representation on each course;
• diversity and inclusion awareness has been provided to the majority of our managers at divisional board level and above. This has included Unconscious Bias sessions run by a leading expert in this field;
• a Women in Interserve (“WiN”) network has been established which is used to provide a platform for networking among women, enabling women working within the organisation to lift their visibility and profile, and to provide development opportunities; and
• established a Mentoring/Coaching programme for women across the organisation, run in conjunction with WiN.
Further information on progress made with wider employee diversity matters can be found in the ‘Our People’ section of the Sustainability Review on pages 39 and 40.
REMUNERATION COMMITTEE The Remuneration Committee is composed entirely of independent non-executive directors, details of which are set out in the table on page 62. Keith Ludeman replaced David Thorpe as committee chairman on his retirement. The responsibilities of the committee, together with an explanation of the work undertaken and how it applies the directors’ remuneration principles of the Code, are set out in more detail in the Directors’ Remuneration Report on pages 74 to 101 and are incorporated by reference into this Corporate Governance report.
OTHER BOARD COMMITTEESThe Conflicts Committee comprises the Group Chairman or, in the event that he is interested in the matter to be considered, the Senior Independent Director, and the Company Secretary.
The General Purposes Committee comprises any two executive directors (one of whom must be the Chief Executive or, in his absence, the Group Finance Director).
The Inside Information Committee comprises the Group Chairman, Chief Executive and Group Finance Director.
The PFI Committee comprises any two or more directors.
Each committee has written terms of reference and reports on the business conducted to the following Board meeting.
Committee meetings held during the year are as follows:
Committee Number of meetings
Conflicts –
General Purposes 57
Inside Information –
PFI 1
ACCOUNTABIITY Risk CommitteeThe Board has overall responsibility for internal control (including risk management and the ongoing review of its effectiveness) and sets appropriate policies having regard to the objectives of the Group. It formally reviews the Group’s register of risks and mitigation plans twice a year and discusses any significant developments in risk exposure as and when appropriate.
As discussed on page 64, the Executive Board has a key role in risk management. In order to assist it with discharging this responsibility the Executive Board created a Risk Committee.
The committee, which met five times during the year, comprises the Chief Executive, Group Finance Director, Group Health, Safety and Environmental Manager, Group Insurance Manager, the Group Company Secretary (who is its secretary), the Group General Counsel, the Group Chief Information Officer, the Group Information Security Officer and a representative from each of the Group’s operating divisions. The internal audit partner has a standing invitation to attend. The committee has written terms of reference and provides copies of its meeting minutes to the Board.
The business covered during the year included: reviews of the Group’s prime risk areas and of contract risk allocation and control; reputation management; business continuity planning and IT disaster recovery; information security risk assessment; regular reviews of the risks presented by forthcoming legislation; and updates on current insurance, internal audit, health and safety, HR and IT developments.
CORPORATE GOVERNANCE
OVERVIEW
GO
VERNA
NCE
FINA
NCIA
L STATEMEN
TS STRATEG
IC REPORT
66 INTERSERVE ANNUAL REPORT 2014 GOVERNANCE
GOVERNANCE
CORPORATE GOVERNANCE
FINANCIAL AND BUSINESS DISCLOSURES In order to present a balanced assessment of the Company’s position and prospects, the Annual Report contains a Directors’ Responsibility Statement on page 102, an Independent Auditors’ Report about their reporting responsibilities on pages 103 to 107 and a going concern statement on page 47. An explanation of the Company’s business model and strategy for delivering the Company’s objectives is set out on pages 8 and 9, and 4 and 5, respectively.
The Directors’ Report contained on pages 52 to 59, of which this Corporate Governance report forms part, contains the information required by paragraph 13(2)(c),(d),(f),(h) and (i) of Schedule 7 to the Large and Medium-sized Companies and Groups (Accounts and Reports) Regulations 2008 (as amended by The Companies Act 2006 (Strategic Report and Directors’ Report) Regulations 2013 and The Large and Medium-sized Companies and Groups (Accounts and Reports) (Amendment) Regulations 2013)).
INTERNAL CONTROL PROCESSESThe Board has a continuous process for identifying, evaluating and managing the significant risks the Group faces together with an ongoing process to embed internal control and risk management further into the operations of the businesses. This has been in place for the period under review and until the date of approval of this Annual Report and Financial Statements. The Audit Committee, the Risk Committee and Executive Board assist the Board in the application of these principles.
The Board has documented a risk management policy setting out the prime risk areas including the threats, risk indicators, control strategy and sources of assurance. The policy is included within the Group’s internal controls manual. Internal controls are reviewed by the Board in advance of the publication of the Group’s half-year and annual reports.
The Board received and reviewed bi-annual reports from the Executive Board on the effectiveness of the Group’s system of internal control for the period under review and implements improvements from time to time in order to strengthen the control processes.
Because of the limitations that are inherent in any system of internal control, the Group’s system of internal control is designed to manage rather than eliminate the risk of failure to achieve business objectives, and can only provide reasonable, but not absolute, assurance against material misstatement or loss. The Group’s governance framework distinguishes between entities which are wholly controlled and joint ventures and associate companies in which the Group does not have overall control. For these joint ventures and associate companies, systems of internal control are applied as agreed between the Group and the other joint-venture parties or members of the associate company, as the case may be.
Financial reportingBased on submissions from the trading divisions, a budget is prepared by the Group for approval by the Board before the start of each financial year. Subsequently, forecasts of prospective financial performance are prepared as at the end of March, May and September of each year. Budgets and forecasts include the financial results, financial position and cash flows for each division and the Group Centre.
The Group has risk management systems and documented accounting policies and procedures to be applied by all entities in the Group in submitting their financial statements for consolidation to ensure that adequate accounting records are maintained and transactions are recorded accurately and fairly to permit the preparation of consolidated financial statements in accordance with International Financial Reporting Standards.
Each month, every entity within the Group submits management accounts in local currency to the Group Finance team. The consolidated management accounts include the financial results, financial position, cash flows and projections and are submitted, along with analytical commentary, to the Executive Board and subsequently the Board for review.
The management accounts submitted by members of the Group for June and December are used to prepare the half-yearly and annual financial statements. The Group Finance team reviews the disclosures in the financial statements to ensure that they comply with applicable reporting standards. The half-yearly and annual financial statements are reviewed by the Executive Board, the Audit Committee and the Board before publication.
The financial reporting process is reviewed periodically by internal audit in accordance with the programme approved by the Audit Committee each year.
A summary of the key financial risks inherent in the Group’s business is given on page 46 and a description of how the Group manages those risks is set out on page 31.
Operational controlsThe principal features of the Group’s system of operational control are:
• An established management structure comprising the Board with its various committees and an Executive Board.
• Executive Board and Board review of the monthly finance and divisional trading reports.
• Documented delegated authority limits which are kept under regular review. Larger value proposals and business acquisitions and disposals are controlled by the Board.
• Manuals setting out Group policy and procedures, with which all Group companies must comply.
CORPORATE GOVERNANCE CONTINUED

INTERSERVE ANNUAL REPORT 2014 GOVERNANCE 67CORPORATE GOVERNANCE
• The Group has certain key areas which are subject to central management or control, which include health, safety and environmental policies, legal, insurance, tax and treasury, real estate, internal and external communication, investor relations, information technology network services and operating systems, human resources and company secretarial. These functions report to members of the Executive Board.
• One or more members of the Executive Board and, in many cases, either the Chief Executive or the Group Finance Director, attend divisional board meetings.
• During the course of each year members of the Executive Board or other senior operational and financial management visit or review all trading companies to discuss and monitor the performance of those businesses.
• The Group has in place a whistleblowing policy which sets out a framework for dealing with any allegations of fraud, financial misreporting and any whistleblowing notification. A copy of the policy is available on the Company’s website at www.interserve.com.
RELATIONSHIP WITH SHAREHOLDERSThe main communications with financial investors are the half-year and full-year results presentations. These presentations are posted on our website and are available for all investors to view, along with a recording of the presentations themselves.
The Company encourages two-way communication with both institutional and private investors to develop an understanding of the views of major shareholders about the Company. The Chief Executive, accompanied by the Group Finance Director, attended 46 meetings with analysts and institutional investors during the year ended 31 December 2014 and, respectively, 13 and 39 individual meetings. Following his usual invitations, the Group Chairman held a meeting with a major shareholder and meetings were also held with major shareholders by the Chairs of the Audit and Remuneration committees, the details of which are included in their respective reports.
One-to-one meetings held with shareholders focus on such matters as Group strategy, operational performance, market trends, macro-economic influences, financial performance, merger and acquisition ambitions, peer group issues, the political environment and progress of key bids and key contract renewals.
One-to-one and group meetings held with analysts focus on the above issues and, in addition, the key factors which influence analysts’ financial forecasts, with a view to ensuring market consensus is based on accurate and up-to-date information, properly interpreted.
Having due regard to their importance as stakeholders, we also undertake regular one-to-one meetings and group presentations with our bank and private placement lenders, in which operational, strategic and market issues are discussed, together with the implications for our future financing requirements.
The Group’s annual and half-yearly results, interim management statements, trading updates, presentations given to analysts and all announcements made through the RIS are published on the Company’s website at www.interserve.com.
All shareholders are given at least 21 clear days’ notice of the AGM. It is standard practice for all directors to attend the AGM to which all shareholders are invited and at which they may put questions to the chairmen of the various committees or the Board generally. The proxy votes for and against each resolution, as well as abstentions (which may be recorded on the proxy form accompanying the notice of AGM) are counted before the AGM commences and are made available to shareholders at the close of the formal business of the meeting. The proxy votes are also announced through the RIS and posted on the Company’s website shortly after the close of the meeting.
APPROVALThis report was approved by the Board of Directors on 26 February 2015 and signed on its behalf by:
Lord Blackwell Chairman 26 February 2015
OVERVIEW
GO
VERNA
NCE
FINA
NCIA
L STATEMEN
TS STRATEG
IC REPORT

68 INTERSERVE ANNUAL REPORT 2014 GOVERNANCE
GOVERNANCE
AUDIT COMMITTEE REPORT
AUDIT COMMITTEE REPORT
INTRODUCTION FROM THE AUDIT COMMITTEE CHAIRI am pleased to present, on behalf of the Board, our Audit Committee Report on our work in relation to the financial year ended 31 December 2014.
2014 has been a busy year during which, in addition to our normal work programme, we changed our auditors from Deloitte LLP to Grant Thornton UK LLP (“Grant Thornton”), following a short but intensive tender and selection process which elicited very high quality submissions from all those involved. We also examined in depth the acquisition accounting for Initial Facilities and reviewed its internal control environment supported by Internal Audit. We welcomed two new members and had one retirement from the committee.
During the year the focus of our normal work programme has been upon the trading judgements and estimates which underpin our revenue and margin recognition on long-term construction and service contracts, impairment testing of the value of goodwill and retirement benefit obligations, all of which are covered in more detail within the body of the report.
In addition, we have also spent time evaluating the independence and the effectiveness of both internal and external audit processes as well as of the committee itself.
Anne FahyChair of the Audit Committee
ANNE FAHYChair of the Audit Committee
INTERSERVE ANNUAL REPORT 2014 GOVERNANCE 69AUDIT COMMITTEE REPORT
MEMBERSHIPThe committee is composed entirely of independent non-executive directors and is chaired by Anne Fahy. The directors who have served on the committee during the year are:
Name Date of appointment to committee
A K Fahy 1 January 2013
L G Cullen 14 November 2005
R J King 1 September 2014
K L Ludeman 1 January 2011
N R Salmon 1 August 2014
D A Thorpe 1 January 2009
Nick Salmon and Russell King were appointed to the committee on 1 August and 1 September 2014, respectively. David Thorpe retired from the committee on 31 August 2014.
Appointments to the committee are made by the Board, on the recommendation of the Nomination Committee and in consultation with the committee Chair. Anne Fahy and Les Cullen are both financially qualified. The other non-executive directors all have substantial financial experience. Directors’ biographies are included on pages 48 to 51.
The Company Secretary is secretary to the committee.
TERMS OF REFERENCEThe committee has written terms of reference based on the FRC’s Guidance on Audit Committees and which set out clearly its authority and duties. These are available on the Company’s website at www.interserve.com and on request. The terms of reference are considered at least annually by the committee and were last updated in December 2014.
The committee may investigate any activity within its terms of reference and is authorised to seek any information it requires from, and require the attendance at, any meeting of any director, officer or employee of the Company or of the Group.
The committee is authorised by the Board to obtain, at the Company’s expense, external legal or other professional advice on any matters within its terms of reference.
A full set of committee papers is provided to every director and the Chair of the committee reports to the subsequent Board meeting on the committee’s work. The Board also receives a copy of the minutes of each meeting.
ROLE AND RESPONSIBILITIESThe role and responsibilities of the committee are to:
• review with management and the external auditors the Group’s consolidated report and accounts and the half-year report and any formal announcements relating to the Group’s financial performance based on the statutory audit or half-yearly review, as the case may be, before submission to the Board;
• review the annual report and accounts and advise the Board as to whether, taken as a whole, it is fair, balanced and understandable and provides the information necessary for shareholders to assess the Company’s performance, business model and strategy;
• make recommendations to the Board on the appointment of and take responsibility for reviewing the effectiveness of, and agreement of, the fees for the statutory audit and approval of fees to be paid to the external auditors for non-audit work;
• approve the annual work programme of the internal auditor, the fees to be paid in connection with that work and review the effectiveness of the internal audit process;
• provide an independent overview of the Group’s systems of internal control, whistleblowing processes and outcomes, and financial reporting processes, through the co-ordination and supervision of the scope, quality, independence and effectiveness of the internal and external audit and other enquiries; and
• review the Company’s processes for detecting fraud.
The effectiveness of the Company and the Group’s internal control and risk management systems is reviewed by the Board.
MEETINGSThe committee met six times during the year. The external auditors were present at four of the meetings and the Head of Internal Audit and representatives from PricewaterhouseCoopers LLP (“PwC”), the provider of the internal audit function, were present at two of the meetings. The Group Chairman, Chief Executive, Group Finance Director and Group Financial Controller attended each of the meetings by invitation.
The committee has twice taken the opportunity to seek the views of the external and internal auditors in private and both the external and internal auditors have the opportunity to address the committee in private at any time should they so wish. In addition, the Chair met with both parties periodically to review audit and internal control topics on an ongoing basis, which was beneficial in a period during which we changed our external auditors and completed a significant acquisition.
OVERVIEW
GO
VERNA
NCE
FINA
NCIA
L STATEMEN
TS STRATEG
IC REPORT
70 INTERSERVE ANNUAL REPORT 2014 GOVERNANCE
GOVERNANCE
AUDIT COMMITTEE REPORT
OVERVIEW OF ACTIVITIESIn connection with the 2014 financial year the committee:
• concluded the tender process to appoint external auditors which resulted in the resignation of Deloitte LLP and the subsequent appointment of Grant Thornton, further details of which are set out in the External Audit paragraph below;
• reviewed the 2014 half-year report and annual report and financial statements. As part of this review the committee satisfied itself as to the clarity and completeness of disclosures in the financial statements and that they were appropriately contextualised. It also reviewed the Chairman’s Statement, Strategic Report and Corporate Governance statement relating to audit and risk management. As part of each review the committee received a report from the external auditors on their audit of the annual report and review of the half-year report, respectively;
• reviewed, prior to their consideration by the Board, the representation letters to be given to the external auditors in respect of the annual and half-year reports;
• reviewed audit effectiveness following the audit of the 2014 annual report taking into account the partners’ and senior audit staff’s understanding of the business, the effectiveness of the audit work in relation to major issues and how those were addressed, the quality of suggested control improvements, the appropriateness of assurance gained over parts of the Group not audited by Grant Thornton, the appropriateness and deployment of experts on technical items, the quality and comprehensibility of the audit findings report and feedback from management on the audit process generally;
• reviewed and approved the external auditors’ terms of engagement for the 2014 half-yearly review and for the audit of the 2014 annual report;
• received a briefing from the Group Finance Director on the principal judgements made in determining the 2014 half-year report and the 2014 annual report and financial statements, reviewed those judgements and, taking into account the external auditor’s view, satisfied itself that the judgements and estimates were both appropriate and robust and in accordance with the Group’s accounting policies;
• reviewed minor textual changes to the key accounting policies and satisfied itself that there had been no change in substance and that the accounting policies remained appropriate;
• considered and agreed the scope and fees to be paid to the external auditors for the 2014 half-yearly review and 2014 audit;
• received a bi-annual update on the Group’s monitoring of fraud risk assessment;
• reviewed the risk register and ensured that the audit activities aligned with it;
• ensured itself as to the adequacy of controls across the worldwide businesses, particularly with regard to entities which are not controlled by the Group;
• monitored non-audit fees in comparison to the audit fees in accordance with the Company’s policy on the provision of non-audit services (as detailed in External Auditor Objectivity and Independence below);
• reviewed the internal audit programme and findings and remediation actions as well as agreeing the internal audit plan for 2015, ensuring an adequate coverage of risks;
• received a report at each meeting on the progress and outcome of the investigation of whistleblowing notifications;
• reviewed its terms of reference and whether any changes needed to be proposed to the Board;
• conducted an evaluation exercise to review its own effectiveness; and
• based upon the review of audit effectiveness, made a recommendation to the Board regarding the continuation in office for a second year of Grant Thornton for the 2015 external audit.
SIGNIFICANT ISSUES CONSIDEREDThe committee has reviewed the key judgements applied in the preparation of the consolidated financial statements which have been prepared in accordance with the accounting policies and detailed notes to the financial statements on pages 114 to 152. The committee received a paper, prepared by management and reviewed by Grant Thornton, setting out by division the key judgements made in relation to the following matters:
• Revenue and margin recognition The recognition of revenue and profits on long-term
construction and service contracts requires management to exercise significant levels of judgement involving a high degree of discretion and control. For construction-type contracts the key judgement concerns the recognition of profits, the recovery of work-in-progress and debtors, especially on non-certified amounts (including variations and claims) and forecast outcomes. For service-type contracts the key accounting risk is that the revenue and costs are not recognised in the correct period and provisions are not made for losses when foreseen. For contracts in the Equipment Services division, where revenue is recognised on either the sale of equipment or over the period of an equipment hire, the key accounting risk relates to whether the appropriate cut-off for sales and period of hire has been applied and the recoverability of debtors.
AUDIT COMMITTEE REPORT CONTINUED
INTERSERVE ANNUAL REPORT 2014 GOVERNANCE 71AUDIT COMMITTEE REPORT
The committee reviewed the audit findings and management judgements/reviews undertaken on a selection of contracts perceived to carry the highest risk of misstatement against the background of its familiarity with the operationally and/or commercially challenged contracts which are regularly discussed at Board meetings. This also included the committee satisfying itself as to the recoverability of long-dated debtor and work-in-progress balances.
The committee reviewed the level of provisioning made by management at both contract level and centrally at the year-end in order to form a view of the completeness of provisions on loss-making contracts and whether there was a requirement to include a forward loss provision. The quality of earnings and movement in provisions during the course of the year was also reviewed.
• Acquisition accounting for the acquisition of Initial Facilities and esg The committee reviewed the fair value of the consideration, opening net asset position and examined the fair value adjustments, how the acquisition expenses had been charged to the income statement, the calculation of the fair value of intangible assets acquired with the business in respect of the order book and customer relationships (including the significant assumptions made by management in the determination of those values) and satisfied itself that these were appropriate.
• Carrying value of goodwill and other intangible assets The carrying value of goodwill and other intangible assets on
the balance sheet at the year-end was £524.5 million which included goodwill with a value of £401.4 million.
The committee reviewed management’s determination of cash generating units, the key assumptions used such as the discount rate and future cash flows in light of current business performance and future projections and satisfied itself of the appropriateness of management’s impairment testing, that significant headroom exists and that any reasonable sensitivity to the assumptions did not indicate any impairment.
• Retirement benefit accountingCalculation of the retirement benefit obligation requires management to make a number of assumptions including the selection of an appropriate discount rate and mortality.
The committee satisfied itself as to the reasonableness of the assumptions set out in note 30 to the financial statements, taking into account the independent third-party confirmations of the pension assets valuation held at the balance sheet date and the accounting entries relating to the insurance buy-in completed by the pension trustees in August. The committee also satisfied itself that the accounting treatment for the insurance contract buy-in was appropriate and in accordance with relevant accounting standards.
FAIR, BALANCED AND UNDERSTANDABLE FINANCIAL STATEMENTSThe directors are responsible for preparing the annual report. At the request of the Board the committee considered whether the report and accounts taken as a whole was fair, balanced and understandable. In making that assessment, the committee took into account whether the report and accounts provided the necessary information for shareholders to assess the Company’s performance, business model and strategy.
The committee was satisfied that, taken as a whole, the 2014 annual report was fair, balanced and understandable and contained the information set out above and reported accordingly to the Board. The Board’s statement in this regard is set out on page 102.
EXTERNAL AUDITHaving decided in 2013 to tender the provision of external audit services, a timetable and process was devised which would permit the committee to make a recommendation to the Board in sufficient time to enable a decision to be made in advance of posting the 2014 AGM Notice.
In order to conduct the process of receiving tender bids, evaluating presentations by the competing audit firms and making a recommendation in an efficient manner, this task was delegated to a panel comprising the Chair of the committee, the Senior Independent Director, the Group Finance Director, the Company Secretary and the Group Financial Controller.
Tenders were invited from four audit firms during the second week of January 2014 with a submission closing date five weeks later. During the bid preparation period a two-week window was set aside for meetings to take place between each of the bidders and key members of staff from around the Group. The tenders were evaluated against relevant criteria and oral presentations were delivered to the panel by each of the four firms, following which the panel made its recommendation to the committee.
The committee Chair then undertook a brief consultation with key shareholders and completed reference checks. The recommendation to appoint Grant Thornton was made to and accepted by the Board.
Grant Thornton was formally appointed as the Company’s auditor on 13 June 2014 following approval by shareholders at the AGM and Deloitte LLP’s resignation as auditor.
OVERVIEW
GO
VERNA
NCE
FINA
NCIA
L STATEMEN
TS STRATEG
IC REPORT

72 INTERSERVE ANNUAL REPORT 2014 GOVERNANCE
GOVERNANCE
AUDIT COMMITTEE REPORT
EXTERNAL AUDITOR OBJECTIVITY AND INDEPENDENCE The Company has an established policy aimed at safeguarding the independence and objectivity of the Group’s external auditors and this was one of the factors taken into account during the audit tender process.
The external auditors may carry out certain categories of non-audit work in areas that have been pre-approved by the committee up to a monetary limit of £150,000 per transaction. Any other work for which management may wish to instruct the external auditors up to a value of £250,000 must be approved in advance by the committee or, more normally, by the committee Chair on its behalf. Instructions above £250,000 require prior approval of the Board. The pre-approved services may be summarised as follows:
• assurance services, tax compliance and advisory services and where audit reports are required by statute or regulation; and
• other services, encompassing general consultancy services.
The above policy also prohibits the auditors auditing their own work, making management decisions, entering into any arrangement in relation to audit work whereby a joint interest is created between the Company and the auditor, acting in the role of advocate for the Company or being appointed as recruitment consultants without the committee’s prior consent.
The committee received a report at each of its meetings itemising the fees expended and forecast to be expended with Grant Thornton for non-audit services. In addition to the above safeguards, non-audit services were delivered by specialists and advisers who were independent of the audit team.
The committee reviewed the nature and extent of non-audit fees expended on bid support to one of the Group’s associate companies for a PFI project (the engagement for which had been entered into some considerable time before Grant Thornton’s appointment as auditor), advising on completion accounts for the Initial Facilities’ acquisition, tax and VAT compliance and the review of the half-year report (representing 26.5 per cent, 2.3 per cent, 2.3 per cent and 9.5 per cent, respectively, of the overall audit fee of £945,000), and the committee concluded that the safeguards set out above were sufficient so as not to compromise auditor objectivity and independence.
Further details of the audit and non-audit fees paid to Grant Thornton are included in note 4 to the financial statements on page 123.
The committee also assessed Grant Thornton’s objectivity, independence and effectiveness at the end of the half-year review and 2014 audit cycles, taking into account the views of a number of those involved in the audit process as well as having private meetings with the auditors and informal conversations with the Chair. The committee concluded that the audit had been effective and that Grant Thornton remained independent throughout the process.
INTERNAL AUDITThe function of internal audit is to provide an independent and objective appraisal to the Board, through the committee, of the adequacy and effectiveness of the processes established to control the business and to assist the Board in meeting its objectives and discharging its responsibilities.
The committee is responsible for monitoring, reviewing and assessing the role and effectiveness of internal audit in the overall context of the Group’s risk management system and review.
The details of the annual internal audit programme for the following year are submitted to the Audit Committee each December for approval, and may be modified (subject to agreement of the Audit Committee) based on changing circumstances.
The 2014 programme was modified to include a post-acquisition review of Initial Facilities, together with other minor changes.
The internal audit programme of work is risk based, with key business activities and financial reporting processes considered for internal audit review on a cyclical basis. The work is carried out by PwC under an outsource contract, renewable annually.
The principal objectives for the 2014 plan were to provide core assurance against those areas identified as high risk together with further assurance on some of the medium-risk areas identified for rotational audit testing.
The committee received a summary of each internal audit review covering the findings, proposed corrective actions and management’s responsiveness to those findings and recommendations.
Closure of the agreed corrective actions is tracked via a web-based system and is monitored by management and reported to the committee in June and December each year.
In order to monitor the level of control across the Group all material business units and relevant central and support functions were again required to complete an online self-assessment of their compliance with key controls covering 15 different business processes.
AUDIT COMMITTEE REPORT CONTINUED
INTERSERVE ANNUAL REPORT 2014 GOVERNANCE 73AUDIT COMMITTEE REPORT
This year, in order to facilitate a greater level of analysis across the Group, each business unit which was subject to a field audit in the year was also required to complete the online self-assessment. The principal findings were:
• most businesses either maintained or improved their compliance to a level in excess of 95 per cent; and
• business continuity planning can be further improved in the Construction and International businesses by conducting more regular testing of the plans.
Whilst compliance scores were generally lower in the Initial Facilities businesses within Support Services, as it is in the course of transition to the higher control standards of the Group, considerable improvement has already been made in this direction, underpinning effective integration.
The Internal Audit partner has direct access to the Chair of the committee and they meet on a periodic basis in addition to the formal committee process.
In December the committee agreed the internal audit work plan for 2015. Consistent with previous years, the plan is designed to provide core assurance against areas identified as high risk against an updated audit universe to reflect the changing risk profile of the Group, together with further assurance on some of the medium-risk areas identified for rotational testing and review of new activities and businesses.
In view of PwC’s eight-year tenure as internal auditor, initially in a co-sourced capacity and latterly as a fully outsourced function, the committee intends to put the provision of internal audit services out to tender during the course of 2015.
REVIEWAfter undertaking a review of its own performance the committee concluded that it had been effective in discharging the obligations entrusted to it by the Board.
AGMThe Chair of the Audit Committee will be available at the AGM to answer questions about the work of the committee.
APPROVALThis report was approved by the Board of Directors on 26 February 2015 and signed on its behalf by:
Anne FahyChair of the Audit Committee 26 February 2015
OVERVIEW
GO
VERNA
NCE
FINA
NCIA
L STATEMEN
TS STRATEG
IC REPORT
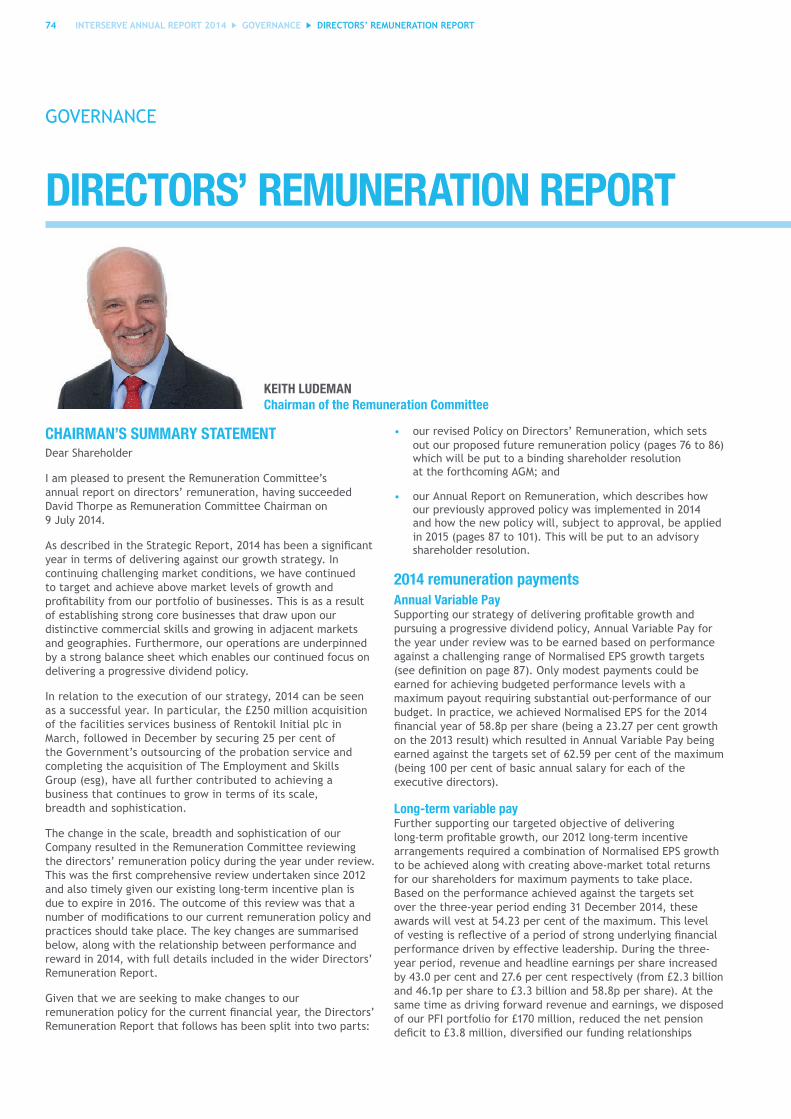
74 INTERSERVE ANNUAL REPORT 2014 GOVERNANCE
GOVERNANCE
DIRECTORS’ REMUNERATION REPORT
CHAIRMAN’S SUMMARY STATEMENTDear Shareholder
I am pleased to present the Remuneration Committee’s annual report on directors’ remuneration, having succeeded David Thorpe as Remuneration Committee Chairman on 9 July 2014.
As described in the Strategic Report, 2014 has been a significant year in terms of delivering against our growth strategy. In continuing challenging market conditions, we have continued to target and achieve above market levels of growth and profitability from our portfolio of businesses. This is as a result of establishing strong core businesses that draw upon our distinctive commercial skills and growing in adjacent markets and geographies. Furthermore, our operations are underpinned by a strong balance sheet which enables our continued focus on delivering a progressive dividend policy.
In relation to the execution of our strategy, 2014 can be seen as a successful year. In particular, the £250 million acquisition of the facilities services business of Rentokil Initial plc in March, followed in December by securing 25 per cent of the Government’s outsourcing of the probation service and completing the acquisition of The Employment and Skills Group (esg), have all further contributed to achieving a business that continues to grow in terms of its scale, breadth and sophistication.
The change in the scale, breadth and sophistication of our Company resulted in the Remuneration Committee reviewing the directors’ remuneration policy during the year under review. This was the first comprehensive review undertaken since 2012 and also timely given our existing long-term incentive plan is due to expire in 2016. The outcome of this review was that a number of modifications to our current remuneration policy and practices should take place. The key changes are summarised below, along with the relationship between performance and reward in 2014, with full details included in the wider Directors’ Remuneration Report.
Given that we are seeking to make changes to our remuneration policy for the current financial year, the Directors’ Remuneration Report that follows has been split into two parts:
• our revised Policy on Directors’ Remuneration, which sets out our proposed future remuneration policy (pages 76 to 86) which will be put to a binding shareholder resolution at the forthcoming AGM; and
• our Annual Report on Remuneration, which describes how our previously approved policy was implemented in 2014 and how the new policy will, subject to approval, be applied in 2015 (pages 87 to 101). This will be put to an advisory shareholder resolution.
2014 remuneration payments Annual Variable PaySupporting our strategy of delivering profitable growth and pursuing a progressive dividend policy, Annual Variable Pay for the year under review was to be earned based on performance against a challenging range of Normalised EPS growth targets (see definition on page 87). Only modest payments could be earned for achieving budgeted performance levels with a maximum payout requiring substantial out-performance of our budget. In practice, we achieved Normalised EPS for the 2014 financial year of 58.8p per share (being a 23.27 per cent growth on the 2013 result) which resulted in Annual Variable Pay being earned against the targets set of 62.59 per cent of the maximum (being 100 per cent of basic annual salary for each of the executive directors).
Long-term variable payFurther supporting our targeted objective of delivering long-term profitable growth, our 2012 long-term incentive arrangements required a combination of Normalised EPS growth to be achieved along with creating above-market total returns for our shareholders for maximum payments to take place. Based on the performance achieved against the targets set over the three-year period ending 31 December 2014, these awards will vest at 54.23 per cent of the maximum. This level of vesting is reflective of a period of strong underlying financial performance driven by effective leadership. During the three-year period, revenue and headline earnings per share increased by 43.0 per cent and 27.6 per cent respectively (from £2.3 billion and 46.1p per share to £3.3 billion and 58.8p per share). At the same time as driving forward revenue and earnings, we disposed of our PFI portfolio for £170 million, reduced the net pension deficit to £3.8 million, diversified our funding relationships
KEITH LUDEMANChairman of the Remuneration Committee
DIRECTORS’ REMUNERATION REPORT
INTERSERVE ANNUAL REPORT 2014 GOVERNANCE 75DIRECTORS’ REMUNERATION REPORT
through a US$350 million private placement and a £74.8 million equity issue, and acquired BEST (Interserve Working Futures), Paragon, Advantage Healthcare (Interserve Healthcare), TOCO, Topaz (Adyard), Initial Facilities and The Employment and Skills Group (esg) and significantly expanded our facilities management footprint in the Middle East. This combination of robust financial performance and effective leadership resulted in growth in TSR of 111.6 per cent, being within the top quartile against our sector-based peer group, over the three-year performance period.
In light of the performance achieved, the Remuneration Committee is satisfied that the above reward outcomes are appropriate and justified.
Review of remuneration policyAs described above, the Company has been transformed in terms of the scale, breadth and sophistication of its operations in recent years, currently employing c80,000 people in over 40 countries.
Mindful of this change, and the fact that a formal remuneration review had not been undertaken since 2012, the Remuneration Committee undertook a comprehensive review of remuneration policy and practice during 2014. The review considered (i) the need to continue to align remuneration policy with the Company’s strategy; (ii) the increased responsibilities of each of the senior executives in light of the factors noted above; (iii) the need to retain and motivate our highly regarded executive team in the current commercial context which has seen a number of our competitors appoint new leadership teams; (iv) comparable market rates of pay and (v) developments in institutional investors’ ‘best practice’ expectations.
The key conclusions of this review in relation to executive directors included:
1. Base salary levels should be revised to better reflect individuals’ current roles and responsibilities. Full details of the changes made to base salaries and how these relate to individuals’ revised roles and responsibilities are set out on page 87.
2. Annual Variable Pay opportunity is to increase from 100 to 125 per cent of salary for the Chief Executive and the Group Finance Director. The additional Annual Variable Pay opportunity has been introduced to incentivise improved performance in a number of strategic areas that the Board is targeting for improvement in 2015.
In addition, a toughening of the current approach to part deferral of Annual Variable Pay earned will take place in that executives will be required to continue to defer part of Annual Variable Pay even if the Company’s increased share ownership guidelines have been met (deferral does not currently apply once share ownership guidelines have been met). A full summary of the revisions to Annual Variable Pay for 2015 is included on pages 80 and 81.
3. The current long-term incentive plan will be proposed for renewal at the 2015 AGM on broadly the same terms as the existing plan (noting it is due to expire in 2016), albeit with a reduction in the threshold vesting target (as it currently applies to the TSR performance condition) from 30 per cent to 25 per cent to bring it into line with current institutional investors’ expectations.
4. The holding period and current recovery and withholding provisions (i.e. clawback and/or malus) under the long-term incentive plan are to be enhanced so that they operate for a period of two years from the relevant receipt date of incentive payments (from the current one-year period).
5. Higher share ownership guidelines are to operate at 200 per cent of salary (increased from 100 per cent of salary).
6. Subject to shareholder approval at the AGM, the changes set out in paragraph 2 will come into effect as of 1 January 2015 and in paragraphs 3 to 5 to awards to be granted after 12 May 2015.
The above changes, which continue to weight remuneration towards long-term performance and enable variable pay to be recovered and/or withheld in certain circumstances, are considered to remain appropriate for a Company that continues to target the delivery of long-term profitable growth for shareholders. Challenging performance targets (weighted towards our key internal measure of financial success, i.e. Normalised EPS), as summarised in the Annual Report on Remuneration, will also continue to apply to variable pay in 2015 in order to incentivise management to continue building a strong core business which delivers sustained earning growth to underpin our progressive dividend policy.
Given the nature of the changes detailed above, and mindful of current sentiment surrounding executive remuneration, the Remuneration Committee consulted with the Company’s major shareholders and the leading shareholder protection bodies (i.e. the Investment Association (following its merger with ABI Investment Affairs) and ISS) in relation to the above changes. The feedback from this consultation exercise was reflected in the final decisions taken by the Committee (e.g. the revised share ownership guidelines were set at 200 per cent of salary as opposed to 150 per cent of salary as originally proposed) and, where required, the changes are reflected in the revised Remuneration Policy, set out in detail on pages 76 to 86, for which we are seeking your support at the AGM.
We believe our new Remuneration Policy achieves this aim and supports our strategic objectives and trust that you will endorse it with a vote in favour at the AGM, as the directors intend to do in respect of their own beneficial holdings.
Keith LudemanChairman of the Remuneration Committee
OVERVIEW
GO
VERNA
NCE
FINA
NCIA
L STATEMEN
TS STRATEG
IC REPORT
76 INTERSERVE ANNUAL REPORT 2014 GOVERNANCE
GOVERNANCE
REMUNERATION POLICYIn this section we set out our remuneration strategy and policy, how the policy supports this strategy, how the Remuneration Committee intends to operate the policy, the selection of performance conditions, why we believe they both support the strategy and are appropriately stretching, together with other relevant information about the directors’ service agreements.
REMUNERATION STRATEGYOur Company strategy is to build strong core businesses that draw upon our distinctive commercial skills, growing our businesses in adjacent markets and geographies. For shareholders we aim to deliver above market growth with a strong balance sheet and market profitability from our portfolio of businesses, supporting a continued progressive dividend policy. The key to delivering our strategy is the need to retain and motivate stable leadership teams who understand and are able to apply the core skills and control framework of the business into adjacent markets in order to grow the business.
Our remuneration strategy is underpinned by remuneration packages which are designed to motivate and retain the high performing people necessary to deliver our strategy. These remuneration packages:
• are simple and transparent, apply some way down the organisation and align with shareholders’ interests;
• reflect the views of our shareholders, shareholder protection bodies and other stakeholders;
• are designed to incentivise the delivery of above market growth in the short and medium term, without encouraging excessive risk taking and only deliver maximum rewards for exceptional performance against challenging targets; and
• provide further long-term focus through the reinvestment in, and holding requirement for, Company shares in the Annual Variable Pay scheme, the holding requirement for Company shares in the Performance Share Plan and the Shareholding Guidelines.
REMUNERATION POLICYThis part of the Directors’ Remuneration Report sets out the remuneration policy for the Company with effect from 12 May 2015, subject to shareholder approval at the AGM to be held on that day.
The following table summarises the main elements of the executive directors’ remuneration policy for 2015 onwards, the key features of each element, their purpose and linkage to our strategy. Details of the remuneration arrangements for the non-executive directors are set out on page 85.
Element of pay Purpose and link to strategy How operated in practice (including framework for assessing performance) Maximum opportunity
Base salary To recruit and retain executives of a suitable calibre for the role and duties required.
Reflects the market rate for the individual and their role.
Reviewed annually with any changes generally taking effect from 1 July.
Salaries are determined taking into account:
• the experience, responsibility, effectiveness and market value of the executive;
• the pay and conditions in the workforce;
• pay relativities within the Group;
• broadly the median position in light of remuneration within other similar companies and the rest of the Company; and
• affordability, given the profits of the Company.
Normally paid monthly in cash.
There is no prescribed maximum annual increase. The Committee is guided by the general increase for the broader workforce but recognises that higher increases may be appropriate where an individual is promoted, changes role, where the size, composition and/or complexity of the Group changes or where an individual is materially below market comparators or is appointed on a below market salary with the expectation that his/her salary will increase with experience and performance.
DIRECTORS’ REMUNERATION REPORT CONTINUED
DIRECTORS’ REMUNERATION REPORT

INTERSERVE ANNUAL REPORT 2014 GOVERNANCE 77
Element of pay Purpose and link to strategy How operated in practice (including framework for assessing performance) Maximum opportunity
Benefits To provide benefits commensurate to the market in which the Company operates and/or the market in which the director is based and in line with policies applicable to all other senior salaried employees.
Car (cash allowance and/or company car) and fuel (or fuel allowance).
Private medical insurance.
Permanent health insurance.
Life assurance.
Relocation expenses, allowance for disruption and ongoing expatriate benefits.
Directors’ and officers’ liability insurance.
Reasonable personal use of mobile telephone.
Small tokens with a value not exceeding £1,000 to mark significant events (e.g. long service, retirement etc).
The value of benefits may vary from year to year depending on the cost to the Company.
Additional benefits may be provided and the range of those benefits may vary taking into account market practice, the relevant circumstances and the requirements of the executive.
Pension To provide benefits commensurate to the market in which the Company operates.
A Company contribution calculated at up to 15% of base salary for executive directors provided they are making the maximum 8% employee contribution.
Employees whose pension provision exceeds HMRC limits are permitted to opt out of making pension contributions and instead receive the Company contribution as a non-enhanceable salary supplement.
Employees who elect to take the cash allowance still benefit from the life cover of four times base salary provided to members of the pension scheme and death-in-service cover.
Employees who have not chosen to opt out of making pension contributions are eligible to participate in the Company’s “SMART Pensions” arrangement. SMART Pensions is a salary sacrifice arrangement set up by the Company providing an option for employee pension contributions to be met by their employer following a corresponding sacrifice in their contractual pay. This scheme affords the Company a saving in employer’s National Insurance contributions.
Employer’s defined contribution and/or pension cash supplement up to a total maximum of 15% of base salary.
DIRECTORS’ REMUNERATION REPORT
OVERVIEW
GO
VERNA
NCE
FINA
NCIA
L STATEMEN
TS STRATEG
IC REPORT
78 INTERSERVE ANNUAL REPORT 2014 GOVERNANCE
GOVERNANCE
DIRECTORS’ REMUNERATION REPORT
Element of pay Purpose and link to strategy How operated in practice (including framework for assessing performance) Maximum opportunity
Annual Variable Pay
To incentivise the achievement of annual targets, rewarding strong operational performance in line with and in excess of targeted performance and which promote the long-term success of the Company.
Targets are set by the Committee with reference to stretching targets that are set annually by the Board.
For Variable Pay earned up to 100% of salary, a majority (if not all) of the Variable Pay will be based on financial targets and a minority (if at all) of the Variable Pay may be based on other performance metrics linked to the business strategy.
For Variable Pay above 100% of salary (i.e. for the Chief Executive and Group Finance Director), in order to maintain a common set of targets across the executive team, supplementary stretching non-financial targets are applied to the additional Variable Pay opportunity beyond 100% of salary.
Although Annual Variable Pay is deliverable in cash, an element of any payment in excess of 25% of basic salary is required to be invested in Company shares in accordance with the arrangements stated below:
• for the balance of any Annual Variable Pay received between 25% and 50% of basic salary, 30% of the net Variable Pay must be invested in Company shares and 70% may be retained; and
• for the balance of any Annual Variable Pay received between 50% and 100% of basic salary or, in the case of the Chief Executive and Group Finance Director, between 50% and 125% of basic salary, 50% of the net Variable Pay must be invested in Company shares and 50% may be retained.
Company shares so acquired must be held for three years and dividends will accrue on deferred shares.
The Committee has the overriding discretion to adjust the Variable Pay outcome up or down (subject to the overall maximum set out in the adjacent column) to ensure the payment is fair and appropriate in all the circumstances.
The Annual Variable Pay arrangements include provisions that enable the Committee to recover value overpaid (clawback) or to withhold future Variable Pay awards (malus) in the event of misstatement, error or misconduct for a period of two years after the date on which a payment is made.
Annual Variable Pay is not pensionable.
Maximum opportunity: 125% of basic salary for the Chief Executive and Group Finance Director and 100% of basic salary for the remaining executive directors.
Entry level performance: No more than 10% of basic salary in relation to financial targets.
A graduated scale of targets operates between entry level and maximum performance.
Where non-financial targets are set, it may not always be possible to set a graduated scale of targets with some elements requiring a subjective assessment of the level of performance achieved.
DIRECTORS’ REMUNERATION REPORT CONTINUED

INTERSERVE ANNUAL REPORT 2014 GOVERNANCE 79DIRECTORS’ REMUNERATION REPORT
Element of pay Purpose and link to strategy How operated in practice (including framework for assessing performance) Maximum opportunity
Performance Share Plan (PSP)
To provide a longer term incentive to incentivise the executive directors to achieving the Group’s longer term objectives and promote the long-term success of the Company.
To provide alignment with shareholders and provide a retention tool.
PSP awards may be granted each year to senior executives.
Awards will be made in the form of nil-cost options.
The awards will usually vest no earlier than the third anniversary of the date of grant, provided that the performance conditions have been satisfied over a three-year period (commencing on 1 January in the year of the award).
Post-tax vested shares must be retained for at least a two-year holding period after vesting.
Dividends notionally accrue on awards from the date of award (up to the earlier date of exercise of the nil-cost option or the conclusion of a holding period of up to two years from vesting) and an equivalent cash sum will become payable on settlement to the extent that the shares ultimately vest.
The PSP includes provisions that enable the Committee to recover value overpaid on vesting (clawback) or to withhold future variable pay awards (malus) in the event of misstatement, error or misconduct for a period of two years after the date on which an award vests.
Long-term incentive awards vest based on three-year performance against a challenging range of EPS and, separately, relative TSR performance targets.
EPS performance targets are set after having due regard to internal planning and market expectations for the Company’s performance and relative TSR performance is measured against an appropriate comparator group.
No more than 25% of each part of an award may vest for achieving the threshold performance levels with full vesting for achieving the maximum performance targets under each element (e.g. upper quartile TSR performance) with graduated scales operating between performance points. No awards vest for below threshold performance levels.
The Committee will review the performance conditions each year prior to awards being made (e.g. to determine whether the TSR comparator group continues to remain appropriate, whether the range of EPS performance targets remains appropriate and, more generally, in light of the Company’s long-term strategy and growth aspirations) and may make appropriate revisions in light of developments in the Company’s strategy. Should there be a material change in the proposed performance conditions (e.g. introducing an additional performance metric) appropriate dialogue with the Company’s major shareholders would take place along with a full explanation in the Annual Report on Remuneration to support any such change.
Maximum: 150% of basic salary (at the date of grant) for the executive directors, save in exceptional circumstances in relation to recruitment or retention where an award of up to 200% of basic salary (at the date of grant) may be made.
No more than 25% of any part of a performance condition can vest for achieving the threshold performance level.
OVERVIEW
GO
VERNA
NCE
FINA
NCIA
L STATEMEN
TS STRATEG
IC REPORT
80 INTERSERVE ANNUAL REPORT 2014 GOVERNANCE
GOVERNANCE
DIRECTORS’ REMUNERATION REPORT
Element of pay Purpose and link to strategy How operated in practice (including framework for assessing performance) Maximum opportunity
All-employee share schemes
To support and encourage share ownership by employees at all levels.
The Company currently provides two all-employee HMRC-approved share schemes for its employees, the Interserve Sharesave Scheme 2009 (the “Sharesave Scheme”) and the Interserve Share Incentive Plan 2009 (the “SIP”).
Under the Sharesave Scheme, eligible employees may enter into a savings contract for a minimum fixed term of three years and at the end of the savings period they have the option to buy shares in the Company at an exercise price fixed at the start of the savings contract.
Under the SIP, eligible employees are offered the opportunity to invest pre-tax earnings (subject to HMRC limits per tax year) in Company shares under a regular monthly share purchase plan or by up to two lump sum payments per tax year (or a combination of the two). Shares so purchased are placed in trust. The shares can be released from the trust to participants at any time, but income tax and national insurance contributions are payable on their value should they be released within five years of their purchase date.
The SIP rules also provide for matching shares and free shares (up to certain prescribed limits) to be given to participants.
Dividend payments on SIP shares are reinvested in dividend shares and must be held in the trust for three years.
The executive directors are entitled to participate in both schemes on the same terms as all other eligible employees. Maximum opportunity is the same for all participants as defined within the terms of the scheme and prescribed by HMRC.
Shareholding guidelines
Under the Shareholding Guidelines executive directors are expected to build up over time a shareholding equivalent to 200% of their base salary. Shares purchased under the Annual Variable Pay arrangements, the 2002 Executive Share Option Scheme, vested awards under the PSP (whether or not exercised), the Sharesave Scheme and the SIP also count toward this limit. Share options, whether or not vested, do not count towards satisfying these Guidelines.
The Remuneration Committee retains the discretion to adjust the requirement to invest Annual Variable Pay in Company shares and retain share awards on vesting in appropriate circumstances.
Notes to the tableThe remuneration packages of the executive directors and senior executives at Group Centre and Support Services were reviewed in August 2014.
As part of approving the above policy, which includes the amendments explained below when compared against the existing policy, the Committee also made a number of adjustments to individual executive director salary levels. These are explained on page 87. In light of the changes to executive directors’ overall remuneration packages, the Committee resolved that during the three-year remuneration policy period that is expected to run from the 2015 AGM that, absent any significant event, future increases (if any) are anticipated to be in line with the increases awarded to the UK wider-salaried workforce.
With regards to performance conditions, the Committee will continue to select financial and, if appropriate, non-financial strategic measures as targets for Annual Variable Pay that are key performance indicators for the business over the short term.
In view of their increased responsibilities, the need to retain and motivate the Chief Executive and Group Finance Director, comparable market remuneration packages and subject to approval of the new Remuneration Policy, the Committee intends to increase their maximum Variable Pay potential from 100 per cent of salary to 125 per cent of salary, to incentivise delivery against a number of the Company’s non-financial key performance indicators, subject to appropriately stretching targets in respect of this additional 25 per cent. No change in quantum for other executive directors (at 100 per cent of salary) is proposed.
DIRECTORS’ REMUNERATION REPORT CONTINUED

INTERSERVE ANNUAL REPORT 2014 GOVERNANCE 81DIRECTORS’ REMUNERATION REPORT
Tougher recovery and withholding (clawback/malus) and deferral requirements are intended to apply to the Annual Variable Pay structure in 2015 which will see the recovery period extended in the event of a material misstatement of the annual results within a two-year period (increased from one) and a requirement to invest a proportion of post-tax Variable Pay in Company shares, regardless of whether or not the shareholding guidelines have been met.
For the long-term incentives, the Committee will select a combination of measures that provide a good focus on the outcomes of the Company’s strategy together with sustainable improvements in long-term profitability together with appropriate and demanding targets in the context of the Company’s trading environment and strategic objectives.
The Committee considers that, for awards made to date, a combination of normalised EPS and TSR for the Executive Board is the most appropriate measure of performance for awards made under the PSP. The EPS target rewards significant and sustained increases in value and delivers strong “line of sight”, whilst the TSR performance condition provides balance by rewarding good relative stock market performance and introduces an element of share price-based discipline to the package. The blend of these two complementary measures is considered to reduce the risk level of the PSP compared to the position if a single metric applied to the entire award. No change to this approach is currently envisaged in 2015 and beyond.
The retention and withholding provisions are to be enhanced for future PSP awards so that they also operate for a period of two years from the relevant receipt date of incentive payments (from the current one-year period). Furthermore, in response to shareholder feedback during consultation over the changes to executive remuneration for 2015, a two-year holding period will apply to future PSP awards granted from 2015 to provide even greater alignment between our executives and shareholders over the long term. In view of this increased holding period, vested but unexercised, PSP awards will be counted towards the shareholding guidelines.
Given the limited number of direct comparator companies to the Company, the relative TSR peer group is to be broadened from a small number of our competitors for the 2015 awards so that it comprises the FTSE 250 Index constituents (excluding investment trusts). Use of a broader TSR peer group is considered to have the potential to provide a keener alignment between performance and reward over the long term as it limits the potential for the performance of one or two companies to disproportionately impact the vesting result which had become the case in operating a small bespoke peer group.
There are no performance conditions for the Sharesave Scheme and SIP as they are all-employee share plans aimed at encouraging wider employee share ownership.
The remuneration policy for the executive directors is designed with regard to the policy for employees across the Group as a whole. There are some differences in the structure of the remuneration policy for executive directors and other senior employees, such as the higher Variable Pay maxima for the Chief Executive and Group Finance Director and Variable Pay targets weighted 70 per cent on divisional and 30 per cent on Group performance, which the Committee believes is necessary to reflect the different levels of responsibility of employees across the Group. In particular, as remuneration levels overall are higher, performance-linked variable pay comprises a much higher proportion of remuneration at more senior levels and there is more of a focus on Group results, rather than business unit or individual performance. This provides a stronger alignment of interest between senior executives and investors.
Specifically, benefits provided to executive directors (with the provision of a cash allowance and/or company car benefit the element that is considered significant in value terms and limited to £30,000) are aligned with those provided to senior managers across the Group, as is participation in the PSP, which is limited to the top 130 or so senior employees. Senior employees below Executive Board level are provided with lower levels of awards that may only have an EPS-based performance condition.
The Shareholding Guidelines, which are to be increased from the current 100 per cent of base salary to 200 per cent of base salary, are not applicable other than to the executive directors.
For the avoidance of doubt, in approving this Directors’ Remuneration Policy, authority is given to the Company to honour any commitments entered into with current or former directors (such as the payment of a pension or the vesting or exercise of past share awards) that have either been set out in the previously approved remuneration policy or remuneration reports or disclosed to and approved by shareholders and in respect of outstanding share awards as detailed on pages 95 to 98 of the Annual Report on Remuneration. Details of any payments to former directors will be set out in the Annual Report on Remuneration as they arise.
OVERVIEW
GO
VERNA
NCE
FINA
NCIA
L STATEMEN
TS STRATEG
IC REPORT

82 INTERSERVE ANNUAL REPORT 2014 GOVERNANCE
GOVERNANCE
DISCRETION RETAINED BY THE COMMITTEERemuneration payments can only be made if they are consistent with the approved Remuneration Policy, the relevant plan rules or are otherwise approved by ordinary resolution of the members of the Company.
Annual Variable Pay and Long-Term Incentive Plan flexibilityThe Committee will operate the Company’s incentive plans according to their respective rules and consistent with normal market practice, the Listing Rules and HMRC rules, where relevant, including flexibility and discretion in a number of respects and as set out in the respective plan rules. In particular, but without limitation, the Committee has flexibility regarding: the testing of a performance condition over a shortened performance period; how to deal with a change of control or restructuring of the Group (as set out in more detail on page 84); determination of a good/bad leaver for incentive plan purposes; and adjustments required in certain circumstances (e.g. rights issues, corporate restructuring, events and special dividends).
The Committee also retains the discretion to:
• adjust the targets and/or set different measures and alter weightings for the Annual Variable Pay arrangements and PSP, or to remove the effects of “one-off” events in relation to the PSP, if events occur that cause it to determine that the metrics are no longer appropriate and amendment is required so they can achieve their original intended purpose; and
• waive some or all of the shareholding guidelines or the requirement to invest Annual Variable Pay in Company shares and retain share awards on vesting in exceptional circumstances.
DIRECTORS’ REMUNERATION SCENARIOS The charts below show how the composition of the executive directors’ remuneration packages varies at different levels of performance under the remuneration policy to be implemented in 2015. A substantial portion of the remuneration packages are performance related and therefore this is illustrated for three different performance scenarios: minimum (fixed pay only), on-target performance and maximum performance.
Assumptions:
• Minimum – fixed pay only, based on salary effective 1 January 2015 (excluding any mid-year review), 15 per cent of salary pension contribution (or 15 per cent of salary contribution in lieu of pension) and benefits received in the 2014 financial year.
• On-target – minimum plus 50 per cent of the maximum payout under the Annual Variable Pay scheme, and 65 per cent PSP vesting.
• Maximum – minimum plus 100 per cent of the maximum payout under the Annual Variable Pay scheme, and full PSP vesting.
Dividend equivalent payments provided for under the PSP have been disregarded and no share price growth assumed for the purposes of these charts.
SERVICE CONTRACTS AND POLICY ON PAYMENTS FOR LOSS OF OFFICEService contract policyAll newly-appointed executive directors will have contracts terminable at any time on up to one year’s notice. Under the terms of the contract, should notice be served by either party, the executives can continue to receive basic salary, benefits and pension for the duration of their notice period during which time the Company may require the individual to continue to fulfil their current duties or may assign a period of garden leave.
Contracts also contain the ability, at the Company’s discretion, to make a payment in lieu of notice of up to of one year’s basic annual salary.
Details of the current executive directors’ service contracts are summarised on the following page. Each contract has an indefinite unexpired term and a notice period of one year.
Minimum Minimum
LTIP
Annual Variable Pay
Fixed Pay
£2,169,259
£1,420,694
£1,284,419
£841,526
£430,694
£656,759
On-target On-target
Chief Executive Finance DirectorMaximum Maximum
100% 30%
32%
51%
27%
100% 51%
27%
30%
32%
38%
38%
22%
22%
Minimum Minimum Minimum
£366,824
£671,684
£1,116,824
£1,270,578
£1,113,208
£668,068
£363,208
£766,086
£420,578
On-target On-target On-target
Managing Director, Equipment Services
Managing Director, Support Services
Managing Director, Developments and UK Construction
Maximum Maximum Maximum
100% 100% 100%55% 55% 55%
22%
23%
22%
23%
27%
40%
22%
23%
33% 33% 33%
27%
40%
27%
40%
DIRECTORS’ REMUNERATION REPORT
DIRECTORS’ REMUNERATION REPORT CONTINUED

INTERSERVE ANNUAL REPORT 2014 GOVERNANCE 83
Element Resignation1 Departure on agreed terms2 Good leaver3
Salary (after cessation of employment)
Nil For existing directors up to one year’s basic salary. Newly-appointed executive directors can continue to receive basic salary for the duration of their notice period of one year. The Company will have the discretion to make a payment in lieu of notice (“PILON”) comprising up to 12 monthly instalments of base salary which would be mitigated proportionate to income received through alternative employment.
Nil
Pension and benefits Nil For existing directors up to one year’s benefits and pension.
For newly-appointed directors up to one year’s benefits and pension as part of the PILON as detailed above.
Nil
Annual Variable Pay Nil if the executive departs before the payment date unless the Committee determines otherwise.
May be payable at the discretion of the Committee based upon performance and pro-rated for the proportion of the financial year worked. No payment will be made in respect of any period of notice not worked.
May be payable at the discretion of the Committee based on performance pro-rated for the proportion of the financial year worked.
Performance Share Plan All awards, including those which have vested but are unexercised will lapse immediately upon cessation of employment.
Awards will lapse upon cessation of employment unless the Committee decides otherwise in which case awards may be exercised within 12 months of the vesting date.
Where employment ends before the vesting date, awards may only be exercised to the extent that the performance conditions have been satisfied, but will be reduced pro-rata based upon the period of time after the grant date and ending on the date of cessation of employment relative to the three-year performance period unless the Committee, acting fairly and reasonably, decides that such a reduction is inappropriate in any particular case.
Awards may be exercised within 12 months of the vesting date.
Where employment ends before the vesting date, awards may only be exercised to the extent that the performance conditions have been satisfied, but will be reduced pro-rata based upon the period of time after the grant date and ending on the date of cessation of employment relative to the three-year performance period unless the Committee, acting fairly and reasonably, decides that such a reduction is inappropriate in any particular case.
All-employee share schemes (Sharesave and SIP)
In accordance with the scheme rules.
Other payments Nil Depending upon circumstances the Committee may consider payments in respect of any statutory entitlements, outplacement support and assistance with legal fees.
Nil
1For example, normal resignation from the Company or termination for cause (e.g. gross misconduct).2 This may cover a range of circumstances such as business reorganisation, changes in reporting lines, change in need for the role, termination as a result of a failure to be re-elected at an AGM.
3 For compassionate reasons such as death, injury or disability, retirement with the agreement of the employer. Should a compromise agreement be reached with an individual, in terms of quantum it will be within the maximum amounts set out above.
DIRECTORS’ REMUNERATION REPORT
Name Date of contract
S L Dance 10 January 2008
T P Haywood 30 November 2010
B A Melizan 10 January 2008
A M Ringrose 13 December 2001
D I Sutherland 1 January 2011
Copies of the service contracts are available for inspection by shareholders at the AGM. The Committee will continue to keep under review the terms of executive directors’ service contracts.
The table below summarises the policy on payments to executive directors for loss of office. The overriding principle will be to honour contractual remuneration entitlements and determine on an equitable basis the appropriate treatment of deferred and performance-linked elements of the package, taking account of the circumstances.
Payments for loss of office can only be made if they are consistent with the approved Remuneration Policy or are otherwise approved by ordinary resolution of the members of the Company. Failure will not be rewarded.
OVERVIEW
GO
VERNA
NCE
FINA
NCIA
L STATEMEN
TS STRATEG
IC REPORT
84 INTERSERVE ANNUAL REPORT 2014 GOVERNANCE
GOVERNANCE
There are no provisions in executive directors’ service agreements entitling them to terminate their employment or receive damages in the event of a change in control of the Company. The Annual Variable Pay scheme does not include any provision entitling early or any payment to be made on a change in control of the Company.
In the event of change of control, PSP awards would be eligible to vest based on (i) the extent to which performance targets had been met, as assessed by the Committee, over the shortened performance period and (ii) subject to a pro-rata reduction for time (which the Committee retains discretion to disapply if it considers it appropriate to do so). As an alternative, and in agreement with an acquiring company, the awards may be replaced with equivalent awards in the acquiring company’s shares.
The Sharesave Scheme provides that if a change in control of the Company occurs, any options may be exercised within a month (or such longer period as the Board may permit up to a maximum of six months). There are also rollover provisions similar to those under the PSP explained above.
RECRUITMENT REMUNERATIONIn cases where the Company recruits a new executive director, the Committee will follow the policy set out below to determine his/her ongoing remuneration package. In arriving at a total package and in considering quantum for each element of the package, the Committee will take into account the skills and experience of the candidate, the market rate for a candidate of that experience as well as the importance of securing the preferred candidate. The remuneration package for a new executive director would be set in accordance with the terms of the Company’s approved remuneration policy in force at the time of appointment.
Element General policy Specifics
Salary At a level required to attract the most appropriate candidate.
Discretion to pay a lower basic salary with increases at a rate above inflation over two to three years as the new appointee becomes established in the role.
Pension and benefits In line with Company policies. Where appropriate, relocation expenses/arrangements may be provided.
Annual Variable Pay In line with existing schemes.
Maximum opportunity 100% of base salary or in the case of a Chief Executive or Group Finance Director, 125% of base salary.
Specific targets could be introduced for an individual where necessary for the first year of appointment if it is appropriate to do so to reflect the individual’s responsibilities and the point in the year in which they joined the Board.
Performance Share Plan
In line with Company policies and PSP rules.
Maximum award up to 200% of basic salary (at the date of grant) may be made.
An award may be made in the year of joining or, alternatively, the award can be delayed until the following year. Targets would be the same as for other directors.
Other share awards or remuneration1
The Committee may make an incentive award to replace remuneration forfeited on an executive leaving a previous employer, where to do so would be in the commercial interests of the Company.
Awards would, where possible, take into account the awards forfeited in terms of vesting periods, expected value and performance conditions.
For unvested performance-related awards, awards of broadly similar quantum (allowing for the impact of any performance targets), with appropriate performance conditions.
1The Committee may make use of the flexibility provided in the Listing Rules to make such awards if deemed appropriate in terms of replacing forfeited variable pay.
In the case of an internal appointment, any variable pay element awarded in respect of the prior role may be allowed to pay out according to its terms on grant, adjusted as relevant to take into account the appointment. In addition, any other ongoing remuneration obligations existing prior to appointment may continue as appropriate.
EXTERNAL DIRECTORSHIPSThe Board is comfortable with the principle of executive directors sitting on another company board as a non-executive in order to assist with their development, subject to the prior approval of the Chief Executive and the Board. Any fees earned in that capacity may be retained by the executive director.
DIRECTORS’ REMUNERATION REPORT
DIRECTORS’ REMUNERATION REPORT CONTINUED
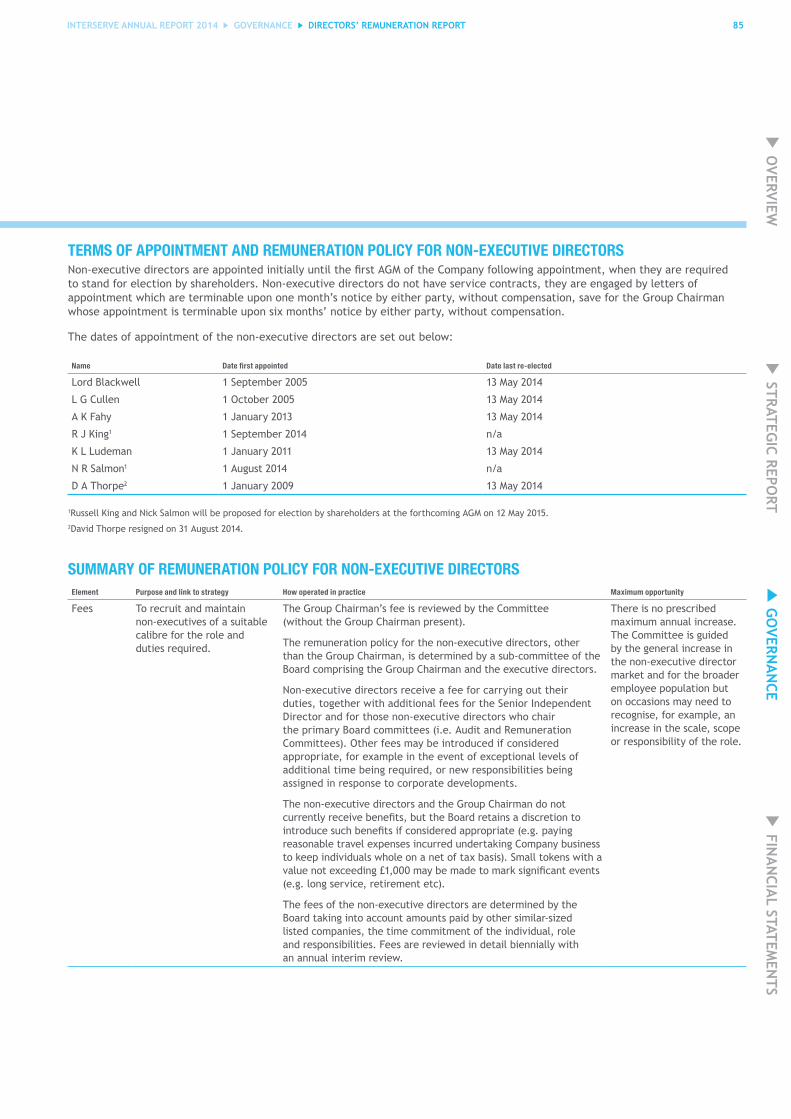
INTERSERVE ANNUAL REPORT 2014 GOVERNANCE 85
TERMS OF APPOINTMENT AND REMUNERATION POLICY FOR NON-EXECUTIVE DIRECTORSNon-executive directors are appointed initially until the first AGM of the Company following appointment, when they are required to stand for election by shareholders. Non-executive directors do not have service contracts, they are engaged by letters of appointment which are terminable upon one month’s notice by either party, without compensation, save for the Group Chairman whose appointment is terminable upon six months’ notice by either party, without compensation.
The dates of appointment of the non-executive directors are set out below:
Name Date first appointed Date last re-elected
Lord Blackwell 1 September 2005 13 May 2014
L G Cullen 1 October 2005 13 May 2014
A K Fahy 1 January 2013 13 May 2014
R J King1 1 September 2014 n/a
K L Ludeman 1 January 2011 13 May 2014
N R Salmon1 1 August 2014 n/a
D A Thorpe2 1 January 2009 13 May 2014
1Russell King and Nick Salmon will be proposed for election by shareholders at the forthcoming AGM on 12 May 2015.2David Thorpe resigned on 31 August 2014.
SUMMARY OF REMUNERATION POLICY FOR NON-EXECUTIVE DIRECTORSElement Purpose and link to strategy How operated in practice Maximum opportunity
Fees To recruit and maintain non-executives of a suitable calibre for the role and duties required.
The Group Chairman’s fee is reviewed by the Committee (without the Group Chairman present).
The remuneration policy for the non-executive directors, other than the Group Chairman, is determined by a sub-committee of the Board comprising the Group Chairman and the executive directors.
Non-executive directors receive a fee for carrying out their duties, together with additional fees for the Senior Independent Director and for those non-executive directors who chair the primary Board committees (i.e. Audit and Remuneration Committees). Other fees may be introduced if considered appropriate, for example in the event of exceptional levels of additional time being required, or new responsibilities being assigned in response to corporate developments.
The non-executive directors and the Group Chairman do not currently receive benefits, but the Board retains a discretion to introduce such benefits if considered appropriate (e.g. paying reasonable travel expenses incurred undertaking Company business to keep individuals whole on a net of tax basis). Small tokens with a value not exceeding £1,000 may be made to mark significant events (e.g. long service, retirement etc).
The fees of the non-executive directors are determined by the Board taking into account amounts paid by other similar-sized listed companies, the time commitment of the individual, role and responsibilities. Fees are reviewed in detail biennially with an annual interim review.
There is no prescribed maximum annual increase. The Committee is guided by the general increase in the non-executive director market and for the broader employee population but on occasions may need to recognise, for example, an increase in the scale, scope or responsibility of the role.
DIRECTORS’ REMUNERATION REPORT
OVERVIEW
GO
VERNA
NCE
FINA
NCIA
L STATEMEN
TS STRATEG
IC REPORT

86 INTERSERVE ANNUAL REPORT 2014 GOVERNANCE
GOVERNANCE
CONSIDERATION OF EMPLOYEE VIEWSAlthough the Committee does not consult directly with employees on executive remuneration we do run a biennial employee survey where employees are able to express their views on a range of issues including their own remuneration.
The Committee considers the general basic salary increase as well as pay and conditions for the broader salaried employee population when determining the annual salary increases for the executive directors.
The Committee receives an annual report for all employees whose basic salary is in excess of £150,000 p.a., detailing the significant elements which make up total remuneration. This enables the Committee to assess the impact of remuneration decisions upon the total cost of employment.
CONSIDERATION OF SHAREHOLDER VIEWSThe Committee considers any shareholder feedback received in relation to the AGM as well as taking into account the general climate regarding executive pay. This feedback, plus any additional feedback received during any other shareholder meetings from time to time, is then considered as part of the Company’s annual review of remuneration policy.
In view of the proposed adjustments to the executive directors’ base salaries and changes to the Remuneration Policy, the Committee Chairman and Company Secretary consulted with eight of the major shareholders who, between them, own around 37 per cent of the Company as well as the Investment Association (following its merger with ABI Investment Affairs) and ISS on the proposed revisions to the Remuneration Policy. Whilst they were supportive of the proposals there was also desire amongst some for the executive directors to hold more Company shares. This has been reflected in the Remuneration Policy through an increase in the Shareholding Guidelines from 100 per cent to 200 per cent of annual base salary, the requirement to continue to purchase shares from a proportion of any net of tax payments received under the Annual Variable Pay scheme, and a two-year holding period for any net of tax shares vesting under the PSP, even after the increased Shareholding Guidelines have been satisfied.
DIRECTORS’ REMUNERATION REPORT
DIRECTORS’ REMUNERATION REPORT CONTINUED
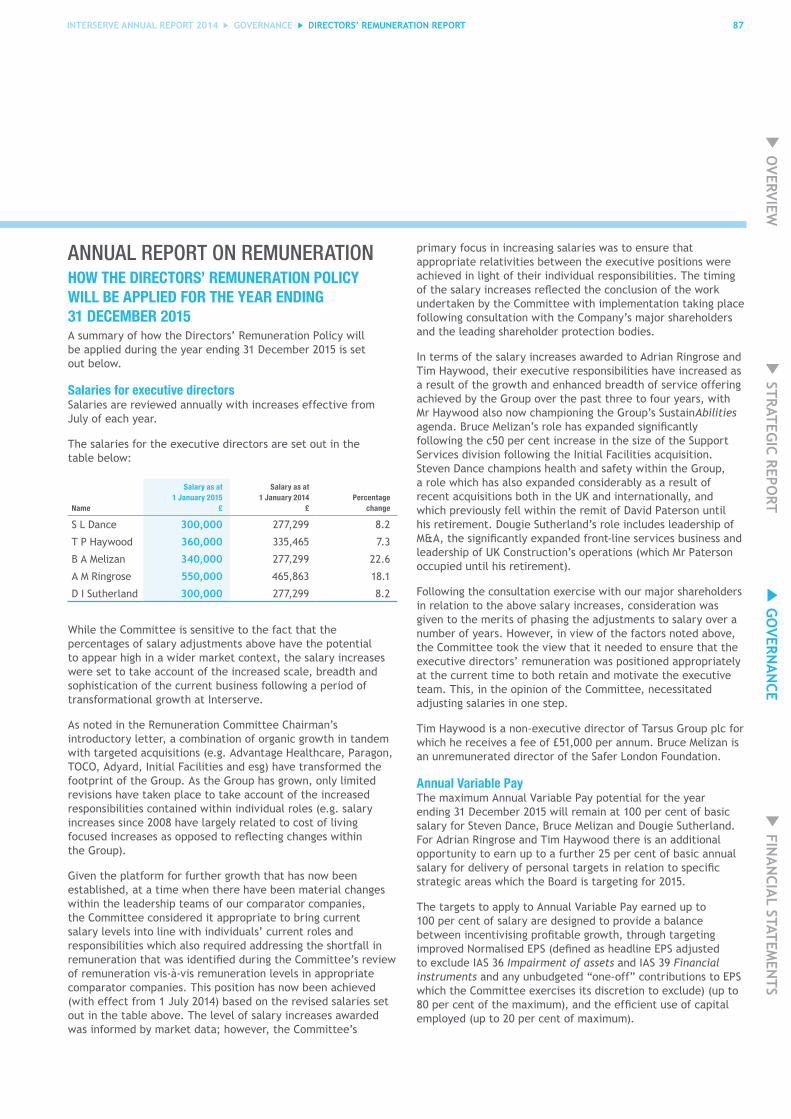
INTERSERVE ANNUAL REPORT 2014 GOVERNANCE 87
ANNUAL REPORT ON REMUNERATIONHOW THE DIRECTORS’ REMUNERATION POLICY WILL BE APPLIED FOR THE YEAR ENDING 31 DECEMBER 2015A summary of how the Directors’ Remuneration Policy will be applied during the year ending 31 December 2015 is set out below.
Salaries for executive directorsSalaries are reviewed annually with increases effective from July of each year.
The salaries for the executive directors are set out in the table below:
Name
Salary as at 1 January 2015
£
Salary as at 1 January 2014
£Percentage
change
S L Dance 300,000 277,299 8.2
T P Haywood 360,000 335,465 7.3
B A Melizan 340,000 277,299 22.6
A M Ringrose 550,000 465,863 18.1
D I Sutherland 300,000 277,299 8.2
While the Committee is sensitive to the fact that the percentages of salary adjustments above have the potential to appear high in a wider market context, the salary increases were set to take account of the increased scale, breadth and sophistication of the current business following a period of transformational growth at Interserve.
As noted in the Remuneration Committee Chairman’s introductory letter, a combination of organic growth in tandem with targeted acquisitions (e.g. Advantage Healthcare, Paragon, TOCO, Adyard, Initial Facilities and esg) have transformed the footprint of the Group. As the Group has grown, only limited revisions have taken place to take account of the increased responsibilities contained within individual roles (e.g. salary increases since 2008 have largely related to cost of living focused increases as opposed to reflecting changes within the Group).
Given the platform for further growth that has now been established, at a time when there have been material changes within the leadership teams of our comparator companies, the Committee considered it appropriate to bring current salary levels into line with individuals’ current roles and responsibilities which also required addressing the shortfall in remuneration that was identified during the Committee’s review of remuneration vis-à-vis remuneration levels in appropriate comparator companies. This position has now been achieved (with effect from 1 July 2014) based on the revised salaries set out in the table above. The level of salary increases awarded was informed by market data; however, the Committee’s
primary focus in increasing salaries was to ensure that appropriate relativities between the executive positions were achieved in light of their individual responsibilities. The timing of the salary increases reflected the conclusion of the work undertaken by the Committee with implementation taking place following consultation with the Company’s major shareholders and the leading shareholder protection bodies.
In terms of the salary increases awarded to Adrian Ringrose and Tim Haywood, their executive responsibilities have increased as a result of the growth and enhanced breadth of service offering achieved by the Group over the past three to four years, with Mr Haywood also now championing the Group’s SustainAbilities agenda. Bruce Melizan’s role has expanded significantly following the c50 per cent increase in the size of the Support Services division following the Initial Facilities acquisition. Steven Dance champions health and safety within the Group, a role which has also expanded considerably as a result of recent acquisitions both in the UK and internationally, and which previously fell within the remit of David Paterson until his retirement. Dougie Sutherland’s role includes leadership of M&A, the significantly expanded front-line services business and leadership of UK Construction’s operations (which Mr Paterson occupied until his retirement).
Following the consultation exercise with our major shareholders in relation to the above salary increases, consideration was given to the merits of phasing the adjustments to salary over a number of years. However, in view of the factors noted above, the Committee took the view that it needed to ensure that the executive directors’ remuneration was positioned appropriately at the current time to both retain and motivate the executive team. This, in the opinion of the Committee, necessitated adjusting salaries in one step.
Tim Haywood is a non-executive director of Tarsus Group plc for which he receives a fee of £51,000 per annum. Bruce Melizan is an unremunerated director of the Safer London Foundation.
Annual Variable PayThe maximum Annual Variable Pay potential for the year ending 31 December 2015 will remain at 100 per cent of basic salary for Steven Dance, Bruce Melizan and Dougie Sutherland. For Adrian Ringrose and Tim Haywood there is an additional opportunity to earn up to a further 25 per cent of basic annual salary for delivery of personal targets in relation to specific strategic areas which the Board is targeting for 2015.
The targets to apply to Annual Variable Pay earned up to 100 per cent of salary are designed to provide a balance between incentivising profitable growth, through targeting improved Normalised EPS (defined as headline EPS adjusted to exclude IAS 36 Impairment of assets and IAS 39 Financial instruments and any unbudgeted “one-off” contributions to EPS which the Committee exercises its discretion to exclude) (up to 80 per cent of the maximum), and the efficient use of capital employed (up to 20 per cent of maximum).
DIRECTORS’ REMUNERATION REPORT
OVERVIEW
GO
VERNA
NCE
FINA
NCIA
L STATEMEN
TS STRATEG
IC REPORT
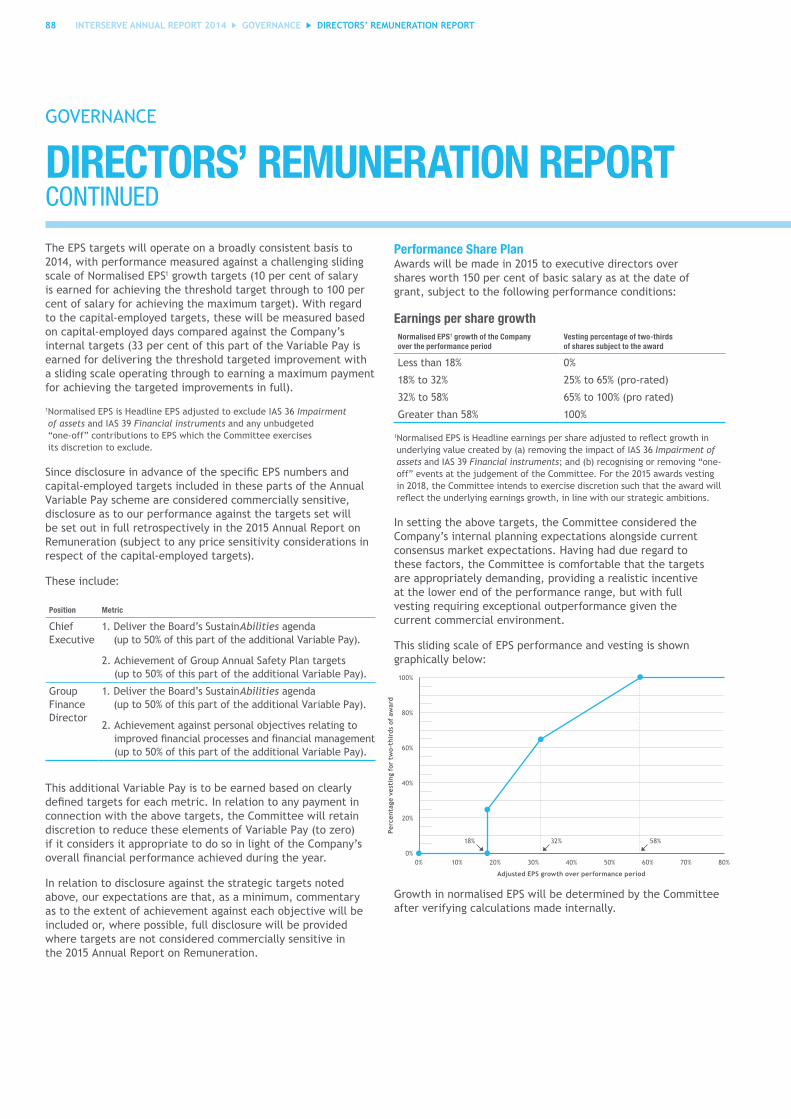
88 INTERSERVE ANNUAL REPORT 2014 GOVERNANCE
GOVERNANCE
The EPS targets will operate on a broadly consistent basis to 2014, with performance measured against a challenging sliding scale of Normalised EPS1 growth targets (10 per cent of salary is earned for achieving the threshold target through to 100 per cent of salary for achieving the maximum target). With regard to the capital-employed targets, these will be measured based on capital-employed days compared against the Company’s internal targets (33 per cent of this part of the Variable Pay is earned for delivering the threshold targeted improvement with a sliding scale operating through to earning a maximum payment for achieving the targeted improvements in full).
1 Normalised EPS is Headline EPS adjusted to exclude IAS 36 Impairment of assets and IAS 39 Financial instruments and any unbudgeted “one-off” contributions to EPS which the Committee exercises its discretion to exclude.
Since disclosure in advance of the specific EPS numbers and capital-employed targets included in these parts of the Annual Variable Pay scheme are considered commercially sensitive, disclosure as to our performance against the targets set will be set out in full retrospectively in the 2015 Annual Report on Remuneration (subject to any price sensitivity considerations in respect of the capital-employed targets).
These include:
Position Metric
Chief Executive
1. Deliver the Board’s SustainAbilities agenda (up to 50% of this part of the additional Variable Pay).
2. Achievement of Group Annual Safety Plan targets (up to 50% of this part of the additional Variable Pay).
Group Finance Director
1. Deliver the Board’s SustainAbilities agenda (up to 50% of this part of the additional Variable Pay).
2. Achievement against personal objectives relating to improved financial processes and financial management (up to 50% of this part of the additional Variable Pay).
This additional Variable Pay is to be earned based on clearly defined targets for each metric. In relation to any payment in connection with the above targets, the Committee will retain discretion to reduce these elements of Variable Pay (to zero) if it considers it appropriate to do so in light of the Company’s overall financial performance achieved during the year.
In relation to disclosure against the strategic targets noted above, our expectations are that, as a minimum, commentary as to the extent of achievement against each objective will be included or, where possible, full disclosure will be provided where targets are not considered commercially sensitive in the 2015 Annual Report on Remuneration.
Performance Share PlanAwards will be made in 2015 to executive directors over shares worth 150 per cent of basic salary as at the date of grant, subject to the following performance conditions:
Earnings per share growthNormalised EPS1 growth of the Company over the performance period
Vesting percentage of two-thirds of shares subject to the award
Less than 18% 0%
18% to 32% 25% to 65% (pro-rated)
32% to 58% 65% to 100% (pro rated)
Greater than 58% 100%
1 Normalised EPS is Headline earnings per share adjusted to reflect growth in underlying value created by (a) removing the impact of IAS 36 Impairment of assets and IAS 39 Financial instruments; and (b) recognising or removing “one-off” events at the judgement of the Committee. For the 2015 awards vesting in 2018, the Committee intends to exercise discretion such that the award will reflect the underlying earnings growth, in line with our strategic ambitions.
In setting the above targets, the Committee considered the Company’s internal planning expectations alongside current consensus market expectations. Having had due regard to these factors, the Committee is comfortable that the targets are appropriately demanding, providing a realistic incentive at the lower end of the performance range, but with full vesting requiring exceptional outperformance given the current commercial environment.
This sliding scale of EPS performance and vesting is shown graphically below:
Growth in normalised EPS will be determined by the Committee after verifying calculations made internally.
DIRECTORS’ REMUNERATION REPORT
DIRECTORS’ REMUNERATION REPORT CONTINUED
100%
Perc
enta
ge v
esti
ng f
or t
wo-
thir
ds o
f aw
ard
Adjusted EPS growth over performance period
60%
80%
40%
20%
0%0% 30%10% 40%20% 60% 70% 80%50%
18% 32% 58%

INTERSERVE ANNUAL REPORT 2014 GOVERNANCE 89
The Board’s strategy continues to focus on delivering long-term profitable growth and generating above market long-term returns to our shareholders. The ongoing use of EPS growth targets and relative TSR targets is considered to provide alignment between the Board’s strategy and the executive’s long-term reward. The targets are weighted towards EPS performance since this is the key metric targeted internally for growth and supports our objective of continuing to operate a progressive dividend policy.
Total shareholder returnVesting of the other third of an award will be dependent upon the Company’s performance in terms of TSR, as measured against the TSR of each company in the FTSE 250, excluding investment trusts.
Given the limited number of direct comparator companies, the use of the above broader TSR peer group is considered to have the potential to provide a keener alignment between performance and reward over the long term as it limits the potential for the performance of one or two companies to disproportionately impact the vesting result which had become the case in operating a small bespoke peer group.
TSR is calculated as the percentage change in the net return index from the start to the end of the three-year performance period commencing on the first day of the 2015 financial year1. This measures the return to an investor on a holding of Interserve shares.
The TSR performance conditions are set out in the table below:
TSR ranking of the Company compared to the Comparator Group over the performance period
Vesting percentage of one-third of shares subject to the award
Below median ranking 0%
Median ranking (top 50%) 25%
Median to upper quartile ranking 25% to 100% (pro-rated)
Upper quartile ranking (top 25%) 100%
1 The return index at the start of the performance period is the average of the net return index over the three months preceding the start of the performance period. The return index at the end of the performance period is the average of the return index over the last three months of the performance period.
This sliding scale of TSR performance and vesting is shown graphically below:
Non-executive director feesThe fee levels for the non-executive directors for 2015 are set out in the table below:
Element
Fee effective 1 January 2015
£
Fee effective 1 January 2014
£Percentage
change
Fee paid to Group Chairman 165,000 150,000 10.0
Base fee paid to other non-executive directors 50,000 45,100 10.9
Supplementary fees:
– Senior Independent Director 7,000 7,000 nil
– Audit Committee Chairman 10,000 10,000 nil
– Remuneration Committee Chairman 10,000 9,000 11.1
– Nomination Committee Chairman See note1 See note1 n/a
1 The Group Chairman is Chairman of the Nomination Committee and receives no supplementary fee for chairing this committee.
DIRECTORS’ REMUNERATION REPORT
100%
Perc
enta
ge v
esti
ng f
or o
ne-t
hird
of
awar
d
TSR ranking of the Company
75%
50%
25%
0%Median
25% vesting at Median
100% vesting at Upper Quartile
Upper Quartile
OVERVIEW
GO
VERNA
NCE
FINA
NCIA
L STATEMEN
TS STRATEG
IC REPORT
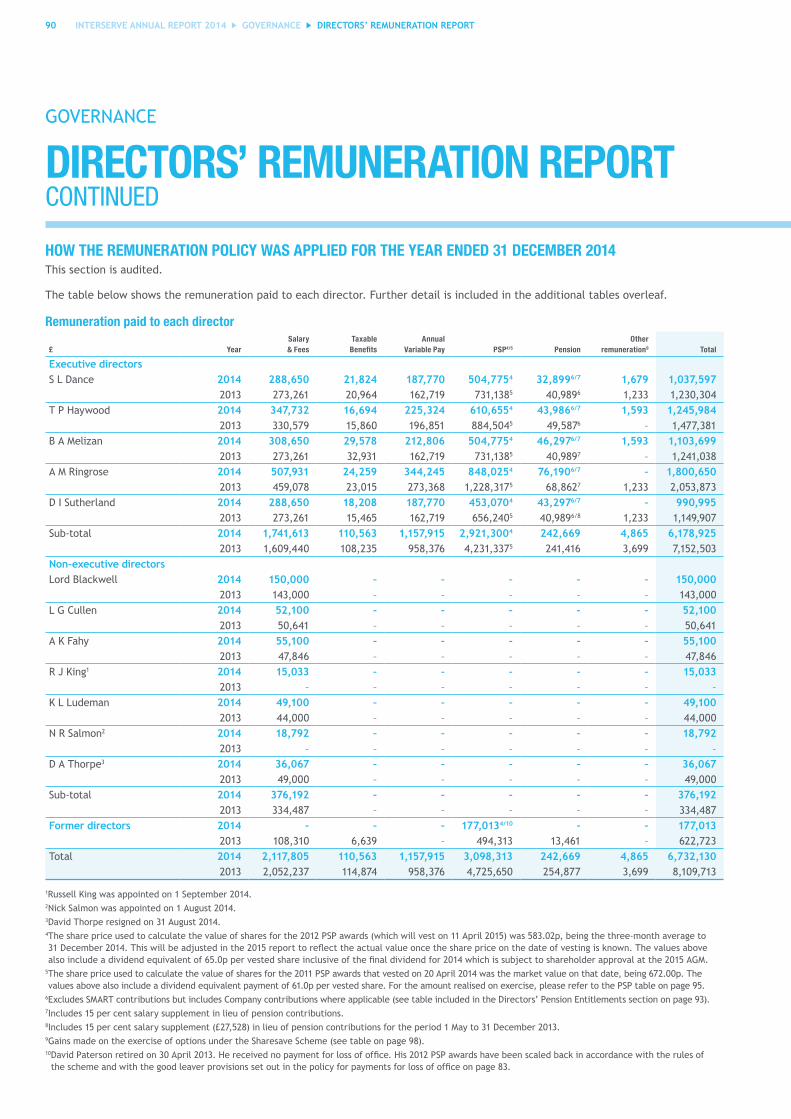
90 INTERSERVE ANNUAL REPORT 2014 GOVERNANCE
GOVERNANCE
HOW THE REMUNERATION POLICY WAS APPLIED FOR THE YEAR ENDED 31 DECEMBER 2014This section is audited.
The table below shows the remuneration paid to each director. Further detail is included in the additional tables overleaf.
Remuneration paid to each director
£ YearSalary & Fees
Taxable Benefits
Annual Variable Pay PSP4/5 Pension
Other remuneration9 Total
Executive directorsS L Dance 2014 288,650 21,824 187,770 504,7754 32,8996/7 1,679 1,037,597
2013 273,261 20,964 162,719 731,1385 40,9896 1,233 1,230,304T P Haywood 2014 347,732 16,694 225,324 610,6554 43,9866/7 1,593 1,245,984
2013 330,579 15,860 196,851 884,5045 49,5876 – 1,477,381B A Melizan 2014 308,650 29,578 212,806 504,7754 46,2976/7 1,593 1,103,699
2013 273,261 32,931 162,719 731,1385 40,9897 – 1,241,038A M Ringrose 2014 507,931 24,259 344,245 848,0254 76,1906/7 – 1,800,650
2013 459,078 23,015 273,368 1,228,3175 68,8627 1,233 2,053,873D I Sutherland 2014 288,650 18,208 187,770 453,0704 43,2976/7 – 990,995
2013 273,261 15,465 162,719 656,2405 40,9896/8 1,233 1,149,907Sub-total 2014 1,741,613 110,563 1,157,915 2,921,3004 242,669 4,865 6,178,925
2013 1,609,440 108,235 958,376 4,231,3375 241,416 3,699 7,152,503Non-executive directorsLord Blackwell 2014 150,000 – – – – – 150,000
2013 143,000 – – – – – 143,000L G Cullen 2014 52,100 – – – – – 52,100
2013 50,641 – – – – – 50,641A K Fahy 2014 55,100 – – – – – 55,100
2013 47,846 – – – – – 47,846R J King1 2014 15,033 – – – – – 15,033
2013 – – – – – – –K L Ludeman 2014 49,100 – – – – – 49,100
2013 44,000 – – – – – 44,000N R Salmon2 2014 18,792 – – – – – 18,792
2013 – – – – – – –D A Thorpe3 2014 36,067 – – – – – 36,067
2013 49,000 – – – – – 49,000Sub-total 2014 376,192 – – – – – 376,192
2013 334,487 – – – – – 334,487Former directors 2014 – – – 177,0134/10 – – 177,013
2013 108,310 6,639 – 494,313 13,461 – 622,723Total 2014 2,117,805 110,563 1,157,915 3,098,313 242,669 4,865 6,732,130
2013 2,052,237 114,874 958,376 4,725,650 254,877 3,699 8,109,713
1Russell King was appointed on 1 September 2014.2Nick Salmon was appointed on 1 August 2014.3David Thorpe resigned on 31 August 2014.4 The share price used to calculate the value of shares for the 2012 PSP awards (which will vest on 11 April 2015) was 583.02p, being the three-month average to 31 December 2014. This will be adjusted in the 2015 report to reflect the actual value once the share price on the date of vesting is known. The values above also include a dividend equivalent of 65.0p per vested share inclusive of the final dividend for 2014 which is subject to shareholder approval at the 2015 AGM.
5 The share price used to calculate the value of shares for the 2011 PSP awards that vested on 20 April 2014 was the market value on that date, being 672.00p. The values above also include a dividend equivalent payment of 61.0p per vested share. For the amount realised on exercise, please refer to the PSP table on page 95.
6Excludes SMART contributions but includes Company contributions where applicable (see table included in the Directors’ Pension Entitlements section on page 93).7Includes 15 per cent salary supplement in lieu of pension contributions.8Includes 15 per cent salary supplement (£27,528) in lieu of pension contributions for the period 1 May to 31 December 2013.9Gains made on the exercise of options under the Sharesave Scheme (see table on page 98). 10 David Paterson retired on 30 April 2013. He received no payment for loss of office. His 2012 PSP awards have been scaled back in accordance with the rules of
the scheme and with the good leaver provisions set out in the policy for payments for loss of office on page 83.
DIRECTORS’ REMUNERATION REPORT
DIRECTORS’ REMUNERATION REPORT CONTINUED
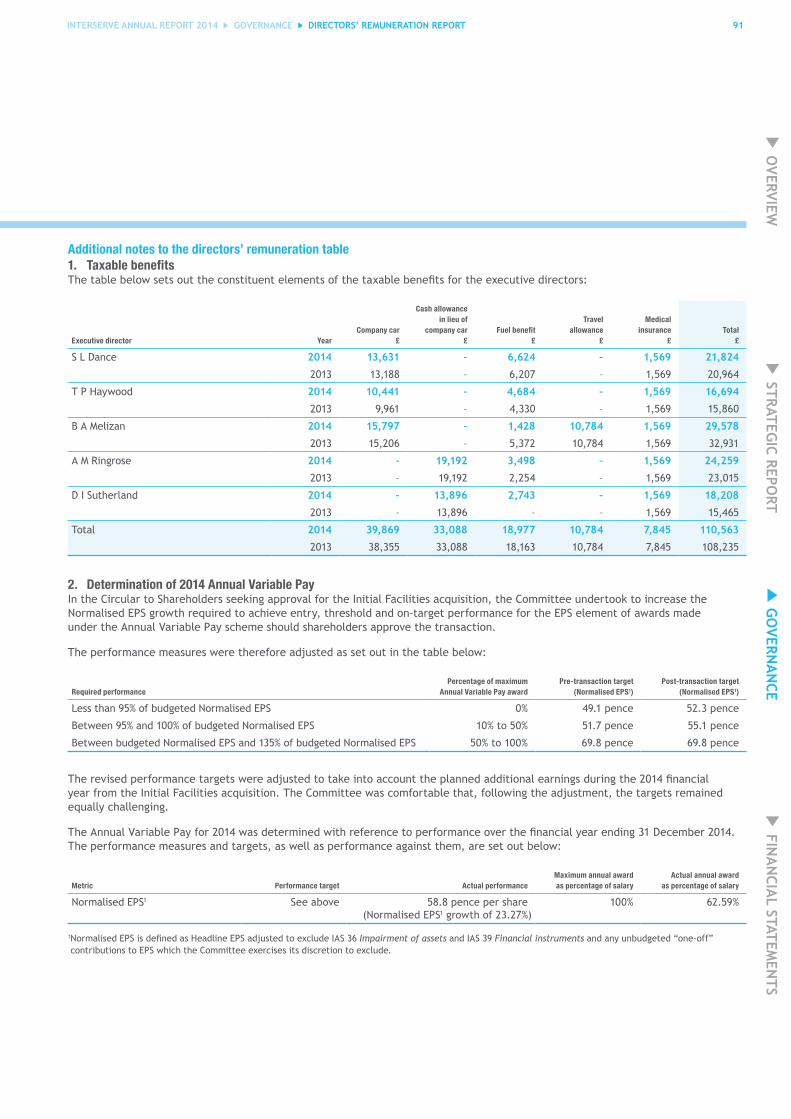
INTERSERVE ANNUAL REPORT 2014 GOVERNANCE 91
Additional notes to the directors’ remuneration table1. Taxable benefitsThe table below sets out the constituent elements of the taxable benefits for the executive directors:
Executive director YearCompany car
£
Cash allowance in lieu of
company car £
Fuel benefit £
Travel allowance
£
Medical insurance
£Total
£
S L Dance 2014 13,631 – 6,624 – 1,569 21,824
2013 13,188 – 6,207 – 1,569 20,964
T P Haywood 2014 10,441 – 4,684 – 1,569 16,694
2013 9,961 – 4,330 – 1,569 15,860
B A Melizan 2014 15,797 – 1,428 10,784 1,569 29,578
2013 15,206 – 5,372 10,784 1,569 32,931
A M Ringrose 2014 – 19,192 3,498 – 1,569 24,259
2013 – 19,192 2,254 – 1,569 23,015
D I Sutherland 2014 – 13,896 2,743 – 1,569 18,208
2013 – 13,896 – – 1,569 15,465
Total 2014 39,869 33,088 18,977 10,784 7,845 110,563
2013 38,355 33,088 18,163 10,784 7,845 108,235
2. Determination of 2014 Annual Variable PayIn the Circular to Shareholders seeking approval for the Initial Facilities acquisition, the Committee undertook to increase the Normalised EPS growth required to achieve entry, threshold and on-target performance for the EPS element of awards made under the Annual Variable Pay scheme should shareholders approve the transaction.
The performance measures were therefore adjusted as set out in the table below:
Required performancePercentage of maximum
Annual Variable Pay awardPre-transaction target
(Normalised EPS1)Post-transaction target
(Normalised EPS1)
Less than 95% of budgeted Normalised EPS 0% 49.1 pence 52.3 pence
Between 95% and 100% of budgeted Normalised EPS 10% to 50% 51.7 pence 55.1 pence
Between budgeted Normalised EPS and 135% of budgeted Normalised EPS 50% to 100% 69.8 pence 69.8 pence
The revised performance targets were adjusted to take into account the planned additional earnings during the 2014 financial year from the Initial Facilities acquisition. The Committee was comfortable that, following the adjustment, the targets remained equally challenging.
The Annual Variable Pay for 2014 was determined with reference to performance over the financial year ending 31 December 2014. The performance measures and targets, as well as performance against them, are set out below:
Metric Performance target Actual performanceMaximum annual award as percentage of salary
Actual annual award as percentage of salary
Normalised EPS1 See above 58.8 pence per share (Normalised EPS1 growth of 23.27%)
100% 62.59%
1 Normalised EPS is defined as Headline EPS adjusted to exclude IAS 36 Impairment of assets and IAS 39 Financial instruments and any unbudgeted “one-off” contributions to EPS which the Committee exercises its discretion to exclude.
DIRECTORS’ REMUNERATION REPORT
OVERVIEW
GO
VERNA
NCE
FINA
NCIA
L STATEMEN
TS STRATEG
IC REPORT

92 INTERSERVE ANNUAL REPORT 2014 GOVERNANCE
GOVERNANCE
3. Determination of EPS performance conditions for awards made under the Performance Share Plan in 2014
In the Circular to Shareholders seeking approval for the Initial Facilities acquisition, the Committee undertook to increase the Normalised EPS growth required to achieve the threshold and on-target performance for the EPS element of awards to be made to the executive directors under the Performance Share Plan should the transaction be approved. The revised targets set out below take into account the Committee’s view on the additional earnings potential from the acquisition.
Pre-acquisition Normalised EPS1 growth of the Company over the performance period
Post-acquisition Normalised EPS1 growth of the Company over the performance period
Vesting percentage of two-thirds of shares subject to the award
Less than 32% Less than 40.46% 0%
32% to 83% 40.46% to 83% 25% to 100% (pro-rated)
Greater than 83% Greater than 83% 100%
1 Normalised EPS is defined as Headline EPS adjusted to reflect growth in underlying value created by (a) removing the impact of IAS 36 Impairment of assets and IAS 39 Financial instruments; and (b) recognising or removing “one off” events at the judgement of the Committee. For the 2014 awards vesting in 2017, the Committee intends to exercise discretion such that the awards will reflect the underlying earnings growth in line with our strategic ambitions.
4. Determination of Performance Share Plan payments for 2014The analysis below explains how the Performance Share Plan payments for the performance period ending 31 December 2014 were determined.
The PSP awards granted on 11 April 2012 were based on performance over the three-year period from 1 January 2012 to 31 December 2014 and were subject to the following performance conditions:
The EPS Performance Condition for two-thirds of the 2012 AwardsNormalised EPS1 growth of the Company over the performance period
Vesting percentage of two-thirds of shares subject to the award
Less than 20% 0%
20% to 40% 20% to 50% (pro-rated)
40% to 60% 50% to 100% (pro-rated)
Greater than 60% 100%
1 Normalised EPS is defined as basic EPS adjusted to remove the effect of IAS 36 Impairment of assets and IAS 39 Financial instruments and any return generated from the sale of the Group’s PFI investments in excess of the internal rate of return as set by the Board of directors of the Company at the approval stage and any other items defined by the Committee.
In testing the performance condition, basic EPS was adjusted to take into account the change from IAS 19 to IAS 19R (pensions) and for the treatment of exceptional items and intangible asset amortisation, the majority of which related to the Initial Facilities acquisition (thus ensuring that the condition was tested on a consistent basis). Following this adjustment, growth in Normalised EPS over the three-year performance period for the 2012 award was 27.6 per cent. Accordingly, 31.34 per cent of the EPS element of those awards will vest. In making the adjustment the Committee was comfortable that the degree of stretch in the original performance target was maintained in light of the acquisition and the change in the accounting standard and took comfort from the fact that the same result had been achieved as if Headline EPS had been used across the performance period (i.e. the adjustments resulted in the condition measuring underlying growth in EPS which was the original intention when the target was set).
The TSR Performance Condition for one-third of the 2012 AwardsThis condition is determined by comparing the Company’s TSR performance to the TSR of each of a defined list of comparator companies drawn from the Construction and Materials, and Support Services sectors, comprising Atkins (WS), Babcock International, Balfour Beatty, Capita Group, Carillion, Costain Group, Kier Group, May Gurney Integrated Services, MITIE Group, Morgan Sindall, Mouchel Group, Rentokil Initial, RPS Group, Serco and WSP Group.
TSR ranking of the Company compared to the Comparator Group over the performance period
Vesting percentage of one-third of shares subject to the award
Below median ranking 0%
Median ranking (top 50%) 30%
Median to upper quartile ranking 30% to 100% (pro-rated)
Upper quartile ranking (top 25%) 100%
Growth in TSR was 111.6 per cent over the three-year performance period, which was in the upper quartile, meaning that the TSR element of the awards will vest in full.
The 2012 PSP awards were granted in the form of nil-cost options, exercisable between 11 April 2015 and 10 April 2017.
DIRECTORS’ REMUNERATION REPORT CONTINUED
DIRECTORS’ REMUNERATION REPORT

INTERSERVE ANNUAL REPORT 2014 GOVERNANCE 93
The 2012 PSP awards will therefore vest as follows:
Executive directorNumber of
shares grantedNumber of
shares to lapseNumber of
shares to vest
Dividend equivalent on
shares to vest1
£
S L Dance 143,648 65,753 77,895 50,632
T P Haywood 173,779 79,545 94,234 61,252
B A Melizan 143,648 65,753 77,895 50,632
A M Ringrose 241,329 110,465 130,864 85,062
D I Sutherland 128,933 59,017 69,916 45,445
1 This includes a final dividend equivalent of 15.5p per share for the financial year ended 31 December 2014, the corresponding dividend of which is subject to approval by shareholders at the 2015 AGM. Accordingly, payment of this part of the dividend equivalent will not be made until after the AGM.
5. Directors’ pension entitlementsDefined Contribution SchemeAs at 31 December 2014, all the executive directors were deferred members of the Defined Contribution section of the Interserve Pension Scheme prior to which only Steven Dance and Dougie Sutherland participated in the Company’s SMART Pensions arrangement (as detailed on page 77).
The table below shows, for each executive director, the amount by which their base salaries were reduced and paid by the Company into their pension scheme (SMART contributions), together with the total contributions paid by the Company (including SMART contributions but excluding SMART Bonus and AVC arrangements).
Executive director Year
Company contributions
(excluding SMART contributions)
£
SMART contributions
£
Total Company contributions
(including SMART contributions)
£
S L Dance1 2014 10,399 2,101 12,500
2013 40,989 8,786 49,775
T P Haywood2 2014 8,174 – 8,174
2013 49,587 581 50,168
B A Melizan3 2014 – – –
2013 – – –
A M Ringrose3 2014 – – –
2013 – – –
D I Sutherland4 2014 – – –
2013 13,461 3,963 17,424
1 Steven Dance became a deferred member of the Scheme with effect from 5 April 2014 and received a 15 per cent salary supplement in lieu of pension thereafter.
2 Tim Haywood became a deferred member of the Scheme with effect from 28 February 2014 and received a 15 per cent salary supplement in lieu of pension thereafter.
3 Bruce Melizan and Adrian Ringrose became deferred members of the Scheme with effect from 1 January 2012 and 1 April 2012 respectively and received a 15 per cent salary supplement in lieu of pension thereafter.
4 Dougie Sutherland became a deferred member of the scheme with effect from 5 April 2014 and received a 15 per cent salary supplement in lieu of pension thereafter.
Dougie Sutherland also participated in the Company’s SMART Bonus arrangement (available to all employees receiving an annual bonus). The contribution paid by the Company in respect of his SMART Bonus was £40,000 (2013: £39,680).
Members of the Scheme have the option to pay additional voluntary contributions (“AVCs”). Neither the contributions nor the resulting benefits of AVCs are included in the above table.
Non-executive directors’ fees are not pensionable.
Defined Benefit SchemeFollowing the benefit changes to the Interserve Pension Scheme, Adrian Ringrose ceased to accrue any further benefits in the Defined Benefit section of the Scheme from 31 December 2009. His accrued pension at that date was £72,337 per annum and his pension will increase up to the point he draws his benefits broadly in line with price inflation.
Performance graph The graph below shows the value, on 31 December 2014, of £100 invested in Interserve Plc on 31 December 2009 compared with the value of £100 invested in the companies comprising the Support Services sector of the FTSE All-Share Index. This was chosen for comparison because it is considered to be the relevant benchmark against which to compare our performance.
Source: Thomson Reuters Datastream
DIRECTORS’ REMUNERATION REPORT
£0
2009 20142012 20132011
Historical TSR Performance Interserve Plc FTSE All-Share Support Services
Valu
e of
hyp
othe
tica
l hol
ding
s –
£
2010
£200
£400
£100
£300
£500
OVERVIEW
GO
VERNA
NCE
FINA
NCIA
L STATEMEN
TS STRATEG
IC REPORT
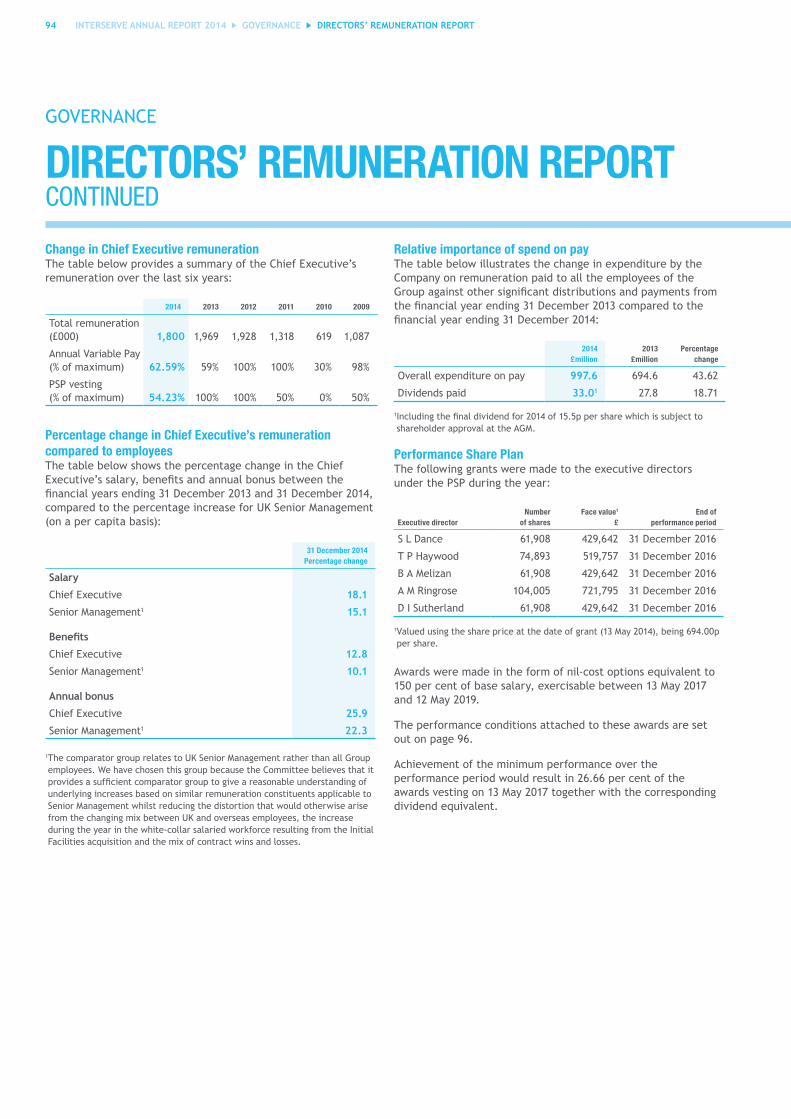
94 INTERSERVE ANNUAL REPORT 2014 GOVERNANCE
GOVERNANCE
Change in Chief Executive remunerationThe table below provides a summary of the Chief Executive’s remuneration over the last six years:
2014 2013 2012 2011 2010 2009
Total remuneration (£000) 1,800 1,969 1,928 1,318 619 1,087
Annual Variable Pay (% of maximum) 62.59% 59% 100% 100% 30% 98%
PSP vesting (% of maximum) 54.23% 100% 100% 50% 0% 50%
Percentage change in Chief Executive’s remuneration compared to employeesThe table below shows the percentage change in the Chief Executive’s salary, benefits and annual bonus between the financial years ending 31 December 2013 and 31 December 2014, compared to the percentage increase for UK Senior Management (on a per capita basis):
31 December 2014 Percentage change
Salary
Chief Executive 18.1
Senior Management1 15.1
Benefits
Chief Executive 12.8
Senior Management1 10.1
Annual bonus
Chief Executive 25.9
Senior Management1 22.3
1 The comparator group relates to UK Senior Management rather than all Group employees. We have chosen this group because the Committee believes that it provides a sufficient comparator group to give a reasonable understanding of underlying increases based on similar remuneration constituents applicable to Senior Management whilst reducing the distortion that would otherwise arise from the changing mix between UK and overseas employees, the increase during the year in the white-collar salaried workforce resulting from the Initial Facilities acquisition and the mix of contract wins and losses.
Relative importance of spend on payThe table below illustrates the change in expenditure by the Company on remuneration paid to all the employees of the Group against other significant distributions and payments from the financial year ending 31 December 2013 compared to the financial year ending 31 December 2014:
2014 £million
2013 £million
Percentage change
Overall expenditure on pay 997.6 694.6 43.62
Dividends paid 33.01 27.8 18.71
1 Including the final dividend for 2014 of 15.5p per share which is subject to shareholder approval at the AGM.
Performance Share PlanThe following grants were made to the executive directors under the PSP during the year:
Executive directorNumber
of shares Face value1
£End of
performance period
S L Dance 61,908 429,642 31 December 2016
T P Haywood 74,893 519,757 31 December 2016
B A Melizan 61,908 429,642 31 December 2016
A M Ringrose 104,005 721,795 31 December 2016
D I Sutherland 61,908 429,642 31 December 2016
1 Valued using the share price at the date of grant (13 May 2014), being 694.00p per share.
Awards were made in the form of nil-cost options equivalent to 150 per cent of base salary, exercisable between 13 May 2017 and 12 May 2019.
The performance conditions attached to these awards are set out on page 96.
Achievement of the minimum performance over the performance period would result in 26.66 per cent of the awards vesting on 13 May 2017 together with the corresponding dividend equivalent.
DIRECTORS’ REMUNERATION REPORT CONTINUED
DIRECTORS’ REMUNERATION REPORT

INTERSERVE ANNUAL REPORT 2014 GOVERNANCE 95
The number of awards over shares in the Company (pursuant to the PSP) held by each person who served as an executive director of the Company during the financial year, is shown below:
Executive directorDate
granted
Balance as at 1 January
2014
Granted during
year
Market price at date
of award pence
Vested during
year
Market price at date
of vesting pence
Market price at date
of exercise pence
Lapsed during
year
Amount realised on
exercise#
£
Balance as at 31 December
2014Performance
period
S L Dance 20.04.11 99,746 – 261.00 99,746 672.00 671.50 – 730,639 – 01.01.11 – 31.12.131
11.04.12 143,648 – 275.80 – n/a n/a – n/a 143,648 01.01.12 – 31.12.142
09.04.13 85,770 – 466.10 – n/a n/a – n/a 85,770 01.01.13 – 31.12.153
13.05.14 – 61,908 694.00 – n/a n/a – n/a 61,908 01.01.14 – 31.12.164
T P Haywood 20.04.11 120,669 – 261.00 120,669 672.00 671.50 – 883,900 – 01.01.11 – 31.12.131
11.04.12 173,779 – 275.80 – n/a n/a – n/a 173,779 01.01.12 – 31.12.142
09.04.13 103,761 – 466.10 – n/a n/a – n/a 103,761 01.01.13 – 31.12.153
13.05.14 – 74,893 694.00 – n/a n/a – n/a 74,893 01.01.14 – 31.12.164
B A Melizan 20.04.11 99,746 – 261.00 99,746 672.00 671.50 – 730,639 – 01.01.11 – 31.12.131
11.04.12 143,648 – 275.80 – n/a n/a – n/a 143,648 01.01.12 – 31.12.142
09.04.13 85,770 – 466.10 – n/a n/a – n/a 85,770 01.01.13 – 31.12.153
13.05.14 – 61,908 694.00 – n/a n/a – n/a 61,908 01.01.14– 31.12.164
A M Ringrose 20.04.11 167,574 – 261.00 167,574 672.00 671.50 – 1,227,480 – 01.01.11 – 31.12.131
11.04.12 241,329 – 275.80 – n/a n/a – n/a 241,329 01.01.12 – 31.12.142
09.04.13 144,094 – 466.10 – n/a n/a – n/a 144,094 01.01.13 – 31.12.153
13.05.14 – 104,005 694.00 – n/a n/a – n/a 104,005 01.01.14 – 31.12.164
D I Sutherland 20.04.11 89,528 – 261.00 89,528 672.00 671.50 – 655,793 – 01.01.11 – 31.12.131
11.04.12 128,933 – 275.80 – n/a n/a – n/a 128,933 01.01.12 – 31.12.142
09.04.13 85,770 – 466.10 – n/a n/a – n/a 85,770 01.01.13 – 31.12.153
13.05.14 – 61,908 694.00 – n/a n/a – n/a 61,908 01.01.14 – 31.12.164
# The share price used to calculate the amount realised on exercise was 671.5p, being the closing share price on 22 April 2014, i.e. the date on which all the executive directors exercised their 2011 awards. This figure also includes a dividend equivalent payment of 61.0p per vested share.
*The maximum number of shares that could be receivable by the executive if the performance conditions set out overleaf are fully met:
DIRECTORS’ REMUNERATION REPORT
OVERVIEW
GO
VERNA
NCE
FINA
NCIA
L STATEMEN
TS STRATEG
IC REPORT

96 INTERSERVE ANNUAL REPORT 2014 GOVERNANCE
GOVERNANCE
1The EPS Performance Condition for the 2011 Awards
Adjusted Headline EPS growth of the Company over the performance period Vesting percentage of 50% of shares subject to the award
Less than 15% 0%
15% to 30% 25% to 50% (pro-rated)
30% to 50% 50% to 100% (pro-rated)
Greater than 50% 100%
The 2011 PSP awards were granted in the form of nil-cost options, exercisable between 20 April 2014 and 19 April 2016.
2The EPS Performance Condition for the 2012 Awards
Normalised EPS growth of the Company over the performance period Vesting percentage of two-thirds of shares subject to the award
Less than 20% 0%
20% to 40% 20% to 50% (pro-rated)
40% to 60% 50% to 100% (pro-rated)
Greater than 60% 100%
The 2012 PSP awards were granted in the form of nil-cost options, exercisable between 11 April 2015 and 10 April 2017.
3The EPS Performance Condition for the 2013 Awards
Normalised EPS growth of the Company over the performance period Vesting percentage of two-thirds of shares subject to the award
Less than 49% 0%
49% to 58% 25% to 50% (pro-rated)
58% to 75% 50% to 100% (pro-rated)
Greater than 75% 100%
The 2013 PSP awards were granted in the form of nil-cost options, exercisable between 9 April 2016 and 8 April 2018.
4The EPS Performance Condition for the 2014 Awards
Normalised EPS growth of the Company over the performance period Vesting percentage of two-thirds of shares subject to the award
Less than 40.46% 0%
40.46% to 83% 25% to 100% (pro-rated)
Greater than 83% 100%
The 2014 PSP awards were granted in the form of nil-cost options, exercisable between 13 May 2017 and 12 May 2019. These targets were adjusted in respect of the Initial Facilities acquisition. For full details refer to page 92.
1234The TSR Performance Condition
This condition is determined by comparing the Company’s TSR performance to the TSR of each of a defined list of comparator companies drawn from the Construction and Materials, and Support Services sectors comprising Atkins (WS), Babcock International, Balfour Beatty, Capita Group, Carillion, Costain Group, Kier Group, May Gurney Integrated Services (not after 2013), MITIE Group, Morgan Sindall, Mouchel Group (not after 2012), Rentokil Initial, Rok (not after 2011), RPS Group, Serco, Spice (not after 2011) and WSP Group (not after 2012).
TSR ranking of the Company compared to the comparator group over the performance period
Vesting percentage of 50% of shares subject to the award*
Below median ranking 0%
Median ranking (top 50%) 30%
Median to upper quartile ranking 30% to 100% (pro-rated)
Upper quartile ranking (top 25%) 100%
*Vesting percentage of 50 per cent was replaced by one-third for the 2012, 2013 and 2014 PSP awards.
The awards made in 2011 (measuring performance over the three years to 31 December 2013) vested in full on 20 April 2014 as the Company’s TSR performance was above the upper quartile (top 25 per cent) TSR performance against the peer group and EPS growth was greater than 50 per cent over the performance period (actual growth 77.53 per cent, including credit for the realised value from PFI investments).
DIRECTORS’ REMUNERATION REPORT CONTINUED
DIRECTORS’ REMUNERATION REPORT
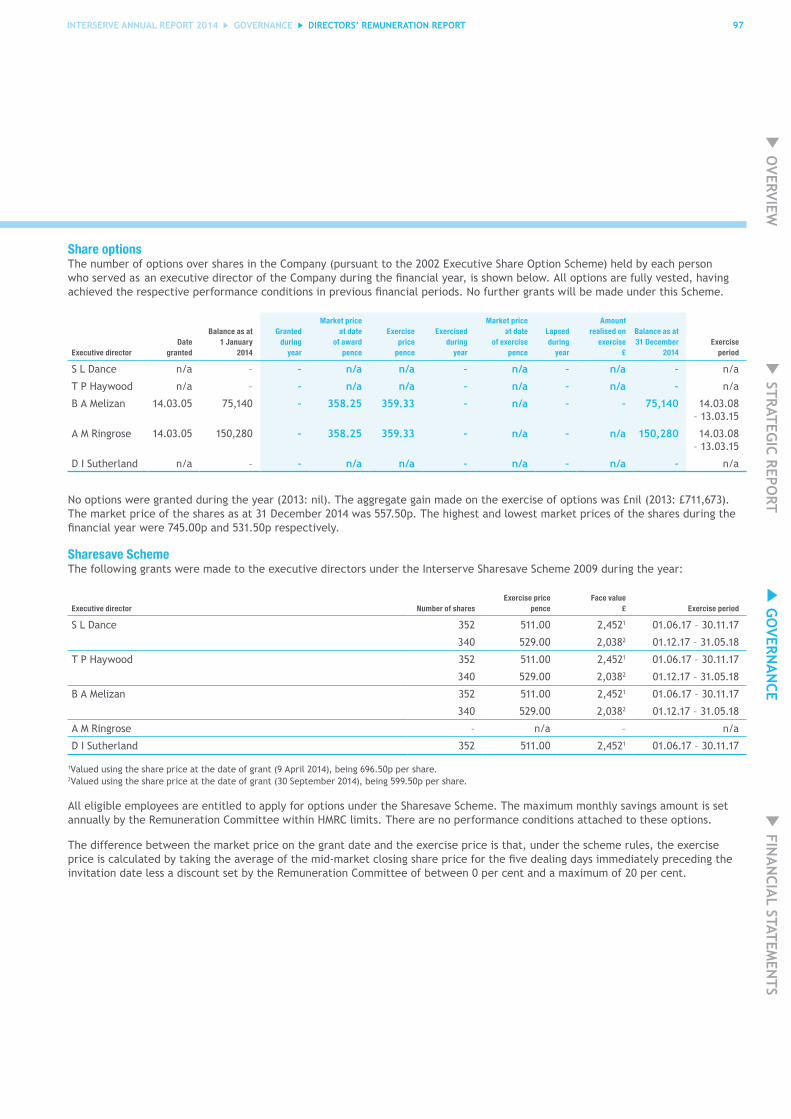
INTERSERVE ANNUAL REPORT 2014 GOVERNANCE 97
Share optionsThe number of options over shares in the Company (pursuant to the 2002 Executive Share Option Scheme) held by each person who served as an executive director of the Company during the financial year, is shown below. All options are fully vested, having achieved the respective performance conditions in previous financial periods. No further grants will be made under this Scheme.
Executive directorDate
granted
Balance as at 1 January
2014
Granted during
year
Market price at date
of award pence
Exercise price
pence
Exercised during
year
Market price at date
of exercise pence
Lapsed during
year
Amount realised on
exercise £
Balance as at 31 December
2014Exercise
period
S L Dance n/a – – n/a n/a – n/a – n/a – n/a
T P Haywood n/a – – n/a n/a – n/a – n/a – n/a
B A Melizan 14.03.05 75,140 – 358.25 359.33 – n/a – – 75,140 14.03.08 – 13.03.15
A M Ringrose 14.03.05 150,280 – 358.25 359.33 – n/a – n/a 150,280 14.03.08 – 13.03.15
D I Sutherland n/a – – n/a n/a – n/a – n/a – n/a
No options were granted during the year (2013: nil). The aggregate gain made on the exercise of options was £nil (2013: £711,673). The market price of the shares as at 31 December 2014 was 557.50p. The highest and lowest market prices of the shares during the financial year were 745.00p and 531.50p respectively.
Sharesave SchemeThe following grants were made to the executive directors under the Interserve Sharesave Scheme 2009 during the year:
Executive director Number of shares Exercise price
penceFace value
£ Exercise period
S L Dance 352 511.00 2,4521 01.06.17 – 30.11.17
340 529.00 2,0382 01.12.17 – 31.05.18
T P Haywood 352 511.00 2,4521 01.06.17 – 30.11.17
340 529.00 2,0382 01.12.17 – 31.05.18
B A Melizan 352 511.00 2,4521 01.06.17 – 30.11.17
340 529.00 2,0382 01.12.17 – 31.05.18
A M Ringrose – n/a – n/a
D I Sutherland 352 511.00 2,4521 01.06.17 – 30.11.17
1Valued using the share price at the date of grant (9 April 2014), being 696.50p per share.2Valued using the share price at the date of grant (30 September 2014), being 599.50p per share.
All eligible employees are entitled to apply for options under the Sharesave Scheme. The maximum monthly savings amount is set annually by the Remuneration Committee within HMRC limits. There are no performance conditions attached to these options.
The difference between the market price on the grant date and the exercise price is that, under the scheme rules, the exercise price is calculated by taking the average of the mid-market closing share price for the five dealing days immediately preceding the invitation date less a discount set by the Remuneration Committee of between 0 per cent and a maximum of 20 per cent.
DIRECTORS’ REMUNERATION REPORT
OVERVIEW
GO
VERNA
NCE
FINA
NCIA
L STATEMEN
TS STRATEG
IC REPORT

98 INTERSERVE ANNUAL REPORT 2014 GOVERNANCE
GOVERNANCE
The number of options over 10p ordinary shares in the Company (pursuant to the Sharesave Scheme) held by each person who served as an executive director of the Company during the financial year, is shown below:
Executive directorDate
granted
Balance as at 1 January
2014
Granted during
year
Market price at date
of award pence
Exercise price
pence
Exercised during
year
Market price at date
of exercise pence
Lapsed during
year
Amount realised on
exercise £
Balance as at 31 December
2014Exercise
period
S L Dance 15.04.11 390 – 260.50 231.00 390 661.50 – 1,679 – 01.07.14 – 31.12.14
05.04.12 378 – 276.40 238.00 – n/a – n/a 378 01.07.15 – 31.12.15
04.04.13 226 – 469.50 398.00 – n/a – n/a 226 01.06.16 – 30.11.16
09.04.14 – 352 696.50 511.00 – n/a – n/a 352 01.06.17 – 30.11.17
30.09.14 – 340 599.50 529.00 – n/a – n/a 340 01.12.17 – 31.05.18
T P Haywood 15.04.11 390 – 260.50 231.00 390 639.50 – 1,593 – 01.07.14 – 31.12.14
05.04.12 378 – 276.40 238.00 – n/a – n/a 378 01.07.15 – 31.12.15
04.04.13 226 – 469.50 398.00 – n/a – n/a 226 01.06.16 – 30.11.16
09.04.14 – 352 696.50 511.00 – n/a – n/a 352 01.06.17 – 30.11.17
30.09.14 – 340 599.50 529.00 – n/a – n/a 340 01.12.17 – 31.05.18
B A Melizan 15.04.11 390 – 260.50 231.00 390 639.50 – 1,593 – 01.07.14 – 31.12.14
05.04.12 378 – 276.40 238.00 – n/a – n/a 378 01.07.15 – 31.12.15
04.04.13 226 – 469.50 398.00 – n/a – n/a 226 01.06.16 – 30.11.16
09.04.14 – 352 696.50 511.00 – n/a – n/a 352 01.06.17 – 30.11.17
30.09.14 – 340 599.50 529.00 – n/a – n/a 340 01.12.17 – 31.05.18
A M Ringrose 05.04.12 378 – 276.40 238.00 – n/a – n/a 378 01.07.15 – 31.12.15
D I Sutherland 05.04.12 378 – 276.40 238.00 – n/a – n/a 378 01.07.15 – 31.12.15
04.04.13 226 – 469.50 398.00 – n/a – n/a 226 01.06.16 – 30.11.16
09.04.14 – 352 696.50 511.00 – n/a – n/a 352 01.06.17 – 30.11.17
Shareholding guidelinesExecutive directors are expected to build up a holding equivalent to 100 per cent of their base salary over time.
A percentage of the Annual Variable Pay is required to be invested in Company shares and no fewer than 100 per cent of shares net of taxes following an option exercise or award vesting must be retained until such time as the shareholding guidelines have been met.
Shares purchased under the Annual Variable Pay arrangements, the 2002 Executive Share Option Scheme, the Sharesave Scheme and the SIP count toward this limit. Share options and awards under the PSP, whether or not vested, do not count towards satisfying the shareholding guidelines.
DIRECTORS’ REMUNERATION REPORT CONTINUED
DIRECTORS’ REMUNERATION REPORT
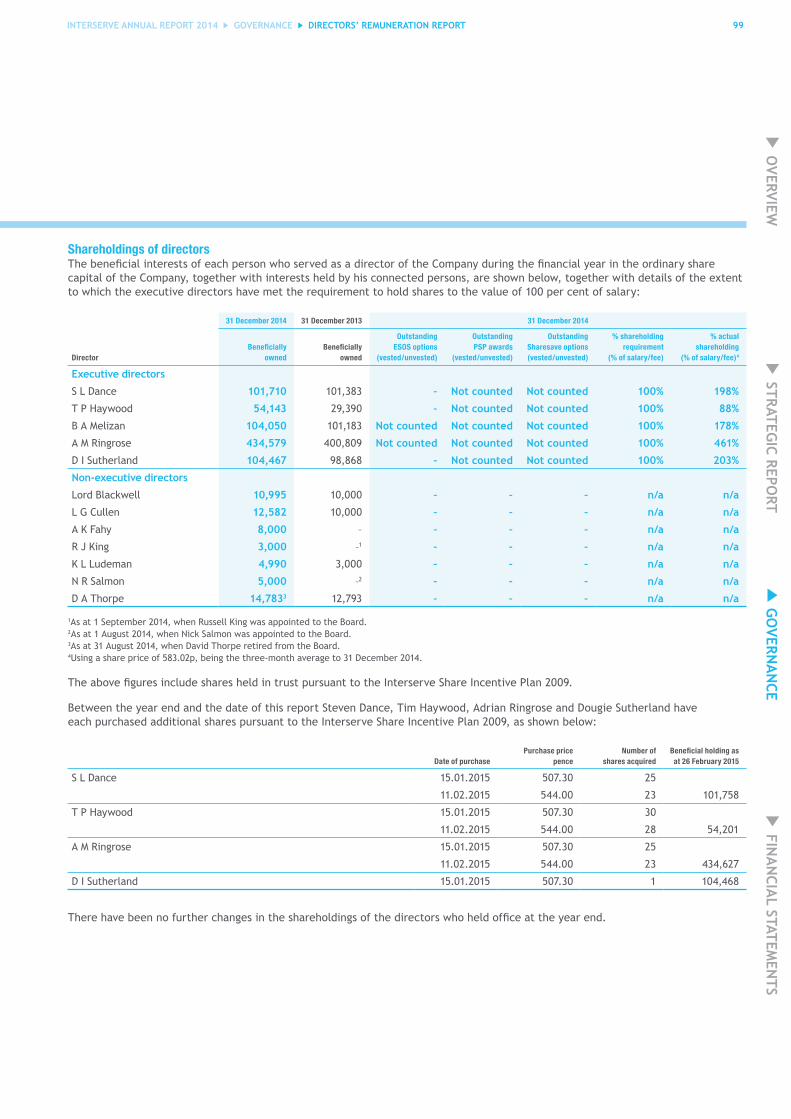
INTERSERVE ANNUAL REPORT 2014 GOVERNANCE 99
Shareholdings of directorsThe beneficial interests of each person who served as a director of the Company during the financial year in the ordinary share capital of the Company, together with interests held by his connected persons, are shown below, together with details of the extent to which the executive directors have met the requirement to hold shares to the value of 100 per cent of salary:
Director
31 December 2014 31 December 2013 31 December 2014
Beneficially owned
Beneficially owned
Outstanding ESOS options
(vested/unvested)
Outstanding PSP awards
(vested/unvested)
Outstanding Sharesave options (vested/unvested)
% shareholding requirement
(% of salary/fee)
% actual shareholding
(% of salary/fee)4
Executive directors
S L Dance 101,710 101,383 – Not counted Not counted 100% 198%
T P Haywood 54,143 29,390 – Not counted Not counted 100% 88%
B A Melizan 104,050 101,183 Not counted Not counted Not counted 100% 178%
A M Ringrose 434,579 400,809 Not counted Not counted Not counted 100% 461%
D I Sutherland 104,467 98,868 – Not counted Not counted 100% 203%
Non-executive directors
Lord Blackwell 10,995 10,000 – – – n/a n/a
L G Cullen 12,582 10,000 – – – n/a n/a
A K Fahy 8,000 – – – – n/a n/a
R J King 3,000 –1 – – – n/a n/a
K L Ludeman 4,990 3,000 – – – n/a n/a
N R Salmon 5,000 –2 – – – n/a n/a
D A Thorpe 14,7833 12,793 – – – n/a n/a
1As at 1 September 2014, when Russell King was appointed to the Board.2As at 1 August 2014, when Nick Salmon was appointed to the Board.3As at 31 August 2014, when David Thorpe retired from the Board.4Using a share price of 583.02p, being the three-month average to 31 December 2014.
The above figures include shares held in trust pursuant to the Interserve Share Incentive Plan 2009.
Between the year end and the date of this report Steven Dance, Tim Haywood, Adrian Ringrose and Dougie Sutherland have each purchased additional shares pursuant to the Interserve Share Incentive Plan 2009, as shown below:
Date of purchasePurchase price
penceNumber of
shares acquiredBeneficial holding as at 26 February 2015
S L Dance 15.01.2015 507.30 25
11.02.2015 544.00 23 101,758
T P Haywood 15.01.2015 507.30 30
11.02.2015 544.00 28 54,201
A M Ringrose 15.01.2015 507.30 25
11.02.2015 544.00 23 434,627
D I Sutherland 15.01.2015 507.30 1 104,468
There have been no further changes in the shareholdings of the directors who held office at the year end.
DIRECTORS’ REMUNERATION REPORT
OVERVIEW
GO
VERNA
NCE
FINA
NCIA
L STATEMEN
TS STRATEG
IC REPORT
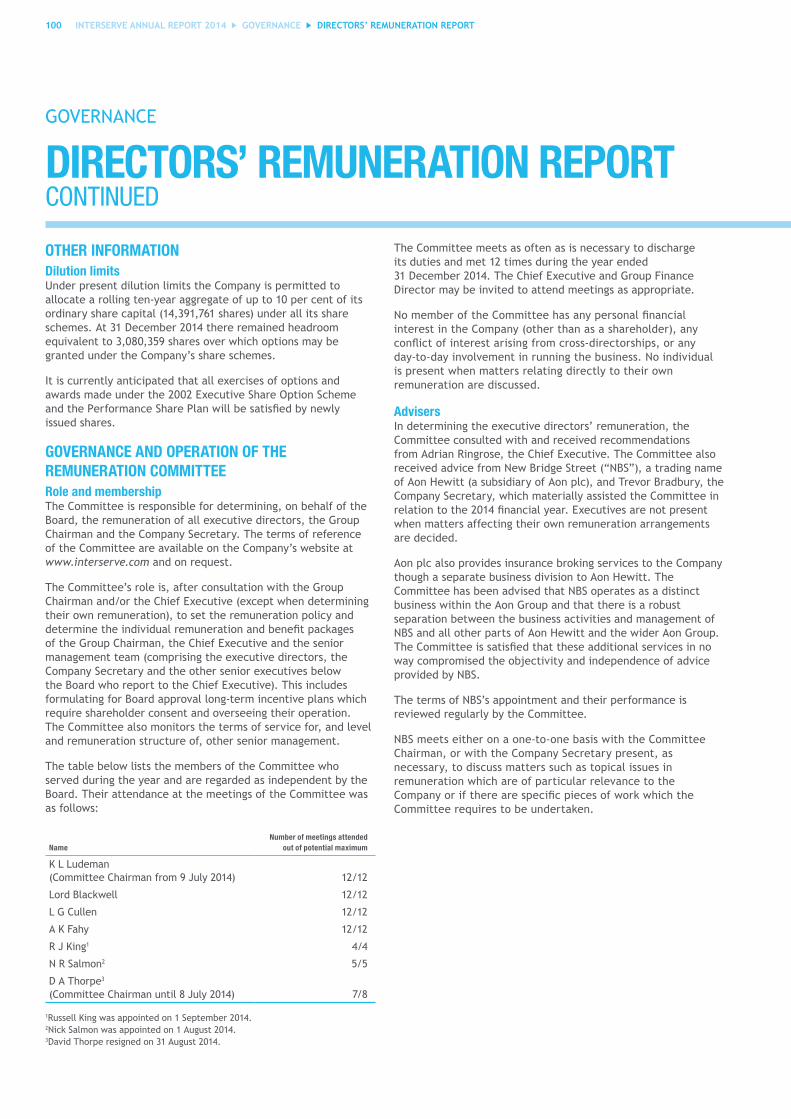
100 INTERSERVE ANNUAL REPORT 2014 GOVERNANCE
GOVERNANCE
OTHER INFORMATIONDilution limits Under present dilution limits the Company is permitted to allocate a rolling ten-year aggregate of up to 10 per cent of its ordinary share capital (14,391,761 shares) under all its share schemes. At 31 December 2014 there remained headroom equivalent to 3,080,359 shares over which options may be granted under the Company’s share schemes.
It is currently anticipated that all exercises of options and awards made under the 2002 Executive Share Option Scheme and the Performance Share Plan will be satisfied by newly issued shares.
GOVERNANCE AND OPERATION OF THE REMUNERATION COMMITTEE Role and membershipThe Committee is responsible for determining, on behalf of the Board, the remuneration of all executive directors, the Group Chairman and the Company Secretary. The terms of reference of the Committee are available on the Company’s website at www.interserve.com and on request.
The Committee’s role is, after consultation with the Group Chairman and/or the Chief Executive (except when determining their own remuneration), to set the remuneration policy and determine the individual remuneration and benefit packages of the Group Chairman, the Chief Executive and the senior management team (comprising the executive directors, the Company Secretary and the other senior executives below the Board who report to the Chief Executive). This includes formulating for Board approval long-term incentive plans which require shareholder consent and overseeing their operation. The Committee also monitors the terms of service for, and level and remuneration structure of, other senior management.
The table below lists the members of the Committee who served during the year and are regarded as independent by the Board. Their attendance at the meetings of the Committee was as follows:
NameNumber of meetings attended
out of potential maximum
K L Ludeman (Committee Chairman from 9 July 2014) 12/12
Lord Blackwell 12/12
L G Cullen 12/12
A K Fahy 12/12
R J King1 4/4
N R Salmon2 5/5
D A Thorpe3 (Committee Chairman until 8 July 2014) 7/8
1Russell King was appointed on 1 September 2014.2Nick Salmon was appointed on 1 August 2014.3David Thorpe resigned on 31 August 2014.
The Committee meets as often as is necessary to discharge its duties and met 12 times during the year ended 31 December 2014. The Chief Executive and Group Finance Director may be invited to attend meetings as appropriate.
No member of the Committee has any personal financial interest in the Company (other than as a shareholder), any conflict of interest arising from cross-directorships, or any day-to-day involvement in running the business. No individual is present when matters relating directly to their own remuneration are discussed.
AdvisersIn determining the executive directors’ remuneration, the Committee consulted with and received recommendations from Adrian Ringrose, the Chief Executive. The Committee also received advice from New Bridge Street (“NBS”), a trading name of Aon Hewitt (a subsidiary of Aon plc), and Trevor Bradbury, the Company Secretary, which materially assisted the Committee in relation to the 2014 financial year. Executives are not present when matters affecting their own remuneration arrangements are decided.
Aon plc also provides insurance broking services to the Company though a separate business division to Aon Hewitt. The Committee has been advised that NBS operates as a distinct business within the Aon Group and that there is a robust separation between the business activities and management of NBS and all other parts of Aon Hewitt and the wider Aon Group. The Committee is satisfied that these additional services in no way compromised the objectivity and independence of advice provided by NBS.
The terms of NBS’s appointment and their performance is reviewed regularly by the Committee.
NBS meets either on a one-to-one basis with the Committee Chairman, or with the Company Secretary present, as necessary, to discuss matters such as topical issues in remuneration which are of particular relevance to the Company or if there are specific pieces of work which the Committee requires to be undertaken.
DIRECTORS’ REMUNERATION REPORT CONTINUED
DIRECTORS’ REMUNERATION REPORT
INTERSERVE ANNUAL REPORT 2014 GOVERNANCE 101
The total fee paid to NBS in respect of its services to the Committee during the year was £122,989 (2013: £21,505). These fees relate to sundry ongoing advice, in line with NBS’s role of providing ongoing support and advice to the Committee over the entire remuneration year. This included:
• performance monitoring of the TSR element of the Performance Share Plan;
• review of vesting documentation for the Performance Share Plan;
• IFRS 2 option valuation;
• assistance with the remuneration review for senior managers, including the executive directors;
• assistance with the drafting of the Directors’ Remuneration Report; and
• the provision of updates on developments in remuneration practice.
Any fees for major projects would normally be negotiated in advance of such a project being undertaken.
NBS is a signatory to the Remuneration Consultants’ Code of Conduct and has confirmed its compliance with the Code.
Statement of shareholder voting at AGMAt the AGM held on 13 May 2014, the Directors’ Remuneration Policy and the Annual Report on Remuneration received the following votes from shareholders:
Resolution text Votes for % for Votes against % againstTotal votes cast
(including votes withheld)Votes
withheld
Directors’ Remuneration Policy 93,059,430 98.0 1,697,625 1.8 94,931,945 174,890
Annual Report on Remuneration 93,775,951 98.8 975,177 1.0 94,931,946 180,818
Shareholder engagementDuring the year the Committee consulted with shareholders on the proposed revisions to the remuneration packages of the executive directors as explained in more detail on page 87 of this report.
APPROVALThis report was approved by the Board of Directors on 26 February 2015 and signed on its behalf by:
Keith LudemanChairman of the Remuneration Committee 26 February 2015
DIRECTORS’ REMUNERATION REPORT
OVERVIEW
GO
VERNA
NCE
FINA
NCIA
L STATEMEN
TS STRATEG
IC REPORT
102 INTERSERVE ANNUAL REPORT 2014 GOVERNANCE
GOVERNANCE
The directors are responsible for preparing the Annual Report and the financial statements in accordance with applicable law and regulations.
Company law requires the directors to prepare financial statements for each financial year. Under that law the directors are required to prepare the Group financial statements in accordance with International Financial Reporting Standards (“IFRS”) as adopted by the European Union and Article 4 of the IAS Regulation and have elected to prepare the parent company financial statements in accordance with United Kingdom Generally Accepted Accounting Practice (“UK GAAP”) (UK Accounting Standards and applicable law).
Under company law the directors must not approve the financial statements unless they are satisfied that they give a true and fair view of the state of affairs of the Group and parent company and of their profit or loss for that period.
In preparing the parent company financial statements, the directors are required to:
• select suitable accounting policies and then apply them consistently;
• make judgements and estimates that are reasonable and prudent;
• state whether applicable UK Accounting Standards have been followed, subject to any material departures disclosed and explained in the financial statements; and
• prepare the financial statements on the going concern basis unless it is inappropriate to presume that the company will continue in business.
In preparing the Group financial statements, International Accounting Standard 1 requires that the directors:
• properly select and apply accounting policies;
• present information, including accounting policies, in a manner that provides relevant, reliable, comparable and understandable information;
• provide additional disclosures when compliance with the specific requirements in IFRSs are insufficient to enable users to understand the impact of particular transactions, other events and conditions on the entity’s financial position and financial performance; and
• make an assessment of the Group’s ability to continue as a going concern.
The directors are responsible for keeping adequate accounting records that are sufficient to show and explain the parent company’s transactions and disclose with reasonable accuracy at any time the financial position of the parent company and enable them to ensure that the financial statements comply with the Companies Act 2006 and Article 4 of the IAS Regulations. They are also responsible for safeguarding the assets of the Group and hence for taking reasonable steps for the prevention and detection of fraud and other irregularities.
Under applicable law and regulations, the directors are also responsible for preparing a Strategic Report, Directors’ Report, Directors’ Remuneration Report and Corporate Governance statement that comply with that law and those regulations.
The directors confirm that, to the best of their knowledge:
(a) the parent company and Group financial statements in this Annual Report, which have been prepared in accordance with UK GAAP and IFRS, respectively, give a true and fair view of the assets, liabilities, financial position and profit of the parent company and of the Group taken as a whole;
(b) the management report required by paragraph 4.1.8R of the FCA’s Disclosure and Transparency Rules (contained in the Strategic Report and the Directors’ Report) includes a fair review of the development and performance of the business and the position of the parent company and the Group taken as a whole, together with a description of the principal risks and uncertainties that they face; and
(c) the Annual Report and Financial Statements, taken as a whole, are fair, balanced and understandable and provide the information necessary for shareholders to assess the Group’s performance, business model and strategy.
By order of the Board
A M Ringrose T P HaywoodChief Executive Group Finance Director
26 February 2015
DIRECTORS’ RESPONSIBILITY STATEMENT
DIRECTORS’ REMUNERATION REPORT

103INTERSERVE ANNUAL REPORT 2014 FINANCIAL STATEMENTS INdEPENdENT AUdITOR’S REPORT
OVERVIEW
GO
VERNA
NCE
FINA
NCIA
L STATEMEN
TS STRATEG
IC REPORT
Independent auditor’s reportto the members of Interserve Plc
Our opinion on the financial statements is unmodified In our opinion:
• the financial statements give a true and fair view of the state of the Group’s and of the parent company’s affairs as at 31 December 2014 and of the Group’s profit for the year then ended;
• the Group financial statements have been properly prepared in accordance with International Financial Reporting Standards (IFRSs) as adopted by the European Union;
• the parent company financial statements have been properly prepared in accordance with applicable law and United Kingdom Accounting Standards (United Kingdom Generally Accepted Accounting Practice); and
• the financial statements have been prepared in accordance with the requirements of the Companies Act 2006 and, as regards the Group financial statements, Article 4 of the IAS Regulation.
What we have audited:Interserve Plc’s financial statements comprise the Consolidated Income Statement, the Consolidated Statement of Comprehensive Income, the Consolidated and Parent Company Balance Sheets, the Consolidated Statement of Changes in Equity, the Consolidated Cash Flow Statement and the related notes.
The financial reporting framework that has been applied in the preparation of the Group financial statements is applicable law and IFRSs as adopted by the European Union. The financial reporting framework that has been applied in the preparation of the parent company financial statements is United Kingdom Generally Accepted Accounting Practice.
Our assessment of risk Without modifying our opinion, we highlight the following matters that are, in our judgement, likely to be most important to users’ understanding of our audit. Our audit procedures relating to these matters were designed in the context of our audit of the Group financial statements as a whole and not to express an opinion on individual transactions, account balances or disclosures.
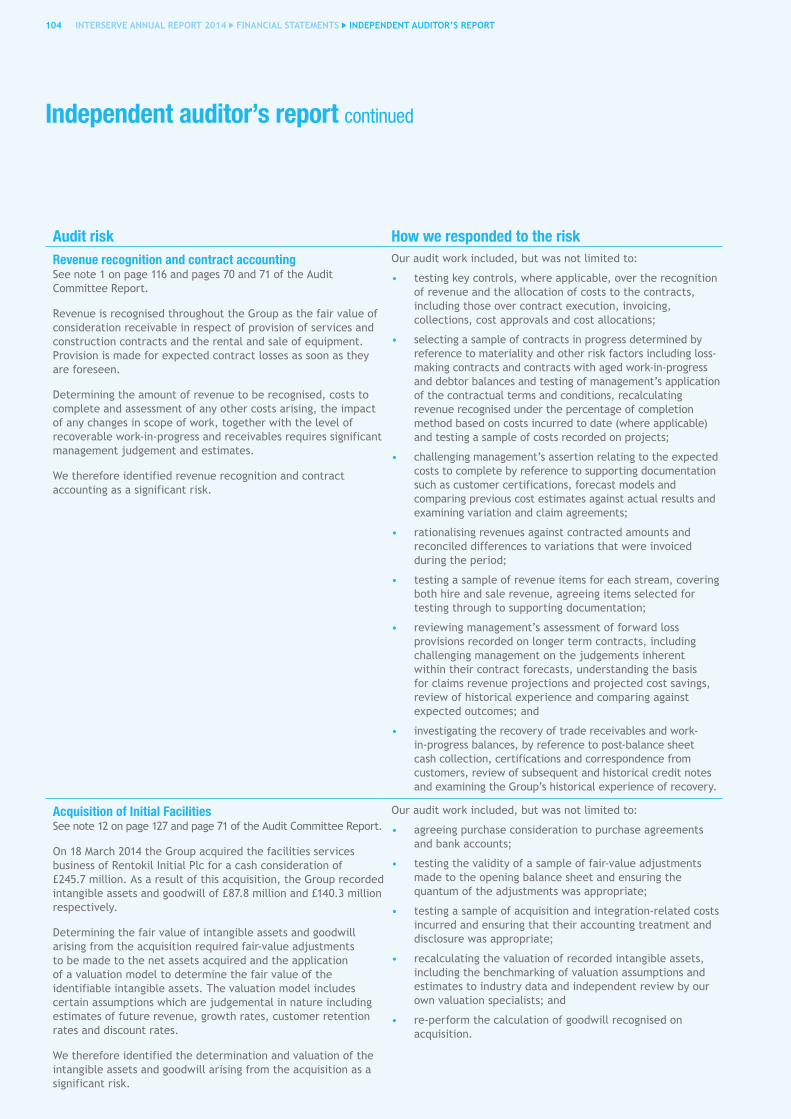
Independent auditor’s report continued
104 INTERSERVE ANNUAL REPORT 2014 FINANCIAL STATEMENTS INdEPENdENT AUdITOR’S REPORT
Audit risk How we responded to the riskRevenue recognition and contract accountingSee note 1 on page 116 and pages 70 and 71 of the Audit Committee Report.
Revenue is recognised throughout the Group as the fair value of consideration receivable in respect of provision of services and construction contracts and the rental and sale of equipment. Provision is made for expected contract losses as soon as they are foreseen.
Determining the amount of revenue to be recognised, costs to complete and assessment of any other costs arising, the impact of any changes in scope of work, together with the level of recoverable work-in-progress and receivables requires significant management judgement and estimates.
We therefore identified revenue recognition and contract accounting as a significant risk.
Our audit work included, but was not limited to:
• testing key controls, where applicable, over the recognition of revenue and the allocation of costs to the contracts, including those over contract execution, invoicing, collections, cost approvals and cost allocations;
• selecting a sample of contracts in progress determined by reference to materiality and other risk factors including loss-making contracts and contracts with aged work-in-progress and debtor balances and testing of management’s application of the contractual terms and conditions, recalculating revenue recognised under the percentage of completion method based on costs incurred to date (where applicable) and testing a sample of costs recorded on projects;
• challenging management’s assertion relating to the expected costs to complete by reference to supporting documentation such as customer certifications, forecast models and comparing previous cost estimates against actual results and examining variation and claim agreements;
• rationalising revenues against contracted amounts and reconciled differences to variations that were invoiced during the period;
• testing a sample of revenue items for each stream, covering both hire and sale revenue, agreeing items selected for testing through to supporting documentation;
• reviewing management’s assessment of forward loss provisions recorded on longer term contracts, including challenging management on the judgements inherent within their contract forecasts, understanding the basis for claims revenue projections and projected cost savings, review of historical experience and comparing against expected outcomes; and
• investigating the recovery of trade receivables and work-in-progress balances, by reference to post-balance sheet cash collection, certifications and correspondence from customers, review of subsequent and historical credit notes and examining the Group’s historical experience of recovery.
Acquisition of Initial FacilitiesSee note 12 on page 127 and page 71 of the Audit Committee Report.
On 18 March 2014 the Group acquired the facilities services business of Rentokil Initial Plc for a cash consideration of £245.7 million. As a result of this acquisition, the Group recorded intangible assets and goodwill of £87.8 million and £140.3 million respectively.
Determining the fair value of intangible assets and goodwill arising from the acquisition required fair-value adjustments to be made to the net assets acquired and the application of a valuation model to determine the fair value of the identifiable intangible assets. The valuation model includes certain assumptions which are judgemental in nature including estimates of future revenue, growth rates, customer retention rates and discount rates.
We therefore identified the determination and valuation of the intangible assets and goodwill arising from the acquisition as a significant risk.
Our audit work included, but was not limited to:
• agreeing purchase consideration to purchase agreements and bank accounts;
• testing the validity of a sample of fair-value adjustments made to the opening balance sheet and ensuring the quantum of the adjustments was appropriate;
• testing a sample of acquisition and integration-related costs incurred and ensuring that their accounting treatment and disclosure was appropriate;
• recalculating the valuation of recorded intangible assets, including the benchmarking of valuation assumptions and estimates to industry data and independent review by our own valuation specialists; and
• re-perform the calculation of goodwill recognised on acquisition.
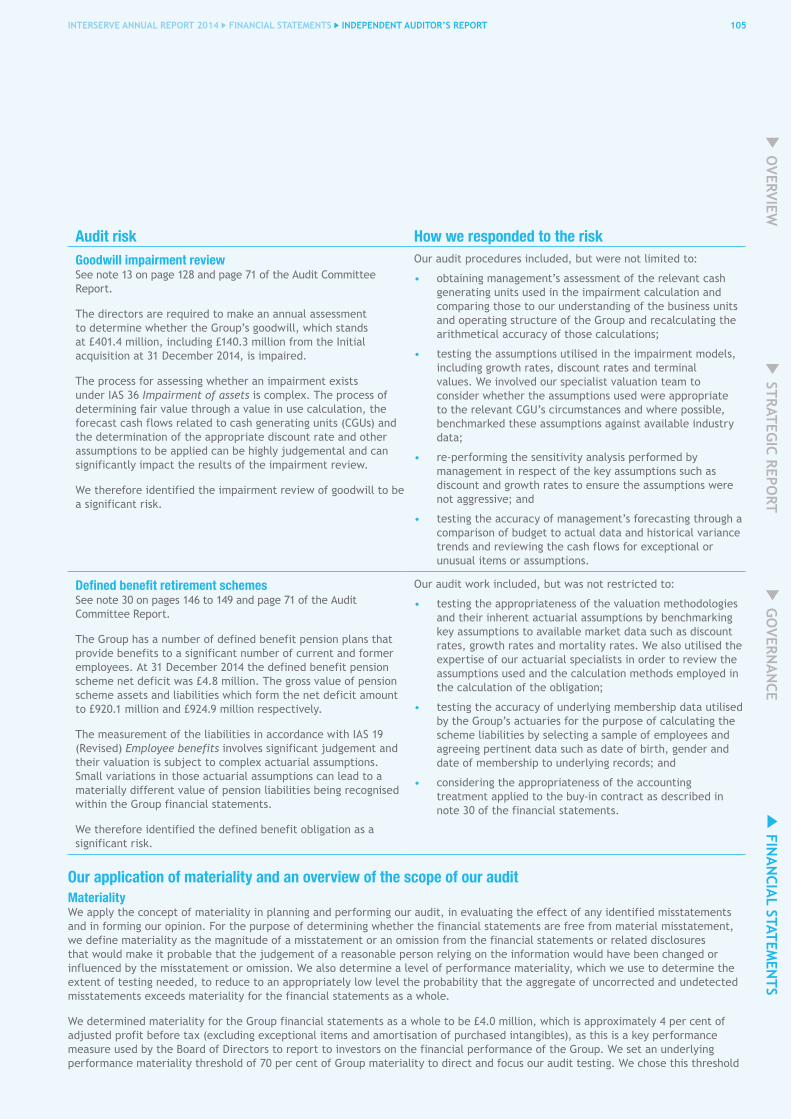
105INTERSERVE ANNUAL REPORT 2014 FINANCIAL STATEMENTS INdEPENdENT AUdITOR’S REPORT
OVERVIEW
GO
VERNA
NCE
FINA
NCIA
L STATEMEN
TS STRATEG
IC REPORT
Audit risk How we responded to the riskGoodwill impairment reviewSee note 13 on page 128 and page 71 of the Audit Committee Report.
The directors are required to make an annual assessment to determine whether the Group’s goodwill, which stands at £401.4 million, including £140.3 million from the Initial acquisition at 31 December 2014, is impaired.
The process for assessing whether an impairment exists under IAS 36 Impairment of assets is complex. The process of determining fair value through a value in use calculation, the forecast cash flows related to cash generating units (CGUs) and the determination of the appropriate discount rate and other assumptions to be applied can be highly judgemental and can significantly impact the results of the impairment review.
We therefore identified the impairment review of goodwill to be a significant risk.
Our audit procedures included, but were not limited to:
• obtaining management’s assessment of the relevant cash generating units used in the impairment calculation and comparing those to our understanding of the business units and operating structure of the Group and recalculating the arithmetical accuracy of those calculations;
• testing the assumptions utilised in the impairment models, including growth rates, discount rates and terminal values. We involved our specialist valuation team to consider whether the assumptions used were appropriate to the relevant CGU’s circumstances and where possible, benchmarked these assumptions against available industry data;
• re-performing the sensitivity analysis performed by management in respect of the key assumptions such as discount and growth rates to ensure the assumptions were not aggressive; and
• testing the accuracy of management’s forecasting through a comparison of budget to actual data and historical variance trends and reviewing the cash flows for exceptional or unusual items or assumptions.
Defined benefit retirement schemes See note 30 on pages 146 to 149 and page 71 of the Audit Committee Report.
The Group has a number of defined benefit pension plans that provide benefits to a significant number of current and former employees. At 31 December 2014 the defined benefit pension scheme net deficit was £4.8 million. The gross value of pension scheme assets and liabilities which form the net deficit amount to £920.1 million and £924.9 million respectively.
The measurement of the liabilities in accordance with IAS 19 (Revised) Employee benefits involves significant judgement and their valuation is subject to complex actuarial assumptions. Small variations in those actuarial assumptions can lead to a materially different value of pension liabilities being recognised within the Group financial statements.
We therefore identified the defined benefit obligation as a significant risk.
Our audit work included, but was not restricted to:
• testing the appropriateness of the valuation methodologies and their inherent actuarial assumptions by benchmarking key assumptions to available market data such as discount rates, growth rates and mortality rates. We also utilised the expertise of our actuarial specialists in order to review the assumptions used and the calculation methods employed in the calculation of the obligation;
• testing the accuracy of underlying membership data utilised by the Group’s actuaries for the purpose of calculating the scheme liabilities by selecting a sample of employees and agreeing pertinent data such as date of birth, gender and date of membership to underlying records; and
• considering the appropriateness of the accounting treatment applied to the buy-in contract as described in note 30 of the financial statements.
Our application of materiality and an overview of the scope of our audit MaterialityWe apply the concept of materiality in planning and performing our audit, in evaluating the effect of any identified misstatements and in forming our opinion. For the purpose of determining whether the financial statements are free from material misstatement, we define materiality as the magnitude of a misstatement or an omission from the financial statements or related disclosures that would make it probable that the judgement of a reasonable person relying on the information would have been changed or influenced by the misstatement or omission. We also determine a level of performance materiality, which we use to determine the extent of testing needed, to reduce to an appropriately low level the probability that the aggregate of uncorrected and undetected misstatements exceeds materiality for the financial statements as a whole.
We determined materiality for the Group financial statements as a whole to be £4.0 million, which is approximately 4 per cent of adjusted profit before tax (excluding exceptional items and amortisation of purchased intangibles), as this is a key performance measure used by the Board of Directors to report to investors on the financial performance of the Group. We set an underlying performance materiality threshold of 70 per cent of Group materiality to direct and focus our audit testing. We chose this threshold

Independent auditor’s report continued
106 INTERSERVE ANNUAL REPORT 2014 FINANCIAL STATEMENTS INdEPENdENT AUdITOR’S REPORT
Our application of materiality and an overview of the scope of our audit continued
Materiality continuedbased on our assessment of the control environment obtained during our risk assessment procedures. The audits undertaken for Group reporting purposes, of the components noted below, were carried out to a materiality level that did not exceed our level of performance materiality.
We agreed with the Audit Committee that we would report to them misstatements above £200,000 identified during our audit, which represents 5 per cent of materiality. We would report misstatements identified below that amount if there were qualitative factors that would warrant the attention of the Audit Committee.
Overview of the scope of our auditOur audit approach was based on a thorough understanding of the Group’s business and is risk-based. An interim visit was conducted before the year end at all significant components of the Group to complete advance substantive audit procedures and to evaluate the Group’s internal controls environment including its IT systems. The components of the Group were evaluated by the group audit team based on a measure of materiality considering each as a percentage of total Group assets, revenues and profit before taxes, to assess the significance of the component and to determine the planned audit response. For those components that were deemed significant, either a full scope or targeted audit approach was determined based on their relative materiality to the Group and our assessment of the audit risk. For significant components requiring a full scope approach we evaluated and tested controls over the financial reporting systems identified as part of our risk assessment, reviewed the accounts production process and addressed critical accounting matters. We sought, wherever possible, to rely on the effectiveness of the Group’s internal controls in order to reduce substantive testing. We then undertook substantive testing on significant transactions and material account balances.
In order to address the audit risks described above as identified during our planning procedures, we performed a full-scope audit of the consolidated financial statements of the parent company, Interserve Plc, and of the Group’s operations throughout the United Kingdom. The operations that were subject to full-scope audit procedures make up 90.7 per cent of total revenues. Statutory audits of subsidiaries are performed to lower materiality where applicable.
While the majority of the operations are located within the United Kingdom, the Group has material operations spanning the globe. Through an analysis of these operations we determined that targeted audit procedures should be carried out in Oman, Qatar, the United Arab Emirates, Ireland, Spain, Saudi Arabia, India, Australia, South Africa, New Zealand, Hong Kong, the Philippines and the United States of America. These targeted procedures addressed the significant risks described above. Those components subjected to targeted audit procedures comprise 8.6 per cent of total revenues.
In total our full scope and targeted procedures covered 99.3 per cent of total revenues and 95.3 per cent of total profit before tax.
The remaining operations of the Group were subjected to analytical procedures over the balance sheet and income statements of the related entities with a focus on applicable risks identified above and the significance to the Group’s balances.
Detailed audit instructions were issued to the auditors of the reporting components where a full scope or targeted audit approach had been identified. The instructions detailed the significant risks that should be addressed through the audit procedures and indicated certain information required to be reported back to the group audit team. The group audit team performed site visits in the United Kingdom, Oman, Qatar and the United Arab Emirates, which included a review of the work performed by the component auditors. Where targeted components outside of the UK were not physically visited a review of working papers was conducted. The group audit team communicated with all component auditors throughout the planning, fieldwork and concluding stages of the local audits.
Other reporting required by regulationOur opinion on other matters prescribed by the Companies Act 2006 is unmodifiedIn our opinion:
• the part of the Directors’ Remuneration Report to be audited has been properly prepared in accordance with the Companies Act 2006; and
• the information given in the Strategic Report and Directors’ Report for the financial year for which the financial statements are prepared is consistent with the financial statements.
107INTERSERVE ANNUAL REPORT 2014 FINANCIAL STATEMENTS INdEPENdENT AUdITOR’S REPORT
OVERVIEW
GO
VERNA
NCE
FINA
NCIA
L STATEMEN
TS STRATEG
IC REPORT
Matters on which we are required to report by exceptionWe have nothing to report in respect of the following:
Under the International Standards on Accounting (UK and Ireland), we are required to report to you if, in our opinion, information in the Annual Report is:
• materially inconsistent with the information in the audited financial statements; or
• apparently materially incorrect based on, or materially inconsistent with, our knowledge of the Group acquired in the course of performing our audit; or
• otherwise misleading.
In particular, we are required to report to you if:
• we have identified any inconsistencies between our knowledge acquired during the audit and the directors’ statement that they consider the Annual Report is fair, balanced and understandable; or
• the Annual Report does not appropriately disclose those matters that were communicated to the Audit Committee which we consider should have been disclosed.
Under the Companies Act 2006 we are required to report to you if, in our opinion:
• adequate accounting records have not been kept by the parent company, or returns adequate for our audit have not been received from branches not visited by us; or
• the parent company financial statements and the part of the Directors’ Remuneration Report to be audited are not in agreement with the accounting records and returns; or
• certain disclosures of directors’ remuneration specified by law are not made; or
• we have not received all the information and explanations we require for our audit.
Under the Listing Rules, we are required to review:
• the directors’ statement, set out on page 47, in relation to going concern; and
• the part of the Corporate Governance statement relating to the Company’s compliance with the ten provisions of the UK Corporate Governance Code specified for our review.
Responsibilities for the financial statements and the auditWhat an audit of financial statements involves:
A description of the scope of an audit of financial statements is provided on the Financial Reporting Council’s website at www.frc.org.uk/auditscopeukprivate.
Our responsibilities and those of the directors:
As explained more fully in the Directors’ Responsibility Statement set out on page 102, the directors are responsible for the preparation of the financial statements and for being satisfied that they give a true and fair view. Our responsibility is to audit and express an opinion on the financial statements in accordance with applicable law and International Standards on Auditing (UK and Ireland). Those standards require us to comply with the Auditing Practices Board’s Ethical Standards for Auditors.
Who we are reporting to:
This report is made solely to the Company’s members, as a body, in accordance with Chapter 3 of Part 16 of the Companies Act 2006. Our audit work has been undertaken so that we might state to the Company’s members those matters we are required to state to them in an auditor’s report and for no other purpose. To the fullest extent permitted by law, we do not accept or assume responsibility to anyone other than the Company and the Company’s members as a body, for our audit work, for this report, or for the opinions we have formed.
Simon Lowe Senior Statutory Auditor for and on behalf of Grant Thornton UK LLP Statutory Auditor, Chartered Accountants London, United Kingdom 26 February 2015
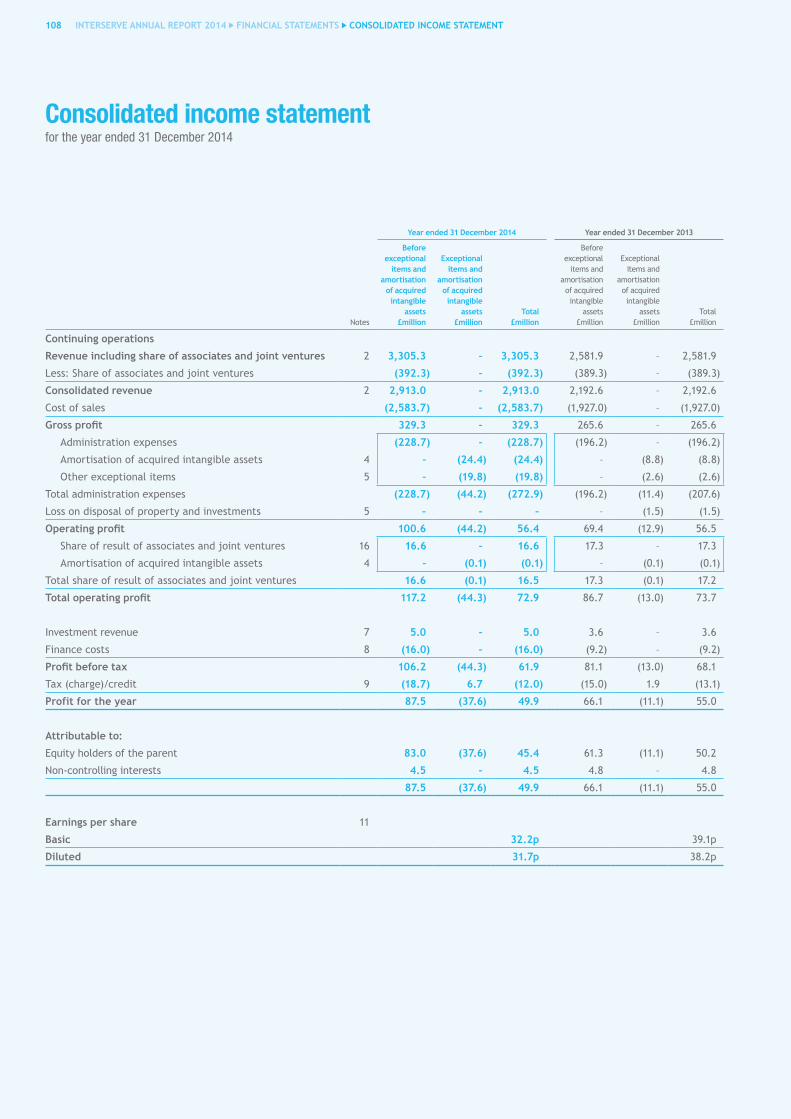
Consolidated income statementfor the year ended 31 December 2014
108 INTERSERVE ANNUAL REPORT 2014 FINANCIAL STATEMENTS CONSOLIdATEd INCOME STATEMENT
Year ended 31 december 2014 Year ended 31 december 2013
Notes
Before exceptional
items and amortisation
of acquired intangible
assets £million
Exceptional items and
amortisation of acquired intangible
assets £million
Total £million
Before exceptional
items and amortisation of acquired intangible
assets £million
Exceptional items and
amortisation of acquired intangible
assets £million
Total £million
Continuing operations
Revenue including share of associates and joint ventures 2 3,305.3 – 3,305.3 2,581.9 – 2,581.9
Less: Share of associates and joint ventures (392.3) – (392.3) (389.3) – (389.3)
Consolidated revenue 2 2,913.0 – 2,913.0 2,192.6 – 2,192.6
Cost of sales (2,583.7) – (2,583.7) (1,927.0) – (1,927.0)
Gross profit 329.3 – 329.3 265.6 – 265.6
Administration expenses (228.7) – (228.7) (196.2) – (196.2)
Amortisation of acquired intangible assets 4 – (24.4) (24.4) – (8.8) (8.8)
Other exceptional items 5 – (19.8) (19.8) – (2.6) (2.6)
Total administration expenses (228.7) (44.2) (272.9) (196.2) (11.4) (207.6)
Loss on disposal of property and investments 5 – – – – (1.5) (1.5)
Operating profit 100.6 (44.2) 56.4 69.4 (12.9) 56.5
Share of result of associates and joint ventures 16 16.6 – 16.6 17.3 – 17.3
Amortisation of acquired intangible assets 4 – (0.1) (0.1) – (0.1) (0.1)
Total share of result of associates and joint ventures 16.6 (0.1) 16.5 17.3 (0.1) 17.2
Total operating profit 117.2 (44.3) 72.9 86.7 (13.0) 73.7
Investment revenue 7 5.0 – 5.0 3.6 – 3.6
Finance costs 8 (16.0) – (16.0) (9.2) – (9.2)
Profit before tax 106.2 (44.3) 61.9 81.1 (13.0) 68.1
Tax (charge)/credit 9 (18.7) 6.7 (12.0) (15.0) 1.9 (13.1)
Profit for the year 87.5 (37.6) 49.9 66.1 (11.1) 55.0
Attributable to:
Equity holders of the parent 83.0 (37.6) 45.4 61.3 (11.1) 50.2
Non-controlling interests 4.5 – 4.5 4.8 – 4.8
87.5 (37.6) 49.9 66.1 (11.1) 55.0
Earnings per share 11
Basic 32.2p 39.1p
diluted 31.7p 38.2p
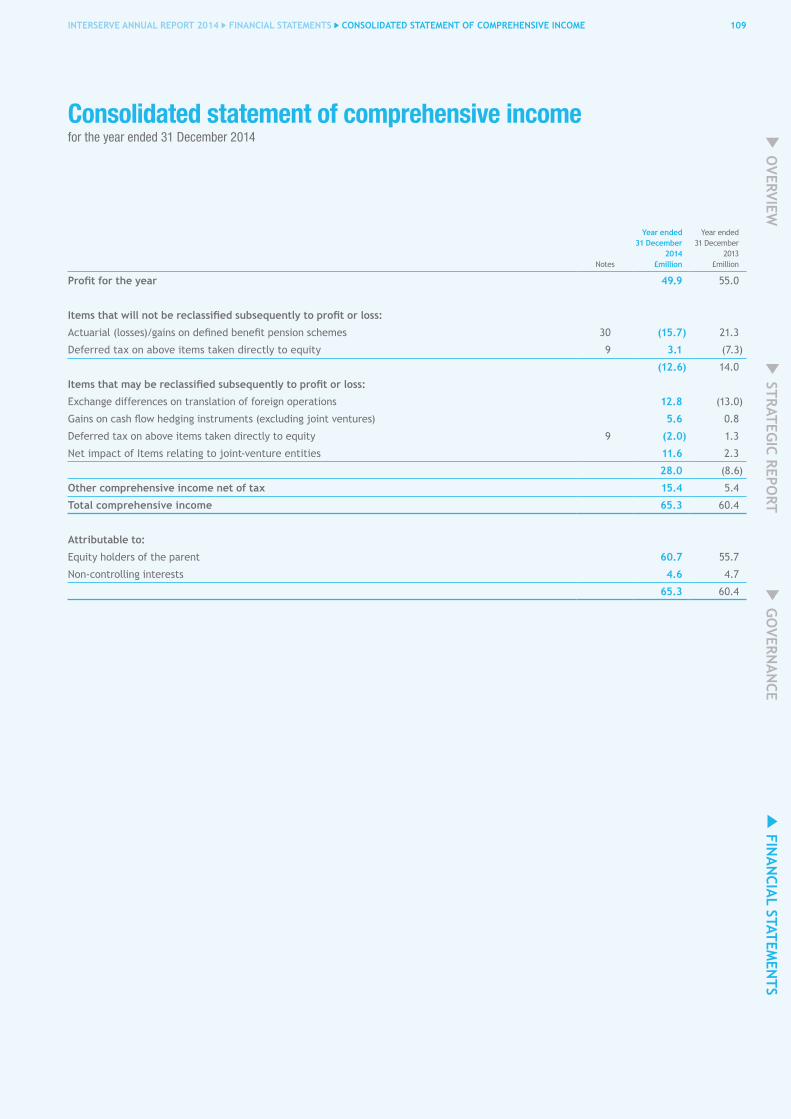
OVERVIEW
GO
VERNA
NCE
FINA
NCIA
L STATEMEN
TS STRATEG
IC REPORT
Consolidated statement of comprehensive incomefor the year ended 31 December 2014
109INTERSERVE ANNUAL REPORT 2014 FINANCIAL STATEMENTS CONSOLIdATEd STATEMENT OF COMPREhENSIVE INCOME
Notes
Year ended 31 december
2014 £million
Year ended 31 December
2013 £million
Profit for the year 49.9 55.0
Items that will not be reclassified subsequently to profit or loss:
Actuarial (losses)/gains on defined benefit pension schemes 30 (15.7) 21.3
Deferred tax on above items taken directly to equity 9 3.1 (7.3)
(12.6) 14.0
Items that may be reclassified subsequently to profit or loss:
Exchange differences on translation of foreign operations 12.8 (13.0)
Gains on cash flow hedging instruments (excluding joint ventures) 5.6 0.8
Deferred tax on above items taken directly to equity 9 (2.0) 1.3
Net impact of Items relating to joint-venture entities 11.6 2.3
28.0 (8.6)
Other comprehensive income net of tax 15.4 5.4
Total comprehensive income 65.3 60.4
Attributable to:
Equity holders of the parent 60.7 55.7
Non-controlling interests 4.6 4.7
65.3 60.4
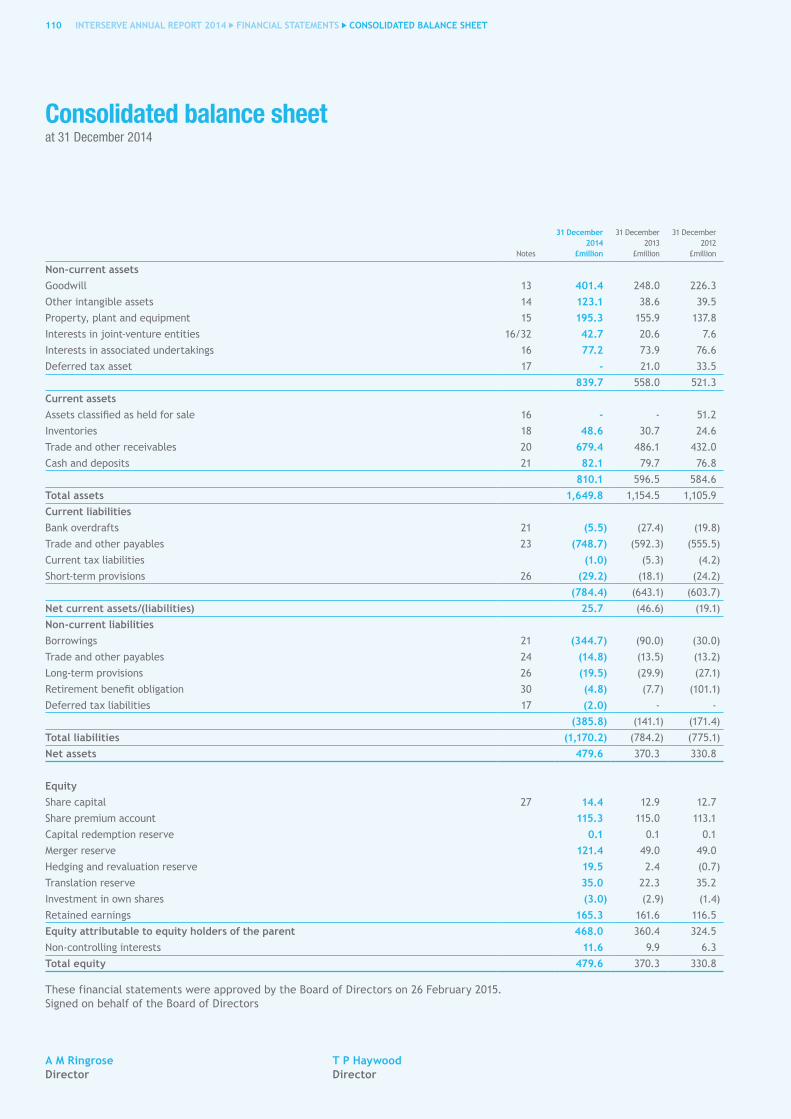
Consolidated balance sheetat 31 December 2014
110 INTERSERVE ANNUAL REPORT 2014 FINANCIAL STATEMENTS CONSOLIdATEd BALANCE ShEET
Notes
31 december 2014
£million
31 December 2013
£million
31 December 2012
£million
Non-current assetsGoodwill 13 401.4 248.0 226.3
Other intangible assets 14 123.1 38.6 39.5
Property, plant and equipment 15 195.3 155.9 137.8
Interests in joint-venture entities 16/32 42.7 20.6 7.6
Interests in associated undertakings 16 77.2 73.9 76.6
Deferred tax asset 17 - 21.0 33.5
839.7 558.0 521.3
Current assetsAssets classified as held for sale 16 - - 51.2
Inventories 18 48.6 30.7 24.6
Trade and other receivables 20 679.4 486.1 432.0
Cash and deposits 21 82.1 79.7 76.8
810.1 596.5 584.6
Total assets 1,649.8 1,154.5 1,105.9
Current liabilitiesBank overdrafts 21 (5.5) (27.4) (19.8)
Trade and other payables 23 (748.7) (592.3) (555.5)
Current tax liabilities (1.0) (5.3) (4.2)
Short-term provisions 26 (29.2) (18.1) (24.2)
(784.4) (643.1) (603.7)
Net current assets/(liabilities) 25.7 (46.6) (19.1)
Non-current liabilitiesBorrowings 21 (344.7) (90.0) (30.0)
Trade and other payables 24 (14.8) (13.5) (13.2)
Long-term provisions 26 (19.5) (29.9) (27.1)
Retirement benefit obligation 30 (4.8) (7.7) (101.1)
Deferred tax liabilities 17 (2.0) - -
(385.8) (141.1) (171.4)
Total liabilities (1,170.2) (784.2) (775.1)
Net assets 479.6 370.3 330.8
Equity Share capital 27 14.4 12.9 12.7
Share premium account 115.3 115.0 113.1
Capital redemption reserve 0.1 0.1 0.1
Merger reserve 121.4 49.0 49.0
Hedging and revaluation reserve 19.5 2.4 (0.7)
Translation reserve 35.0 22.3 35.2
Investment in own shares (3.0) (2.9) (1.4)
Retained earnings 165.3 161.6 116.5
Equity attributable to equity holders of the parent 468.0 360.4 324.5
Non-controlling interests 11.6 9.9 6.3
Total equity 479.6 370.3 330.8
These financial statements were approved by the Board of Directors on 26 February 2015. Signed on behalf of the Board of Directors
A M Ringrose T P haywood director director
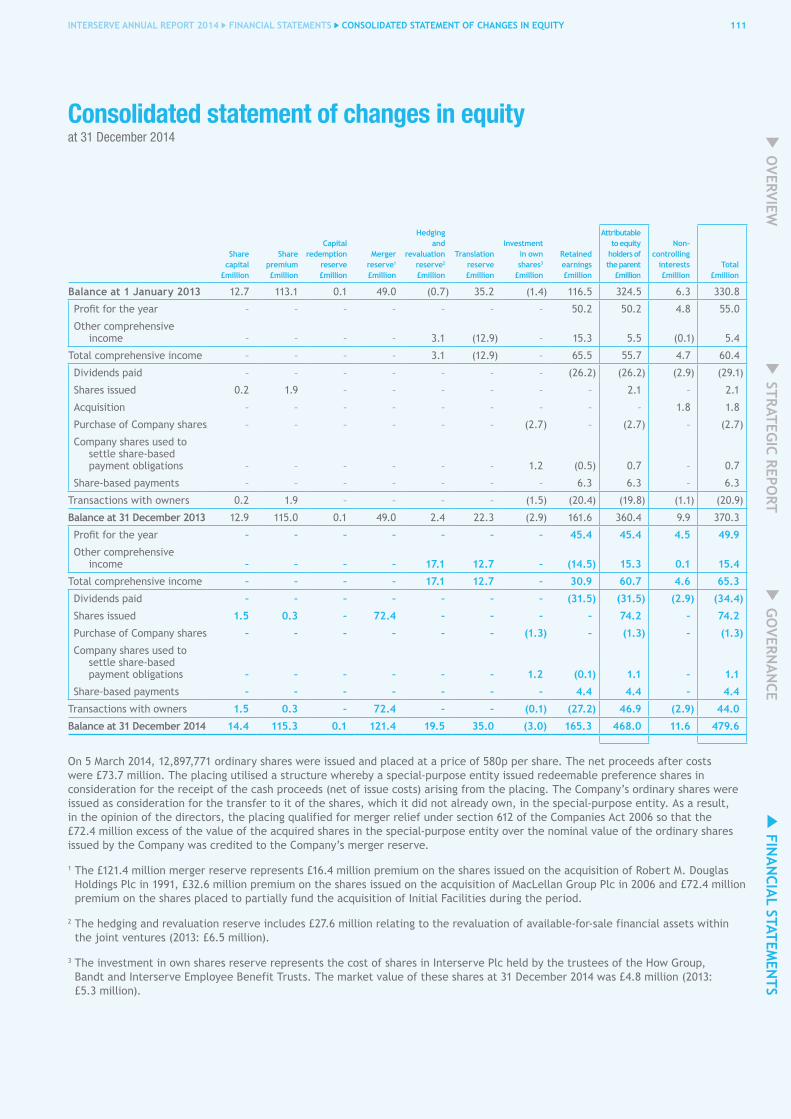
OVERVIEW
GO
VERNA
NCE
FINA
NCIA
L STATEMEN
TS STRATEG
IC REPORT
Consolidated statement of changes in equityat 31 December 2014
111INTERSERVE ANNUAL REPORT 2014 FINANCIAL STATEMENTS CONSOLIdATEd STATEMENT OF ChANGES IN EqUITY
Share capital
£million
Share premium £million
Capital redemption
reserve £million
Merger reserve1 £million
hedging and
revaluation reserve2 £million
Translation reserve £million
Investment in own shares3
£million
Retained earnings £million
Attributable to equity
holders of the parent
£million
Non- controlling
interests £million
Total £million
Balance at 1 January 2013 12.7 113.1 0.1 49.0 (0.7) 35.2 (1.4) 116.5 324.5 6.3 330.8
Profit for the year – – – – – – – 50.2 50.2 4.8 55.0
Other comprehensive income – – – – 3.1 (12.9) – 15.3 5.5 (0.1) 5.4
Total comprehensive income – – – – 3.1 (12.9) – 65.5 55.7 4.7 60.4
Dividends paid – – – – – – – (26.2) (26.2) (2.9) (29.1)
Shares issued 0.2 1.9 – – – – – – 2.1 – 2.1
Acquisition – – – – – – – – – 1.8 1.8
Purchase of Company shares – – – – – – (2.7) – (2.7) – (2.7)
Company shares used to settle share-based payment obligations – – – – – – 1.2 (0.5) 0.7 – 0.7
Share-based payments – – – – – – – 6.3 6.3 – 6.3
Transactions with owners 0.2 1.9 – – – – (1.5) (20.4) (19.8) (1.1) (20.9)
Balance at 31 december 2013 12.9 115.0 0.1 49.0 2.4 22.3 (2.9) 161.6 360.4 9.9 370.3
Profit for the year – – – – – – – 45.4 45.4 4.5 49.9
Other comprehensive income – – – – 17.1 12.7 – (14.5) 15.3 0.1 15.4
Total comprehensive income – – – – 17.1 12.7 – 30.9 60.7 4.6 65.3
Dividends paid – – – – – – – (31.5) (31.5) (2.9) (34.4)
Shares issued 1.5 0.3 – 72.4 – – – – 74.2 – 74.2
Purchase of Company shares – – – – – – (1.3) – (1.3) – (1.3)
Company shares used to settle share-based payment obligations – – – – – – 1.2 (0.1) 1.1 – 1.1
Share-based payments – – – – – – – 4.4 4.4 – 4.4
Transactions with owners 1.5 0.3 – 72.4 – – (0.1) (27.2) 46.9 (2.9) 44.0
Balance at 31 december 2014 14.4 115.3 0.1 121.4 19.5 35.0 (3.0) 165.3 468.0 11.6 479.6
On 5 March 2014, 12,897,771 ordinary shares were issued and placed at a price of 580p per share. The net proceeds after costs were £73.7 million. The placing utilised a structure whereby a special-purpose entity issued redeemable preference shares in consideration for the receipt of the cash proceeds (net of issue costs) arising from the placing. The Company’s ordinary shares were issued as consideration for the transfer to it of the shares, which it did not already own, in the special-purpose entity. As a result, in the opinion of the directors, the placing qualified for merger relief under section 612 of the Companies Act 2006 so that the £72.4 million excess of the value of the acquired shares in the special-purpose entity over the nominal value of the ordinary shares issued by the Company was credited to the Company’s merger reserve.
1 The £121.4 million merger reserve represents £16.4 million premium on the shares issued on the acquisition of Robert M. Douglas Holdings Plc in 1991, £32.6 million premium on the shares issued on the acquisition of MacLellan Group Plc in 2006 and £72.4 million premium on the shares placed to partially fund the acquisition of Initial Facilities during the period.
2 The hedging and revaluation reserve includes £27.6 million relating to the revaluation of available-for-sale financial assets within the joint ventures (2013: £6.5 million).
3 The investment in own shares reserve represents the cost of shares in Interserve Plc held by the trustees of the How Group, Bandt and Interserve Employee Benefit Trusts. The market value of these shares at 31 December 2014 was £4.8 million (2013: £5.3 million).

Consolidated cash flow statement for the year ended 31 December 2014
112 INTERSERVE ANNUAL REPORT 2014 FINANCIAL STATEMENTS CONSOLIdATEd CASh FLOw STATEMENT
Notes
Year ended 31 december
2014 £million
Year ended 31 December
2013 £million
Operating activities
Total operating profit 72.9 73.7
Adjustments for:
Amortisation of acquired intangible assets 14 24.4 8.8
Amortisation of capitalised software development 14 3.7 1.9
Depreciation of property, plant and equipment 15 35.6 31.9
(Profit)/loss on disposal of property and investments 5 - 1.5
Other non-cash exceptional items 5 1.4 0.5
Pension contributions in excess of the income statement charge (18.2) (18.5)
Share of results of associates and joint ventures (16.5) (17.2)
Charge relating to share-based payments 29 3.4 5.5
Gain on disposal of plant and equipment - hire fleet (12.1) (13.4)
Gain on disposal of plant and equipment - other (0.1) –
Operating cash flows before movements in working capital 94.5 74.7
Increase in inventories (13.4) (4.5)
Increase in receivables (73.6) (14.6)
Increase/(decrease) in payables 33.7 (0.6)
Cash generated by operations before changes in hire fleet 41.2 55.0
Capital expenditure - hire fleet 15 (47.0) (29.8)
Proceeds on disposal of plant and equipment - hire fleet 16.7 18.0
Cash generated by operations 10.9 43.2
Taxes paid (10.2) (5.7)
Net cash from operating activities 0.7 37.5
Investing activities
Interest received 4.7 3.5
Dividends received from associates and joint ventures 16a 17.8 13.7
Proceeds on disposal of plant and equipment - non-hire fleet 0.9 0.2
Capital expenditure - non-hire fleet 14/15 (24.9) (22.1)
Purchase of businesses 12 (243.7) (49.1)
Investment in joint-venture entities 16b (10.4) (10.6)
Costs of disposal of investments 5 - (0.2)
Receipt of loan repayment - Investments 16b 0.3 -
Net cash used in investing activities (255.3) (64.6)
Financing activities
Interest paid (16.0) (7.8)
Dividends paid to equity shareholders 10 (31.5) (26.2)
Dividends paid to minority shareholders (2.9) (2.9)
Proceeds from issue of shares and exercise of share options 75.2 3.3
Purchase of own shares (1.3) (2.7)
Proceeds from US private placement 207.2 -
Increase in bank loans 47.5 60.0
Movement in obligations under finance leases (0.1) (0.3)
Net cash from financing activities 278.1 23.4
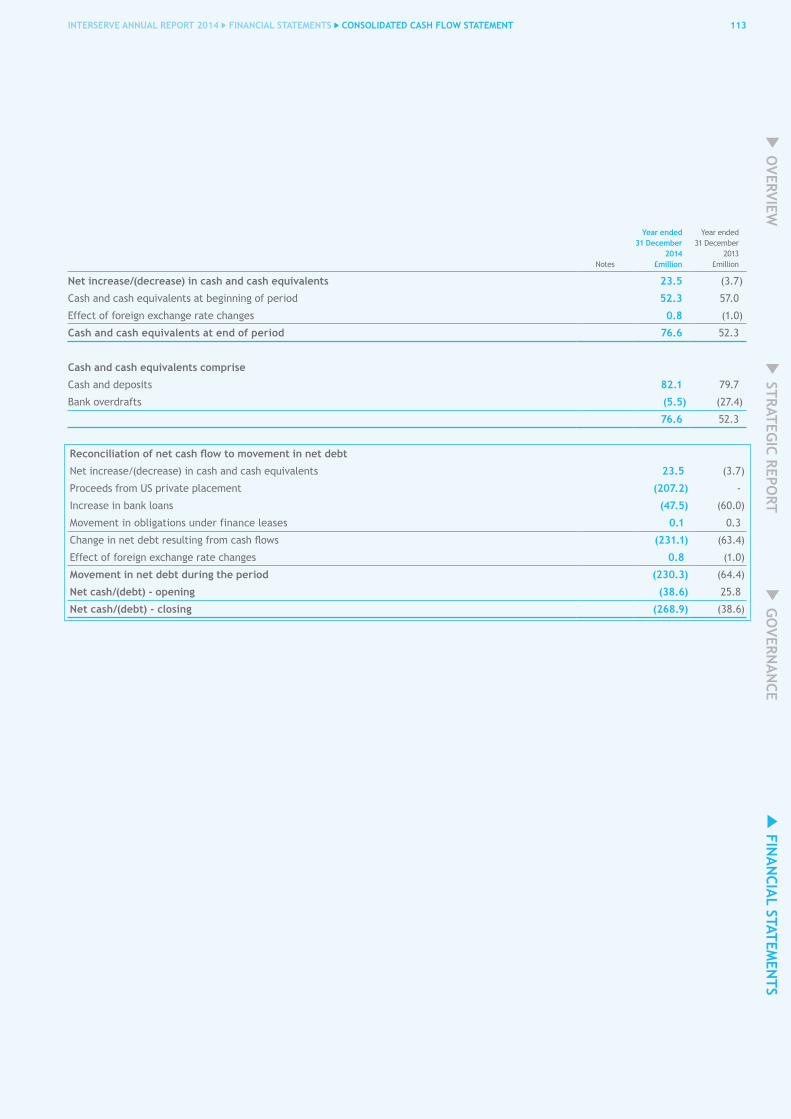
113INTERSERVE ANNUAL REPORT 2014 FINANCIAL STATEMENTS CONSOLIdATEd CASh FLOw STATEMENT
OVERVIEW
GO
VERNA
NCE
FINA
NCIA
L STATEMEN
TS STRATEG
IC REPORT
Notes
Year ended 31 december
2014 £million
Year ended 31 December
2013 £million
Net increase/(decrease) in cash and cash equivalents 23.5 (3.7)
Cash and cash equivalents at beginning of period 52.3 57.0
Effect of foreign exchange rate changes 0.8 (1.0)
Cash and cash equivalents at end of period 76.6 52.3
Cash and cash equivalents comprise
Cash and deposits 82.1 79.7
Bank overdrafts (5.5) (27.4)
76.6 52.3
Reconciliation of net cash flow to movement in net debt
Net increase/(decrease) in cash and cash equivalents 23.5 (3.7)
Proceeds from US private placement (207.2) -
Increase in bank loans (47.5) (60.0)
Movement in obligations under finance leases 0.1 0.3
Change in net debt resulting from cash flows (231.1) (63.4)
Effect of foreign exchange rate changes 0.8 (1.0)
Movement in net debt during the period (230.3) (64.4)
Net cash/(debt) - opening (38.6) 25.8
Net cash/(debt) - closing (268.9) (38.6)

Notes to the consolidated financial statementsfor the year ended 31 December 2014
114 INTERSERVE ANNUAL REPORT 2014 FINANCIAL STATEMENTS NOTES TO ThE CONSOLIdATEd FINANCIAL STATEMENTS
1. Basis of preparation and accounting policies
Basis of preparation
The Interserve Plc consolidated financial statements have been prepared in accordance with International Financial Reporting Standards (“IFRS”) and comply with the IFRS and related interpretations (SIC and IFRIC interpretations) as adopted by the European Union.
(a) Adoption of new and revised standards
In the current year, the following new and revised standards and interpretations have been adopted and affected the amounts reported in these financial statements:
IFRS 10 Consolidated financial statements IFRS 11 Joint arrangementsIFRS 12 Disclosures of interests in other entitiesIAS 27 Separate financial statementsIAS 28 Investments in associates and joint venturesIAS 32 Offsetting financial assets and financial liabilities IAS 39 Novation of derivatives and continuation of hedge accounting
These do not materially impact the Group.
At the date of authorisation of these Group financial statements, the following standards and interpretations were in issue but not yet effective, and therefore have not been applied in these Group financial statements:
IFRS 9 Financial instrumentsThe impact of the sections of IFRS 9 currently issued will result in the Group’s project finance interests that are currently treated by the joint-venture companies as being available-for-sale, being treated as a debt carried at “fair value through profit or loss” or “amortised cost”. As a result, movements in the fair value will no longer be taken to “Other comprehensive income”.
IFRS 15 Revenue from contracts with customersThe new standard will replace IAS 18 Revenue and IAS 11 Construction contracts. It will become effective for accounting periods on or after 1 January 2017, at the earliest. In advance of its adoption, the Group will conduct a systematic review of all existing major contracts to ensure that the impact and effect of the new standard is fully understood, and changes to the current accounting procedures are highlighted and acted upon.
Except for IFRS 9 and IFRS 15 noted above, the directors do not currently anticipate that the adoption of any other standard and interpretation that has been issued but is not yet effective will have a material impact on the financial statements of the Group in future periods.
(b) Critical accounting judgements and key sources of estimation and uncertainty
In the preparation of the consolidated financial statements management makes certain judgements and estimates that impact the financial statements. While these judgements are continually reviewed the facts and circumstances underlying these judgements may change resulting in a change to the estimates that could impact the results of the Group. In particular:
Revenue and margin recognitionThe policy for revenue recognition on long-term and service contracts is set out in notes 1(d) and (e). Judgements are made on an ongoing basis with regard to the recoverability of amounts due, liabilities arising and the requirement for forward loss provisions. Regular forecasts are compiled on the outcomes of these types of contracts, which require assessments and judgements relating to the recovery of pre-contract costs, changes in work scopes, contract programmes and maintenance liabilities.
PFI financial assets and derivative financial instrumentsThe Group’s interests in PFI/PPP investments are classified as “available-for-sale” financial assets by the joint-venture entities. The fair value of these financial assets is measured at each balance sheet date by discounting the future cash flows allocated to the financial asset. The discount rate used is based on long-term LIBOR plus a margin to reflect the risk associated with each project.
The Group’s PFI/PPP joint-venture and associate companies use derivative financial instruments to manage the interest rate risk to which the concessions are exposed within their long-term contractual agreements. These derivatives are initially recognised as assets and liabilities at their fair value and subsequently remeasured at each balance sheet date at their fair value. The fair value of derivatives, assessed by discounting future cash flows, constantly changes in response to prevailing market conditions.
Measurement of impairment of goodwill and intangible assetsAs set out in notes 1(b) and (h) the carrying value of goodwill and intangible assets is reviewed for impairment at least annually. In determining whether goodwill is impaired an estimation of the value in use of the cash generating unit (CGU) to which the goodwill has been allocated is required. This calculation of value in use requires estimates to be made relating to the timing and amount of future cash flows expected from the CGU, and suitable discount rates based on the Group’s weighted average cost of capital adjusted to reflect the specific economic environment of the relevant CGU.

115INTERSERVE ANNUAL REPORT 2014 FINANCIAL STATEMENTS NOTES TO ThE CONSOLIdATEd FINANCIAL STATEMENTS
OVERVIEW
GO
VERNA
NCE
FINA
NCIA
L STATEMEN
TS STRATEG
IC REPORT
Retirement benefit obligationsIn accordance with IAS 19 Employee benefits, the Group has disclosed in note 30 the assumptions used in calculating the defined benefit obligations. In the calculation a number of assumptions around future salary increases, increase in pension benefits, mortality rates, inflation and discount rates have been made. Small changes in these assumptions can lead to significant changes to the overall scheme liabilities, as disclosed in note 30. Judgement is also exercised in establishing the fair value of retirement benefit assets, most notably the valuation of the buy-in contract to insure some of the benefits of a subset of the pension membership of the Scheme provided by the insurer.
Property, plant and equipmentThe rental fleet in Equipment Services has a significant carrying value (see note 15). The great majority of equipment in the rental fleet is depreciated on a straight-line basis to a residual value of zero over 10 years. Asset lives are reviewed regularly in light of technological change, prospective utilisation and the physical condition of the assets. Due to the transportable nature of the rental fleet, the review for potential impairment is performed on a global basis.
Carrying value of trade and other receivables Allowance for doubtful debt and provisions against other receivables, including amounts due on construction contracts and carrying value of accrued income, are made on a specific basis, based on estimates of irrecoverability determined by market knowledge and past experience.
Acquisition accountingA number of judgements and estimates are necessary in establishing the opening net asset position, fair-value adjustments and the value of intangible assets in respect of businesses acquired. These include estimates of future revenue, growth rates, customer retention rates and discount rates.
Accounting policies
Interserve Plc (the Company) is a company incorporated in the United Kingdom and bound by the Companies Act 2006. The consolidated financial statements comprise the Company and its subsidiaries (together referred to as the Group) and the Group’s interest in joint ventures and associates. These financial statements are presented in pounds sterling which is the currency of the primary economic environment in which the Group operates. Foreign operations are included in accordance with the policies set out below.
These financial statements have been prepared on a historical cost basis, except for the revaluation of certain financial instruments.
The financial statements are prepared on a going concern basis. As disclosed on page 47 the directors believe that the Group has adequate resources to continue in operational existence for the foreseeable future.
The significant accounting policies adopted by the directors are set out below and have been applied consistently in dealing with items which are considered material to the Group’s financial statements.
(a) Basis of consolidation
The Group financial statements incorporate the financial statements of the Company and entities controlled by the Company (its subsidiaries). The results, assets and liabilities of associates and joint-venture entities are accounted for under the equity method of accounting. The results of subsidiaries acquired or disposed of during the year are included from the effective date of acquisition or until the effective date of disposal respectively.
Non-controlling interests in the net assets of the consolidated subsidiaries are identified separately from the Group’s equity interest therein. Non-controlling interests consist of those interests at the date of the original business combination and the minority’s share of the changes in equity since the date of the combination.
All intra-group transactions, balances, income and expenses are eliminated on consolidation.
Where necessary, adjustments are made to the financial statements of the associates, joint ventures and any newly acquired subsidiaries to bring their accounting policies into line with those used by the Group. When an entity has an accounting reference date other than 31 December, due to the influence of a co-shareholder or customer requirements, the consolidation includes management accounts, prepared using these Group accounting policies, drawn up for the year ended 31 December.
Where a Group company is party to a jointly-controlled operation, that company proportionately accounts for its share of the income and expenditure, assets, liabilities and cash flows on a line-by-line basis. Such arrangements are reported in the consolidated financial statements on the same basis.
Notes to the consolidated financial statements continued
116 INTERSERVE ANNUAL REPORT 2014 FINANCIAL STATEMENTS NOTES TO ThE CONSOLIdATEd FINANCIAL STATEMENTS
1. Basis of preparation and accounting policies continued
(b) Business combinations
Business combinations are accounted for using the acquisition accounting method. The cost of the acquisition is measured at the aggregate of the fair values, at the date of acquisition, of assets given, liabilities incurred or assumed and equity instruments issued by the Group in exchange for control of the acquired company. The acquired company’s identifiable assets, liabilities and contingent liabilities are recognised at their fair value as at the acquisition date. Before the adoption of IFRS 3 (revised), the cost of acquisition included any costs directly attributable to the business combination. Costs incurred on acquisitions completed since 1 January 2010, the date of adoption of the revision to IFRS 3, are expensed.
Goodwill arising on consolidation represents the excess of the cost of acquisition over the Group’s interest in the fair value of the identifiable assets and liabilities of a subsidiary at the date of acquisition. Goodwill is recognised as an asset and reviewed for impairment at least annually. Any impairment is recognised immediately in the income statement and is not subsequently reversed.
On disposal of a subsidiary, associate or jointly-controlled entity, the attributable amount of goodwill is included in the determination of the profit or loss on disposal.
Goodwill arising on acquisitions before the date of transition to IFRS has been retained at the previous UK GAAP value at that date, subject to being subsequently tested for impairment. Goodwill written off to reserves under UK GAAP prior to 1998 has not been reinstated and is not included in determining any subsequent profit or loss on disposal. Goodwill arising on the acquisition of shares in associated undertakings is included within investments in associated undertakings.
The interest of minority shareholders in the acquired company is initially measured at the minorities’ proportion of the net fair value of the assets, liabilities and contingent liabilities recognised.
(c) Foreign currency
Transactions denominated in foreign currency are translated at the rates ruling at the dates of the transactions.
Monetary assets and liabilities denominated in foreign currencies at the balance sheet date are translated at the rates ruling at that date. These translation differences are dealt with in the profit for the year.
The financial results and cash flows of foreign subsidiaries, associated undertakings and joint ventures are translated into sterling at the average rate of exchange for the year. The balance sheets are translated into sterling at the closing rate of exchange, and the difference arising from the translation of the opening net assets and financial results for the year at the closing rate is taken directly to reserves.
(d) Revenue
Revenue is measured at the fair value of the consideration received or receivable for goods and services provided, net of trade discounts, value added and similar sales-based taxes, after eliminating revenue within the Group.
Revenue is recognised as follows:
• Construction contracts - by reference to services performed to date as a percentage of total services to be performed (see note 1(e))
• Service contracts – the value of work carried out during the year as services are provided, including amounts not invoiced
• Equipment sales – at the time of delivery
• Equipment hire – on a straight-line basis over the hire period in accordance with contractual arrangements
(e) Contract accounting
Where the outcome of a contract can be estimated reliably, revenue and costs are recognised by reference to the stage of completion of the contract activity at the balance sheet date (determined by surveys of work performed by quantity surveyors in conjunction with clients). Where the outcome of a contract cannot be estimated reliably, revenue is only recognised to the extent that it is probable that it will be recoverable. Profit is only recognised on a construction contract when the final outcome can be assessed with reasonable certainty. Expected losses are recognised immediately.

117INTERSERVE ANNUAL REPORT 2014 FINANCIAL STATEMENTS NOTES TO ThE CONSOLIdATEd FINANCIAL STATEMENTS
OVERVIEW
GO
VERNA
NCE
FINA
NCIA
L STATEMEN
TS STRATEG
IC REPORT
(f) Other intangible assets
Intangible assets acquired as part of an acquisition of a business are stated at fair value less accumulated amortisation and any impairment losses, provided that the fair value can be measured reliably on initial recognition.
Operating software acquired as part of a related item of hardware is capitalised within property, plant and equipment along with the hardware acquired. Other software licences acquired are capitalised, along with the cost to bring the software into use, within intangible assets.
Other intangible assets are amortised over their useful economic lives on a straight-line basis, typically between three and ten years.
(g) Property, plant and equipment
(i) Owned property, plant and equipment - tangible fixed assets are carried at historical cost less any accumulated depreciation and any impairment losses. Properties in the course of construction are carried at cost less any recognised impairment loss. Depreciation is charged so as to write off the cost of assets over their expected useful lives.
Depreciation is provided on a straight-line or reducing-balance basis at rates ranging between:
Straight line Reducing balance Freehold land Nil – Freehold buildings 2% to 7% – Leasehold property over the period of the lease – Plant and equipment 10% to 50% 11.5% to 38%
(ii) Property, plant and equipment held under finance leases are capitalised and depreciated over their expected useful lives. The finance charges are allocated over the primary period of the lease in proportion to the capital element outstanding.
(h) Impairment of tangible and other intangible assets
The Group reviews, at least annually, the carrying amounts of its tangible and intangible assets compared to their recoverable amounts to determine whether those assets have suffered an impairment loss (see note 13). Where an impairment loss subsequently reverses, the carrying amount of the asset is increased to the revised estimate of its recoverable amount, but so that the increased carrying amount does not exceed the carrying amount that would have been determined had no impairment loss been recognised for the asset in prior years.
(i) Investments
Investments are held at fair value at the balance sheet date. Investments are financial assets and are classified as fair value through the profit or loss. Gains or losses arising from the changes in fair value are included in the income statement in the period in which they arise.
(j) Inventories
Inventories are stated at the lower of cost and net realisable value. The cost of inventories is calculated using the weighted average method. Net realisable value represents the estimated selling price less all estimated costs of completion and costs to be incurred in marketing, selling and distribution.
(k) Borrowing costs
Project-specific finance costs are capitalised until the asset becomes operational. All other borrowing costs are recognised in the income statement using the effective interest method.
(l) PFI bid costs and other pre-contract costs
In the case of PFI bid costs, on financial close of the project the Group recovers bid costs by charging a fee to the relevant project company. If the fee exceeds the amount held by the Group as an asset, the excess is credited to the balance sheet as deferred income and is released to the income statement over the construction and early start-up period. If the agreed fee is less than the amount held by the Group as an asset, the loss is recognised as soon as it is anticipated.
Other pre-contract costs are recognised as expenses as incurred, except that directly attributable costs are recognised as an asset when it is virtually certain that a contract will be obtained and the contract is expected to result in future net cash inflows. Virtual certainty of a contract award is a subjective assessment, but normally arises on appointment as preferred bidder or notification from the prospective customer of their intent to appoint Interserve.
Notes to the consolidated financial statements continued
118 INTERSERVE ANNUAL REPORT 2014 FINANCIAL STATEMENTS NOTES TO ThE CONSOLIdATEd FINANCIAL STATEMENTS
1. Basis of preparation and accounting policies continued
(m) Leases
Leases are classified as finance leases whenever the terms of the lease transfer substantially all risks and rewards of ownership to the lessee. All other leases are classified as operating leases.
Finance leases are capitalised at the inception of the lease at the fair value of the leased property or, if lower, at the present value of the minimum lease payments. Lease payments are apportioned between the finance charges and the reduction of the lease liability so as to achieve a constant rate of interest on the remaining balance of the liability. Finance charges are reflected in the income statement.
Operating lease payments are recognised as an expense in the income statement on a straight-line basis over the lease term.
(n) Provisions
Provisions are recognised when the Group has a present obligation (legal or constructive) as a result of a past event, it is probable that an outflow of resources embodying economic benefits will be required to settle the obligation and a reliable estimate can be made of the amount of the obligation. The expense relating to any provision is presented in the income statement net of any reimbursement. If the effect of the time value of money is material, provisions are discounted using an appropriate rate that takes into account the risks specific to the liability. Where discounting is used, the increase in the provision due to the passage of time is recognised as a finance cost.
(o) Financial instruments
Trade receivablesTrade receivables are initially measured at fair value. Appropriate allowances for estimated irrecoverable amounts are recognised in the income statement where there is objective evidence that the asset is impaired. Trade receivables are financial assets and classified as loans and receivables.
Cash and depositsCash and deposits comprise cash on hand and demand deposits and other short-term, highly liquid investments that are readily convertible to a known amount of cash and are subject to an insignificant risk of changes in value. Cash and deposits are financial assets and are classified as loans and receivables.
BorrowingsInterest-bearing bank loans and overdrafts are recorded at the proceeds received, net of direct issue costs. Finance charges, including premiums payable on settlement or redemption and direct issue costs, are accounted for on an accruals basis in the income statement and are added to the carrying amount of the instrument to the extent that they are not settled in the period in which they arise. Borrowings are measured at amortised cost.
Trade payablesTrade payables are other financial liabilities initially measured at fair value and subsequently measured at amortised cost using the effective interest rate method.
Equity instrumentsEquity instruments issued by the Company are recorded at the proceeds received, net of direct issue costs.
derivative financial instruments and hedge accountingFinancial assets and financial liabilities are recognised on the Group’s balance sheet when the Group becomes a party to the contractual provisions of the instrument.
Transactions in derivative financial instruments are for risk management purposes only. The Group uses derivative financial instruments to hedge its exposure to interest rate and foreign currency risk. To the extent that such instruments are matched to underlying assets or liabilities, they are accounted for using hedge accounting.
Derivatives are initially recognised at fair value at the date a derivative contract is taken out and subsequently remeasured at fair value at each balance sheet date. Changes in fair value of derivative instruments that are designated as, and effective as, hedges of future cash flows and net investments are recognised directly in the other comprehensive income statement. Any ineffective portion is recognised immediately in the income statement.
Amounts deferred in equity are recycled through the income statement in the same period in which the underlying hedged item is recognised in the income statement. However, when the transaction that is being hedged results in a non-financial asset or non-financial liability, the gains and losses previously accumulated in equity are transferred from equity and included in the initial measurement of the cost of that asset or liability. Hedge accounting is discontinued when the hedging instrument expires or is sold, terminated, or exercised, or no longer qualifies for hedge accounting. Any cumulative gain or loss on the hedging instrument recognised in equity at that time is retained in equity until the forecast transaction occurs. If a hedged transaction is no longer expected to occur, any cumulative gain or loss recognised in equity is transferred to the income statement for the period.

119INTERSERVE ANNUAL REPORT 2014 FINANCIAL STATEMENTS NOTES TO ThE CONSOLIdATEd FINANCIAL STATEMENTS
OVERVIEW
GO
VERNA
NCE
FINA
NCIA
L STATEMEN
TS STRATEG
IC REPORT
Changes in fair value of derivative instruments that do not qualify for hedge accounting, or have not been designated as hedges, are recognised in the income statement as they arise. These derivative instruments are designated as fair value through the profit or loss (FVTPL).
Derivatives embedded in other financial instruments or other host contracts are treated as separate derivatives when their economic risks and characteristics are not closely related to those of the host contracts and the host contracts are not carried at fair value.
(p) Share-based payments
The Group has applied the requirements of IFRS 2 Share-based payment.
The Group issues share-based payments to certain employees. The fair value determined at the grant date is expensed on a straight-line basis over the vesting period, based on the Group’s estimate of shares that will eventually vest. Fair value is measured by use of an appropriate valuation model. The Black-Scholes option pricing model has been used to value the share option plans and the Sharesave Scheme. A stochastic model has been used to value the Performance Share Plan.
(q) PFI projects
Treatment on consolidationThe Group’s investments in PFI jointly-controlled entities (“Joint ventures - PFI Investments”) are accounted for under the equity method.
Treatment in the underlying joint-venture entityThe joint-venture entities have determined the appropriate treatment of the principal assets of, and income streams from, PFI and similar contracts. The balance of risks and rewards derived from the underlying assets is not borne by the entities, and therefore the asset provided is accounted for as a financial asset and is classified as available-for-sale.
Income is recognised on PFI projects both as operating revenue and interest income: a proportion of total cash receivable is allocated to operating revenue by means of a margin on service costs taking account of operational risks, and interest income on the financial asset is recognised in the income statement using the effective interest method. The residual element is allocated to the amortisation of the financial asset.
The fair value of the financial asset is measured at each balance sheet date by computing the discounted future value of the cash flow allocated to the financial asset. Discount rates are determined using long-term interest rates, subject to a floor, plus risk factors specific to individual projects.
Gains and losses arising from changes in the fair value of available-for-sale financial assets are recognised directly in equity until the asset is disposed of or is determined to be impaired, at which time the cumulative gain or loss previously recognised in equity is included in the income statement for the period.
(r) Pensions
The Group has both defined benefit and defined contribution pension schemes for the benefit of permanent members of staff. For the defined benefit schemes the cost of providing benefits is determined using the projected unit credit method, with actuarial valuations being carried out at each balance sheet date.
Actuarial gains and losses are recognised in full in the period in which they occur. They are recognised directly in equity and presented in the statement of recognised income and expense.
For defined contribution schemes, the amount recognised in the income statement is equal to the contributions payable to the schemes during the year.
(s) Taxation
Current tax is provided at amounts expected to be paid (or recovered) using the tax rates and laws that have been enacted or substantively enacted by the balance sheet date. Deferred tax assets and liabilities are calculated at the rates at which they are likely to reverse in the tax jurisdiction to which they relate.
Deferred tax is provided in full on temporary differences which arise between the carrying value of an asset or liability and its tax base. Deferred tax assets are recognised to the extent that it is probable that there will be sufficient profits in the future to enable the assets to be utilised and reviewed at least annually. Deferred tax liabilities are normally recognised for all taxable temporary differences. Deferred tax assets and liabilities are not discounted.
Deferred tax is charged/credited to the income statement except to the extent that the underlying asset or liability is credited/charged to equity in which case the deferred tax follows that treatment to equity.
Deferred tax assets and liabilities are offset when there is a legally enforceable right to set off current tax assets against current tax liabilities and when they relate to income taxes levied by the same taxation authority and the Group intends to settle its current tax assets and liabilities on a net basis.

Notes to the consolidated financial statements continued
120 INTERSERVE ANNUAL REPORT 2014 FINANCIAL STATEMENTS NOTES TO ThE CONSOLIdATEd FINANCIAL STATEMENTS
1. Basis of preparation and accounting policies continued
(t) Exceptional items
Exceptional items are those that the Group consider to be non-recurring and significant in size or in nature. Exceptional items include: profit on disposals of PFI investments and related costs; and transaction and integration costs relating to the acquisition of businesses.
(u) Assets classified as held for sale
Assets (and disposal groups) classified as held for sale are measured at the lower of carrying amount and fair value less costs to sell.
Assets and disposal groups are classified as held for sale if their carrying amount will be recovered through a sale transaction rather than continuing for use. This condition is regarded as met only when the sale is highly probable and the asset (or disposal group) is available for immediate sale in its present condition. Management must be committed to the sale which should be expected to qualify for recognition as a completed sale within one year from the date of classification.
2. Revenue
An analysis of the Group’s revenue for the year is as follows:
Revenue including share of associates and joint
ventures Consolidated revenue
2014 £million
2013 £million
2014 £million
2013 £million
Continuing operations
Provision of services 1,913.3 1,395.3 1,758.8 1,248.8
Revenue from construction contracts 1,176.3 1,002.2 938.5 759.4
Equipment sales and leasing income 215.7 184.4 215.7 184.4
3,305.3 2,581.9 2,913.0 2,192.6
3. Business and geographical segments
(a) Business segments
The Group is organised into four operating divisions, as set out below. Information reported to the Executive Board for the purposes of resource allocation and assessment of segment performance is based on the products and services provided.
– Support Services: provision of outsourced support services to public- and private-sector clients, both in the UK and internationally.
– Construction: design, construction and maintenance of buildings and infrastructure, both in the UK and internationally.
– Equipment Services: design, hire and sale of formwork, falsework and associated access equipment.
– Investments: transaction structuring, and management of, the Group’s project finance activities. Investments’ segmental figures represent the Group’s share of the associated special-purpose companies.
Costs of central services, including those relating to managing our PFI investments and central bidding activities, are shown in “Group Services”.

121INTERSERVE ANNUAL REPORT 2014 FINANCIAL STATEMENTS NOTES TO ThE CONSOLIdATEd FINANCIAL STATEMENTS
OVERVIEW
GO
VERNA
NCE
FINA
NCIA
L STATEMEN
TS STRATEG
IC REPORT
Revenue including share of associates and joint
ventures Consolidated revenue Result
2014 £million
2013 £million
2014 £million
2013 £million
2014 £million
2013 £million
Support Services - UK 1,786.0 1,292.5 1,679.9 1,196.6 81.4 56.0
Support Services - International 157.2 100.5 117.5 57.5 7.4 4.1
Support Services 1,943.2 1,393.0 1,797.4 1,254.1 88.8 60.1
Construction - UK 970.7 802.2 970.7 802.2 15.4 14.7
Construction – International 207.9 215.9 – – 10.8 13.1
Construction 1,178.6 1,018.1 970.7 802.2 26.2 27.8
Equipment Services 195.5 169.6 195.5 169.6 26.6 20.1
Investments 38.6 34.5 – – 0.8 0.8
Group Services 8.1 7.1 8.1 7.1 (25.2) (22.1)
Inter-segment elimination (58.7) (40.4) (58.7) (40.4) – –
3,305.3 2,581.9 2,913.0 2,192.6 117.2 86.7
Amortisation of acquired intangible assets (24.5) (8.9)
Exceptional items (note 5) (19.8) (4.1)
Total operating profit 72.9 73.7
Investment revenue 5.0 3.6
Finance costs (16.0) (9.2)
Profit before tax 61.9 68.1
Tax (12.0) (13.1)
Profit for the year 49.9 55.0
Segment assets Segment liabilities Net assets/(liabilities)
2014 £million
2013 £million
2014 £million
2013 £million
2014 £million
2013 £million
Support Services - UK 392.6 252.7 (339.9) (242.2) 52.7 10.5
Support Services - International 89.2 71.6 (26.6) (20.7) 62.6 50.9
Support Services 481.8 324.3 (366.5) (262.9) 115.3 61.4
Construction - UK 214.7 172.0 (321.9) (302.5) (107.2) (130.5)
Construction - International 50.8 48.7 - - 50.8 48.7
Construction 265.5 220.7 (321.9) (302.5) (56.4) (81.8)
Equipment Services 237.4 188.9 (47.3) (37.2) 190.1 151.7
Investments 42.7 20.6 - - 42.7 20.6
1,027.4 754.5 (735.7) (602.6) 291.7 151.9
Group Services, goodwill and acquired intangible assets 537.2 316.6 (92.0) (69.5) 445.2 247.1
1,564.6 1,071.1 (827.7) (672.1) 736.9 399.0
Net debt (268.9) (38.6)
Net assets (excluding non-controlling interests) 468.0 360.4
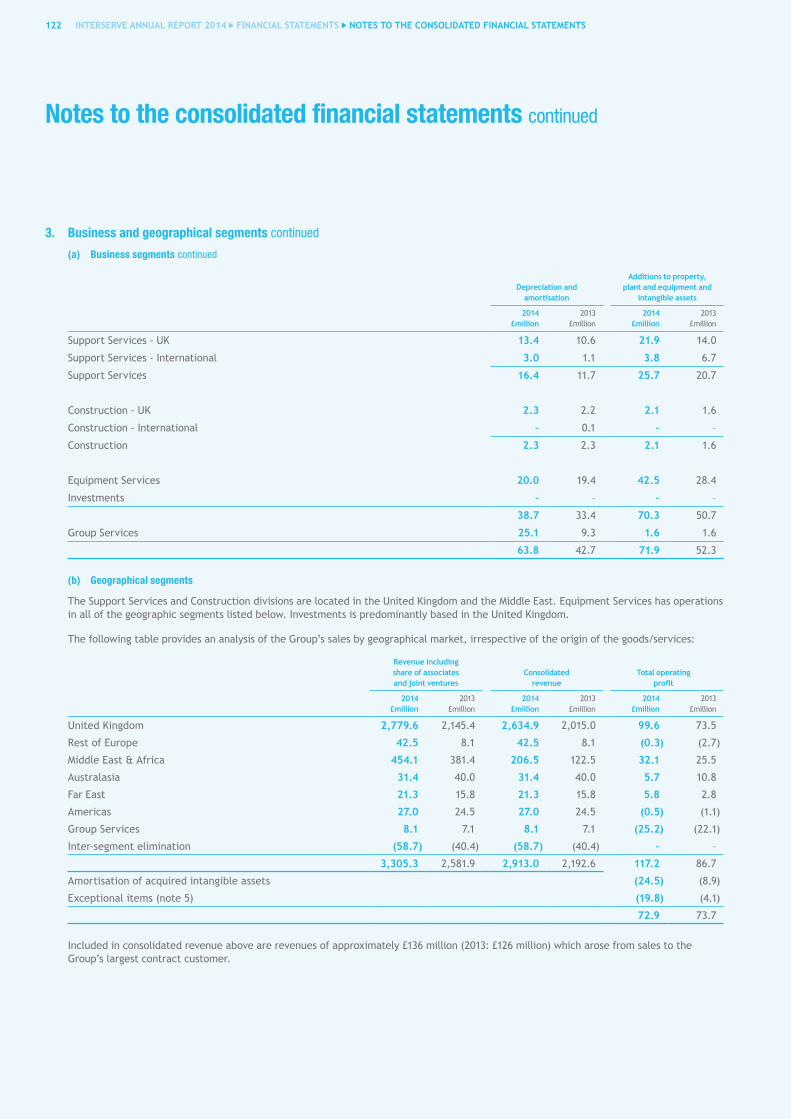
122 INTERSERVE ANNUAL REPORT 2014 FINANCIAL STATEMENTS NOTES TO ThE CONSOLIdATEd FINANCIAL STATEMENTS
3. Business and geographical segments continued
(a) Business segments continued
Notes to the consolidated financial statements continued
depreciation and amortisation
Additions to property, plant and equipment and
intangible assets
2014 £million
2013 £million
2014 £million
2013 £million
Support Services - UK 13.4 10.6 21.9 14.0
Support Services - International 3.0 1.1 3.8 6.7
Support Services 16.4 11.7 25.7 20.7
Construction - UK 2.3 2.2 2.1 1.6
Construction - International – 0.1 – –
Construction 2.3 2.3 2.1 1.6
Equipment Services 20.0 19.4 42.5 28.4
Investments – – – –
38.7 33.4 70.3 50.7
Group Services 25.1 9.3 1.6 1.6
63.8 42.7 71.9 52.3
(b) Geographical segments
The Support Services and Construction divisions are located in the United Kingdom and the Middle East. Equipment Services has operations in all of the geographic segments listed below. Investments is predominantly based in the United Kingdom.
The following table provides an analysis of the Group’s sales by geographical market, irrespective of the origin of the goods/services:
Revenue including share of associates and joint ventures
Consolidated revenue
Total operating profit
2014 £million
2013 £million
2014 £million
2013 £million
2014 £million
2013 £million
United Kingdom 2,779.6 2,145.4 2,634.9 2,015.0 99.6 73.5
Rest of Europe 42.5 8.1 42.5 8.1 (0.3) (2.7)
Middle East & Africa 454.1 381.4 206.5 122.5 32.1 25.5
Australasia 31.4 40.0 31.4 40.0 5.7 10.8
Far East 21.3 15.8 21.3 15.8 5.8 2.8
Americas 27.0 24.5 27.0 24.5 (0.5) (1.1)
Group Services 8.1 7.1 8.1 7.1 (25.2) (22.1)
Inter-segment elimination (58.7) (40.4) (58.7) (40.4) – –
3,305.3 2,581.9 2,913.0 2,192.6 117.2 86.7
Amortisation of acquired intangible assets (24.5) (8.9)
Exceptional items (note 5) (19.8) (4.1)
72.9 73.7
Included in consolidated revenue above are revenues of approximately £136 million (2013: £126 million) which arose from sales to the Group’s largest contract customer.
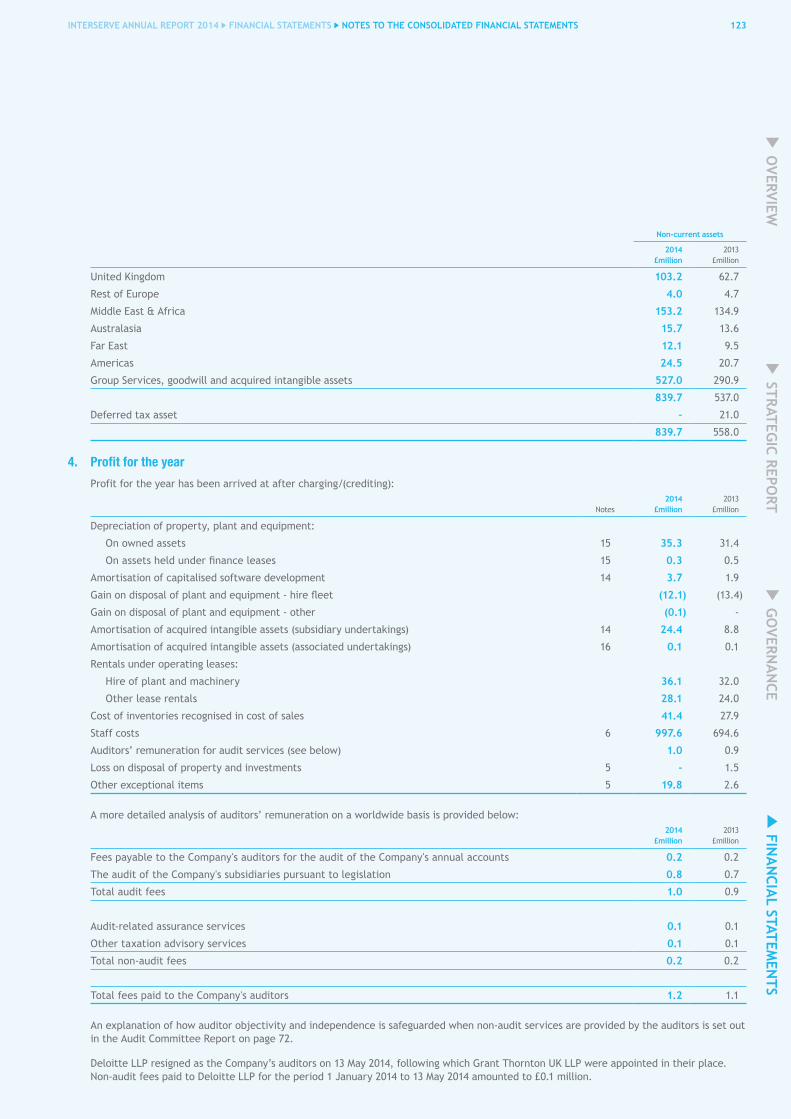
123INTERSERVE ANNUAL REPORT 2014 FINANCIAL STATEMENTS NOTES TO ThE CONSOLIdATEd FINANCIAL STATEMENTS
OVERVIEW
GO
VERNA
NCE
FINA
NCIA
L STATEMEN
TS STRATEG
IC REPORT
Non-current assets
2014 £million
2013 £million
United Kingdom 103.2 62.7
Rest of Europe 4.0 4.7
Middle East & Africa 153.2 134.9
Australasia 15.7 13.6
Far East 12.1 9.5
Americas 24.5 20.7
Group Services, goodwill and acquired intangible assets 527.0 290.9
839.7 537.0
Deferred tax asset – 21.0
839.7 558.0
4. Profit for the year
Profit for the year has been arrived at after charging/(crediting):
Notes2014
£million2013
£million
Depreciation of property, plant and equipment:
On owned assets 15 35.3 31.4
On assets held under finance leases 15 0.3 0.5
Amortisation of capitalised software development 14 3.7 1.9
Gain on disposal of plant and equipment - hire fleet (12.1) (13.4)
Gain on disposal of plant and equipment - other (0.1) -
Amortisation of acquired intangible assets (subsidiary undertakings) 14 24.4 8.8
Amortisation of acquired intangible assets (associated undertakings) 16 0.1 0.1
Rentals under operating leases:
Hire of plant and machinery 36.1 32.0
Other lease rentals 28.1 24.0
Cost of inventories recognised in cost of sales 41.4 27.9
Staff costs 6 997.6 694.6
Auditors’ remuneration for audit services (see below) 1.0 0.9
Loss on disposal of property and investments 5 - 1.5
Other exceptional items 5 19.8 2.6
A more detailed analysis of auditors’ remuneration on a worldwide basis is provided below:2014
£million2013
£million
Fees payable to the Company's auditors for the audit of the Company's annual accounts 0.2 0.2
The audit of the Company's subsidiaries pursuant to legislation 0.8 0.7
Total audit fees 1.0 0.9
Audit-related assurance services 0.1 0.1
Other taxation advisory services 0.1 0.1
Total non-audit fees 0.2 0.2
Total fees paid to the Company's auditors 1.2 1.1
An explanation of how auditor objectivity and independence is safeguarded when non-audit services are provided by the auditors is set out in the Audit Committee Report on page 72.
Deloitte LLP resigned as the Company’s auditors on 13 May 2014, following which Grant Thornton UK LLP were appointed in their place. Non-audit fees paid to Deloitte LLP for the period 1 January 2014 to 13 May 2014 amounted to £0.1 million.

Notes to the consolidated financial statements continued
124 INTERSERVE ANNUAL REPORT 2014 FINANCIAL STATEMENTS NOTES TO ThE CONSOLIdATEd FINANCIAL STATEMENTS
5. Exceptional items2014
£million2013
£million
Agreed valuation of transfer to pension scheme – 55.0
Transaction costs – (0.2)
Disposals – (51.2)
Profit on disposal of PFI assets – 3.6
Write–down of investment in Indian associate company, SSPDL Interserve Private Limited – (5.1)
Loss on disposal of property and investments – (1.5)
Transaction costs on the acquisition of Initial Facilities and esg (8.2) –
Integration costs on the acquisition of Initial Facilities (10.2) –
Earnout arrangements on the acquisition of Paragon Management UK Ltd (1.4) (0.5)
Bonus and share–based payments triggered by the exceptional profits on the disposals of PFI investments above – (2.1)
Other exceptional items (19.8) (2.6)
Exceptional items (19.8) (4.1)
6. Staff costs
The average number of full-time equivalent employees within each division during the year, including executive directors, was:
2014 Number
2013 Number
Support Services 37,040 21,511
Construction 2,488 2,463
Equipment Services 1,321 1,191
Group Services 242 218
41,091 25,383
Their aggregate remuneration comprised:2014
£million2013
£million
Wages and salaries 892.7 615.4
Social security costs 74.8 47.9
Share-based payments 3.4 7.8
Other pension costs (see below) 26.7 23.5
997.6 694.6
Defined benefit scheme current service costs (note 30) 8.0 7.4
Other UK - defined contribution 17.6 14.9
Other overseas - defined contribution 1.1 1.2
Pension costs 26.7 23.5
Detailed disclosures of directors’ aggregate and individual remuneration and share-based payments are given in the audited section of the Directors’ Remuneration Report on pages 90 to 101 and should be regarded as an integral part of this note.
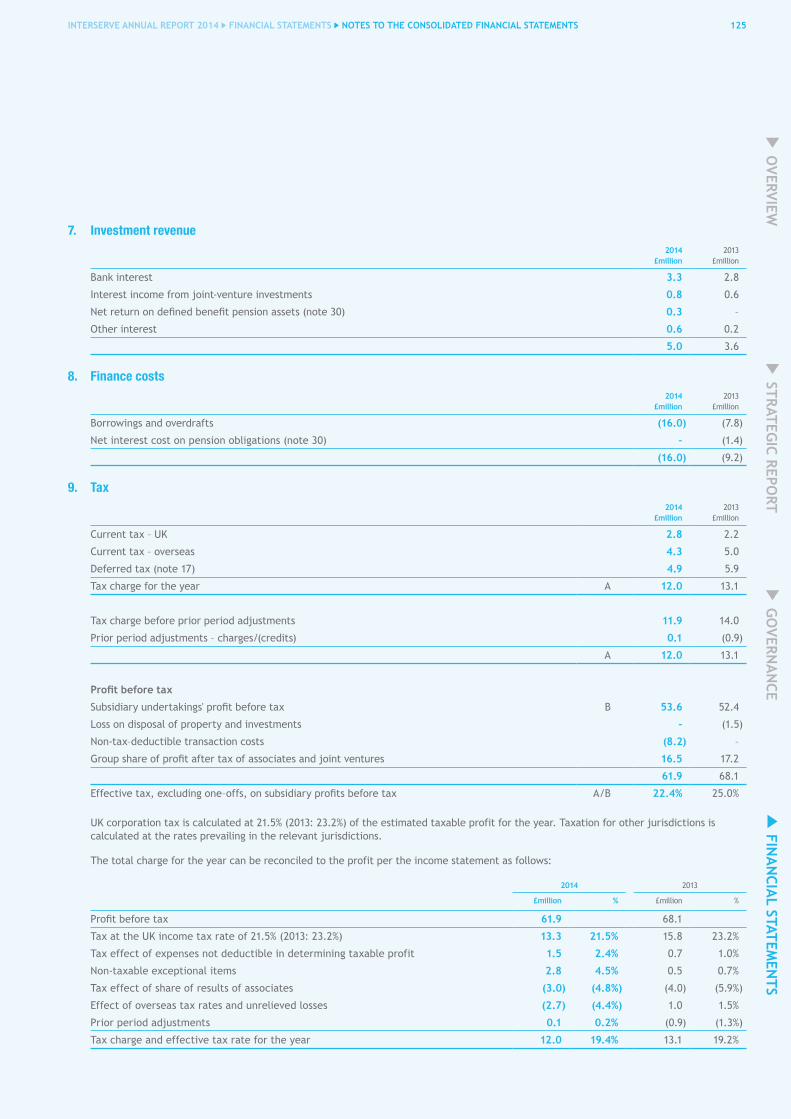
125INTERSERVE ANNUAL REPORT 2014 FINANCIAL STATEMENTS NOTES TO ThE CONSOLIdATEd FINANCIAL STATEMENTS
OVERVIEW
GO
VERNA
NCE
FINA
NCIA
L STATEMEN
TS STRATEG
IC REPORT
7. Investment revenue2014
£million2013
£million
Bank interest 3.3 2.8
Interest income from joint-venture investments 0.8 0.6
Net return on defined benefit pension assets (note 30) 0.3 –
Other interest 0.6 0.2
5.0 3.6
8. Finance costs2014
£million2013
£million
Borrowings and overdrafts (16.0) (7.8)
Net interest cost on pension obligations (note 30) – (1.4)
(16.0) (9.2)
9. Tax2014
£million2013
£million
Current tax – UK 2.8 2.2
Current tax – overseas 4.3 5.0
Deferred tax (note 17) 4.9 5.9
Tax charge for the year A 12.0 13.1
Tax charge before prior period adjustments 11.9 14.0
Prior period adjustments – charges/(credits) 0.1 (0.9)
A 12.0 13.1
Profit before tax
Subsidiary undertakings' profit before tax B 53.6 52.4
Loss on disposal of property and investments – (1.5)
Non-tax–deductible transaction costs (8.2) –
Group share of profit after tax of associates and joint ventures 16.5 17.2
61.9 68.1
Effective tax, excluding one–offs, on subsidiary profits before tax A/B 22.4% 25.0%
UK corporation tax is calculated at 21.5% (2013: 23.2%) of the estimated taxable profit for the year. Taxation for other jurisdictions is calculated at the rates prevailing in the relevant jurisdictions.
The total charge for the year can be reconciled to the profit per the income statement as follows:
2014 2013
£million % £million %
Profit before tax 61.9 68.1
Tax at the UK income tax rate of 21.5% (2013: 23.2%) 13.3 21.5% 15.8 23.2%
Tax effect of expenses not deductible in determining taxable profit 1.5 2.4% 0.7 1.0%
Non-taxable exceptional items 2.8 4.5% 0.5 0.7%
Tax effect of share of results of associates (3.0) (4.8%) (4.0) (5.9%)
Effect of overseas tax rates and unrelieved losses (2.7) (4.4%) 1.0 1.5%
Prior period adjustments 0.1 0.2% (0.9) (1.3%)
Tax charge and effective tax rate for the year 12.0 19.4% 13.1 19.2%

Notes to the consolidated financial statements continued
126 INTERSERVE ANNUAL REPORT 2014 FINANCIAL STATEMENTS NOTES TO ThE CONSOLIdATEd FINANCIAL STATEMENTS
9. Tax continued
In addition to the income tax charged to the income statement, the following deferred tax charges/(credits) have been recorded directly to equity in the year:
2014 £million
2013 £million
Tax on actuarial losses/gains on pension liability (3.1) 4.3
Impact of change in corporation tax rate on pension liability – 3.0
Tax on fair value adjustment on cash flow hedging instruments – 0.2
Tax on the intrinsic value of share–based payments 2.0 (1.5)
Total (1.1) 6.0
10. Dividendsdividend per share
pence2014
£million2013
£million
Final dividend for the year ended 31 December 2012 14.1 – 17.6
Interim dividend for the year ended 31 December 2013 6.8 – 8.6
Final dividend for the year ended 31 December 2013 14.7 20.8 –
Interim dividend for the year ended 31 December 2014 7.5 10.7 –
Amount recognised as distribution to equity holders in the period 31.5 26.2
Proposed final dividend for the year ended 31 December 2014 15.5 22.3
The proposed final dividend is subject to approval by shareholders at the Annual General Meeting and has not been included as a liability in these financial statements.
11. Earnings per share
Calculation of earnings per share is based on the following data:
Earnings2014
£million2013
£million
Net profit attributable to equity holders of the parent (for basic and diluted basic earnings per share) 45.4 50.2
Adjustments:
Exceptional items 19.8 4.1
Amortisation of acquired intangible assets 24.5 8.9
Tax effect of above adjustments (6.7) (1.9)
Headline earnings (for headline and diluted headline earnings per share) 83.0 61.3
Number of shares2014
Number2013
Number
Weighted average number of ordinary shares for the purposes of basic and headline earnings per share 141,136,892 128,386,396
Effect of dilutive potential ordinary shares:
Share options and awards 2,109,620 3,154,762
Weighted average number of ordinary shares for the purposes of diluted basic and diluted headline earnings per share 143,246,512 131,541,158

127INTERSERVE ANNUAL REPORT 2014 FINANCIAL STATEMENTS NOTES TO ThE CONSOLIdATEd FINANCIAL STATEMENTS
OVERVIEW
GO
VERNA
NCE
FINA
NCIA
L STATEMEN
TS STRATEG
IC REPORT
Earnings per share 2014
pence2013
pence
Basic earnings per share 32.2 39.1
Diluted basic earnings per share 31.7 38.2
Headline earnings per share 58.8 47.7
Diluted headline earnings per share 57.9 46.6
12. Acquisitions
The Group made the following acquisitions in the year:
On 18 March 2014 the Group acquired 100% of the facilities services business (“Initial Facilities”) of Rentokil Initial Plc, for a cash consideration of £245.7 million. The acquisition strengthens the Support Services offering of Interserve, allowing the provision of a significantly enhanced service offering. The enlarged business offers a full range of services across all contract sizes and to both public- and private-sector customers.
On 5 December 2014 the Group acquired 100% of the share capital of ESG Holdings Limited (“esg”) for a cash consideration of £25.7 million. The acquisition strengthens Interserve’s position within the UK and Saudi Arabian skills and training markets. It also provides an increased presence in the Welfare-to-Work market where we are already active via Interserve Working Futures and Rehab Jobfit.
Preliminary fair value exercises have been performed, as set out below:
Assets acquired
Initial Facilities £million
esg £million
Total £million
Property, plant and equipment 6.6 3.2 9.8
Intangible assets 87.8 19.1 106.9
Cash balances 25.3 4.5 29.8
Inventories 3.3 - 3.3
Trade and other receivables 107.7 5.2 112.9
Trade and other payables (96.8) (13.4) (110.2)
Other liabilities (28.5) (4.8) (33.3)
Net assets 105.4 13.8 119.2
Goodwill 140.3 11.9 152.2
Consideration 245.7 25.7 271.4
Net cash outflow on acquisitions 220.4 21.2 241.6
The fair value adjustments relate to certain intangible assets and their associated deferred tax charge. These have been separately identified and recognised using appropriate valuation techniques based on the fair value of forecast future cash flows. The resultant goodwill from the acquisition represents the future economic benefits arising from assets that are not capable of being individually identified and separately recognised (for example the knowledge and expertise of the assembled workforce and the operating synergies that arise from the Group’s strengthened market position). None of the goodwill is expected to be deductible for income tax purposes.
Acquisition-related costs, included in exceptional costs, amounted to £8.2 million (see note 5).
Since acquisition on 18 March 2014, Initial Facilities has contributed £440.4 million to revenue and a £7.9 million loss after exceptional items. If the business had been acquired on 1 January 2014, it would have contributed revenues of £555.3 million and a loss after exceptional items of £5.6 million.
Since acquisition on 5 December 2014, esg has contributed £3.4 million in revenue and a £0.3 million loss after exceptional items. If the business had been acquired on 1 January 2014, it would have contributed revenues of £41.2 million and a loss after exceptional items of £3.3 million.
A further £2.1 million of cash was paid in the period relating to the 2013 acquisition of Adyard.
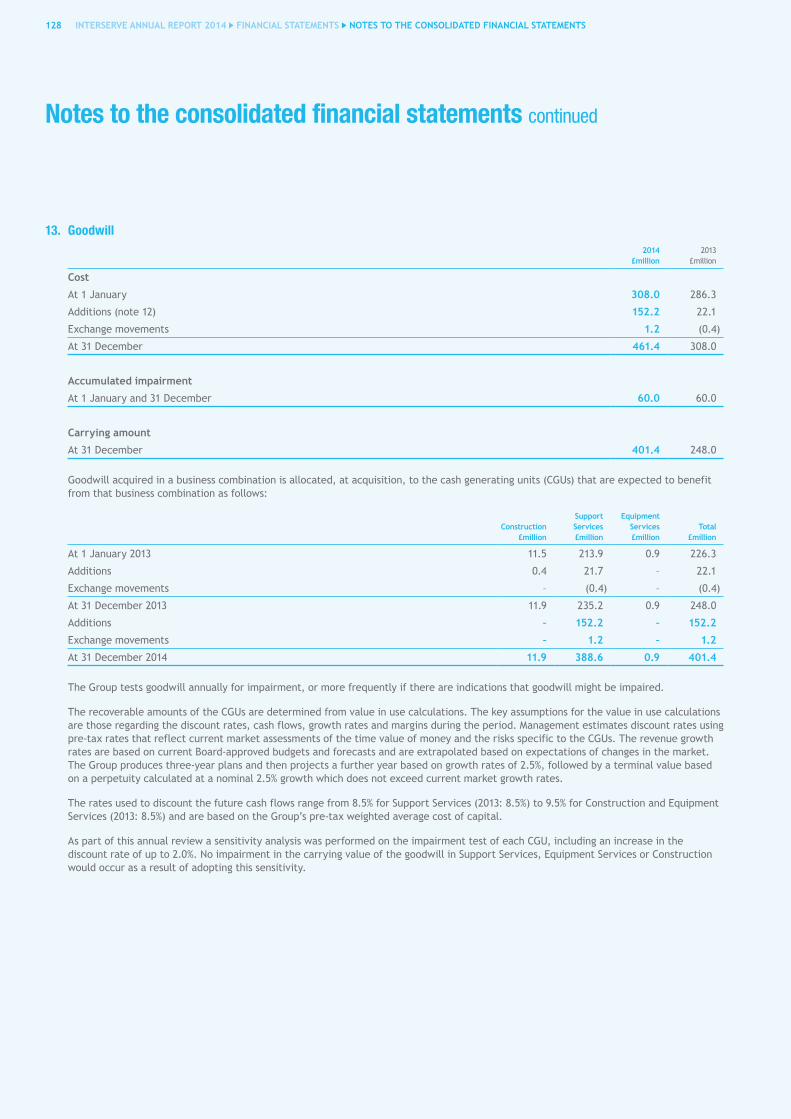
Notes to the consolidated financial statements continued
128 INTERSERVE ANNUAL REPORT 2014 FINANCIAL STATEMENTS NOTES TO ThE CONSOLIdATEd FINANCIAL STATEMENTS
13. Goodwill 2014
£million2013
£million
Cost
At 1 January 308.0 286.3
Additions (note 12) 152.2 22.1
Exchange movements 1.2 (0.4)
At 31 December 461.4 308.0
Accumulated impairment
At 1 January and 31 December 60.0 60.0
Carrying amount
At 31 December 401.4 248.0
Goodwill acquired in a business combination is allocated, at acquisition, to the cash generating units (CGUs) that are expected to benefit from that business combination as follows:
Construction £million
Support Services £million
Equipment Services £million
Total £million
At 1 January 2013 11.5 213.9 0.9 226.3
Additions 0.4 21.7 – 22.1
Exchange movements – (0.4) – (0.4)
At 31 December 2013 11.9 235.2 0.9 248.0
Additions – 152.2 – 152.2
Exchange movements – 1.2 – 1.2
At 31 December 2014 11.9 388.6 0.9 401.4
The Group tests goodwill annually for impairment, or more frequently if there are indications that goodwill might be impaired.
The recoverable amounts of the CGUs are determined from value in use calculations. The key assumptions for the value in use calculations are those regarding the discount rates, cash flows, growth rates and margins during the period. Management estimates discount rates using pre-tax rates that reflect current market assessments of the time value of money and the risks specific to the CGUs. The revenue growth rates are based on current Board-approved budgets and forecasts and are extrapolated based on expectations of changes in the market. The Group produces three-year plans and then projects a further year based on growth rates of 2.5%, followed by a terminal value based on a perpetuity calculated at a nominal 2.5% growth which does not exceed current market growth rates.
The rates used to discount the future cash flows range from 8.5% for Support Services (2013: 8.5%) to 9.5% for Construction and Equipment Services (2013: 8.5%) and are based on the Group’s pre-tax weighted average cost of capital.
As part of this annual review a sensitivity analysis was performed on the impairment test of each CGU, including an increase in the discount rate of up to 2.0%. No impairment in the carrying value of the goodwill in Support Services, Equipment Services or Construction would occur as a result of adopting this sensitivity.

129INTERSERVE ANNUAL REPORT 2014 FINANCIAL STATEMENTS NOTES TO ThE CONSOLIdATEd FINANCIAL STATEMENTS
OVERVIEW
GO
VERNA
NCE
FINA
NCIA
L STATEMEN
TS STRATEG
IC REPORT
14. Other intangible assetsAcquired
Computer software £million
Customer relationships
£millionOther
£millionTotal
£million
Cost
At 1 January 2013 8.4 67.2 1.4 77.0
Acquisitions – 8.0 1.7 9.7
Additions 0.2 – – 0.2
Exchange movements – (0.2) (0.1) (0.3)
At 31 December 2013 8.6 75.0 3.0 86.6
Acquisitions (note 12) 1.3 105.6 – 106.9
Additions 5.3 – – 5.3
Exchange movements – 0.7 – 0.7
At 31 December 2014 15.2 181.3 3.0 199.5
Accumulated amortisation
At 1 January 2013 4.4 31.8 1.3 37.5
Charge for the year 1.9 8.6 0.2 10.7
Exchange movements – (0.2) – (0.2)
At 31 December 2013 6.3 40.2 1.5 48.0
Charge for the year 3.7 24.1 0.3 28.1
Exchange movements – 0.3 – 0.3
At 31 December 2014 10.0 64.6 1.8 76.4
Carrying amount
At 31 December 2014 5.2 116.7 1.2 123.1
At 31 December 2013 2.3 34.8 1.5 38.6
At 1 January 2013 4.0 35.4 0.1 39.5
Useful lives5
years5-10
years3-5
years
The useful life and amortisation period of each group of intangible assets varies according to the underlying length of benefit expected to be received.

Notes to the consolidated financial statements continued
130 INTERSERVE ANNUAL REPORT 2014 FINANCIAL STATEMENTS NOTES TO ThE CONSOLIdATEd FINANCIAL STATEMENTS
15. Property, plant and equipment
(a) Movements
Land and buildings£million
hire fleet
£million
Other plant and
equipment£million
Total£million
Cost
At 1 January 2013 18.3 224.8 75.0 318.1
Additions 2.4 29.8 19.9 52.1
Acquisition of subsidiaries 4.5 - 5.3 9.8
Disposals (0.5) (24.0) (5.9) (30.4)
Exchange differences (0.9) (10.7) (3.2) (14.8)
At 31 December 2013 23.8 219.9 91.1 334.8
Additions 1.6 47.0 18.0 66.6
Acquisition of subsidiaries 0.5 - 9.3 9.8
Disposals (0.4) (18.3) (6.5) (25.2)
Exchange differences 0.3 3.7 3.4 7.4
At 31 December 2014 25.8 252.3 115.3 393.4
Accumulated depreciation
At 1 January 2013 9.8 116.1 54.4 180.3
Charge for the year 1.2 18.4 12.3 31.9
Eliminated on disposals (0.4) (19.3) (5.4) (25.1)
Exchange differences (0.6) (5.0) (2.6) (8.2)
At 31 December 2013 10.0 110.2 58.7 178.9
Charge for the year 1.8 19.6 14.2 35.6
Eliminated on disposals (0.3) (13.6) (6.0) (19.9)
Exchange differences 0.3 0.5 2.7 3.5
At 31 December 2014 11.8 116.7 69.6 198.1
Carrying amount
At 31 December 2014 14.0 135.6 45.7 195.3
At 31 December 2013 13.8 109.7 32.4 155.9
At 1 January 2013 8.5 108.7 20.6 137.8
The carrying amount of the Group’s plant and equipment includes an amount of £0.8 million (2013: £1.0 million) in respect of assets held under finance leases. Details of property, plant and equipment held under finance leases are shown in note 25.
(b) Carrying amount of land and buildings
31 december 2014
£million
31 December 2013
£million
Freehold:
Land at cost 3.7 2.7
Buildings at cost less depreciation 5.6 6.4
9.3 9.1
Leaseholds under 50 years at cost less depreciation 4.7 4.7
Total 14.0 13.8
(c) Future capital expenditure not provided for in the financial statements
31 december 2014
£million
31 December 2013
£million
Committed 3.5 1.8
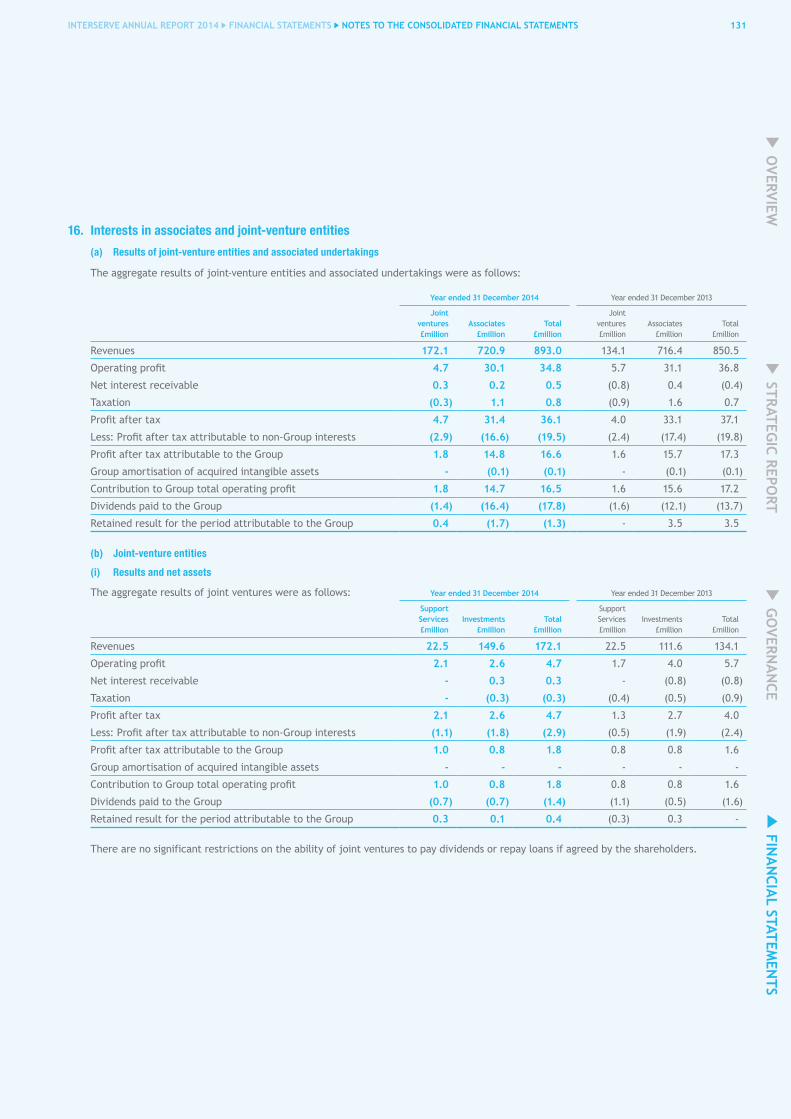
131INTERSERVE ANNUAL REPORT 2014 FINANCIAL STATEMENTS NOTES TO ThE CONSOLIdATEd FINANCIAL STATEMENTS
OVERVIEW
GO
VERNA
NCE
FINA
NCIA
L STATEMEN
TS STRATEG
IC REPORT
16. Interests in associates and joint-venture entities
(a) Results of joint-venture entities and associated undertakings
The aggregate results of joint-venture entities and associated undertakings were as follows:
Year ended 31 december 2014 Year ended 31 December 2013
Joint ventures£million
Associates£million
Total£million
Joint ventures£million
Associates£million
Total£million
Revenues 172.1 720.9 893.0 134.1 716.4 850.5
Operating profit 4.7 30.1 34.8 5.7 31.1 36.8
Net interest receivable 0.3 0.2 0.5 (0.8) 0.4 (0.4)
Taxation (0.3) 1.1 0.8 (0.9) 1.6 0.7
Profit after tax 4.7 31.4 36.1 4.0 33.1 37.1
Less: Profit after tax attributable to non-Group interests (2.9) (16.6) (19.5) (2.4) (17.4) (19.8)
Profit after tax attributable to the Group 1.8 14.8 16.6 1.6 15.7 17.3
Group amortisation of acquired intangible assets - (0.1) (0.1) - (0.1) (0.1)
Contribution to Group total operating profit 1.8 14.7 16.5 1.6 15.6 17.2
Dividends paid to the Group (1.4) (16.4) (17.8) (1.6) (12.1) (13.7)
Retained result for the period attributable to the Group 0.4 (1.7) (1.3) - 3.5 3.5
(b) Joint-venture entities
(i) Results and net assets
The aggregate results of joint ventures were as follows: Year ended 31 december 2014 Year ended 31 December 2013
Support Services£million
Investments£million
Total£million
Support Services£million
Investments£million
Total£million
Revenues 22.5 149.6 172.1 22.5 111.6 134.1
Operating profit 2.1 2.6 4.7 1.7 4.0 5.7
Net interest receivable - 0.3 0.3 - (0.8) (0.8)
Taxation - (0.3) (0.3) (0.4) (0.5) (0.9)
Profit after tax 2.1 2.6 4.7 1.3 2.7 4.0
Less: Profit after tax attributable to non-Group interests (1.1) (1.8) (2.9) (0.5) (1.9) (2.4)
Profit after tax attributable to the Group 1.0 0.8 1.8 0.8 0.8 1.6
Group amortisation of acquired intangible assets - - - - - -
Contribution to Group total operating profit 1.0 0.8 1.8 0.8 0.8 1.6
Dividends paid to the Group (0.7) (0.7) (1.4) (1.1) (0.5) (1.6)
Retained result for the period attributable to the Group 0.3 0.1 0.4 (0.3) 0.3 -
There are no significant restrictions on the ability of joint ventures to pay dividends or repay loans if agreed by the shareholders.
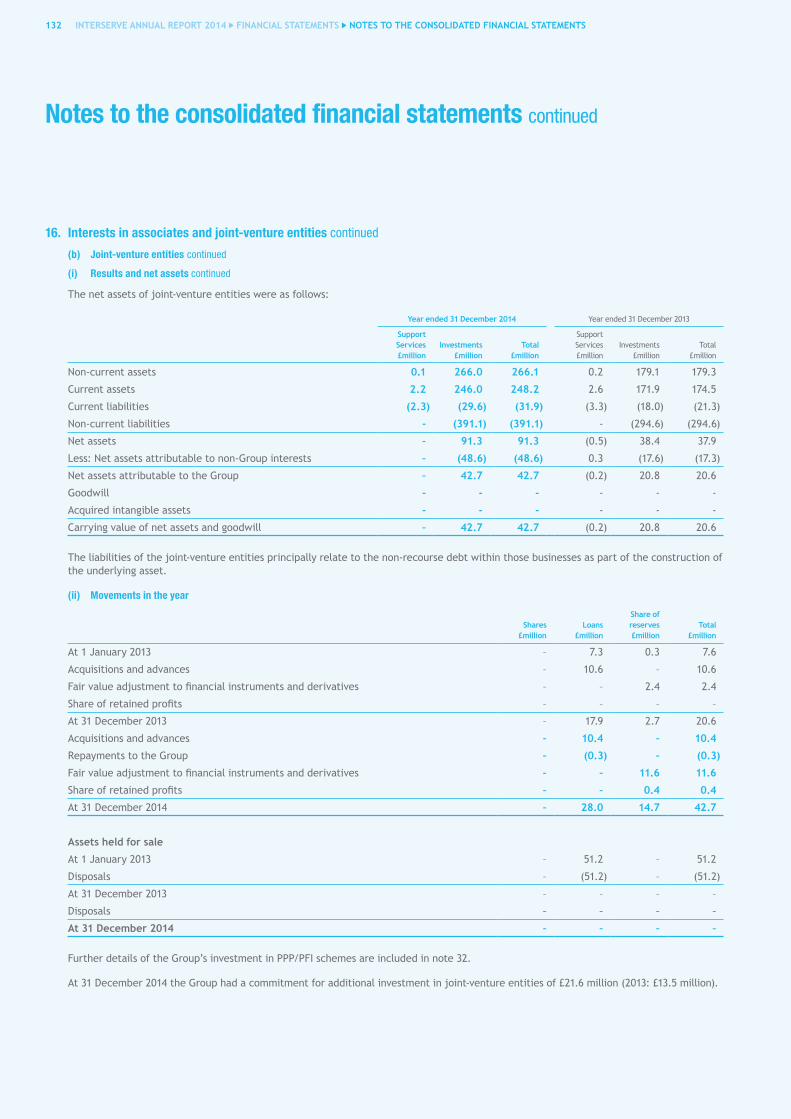
132 INTERSERVE ANNUAL REPORT 2014 FINANCIAL STATEMENTS NOTES TO ThE CONSOLIdATEd FINANCIAL STATEMENTS
16. Interests in associates and joint-venture entities continued
(b) Joint-venture entities continued
Notes to the consolidated financial statements continued
(i) Results and net assets continued
The net assets of joint-venture entities were as follows:
Year ended 31 december 2014 Year ended 31 December 2013
Support Services£million
Investments£million
Total£million
Support Services£million
Investments£million
Total£million
Non-current assets 0.1 266.0 266.1 0.2 179.1 179.3
Current assets 2.2 246.0 248.2 2.6 171.9 174.5
Current liabilities (2.3) (29.6) (31.9) (3.3) (18.0) (21.3)
Non-current liabilities - (391.1) (391.1) - (294.6) (294.6)
Net assets – 91.3 91.3 (0.5) 38.4 37.9
Less: Net assets attributable to non-Group interests – (48.6) (48.6) 0.3 (17.6) (17.3)
Net assets attributable to the Group – 42.7 42.7 (0.2) 20.8 20.6
Goodwill - - - - - -
Acquired intangible assets - - - - - -
Carrying value of net assets and goodwill – 42.7 42.7 (0.2) 20.8 20.6
The liabilities of the joint-venture entities principally relate to the non-recourse debt within those businesses as part of the construction of the underlying asset.
(ii) Movements in the year
Shares£million
Loans£million
Share of reserves£million
Total£million
At 1 January 2013 – 7.3 0.3 7.6
Acquisitions and advances – 10.6 – 10.6
Fair value adjustment to financial instruments and derivatives – – 2.4 2.4
Share of retained profits – – – –
At 31 December 2013 – 17.9 2.7 20.6
Acquisitions and advances – 10.4 – 10.4
Repayments to the Group – (0.3) – (0.3)
Fair value adjustment to financial instruments and derivatives – – 11.6 11.6
Share of retained profits – – 0.4 0.4
At 31 December 2014 – 28.0 14.7 42.7
Assets held for sale
At 1 January 2013 – 51.2 – 51.2
Disposals – (51.2) – (51.2)
At 31 December 2013 – – – –
Disposals – – – –
At 31 december 2014 – – – –
Further details of the Group’s investment in PPP/PFI schemes are included in note 32.
At 31 December 2014 the Group had a commitment for additional investment in joint-venture entities of £21.6 million (2013: £13.5 million).

133INTERSERVE ANNUAL REPORT 2014 FINANCIAL STATEMENTS NOTES TO ThE CONSOLIdATEd FINANCIAL STATEMENTS
OVERVIEW
GO
VERNA
NCE
FINA
NCIA
L STATEMEN
TS STRATEG
IC REPORT
(c) Associated undertakings
(i) Results and net assets
The aggregate results of the Group’s various associated undertakings were as follows:
Year ended 31 december 2014 Year ended 31 December 2013
Construction£million
Support Services£million
Total£million
Construction£million
Support Services£million
Total£million
Revenues 442.3 278.6 720.9 459.4 257.0 716.4
Operating profit 23.6 6.5 30.1 23.4 7.7 31.1
Net interest receivable 0.2 - 0.2 0.4 - 0.4
Taxation 2.1 (1.0) 1.1 2.6 (1.0) 1.6
Profit after tax 25.9 5.5 31.4 26.4 6.7 33.1
Less: Profit after tax attributable to non-Group interests (13.7) (2.9) (16.6) (14.0) (3.4) (17.4)
Profit after tax attributable to the Group 12.2 2.6 14.8 12.4 3.3 15.7
Group amortisation of acquired intangible assets - (0.1) (0.1) (0.1) - (0.1)
Contribution to Group total operating profit 12.2 2.5 14.7 12.3 3.3 15.6
Dividends paid to the Group (14.5) (1.9) (16.4) (9.4) (2.7) (12.1)
Retained result for the period attributable to the Group (2.3) 0.6 (1.7) 2.9 0.6 3.5
There are no significant restrictions on the ability of associates to pay dividends or repay loans if agreed by the shareholders.
Total net assets of the associated undertakings were as follows:
Year ended 31 december 2014 Year ended 31 December 2013
Construction£million
Support Services£million
Total£million
Construction£million
Support Services£million
Total£million
Non-current assets 34.5 27.1 61.6 37.7 26.5 64.2
Current assets 373.4 71.6 445.0 355.3 54.5 409.8
Current liabilities (259.1) (48.4) (307.5) (255.7) (34.8) (290.5)
Non-current liabilities (43.2) (3.7) (46.9) (36.2) (2.7) (38.9)
Net assets 105.6 46.6 152.2 101.1 43.5 144.6
Less: Net assets attributable to non-Group interests (56.0) (23.9) (79.9) (53.6) (22.1) (75.7)
Net assets attributable to the Group 49.6 22.7 72.3 47.5 21.4 68.9
Goodwill 1.2 3.5 4.7 1.2 3.5 4.7
Acquired intangible assets - 0.2 0.2 - 0.3 0.3
Carrying value of net assets and goodwill 50.8 26.4 77.2 48.7 25.2 73.9
(ii) Movements in the year
Shares£million
Loans£million
Share of reserves£million
Total£million
At 1 January 2013 10.7 9.4 56.5 76.6
Write-down of investment (4.8) (0.5) 0.2 (5.1)
Share of retained profits net of amortisation - - 3.5 3.5
Exchange differences - - (1.1) (1.1)
At 31 December 2013 5.9 8.9 59.1 73.9
Additions - - - -
Share of retained profits net of amortisation - - (1.7) (1.7)
Exchange differences - - 5.0 5.0
At 31 december 2014 5.9 8.9 62.4 77.2
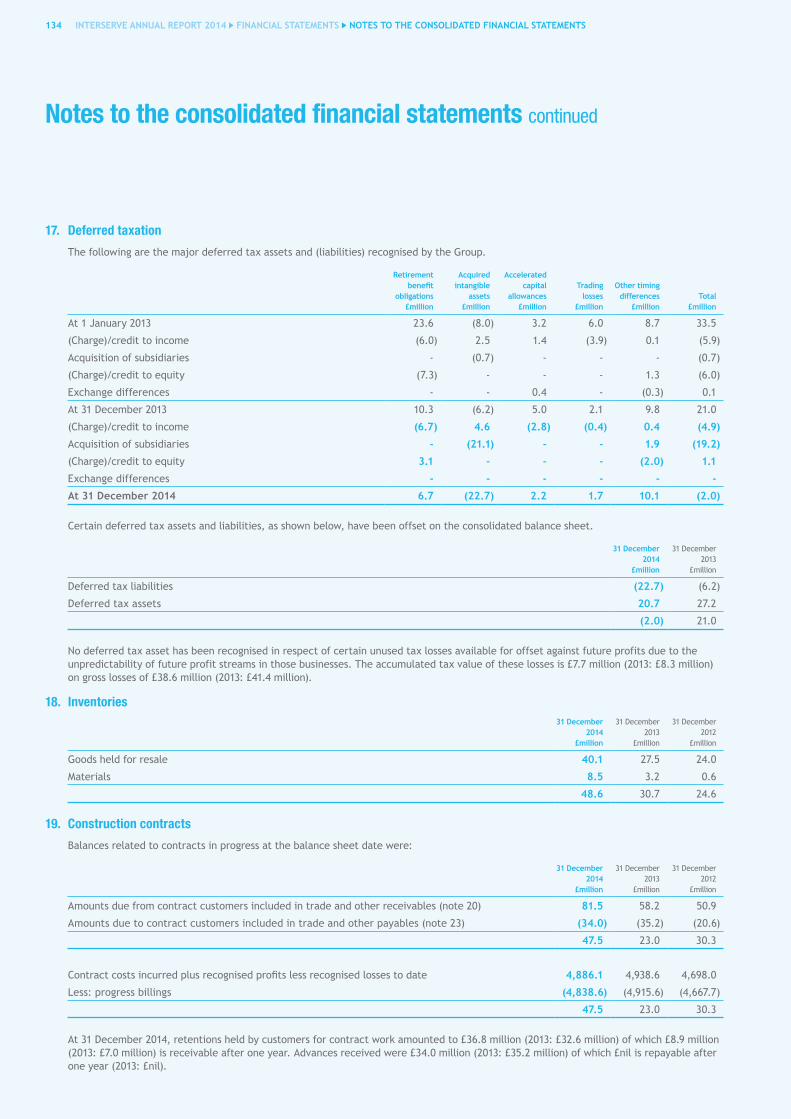
Notes to the consolidated financial statements continued
134 INTERSERVE ANNUAL REPORT 2014 FINANCIAL STATEMENTS NOTES TO ThE CONSOLIdATEd FINANCIAL STATEMENTS
17. Deferred taxation
The following are the major deferred tax assets and (liabilities) recognised by the Group.
Retirement benefit
obligations£million
Acquired intangible
assets£million
Accelerated capital
allowances£million
Trading losses
£million
Other timing differences
£millionTotal
£million
At 1 January 2013 23.6 (8.0) 3.2 6.0 8.7 33.5
(Charge)/credit to income (6.0) 2.5 1.4 (3.9) 0.1 (5.9)
Acquisition of subsidiaries - (0.7) - - - (0.7)
(Charge)/credit to equity (7.3) - - - 1.3 (6.0)
Exchange differences - - 0.4 - (0.3) 0.1
At 31 December 2013 10.3 (6.2) 5.0 2.1 9.8 21.0
(Charge)/credit to income (6.7) 4.6 (2.8) (0.4) 0.4 (4.9)
Acquisition of subsidiaries - (21.1) - - 1.9 (19.2)
(Charge)/credit to equity 3.1 - - - (2.0) 1.1
Exchange differences - - - - - -
At 31 december 2014 6.7 (22.7) 2.2 1.7 10.1 (2.0)
Certain deferred tax assets and liabilities, as shown below, have been offset on the consolidated balance sheet.
31 december 2014
£million
31 December 2013
£million
Deferred tax liabilities (22.7) (6.2)
Deferred tax assets 20.7 27.2
(2.0) 21.0
No deferred tax asset has been recognised in respect of certain unused tax losses available for offset against future profits due to the unpredictability of future profit streams in those businesses. The accumulated tax value of these losses is £7.7 million (2013: £8.3 million) on gross losses of £38.6 million (2013: £41.4 million).
18. Inventories31 december
2014£million
31 December 2013
£million
31 December 2012
£million
Goods held for resale 40.1 27.5 24.0
Materials 8.5 3.2 0.6
48.6 30.7 24.6
19. Construction contracts
Balances related to contracts in progress at the balance sheet date were:
31 december 2014
£million
31 December 2013
£million
31 December 2012
£million
Amounts due from contract customers included in trade and other receivables (note 20) 81.5 58.2 50.9
Amounts due to contract customers included in trade and other payables (note 23) (34.0) (35.2) (20.6)
47.5 23.0 30.3
Contract costs incurred plus recognised profits less recognised losses to date 4,886.1 4,938.6 4,698.0
Less: progress billings (4,838.6) (4,915.6) (4,667.7)
47.5 23.0 30.3
At 31 December 2014, retentions held by customers for contract work amounted to £36.8 million (2013: £32.6 million) of which £8.9 million (2013: £7.0 million) is receivable after one year. Advances received were £34.0 million (2013: £35.2 million) of which £nil is repayable after one year (2013: £nil).

135INTERSERVE ANNUAL REPORT 2014 FINANCIAL STATEMENTS NOTES TO ThE CONSOLIdATEd FINANCIAL STATEMENTS
OVERVIEW
GO
VERNA
NCE
FINA
NCIA
L STATEMEN
TS STRATEG
IC REPORT
20. Trade and other receivables31 december
2014£million
31 December 2013
£million
31 December 2012
£million
Amounts recoverable from the sale of goods and services 418.0 290.8 270.1
Allowances for doubtful debts (49.2) (41.8) (30.5)
368.8 249.0 239.6
Amounts due from construction contract customers 81.5 58.2 50.9
Retentions 36.8 32.6 26.0
Other receivables 26.7 20.1 12.4
Prepayments and accrued income 165.6 126.2 103.1
679.4 486.1 432.0
Included in the above are the following amounts recoverable after more than one year:
31 december 2014
£million
31 December 2013
£million
31 December 2012
£million
Retentions 8.9 7.0 4.5
The directors consider that the carrying amount of trade and other receivables approximates their fair value. Trade and other receivables are included as part of the financial assets.
Average credit period taken on the sale of goods and services is 38 days (2013: 35 days). Allowances for doubtful debt are provided for on a specific basis, based on estimates of irrecoverability determined by market knowledge and past experience.
Ageing of trade receivables, not impaired but net of allowances for doubtful debt, is as follows:
31 december 2014
£million
31 December 2013
£million
31 December 2012
£million
Not more than one month past due 65.8 30.8 36.0
Between one and three months past due 26.0 16.6 14.3
Between three and six months past due 24.5 14.9 16.6
Greater than six months 17.1 6.3 10.4
Total past due but not impaired 133.4 68.6 77.3
Not past due 235.4 180.4 162.3
Total net receivables 368.8 249.0 239.6
The average age of the receivables past due but not impaired is 78 days (2013: 75 days).
Movement in allowance for doubtful debt is as follows:
2014£million
2013£million
Balance at 1 January 41.8 30.5
Acquisition of new subsidiaries 4.2 1.2
Amounts written off as uncollectable (23.3) (9.7)
Impairment losses recognised in the year 28.0 25.3
Amounts recovered during the year (2.6) (3.8)
Exchange differences 1.1 (1.7)
Balance at 31 December 49.2 41.8
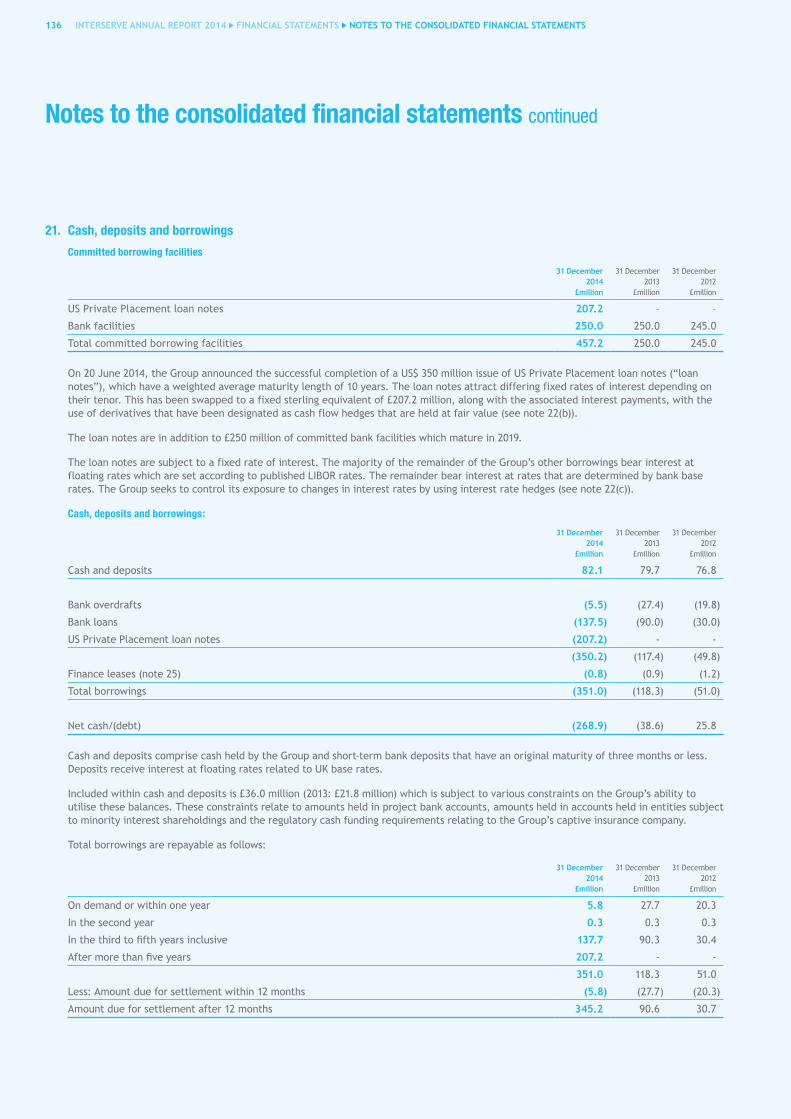
Notes to the consolidated financial statements continued
136 INTERSERVE ANNUAL REPORT 2014 FINANCIAL STATEMENTS NOTES TO ThE CONSOLIdATEd FINANCIAL STATEMENTS
21. Cash, deposits and borrowings
Committed borrowing facilities
31 december 2014
£million
31 December 2013
£million
31 December 2012
£million
US Private Placement loan notes 207.2 – –
Bank facilities 250.0 250.0 245.0
Total committed borrowing facilities 457.2 250.0 245.0
On 20 June 2014, the Group announced the successful completion of a US$ 350 million issue of US Private Placement loan notes (“loan notes”), which have a weighted average maturity length of 10 years. The loan notes attract differing fixed rates of interest depending on their tenor. This has been swapped to a fixed sterling equivalent of £207.2 million, along with the associated interest payments, with the use of derivatives that have been designated as cash flow hedges that are held at fair value (see note 22(b)).
The loan notes are in addition to £250 million of committed bank facilities which mature in 2019.
The loan notes are subject to a fixed rate of interest. The majority of the remainder of the Group’s other borrowings bear interest at floating rates which are set according to published LIBOR rates. The remainder bear interest at rates that are determined by bank base rates. The Group seeks to control its exposure to changes in interest rates by using interest rate hedges (see note 22(c)).
Cash, deposits and borrowings:
31 december 2014
£million
31 December 2013
£million
31 December 2012
£million
Cash and deposits 82.1 79.7 76.8
Bank overdrafts (5.5) (27.4) (19.8)
Bank loans (137.5) (90.0) (30.0)
US Private Placement loan notes (207.2) - -
(350.2) (117.4) (49.8)
Finance leases (note 25) (0.8) (0.9) (1.2)
Total borrowings (351.0) (118.3) (51.0)
Net cash/(debt) (268.9) (38.6) 25.8
Cash and deposits comprise cash held by the Group and short-term bank deposits that have an original maturity of three months or less. Deposits receive interest at floating rates related to UK base rates.
Included within cash and deposits is £36.0 million (2013: £21.8 million) which is subject to various constraints on the Group’s ability to utilise these balances. These constraints relate to amounts held in project bank accounts, amounts held in accounts held in entities subject to minority interest shareholdings and the regulatory cash funding requirements relating to the Group’s captive insurance company.
Total borrowings are repayable as follows:
31 december 2014
£million
31 December 2013
£million
31 December 2012
£million
On demand or within one year 5.8 27.7 20.3
In the second year 0.3 0.3 0.3
In the third to fifth years inclusive 137.7 90.3 30.4
After more than five years 207.2 - -
351.0 118.3 51.0
Less: Amount due for settlement within 12 months (5.8) (27.7) (20.3)
Amount due for settlement after 12 months 345.2 90.6 30.7

137INTERSERVE ANNUAL REPORT 2014 FINANCIAL STATEMENTS NOTES TO ThE CONSOLIdATEd FINANCIAL STATEMENTS
OVERVIEW
GO
VERNA
NCE
FINA
NCIA
L STATEMEN
TS STRATEG
IC REPORT
Amounts are drawn down against facilities on a short-term basis but the ageing of the total amount borrowed is classified according to the maturity of the facilities. Contractual interest on bank loans, that will accrue between the year end and the date of rollover of the amounts drawn down, is £0.5 million and is all due for payment within one year (2013: £0.1 million within one year).
The analysis of utilisation of committed bank facilities is as follows:
31 december 2014
£million
31 December 2013
£million
31 December 2012
£million
Drawn facilities:
US Private Placement loan notes 207.2 - -
Bank loans 137.5 90.0 30.0
Undrawn facilities within one to two years - - -
Undrawn facilities within more than two years but not more than five years remaining 112.5 160.0 215.0
Total committed borrowing facilities 457.2 250.0 245.0
22. Financial risk management
Financial assets comprise trade and other receivables (excluding construction contracts, prepaid and accrued income), long-term debtors and cash and deposits. Financial assets and liabilities have fair values not materially different to the carrying values. Financial liabilities comprise trade and other payables (excluding construction contracts, accruals, deferred income and other tax and social security), bank borrowings, finance leases, loan notes, long-term creditors and interest rate hedges.
The Group has the following categories of financial assets and liabilities:
31 december 2014 31 December 2013
Other financial
assets£million
derivatives used for hedging£million
Total£million
Other financial
assets£million
Derivatives used for hedging£million
Total£million
Loans and receivables
Cash and deposits 82.1 - 82.1 79.7 - 79.7
Trade and other receivables (excluding construction contracts, prepaid and accrued income) 395.5 - 395.5 269.1 - 269.1
Currency exchange rate hedge - 5.4 5.4 - - -
Total financial assets 477.6 5.4 483.0 348.8 - 348.8
31 december 2014 31 December 2013
Other financial liabilities£million
derivatives used for hedging£million
Total£million
Other financial liabilities£million
Derivatives used for hedging£million
Total£million
Borrowings, overdrafts and finance leases 143.8 - 143.8 118.3 - 118.3
Loan notes 207.2 - 207.2 - - -
Trade and other payables (excluding construction contracts, accruals, deferred income and other tax and social security) 357.1 - 357.1 297.8 - 297.8
Interest rate hedge (non-PFI investments) - 0.1 0.1 - 0.3 0.3
Total financial liabilities 708.1 0.1 708.2 416.1 0.3 416.4
Trade and other receivables and trade and other payables are held at amortised cost. The directors consider these values to approximate their fair values. The interest rate hedges are recorded at fair value at each balance sheet date.

Notes to the consolidated financial statements continued
138 INTERSERVE ANNUAL REPORT 2014 FINANCIAL STATEMENTS NOTES TO ThE CONSOLIdATEd FINANCIAL STATEMENTS
22. Financial risk management continued
Financial instruments that are measured subsequent to initial recognition at fair value are grouped into three levels based on the degree to which the fair value is observable, as defined by IFRS 13:
– Level 1 fair value measurements are those derived from unadjusted quoted prices in active markets for identical assets and liabilities;
– Level 2 fair value measurements are those derived from inputs, other than quoted prices included within “Level 1”, that are observable either directly (i.e. as prices) or indirectly (i.e. derived from prices); and
– Level 3 fair value measurements are those derived from valuation techniques that include inputs for the asset or liability that are not based on observable market data.
Classification of financial assets/(liabilities) held at fair value according to the definitions set out in IFRS 13:
31 december 2014
£million
31 December 2013
£million
Level 2 5.3 (0.3)
Derivatives used for hedging financial liabilities are considered to be within the grouping referred to as “Level 2”. Their fair values are calculated based on the valuation models operated by the relevant counterparty bank, based on market interest rates in force on the date of valuation. The Level 2 financial derivatives are classified within other receivables and other payables.
No financial instruments have been transferred between Levels during the year.
Exposure to credit risk on liquid funds and derivative financial instruments is managed by the Group’s requirement to trade with counterparties with strong credit ratings as determined by international credit rating agencies. The transactional banking requirements are met by local banks in each location with significant cash balances being remitted to Group treasury where short-term cash surpluses or cash not available for use by the Group is deposited with investment grade rated banks.
(a) Currency exposures
Where material trade is transacted in non-local currency, the Company hedges the currency exposure and ordinarily this will be achieved with forward contracts.
Analysis of financial assets, excluding derivatives used for hedging, by currency:
31 december 2014 31 December 2013
Floating rates
£million
Fixed rates
£million
Non-interest bearing£million
Total£million
Floating rates
£million
Fixed rates
£million
Non-interest bearing£million
Total£million
Sterling 49.7 - 285.8 335.5 50.6 - 203.5 254.1
US dollar 6.2 - 39.8 46.0 7.1 - 20.6 27.7
Euro 4.1 - 9.8 13.9 10.8 - 1.2 12.0
Australian dollar 2.7 - 5.0 7.7 2.1 - 7.7 9.8
Dirham 6.5 - 22.1 28.6 0.9 - 11.5 12.4
Other 12.9 - 33.0 45.9 8.2 - 24.6 32.8
82.1 - 395.5 477.6 79.7 - 269.1 348.8
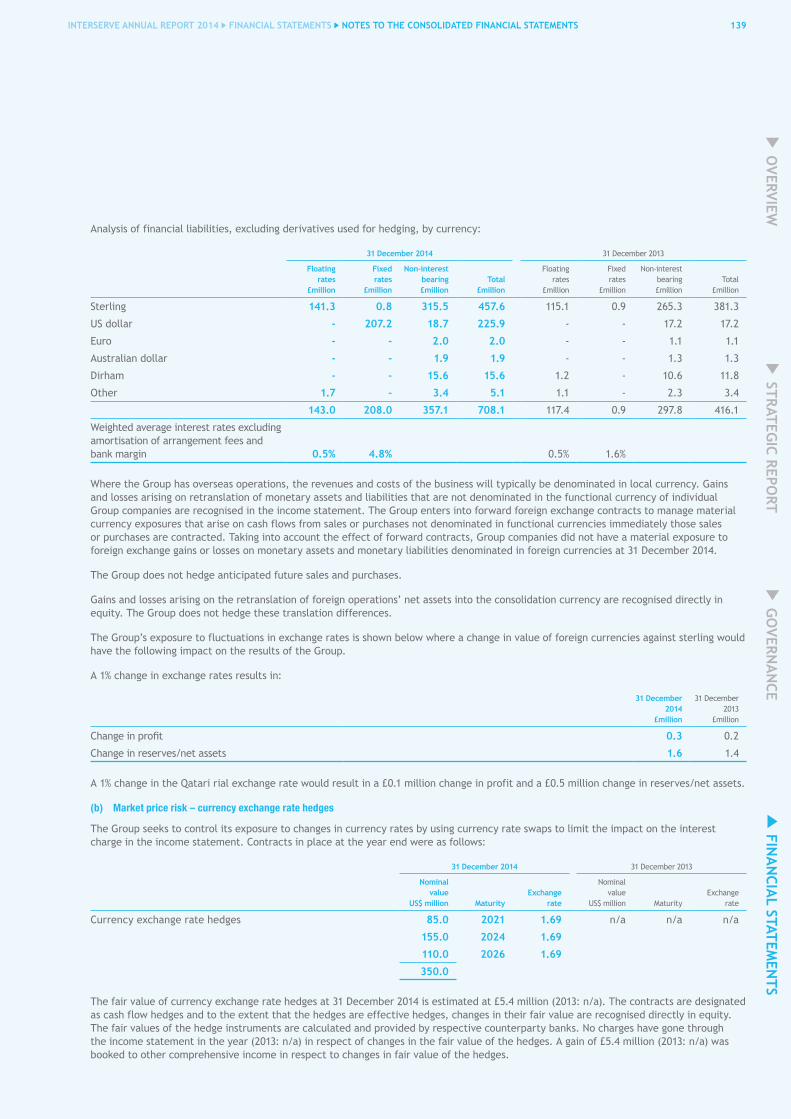
139INTERSERVE ANNUAL REPORT 2014 FINANCIAL STATEMENTS NOTES TO ThE CONSOLIdATEd FINANCIAL STATEMENTS
OVERVIEW
GO
VERNA
NCE
FINA
NCIA
L STATEMEN
TS STRATEG
IC REPORT
Analysis of financial liabilities, excluding derivatives used for hedging, by currency:
31 december 2014 31 December 2013
Floating rates
£million
Fixed rates
£million
Non-interest bearing£million
Total£million
Floating rates
£million
Fixed rates
£million
Non-interest bearing£million
Total£million
Sterling 141.3 0.8 315.5 457.6 115.1 0.9 265.3 381.3
US dollar - 207.2 18.7 225.9 - - 17.2 17.2
Euro - - 2.0 2.0 - - 1.1 1.1
Australian dollar - - 1.9 1.9 - - 1.3 1.3
Dirham - - 15.6 15.6 1.2 - 10.6 11.8
Other 1.7 - 3.4 5.1 1.1 - 2.3 3.4
143.0 208.0 357.1 708.1 117.4 0.9 297.8 416.1
Weighted average interest rates excluding amortisation of arrangement fees and bank margin 0.5% 4.8% 0.5% 1.6%
Where the Group has overseas operations, the revenues and costs of the business will typically be denominated in local currency. Gains and losses arising on retranslation of monetary assets and liabilities that are not denominated in the functional currency of individual Group companies are recognised in the income statement. The Group enters into forward foreign exchange contracts to manage material currency exposures that arise on cash flows from sales or purchases not denominated in functional currencies immediately those sales or purchases are contracted. Taking into account the effect of forward contracts, Group companies did not have a material exposure to foreign exchange gains or losses on monetary assets and monetary liabilities denominated in foreign currencies at 31 December 2014.
The Group does not hedge anticipated future sales and purchases.
Gains and losses arising on the retranslation of foreign operations’ net assets into the consolidation currency are recognised directly in equity. The Group does not hedge these translation differences.
The Group’s exposure to fluctuations in exchange rates is shown below where a change in value of foreign currencies against sterling would have the following impact on the results of the Group.
A 1% change in exchange rates results in:
31 december 2014
£million
31 December 2013
£million
Change in profit 0.3 0.2
Change in reserves/net assets 1.6 1.4
A 1% change in the Qatari rial exchange rate would result in a £0.1 million change in profit and a £0.5 million change in reserves/net assets.
(b) Market price risk – currency exchange rate hedges
The Group seeks to control its exposure to changes in currency rates by using currency rate swaps to limit the impact on the interest charge in the income statement. Contracts in place at the year end were as follows:
31 december 2014 31 December 2013
Nominal value
US$ million MaturityExchange
rate
Nominal value
US$ million MaturityExchange
rate
Currency exchange rate hedges 85.0 2021 1.69 n/a n/a n/a
155.0 2024 1.69
110.0 2026 1.69
350.0
The fair value of currency exchange rate hedges at 31 December 2014 is estimated at £5.4 million (2013: n/a). The contracts are designated as cash flow hedges and to the extent that the hedges are effective hedges, changes in their fair value are recognised directly in equity. The fair values of the hedge instruments are calculated and provided by respective counterparty banks. No charges have gone through the income statement in the year (2013: n/a) in respect of changes in the fair value of the hedges. A gain of £5.4 million (2013: n/a) was booked to other comprehensive income in respect to changes in fair value of the hedges.
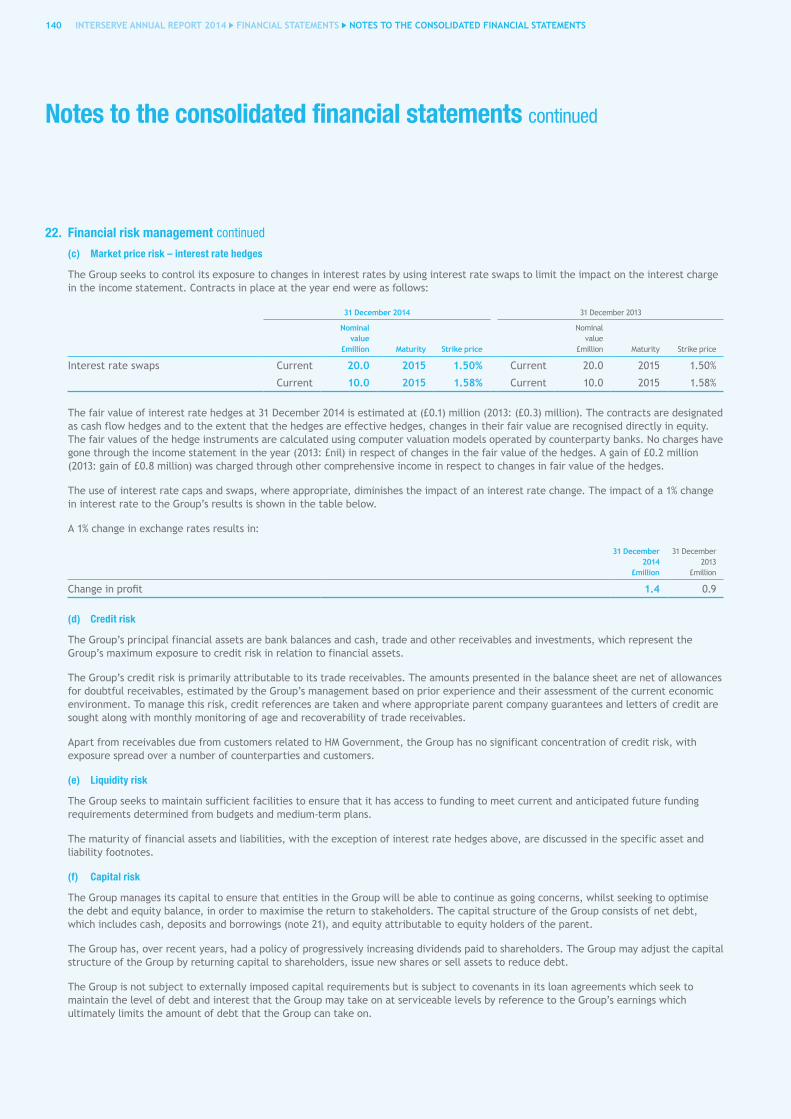
Notes to the consolidated financial statements continued
140 INTERSERVE ANNUAL REPORT 2014 FINANCIAL STATEMENTS NOTES TO ThE CONSOLIdATEd FINANCIAL STATEMENTS
22. Financial risk management continued
(c) Market price risk – interest rate hedges
The Group seeks to control its exposure to changes in interest rates by using interest rate swaps to limit the impact on the interest charge in the income statement. Contracts in place at the year end were as follows:
31 december 2014 31 December 2013
Nominal value
£million Maturity Strike price
Nominal value
£million Maturity Strike price
Interest rate swaps Current 20.0 2015 1.50% Current 20.0 2015 1.50%
Current 10.0 2015 1.58% Current 10.0 2015 1.58%
The fair value of interest rate hedges at 31 December 2014 is estimated at (£0.1) million (2013: (£0.3) million). The contracts are designated as cash flow hedges and to the extent that the hedges are effective hedges, changes in their fair value are recognised directly in equity. The fair values of the hedge instruments are calculated using computer valuation models operated by counterparty banks. No charges have gone through the income statement in the year (2013: £nil) in respect of changes in the fair value of the hedges. A gain of £0.2 million (2013: gain of £0.8 million) was charged through other comprehensive income in respect to changes in fair value of the hedges.
The use of interest rate caps and swaps, where appropriate, diminishes the impact of an interest rate change. The impact of a 1% change in interest rate to the Group’s results is shown in the table below.
A 1% change in exchange rates results in:
31 december 2014
£million
31 December 2013
£million
Change in profit 1.4 0.9
(d) Credit risk
The Group’s principal financial assets are bank balances and cash, trade and other receivables and investments, which represent the Group’s maximum exposure to credit risk in relation to financial assets.
The Group’s credit risk is primarily attributable to its trade receivables. The amounts presented in the balance sheet are net of allowances for doubtful receivables, estimated by the Group’s management based on prior experience and their assessment of the current economic environment. To manage this risk, credit references are taken and where appropriate parent company guarantees and letters of credit are sought along with monthly monitoring of age and recoverability of trade receivables.
Apart from receivables due from customers related to HM Government, the Group has no significant concentration of credit risk, with exposure spread over a number of counterparties and customers.
(e) Liquidity risk
The Group seeks to maintain sufficient facilities to ensure that it has access to funding to meet current and anticipated future funding requirements determined from budgets and medium-term plans.
The maturity of financial assets and liabilities, with the exception of interest rate hedges above, are discussed in the specific asset and liability footnotes.
(f) Capital risk
The Group manages its capital to ensure that entities in the Group will be able to continue as going concerns, whilst seeking to optimise the debt and equity balance, in order to maximise the return to stakeholders. The capital structure of the Group consists of net debt, which includes cash, deposits and borrowings (note 21), and equity attributable to equity holders of the parent.
The Group has, over recent years, had a policy of progressively increasing dividends paid to shareholders. The Group may adjust the capital structure of the Group by returning capital to shareholders, issue new shares or sell assets to reduce debt.
The Group is not subject to externally imposed capital requirements but is subject to covenants in its loan agreements which seek to maintain the level of debt and interest that the Group may take on at serviceable levels by reference to the Group’s earnings which ultimately limits the amount of debt that the Group can take on.
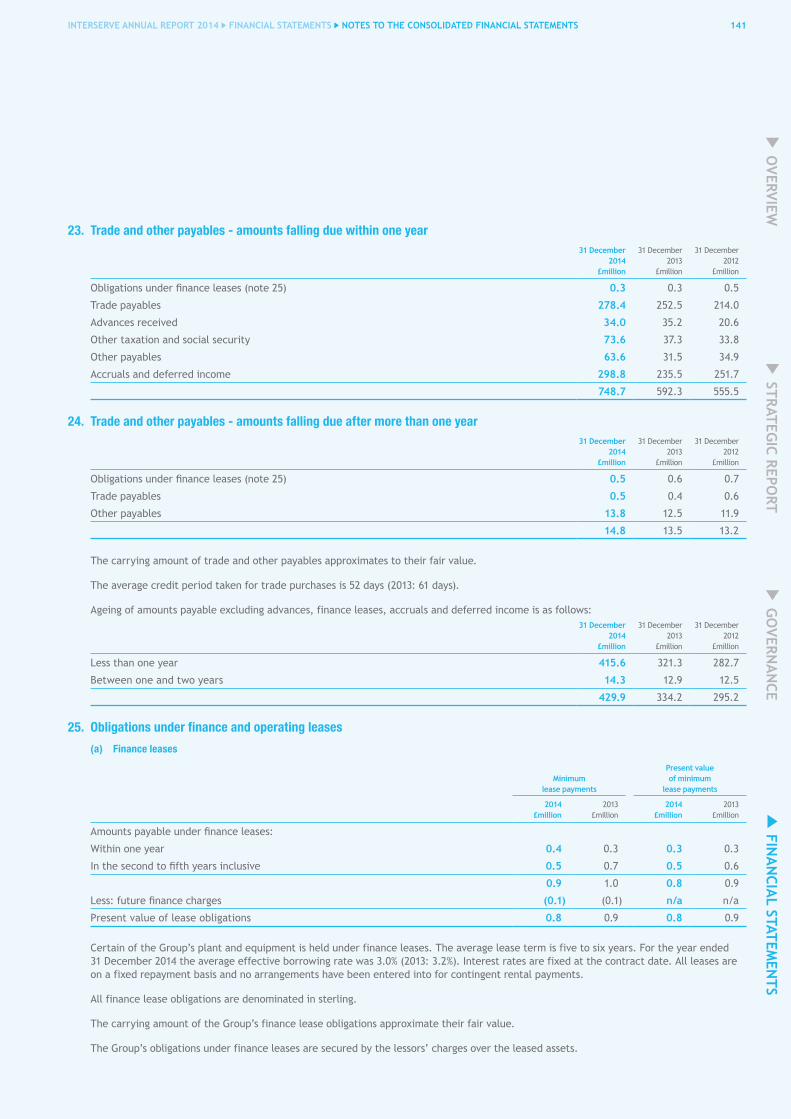
141INTERSERVE ANNUAL REPORT 2014 FINANCIAL STATEMENTS NOTES TO ThE CONSOLIdATEd FINANCIAL STATEMENTS
OVERVIEW
GO
VERNA
NCE
FINA
NCIA
L STATEMEN
TS STRATEG
IC REPORT
23. Trade and other payables - amounts falling due within one year31 december
2014£million
31 December 2013
£million
31 December 2012
£million
Obligations under finance leases (note 25) 0.3 0.3 0.5
Trade payables 278.4 252.5 214.0
Advances received 34.0 35.2 20.6
Other taxation and social security 73.6 37.3 33.8
Other payables 63.6 31.5 34.9
Accruals and deferred income 298.8 235.5 251.7
748.7 592.3 555.5
24. Trade and other payables - amounts falling due after more than one year31 december
2014£million
31 December 2013
£million
31 December 2012
£million
Obligations under finance leases (note 25) 0.5 0.6 0.7
Trade payables 0.5 0.4 0.6
Other payables 13.8 12.5 11.9
14.8 13.5 13.2
The carrying amount of trade and other payables approximates to their fair value.
The average credit period taken for trade purchases is 52 days (2013: 61 days).
Ageing of amounts payable excluding advances, finance leases, accruals and deferred income is as follows:31 december
2014£million
31 December 2013
£million
31 December 2012
£million
Less than one year 415.6 321.3 282.7
Between one and two years 14.3 12.9 12.5
429.9 334.2 295.2
25. Obligations under finance and operating leases
(a) Finance leases
Minimum lease payments
Present value of minimum
lease payments
2014£million
2013£million
2014£million
2013£million
Amounts payable under finance leases:
Within one year 0.4 0.3 0.3 0.3
In the second to fifth years inclusive 0.5 0.7 0.5 0.6
0.9 1.0 0.8 0.9
Less: future finance charges (0.1) (0.1) n/a n/a
Present value of lease obligations 0.8 0.9 0.8 0.9
Certain of the Group’s plant and equipment is held under finance leases. The average lease term is five to six years. For the year ended 31 December 2014 the average effective borrowing rate was 3.0% (2013: 3.2%). Interest rates are fixed at the contract date. All leases are on a fixed repayment basis and no arrangements have been entered into for contingent rental payments.
All finance lease obligations are denominated in sterling.
The carrying amount of the Group’s finance lease obligations approximate their fair value.
The Group’s obligations under finance leases are secured by the lessors’ charges over the leased assets.

Notes to the consolidated financial statements continued
142 INTERSERVE ANNUAL REPORT 2014 FINANCIAL STATEMENTS NOTES TO ThE CONSOLIdATEd FINANCIAL STATEMENTS
25. Obligations under finance and operating leases continued
(b) Operating leases
At the balance sheet date, the Group had outstanding commitments for future minimum lease payments under non-cancellable operating leases, which fall due as follows:
31 december 2014 31 December 2013
Land and buildings£million
Other£million
Total£million
Land and buildings£million
Other£million
Total£million
Within one year 12.6 14.8 27.4 12.9 10.6 23.5
In the second to fifth years inclusive 27.3 14.0 41.3 27.7 12.9 40.6
After five years 10.9 - 10.9 12.6 0.3 12.9
50.8 28.8 79.6 53.2 23.8 77.0
The majority of leases of land and buildings are subject to rent reviews at periodic intervals of between three and five years and are based on market rates.
26. ProvisionsContract
provisions£million
Other£million
Total£million
At 1 January 2013 40.5 10.8 51.3
Additional provision in the year 10.3 2.8 13.1
Acquisitions - 3.3 3.3
Release (10.8) (0.1) (10.9)
Utilisation of provision (5.8) (2.5) (8.3)
Exchange differences - (0.5) (0.5)
At 31 December 2013 34.2 13.8 48.0
Additional provision in the year 7.5 2.7 10.2
Acquisitions (note 12) 12.1 1.9 14.0
Release (11.5) (1.5) (13.0)
Utilisation of provision (8.8) (2.0) (10.8)
Exchange differences - 0.3 0.3
At 31 december 2014 33.5 15.2 48.7
31 december 2014
£million
31 December 2013
£million
31 December 2012
£million
Included in current liabilities 29.2 18.1 24.2
Included in non-current liabilities 19.5 29.9 27.1
48.7 48.0 51.3
The impact of discounting is not material.
Contract provisions include costs of site clearance, remedial costs and other contractual provisions. These are expected to be utilised on final settlement of the relevant contracts.
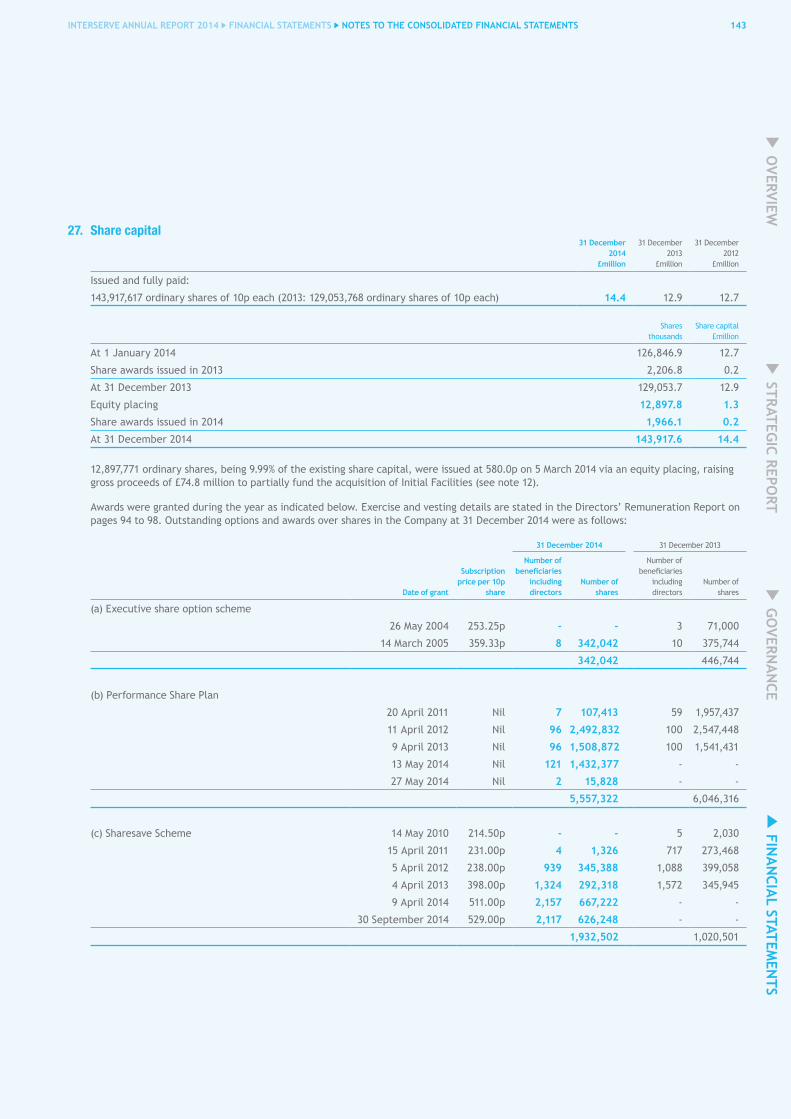
143INTERSERVE ANNUAL REPORT 2014 FINANCIAL STATEMENTS NOTES TO ThE CONSOLIdATEd FINANCIAL STATEMENTS
OVERVIEW
GO
VERNA
NCE
FINA
NCIA
L STATEMEN
TS STRATEG
IC REPORT
27. Share capital31 december
2014£million
31 December 2013
£million
31 December 2012
£million
Issued and fully paid:
143,917,617 ordinary shares of 10p each (2013: 129,053,768 ordinary shares of 10p each) 14.4 12.9 12.7
Sharesthousands
Share capital£million
At 1 January 2014 126,846.9 12.7
Share awards issued in 2013 2,206.8 0.2
At 31 December 2013 129,053.7 12.9
Equity placing 12,897.8 1.3
Share awards issued in 2014 1,966.1 0.2
At 31 December 2014 143,917.6 14.4
12,897,771 ordinary shares, being 9.99% of the existing share capital, were issued at 580.0p on 5 March 2014 via an equity placing, raising gross proceeds of £74.8 million to partially fund the acquisition of Initial Facilities (see note 12).
Awards were granted during the year as indicated below. Exercise and vesting details are stated in the Directors’ Remuneration Report on pages 94 to 98. Outstanding options and awards over shares in the Company at 31 December 2014 were as follows:
31 december 2014 31 December 2013
date of grant
Subscription price per 10p
share
Number of beneficiaries
including directors
Number of shares
Number of beneficiaries
including directors
Number of shares
(a) Executive share option scheme
26 May 2004 253.25p - - 3 71,000
14 March 2005 359.33p 8 342,042 10 375,744
342,042 446,744
(b) Performance Share Plan
20 April 2011 Nil 7 107,413 59 1,957,437
11 April 2012 Nil 96 2,492,832 100 2,547,448
9 April 2013 Nil 96 1,508,872 100 1,541,431
13 May 2014 Nil 121 1,432,377 - -
27 May 2014 Nil 2 15,828 - -
5,557,322 6,046,316
(c) Sharesave Scheme 14 May 2010 214.50p - - 5 2,030
15 April 2011 231.00p 4 1,326 717 273,468
5 April 2012 238.00p 939 345,388 1,088 399,058
4 April 2013 398.00p 1,324 292,318 1,572 345,945
9 April 2014 511.00p 2,157 667,222 - -
30 September 2014 529.00p 2,117 626,248 - -
1,932,502 1,020,501
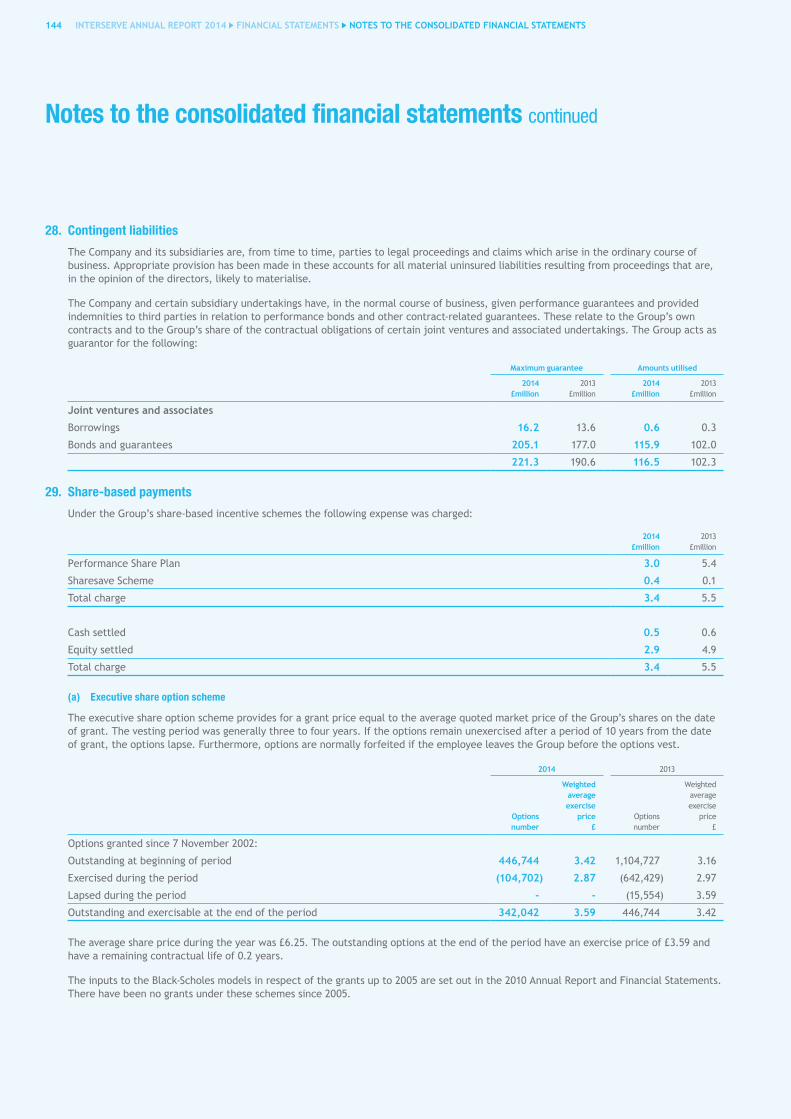
Notes to the consolidated financial statements continued
144 INTERSERVE ANNUAL REPORT 2014 FINANCIAL STATEMENTS NOTES TO ThE CONSOLIdATEd FINANCIAL STATEMENTS
28. Contingent liabilities
The Company and its subsidiaries are, from time to time, parties to legal proceedings and claims which arise in the ordinary course of business. Appropriate provision has been made in these accounts for all material uninsured liabilities resulting from proceedings that are, in the opinion of the directors, likely to materialise.
The Company and certain subsidiary undertakings have, in the normal course of business, given performance guarantees and provided indemnities to third parties in relation to performance bonds and other contract-related guarantees. These relate to the Group’s own contracts and to the Group’s share of the contractual obligations of certain joint ventures and associated undertakings. The Group acts as guarantor for the following:
Maximum guarantee Amounts utilised
2014£million
2013£million
2014£million
2013£million
Joint ventures and associates
Borrowings 16.2 13.6 0.6 0.3
Bonds and guarantees 205.1 177.0 115.9 102.0
221.3 190.6 116.5 102.3
29. Share-based payments
Under the Group’s share-based incentive schemes the following expense was charged:
2014£million
2013£million
Performance Share Plan 3.0 5.4
Sharesave Scheme 0.4 0.1
Total charge 3.4 5.5
Cash settled 0.5 0.6
Equity settled 2.9 4.9
Total charge 3.4 5.5
(a) Executive share option scheme
The executive share option scheme provides for a grant price equal to the average quoted market price of the Group’s shares on the date of grant. The vesting period was generally three to four years. If the options remain unexercised after a period of 10 years from the date of grant, the options lapse. Furthermore, options are normally forfeited if the employee leaves the Group before the options vest.
2014 2013
Options number
weighted average exercise
price £
Options number
Weighted average exercise
price£
Options granted since 7 November 2002:
Outstanding at beginning of period 446,744 3.42 1,104,727 3.16
Exercised during the period (104,702) 2.87 (642,429) 2.97
Lapsed during the period - - (15,554) 3.59
Outstanding and exercisable at the end of the period 342,042 3.59 446,744 3.42
The average share price during the year was £6.25. The outstanding options at the end of the period have an exercise price of £3.59 and have a remaining contractual life of 0.2 years.
The inputs to the Black-Scholes models in respect of the grants up to 2005 are set out in the 2010 Annual Report and Financial Statements. There have been no grants under these schemes since 2005.
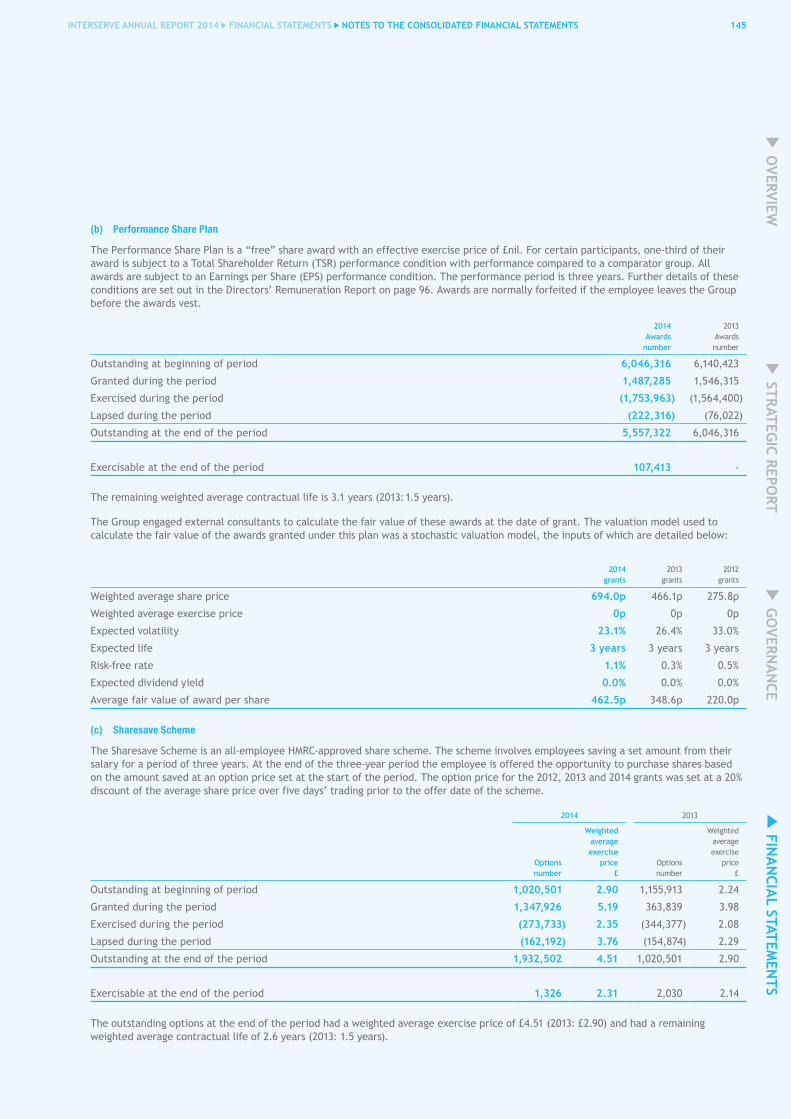
145INTERSERVE ANNUAL REPORT 2014 FINANCIAL STATEMENTS NOTES TO ThE CONSOLIdATEd FINANCIAL STATEMENTS
OVERVIEW
GO
VERNA
NCE
FINA
NCIA
L STATEMEN
TS STRATEG
IC REPORT
(b) Performance Share Plan
The Performance Share Plan is a “free” share award with an effective exercise price of £nil. For certain participants, one-third of their award is subject to a Total Shareholder Return (TSR) performance condition with performance compared to a comparator group. All awards are subject to an Earnings per Share (EPS) performance condition. The performance period is three years. Further details of these conditions are set out in the Directors’ Remuneration Report on page 96. Awards are normally forfeited if the employee leaves the Group before the awards vest.
2014Awardsnumber
2013Awardsnumber
Outstanding at beginning of period 6,046,316 6,140,423
Granted during the period 1,487,285 1,546,315
Exercised during the period (1,753,963) (1,564,400)
Lapsed during the period (222,316) (76,022)
Outstanding at the end of the period 5,557,322 6,046,316
Exercisable at the end of the period 107,413 -
The remaining weighted average contractual life is 3.1 years (2013: 1.5 years).
The Group engaged external consultants to calculate the fair value of these awards at the date of grant. The valuation model used to calculate the fair value of the awards granted under this plan was a stochastic valuation model, the inputs of which are detailed below:
2014grants
2013grants
2012grants
Weighted average share price 694.0p 466.1p 275.8p
Weighted average exercise price 0p 0p 0p
Expected volatility 23.1% 26.4% 33.0%
Expected life 3 years 3 years 3 years
Risk-free rate 1.1% 0.3% 0.5%
Expected dividend yield 0.0% 0.0% 0.0%
Average fair value of award per share 462.5p 348.6p 220.0p
(c) Sharesave Scheme
The Sharesave Scheme is an all-employee HMRC-approved share scheme. The scheme involves employees saving a set amount from their salary for a period of three years. At the end of the three-year period the employee is offered the opportunity to purchase shares based on the amount saved at an option price set at the start of the period. The option price for the 2012, 2013 and 2014 grants was set at a 20% discount of the average share price over five days’ trading prior to the offer date of the scheme.
2014 2013
Options number
weighted average exercise
price £
Options number
Weighted average exercise
price £
Outstanding at beginning of period 1,020,501 2.90 1,155,913 2.24
Granted during the period 1,347,926 5.19 363,839 3.98
Exercised during the period (273,733) 2.35 (344,377) 2.08
Lapsed during the period (162,192) 3.76 (154,874) 2.29
Outstanding at the end of the period 1,932,502 4.51 1,020,501 2.90
Exercisable at the end of the period 1,326 2.31 2,030 2.14
The outstanding options at the end of the period had a weighted average exercise price of £4.51 (2013: £2.90) and had a remaining weighted average contractual life of 2.6 years (2013: 1.5 years).
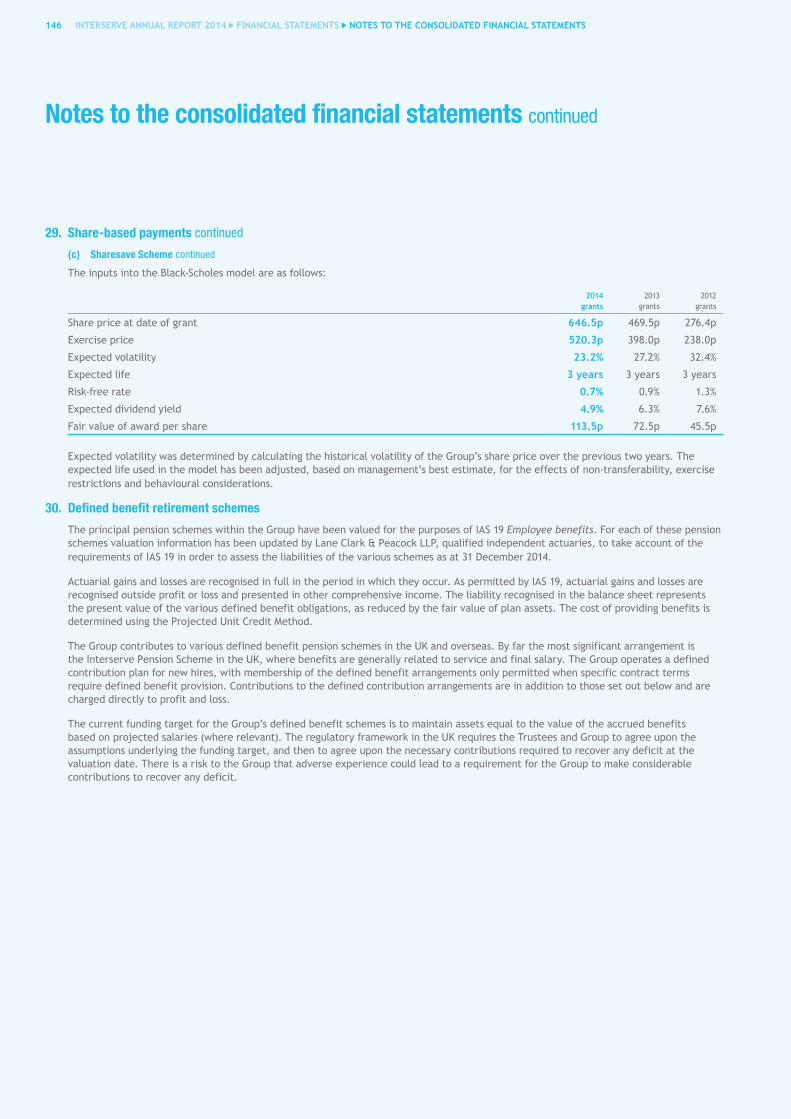
146 INTERSERVE ANNUAL REPORT 2014 FINANCIAL STATEMENTS NOTES TO ThE CONSOLIdATEd FINANCIAL STATEMENTS
29. Share-based payments continued
(c) Sharesave Scheme continued
Notes to the consolidated financial statements continued
The inputs into the Black-Scholes model are as follows:
2014grants
2013grants
2012grants
Share price at date of grant 646.5p 469.5p 276.4p
Exercise price 520.3p 398.0p 238.0p
Expected volatility 23.2% 27.2% 32.4%
Expected life 3 years 3 years 3 years
Risk-free rate 0.7% 0.9% 1.3%
Expected dividend yield 4.9% 6.3% 7.6%
Fair value of award per share 113.5p 72.5p 45.5p
Expected volatility was determined by calculating the historical volatility of the Group’s share price over the previous two years. The expected life used in the model has been adjusted, based on management’s best estimate, for the effects of non-transferability, exercise restrictions and behavioural considerations.
30. Defined benefit retirement schemes
The principal pension schemes within the Group have been valued for the purposes of IAS 19 Employee benefits. For each of these pension schemes valuation information has been updated by Lane Clark & Peacock LLP, qualified independent actuaries, to take account of the requirements of IAS 19 in order to assess the liabilities of the various schemes as at 31 December 2014.
Actuarial gains and losses are recognised in full in the period in which they occur. As permitted by IAS 19, actuarial gains and losses are recognised outside profit or loss and presented in other comprehensive income. The liability recognised in the balance sheet represents the present value of the various defined benefit obligations, as reduced by the fair value of plan assets. The cost of providing benefits is determined using the Projected Unit Credit Method.
The Group contributes to various defined benefit pension schemes in the UK and overseas. By far the most significant arrangement is the Interserve Pension Scheme in the UK, where benefits are generally related to service and final salary. The Group operates a defined contribution plan for new hires, with membership of the defined benefit arrangements only permitted when specific contract terms require defined benefit provision. Contributions to the defined contribution arrangements are in addition to those set out below and are charged directly to profit and loss.
The current funding target for the Group’s defined benefit schemes is to maintain assets equal to the value of the accrued benefits based on projected salaries (where relevant). The regulatory framework in the UK requires the Trustees and Group to agree upon the assumptions underlying the funding target, and then to agree upon the necessary contributions required to recover any deficit at the valuation date. There is a risk to the Group that adverse experience could lead to a requirement for the Group to make considerable contributions to recover any deficit.
29. Share-based payments

147INTERSERVE ANNUAL REPORT 2014 FINANCIAL STATEMENTS NOTES TO ThE CONSOLIdATEd FINANCIAL STATEMENTS
OVERVIEW
GO
VERNA
NCE
FINA
NCIA
L STATEMEN
TS STRATEG
IC REPORT
The following table sets out the key IAS 19 assumptions used to assess the present value of the defined benefit obligation. The assumptions shown are in relation to the Interserve Pension Scheme, which represents 92% of the total defined benefit obligation. The life expectancy assumptions shown relate to the vast majority of the membership of that scheme. Alternative assumptions have been used for the less material arrangements where the specific nature of those schemes deems it appropriate to do so. The weighted average duration of the expected benefit payments for the schemes is around 17 years.
2014 2013 2012
Significant actuarial assumptions
Retail price inflation 3.10% pa 3.40% pa 3.00% pa
Discount rate 3.60% pa 4.50% pa 4.40% pa
Post-retirement mortality (expectancy of life in years)
Male currently aged 65 87.5 87.4 87.3
Female currently aged 65 89.5 89.4 89.3
Male aged 65 in 20 years' time 89.3 89.2 89.1
Female aged 65 in 20 years' time 91.0 90.9 90.9
Other related actuarial assumptions
Consumer price index 2.10% pa 2.40% pa 2.30% pa
Pension increases in payment:
LPI/RPI 3.00%/3.10% pa 3.30%/3.40% pa 2.90%/3.00% pa
Fixed 5% 5.00% pa 5.00% pa 5.00% pa
3% or RPI if higher (capped at 5%) 3.60% pa 3.70% pa 3.50% pa
General salary increases 2.10-2.60% pa 2.40-2.90% pa 2.30-2.80% pa
The amount included in the balance sheet arising from the Group’s obligations in respect of the various pension schemes is as follows:
2014£million
2013£million
2012£million
2011£million
2010£million
Present value of defined benefit obligation 924.9 826.9 799.3 695.0 642.3
Fair value of schemes' assets (920.1) (819.2) (698.2) (638.8) (590.8)
Liability recognised in the balance sheet 4.8 7.7 101.1 56.2 51.5
The change in the net liabilities recognised in the balance sheet is comprised as follows:
2014£million
2013£million
Opening net liability 7.7 101.1
Expense charges to profit and loss 9.2 10.7
Amount recognised outside profit and loss 15.7 (21.3)
Employer contributions (27.8) (82.8)
Closing net liability 4.8 7.7
Indicative change in defined benefit obligation
Sensitivity2014
£million2013
£million
Sensitivity to significant actuarial assumptions
Price inflation +/0.5% pa +/-55 +/-50
Discount rate +/0.5% pa +/-73 +/-67
Post retirement mortality (expectancy of life in years) 1 year increase +30 +25
The sensitivities shown above reflect only the change in the assessed defined benefit obligation. In practice any movement in assumptions is likely to be accompanied by a partially offsetting change in asset values, and the corresponding overall impact on the net liability is therefore likely to be lower than the amounts above.
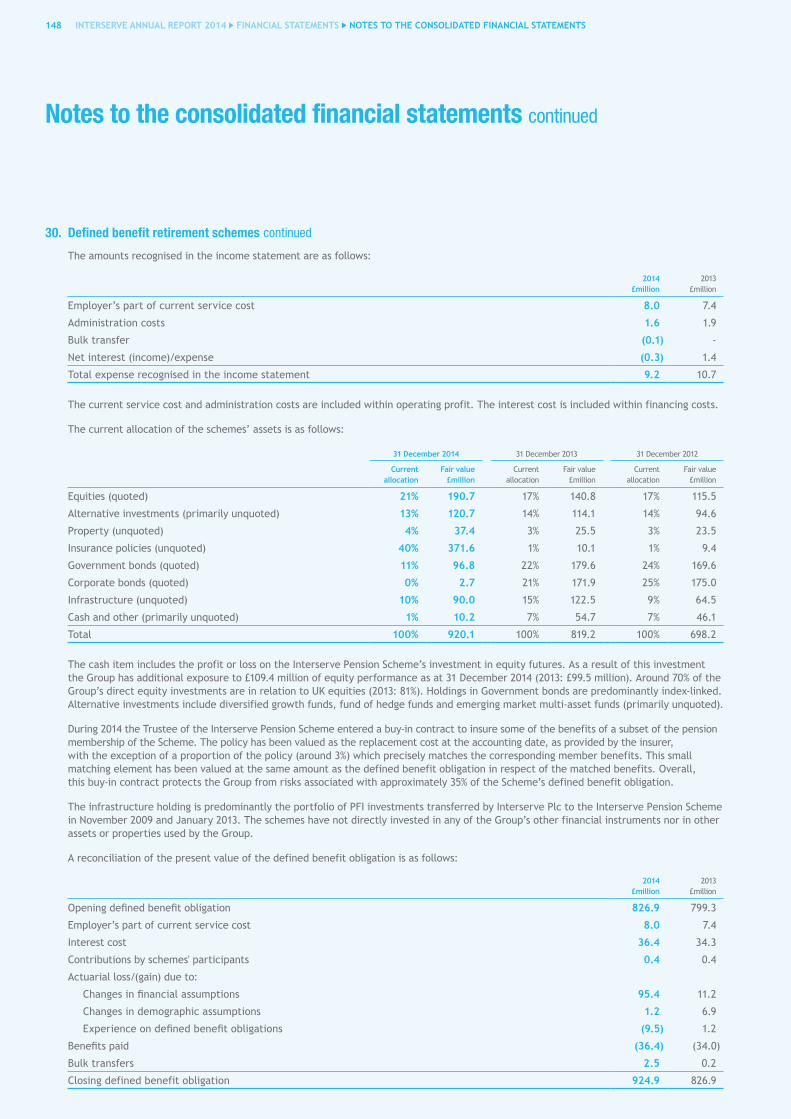
Notes to the consolidated financial statements continued
148 INTERSERVE ANNUAL REPORT 2014 FINANCIAL STATEMENTS NOTES TO ThE CONSOLIdATEd FINANCIAL STATEMENTS
30. Defined benefit retirement schemes continued
The amounts recognised in the income statement are as follows:
2014£million
2013£million
Employer’s part of current service cost 8.0 7.4
Administration costs 1.6 1.9
Bulk transfer (0.1) -
Net interest (income)/expense (0.3) 1.4
Total expense recognised in the income statement 9.2 10.7
The current service cost and administration costs are included within operating profit. The interest cost is included within financing costs.
The current allocation of the schemes’ assets is as follows:
31 december 2014 31 December 2013 31 December 2012
Current allocation
Fair value £million
Current allocation
Fair value £million
Current allocation
Fair value £million
Equities (quoted) 21% 190.7 17% 140.8 17% 115.5
Alternative investments (primarily unquoted) 13% 120.7 14% 114.1 14% 94.6
Property (unquoted) 4% 37.4 3% 25.5 3% 23.5
Insurance policies (unquoted) 40% 371.6 1% 10.1 1% 9.4
Government bonds (quoted) 11% 96.8 22% 179.6 24% 169.6
Corporate bonds (quoted) 0% 2.7 21% 171.9 25% 175.0
Infrastructure (unquoted) 10% 90.0 15% 122.5 9% 64.5
Cash and other (primarily unquoted) 1% 10.2 7% 54.7 7% 46.1
Total 100% 920.1 100% 819.2 100% 698.2
The cash item includes the profit or loss on the Interserve Pension Scheme’s investment in equity futures. As a result of this investment the Group has additional exposure to £109.4 million of equity performance as at 31 December 2014 (2013: £99.5 million). Around 70% of the Group’s direct equity investments are in relation to UK equities (2013: 81%). Holdings in Government bonds are predominantly index-linked. Alternative investments include diversified growth funds, fund of hedge funds and emerging market multi-asset funds (primarily unquoted).
During 2014 the Trustee of the Interserve Pension Scheme entered a buy-in contract to insure some of the benefits of a subset of the pension membership of the Scheme. The policy has been valued as the replacement cost at the accounting date, as provided by the insurer, with the exception of a proportion of the policy (around 3%) which precisely matches the corresponding member benefits. This small matching element has been valued at the same amount as the defined benefit obligation in respect of the matched benefits. Overall, this buy-in contract protects the Group from risks associated with approximately 35% of the Scheme’s defined benefit obligation.
The infrastructure holding is predominantly the portfolio of PFI investments transferred by Interserve Plc to the Interserve Pension Scheme in November 2009 and January 2013. The schemes have not directly invested in any of the Group’s other financial instruments nor in other assets or properties used by the Group.
A reconciliation of the present value of the defined benefit obligation is as follows:
2014£million
2013£million
Opening defined benefit obligation 826.9 799.3
Employer’s part of current service cost 8.0 7.4
Interest cost 36.4 34.3
Contributions by schemes' participants 0.4 0.4
Actuarial loss/(gain) due to:
Changes in financial assumptions 95.4 11.2
Changes in demographic assumptions 1.2 6.9
Experience on defined benefit obligations (9.5) 1.2
Benefits paid (36.4) (34.0)
Bulk transfers 2.5 0.2
Closing defined benefit obligation 924.9 826.9
30. Defined benefit retirement schemes

149INTERSERVE ANNUAL REPORT 2014 FINANCIAL STATEMENTS NOTES TO ThE CONSOLIdATEd FINANCIAL STATEMENTS
OVERVIEW
GO
VERNA
NCE
FINA
NCIA
L STATEMEN
TS STRATEG
IC REPORT
A reconciliation of the fair value of the schemes’ assets is as follows:
2014£million
2013£million
Opening fair value of the schemes' assets 819.2 698.2
Interest on schemes' assets 36.7 32.9
Actual return on schemes' assets less interest on schemes' assets 71.4 40.6
Contributions by the employer 27.8 82.8
Contributions by schemes' participants 0.4 0.4
Benefits paid (36.4) (34.0)
Administration costs (1.6) (1.9)
Bulk transfers 2.6 0.2
Closing fair value of the schemes' assets 920.1 819.2
Based on current contribution rates and payroll, the Group expects to contribute £25.1 million to the various defined benefit arrangements during 2015. This includes deficit contributions to the Interserve Pension Scheme of £12.9 million.
The Group has assessed that no further liability arises under IFRIC 14 IAS 19 - The limit on a defined benefit asset, minimum funding requirements and their interaction on the basis that the scheme rules allow the Company an unconditional right to refunds assuming the gradual settlement of plan liabilities over time until all members have left the scheme.
31. Related party transactions
Transactions between the Company and its subsidiaries, which are related parties, have been eliminated on consolidation and are not disclosed in this note. Transactions between the Group and its associates are disclosed below.
During the year, Group companies entered into the following transactions with related parties who are not members of the Group:
Sales of goods and services
Purchases of goods and services
Amounts due from related parties
Amounts owed to related parties
2014£million
2013£million
2014£million
2013£million
2014£million
2013£million
2014£million
2013£million
Joint-venture entities 2.5 1.2 - - 0.4 0.1 - -
Associates 137.6 127.6 0.8 1.0 21.2 32.2 0.5 16.2
Sales and purchases of goods and services to related parties were made on normal trading terms.
The amounts outstanding are unsecured and will be settled in cash. No guarantees have been given or received in respect of the outstanding balances. No provisions have been made for doubtful debts in respect of the amounts owed by related parties.
Key management personnel are considered to be the directors of Interserve Plc. Dividends totalling £0.2 million (2013: £0.1 million) were paid in the year in respect of ordinary shares held by the Company’s directors. Other amounts paid to key management personnel are given in the audited section of the Directors’ Remuneration Report on pages 90 to 101.
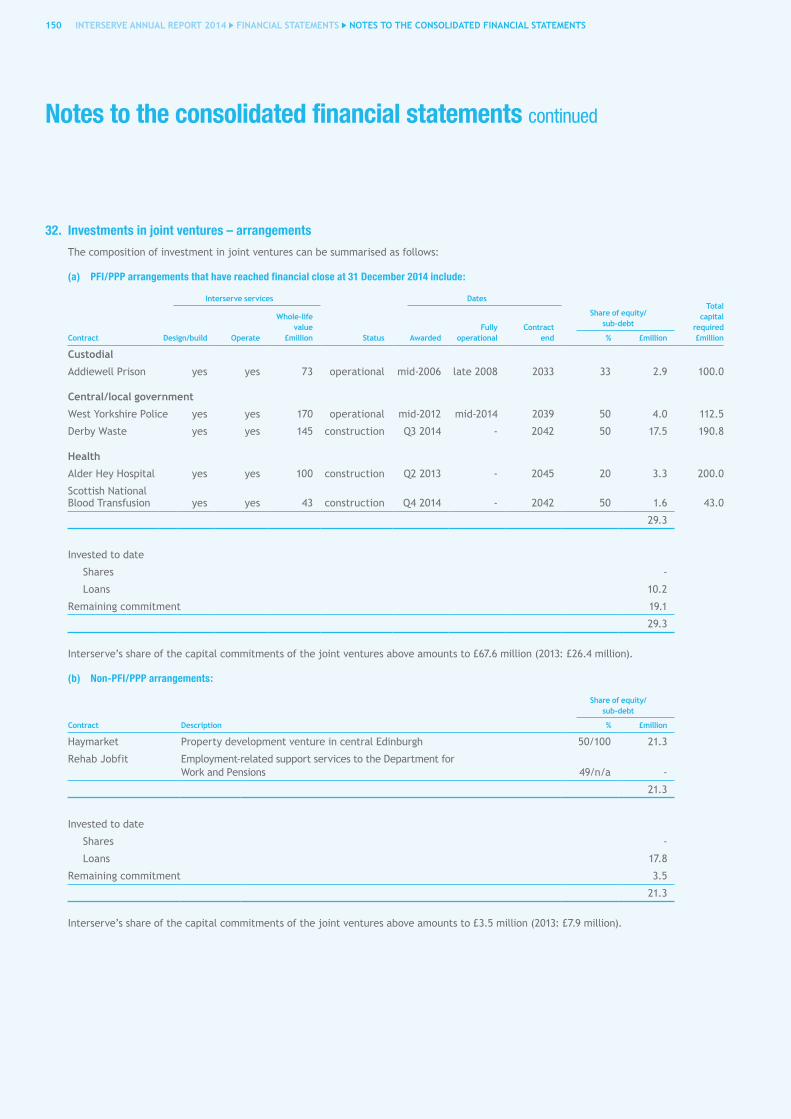
Notes to the consolidated financial statements continued
150 INTERSERVE ANNUAL REPORT 2014 FINANCIAL STATEMENTS NOTES TO ThE CONSOLIdATEd FINANCIAL STATEMENTS
32. Investments in joint ventures – arrangements
The composition of investment in joint ventures can be summarised as follows:
(a) PFI/PPP arrangements that have reached financial close at 31 December 2014 include:
Interserve services dates
Share of equity/ sub-debt
% £million
Total capital
required £millionContract design/build Operate
whole-life value
£million Status AwardedFully
operationalContract
end
Custodial
Addiewell Prison yes yes 73 operational mid-2006 late 2008 2033 33 2.9 100.0
Central/local government
West Yorkshire Police yes yes 170 operational mid-2012 mid-2014 2039 50 4.0 112.5
Derby Waste yes yes 145 construction Q3 2014 - 2042 50 17.5 190.8
health
Alder Hey Hospital yes yes 100 construction Q2 2013 - 2045 20 3.3 200.0
Scottish National Blood Transfusion yes yes 43 construction Q4 2014 - 2042 50 1.6 43.0
29.3
Invested to date
Shares -
Loans 10.2
Remaining commitment 19.1
29.3
Interserve’s share of the capital commitments of the joint ventures above amounts to £67.6 million (2013: £26.4 million).
(b) Non-PFI/PPP arrangements:
Share of equity/ sub-debt
% £millionContract description
Haymarket Property development venture in central Edinburgh 50/100 21.3
Rehab Jobfit Employment-related support services to the Department for Work and Pensions 49/n/a -
21.3
Invested to date
Shares -
Loans 17.8
Remaining commitment 3.5
21.3
Interserve’s share of the capital commitments of the joint ventures above amounts to £3.5 million (2013: £7.9 million).

151INTERSERVE ANNUAL REPORT 2014 FINANCIAL STATEMENTS NOTES TO ThE CONSOLIdATEd FINANCIAL STATEMENTS
OVERVIEW
GO
VERNA
NCE
FINA
NCIA
L STATEMEN
TS STRATEG
IC REPORT
33. Reconciliation of non-statutory measures
The Group uses a number of key performance indicators to monitor the performance of its business.
This note reconciles these key performance indicators to individual lines in the financial statements.
(a) Headline pre-tax profit
2014£million
2013 £million
2012£million
Profit before tax 61.9 68.1 179.8
Adjusted for:
Amortisation of acquired intangible assets 24.4 8.8 6.0
Share of associates amortisation of acquired intangible assets 0.1 0.1 0.4
Exceptional items 19.8 4.1 (110.9)
Headline pre-tax profit 106.2 81.1 75.3
(b) Operating cash flow
2014£million
2013 £million
2012£million
Cash generated by operations 10.9 43.2 33.7
Adjusted for:
Pension contributions in excess of income statement charge 18.2 18.5 28.8
Other exceptional items cash impact 18.4 2.1 4.0
Proceeds on disposal of plant and equipment - non-hire fleet 0.9 0.2 1.8
Capital expenditure - non-hire fleet (24.9) (22.1) (10.7)
Operating cash flow 23.5 41.9 57.6
(c) Free cash flow
2014£million
2013 £million
2012£million
Operating cash flow 23.5 41.9 57.6
Adjusted for:
Pension contributions in excess of income statement charge (18.2) (18.5) (28.8)
Taxes paid (10.2) (5.7) (10.7)
Dividends received from associates and joint ventures 17.8 13.7 19.8
Interest received 4.7 3.5 8.4
Interest paid (16.0) (7.8) (9.6)
Effect of foreign exchange rate change 0.8 (1.0) (0.2)
Free cash flow 2.4 26.1 36.5
(d) Operating cash conversion
2014£million
2013 £million
2012£million
Operating cash flow 23.5 41.9 57.6
Operating profit, before exceptional items and amortisation of acquired intangible assets 100.6 69.4 53.0
Full-year operating cash conversion 23.4% 60.4% 108.7%
Three-year rolling operating cash flow 123.0 163.6 165.8
Three-year rolling operating profit, before exceptional items and amortisation of acquired intangible assets 223.0 165.8 137.6
Operating cash conversion, three-year rolling average 55.2% 98.7% 120.5%
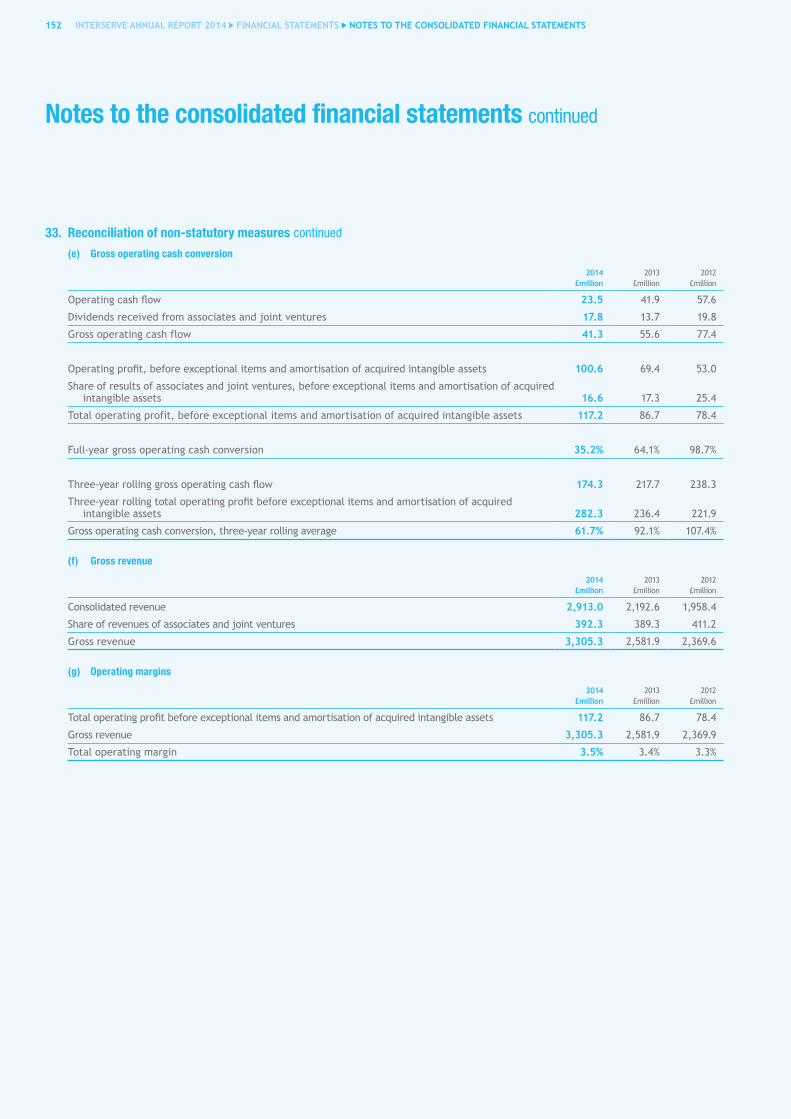
Notes to the consolidated financial statements continued
152 INTERSERVE ANNUAL REPORT 2014 FINANCIAL STATEMENTS NOTES TO ThE CONSOLIdATEd FINANCIAL STATEMENTS
33. Reconciliation of non-statutory measures continued
(e) Gross operating cash conversion
2014£million
2013 £million
2012£million
Operating cash flow 23.5 41.9 57.6
Dividends received from associates and joint ventures 17.8 13.7 19.8
Gross operating cash flow 41.3 55.6 77.4
Operating profit, before exceptional items and amortisation of acquired intangible assets 100.6 69.4 53.0
Share of results of associates and joint ventures, before exceptional items and amortisation of acquired intangible assets 16.6 17.3 25.4
Total operating profit, before exceptional items and amortisation of acquired intangible assets 117.2 86.7 78.4
Full-year gross operating cash conversion 35.2% 64.1% 98.7%
Three-year rolling gross operating cash flow 174.3 217.7 238.3
Three-year rolling total operating profit before exceptional items and amortisation of acquired intangible assets 282.3 236.4 221.9
Gross operating cash conversion, three-year rolling average 61.7% 92.1% 107.4%
(f) Gross revenue
2014£million
2013 £million
2012£million
Consolidated revenue 2,913.0 2,192.6 1,958.4
Share of revenues of associates and joint ventures 392.3 389.3 411.2
Gross revenue 3,305.3 2,581.9 2,369.6
(g) Operating margins
2014£million
2013 £million
2012£million
Total operating profit before exceptional items and amortisation of acquired intangible assets 117.2 86.7 78.4
Gross revenue 3,305.3 2,581.9 2,369.9
Total operating margin 3.5% 3.4% 3.3%
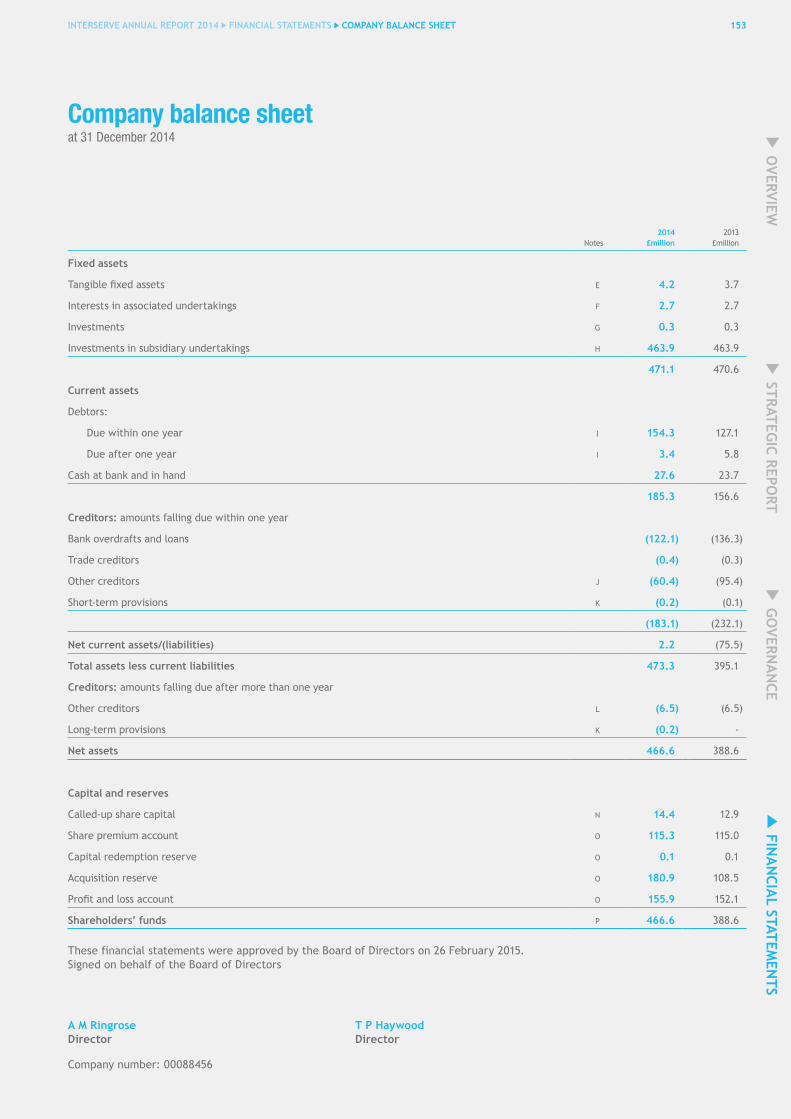
OVERVIEW
GO
VERNA
NCE
FINA
NCIA
L STATEMEN
TS STRATEG
IC REPORT
Company balance sheetat 31 December 2014
153INTERSERVE ANNUAL REPORT 2014 FINANCIAL STATEMENTS COMPANy bALANCE ShEET 153INTERSERVE ANNUAL REPORT 2014 FINANCIAL STATEMENTS COMPANy bALANCE ShEET
OVERVIEW
GO
VERNA
NCE
FINA
NCIA
L STATEMEN
TS STRATEG
IC REPORT
Company balance sheetat 31 December 2014
Notes2014
£million2013
£million
Fixed assets
Tangible fixed assets E 4.2 3.7
Interests in associated undertakings F 2.7 2.7
Investments G 0.3 0.3
Investments in subsidiary undertakings H 463.9 463.9
471.1 470.6
Current assets
Debtors:
Due within one year I 154.3 127.1
Due after one year I 3.4 5.8
Cash at bank and in hand 27.6 23.7
185.3 156.6
Creditors: amounts falling due within one year
Bank overdrafts and loans (122.1) (136.3)
Trade creditors (0.4) (0.3)
Other creditors J (60.4) (95.4)
Short-term provisions K (0.2) (0.1)
(183.1) (232.1)
Net current assets/(liabilities) 2.2 (75.5)
Total assets less current liabilities 473.3 395.1
Creditors: amounts falling due after more than one year
Other creditors L (6.5) (6.5)
Long-term provisions K (0.2) -
Net assets 466.6 388.6
Capital and reserves
Called-up share capital N 14.4 12.9
Share premium account O 115.3 115.0
Capital redemption reserve O 0.1 0.1
Acquisition reserve O 180.9 108.5
Profit and loss account O 155.9 152.1
Shareholders’ funds P 466.6 388.6
These financial statements were approved by the Board of Directors on 26 February 2015. Signed on behalf of the Board of Directors
A M Ringrose T P haywoodDirector Director
Company number: 00088456

Notes to the Company financial statementsfor the year ended 31 December 2014
154 INTERSERVE ANNUAL REPORT 2014 FINANCIAL STATEMENTS NOTES TO ThE COMPANy FINANCIAL STATEMENTS
Notes to the Company financial statementsfor the year ended 31 December 2014
154 INTERSERVE ANNUAL REPORT 2014 FINANCIAL STATEMENTS NOTES TO ThE COMPANy FINANCIAL STATEMENTS
A) Accounting policies
The financial statements have been prepared in accordance with applicable United Kingdom law and accounting standards. The accounting policies have been applied consistently throughout the year and the previous year.
The particular policies adopted by the directors are described below.
Going concern
The directors have made enquiries and have a reasonable expectation that the Company has adequate resources to continue in existence for the foreseeable future. For this reason they continue to adopt the going concern basis in preparing the financial statements.
Basis of accounting
These financial statements have been prepared in accordance with the historical cost convention.
Foreign currency
Transactions denominated in foreign currency are translated at the rates ruling at the dates of the transactions. Monetary assets and liabilities denominated in foreign currencies at the balance sheet date are translated at the rates ruling at that date. These translation differences are dealt with in the profit for the year.
Property, plant and equipment
Tangible fixed assets are carried at cost less any accumulated depreciation and any impairment losses. Depreciation is provided on a straight-line basis at rates ranging between:
Freehold land NilFreehold buildings 2%Leasehold property Over period of leaseComputer hardware 33.3%Computer software 33.3%Furniture and office equipment 33.3%Plant and equipment 10% to 20%
The costs of operating leases are charged to the profit and loss account as they accrue.
Provisions
Provisions are recognised when the Company has a present obligation (legal or constructive) as a result of a past event, it is probable that an outflow of resources embodying economic benefits will be required to settle the obligation and a reliable estimate can be made of the amount of the obligation. Where the Company expects some or all of a provision to be reimbursed, the reimbursement is recognised as a separate asset but only when the reimbursement is virtually certain. The expense relating to any provision is presented in the income statement net of any reimbursement. If the effect of the time value of money is material, provisions are discounted using an appropriate rate that takes into account the risks specific to the liability. Where discounting is used, the increase in the provision due to the passage of time is recognised as a finance cost.
Investments
Investments are stated at cost less provision for any impairment in value.
Pensions
The Company operates a pension scheme for the benefit of permanent members of staff, the Interserve Pension Scheme. This contains defined benefit and defined contribution pension sections. The Company also set up a new defined contribution section of the Interserve Pension Scheme with effect from 1 November 2002. Actuarial valuations of the Interserve Pension Scheme are carried out every three years.
For the purposes of FRS 17 Retirement benefits, the Company is unable to identify its share of the underlying assets and liabilities in the main Group Scheme, the Interserve Pension Scheme, on a consistent and reasonable basis. Therefore, the Company will account for contributions to the scheme as if it were a defined contribution scheme. Note 30 to the Annual Report and Financial Statements of the Group sets out details of the IAS 19 net pension liability of £4.8 million for the Company (2013: £7.7 million).
For defined contribution schemes, the amount recognised in the profit and loss account is equal to the contributions payable to the schemes during the year.
The defined benefit scheme was closed on 31 December 2009 with the exception of passport members. All non-passport members transferred to the defined contribution scheme as at 1 January 2010.
155INTERSERVE ANNUAL REPORT 2014 FINANCIAL STATEMENTS NOTES TO ThE COMPANy FINANCIAL STATEMENTS
OVERVIEW
GO
VERNA
NCE
FINA
NCIA
L STATEMEN
TS STRATEG
IC REPORT
Taxation
Current tax is provided at amounts expected to be paid (or recovered) using the tax rates and laws that have been enacted or substantively enacted by the balance sheet date.
Deferred tax is provided in full on timing differences which result in an obligation at the balance sheet date to pay more tax, or a right to pay less tax, at a future date, at rates expected to apply when they crystallise based on current tax rates and law. Timing differences arise from the inclusion of items of income and expenditure in taxation computations in periods different from those in which they are included in the financial statements. Deferred tax is not provided on timing differences arising from the revaluation of fixed assets where there is no commitment to sell the asset, or on unremitted earnings of subsidiaries or associates where there is no commitment to remit these earnings. Deferred tax assets are recognised to the extent that it is regarded as more likely than not that they will be recovered. Deferred tax assets and liabilities are not discounted.
Financial instruments
DebtorsDebtors are measured at fair value. Appropriate allowances for estimated irrecoverable amounts are recognised in the income statement where there is objective evidence that the asset is impaired.
Cash and cash equivalentsCash and cash equivalents comprise cash on hand, demand deposits and other short-term highly liquid investments that are readily convertible to a known amount of cash and are subject to an insignificant risk of changes in value.
bank borrowingsInterest-bearing bank loans and overdrafts are recorded at the proceeds received, net of direct issue costs. Finance charges, including premiums payable on settlement or redemption and direct issue costs, are accounted for on an accruals basis in the income statement and are added to the carrying amount of the instrument to the extent that they are not settled in the period in which they arise.
CreditorsCreditors are measured at fair value.
Equity instrumentsEquity instruments issued by the Company are recorded at the proceeds received, net of direct issue costs.
Derivative financial instruments and hedge accountingFinancial assets and financial liabilities are recognised on the Group’s balance sheet when the Company becomes a party to the contractual provisions of the instrument. Transactions in derivative financial instruments are for risk management purposes only. The Company uses derivative financial instruments to hedge its exposure to interest rate and foreign currency risk. To the extent that such instruments are matched to underlying assets or liabilities, they are accounted for using hedge accounting. Derivatives are initially recognised at fair value at the date a derivative contract is taken out and subsequently remeasured at fair value at each balance sheet date. Changes in fair value of derivative instruments that are designated as, and effective as, hedges of future cash flows and net investments are recognised directly in the other income statement. Any ineffective portion is recognised immediately in the income statement. Amounts deferred in equity are recycled through the income statement in the same period in which the underlying hedged item is recognised in the income statement. However, when the transaction that is being hedged results in a non-financial asset or non-financial liability, the gains and losses previously accumulated in equity are transferred from equity and included in the initial measurement of the cost of that asset or liability. Hedge accounting is discontinued when the hedging instrument expires or is sold, terminated, or exercised, or no longer qualifies for hedge accounting. Any cumulative gain or loss on the hedging instrument recognised in equity at that time is retained in equity until the forecast transaction occurs. If a hedged transaction is no longer expected to occur, any cumulative gain or loss recognised in equity is transferred to the income statement for the period.
Changes in fair value of derivative instruments that do not qualify for hedge accounting, or have not been designated as hedges, are recognised in the income statement as they arise. These derivative instruments are designated as fair value through the profit or loss. Derivatives embedded in other financial instruments or other host contracts are treated as separate derivatives when their economic risks and characteristics are not closely related to those of the host contracts and the host contracts are not carried at fair value.
Share-based payments The Company has applied the requirements of FRS 20 Share-based payment. In accordance with the transitional provisions, FRS 20 has been applied to all grants of equity instruments after November 2002 that were unvested as at January 2004. The Company issues share-based payments to certain employees of the Group headed by the Company. The fair value determined at the grant date is expensed on a straight-line basis over the vesting period, based on the Company’s estimate of shares that will eventually vest. Fair value for grants pre-2006 was measured by the use of the Black-Scholes model and subsequently a stochastic model was used. Note 29 to the Annual Report and Financial Statements of the Group sets out details of the share-based payments. The total value of equity-settled share-based payments is credited to the profit and loss reserve of the Company. Share-based payments to employees of subsidiaries of the Company are recharged to the relevant employer and the recharged income is credited to the profit and loss account of the Company.

Notes to the Company financial statements continued
156 INTERSERVE ANNUAL REPORT 2014 FINANCIAL STATEMENTS NOTES TO ThE COMPANy FINANCIAL STATEMENTS
A) Accounting policies continued
Exemptions
The Company’s financial statements are included in the Interserve Plc consolidated financial statements for the year ended 31 December 2014. As permitted by section 408 of the Companies Act 2006, the Company has not presented its own profit and loss account. The Company has also taken advantage of the exemption from presenting a cash flow statement under the terms of FRS 1 Cash flow statements. The Company is also exempt under the terms of FRS 8 Related party disclosures from disclosing transactions with other wholly-owned members of the Interserve Group. The Interserve Plc consolidated financial statements for the year ended 31 December 2014 contain financial instrument disclosures which comply with FRS 29 Financial instruments: disclosures. The Company has therefore taken advantage of the exemption in FRS 29 not to present separate financial instrument disclosures for the Company.
B) Profit for the year
Interserve Plc reported a profit after taxation for the financial year ended 31 December 2014 of £33.3 million (2013: 12.1 million).
The auditors’ remuneration for audit services to the Company was £0.2 million (2013: £0.1 million).
C) Employees
The average number of persons employed, being full-time equivalents, by the Company during the year, including directors, was 153 (2013: 130).
The costs incurred in respect of these employees were:
2014£million
2013£million
Wages and salaries 10.9 9.4
Social security costs 1.2 0.8
Share-based payments 2.7 3.0
Pension costs 0.7 0.7
15.5 13.9
2014£million
2013£million
Share-based payments to employees of the Company 2.7 2.8
Share-based payments to employees of subsidiaries 0.7 2.7
Group share-based payment charge 3.4 5.5
Cash settled 0.5 0.6
Equity settled 2.9 4.9
Group share-based payment charge 3.4 5.5
Directors’ remuneration
Detailed disclosures of directors’ aggregated individual remuneration and share-based payments included in the above analysis are given in the audited section of the Directors’ Remuneration Report on pages 90 to 101 and should be regarded as an integral part of this note.
D) Dividends2014
£million2013
£million
Amounts recognised as distributions to equity holders in the period:
Final dividend for the year ended 31 December 2013 of 14.7p (2012: 14.1p) per share 20.8 17.9
Interim dividend for the year ended 31 December 2014 of 7.5p (2013: 6.8p) per share 10.7 8.7
31.5 26.6
Proposed final dividend for the year ended 31 December 2014 of 15.5p per share 22.3
The proposed final dividend is subject to approval by shareholders at the Annual General Meeting and has not been included as a liability in these financial statements.

157INTERSERVE ANNUAL REPORT 2014 FINANCIAL STATEMENTS NOTES TO ThE COMPANy FINANCIAL STATEMENTS
OVERVIEW
GO
VERNA
NCE
FINA
NCIA
L STATEMEN
TS STRATEG
IC REPORT
E) Tangible fixed assets
(a) Movement during the year
Land and buildings£million
Other£million
Total£million
Cost
At 1 January 2014 4.4 4.9 9.3
Additions 1.1 0.4 1.5
Disposals (0.1) - (0.1)
At 31 December 2014 5.4 5.3 10.7
Depreciation
At 1 January 2014 2.2 3.4 5.6
Charge in year 0.1 0.8 0.9
At 31 December 2014 2.3 4.2 6.5
Net book value
At 31 December 2014 3.1 1.1 4.2
At 31 December 2013 2.2 1.5 3.7
(b) Land and buildings
2014£million
2013£million
Net book value of land and buildings
Freehold:
Land at cost 2.0 1.0
Buildings at cost less depreciation - -
2.0 1.0
Leaseholds over 50 years at cost less depreciation 1.1 1.2
Total 3.1 2.2
(c) Operating leases
The Company had annual commitments under non-cancellable operating leases that expire as follows:
Land and buildings Other
2014£million
2013£million
2014£million
2013£million
Within one year - 0.3 0.1 0.1
Within two to five years - - 0.1 0.1
After five years 1.1 1.1 - -
1.1 1.4 0.2 0.2
The majority of leases of land and buildings are subject to rent reviews at periodic intervals of between three and five years.
F) Investment in associate undertakings2014
£million2013
£million
Investment 2.7 2.7

Notes to the Company financial statements continued
158 INTERSERVE ANNUAL REPORT 2014 FINANCIAL STATEMENTS NOTES TO ThE COMPANy FINANCIAL STATEMENTS
G) Investments2014
£million2013
£million
Bonds 0.3 0.3
The Company invested £250,000 in Allia bonds during the year ended 31 December 2013.
H) Investments in subsidiary undertakingsShares at cost
£million
Cost
At 1 January 2014 483.8
Disposals (6.4)
At 31 December 2014 477.4
Provisions
At 1 January 2014 19.9
Disposals (6.4)
At 31 December 2014 13.5
Net book value
At 31 December 2014 463.9
At 31 December 2013 463.9
Details of principal group undertakings are given on pages 161 to 165, which form part of these financial statements.
The Company liquidated Interserve Deutschland GmbH on 4 August 2014.
I) Debtors2014
£million2013
£million
Amounts falling due within one year:
Trade debtors 0.1 0.1
Amounts owed by subsidiary undertakings 143.1 120.6
Corporation tax 8.1 4.2
Prepayments and accrued income 3.0 2.2
154.3 127.1
Amounts falling due after more than one year:
Deferred taxation (note M) 3.4 5.8
3.4 5.8
J) Other creditors2014
£million2013
£million
Amounts owed to subsidiary undertakings 1.1 65.2
Other creditors 51.2 22.0
Accruals and deferred income 8.1 8.2
60.4 95.4

159INTERSERVE ANNUAL REPORT 2014 FINANCIAL STATEMENTS NOTES TO ThE COMPANy FINANCIAL STATEMENTS
OVERVIEW
GO
VERNA
NCE
FINA
NCIA
L STATEMEN
TS STRATEG
IC REPORT
K) Provisions2014
£million2013
£million
At 1 January (0.1) (0.2)
Additions (0.4) -
Provision utilisation 0.1 0.1
At 31 December (0.4) (0.1)
Included in current liabilities (0.2) (0.1)
Included in non-current liabilities (0.2) -
L) Other creditors – amounts falling due after more than one year2014
£million2013
£million
Other creditors 6.5 6.5
M) Deferred taxation asset2014
£million2013
£million
Movement in year
At 1 January 5.8 4.3
Provided in the year - 1.5
Utilised in the year (2.4) -
At 31 December 3.4 5.8
The source of the balance on deferred tax account is as follows:
Accelerated capital allowances - -
Other timing differences 3.4 5.8
At 31 December 3.4 5.8
N) Share capital2014
£million2013
£million
Allotted and fully paid
143,917,617 ordinary shares of 10p each (2013: 129,053,768 ordinary shares of 10p each) 14.4 12.9
Awards were granted during the year as indicated in note 27 to the Annual Report and Financial Statements of the Group.
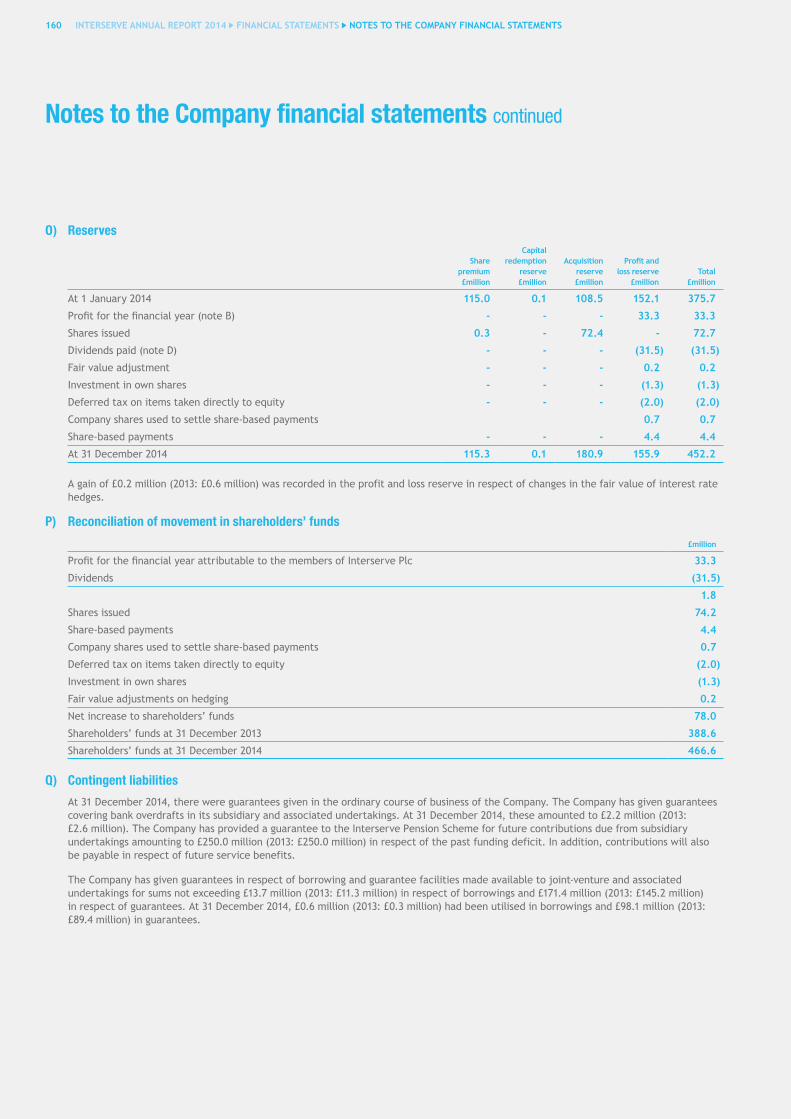
Notes to the Company financial statements continued
160 INTERSERVE ANNUAL REPORT 2014 FINANCIAL STATEMENTS NOTES TO ThE COMPANy FINANCIAL STATEMENTS
O) Reserves
Sharepremium£million
Capitalredemption
reserve£million
Acquisitionreserve£million
Profit andloss reserve
£millionTotal
£million
At 1 January 2014 115.0 0.1 108.5 152.1 375.7
Profit for the financial year (note B) - - - 33.3 33.3
Shares issued 0.3 - 72.4 - 72.7
Dividends paid (note D) - - - (31.5) (31.5)
Fair value adjustment - - - 0.2 0.2
Investment in own shares - - - (1.3) (1.3)
Deferred tax on items taken directly to equity - - - (2.0) (2.0)
Company shares used to settle share-based payments 0.7 0.7
Share-based payments - - - 4.4 4.4
At 31 December 2014 115.3 0.1 180.9 155.9 452.2
A gain of £0.2 million (2013: £0.6 million) was recorded in the profit and loss reserve in respect of changes in the fair value of interest rate hedges.
P) Reconciliation of movement in shareholders’ funds
£million
Profit for the financial year attributable to the members of Interserve Plc 33.3
Dividends (31.5)
1.8
Shares issued 74.2
Share-based payments 4.4
Company shares used to settle share-based payments 0.7
Deferred tax on items taken directly to equity (2.0)
Investment in own shares (1.3)
Fair value adjustments on hedging 0.2
Net increase to shareholders’ funds 78.0
Shareholders’ funds at 31 December 2013 388.6
Shareholders’ funds at 31 December 2014 466.6
Q) Contingent liabilities
At 31 December 2014, there were guarantees given in the ordinary course of business of the Company. The Company has given guarantees covering bank overdrafts in its subsidiary and associated undertakings. At 31 December 2014, these amounted to £2.2 million (2013: £2.6 million). The Company has provided a guarantee to the Interserve Pension Scheme for future contributions due from subsidiary undertakings amounting to £250.0 million (2013: £250.0 million) in respect of the past funding deficit. In addition, contributions will also be payable in respect of future service benefits.
The Company has given guarantees in respect of borrowing and guarantee facilities made available to joint-venture and associated undertakings for sums not exceeding £13.7 million (2013: £11.3 million) in respect of borrowings and £171.4 million (2013: £145.2 million) in respect of guarantees. At 31 December 2014, £0.6 million (2013: £0.3 million) had been utilised in borrowings and £98.1 million (2013: £89.4 million) in guarantees.

161INTERSERVE ANNUAL REPORT 2014 FINANCIAL STATEMENTS PRINCIPAL GROUP UNDERTAKINGS
Principal subsidiaries, associated undertakings, jointly‑controlled entities and jointly‑controlled operations
OVERVIEW
GO
VERNA
NCE
FINA
NCIA
L STATEMEN
TS STRATEG
IC REPORT
The principal subsidiaries, associated undertakings, jointly-controlled entities and jointly-controlled operations of the Group listed below are those that, in the opinion of the directors, principally affect the figures shown in the financial statements as at 31 December 2014. A full list of Group companies will be annexed to the next annual return of Interserve Plc. Except where shown:
(a) the principal operations of each company are conducted in its country of incorporation or registration;
(b) the shareholdings of all subsidiaries relate to ordinary share capital and are equivalent to the percentage of voting rights held by the Group;
(c) the equity capital of all subsidiaries, associated undertakings, jointly-controlled entities and jointly-controlled operations are held by subsidiary undertakings of Interserve Plc;
(d) the accounting reference date is 31 December; and
(e) the consolidated financial statements include the results for the twelve months to 31 December even if the accounting reference date is different.
Principal activities
Country of incorporation or registration
Group holding
(A) Principal subsidiaries
Support Services
Adyard Abu Dhabi LLC Engineering, fabrication works, marine repairs and other related works for the oil and gas industry, both offshore and onshore
United Arab Emirates 100%
ESG Holdings Ltd Provision of education, apprenticeship and skills services
England 100%
First Security (Guards) Ltd1 Provision of a range of security manpower and associated support services
England & Wales 100%
Interserve Catering Services Ltd Provision of catering services England & Wales 100%
Interserve Centro Especial de Empleo, SL Supply of labour for Spanish contracts Spain 100%
Interserve (Defence) Ltd Property and facilities management services to the Ministry of Defence and other clients in the defence sector
England & Wales 100%
Interserve Environmental Services Ltd Provision of asbestos services relating to surveying, record management and removal of asbestos materials
England & Wales 100%
Interserve (Facilities Management) Ltd Facilities management services to a range of clients in the public and private sectors
England & Wales 100%
Interserve (Facilities Services-Slough) Ltd2 3 Provision of comprehensive management and maintenance services to Slough Borough Council
England & Wales 100%
Interservefm Ltd4 Holding company England & Wales 100%
Interserve FS (UK) Ltd Provision of contract cleaning and related services England & Wales 100%
Interserve Healthcare Ltd Provision of healthcare services at home through the delivery of care packages, as well as the supply of nurses and care staff to establishments such as NHS hospital trusts and care homes
England & Wales 100%

162 INTERSERVE ANNUAL REPORT 2014 FINANCIAL STATEMENTS PRINCIPAL GROUP UNDERTAKINGS
Principal subsidiaries, associated undertakings, jointly‑controlled entities and jointly‑controlled operations continued
Principal activities
Country of incorporation or registration
Group holding
(A) Principal subsidiaries continued
Support Services continued
Interserve Industrial Services Ltd Industrial support services, including thermal insulation, access scaffolding, engineering construction and project management
England & Wales 100%
Interserve Integrated Services Ltd Management and provision of support services to industrial, commercial and public sectors
England & Wales 100%
Interserve International Equipment Ltd Rental of plant and machinery used in the construction industry
Mauritius 85%
Interserve Technical Services Ltd Provision of mechanical and electrical engineering services
England & Wales 100%
Interserve Working Futures Ltd Provision of placement, training and development for jobseekers and employers
England & Wales 100%
Knightsbridge Guarding Ltd Provision of manned guarding security services to office buildings
England & Wales 100%
Landmarc Support Services Ltd2 Provision of management services to the Ministry of Defence Army Training Estate
England & Wales 51%
MacLellan International Ltd Facilities management services England & Wales 100%
Modus FM Ltd Maintenance and facilities management services England & Wales 100%
Phoenix Fire Services Ltd Design, supply, installation, maintenance and service of fire suppression and detection systems
England & Wales 100%
Purple Futures LLP5 Operation of probation and rehabilitation services through five CRCs in conjunction with Addaction Social Enterprises Ltd, Shelter, Third Sector Consortia Management LLP and People Potential Possibilities
England & Wales 80%
The Oman Construction Company LLC Contract transport services, pipeline construction and general maintenance services to the oil and gas industry
Sultanate of Oman 85%
Translimp Contract Services, SA Supply of labour for Spanish contracts Spain 100%
Construction
Interserve Construction Ltd Creation of sustainable solutions for the built environment and delivery of these built assets and infrastructure primarily via PFI, frameworks and other long-term customer alliances
England & Wales 100%
Interserve Engineering Services Ltd Design, installation and commissioning of mechanical, electrical and public-health-building engineering services
England & Wales 100%
Paragon Management UK Ltd Fitting out and refurbishment of offices and other buildings
England & Wales 100%
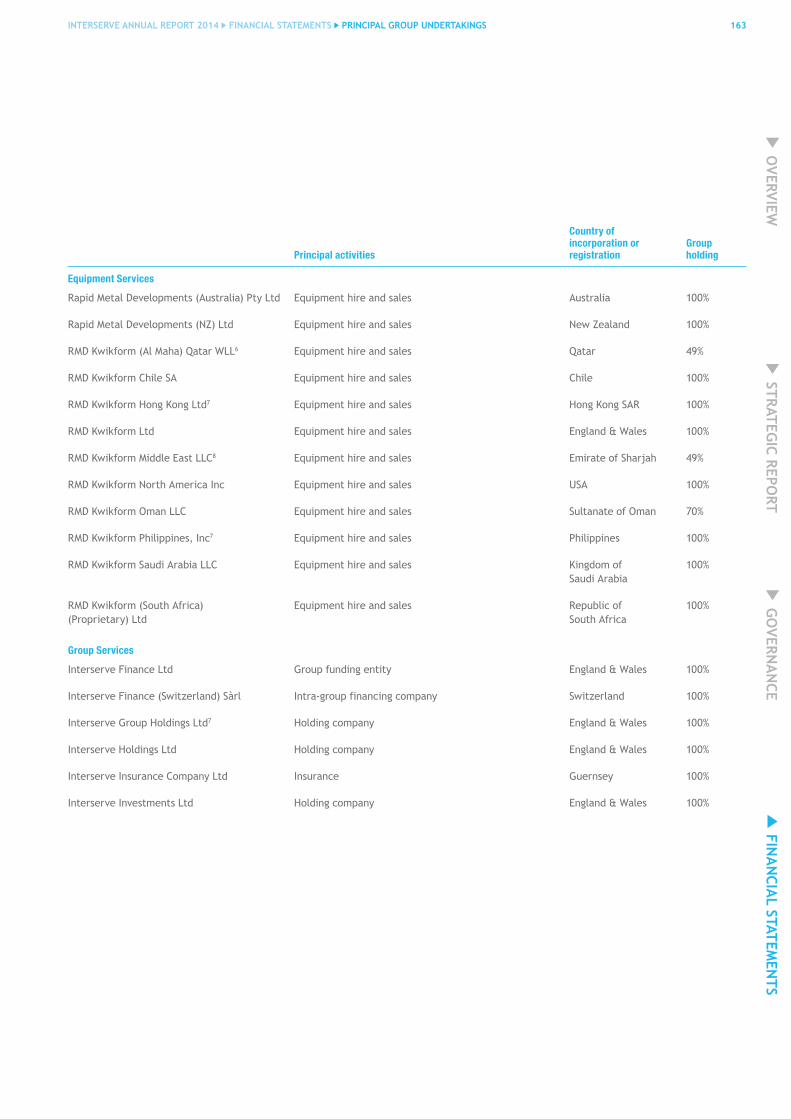
163INTERSERVE ANNUAL REPORT 2014 FINANCIAL STATEMENTS PRINCIPAL GROUP UNDERTAKINGS
OVERVIEW
GO
VERNA
NCE
FINA
NCIA
L STATEMEN
TS STRATEG
IC REPORT
Principal activities
Country of incorporation or registration
Group holding
Equipment Services
Rapid Metal Developments (Australia) Pty Ltd Equipment hire and sales Australia 100%
Rapid Metal Developments (NZ) Ltd Equipment hire and sales New Zealand 100%
RMD Kwikform (Al Maha) Qatar WLL6 Equipment hire and sales Qatar 49%
RMD Kwikform Chile SA Equipment hire and sales Chile 100%
RMD Kwikform Hong Kong Ltd7 Equipment hire and sales Hong Kong SAR 100%
RMD Kwikform Ltd Equipment hire and sales England & Wales 100%
RMD Kwikform Middle East LLC8 Equipment hire and sales Emirate of Sharjah 49%
RMD Kwikform North America Inc Equipment hire and sales USA 100%
RMD Kwikform Oman LLC Equipment hire and sales Sultanate of Oman 70%
RMD Kwikform Philippines, Inc7 Equipment hire and sales Philippines 100%
RMD Kwikform Saudi Arabia LLC Equipment hire and sales Kingdom of Saudi Arabia
100%
RMD Kwikform (South Africa) (Proprietary) Ltd
Equipment hire and sales Republic of South Africa
100%
Group Services
Interserve Finance Ltd Group funding entity England & Wales 100%
Interserve Finance (Switzerland) Sàrl Intra-group financing company Switzerland 100%
Interserve Group Holdings Ltd7 Holding company England & Wales 100%
Interserve Holdings Ltd Holding company England & Wales 100%
Interserve Insurance Company Ltd Insurance Guernsey 100%
Interserve Investments Ltd Holding company England & Wales 100%

164 INTERSERVE ANNUAL REPORT 2014 FINANCIAL STATEMENTS PRINCIPAL GROUP UNDERTAKINGS
Principal subsidiaries, associated undertakings, jointly‑controlled entities and jointly‑controlled operations continued
Principal activities
Country of incorporation or registration
Issued share capital
Group holding
(B) Associated undertakings
Support Services
Khansaheb Group LLC Facilities management and maintenance services
United Arab Emirates
3,000 shares of 1,000 UAE Dirhams
49%
Madina Group WLL Fabrication, engineering and maintenance solutions for the oil, gas and petrochemical industries, both on and off shore
Qatar 1,000 shares of 1,000 Qatari Riyals
49%
Construction
Douglas OHI LLC Civil engineering and building Sultanate of Oman 100,000 shares of 10 Omani Rials
49%
Gulf Contracting Co WLL Civil engineering, building and maintenance services
Qatar 1,000 shares of 1,000 Qatari Riyals
49%
How United Services WLL Installation, testing and commissioning of building services; maintenance and facilities services
Qatar 9,000 shares of 1,000 Qatari Riyals
49%
Khansaheb Civil Engineering LLC Civil engineering, building and maintenance services
United Arab Emirates
11,000 shares of 1,000 UAE Dirhams
45%
Khansaheb Hussain LLC Civil engineering, building and maintenance services
United Arab Emirates
1,000 shares of 1,000 UAE Dirhams
49%
Principal activitiesAddress of principal place(s) of business
Group holding
(C) Jointly-controlled entities
Jointly-controlled entities are where strategic and operating decisions of an incorporated joint venture require unanimous consent of the parties sharing control.
Support Services
PriDE (SERP) Ltd2 Estate management services under the Ministry of Defence South East Regional Prime Contract
Aldershot, Hampshire, England 50%
Rehab Jobfit LLP Employment-related support services to the Department for Work and Pensions
Twyford, Reading, England 49%
Sussex Estates and Facilities LLP9 Provision of facilities management services to the University of Sussex
Falmer, East Sussex, England 35%
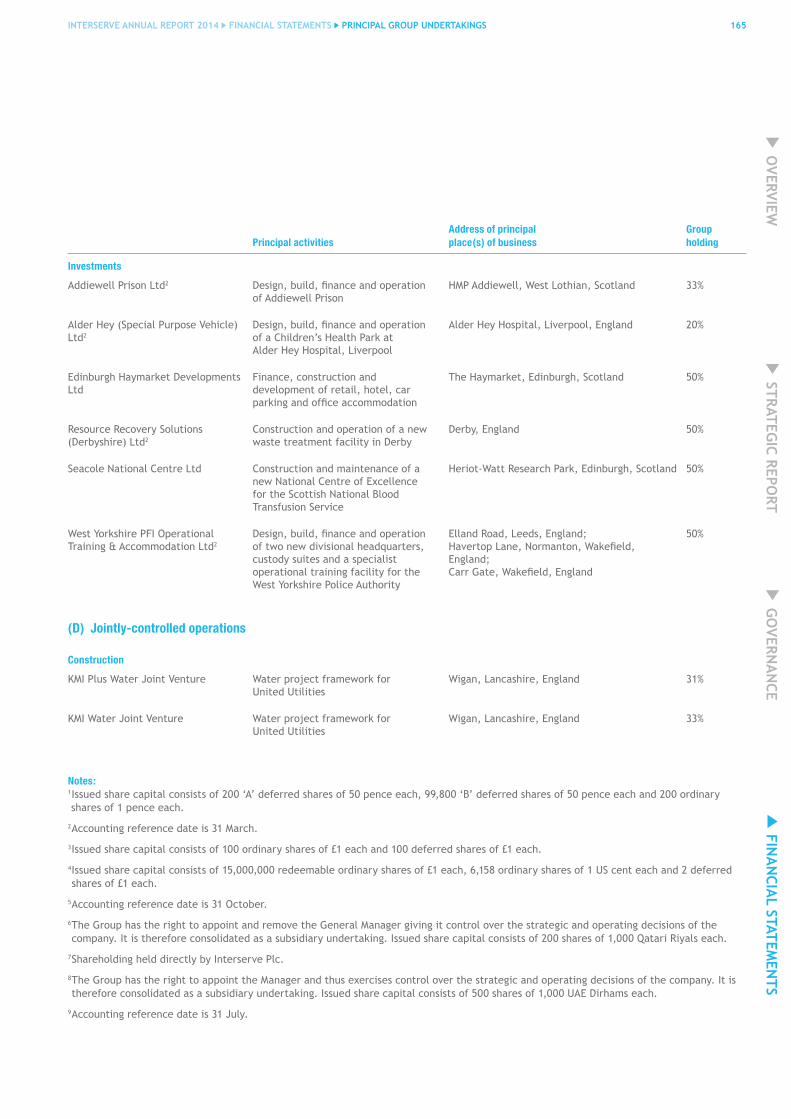
165INTERSERVE ANNUAL REPORT 2014 FINANCIAL STATEMENTS PRINCIPAL GROUP UNDERTAKINGS
OVERVIEW
GO
VERNA
NCE
FINA
NCIA
L STATEMEN
TS STRATEG
IC REPORT
Principal activitiesAddress of principal place(s) of business
Group holding
Investments
Addiewell Prison Ltd2 Design, build, finance and operation of Addiewell Prison
HMP Addiewell, West Lothian, Scotland 33%
Alder Hey (Special Purpose Vehicle) Ltd2
Design, build, finance and operation of a Children’s Health Park at Alder Hey Hospital, Liverpool
Alder Hey Hospital, Liverpool, England 20%
Edinburgh Haymarket Developments Ltd
Finance, construction and development of retail, hotel, car parking and office accommodation
The Haymarket, Edinburgh, Scotland 50%
Resource Recovery Solutions (Derbyshire) Ltd2
Construction and operation of a new waste treatment facility in Derby
Derby, England 50%
Seacole National Centre Ltd Construction and maintenance of a new National Centre of Excellence for the Scottish National Blood Transfusion Service
Heriot-Watt Research Park, Edinburgh, Scotland 50%
West Yorkshire PFI Operational Training & Accommodation Ltd2
Design, build, finance and operation of two new divisional headquarters, custody suites and a specialist operational training facility for the West Yorkshire Police Authority
Elland Road, Leeds, England;Havertop Lane, Normanton, Wakefield, England;Carr Gate, Wakefield, England
50%
(D) Jointly-controlled operations
Construction
KMI Plus Water Joint Venture Water project framework for United Utilities
Wigan, Lancashire, England 31%
KMI Water Joint Venture Water project framework for United Utilities
Wigan, Lancashire, England 33%
Notes:1 Issued share capital consists of 200 ‘A’ deferred shares of 50 pence each, 99,800 ‘B’ deferred shares of 50 pence each and 200 ordinary shares of 1 pence each.
2 Accounting reference date is 31 March.
3 Issued share capital consists of 100 ordinary shares of £1 each and 100 deferred shares of £1 each.
4 Issued share capital consists of 15,000,000 redeemable ordinary shares of £1 each, 6,158 ordinary shares of 1 US cent each and 2 deferred shares of £1 each.
5 Accounting reference date is 31 October.
6 The Group has the right to appoint and remove the General Manager giving it control over the strategic and operating decisions of the company. It is therefore consolidated as a subsidiary undertaking. Issued share capital consists of 200 shares of 1,000 Qatari Riyals each.
7 Shareholding held directly by Interserve Plc.
8 The Group has the right to appoint the Manager and thus exercises control over the strategic and operating decisions of the company. It is therefore consolidated as a subsidiary undertaking. Issued share capital consists of 500 shares of 1,000 UAE Dirhams each.
9 Accounting reference date is 31 July.

166 INTERSERVE ANNUAL REPORT 2014 FINANCIAL STATEMENTS FIVE-YEAR ANALYSIS
Five-year analysis (unaudited)
2014 £million
2013 £million
2012 £million
2011 £million
2010 £million
Revenue including share of associates and joint venturesSupport Services - UK 1,786.0 1,292.5 1,215.4 1,069.6 1,098.7 Support Services - International 157.2 100.5 31.3 25.9 23.7
Support Services 1,943.2 1,393.0 1,246.7 1,095.5 1,122.4
Construction - UK 970.7 802.2 737.2 731.1 754.3 Construction - International 207.9 215.9 201.6 223.7 239.2
Construction 1,178.6 1,018.1 938.8 954.8 993.5
Equipment Services 195.5 169.6 167.5 154.3 139.9 Investments 38.6 34.5 81.0 160.2 106.6 Group Services 8.1 7.1 - - - Inter-segment elimination (58.7) (40.4) (64.4) (45.2) (47.0)
3,305.3 2,581.9 2,369.6 2,319.6 2,315.4
Consolidated revenueSupport Services - UK 1,679.9 1,196.6 1,118.1 1,007.3 1,024.8 Support Services - International 117.5 57.5 - - -
Support Services 1,797.4 1,254.1 1,118.1 1,007.3 1,024.8
Construction - UK 970.7 802.2 737.2 731.1 754.3 Construction - International - - - - -
Construction 970.7 802.2 737.2 731.1 754.3
Equipment Services 195.5 169.6 167.5 154.3 139.9 Group Services 8.1 7.1 - - - Inter-segment elimination (58.7) (40.4) (64.4) (45.2) (47.0)
2,913.0 2,192.6 1,958.4 1,847.5 1,872.0
Headline profitSupport Services - UK 81.4 56.0 44.3 36.4 25.1 Support Services - International 7.4 4.1 3.7 3.6 3.4
Support Services 88.8 60.1 48.0 40.0 28.5
Construction - UK 15.4 14.7 14.6 18.0 24.5 Construction - International 10.8 13.1 14.3 16.6 22.8
Construction 26.2 27.8 28.9 34.6 47.3
Equipment Services 26.6 20.1 16.0 13.6 14.4 Investments 0.8 0.8 6.6 6.0 4.2 Group Services (25.2) (22.1) (21.1) (22.9) (22.2)
Total operating profit 117.2 86.7 78.4 71.3 72.2
Investment revenue 5.0 3.6 8.4 5.7 3.8
Finance costs (16.0) (9.2) (11.5) (9.7) (10.8)
106.2 81.1 75.3 67.3 65.2
Earnings per share, penceBasic EPS 32.2 39.1 130.0 42.7 37.0 Headline EPS 58.8 47.7 45.3 46.1 40.3
Dividend per share, penceInterim 7.5 6.8 6.4 6.0 5.6 Final 15.5 14.7 14.1 13.0 12.4
FIVE-YEAR ANALYSIS

167167INTERSERVE ANNUAL REPORT 2014 FINANCIAL STATEMENTS FIVE-YEAR ANALYSIS
OVERVIEW
GO
VERNA
NCE
FINA
NCIA
L STATEMEN
TS STRATEG
IC REPORT
2014 £million
2013 £million
2012 £million
2011 £million
2010 £million
Balance sheetIntangible assets 524.5 286.6 265.8 221.2 228.3 Property, plant and equipment 195.3 155.9 137.8 139.7 149.0 Interests in joint ventures 42.7 20.6 7.6 103.3 60.1 Interests in associated undertakings 77.2 73.9 76.6 77.2 61.7 Deferred tax asset - 21.0 33.5 23.4 16.5
Non-current assets 839.7 558.0 521.3 564.8 515.6
Assets held for sale - - 51.2 - - Inventories 48.6 30.7 24.6 22.2 19.6 Trade and other receivables 679.4 486.1 432.0 380.1 386.1 Cash and deposits 82.1 79.7 76.8 46.1 67.6
Bank overdrafts and loans (5.5) (27.4) (19.8) (19.3) (35.2)Trade and other payables (749.7) (597.6) (559.7) (498.6) (496.7)Short-term provisions (29.2) (18.1) (24.2) (28.7) (20.2)
Net current assets/(liabilities) 25.7 (46.6) (19.1) (98.2) (78.8)
Bank loans (344.7) (90.0) (30.0) (70.0) (85.0)Trade and other payables (14.8) (13.5) (13.2) (13.3) (15.8)Long-term provisions (19.5) (29.9) (27.1) (26.3) (26.9)Deferred tax liability (2.0) - - - -Retirement benefit obligation (4.8) (7.7) (101.1) (56.2) (51.5)
Non-current liablilites (385.8) (141.1) (171.4) (165.8) (179.2)
Net assets 479.6 370.3 330.8 300.8 257.6
Cash flowOperating cash flows before movements in working capital 94.5 74.7 39.5 35.6 31.6 Movement in working capital (53.3) (19.7) 0.2 9.5 (21.5)Changes in hire fleet (30.3) (11.8) (6.0) 3.0 15.1 Taxes paid (10.2) (5.7) (10.7) (3.2) (6.3)
Net cash from operating activities 0.7 37.5 23.0 44.9 18.9
Acquisitions and investments (253.8) (59.9) 63.0 (19.3) (32.6)Net capital expenditure - non-hire fleet (24.0) (21.9) (8.9) (8.5) (5.6)Dividends from joint ventures and associates 17.8 13.7 19.8 20.6 32.1 Interest received 4.7 3.5 8.4 4.4 3.8
Net cash used in investing activities (255.3) (64.6) 82.3 (2.8) (2.3)
Interest paid (16.0) (7.8) (9.6) (6.7) (6.4)Dividends paid (34.4) (29.1) (27.0) (25.5) (24.8)Other (including share issues) 73.9 0.6 1.5 - (2.2)
Net cash used in financing activities excluding debt 23.5 (36.3) (35.1) (32.2) (33.4)
Effect of foreign exchange 0.8 (1.0) (0.2) (0.3) 0.3
Movement in net debt (230.3) (64.4) 70.0 9.6 (16.5)
Closing net cash/(debt) (268.9) (38.6) 25.8 (44.2) (53.8)
FIVE-YEAR ANALYSIS

168 INTERSERVE ANNUAL REPORT 2014 FINANCIAL STATEMENTS SHAREHOLDER INFORMATION
Shareholder information
Financial calendar 2015Final results announcement for the year ended 31 December 2014 26 February 2015Publication of Annual Report and Financial Statements 30 March 2015Annual General Meeting 12 May 2015Final dividend payable (record date 7 April 2015) 20 May 2015Half-year results announcement for the six months ended 30 June 2015 12 August 2015Publication of Half-Year Report Late August 2015Interim dividend payable October 2015
The Company will keep under review the appropriateness of issuing other trading updates to the market during the course of the year.
Share price
As at 31 December 2014 557.5pLowest for the year ended 31 December 2014 531.5pHighest for year ended 31 December 2014 745.0p
The current price of the Company’s shares is available on the Company’s website at www.interserve.com.
Analysis of registered shareholdingsHolders Shares
Number % Number %
Notifiable interests 3 0.07 36,479,931 25.35Banks, institutions and nominees 1,197 26.54 98,527,021 68.46Private shareholders 3,309 73.39 8,910,665 6.19Total as at 26 February 2015 4,509 100.00 143,917,617 100.00
Shareholder services
Capita is our registrar and they offer many services to make managing your shareholding easier and more efficient:
(a) Share Portal
The Share Portal is a secure online site where you can manage your shareholding quickly and easily. You can:
• View your holding and get an indicative valuation• Change your address• Elect to receive shareholder communications by email rather than by post• View your dividend payment history• Make dividend payment choices• Register your proxy voting instruction
Just visit www.capitashareportal.com. All you need is your investor code, which can be found on your share certificate or your dividend tax voucher.
(b) Customer Support Centre
Alternatively, you can contact Capita’s Customer Support Centre which is available to answer any queries you have in relation to your shareholding:
By email: [email protected] phone: +44 (0)20 8639 3399 (lines are open 9.00am to 5.30pm, Monday to Friday)By post: Shareholder Administration, Capita Asset Services, The Registry, 34 Beckenham Road, Beckenham, Kent BR3 4TU

169169INTERSERVE ANNUAL REPORT 2014 FINANCIAL STATEMENTS SHAREHOLDER INFORMATION
OVERVIEW
GO
VERNA
NCE
FINA
NCIA
L STATEMEN
TS STRATEG
IC REPORT
(c) Sign up to electronic communications
By signing up to receive your shareholder communications by email, you will help us to save paper and receive your shareholder information quickly and securely. Registering for electronic communications is very straightforward. Just visit www.capitashareportal.com. All you need is your investor code, which can be found on your share certificate or your dividend tax voucher.
(d) Dividend payment options
• Re-invest your dividends Capita’s Dividend Re-investment Plan is a convenient way to build up your shareholding by using your cash dividends to purchase additional shares. The plan is provided by Capita IRG Trustees Limited which is authorised and regulated by the Financial Conduct Authority. For more information and an application pack please call +44 (0)20 8639 3402 (lines are open from 9am to 5.30pm, Monday to Friday). Alternatively you can email [email protected] or log on to www.capitashareportal.com (click on ‘Reinvest your dividends’ and follow the onscreen instructions).
The value of shares and income from them can fall as well as rise and you may not recover the amount of money you invest. Past performance should not be seen as indicative of future performance. This arrangement should be considered as part of a diversified portfolio.
• Elect to have your dividends paid direct into your bank account This means that:
• your dividend reaches your bank account on the payment date;• it is more secure – cheques can sometimes get lost in the post; and• you don’t have the inconvenience of depositing a cheque and waiting for it to clear.
You can sign up for this service by logging on to www.capitashareportal.com (click on ‘Dividends’ and follow the onscreen instructions) or by contacting the Customer Support Centre.
• Choose to receive your next dividend in your local currency Capita has partnered with Deutsche Bank to provide you with a service that will convert your sterling dividends into your local currency at a competitive rate. You can choose to receive payment directly into your bank account, or alternatively, you can be sent a currency draft. For further information contact Capita on +44 (0)20 8639 3405 (lines are open 9.00am to 5.30pm, Monday to Friday) or by email – [email protected].
(e) Buy and sell shares
A quick and easy way to buy and sell shares is provided by Capita Asset Services. There is no need to pre-register and there are no complicated application forms to fill in. You can also access a wealth of stock market news and information free of charge. For further information on this service, or to buy and sell shares, visit www.capitadeal.com or call +44 (0)20 3367 2686 (lines are open 8.00am to 4.30pm, Monday to Friday).
This is not a recommendation to buy and sell shares and this service may not be suitable for all shareholders. The price of shares can go down as well as up and you are not guaranteed to get back the amount you originally invested. Terms, conditions and risks apply. Capita Asset Services is a trading name of Capita IRG Trustees Limited which is authorised and regulated by the Financial Conduct Authority. This service is only available to private shareholders resident in the EEA, the Channel Islands and the Isle of Man.
Share registration and associated services are provided by Capita Registrars Limited (registered in England, No.2605568). Regulated services are provided by Capita IRG Trustees Limited (registered in England, No.2729260). The registered office of each of these companies is The Registry, 34 Beckenham Road, Beckenham, Kent BR3 4TU.
Donate your shares to charity
If you have only a small number of shares which are uneconomical to sell, you may wish to donate them to charity free of charge through ShareGift (Registered Charity 1052686). Find out more at www.sharegift.org.uk or by telephoning +44 (0)20 7930 3737.

170 INTERSERVE ANNUAL REPORT 2014 FINANCIAL STATEMENTS SHAREHOLDER INFORMATION
Shareholder information
Beneficial owners of shares with ‘‘information rights’’
Please note that beneficial owners of shares who have been nominated by the registered holder of those shares to receive information rights under section 146 of the Companies Act 2006 are required to direct all communications to the registered holder of their shares rather than to the Company’s Registrar, Capita Asset Services, or to the Company directly.
Capital gains tax/capitalisation changes
The market value of the Company’s shares as at 31 March 1982 for the purpose of capital gains tax was 16.67p per share. This has been adjusted to take account of all capitalisation changes to 26 February 2015, as indicated below, other than the rights issue in 1986 (one new share for every three existing shares at 140p per share).
22 June 1982 - sub-division of each £1 share into four shares of 25p; bonus issue of two new 25p shares for each £1 share held;
10 June 1983 - bonus issue of one new share of 25p for every four shares held; and
31 October 1997 - share split of five new 10p shares for every two 25p shares held.
Beware of share fraud
in recent years many companies have become aware that their shareholders have received unsolicited telephone calls or correspondence concerning investment matters. These are typically from overseas-based ‘‘brokers’’ who target UK shareholders offering to sell them what often turn out to be worthless or high-risk shares in US or UK investments. These operations are commonly known as “boiler rooms”. The “brokers” can be very persistent and extremely persuasive. Shareholders are advised to be very wary of any unsolicited advice, offers to buy shares at a discount or offers of free reports into the Company.
You can find out more information on how share fraud works and how to avoid it on the Financial Conduct Authority website at www.fca.org.uk/scams. You can also call the FCA Consumer Helpline on 0800 111 6768.
Details of all share dealing facilities that the Company endorses are detailed above.
Please note that any electronic address provided in this document to communicate with the Company may not be used for any purpose other than that expressly stated.

171171
OVERVIEW
GO
VERNA
NCE
FINA
NCIA
L STATEMEN
TS STRATEG
IC REPORT
INTERSERVE ANNUAL REPORT 2014 FINANCIAL STATEMENTS NOTES
Notes

172 INTERSERVE ANNUAL REPORT 2014 FINANCIAL STATEMENTS NOTES
NotesNotes

Achieve sustainable growth
Create places that benefit peopleO
UTC
OM
ES
Build more skills and more opportunities
Deliver public service in the public interest
Generate a positive environmental impact
REC
ENT
WO
RK
HO
W W
E D
O IT
READ THE STORY ON PAGE READ THE STORY ON PAGE READ THE STORY ON PAGE READ THE STORY ON PAGE READ THE STORY ON PAGE34
04 06 08 10
26 22 25 29
OU
R VA
LUES
OU
R V
ISIO
N
DELIVERING SHAREHOLDER VALUE
SOCIAL VALUE MAPPING DLR CONTRACT ADDS TO TRANSPORT SECTOR GROWTH
BUILDING QATAR’S BIGGEST MALL AT DOHA FESTIVAL CITY
PARAGON FITS OUT MARKEL’S ‘WALKIE TALKIE’ LONDON OFFICE
BUILDING ADVANCED MEDICAL AND TESTING FACILITIES
OUR BUSINESS MODEL
READ MORE ON PAGE
OPERATIONS AT A GLANCE
READ MORE ON PAGE
OUR MODEL IN ACTION
READ MORE ON PAGE
PROTECTING OUR BUSINESS
READ MORE ON PAGE
WHERE WE OPERATE
READ MORE ON PAGE
OUR STRATEGY
READ MORE ON PAGE
• TAKE PRIDE IN WHAT YOU DO • EVERYONE HAS A VOICE • DO THE RIGHT THING• BRING BETTER TO LIFE
TO REDEFINE THE FUTURE FOR PEOPLE AND PLACES
INTERSERVE ANNUAL REPORT 2014 OVERVIEW DELIVERING SHAREHOLDER VALUE
12 14
COMMUNITY CENTRE
This Annual Report was printed in the UK by CPI Colour Limited, using vegetable based inks. The printer and paper mill are accredited with ISO 14001 Environmental management Systems and are Forest Stewardship Council chain-of-custody registered. ®
The paper is 100% recycled, produced from de-inked post consumer waste. The silk laminate used on the outer cover is bio-degradable. www.accruefulton.com
Designed and produced by
10339 INT – AR14 0 Cover AW01 tp.indd 2 20/03/2015 13:41

ANNUAL REPORT 2014
ingenuity at work
REGISTERED OFFICE
Interserve Plc Interserve House Ruscombe Park Twyford
Reading Berkshire RG10 9JU
T. +44 (0)118 932 0123 F. +44 (0)118 932 0206
www.interserve.com
Interserve Plc A
NN
UA
L REPO
RT 2014
INTERSERVE ANNUAL REPORT 2014 OVERVIEW 2014 IN SUMMARY
CONTENTS
FINANCIAL STATEMENTSINDEPENDENT AUDITORS’ REPORT 103
CONSOLIDATED FINANCIAL STATEMENTS 108
NOTES TO THE CONSOLIDATED FINANCIAL STATEMENTS
114
COMPANY FINANCIAL STATEMENTS 153
NOTES TO THE COMPANY FINANCIAL STATEMENTS
154
PRINCIPAL GROUP UNDERTAKINGS 161
FIVE-YEAR ANALYSIS 166
SHAREHOLDER INFORMATION 168
GOVERNANCEDIRECTORS 48
ADVISERS 51
DIRECTORS’ REPORT 52
CORPORATE GOVERNANCE 60
AUDIT COMMITTEE REPORT 68
DIRECTORS’ REMUNERATION REPORT 74
DIRECTORS’ RESPONSIBILITY STATEMENT 102
STRATEGIC REPORTOUR STRATEGY 04
OPERATIONS AT A GLANCE 06
OUR BUSINESS MODEL 08
OUR MODEL IN ACTION 10
WHERE WE OPERATE 12
PROTECTING OUR BUSINESS 14
PERFORMANCE 18
OPERATIONAL REVIEW 20
PRINCIPAL RISKS AND UNCERTAINTIES 30
SUSTAINABILITY REVIEW 32
FINANCIAL REVIEW 42
OVERVIEW HIGHLIGHTS 01
DELIVERING SHAREHOLDER VALUE 01
CHAIRMAN’S STATEMENT 02
“ 2014 WAS A LANDMARK YEAR FOR THE BUSINESS IN WHICH WE ADVANCED OUR STRATEGY AND DELIVERED 35 PER CENT OPERATING PROFIT GROWTH DESPITE CHALLENGING CONDITIONS IN MANY OF OUR MARKETS. WE MADE TWO STRATEGIC ACQUISITIONS (INITIAL FACILITIES AND ESG), EACH OF WHICH DEEPENED OUR PRESENCE IN CORE OUTSOURCING MARKETS. OUR FOCUS ON PROVIDING HIGH QUALITY SERVICES TO BOTH NEW AND EXISTING CLIENTS RESULTED IN STRONG WORK WINNING DURING THE YEAR, WITH OUR FUTURE WORKLOAD RISING 26 PER CENT TO £8.1 BILLION.”
INTRODUCTION
ADRIAN RINGROSE CHIEF EXECUTIVE
FOR FURTHER INVESTOR INFORMATION: www.interserve.com/investors
2014 IN SUMMARY
OVERVIEW
10339 INT – AR14 0 Cover AW01 tp.indd 1 19/03/2015 16:31


