18
Health Plan Satisfaction Drivers Key Insights from Our 2014 Australian Health Insurance Plan Satisfaction Research Prepared for XXX Australia 0
| Date post: | 08-Aug-2015 |
| Category: |
Healthcare |
| Upload: | john-gregg |
| View: | 9 times |
| Download: | 0 times |

Health Plan Satisfaction Drivers
Key Insights from Our 2014 Australian Health Insurance Plan Satisfaction Research
Prepared for XXX Australia
0

1
We specifically evaluate three of the “overall rating” questions
individually to look for weaknesses in a particular demographic
subgroup:
1. Overall satisfaction with primary care physician
2. Overall satisfaction with health care provided
3. Overall satisfaction with health plan
2
• Attributable effects is an established and valid statistical technique that provides
readily understandable and actionable results.
• Attributable effects analysis identifies two types of drivers of satisfaction.
Maintenance (or risk drivers): the percentage of those rating the plan favorably
who are at risk of changing their opinion if the associated product characteristic
were perceived poorly.
Potential (or opportunity drivers): the percentage of those currently not rating
the plan favorably that would change their rating if the associated characteristics
were perceived positively. For this analysis, we focus on these potential attributes.
Attributable Effects

3
A special type of attribute is called a Foundational Factor.
Foundational factors are attributes that do not provide much potential or opportunity
but they impose a large risk, or downside potential.
These attributes are considered a core or foundation attribute which consumers
“expect” as part of the services they receive. Special attention should be given to
foundational factors.
They represent a consumer requirement of care.
Attributable Effects

4
Attributable Effects Analysis
Focuses on differences in product or service perceptions between those who like the product
and those who do not for each product.
Is performed one product at a time
Is performed on micro- or respondent-level data
Provides two primary statistics--Maintenance and Potential effects which measure each
characteristic’s impact on acceptance.
Maintenance and Potential effects are expressed as percentages and are therefore easy to
interpret.
Attributable Effects
5
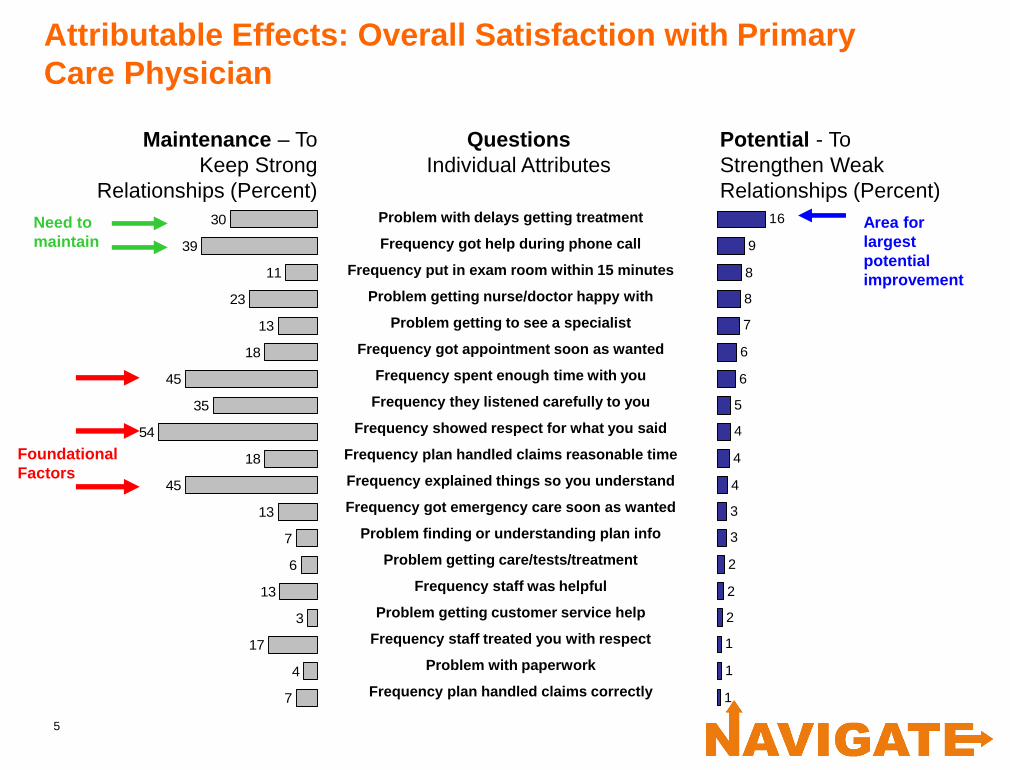
Attributable Effects: Overall Satisfaction with Primary
Care Physician
30
39
11
23
13
18
45
35
54
18
45
13
7
6
13
3
17
4
7
Problem with delays getting treatment
Frequency got help during phone call
Frequency put in exam room within 15 minutes
Problem getting nurse/doctor happy with
Problem getting to see a specialist
Frequency got appointment soon as wanted
Frequency spent enough time with you
Frequency they listened carefully to you
Frequency showed respect for what you said
Frequency plan handled claims reasonable time
Frequency explained things so you understand
Frequency got emergency care soon as wanted
Problem finding or understanding plan info
Problem getting care/tests/treatment
Frequency staff was helpful
Problem getting customer service help
Frequency staff treated you with respect
Problem with paperwork
Frequency plan handled claims correctly
16
9
8
8
7
6
6
5
4
4
4
3
3
2
2
2
1
1
1
Area for
largest
potential
improvement
Maintenance – To
Keep Strong
Relationships (Percent)
Potential - To
Strengthen Weak
Relationships (Percent)
Need to
maintain
Foundational
Factors
Questions
Individual Attributes

6
Attributable Effects: Overall Satisfaction with Primary Care
Physician
30
39
11
23
13
18
Problem with delays getting
treatment
Frequency got help during phone call
Frequency put in exam room within
15 minutes
Problem getting nurse/doctor happy
with
Problem getting to see a specialist
Frequency got appointment soon as
wanted
16
9
8
8
7
6
Area for
largest
potential
improvement
Maintenance – To
Keep Strong
Relationships (Percent)
Potential - To
Strengthen Weak
Relationships (Percent)
Need to
maintain
Questions
Individual Attributes

7
Attributable Effects: Overall Satisfaction with Primary
Care Physician
45
35
54
18
45
Frequency spent enough time with
you
Frequency they listened carefully to
you
Frequency showed respect for what
you said
Frequency plan handled claims
reasonable time
Frequency explained things so you
understand
6
5
4
4
4
Maintenance – To
Keep Strong
Relationships (Percent)
Potential - To
Strengthen Weak
Relationships (Percent)
Foundational
Factors
Questions
Individual Attributes

8
Graphical Modeling
Graphical Modeling
•Uses correlations between variables to create a structure which shows
how predictors inter-relate amongst themselves and then to some
dependent measure.
•The resulting graph shows the direct and indirect effect of predictor
variables on each other and on the dependent measure.

9
Graphical Modeling: Overall Satisfaction with Primary
Care Physician
Relationship
with personal
doctor
Access to
needed
care
Spent
enough
time with
you
Explained things
in a way you
could understand
Listened carefully
to you
Showed respect
for what you had
to say
Problem getting
needed care
Problem with
delays getting
treatment
Commercial Adults

10
Graphical Modeling: Overall Satisfaction with Primary
Care Physician
Relationship
with
personal
doctor Access to
needed care
Spent
enough time
with you
Explained things in
a way you could
understand
Listened carefully
to you
Showed respect for
what you had to say
Problem getting
needed care
Problem with delays
getting treatment
• Path to Building a Strong Relationship -
• Relationship Model:
• Displays connections among attributes and relationship to the provider rating.
• Reveals causal flow
• Two main branches of attributes influence the strength of relationship with the provider:
• 1. physician’s “bedside manner” and 2. access to needed care.
• The graphical model in its simplest form, shows how attributes are related in their influence
on the strength of relationship with the provider.
11
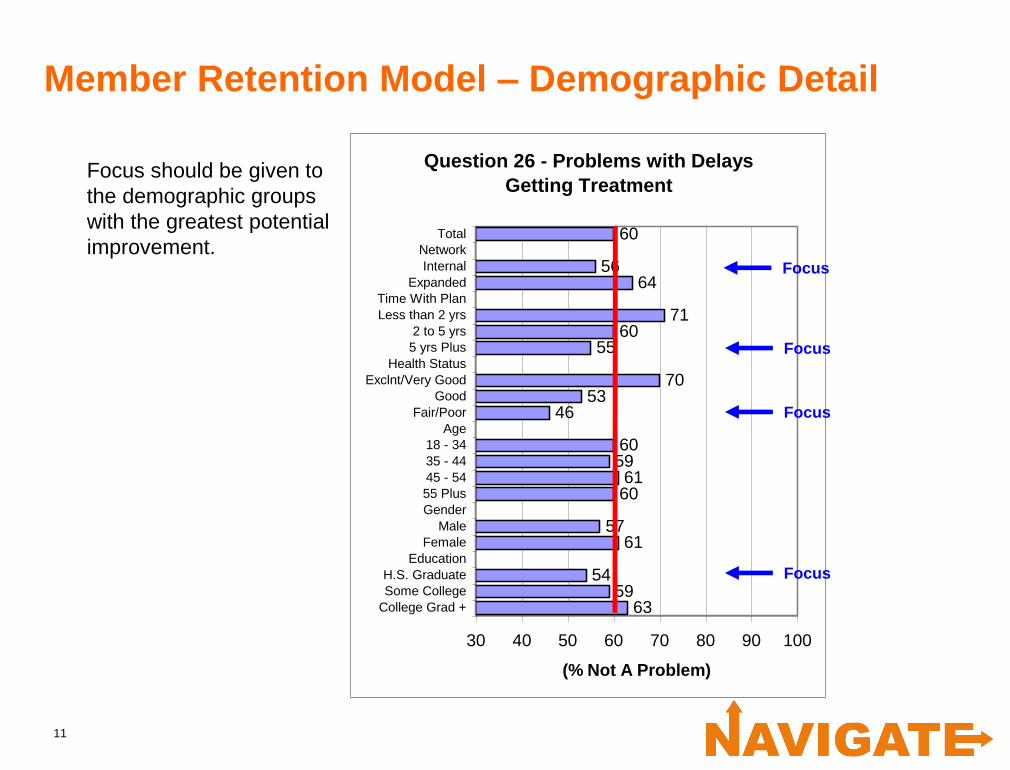
Member Retention Model – Demographic Detail
• Focus should be given to
the demographic groups
with the greatest potential
improvement.
•
College Grad +
Some College
H.S. Graduate
Education
Female
Male
Gender
55 Plus
45 - 54
35 - 44
18 - 34
Age
Fair/Poor
Good
Exclnt/Very Good
Health Status
5 yrs Plus
2 to 5 yrs
Less than 2 yrs
Time With Plan
Expanded
Internal
Network
Total
Question 26 - Problems with Delays
Getting Treatment
6359
54
6157
6061
5960
4653
70
5560
71
56
60
64
30 40 50 60 70 80 90 100
College Grad +
Some College
H.S. Graduate
Education
Female
Male
Gender
55 Plus
45 - 54
35 - 44
18 - 34
Age
Fair/Poor
Good
Exclnt/Very Good
Health Status
5 yrs Plus
2 to 5 yrs
Less than 2 yrs
Time With Plan
Expanded
Internal
Network
Total
(% Not A Problem)
Focus
Focus
Focus
Focus

12
Attributable Effects: Overall Satisfaction with Health Care
Provided
49
40
56
61
61
31
35
53
44
89
51
75
61
37
83
82
67
29
12
25
24
21
20
19
12
11
11
10
9
9
8
8
6
5
5
4
4
3
Problem getting to see a specialist
Frequency put in exam room within 15 minutes
Problem getting nurse/doctor happy with
Problem getting care/tests/treatment
Frequency got appointment soon as wanted
Problem with delays getting treatment
Problem getting help from customer service
Frequency got help during phone call
Frequency plan handled claims reasonable time
Frequency they listened carefully to you
Frequency got emergency care soon as wanted
Frequency spent enough time with you
Frequency staff was helpful
Problem with paperwork
Frequency showed respect for what you said
Frequency explained things so you understand
Frequency staff treated you with respect
Frequency plan handled claims correctly
Problem finding or understanding plan info
Areas for
largest
potential
improvementNeed to
maintain
Foundational
Factors
Maintenance – To
Keep Strong
Relationships (Percent)
Potential - To
Strengthen Weak
Relationships (Percent)
Questions
Individual Attributes
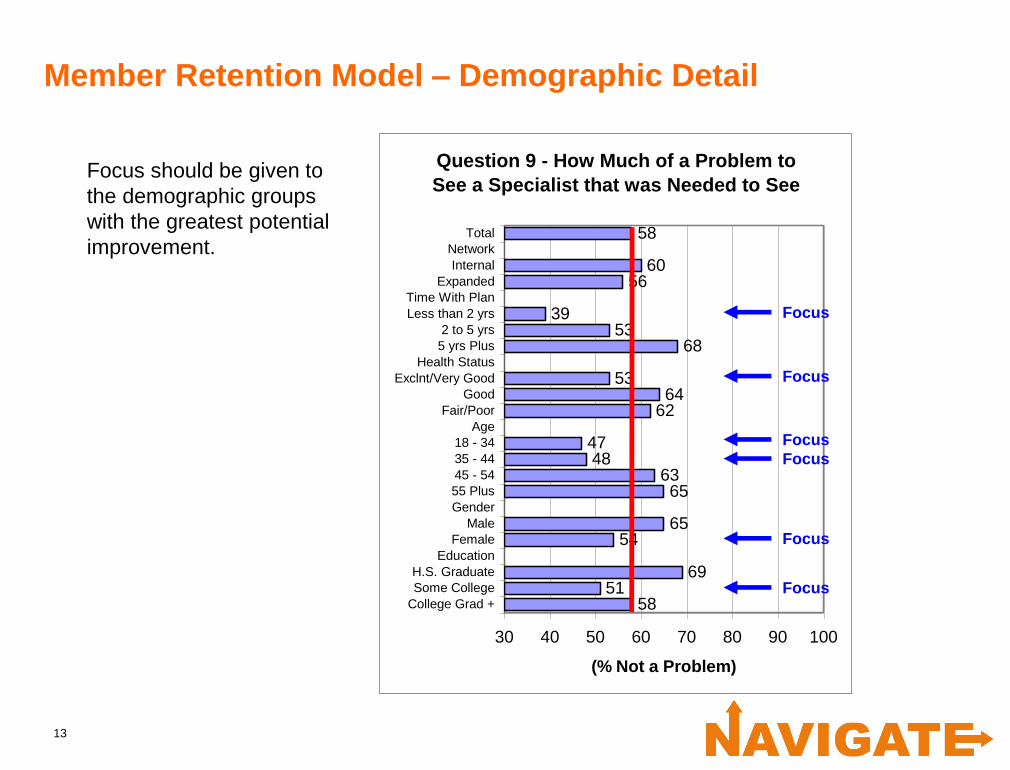
13
Member Retention Model – Demographic Detail
College Grad +
Some College
H.S. Graduate
Education
Female
Male
Gender
55 Plus
45 - 54
35 - 44
18 - 34
Age
Fair/Poor
Good
Exclnt/Very Good
Health Status
5 yrs Plus
2 to 5 yrs
Less than 2 yrs
Time With Plan
Expanded
Internal
Network
Total
Question 9 - How Much of a Problem to
See a Specialist that was Needed to See
5851
69
5465
6563
4847
6264
53
6853
39
60
58
56
30 40 50 60 70 80 90 100
College Grad +
Some College
H.S. Graduate
Education
Female
Male
Gender
55 Plus
45 - 54
35 - 44
18 - 34
Age
Fair/Poor
Good
Exclnt/Very Good
Health Status
5 yrs Plus
2 to 5 yrs
Less than 2 yrs
Time With Plan
Expanded
Internal
Network
Total
(% Not a Problem)
• Focus should be given to
the demographic groups
with the greatest potential
improvement.
•
Focus
Focus
Focus
Focus
Focus
Focus

14
College Grad +
Some College
H.S. Graduate
Education
Female
Male
Gender
55 Plus
45 - 54
35 - 44
18 - 34
Age
Fair/Poor
Good
Exclnt/Very Good
Health Status
5 yrs Plus
2 to 5 yrs
Less than 2 yrs
Time With Plan
Expanded
Internal
Network
Total
Question 7 - How Much of a Problem to
get a Doctor/Nurse that Respondent was
Happy with.
6370
80
6774
7668
6468
6271
70
7666
60
78
69
56
50 60 70 80 90 100
College Grad +
Some CollegeH.S. Graduate
Education
FemaleMale
Gender55 Plus
45 - 5435 - 4418 - 34
AgeFair/Poor
GoodExclnt/Very Good
Health Status
5 yrs Plus2 to 5 yrs
Less than 2 yrsTime With Plan
ExpandedInternal
Network
Total
% Not a Problem
Member Retention Model – Demographic Detail
• Focus should be given to
the demographic groups
with the greatest potential
improvement.
•
Focus
Focus
Focus
Focus
Focus
Focus

15
College Grad +
Some College
H.S. Graduate
Education
Female
Male
Gender
55 Plus
45 - 54
35 - 44
18 - 34
Age
Fair/Poor
Good
Exclnt/Very Good
Health Status
5 yrs Plus
2 to 5 yrs
Less than 2 yrs
Time With Plan
Expanded
Internal
Network
Total
Question 24 - How Much of a Problem to
get Necessary Care, Tests or Treatment
6568
75
6675
7266
6867
6268
72
7165
69
69
69
69
50 60 70 80 90 100
College Grad +
Some College
H.S. Graduate
Education
Female
Male
Gender
55 Plus
45 - 54
35 - 44
18 - 34
Age
Fair/Poor
Good
Exclnt/Very Good
Health Status
5 yrs Plus
2 to 5 yrs
Less than 2 yrs
Time With Plan
Expanded
Internal
Network
Total
(% Not a Problem)
Member Retention Model – Demographic Detail
• Focus should be given to
the demographic groups
with the greatest potential
improvement.
•
Focus
Focus
Focus
Focus
16
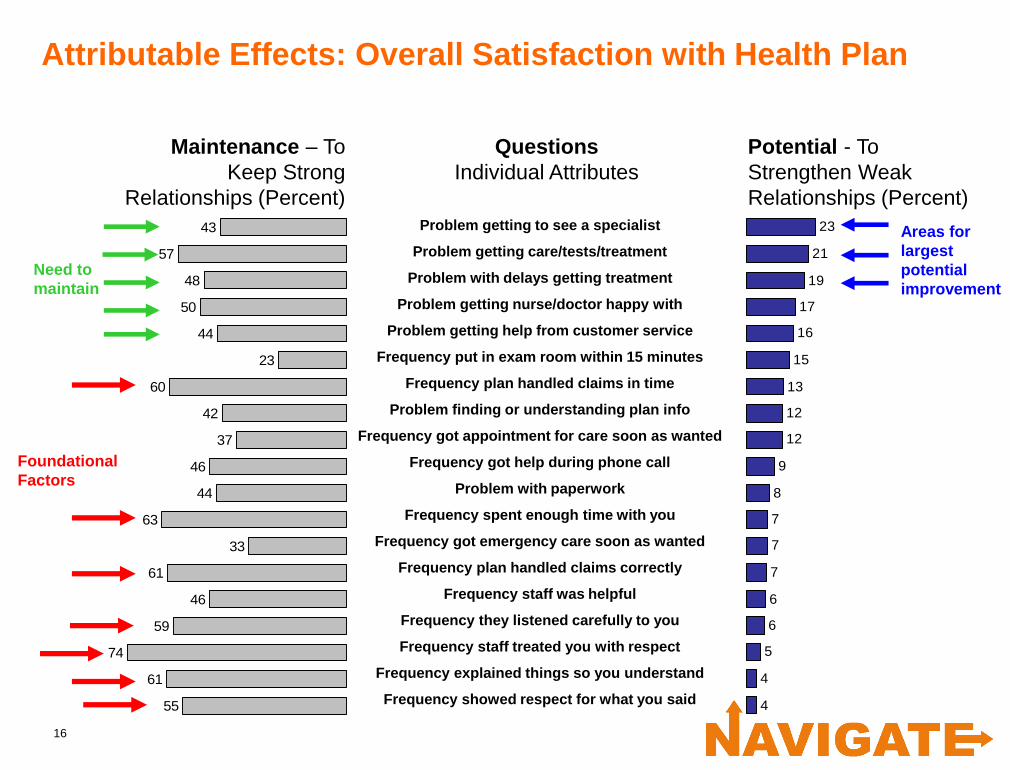
Attributable Effects: Overall Satisfaction with Health Plan
43
57
48
50
44
23
60
42
37
46
44
63
33
61
46
59
74
61
55
Problem getting to see a specialist
Problem getting care/tests/treatment
Problem with delays getting treatment
Problem getting nurse/doctor happy with
Problem getting help from customer service
Frequency put in exam room within 15 minutes
Frequency plan handled claims in time
Problem finding or understanding plan info
Frequency got appointment for care soon as wanted
Frequency got help during phone call
Problem with paperwork
Frequency spent enough time with you
Frequency got emergency care soon as wanted
Frequency plan handled claims correctly
Frequency staff was helpful
Frequency they listened carefully to you
Frequency staff treated you with respect
Frequency explained things so you understand
Frequency showed respect for what you said
23
21
19
17
16
15
13
12
12
9
8
7
7
7
6
6
5
4
4
Areas for
largest
potential
improvement
Need to
maintain
Foundational
Factors
Maintenance – To
Keep Strong
Relationships (Percent)
Potential - To
Strengthen Weak
Relationships (Percent)
Questions
Individual Attributes

Visit our site and get a feeling for team, our expertise and how we could help you at;
www.navigateconsulting.com.au


