A Log-Normal distribution is generated from a normal with mu = Ln(Median) and sigma = Sqrt[2*Ln(Mean/Median)].
The lognormal is always positive and right-skewed.
Examples:•Incomes (bottom 97%), assets, size of cities•Weight and blood pressure of humans (by gender)
Benefit: •calculate the share of total income held by the top X%•calculate share of total income held by the ‘above-average’•explore effects of change in mean-median ratio.
Log-Normal Distributions
2014 NNN1B 3
“In many ways, it [the Log-Normal] has remained the Cinderella of distributions, the interest of writers in the learned journals being curiously sporadic and that of the authors of statistical test-books but faintly aroused.”
“We … state our belief that the lognormal is as fundamental a distribution in statistics as is the normal, despite the stigma of the derivative nature of its name.”
Aitchison and Brown (1957). P 1.
Log-Normal Distributions
2014 NNN1B 4
Use Excel to focus on the model and the results.Excel has two Log-Normal functions:Standard: =LOGNORM.DIST(X, mu, sigma, k) k=0 for PDF; k=1 for CDF. Inverse: =LOGNORM.INV(X, mu, sigma)
Use Standard to calculate/graph the PDF and CDF. Use Inverse to find cutoffs: quartiles, to 1%, etc.Use Excel to create graphs that show comparisons.
Lognormal and Excel
2014 NNN1B 5
Bibliography
.
2014 NNN1B 6
.
Log-Normal Distribution of Units
0%
25%
50%
75%
100%
0 50 100 150 200 250 300 350 400 450 500
Incomes ($1,000)
Theoretical Distribution of Units by Income
Probability Distribution Function (PDF): as a percentage of the Modal PDF
Cumulative Distribution Function (CDF):Percentage of Units with Incomes below price
Mode: 20K
LogNormal Dist of Units Income
Median=50K; Mean=80K
Units can be individuals, households or families
2014 NNN1B 7
For anything that is distributed by X, there are always two distributions:
1.Distribution of subjects by X2.Distribution of total X by X.Sometime we ignore the 2nd: height or weight.Sometimes we care about the 2nd: income or assets.
Surprise: If the 1st is lognormal, so is the 2nd.
Paired Distributions
2014 NNN1B 8
Suppose the distribution of households by income is log-normal with normal parameters mu# and sigma#.
Then the distribution of total income by amount has a log-normal distribution with these parameters: mu$ = mu# + sigma#^2; sigma$ = sigma#.
See Aitchison and Brown (1963) p. 158.Special thanks to Mohammod Irfan (Denver University) for his help on this topic.
Distribution of Households and Total Income by Income
2014 NNN1B 9
.
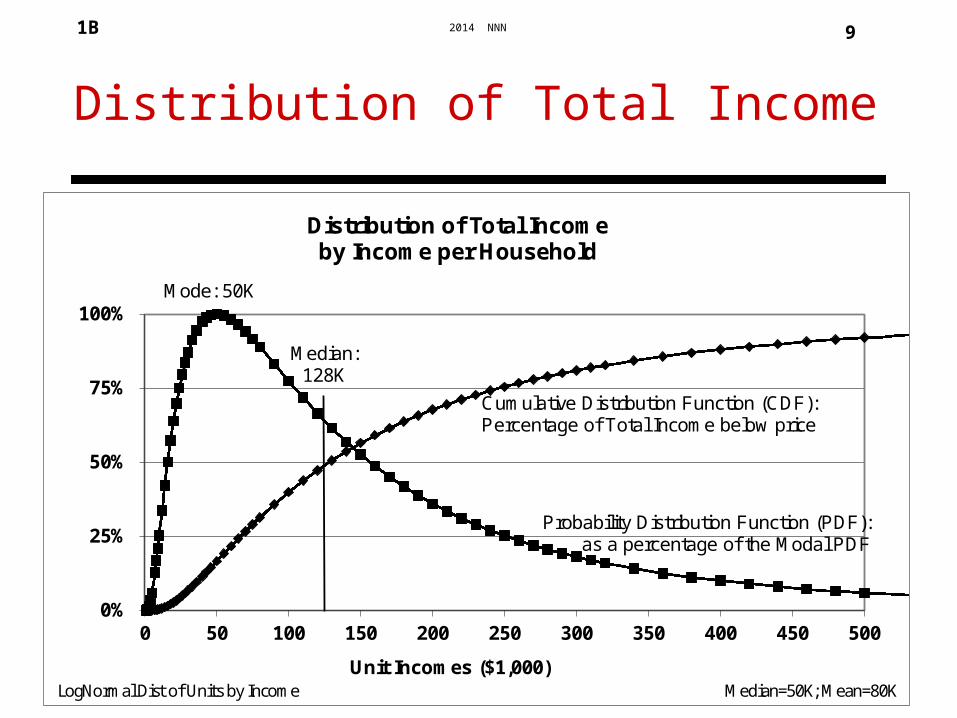
Distribution of Total Income
0%
25%
50%
75%
100%
0 50 100 150 200 250 300 350 400 450 500
Unit Incomes ($1,000)
Distribution of Total Income by Income per Household
Probability Distribution Function (PDF): as a percentage of the Modal PDF
Cumulative Distribution Function (CDF):Percentage of Total Income below price
Mode: 50K
LogNormal Dist of Units by Income Median=50K; Mean=80K
Median: 128K
2014 NNN1B
Distribution of Households and Total Income
10
0%
25%
50%
75%
100%
0 50 100 150 200
Perc
enta
ge o
f Max
imum
Income ($1,000)
Distribution of Households by Income;Distribution of Total Income by Amount
Log Normal Distribution of Households by Income Income/House: Mean=80K; Median=50K
Households by IncomeMode: $20K; Median: $50K
Mean=$80K
Distribution of Total Income by Amount of Income
Mode: $50KMedian: $128K
Ave $205K
2014 NNN1B 11
.
Lorenz Curve and Gini Coefficient
0%
20%
40%
60%
80%
100%
0% 20% 40% 60% 80% 100%
Perc
enta
ge o
f Inc
ome
Percentage of Households
Pctg of Income vs. Pctg. of Households
Top 50% (above $50k): 83% of total IncomeTop 10% (above $175k: 38% of total IncomeTop 1% (above $475k): 8.7% of total IncomeTop 0.1% (above $1M): 1.7% of total Income
Log Normal Distribution of Households by Income Income/House: Mean=80K; Median=50K
Gini Coefficient:0.507
Bigger meansmore unequal
2014 NNN1B 12
The Gini coefficient is determined by theMean#/Median# ratio.
The bigger this ratiothe bigger the Ginicoefficient and thegreater the economicinequality.
Champagne-GlassDistribution
0%
20%
40%
60%
80%
100%
0% 20% 40% 60% 80% 100%
Perc
enta
ge o
f Hou
seho
lds
Percentage of Income
Pctg of Households vs. Pctg of Income
Top 50% (above $50k) have 83% of total IncomeTop 10% (above $175k) have 38% of total IncomeTop 1% (above $475k) have 8.7% of total IncomeTop 0.1% (above $1M) have 1.7% of total Income
Log Normal Distribution of Households by Income Income/House: Mean=80K; Median=50K
Gini = 0.507
Bottom-Up
2014 NNN1B 13
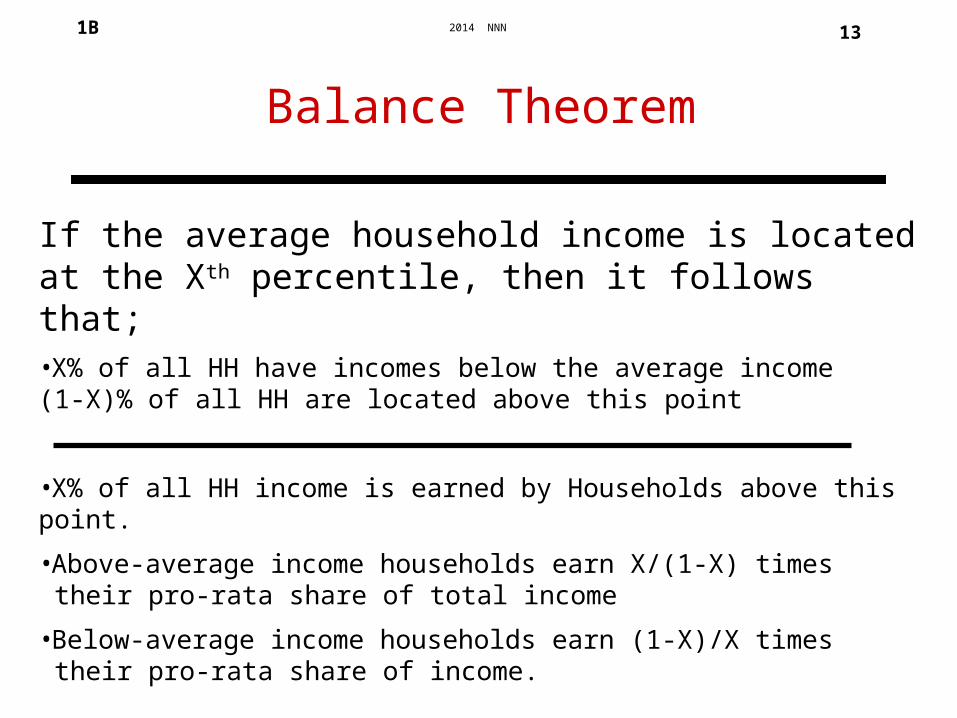
If the average household income is located at the Xth percentile, then it follows that;•X% of all HH have incomes below the average income(1-X)% of all HH are located above this point
•X% of all HH income is earned by Households above this point.
•Above-average income households earn X/(1-X) times their pro-rata share of total income
•Below-average income households earn (1-X)/X times their pro-rata share of income.
Median Income: 50KLog Normal Distribution of Households by Income
2014 NNN1B 16
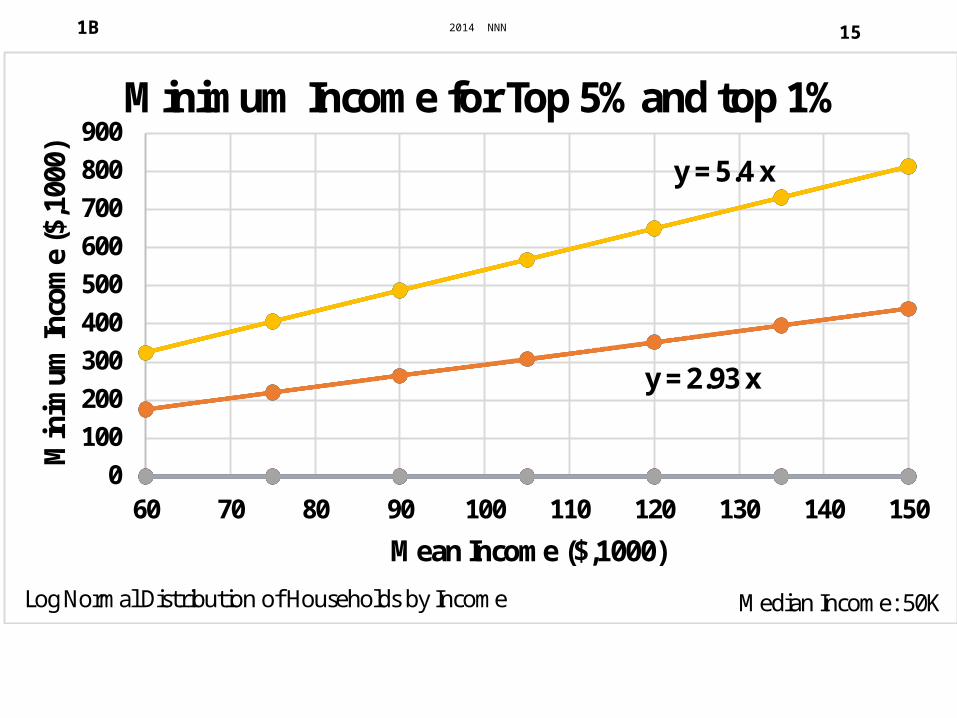
US Median Income (Table 691*)•$46,089 in 1970; $50,303 in 2008
Share of Total Income by Top 5% (Table 693*)•16.6% in 1970; 21.5% in 2008
Best log-normal fits: •1970 Median 46K, Mean 53K: Ratio = 1.15•2008 Median 50K, Mean 73K; Ratio = 1.46
* 2011 US Statistical Abstract (2008 dollars).
Which parameters best model US household incomes?
2014 NNN1B 17
Conclusion
Using the LogNormal distributions provides a principled way students can explore a plausible distribution of incomes.
Allows students to explore the difference between part and whole when using percentage grammar.
2014 NNN1B 18
Bibliography
Aitchison J and JAC Brown (1957). The Log-normal Distribution. Cambridge (UK): Cambridge University Press. Searchable copy at Google Books: http://books.google.com/books?id=Kus8AAAAIAAJ
Cobham, Alex and Andy Sumner (2014). Is inequality all about the tails?: The Palma measure of income inequality. Significance. Volume 11 Issue 1. www.significancemagazine.org/details/magazine/5871201/Is-inequality-all-about-the-tails-The-Palma-measure-of-income-inequality.html
Limpert, E., W.A. Stahel and M. Abbt (2001). Log-normal Distributions across the Sciences: Keys and Clues. Bioscience 51, No 5, May 2001, 342-352. Copy at http://stat.ethz.ch/~stahel/lognormal/bioscience.pdf
Schield, Milo (2013) Creating a Log-Normal Distribution using Excel 2013.www.statlit.org/pdf/Create-LogNormal-Excel2013-Demo-6up.pdf
Stahel, Werner (2014). Website: http://stat.ethz.ch/~stahelUniv. Denver (2014). Using the LogNormal Distribution. Copy at