25
CITY OF CAÑON CITY 2014 PAVEMENT MANAGEMENT STUDY ENGINEERING DEPARTMENT
CITY OF CAÑON CITY 2014 PAVEMENT MANAGEMENT STUDY
ENGINEERING DEPARTMENT
TABLE OF CONTENTS
EXECUTIVE SUMMARY
INTRODUCTION
PURPOSE OF STUDY
SUMMARY OF FINDINGS
ANALYSIS AND RECOMMENDATIONS
SECTION 1: NEED FOR PAVEMENT MANAGEMENT
SECTION 2: STREET SURFACE EVALUATION
SECTION 3: PAVEMENT TREATMENT OPTIONS
SECTION 4: APPLYING PAVEMENT TREATMENT OPTIONS
SECTION 5: PAVEMENT MANAGEMENT METHODOLOGIES
SECTION 6: FUNDING SCENARIOS
SECTION 7: RECOMMENDED PLAN OF ACTION
SECTION 8: PAVEMENT MANAGEMENT SYSTEM MAINTENANCE
CREDITS
APPENDIX
A Street Surface Type Maps by Traffic Service Area
B Major Thoroughfare Maps by Traffic Service Area
C Street OCI Maps by Traffic Service Area
D OCI X Pavement Miles
E Pavement Data by Pavement Type, Designation, & Location
F Funding Scenario Charts
EXECUTIVE SUMMARY
Introduction
The future of our local economy is uncertain, but one thing we know we must manage our infrastructure smarter. We, like many agencies, face challenging times. There are over 115 miles of roads in our city with limited funds for maintenance. Due in large part to grant funds and sources other than general funds, the City has been paving gravel roads, but for road maintenance we receive no outside funds except from the Highway Users Tax Fund (HUTF). This amount, that is a little less than $600,000 per year, has been in the decline for many years. The City’s annual street budget average of $2 Million includes approximately $1.6 Million in operating cost. There is a national discussion about gas tax and how it has not kept up with the needs of an aging infrastructure.
A major challenge is how to balance the needs between preservation, system expansion, and system management and continue to serve our objective in providing service to our community. Our goal is to slow the rate of deterioration of our existing road network using pavement preservation and rehabilitation treatments. The development of a new Pavement Management Program is a large step in the right direction. This new tool will assist in determining the most cost effective treatments to apply on a given street segment at a given time.
Purpose of the Study
The Engineering Department has developed a citywide Pavement Management Program (PMP). In developing this program, the physical condition of City street surfaces were evaluated, rated, and the projected life cycle determined. The PMP further identifies a schedule for maintenance and reconstruction of City streets at the appropriate time in order to extend their overall life-expectancy in the most efficient and economical manner. In addition, the PMP establishes a comprehensive process to prioritize rehabilitation of the City’s roadway system and will be used as a powerful tool in the decision-making process in order to best utilize the City’s available financial resources.
Other advantages of this program include:
1. Improving the quality of the City’s streets in a fiscally responsible manner;
2. Implementing a plan that considers both immediate and long-term needs;
3. Promoting transparency by educating public on the decision-making process involving selection
and utilization of street improvement funds throughout the City.
Summary of Findings
The City’s street network system consists of over 115 paved street miles. Inspections of the street
network occurred from April 2013 to November 2013. There are approximately 93 miles of asphalt
streets and 5 miles of concrete streets with the balance being gravel roadways. The average age of the
street network is 55 years. At a replacement cost approaching $1.3 Million per mile, not including the
cost of the right of way and other improvements, the City has over $155 Million invested in our paved
roadway network.
Staff utilized Cartegraph PAVEMENTview and existing HUTF database, for asset data collection and
automated pavement evaluation system to create a database of the current inventory of City street

conditions, treatment options, and cost estimates for each treatment available. The criteria used for
inspection included both the USACOE and ASTM D6433-07 standards. Using this system, it has been
confirmed that due to the lack of a comprehensive and systematic maintenance program of the City’s
road system over a number of years, the City’s average Overall Condition Index (OCI) has dropped to
37 on a scale of 0-100, 100 being a new street and 0 being a street needing full reconstruction. An
average OCI of 37 is considered very poor condition according to industry standard. On another note,
25% of the roadways are rated at an OCI above 70, which is satisfactory to good or excellent condition.
Various rehabilitation and resurfacing methods are available to maintain a road surface, each with their
own benefits and expected service life. To maximize the City’s resources, the appropriate treatment
must be selected for each road’s condition, many of which are described in this report.
New pavement deteriorates slowly at first, then at a continually increasing rate. This deterioration can be
significantly slowed by use of systematic preventive maintenance starting in the early stages of a
pavement’s lifecycle.
Analysis and Recommendations
In 2014, with the availability of funds, the City was able to perform some preventative maintenance for the first time years. However, a comprehensive multiyear approach was deemed necessary to reduce the rapid deterioration of most streets within the City limits.
Recent practices have demonstrated that it is fiscally prudent to maintain roads that are in a relatively
good condition. This can be accomplished using low cost treatment methods to prevent them from
deteriorating. The intent of this study is to provide a comprehensive plan for a strategic street
maintenance and rehabilitation program. The result is a “big-picture” approach that shows the streets
that warrant treatment based on function, location, and the condition of the street surface.
The study determined that $10M - $13M per year over the next 30 years is required to bring and
maintain the overall citywide system in satisfactory condition. Further financial analysis will be
necessary but, regardless of the funds generated, any available funds should be used for less costly
pavement maintenance and rehabilitation on the streets that remain in favorable condition. Any
additional capital funding should be spent on the thoroughfares with any further system-wide work being
prioritized using the pavement management program. This strategy will extend the life of those streets
that can be saved by several years and delay or prevent, if possible, having to use more expensive
pavement treatments in the future. Based on the limited funds available, this is the most cost-effective
strategy to maintain the best pavement condition Citywide.
Ideally, the City should strive to use Best Management Practices in the most cost effective and timely manner to achieve an average OCI rating of 80 or better. A street system maintained at this level is considered to be in optimum state. At this level, maintenance costs would remain at a minimum while the street standard would be maintained at a better quality.
SECTION 1
Need for Pavement Management The network of paved roads within the City has been without a comprehensive maintenance/rehabilitation plan since the City’s incorporation in 1872, with the exception of a street condition survey performed in 1995 and a reconstruction plan completed in 2002. At that time it was determined that our reconstruction schedule was on a 133 year cycle. Due to funding, these past plans have produced little results. While the City has grown to its current population of 16,000+, increased demand has been placed on the road system as residents drive to work, shop, and have their needs met with the assistance of truck and delivery services. Many roads experience traffic counts beyond their intended design, furthering the deterioration of the road surface. With a limited budget for road maintenance, identifying a solution to maintaining the City’s road system using treatment methods that will provide the greatest benefit to the community is the objective of this program. The City generally has two classes of roads: local and thoroughfares which consist of collectors and
arterials. Local roads are typically those in residential neighborhoods. Collector roads generally function
as those that receive traffic from multiple local roads and are usually within mixed-use areas. Examples
of collector roads include 15th Street, College Avenue and Orchard Avenue. Arterial roads experience
the highest traffic volumes and function as major transportation corridors. Examples include Raynolds
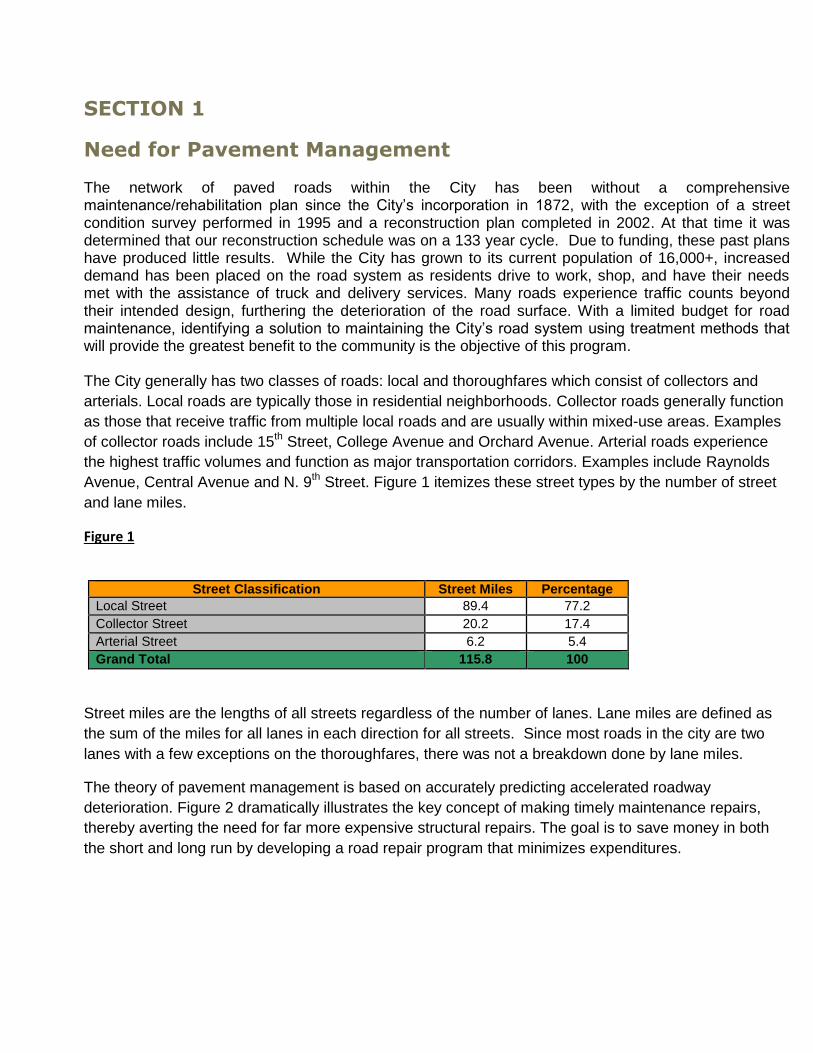
Avenue, Central Avenue and N. 9th Street. Figure 1 itemizes these street types by the number of street
and lane miles.
Figure 1
Street Classification Street Miles Percentage
Local Street 89.4 77.2
Collector Street 20.2 17.4
Arterial Street 6.2 5.4
Grand Total 115.8 100
Street miles are the lengths of all streets regardless of the number of lanes. Lane miles are defined as
the sum of the miles for all lanes in each direction for all streets. Since most roads in the city are two
lanes with a few exceptions on the thoroughfares, there was not a breakdown done by lane miles.
The theory of pavement management is based on accurately predicting accelerated roadway
deterioration. Figure 2 dramatically illustrates the key concept of making timely maintenance repairs,
thereby averting the need for far more expensive structural repairs. The goal is to save money in both
the short and long run by developing a road repair program that minimizes expenditures.
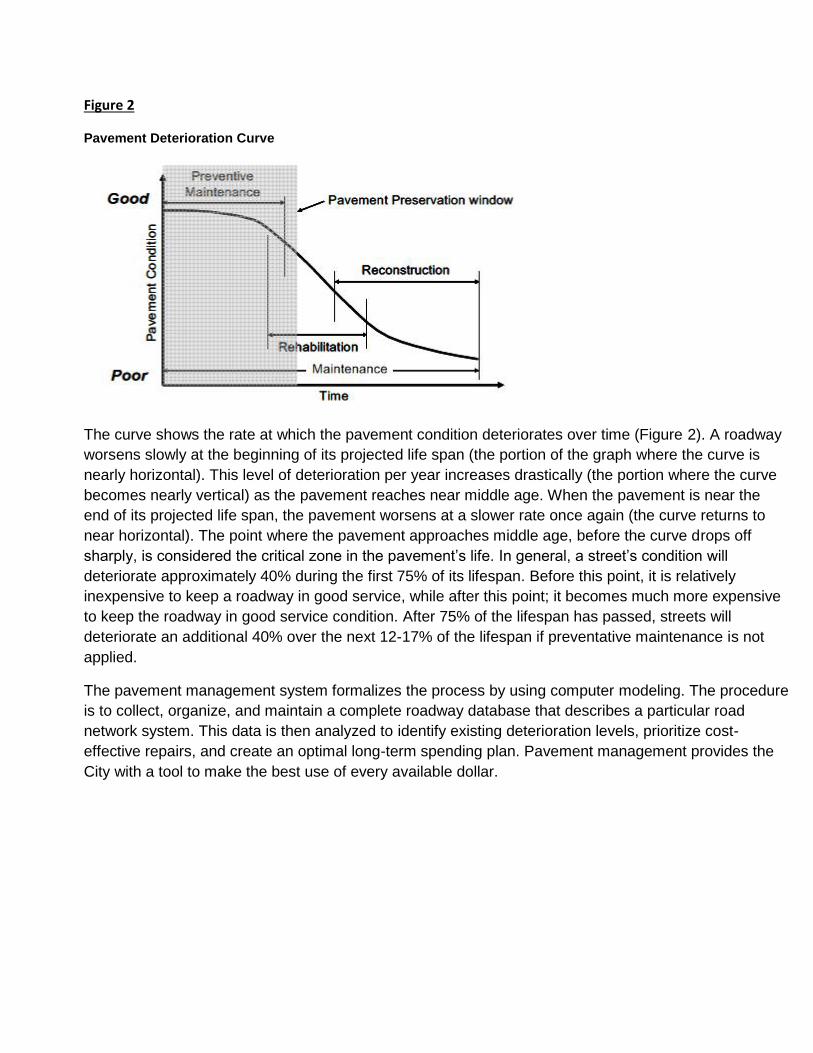
Figure 2
Pavement Deterioration Curve
The curve shows the rate at which the pavement condition deteriorates over time (Figure 2). A roadway
worsens slowly at the beginning of its projected life span (the portion of the graph where the curve is
nearly horizontal). This level of deterioration per year increases drastically (the portion where the curve
becomes nearly vertical) as the pavement reaches near middle age. When the pavement is near the
end of its projected life span, the pavement worsens at a slower rate once again (the curve returns to
near horizontal). The point where the pavement approaches middle age, before the curve drops off
sharply, is considered the critical zone in the pavement’s life. In general, a street’s condition will
deteriorate approximately 40% during the first 75% of its lifespan. Before this point, it is relatively
inexpensive to keep a roadway in good service, while after this point; it becomes much more expensive
to keep the roadway in good service condition. After 75% of the lifespan has passed, streets will
deteriorate an additional 40% over the next 12-17% of the lifespan if preventative maintenance is not
applied.
The pavement management system formalizes the process by using computer modeling. The procedure
is to collect, organize, and maintain a complete roadway database that describes a particular road
network system. This data is then analyzed to identify existing deterioration levels, prioritize cost-
effective repairs, and create an optimal long-term spending plan. Pavement management provides the
City with a tool to make the best use of every available dollar.
SECTION 2
Street Surface Evaluation
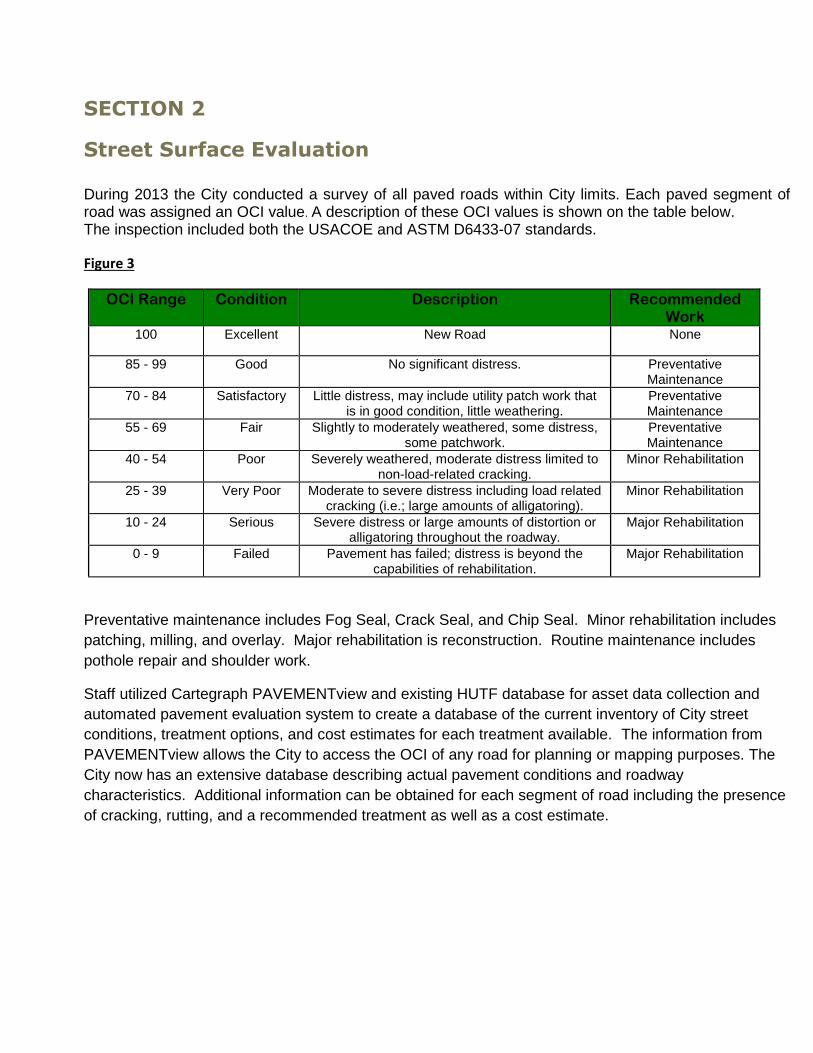
During 2013 the City conducted a survey of all paved roads within City limits. Each paved segment of road was assigned an OCI value. A description of these OCI values is shown on the table below. The inspection included both the USACOE and ASTM D6433-07 standards.
Figure 3
OCI Range Condition Description Recommended Work
100 Excellent New Road None
85 - 99 Good No significant distress. Preventative Maintenance
70 - 84 Satisfactory Little distress, may include utility patch work that is in good condition, little weathering.
Preventative Maintenance
55 - 69 Fair Slightly to moderately weathered, some distress, some patchwork.
Preventative Maintenance
40 - 54 Poor Severely weathered, moderate distress limited to non-load-related cracking.
Minor Rehabilitation
25 - 39 Very Poor Moderate to severe distress including load related cracking (i.e.; large amounts of alligatoring).
Minor Rehabilitation
10 - 24 Serious Severe distress or large amounts of distortion or alligatoring throughout the roadway.
Major Rehabilitation
0 - 9 Failed Pavement has failed; distress is beyond the capabilities of rehabilitation.
Major Rehabilitation
Preventative maintenance includes Fog Seal, Crack Seal, and Chip Seal. Minor rehabilitation includes
patching, milling, and overlay. Major rehabilitation is reconstruction. Routine maintenance includes
pothole repair and shoulder work.
Staff utilized Cartegraph PAVEMENTview and existing HUTF database for asset data collection and
automated pavement evaluation system to create a database of the current inventory of City street
conditions, treatment options, and cost estimates for each treatment available. The information from
PAVEMENTview allows the City to access the OCI of any road for planning or mapping purposes. The
City now has an extensive database describing actual pavement conditions and roadway
characteristics. Additional information can be obtained for each segment of road including the presence
of cracking, rutting, and a recommended treatment as well as a cost estimate.

The distribution of the OCI ratings for the City streets is depicted in Figure 4.
Figure 4

The condition of a road is impacted by several factors:
Traffic patterns and loading;
Structural section (pavement over engineered aggregate base or pavement over native soil);
Characteristics of the underlying soil (high clay content, sandy, gravely);
Drainage (excessive runoff from lawns, puddling, storm runoff);
Previous maintenance;
Quantity of utility trenching and related repairs. The above items are contributing factors to the overall pavement condition and lifespan of a road.
Because OCI varies along a length of road, there are challenges to selecting a uniform treatment for a
paving project within a selected area.
Overall Condition Index (OCI)
Below are photographs depicting examples of different OCI scores.
OCI = 0-9 N. 9th Street
OCI = 10-24 S. 12th Street
OCI = 25-39 Willmoor Ct
OCI = 40-54 Leslie Lane
Failed Condition --------------------------------------------------------- Poor Condition
OCI = 55-69 Elizabeth Street
OCI = 70-84 Cowboy Way
OCI = 85-99 Pecos Point
OCI = 100 S. 5th Street
Fair Condition --------------------------------------------------------- Excellent Condition
SECTION 3
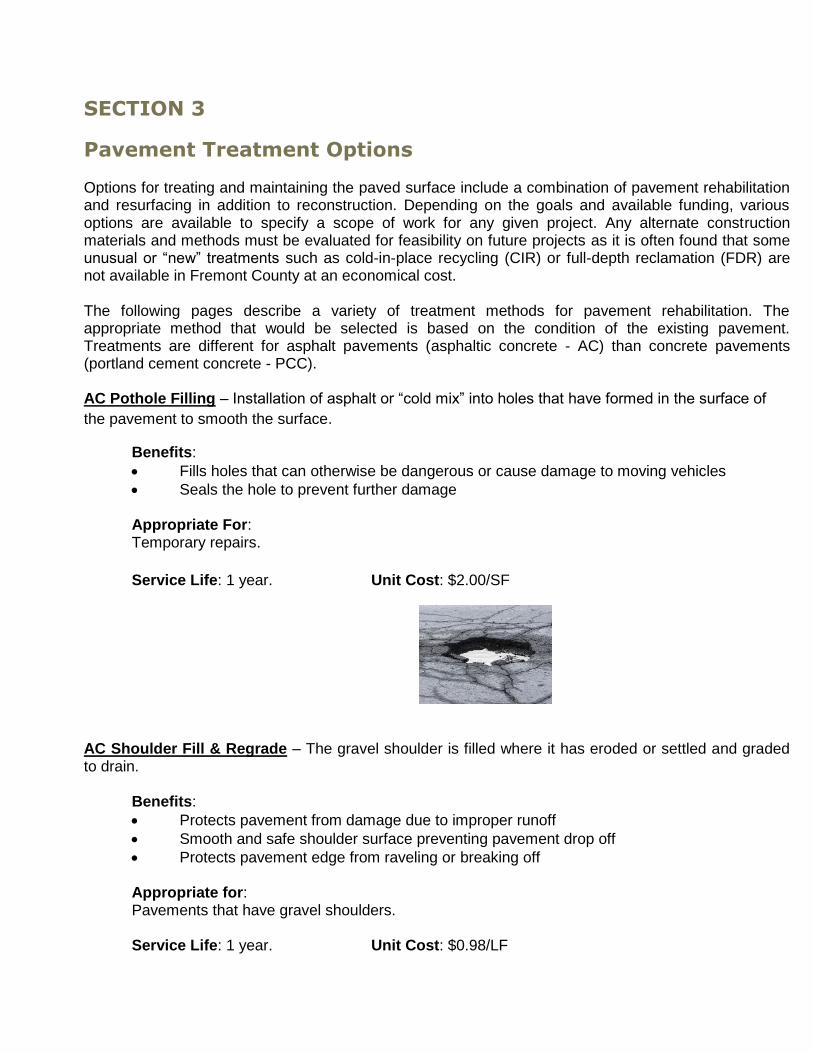
Pavement Treatment Options Options for treating and maintaining the paved surface include a combination of pavement rehabilitation and resurfacing in addition to reconstruction. Depending on the goals and available funding, various options are available to specify a scope of work for any given project. Any alternate construction materials and methods must be evaluated for feasibility on future projects as it is often found that some unusual or “new” treatments such as cold-in-place recycling (CIR) or full-depth reclamation (FDR) are not available in Fremont County at an economical cost. The following pages describe a variety of treatment methods for pavement rehabilitation. The appropriate method that would be selected is based on the condition of the existing pavement. Treatments are different for asphalt pavements (asphaltic concrete - AC) than concrete pavements (portland cement concrete - PCC). AC Pothole Filling – Installation of asphalt or “cold mix” into holes that have formed in the surface of
the pavement to smooth the surface.
Benefits:
Fills holes that can otherwise be dangerous or cause damage to moving vehicles
Seals the hole to prevent further damage
Appropriate For: Temporary repairs.
Service Life: 1 year. Unit Cost: $2.00/SF
AC Shoulder Fill & Regrade – The gravel shoulder is filled where it has eroded or settled and graded to drain.
Benefits:
Protects pavement from damage due to improper runoff
Smooth and safe shoulder surface preventing pavement drop off
Protects pavement edge from raveling or breaking off Appropriate for: Pavements that have gravel shoulders. Service Life: 1 year. Unit Cost: $0.98/LF
AC Shoulder Reconstruct – The gravel shoulder is reconstructed full depth.
Benefits:
Protects pavement from damage due to improper runoff
Smooth and safe shoulder surface preventing pavement drop off
Protects pavement edge from raveling or breaking off Appropriate for: Pavements that have gravel shoulders. Service Life: 2 - 5 years. Unit Cost: $1.79/LF
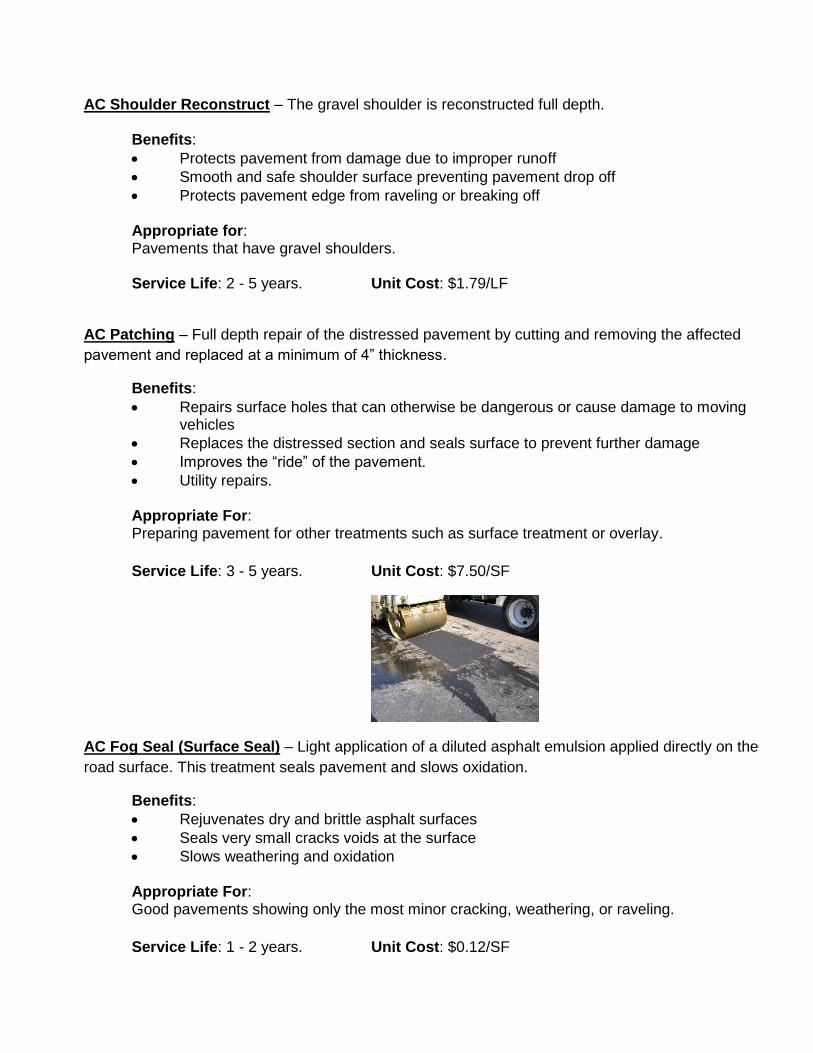
AC Patching – Full depth repair of the distressed pavement by cutting and removing the affected
pavement and replaced at a minimum of 4” thickness.
Benefits:
Repairs surface holes that can otherwise be dangerous or cause damage to moving vehicles
Replaces the distressed section and seals surface to prevent further damage
Improves the “ride” of the pavement.
Utility repairs.
Appropriate For: Preparing pavement for other treatments such as surface treatment or overlay.
Service Life: 3 - 5 years. Unit Cost: $7.50/SF
AC Fog Seal (Surface Seal) – Light application of a diluted asphalt emulsion applied directly on the
road surface. This treatment seals pavement and slows oxidation.
Benefits:
Rejuvenates dry and brittle asphalt surfaces
Seals very small cracks voids at the surface
Slows weathering and oxidation
Appropriate For: Good pavements showing only the most minor cracking, weathering, or raveling.
Service Life: 1 - 2 years. Unit Cost: $0.12/SF
AC Crack Seal – Bituminous sealant applied to cracks in the paved surface. Benefits:
Prevents intrusion of moisture and debris through cracks
Prevents water damage to pavement structure Appropriate for: Cracks less than 1” wide and spaced uniformly along the pavement. OCI 55 - 85 Service Life: 3 – 5 years. Unit Cost: $0.04/SF
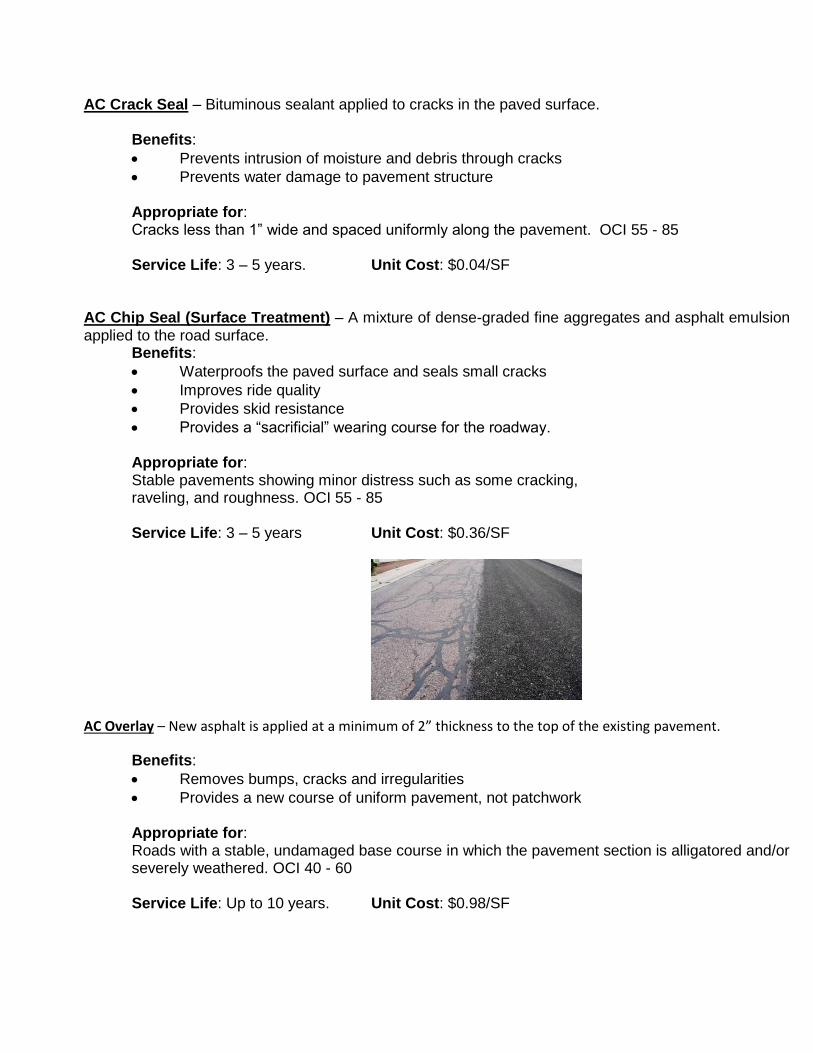
AC Chip Seal (Surface Treatment) – A mixture of dense-graded fine aggregates and asphalt emulsion applied to the road surface.
Benefits:
Waterproofs the paved surface and seals small cracks
Improves ride quality
Provides skid resistance
Provides a “sacrificial” wearing course for the roadway.
Appropriate for: Stable pavements showing minor distress such as some cracking, raveling, and roughness. OCI 55 - 85 Service Life: 3 – 5 years Unit Cost: $0.36/SF
AC Overlay – New asphalt is applied at a minimum of 2” thickness to the top of the existing pavement.
Benefits:
Removes bumps, cracks and irregularities
Provides a new course of uniform pavement, not patchwork Appropriate for: Roads with a stable, undamaged base course in which the pavement section is alligatored and/or severely weathered. OCI 40 - 60 Service Life: Up to 10 years. Unit Cost: $0.98/SF
AC Mill and Overlay – 1” to 2” of roadway are milled to remove the upper portion of the road surface. Milling is typically necessary when overall change in surface elevation is not desired such as when curb & gutter are present. New asphalt is then applied at generally the same thickness as the removed portion.
Benefits:
Removes bumps, cracks and irregularities
Provides a new course of uniform pavement, not patchwork Appropriate for: Roads with a stable, undamaged base course in which the pavement section is alligatored and/or severely weathered. OCI 25 - 40 Service Life: Up to 10 years. Unit Cost: $2.35/SF
AC Keel Reconstruction – The traveled section or primary lanes of the pavement are reconstructed along with the base course.
Benefits:
Brand new roadway for the primary lanes
Smooth and safe driving surface Appropriate for: Roads that have lanes that have reached the failed to serious condition but the auxiliary lanes or parking zones are not priority for repair or are in better condition. Service Life: Up to 20 years. Unit Cost: $3.46/SF
AC Reconstruction – The pavement is reconstructed along with the base course.
Benefits:
Brand new roadway
Smooth and safe driving surface Appropriate for: Roads that reached the failed to serious condition. OCI 0 - 25 Service Life: Up to 30 years. Unit Cost: $6.99/SF

PCC Shoulder Fill & Regrade – The gravel shoulder is filled where it has eroded or settled and graded to drain.
Benefits:
Protects pavement from damage due to improper runoff
Smooth and safe shoulder surface preventing pavement drop off
Protects pavement edge from raveling or breaking off Appropriate for: Pavements that have gravel shoulders. Service Life: 1 year. Unit Cost: $0.98/LF
PCC Shoulder Reconstruct – The gravel shoulder is reconstructed full depth.
Benefits:
Protects pavement from damage due to improper runoff
Smooth and safe shoulder surface preventing pavement drop off
Protects pavement edge from raveling or breaking off Appropriate for: Pavements that have gravel shoulders. Service Life: 2 - 5 years. Unit Cost: $1.79/LF
PCC Patching – Partial depth repair of the distressed pavement by cutting and removing the affected
pavement and replaced at minimum the existing pavement thickness.
Benefits:
Repairs surface holes that can otherwise be dangerous or cause damage to moving vehicles
Replaces the distressed section and seals surface to prevent further damage
Improves the “ride” of the pavement.
Utility repairs.
Appropriate For: Pavement that requires point repairs only.
Service Life: 10 - 20 years. Unit Cost: $4.00/SF
PCC Slab Replacement – Full depth repair of the distressed pavement by cutting and removing the
affected pavement joint to joint and replaced, at minimum, the existing pavement thickness.
Benefits:
Repairs surface holes that can otherwise be dangerous or cause damage to moving vehicles
Replaces the distressed section and seals surface to prevent further damage
Improves the “ride” of the pavement.
Utility repairs.
Appropriate For: Pavement that requires point repairs only or has had utility work.
Service Life: 10 - 20 years. Unit Cost: $13.72/SF
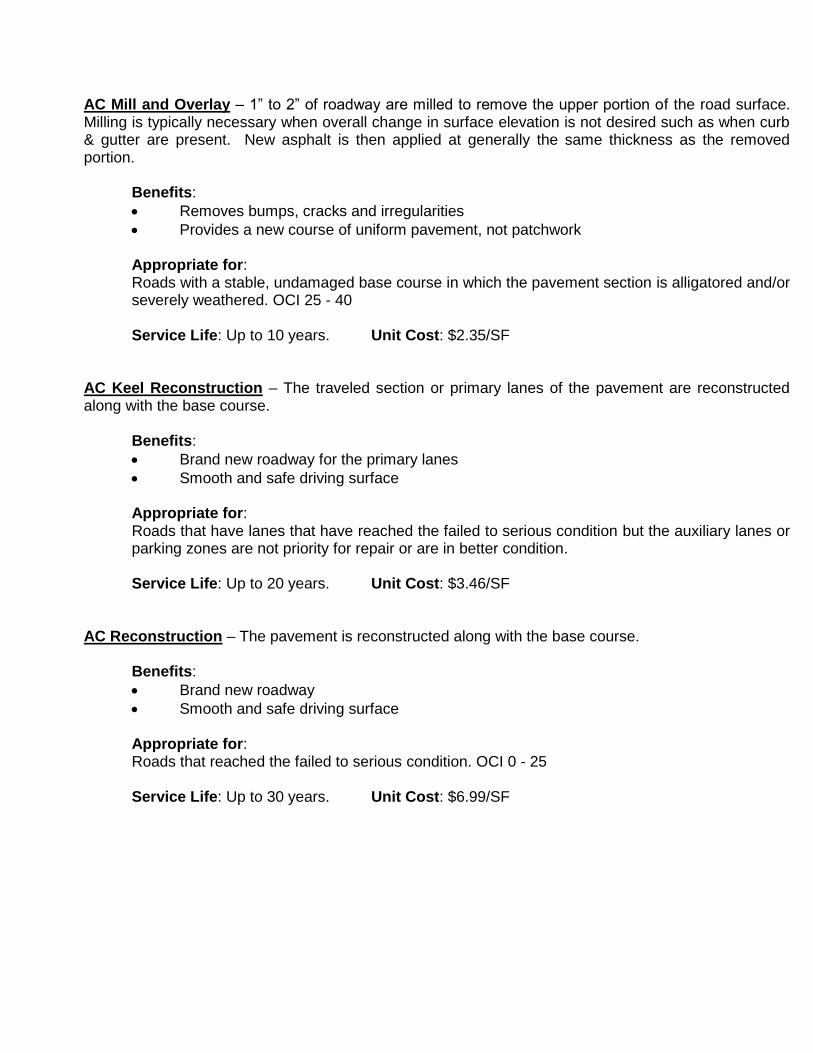
PCC Crack Seal – Sealant applied to cracks in the paved surface.
Benefits:
Prevents intrusion of moisture and debris through cracks
Prevents water damage to pavement structure Appropriate for: Cracks less than 1” wide and spaced uniformly along the pavement. Service Life: 3 – 5 years. Unit Cost: $1.79/SF
PCC Joint Seal – Sealant applied to the cut or preformed joints in the paved surface. Benefits:
Prevents intrusion of moisture and debris through cracks
Prevents water damage to pavement structure Appropriate for: Joints less than 1” wide. Service Life: 3 – 5 years. Unit Cost: $2.70/SF
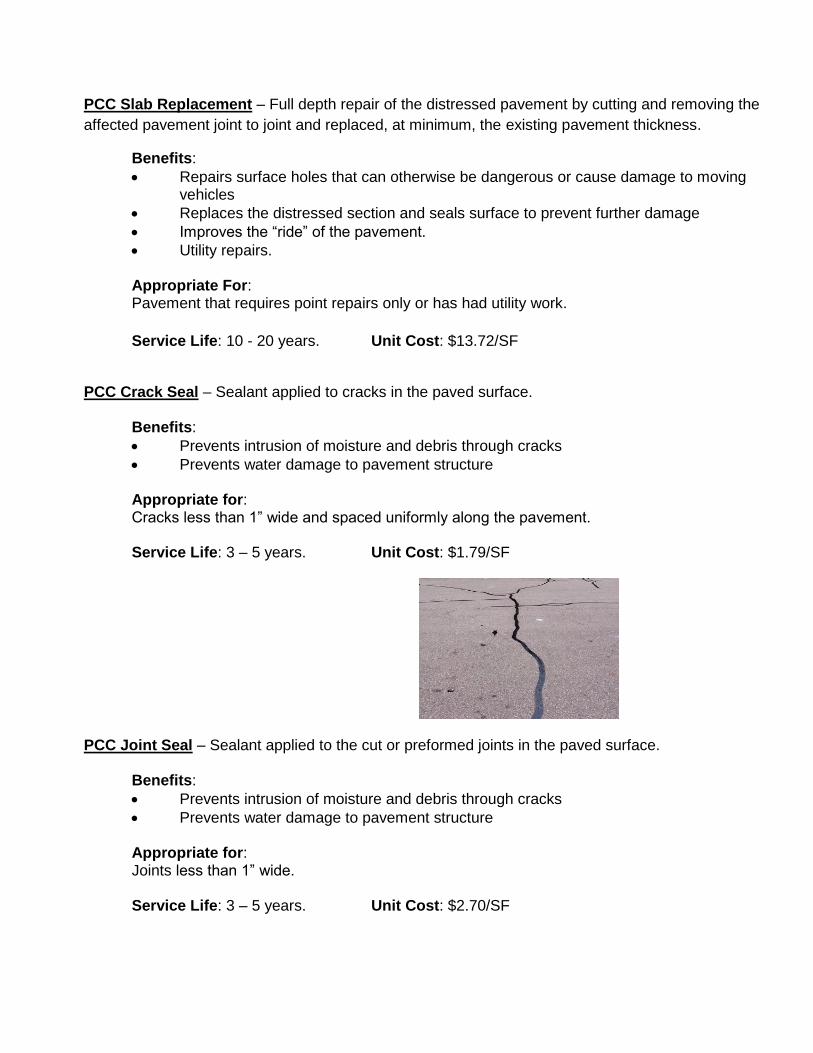
PCC Reconstruction – The pavement is reconstructed along with the base course.
Benefits:
Brand new roadway
Smooth and safe driving surface Appropriate for: Roads that reached the failed to serious condition. OCI 0 - 25 Service Life: Up to 30 years. Unit Cost: $8.77/SF
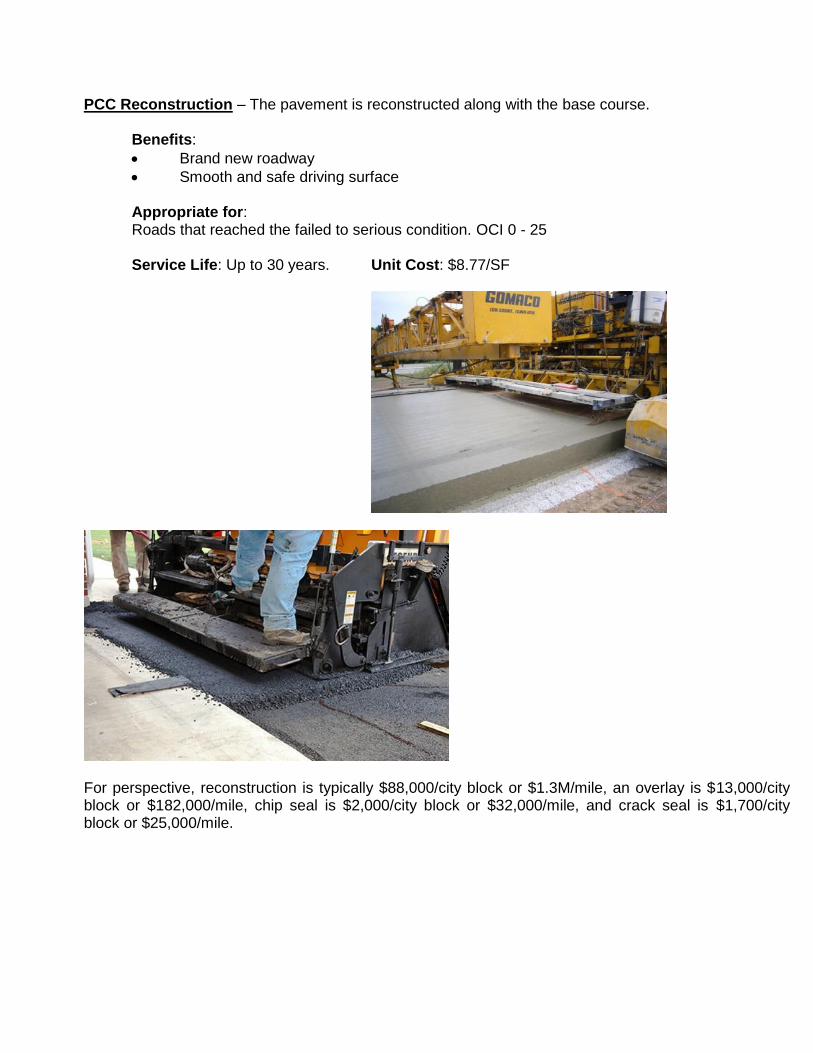
For perspective, reconstruction is typically $88,000/city block or $1.3M/mile, an overlay is $13,000/city block or $182,000/mile, chip seal is $2,000/city block or $32,000/mile, and crack seal is $1,700/city block or $25,000/mile.
SECTION 4
Applying Pavement Treatment Options
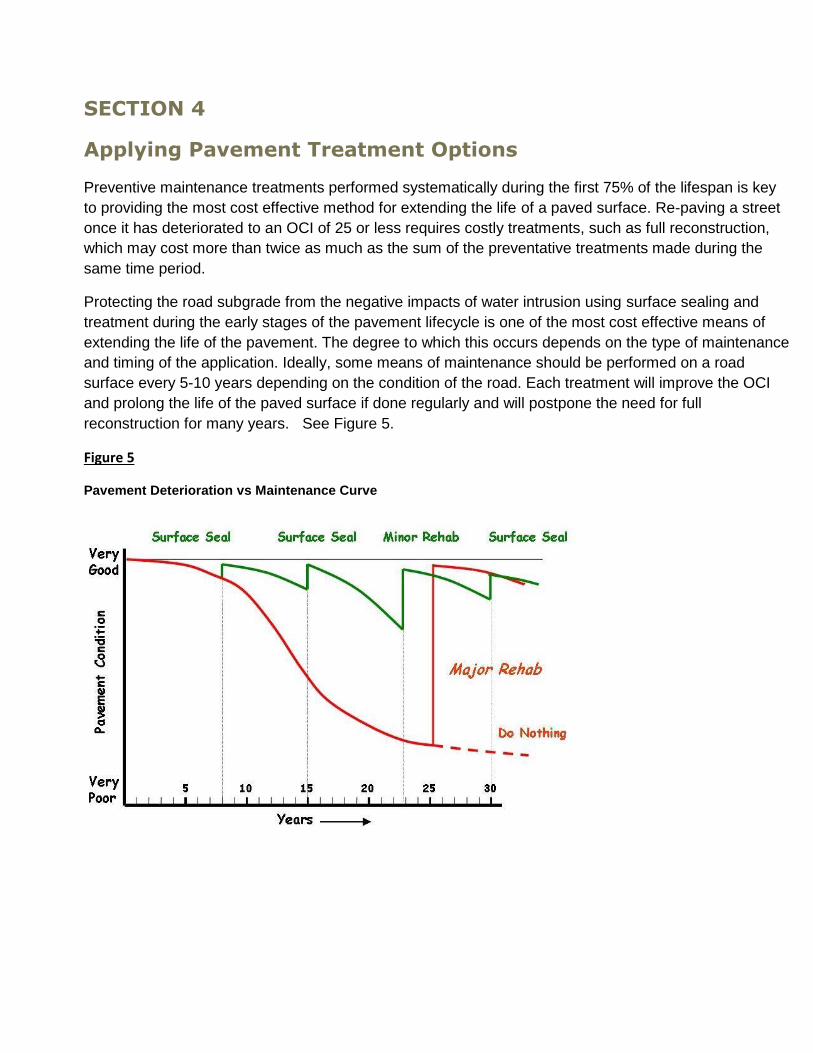
Preventive maintenance treatments performed systematically during the first 75% of the lifespan is key
to providing the most cost effective method for extending the life of a paved surface. Re-paving a street
once it has deteriorated to an OCI of 25 or less requires costly treatments, such as full reconstruction,
which may cost more than twice as much as the sum of the preventative treatments made during the
same time period.
Protecting the road subgrade from the negative impacts of water intrusion using surface sealing and
treatment during the early stages of the pavement lifecycle is one of the most cost effective means of
extending the life of the pavement. The degree to which this occurs depends on the type of maintenance
and timing of the application. Ideally, some means of maintenance should be performed on a road
surface every 5-10 years depending on the condition of the road. Each treatment will improve the OCI
and prolong the life of the paved surface if done regularly and will postpone the need for full
reconstruction for many years. See Figure 5.
Figure 5
Pavement Deterioration vs Maintenance Curve

SECTION 5
Pavement Management Methodologies
The Pavement Management Program takes a citywide approach to evaluate pavement. This approach
requires attaining large amounts of data and resources for analysis to optimize solutions for the entire
City, including such things as the coordination of various capital improvement and development projects
with paving projects. Using this approach to pavement management there are two distinct
methodologies to prioritize the City’s roads for resurfacing. One is the “worst first” methodology and the
other is the “best first” methodology.
While there is often tremendous pressure from the public to repair streets upon the “worst first” strategy,
where streets selected for treatment are those closest to failure, this strategy focuses on streets that
cannot get worse and quickly depletes available funding while streets in acceptable condition continue
to deteriorate. Therefore opportunities to expand the useful service life cost effectively are lost and the
backlog continues to grow as the “best” streets quickly drop in a lower desired condition.
Preventative maintenance utilizes the “best first” strategy wherein cost-effective treatments are applied
earlier in pavement life. True implementation of a preventative maintenance strategy is often difficult for
the public to understand because relatively new streets may be seen receiving treatment whereas a
street needing reconstruction may appear to be ignored.
Recent practices have demonstrated that it is fiscally prudent to maintain roads that are in a relatively
good condition. This can be accomplished using low cost treatment methods to prevent them from
deteriorating into a more damaged condition.
In order to apply budgetary dollars to those roads of highest priority, an assessment was made of the
City’s needs. Some needs weigh more than others, therefore a weighted criteria was established to
define the City’s long-term priorities. When scenarios are calculated, each roadway is given a Network
Priority Rating (NPR) to order which roadway is worked on first. The roadways are given a weighted
value based on a parameter value multiplied by another factor called Segment Priority Ranking (SPR).
For example a roadway with a lower OCI has a greater priority, and if the roadway is also a
thoroughfare, the priority level increases and so on.
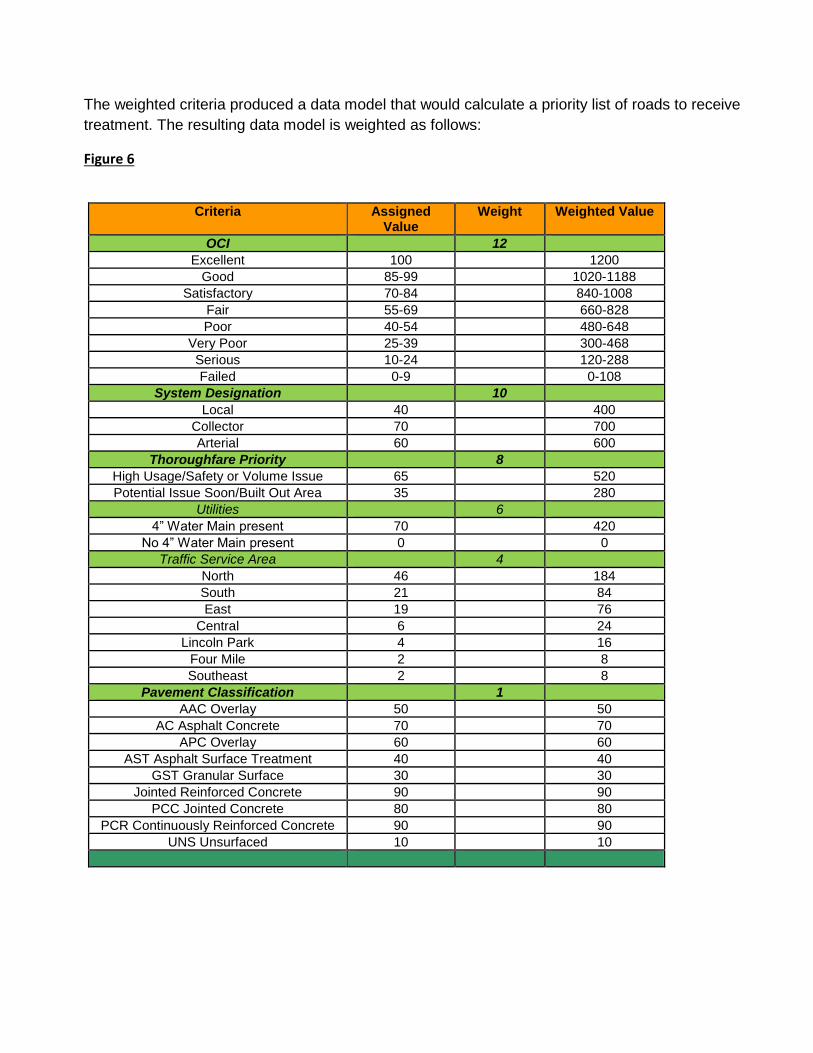
The weighted criteria produced a data model that would calculate a priority list of roads to receive
treatment. The resulting data model is weighted as follows:
Figure 6
Criteria Assigned
Value Weight Weighted Value
OCI 12
Excellent 100 1200
Good 85-99 1020-1188
Satisfactory 70-84 840-1008
Fair 55-69 660-828
Poor 40-54 480-648
Very Poor 25-39 300-468
Serious 10-24 120-288
Failed 0-9 0-108
System Designation 10
Local 40 400
Collector 70 700
Arterial 60 600
Thoroughfare Priority 8
High Usage/Safety or Volume Issue 65 520
Potential Issue Soon/Built Out Area 35 280
Utilities 6
4” Water Main present 70 420
No 4” Water Main present 0 0
Traffic Service Area 4
North 46 184
South 21 84
East 19 76
Central 6 24
Lincoln Park 4 16
Four Mile 2 8
Southeast 2 8
Pavement Classification 1
AAC Overlay 50 50
AC Asphalt Concrete 70 70
APC Overlay 60 60
AST Asphalt Surface Treatment 40 40
GST Granular Surface 30 30
Jointed Reinforced Concrete 90 90
PCC Jointed Concrete 80 80
PCR Continuously Reinforced Concrete 90 90
UNS Unsurfaced 10 10
Statistical analysis allowed staff to see those road segments where paving treatment was needed most.
It is important to remember that this criterion was based on assigned values for each of the criteria listed
above. The higher the resulting score for a given road, the higher priority that road has for surface
treatment. Engineering judgment is required to process this priority, based on weighted criteria, into a
scope of work for a specific paving and rehabilitation project.
Other outside factors, such as project coordination, bike routes, utility work, drainage,
intersection/mobility issues, future improvement agreements, public improvement districts, complaints,
other community priorities, and safety, will require adjustment of a road’s priority for paving and
resurfacing. As an example, there are two reasons for this part of the prioritization process regarding
utility work. First, paving the full width of a road after completion of utility trenching and patchwork will
contribute to an overall increase in the City’s average OCI rating. Second, if the patchwork and paving
portion of the utility work is concurrent with a separate project to pave the entire road, a cost benefit in
the amount of the cost of utility patchwork may be applied towards the total resurfacing cost of that road.
Each plan year, the management model prepares a future roadway condition projection, exhausts the
assigned budget, and then produces an annual list of road segments to include in the maintenance
program. The model results are further adjusted by assigning the system target OCI. The City will need
to decide what pavement condition is the ultimate goal, realizing that budget constraints will limit how
“good” the roads can be. The model also takes into account inflation for the time value of money.
SECTION 6
Funding Scenarios
A regressive spending program occurs when insufficient funds are invested in road repairs, resulting in
an ever-increasing repair backlog. This is the mode the City is currently operating in system wide. With
the current funding there is equilibrium regarding maintenance only of the newest or best roadways. A
more progressive funding program is needed to provide sufficient funds to reduce the existing backlog
over time and maintain the pavement as it is reconstructed.
A number of funding scenarios were examined and modeled over a 30 year span:
Annual Budget Scenarios
$400,000 (Current Budget)
$1.33 Million (equates to 0.5% sales tax increase)
$2.66 Million (equates to 1.0% sales tax increase)
$3.90 Million (equates to 1.5% sales tax increase)
$10.5 Million (equates to 3.9% sales tax increase)
$12.6 Million (equates to 4.7% sales tax increase)
Target OCI Scenarios
Target OCI 55 (Fair Condition low range)
Target OCI 70 (Satisfactory Condition low range)
Target OCI 80 (Satisfactory Condition high range)
Target OCI 90 (Good Condition low range)
The annual budget model scenarios use an annual budgeted amount and a resulting OCI is generated
using the model prioritizations. The target OCI model scenarios use an OCI as a goal and adjust the
budget annually to meet that goal.
The five lowest of the annual budget scenarios never get the system condition to a preventative
maintenance mode or even fair condition and the condition continues to decline into the future. The 55
and 70 target OCI scenarios get the system to the target OCI and maintain that level but because the
cost of maintaining pavement in poor condition gets more expensive with time, the costs climb
exponentially through the model period. See Figure 7.

Figure 7
The final three scenarios, OCI 80 and $12.6M/yr & OCI 90, tend to correlate closer with each other and
get the system condition closer to a preventative maintenance cycle maintainable through the model
period. They correlate in relation to total money spent over the 30 year period but differ in money spent
annually. The OCI scenarios spend a large sum up front to bring the system average up and then do
nothing for years in between whereas the annual scenarios take many years to get the system average
up and then bank money in between maintenance years. All scenarios expend more towards the end of
the cycle because the aging pavement maintenance will always increase unless the City was on a
reconstruction schedule only. Inflation is also taken into account for these models. See Figure 8.
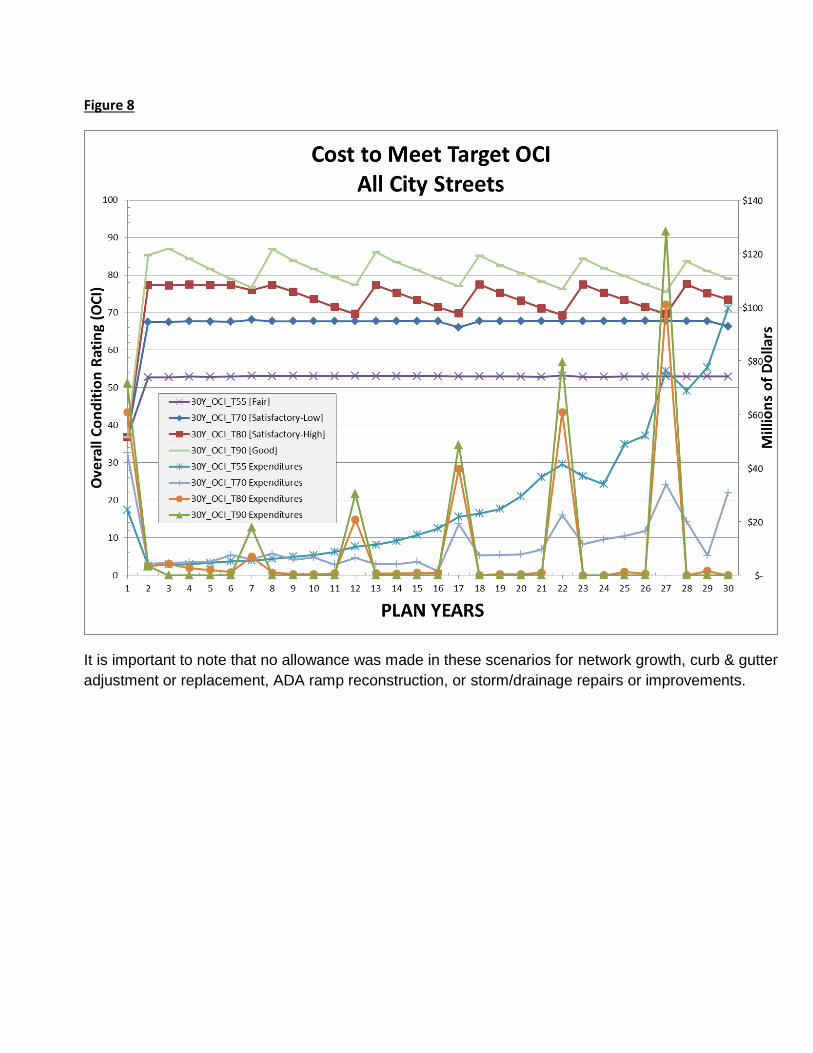
Figure 8
It is important to note that no allowance was made in these scenarios for network growth, curb & gutter
adjustment or replacement, ADA ramp reconstruction, or storm/drainage repairs or improvements.
SECTION 7
Recommended Plan of Action
The overall street system in the City is currently in poor condition. This study shows that future funding
will immediately be necessary to preserve and improve city-wide pavement conditions. The findings in
this report illustrate current funding levels are severely low and will not sustain the street system. Future
roadway funding levels need to be increased as soon as possible, as the street network is in need of
extensive city-wide roadway rehabilitation. If pre-emptive action is not taken, the large mileage of streets
currently in need of preventative maintenance will rapidly digress to poorer conditions that would subject
the City to far more expensive roadway work.
The City should strive to secure funding through any means the Finance Department and City Council
deem feasible. Funding sources could include sales tax increases, property tax increases, municipal
bonds, special assessments, increased excavation permit fees and development impact fees or
combinations of these sources. Some Colorado cities have implemented a street maintenance utility fee
or transportation authorities with dedicated tax collection or mill levy. Also, the City should continue
keeping abreast of the latest developments in pavement restoration technology that might offer a more
cost-effective alternative to pavement maintenance or rehabilitation over the pavement's life cycle.
The streets are a community’s single largest asset. The City has a major investment in its 115-mile
roadway network. Simply considering the pavement surface alone, without water, sewer, drainage,
curbing, or sidewalks assets, it would cost the City over $155,000,000 in today’s dollars to completely
replace the existing pavement infrastructure. Pavements are not perpetual; they are one of City’s fastest
deteriorating assets. Viable alternatives need investigated for additional roadway capital. Additional
roadway funding will protect the pavement assets, resulting in better overall roadway conditions, and
satisfaction that taxpayer dollars have been well spent.
Due to any inevitable shortfall in gap between needed and actual funding, the City should focus on
preserving street pavements that require less costly maintenance and rehabilitation procedures, while
looking for alternate funding to re-build and/or reconstruct streets that are beyond repair.
SECTION 8
Pavement Management System Maintenance
Pavement management is a systematic process that needs the long-term commitment of the City
decision-makers and support of City staff to maintain the pavement management system. The City now
has pavement management software to update the City’s street database in the future. Standard
management and upkeep of the database include the following practices:
• Post all annual pavement management segment improvements into the database. Both the pavement
condition ratings and the repair history information should be entered.
• Re-inspect Arterial and Collector roadways every 2 years and all local roads every 3 – 5 years.
• Add any new roadways to the database as soon as the City accepts them.
• Update repair type unit costs and inflation rates annually, re-calculate applicable funding models and
analyses.
• Implement a sound departmental quality control/assurance program, with particular focus on major pay
items such as hot mix asphalt.
The Engineering Department will support the proposed action plan and administer the Pavement
Management Program.
CREDITS
Adam Lancaster, PE, City Engineer - Project Oversight, Report Compilation
Ted Dell, Engineer Specialist - Pavement Survey, Data Compilation, Plan Modeling
Database Management, Data Research
Mike Pielow, GIS Specialist - Data Compilation, Database Management, Maps
Larry Hamilton, Public Works Inspector - Pavement Survey
Tony Falgien, Street Superintendent - Data Compilation, Cost Estimating


