The Virginia Home Sales Report for the first quarter of 2014
16
VIRGINIA Published by Virginia Association of REALTORS ® , the advocate for real estate professionals and property owners in Virginia. VIRGINIA HOME SALES REPORT SECOND FIRST QUARTER 2014 Analysis by the Virginia Center for Housing Research at Virginia Tech
Transcript
VIRGINIA Home SAleS RepoRt se
cond
Qu
arte
r
2011
Published by Virginia association of reaLtors®, the advocate for real estate professionals and property owners in Virginia.
VIRGINIA Home SAleS RepoRt se
cond
Qu
arte
r
2011
Published by Virginia association of reaLtors®, the advocate for real estate professionals and property owners in Virginia.
VIRGINIA Home SAleS RepoRt se
cond
Qu
arte
r
2011
Published by Virginia association of reaLtors®, the advocate for real estate professionals and property owners in Virginia.
FIR
ST
QUAR
TER
2014
Analysis by the Virginia Center for Housing Research at Virginia Tech
2014-Q1Virginia Quarterly Home Sales Report
Published by the Virginia Association of REALTORS®
Analysis by the Virginia Center for Housing Research at Virginia TechPage 2
0
2,000
4,000
6,000
8,000
10,000
12,000
January February March April May June July August September October November December
Num
ber o
f Sin
gle
Fam
ily, T
ownh
ome
and
Con
do S
ales
Month
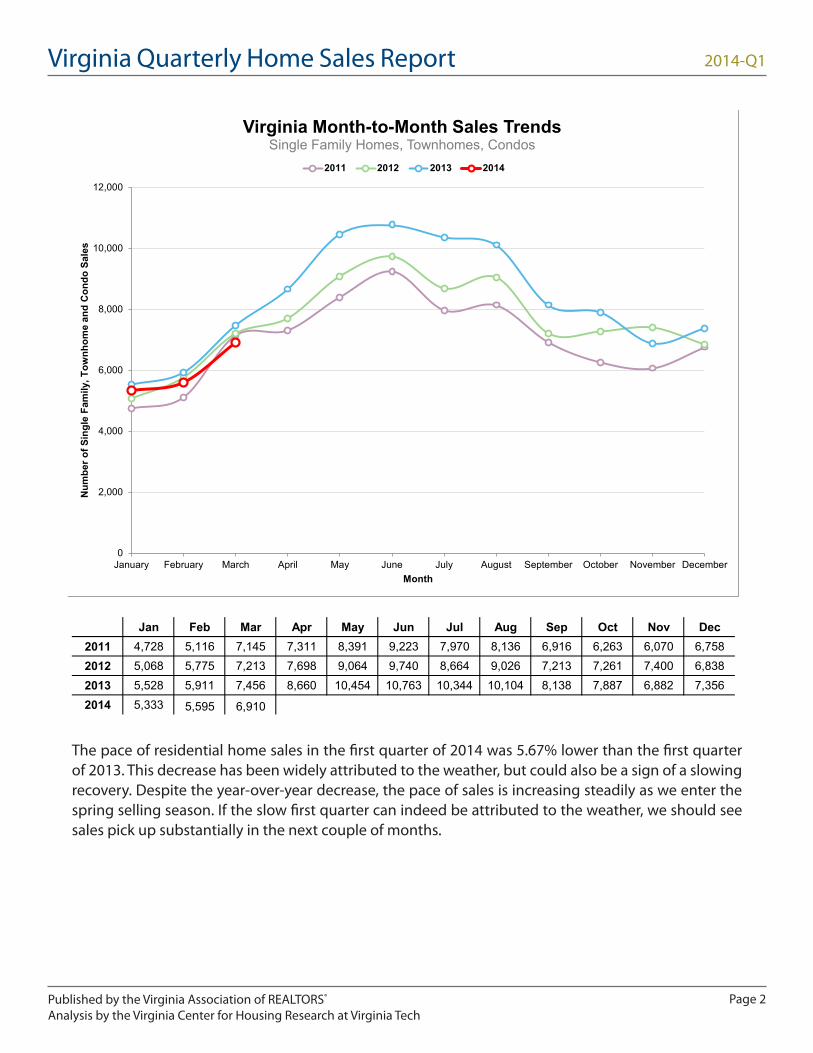
Virginia Month-to-Month Sales TrendsSingle Family Homes, Townhomes, Condos
2011 2012 2013 2014
Jan Feb Mar Apr May Jun Jul Aug Sep Oct Nov Dec2011 4,728 5,116 7,145 7,311 8,391 9,223 7,970 8,136 6,916 6,263 6,070 6,7582012 5,068 5,775 7,213 7,698 9,064 9,740 8,664 9,026 7,213 7,261 7,400 6,8382013 5,528 5,911 7,456 8,660 10,454 10,763 10,344 10,104 8,138 7,887 6,882 7,3562014 5,333 5,595 6,910
The pace of residential home sales in the first quarter of 2014 was 5.67% lower than the first quarter of 2013. This decrease has been widely attributed to the weather, but could also be a sign of a slowing recovery. Despite the year-over-year decrease, the pace of sales is increasing steadily as we enter the spring selling season. If the slow first quarter can indeed be attributed to the weather, we should see sales pick up substantially in the next couple of months.
2014-Q1Virginia Quarterly Home Sales Report
Published by the Virginia Association of REALTORS®
Analysis by the Virginia Center for Housing Research at Virginia TechPage 3
Virginia Quarterly Residential SalesSingle Family Homes, Townhomes, Condos
The pace of home sales was 5.67% lower in the first quarter of 2014 compared to the first quarter of 2013. Decreasing pace is typical for Virginia in the first quarter, primarily because the winter season lingers through February. Sales increased from 5,595 in February to 6,910 in March (23.5%), indicating that Virginia is moving into the higher paced spring selling season.
-5.67%YOY
2014-Q1Virginia Quarterly Home Sales Report
Published by the Virginia Association of REALTORS®
Analysis by the Virginia Center for Housing Research at Virginia TechPage 4
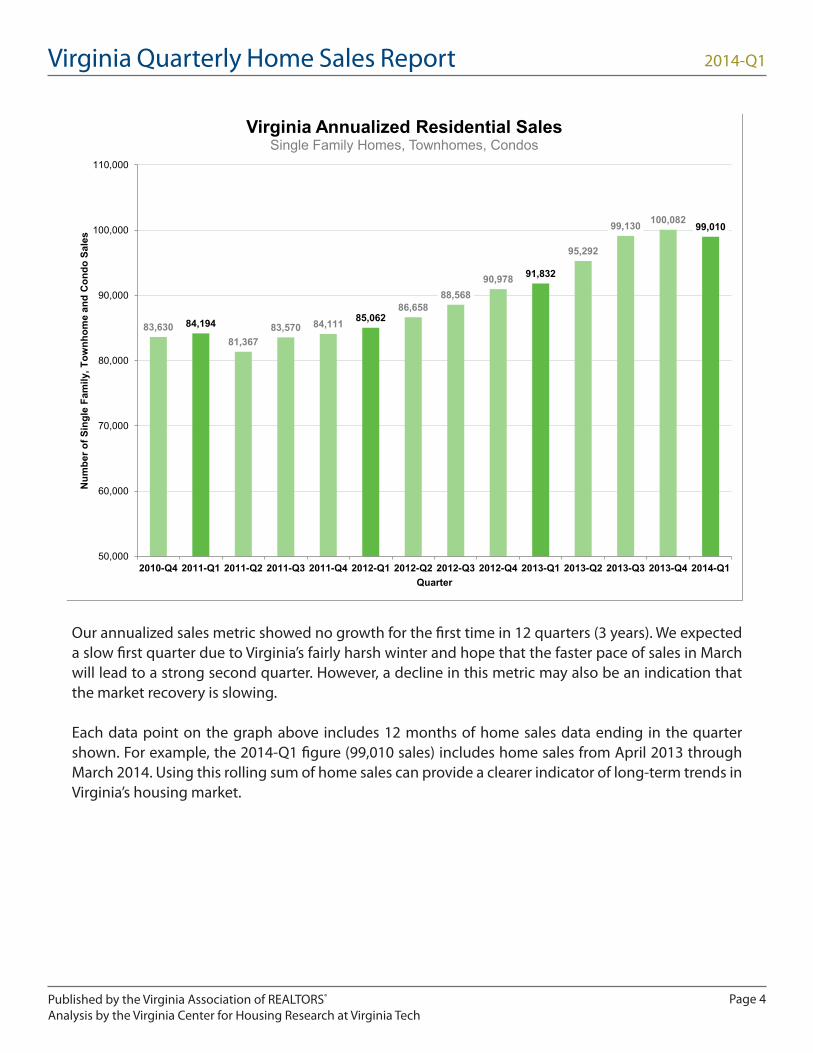
Virginia Annualized Residential SalesSingle Family Homes, Townhomes, Condos
Our annualized sales metric showed no growth for the first time in 12 quarters (3 years). We expected a slow first quarter due to Virginia’s fairly harsh winter and hope that the faster pace of sales in March will lead to a strong second quarter. However, a decline in this metric may also be an indication that the market recovery is slowing.
Each data point on the graph above includes 12 months of home sales data ending in the quarter shown. For example, the 2014-Q1 figure (99,010 sales) includes home sales from April 2013 through March 2014. Using this rolling sum of home sales can provide a clearer indicator of long-term trends in Virginia’s housing market.
2014-Q1Virginia Quarterly Home Sales Report
Published by the Virginia Association of REALTORS®
Analysis by the Virginia Center for Housing Research at Virginia TechPage 5
Region 2013-Q1 2014-Q1 ChangeCentral Valley 1,038 950 -8.5%
Central Virginia 2,945 2,881 -2.2%Hampton Roads / Chesapeake Bay 4,511 4,308 -4.5%
Southside Virginia 387 379 -2.1%Southwest Virginia 268 234 -12.7%
All of Virginia 18,899 17,834 -5.6%
Central Valley-8.5%
Northern Virginia-9.3%
Roanoke / Lynchburg / Blacksburg+8.3%
Southwest Virginia-12.7% Southside Virginia
-2.1%Hampton Roads /Chesapeake Bay
-4.5%
Central Virginia-2.2%
Regional Changes in Sales2013-Q1 vs. 2014-Q1 Units
Every region of the state experienced a slower pace of sales compared to the first quarter of 2013 with exception of the Roanoke/Lynchburg/Blacksburg region. Decreases in sales ranged from 2.1% (8 fewer sales) in Southside to 9.3% (781 fewer sales) in Northern Virginia.
2014-Q1Virginia Quarterly Home Sales Report
Published by the Virginia Association of REALTORS®
Analysis by the Virginia Center for Housing Research at Virginia TechPage 6
Virginia Median Residential Sales PriceSingle Family Homes, Townhomes, Condos
The median sales price in Virginia increased 1% over the past year to $235,000. Looking at the longer term trend, the median sales price in Virginia has increased by 11.9% over 2011-Q1. The median price decreased steadily from second quarter of 2013, following the typical pattern of seasonal price fluctuation in Virginia. Previous years indicate that prices will increase through the second quarter and level out in the third quarter.
+11.9%
+1.03%
2014-Q1Virginia Quarterly Home Sales Report
Published by the Virginia Association of REALTORS®
Analysis by the Virginia Center for Housing Research at Virginia TechPage 7
Region 2013-Q1 2014-Q1 ChangeCentral Valley $186,965 $188,750 1.0%
Central Virginia $175,000 $187,000 6.9%Hampton Roads / Chesapeake Bay $195,000 $192,250 -1.4%
Southside Virginia $72,000 $75,500 4.9%Southwest Virginia $120,000 $100,000 -16.7%
All of Virginia $240,535 $235,000 -2.3%
Roanoke / Lynchburg / Blacksburg+0.3%
Central Valley+1.0%
Northern Virginia+2.9%
Southwest Virginia-16.7% Southside Virginia
+4.9%Hampton Roads /Chesapeake Bay
-1.4%
Central Virginia+6.9%
Regional Changes in Median Sales Prices2013-Q1 vs. 2014-Q1
Median sales price stayed fairly stable throughout the state. Only Southwest Virginia experienced a significant change (-16.7%). Based on state trends, we can expect to see increases in prices in all regions through the second quarter.
2014-Q1Virginia Quarterly Home Sales Report
Published by the Virginia Association of REALTORS®
Analysis by the Virginia Center for Housing Research at Virginia TechPage 8
Virginia Quarterly Residential Sales Volume ($M)Single Family Homes, Townhomes, Condos
This graph illustrates the dollar value of real estate sold (in millions) during each quarter over the past three years. The volume of real estate sold in the first quarter of 2014 ($5.2B) decreased 4.2% from the first quarter of 2013 ($5.4B) primarily due to a slower pace of sales. Median sales price was slightly higher this quarter than in the first quarter of 2013.
-4.2% YOY
2014-Q1Virginia Quarterly Home Sales Report
Published by the Virginia Association of REALTORS®
Analysis by the Virginia Center for Housing Research at Virginia TechPage 9
Virginia Price Distribution Of Residential Home SalesSingle Family Homes, Townhomes, Condos
2013-Q1 2014-Q1
-9%
-7%
-4%
-7%
-2%
-2%
-3%
4%
-31%
9%
Year-over-year home sales decreased in all price ranges this quarter except for the $1-$2M price ranges. Sales increased 4% in the $1M-1.5M range and 9% in the $1.5M-2M range. These increases represent a very small number of sales, 4 and 7 sales respectively. Given the small number of sales, there is not much insight to be gained from these relatively small increases. During the first quarter, unemployment and mortgage interest rates remained stable, so decreases in most of the price ranges likely reflect the seasonal trend. The decrease was most substantial in the $2M+ price range, 31%. Again, since this decrease represents a very small number of sales (11) there is not a lot of insight to be gained from this decrease, although it is reasonable that increases in interest rates would have the largest impact among higher priced sales. Decreases in other price ranges ranged from 2% to 9%.
2014-Q1Virginia Quarterly Home Sales Report
Published by the Virginia Association of REALTORS®
Analysis by the Virginia Center for Housing Research at Virginia TechPage 10
Virginia Average Days On MarketSingle Family Homes, Townhomes, Condos
Days on the market remain relatively low and the year-over-year change was slight. Time on the market increased 15% from the fourth quarter of 2013 to an average of 92 days in the first quarter of 2014. Days on the market dropped from 98 in February to 89 in March indicating that the spring selling season is underway.
+1%YOY
2014-Q1Virginia Quarterly Home Sales Report
Published by the Virginia Association of REALTORS®
Analysis by the Virginia Center for Housing Research at Virginia TechPage 11
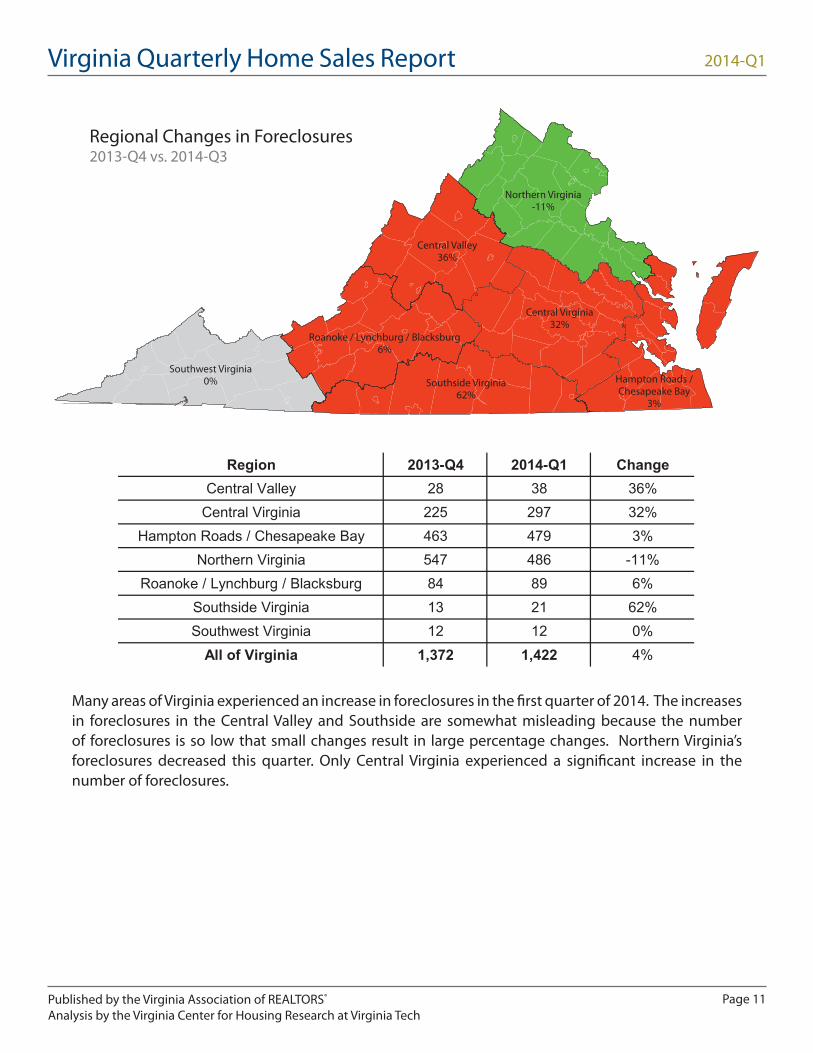
Region 2013-Q4 2014-Q1 ChangeCentral Valley 28 38 36%
Central Virginia 225 297 32%Hampton Roads / Chesapeake Bay 463 479 3%
Southside Virginia 13 21 62%Southwest Virginia 12 12 0%
All of Virginia 1,372 1,422 4%
Central Valley36%
Northern Virginia-11%
Roanoke / Lynchburg / Blacksburg6%
Southwest Virginia0% Southside Virginia
62%Hampton Roads /Chesapeake Bay
3%
Central Virginia32%
Regional Changes in Foreclosures2013-Q4 vs. 2014-Q3
Many areas of Virginia experienced an increase in foreclosures in the first quarter of 2014. The increases in foreclosures in the Central Valley and Southside are somewhat misleading because the number of foreclosures is so low that small changes result in large percentage changes. Northern Virginia’s foreclosures decreased this quarter. Only Central Virginia experienced a significant increase in the number of foreclosures.
2014-Q1Virginia Quarterly Home Sales Report
Published by the Virginia Association of REALTORS®
Analysis by the Virginia Center for Housing Research at Virginia TechPage 12
Monthly Residential Median Sales PriceVIRGINIA (All MLS-Reported Home Sales) UNITED STATES (Existing Home Sales)
The median sales price in Virginia also increased more quickly than prices in the United States as a whole. The US median price increased only 0.7% from January to February while Virginia’s price increased 1.9%.
The pace of Virginia home sales has been similar to the pace of sales in the United States as a whole throughout the year. Both the United States as a whole and Virginia continued to experience seasonal decline through January, but the pace picked up in February. Virginia’s pace increased slightly faster than that of the United States as a whole.
2014-Q1Virginia Quarterly Home Sales Report
Published by the Virginia Association of REALTORS®
Analysis by the Virginia Center for Housing Research at Virginia TechPage 13
Unemployment Rates By State seasonally adjusted, November 2013
(U.S. rate = 7.0 percent)
14.0% and over
12.0% to 13.9%
10.0% to 11.9%
8.0% to 9.9%
6 0% t 7 9%
SOURCE: Bureau of Labor Statistics Local Area Unemployment Statistics
Virginia Unemployment RateSource: Bureau of Labor & Statistics
Virginia’s unemployment rate decreased in the first quarter of 2014 to 4.9% in February. Virginia remained at the second lowest level of unemployment in the United States in March, but unemployment rose to 5.0%. It isn’t likely that this slight rise in unemployment had a discernible impact on sales.
2013-Q3 unemployment rate based on preliminary August 2013 data.
2014-Q1Virginia Quarterly Home Sales Report
Published by the Virginia Association of REALTORS®
Analysis by the Virginia Center for Housing Research at Virginia TechPage 14
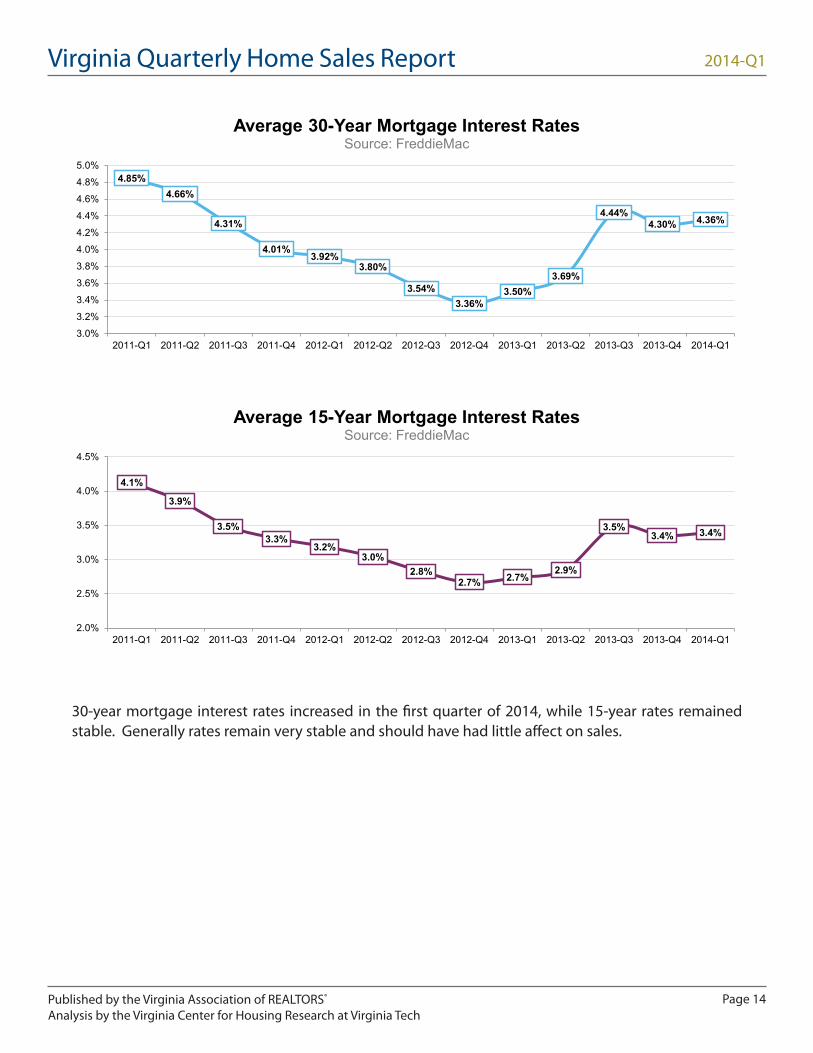
Average 15-Year Mortgage Interest RatesSource: FreddieMac
30-year mortgage interest rates increased in the first quarter of 2014, while 15-year rates remained stable. Generally rates remain very stable and should have had little affect on sales.
2014-Q1Virginia Quarterly Home Sales Report
Published by the Virginia Association of REALTORS®
Analysis by the Virginia Center for Housing Research at Virginia TechPage 15
The Virginia Association of REALTORS® (VAR) is the business advocate for real estate professionals in Virginia. VAR represents more than 29,000 REALTORS® active in all phases of real estate brokerage, management, development and appraisal. Our mission is to enhance our membership’s ability to achieve business success.
All inquiries regarding this report should be directed to:
Stacey Ricks, Chief of Marketing and CommunicationsVirginia Association of REALTORS®10231 Telegraph Road, Glen Allen, VA 23059(804) 249-5716 [email protected]/HomeSales
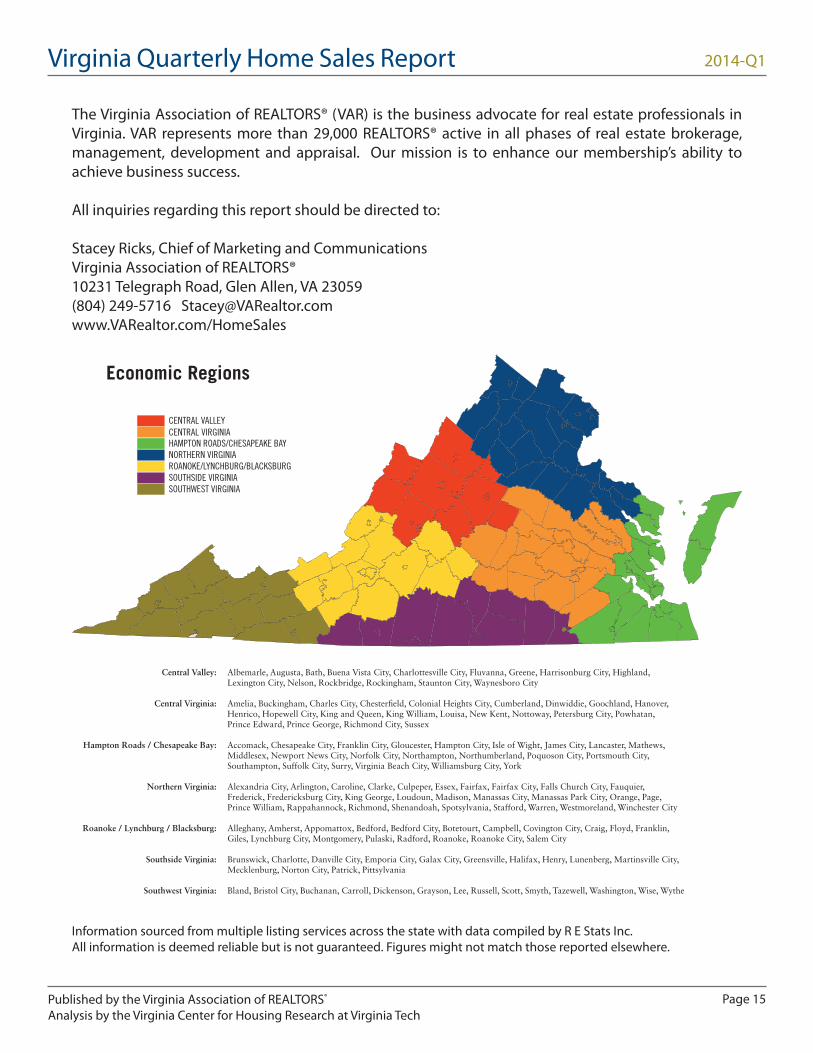
Economic Regions
Central Valley:
Central Virginia:
Hampton Roads / Chesapeake Bay:
Northern Virginia:
Roanoke / Lynchburg / Blacksburg:
Southside Virginia:
Southwest Virginia:
Albemarle, Augusta, Bath, Buena Vista City, Charlottesville City, Fluvanna, Greene, Harrisonburg City, Highland, Lexington City, Nelson, Rockbridge, Rockingham, Staunton City, Waynesboro City
Amelia, Buckingham, Charles City, Chester�eld, Colonial Heights City, Cumberland, Dinwiddie, Goochland, Hanover, Henrico, Hopewell City, King and Queen, King William, Louisa, New Kent, Nottoway, Petersburg City, Powhatan, Prince Edward, Prince George, Richmond City, Sussex
Accomack, Chesapeake City, Franklin City, Gloucester, Hampton City, Isle of Wight, James City, Lancaster, Mathews, Middlesex, Newport News City, Norfolk City, Northampton, Northumberland, Poquoson City, Portsmouth City, Southampton, Suffolk City, Surry, Virginia Beach City, Williamsburg City, York
Alexandria City, Arlington, Caroline, Clarke, Culpeper, Essex, Fairfax, Fairfax City, Falls Church City, Fauquier, Frederick, Fredericksburg City, King George, Loudoun, Madison, Manassas City, Manassas Park City, Orange, Page, Prince William, Rappahannock, Richmond, Shenandoah, Spotsylvania, Stafford, Warren, Westmoreland, Winchester City
Alleghany, Amherst, Appomattox, Bedford, Bedford City, Botetourt, Campbell, Covington City, Craig, Floyd, Franklin, Giles, Lynchburg City, Montgomery, Pulaski, Radford, Roanoke, Roanoke City, Salem City
Brunswick, Charlotte, Danville City, Emporia City, Galax City, Greensville, Halifax, Henry, Lunenberg, Martinsville City, Mecklenburg, Norton City, Patrick, Pittsylvania
Information sourced from multiple listing services across the state with data compiled by R E Stats Inc.All information is deemed reliable but is not guaranteed. Figures might not match those reported elsewhere.