2014 Seminole County Travel Time & Delay Study Prepared For: Seminole County Public Works Department Engineering Division RFP-600878-10/BJC Metric Project No. 4.2001.04 Prepared By: Metric Engineering, Inc. 615 Crescent Executive Court, Suite 524 Lake Mary, FL 32746 Florida Certification No. EB-0002294 May 2014
Transcript
2014 Seminole County Travel Time & Delay Study
Prepared For:
Seminole County Public Works Department
Engineering Division
RFP-600878-10/BJC Metric Project No. 4.2001.04
Prepared By:
Metric Engineering, Inc. 615 Crescent Executive Court, Suite 524
Lake Mary, FL 32746 Florida Certification No. EB-0002294
3.1. Data Collection Schedule .............................................................................8 3.2. Time of Day .................................................................................................9 3.3. Data Collection ..........................................................................................12 3.4. Data Analysis .............................................................................................13
Table 5: Roadways Operating at LOS E and LOS F .............................................................. 16
2014 Seminole County Travel Time and Delay Study
Metric Engineering, Inc. ii
List of Appendices
Appendix A: Year 2014 Summary of State Roads
Appendix B: Year 2014 Summary of County Roads
Appendix C: Historical Summary of State Roads
Appendix D: Historical Summary of County Roads
Appendix E: Summary of Concurrency Database Showing Roadway Sections Operating at LOS E and LOS F
Appendix F: Data Collection Equipment Specifications
2014 Seminole County Travel Time and Delay Study
Metric Engineering, Inc. 1
1. INTRODUCTION
Seminole County Public Works Department requested Metric Engineering, Inc. (MEI) to
perform a Travel Time and Delay Study for a group of State and County roadways in Seminole
County. The roadways under study are shown on a county map in Figure 1 with the legend
provided in Table 1.
The purpose of this study is to quantify a series of Measures of Effectiveness (MOE’s) (level of
service (LOS), travel speed, etc.) on the study roadways to identify problem locations with high
traffic congestion and serve as a basis for evaluations of transportation improvements. The
analysis methods used in conducting this study are consistent with those set forth in the Manual
on Uniform Traffic Studies (MUTS).
Travel time and delay information was collected for a total of 319.9 miles of state and county
roads; which includes nine (9) state roads totaling 120.9 miles, and sixty-five (65) county roads
totaling 199.0 miles. A complete list of the study roadways along with the associated limits is
shown in Table 2. The peak hours for the study roadways were determined based upon the most
current (year 2013) traffic data from Seminole County.
For this study, MEI has employed state-of-the-art technology based on a combination of Global
Positioning System (GPS) and Geographical Information Systems (GIS) technologies for data
collection and analysis. The GPS approach has proven to be cost-effective, safer, and more
accurate than other methods. QStarz Travel Recorder X were used for collecting field data; and
GeoStats TravTime software package for data reduction were chosen based on previous
experience in conducting similar travel time and delay studies.
Lake Jesup
Lake Harney
Lake Monroe
SANFORD
SANFORD
LAKE MARY
WINTER SPRINGSLONGWOOD
CASSELBERRYOVIEDO
ALTAMONTE SPRINGS
C42
C46
C4
C37
C18A
C52
C32
C1
C39
C33
C7
C2
C25
C26C56
C34
C29
C20
C64
C58
C17
C13
C57
C24 C5
9
C50
C45
C61
C8
C43
C10
C14
C3C3
0
C16
C6
C21
C5
C27
C65
C44
C11
C41
C40
C48
C51
C15
C23
C12
C38
C28
C9 C22
C62
C7
C53
C35
C19
C31
C60C55 C47
C8
C49
C54C63
C36
C18BS6
S3B
S1A
S5A
S5B
S3C
S4A
S3A
S7
S4BS2
S4B
S1B
S3C
S8
S9
/
0 1 2 3 40.5Miles
YEAR 2014 TRAVEL TIME AND DELAY STUDYStudy Map
Prepared for: Prepared by:
County RoadState Road
LegendFigure 1
2014 Seminole County Travel Time and Delay Study
Metric Engineering, Inc. 3
Table 1: Map Legend
State Roads
S1 SR 46 S6 SR 400 (I-4) S2 SR 419 S7 SR 426 S3 SR 434 S8 SR 414 (Maitland Blvd) S4 SR 436 S9 SR 417 S5 US 17/92
County Roads
C1 Airport Blvd./MLK Jr. Blvd. C34 North St.C2 CR 15 C35 Snow Hill Rd. C3 Central Pkwy C36 13th St./Celery Ave. C4 Chapman Rd. C37 Bear Lake Rd. C5 CR 419 C38 Bunnell Rd.C6 CR 426 C39 CR 431C7 CR 427 C40 Dike Rd.C8 CR 46A C41 Eden Park Rd. C9 Dean Rd. C42 EE Williamson Rd./Longwood C10 Dodd Rd. Hills Rd.C11 Dog Track Rd./Seminola Blvd./Lake Dr. C43 Greenway Blvd. C12 Douglas Ave. C44 Greenwood Blvd. C13 Howell Branch Rd. C45 E. Lake Brantley Dr. C14 Hunt Club Blvd. C46 W. Lake Brantley Rd. C15 International Pkwy. C47 Lake of the Woods Blvd. C16 Lake Emma Rd. C48 Lake Park Dr. C17 Lake Howell Rd. C49 Lake Way Rd. C18 Lake Mary Blvd./SR 415 C50 Longwood Markham Rd. C19 Lockwood Blvd. C51 Markham Rd. C20 Maitland Ave. C52 Old Lake Mary Rd. C21 Markham Woods Rd. C53 Old Lockwood Rd. C22 McCulloch Rd. C54 Orange Ave.C23 Mitchell Hammock Rd. C55 Oranole Rd.C24 Montgomery Rd. C56 Oxford Rd.C25 Palm Springs Dr. C57 Pearl Lake Cswy C26 Red Bug Lake Rd. C58 Rangeline Rd. C27 Rinehart Rd. C59 Raymond Ave. C28 Sand Lake Rd. C60 Slavia Rd.C29 Sanford Ave. C61 Tangerine Ave. C30 Tuskawilla Rd. C62 Towne Center Blvd. C31 Wekiva Springs Rd. C63 W. Town Pkwy. C32 Wymore Rd. C64 Winter Park Dr. C33 Longwood Lake Mary Rd. C65 Derbyshire Dr.
2014 Seminole County Travel Time and Delay Study
Metric Engineering, Inc. 4
Table 2: Roadway Limits
Road Number
State Road From To Length Miles
S1 SR 46 Lake Co. Line Volusia Co. Line 25.1
S2 SR 419 US 17-92 SR 434 2.6
S3 SR 434 Orange Co. Line (West) Orange Co. Line (East) 22.0
S4 SR 436 Orange Co. Line (West) Orange Co. Line (South) 11.6
S5 US 17-92 Orange Co. Line Volusia Co. Line 17.2
S6 SR 400 (I-4) Orange Co. Line Volusia Co. Line 14.4
S7 SR 426 Orange Co. Line SR 434 7.0
S8 SR 414 (Maitland Blvd) Bear Lake Rd. Maitland Summit Blvd. 2.6
S9 SR 417 Orange Co. Line International Pkwy. 18.4
Road Number County Road From To
Length Miles
C1 Airport Blvd./MLK Jr. Blvd SR 46 Sanford Ave. 4.6
C2 CR 15 CR 427 US 17-92 8.0
C3 Central Pkwy. Palm Springs Dr. Montgomery Rd. 1.9
C4 Chapman Rd. SR 434 SR 426 1.6
C5 CR 419 SR 434 Orange Co. Line 7.4
C6 CR 426 CR 419 SR 46 7.8
C7 CR 427 Ballard St. Lake Mary Blvd. 10.4
C8 CR 46A Orange Blvd. (CR 431) US 17-92 5.5
C9 Dean Rd. Orange Co. Line SR 426 0.6
C10 Dodd Rd. Howell Branch Rd. Red Bug Lake Rd. 1.9
C11 Dog Track Rd./Seminola Blvd./Lake Dr. CR 427 Tuskawilla Rd. 5.2
C12 Douglas Ave. SR 436 SR 434 1.9
C13 Howell Branch Rd. SR 426 Lakemont Ave. 3.6
C14 Hunt Club Blvd. SR 436 Wekiva Springs Rd. 2.8
C15 International Pkwy. Lake Mary Blvd. SR 46 4.3
C16 Lake Emma Rd. Longwood Hills Rd. Lake Mary Blvd. 3.0
C17 Lake Howell Rd. Orange Co. Line SR 436 2.1
C18 Lake Mary Blvd./SR 415 Markham Woods Rd. Volusia Co. Line 13.4
C19 Lockwood Blvd. McCulloch Rd. CR 419 3.9
C20 Maitland Ave. Orange Co. Line SR 436 1.6
C21 Markham Woods Rd. SR 434 Markham Rd. 7.4
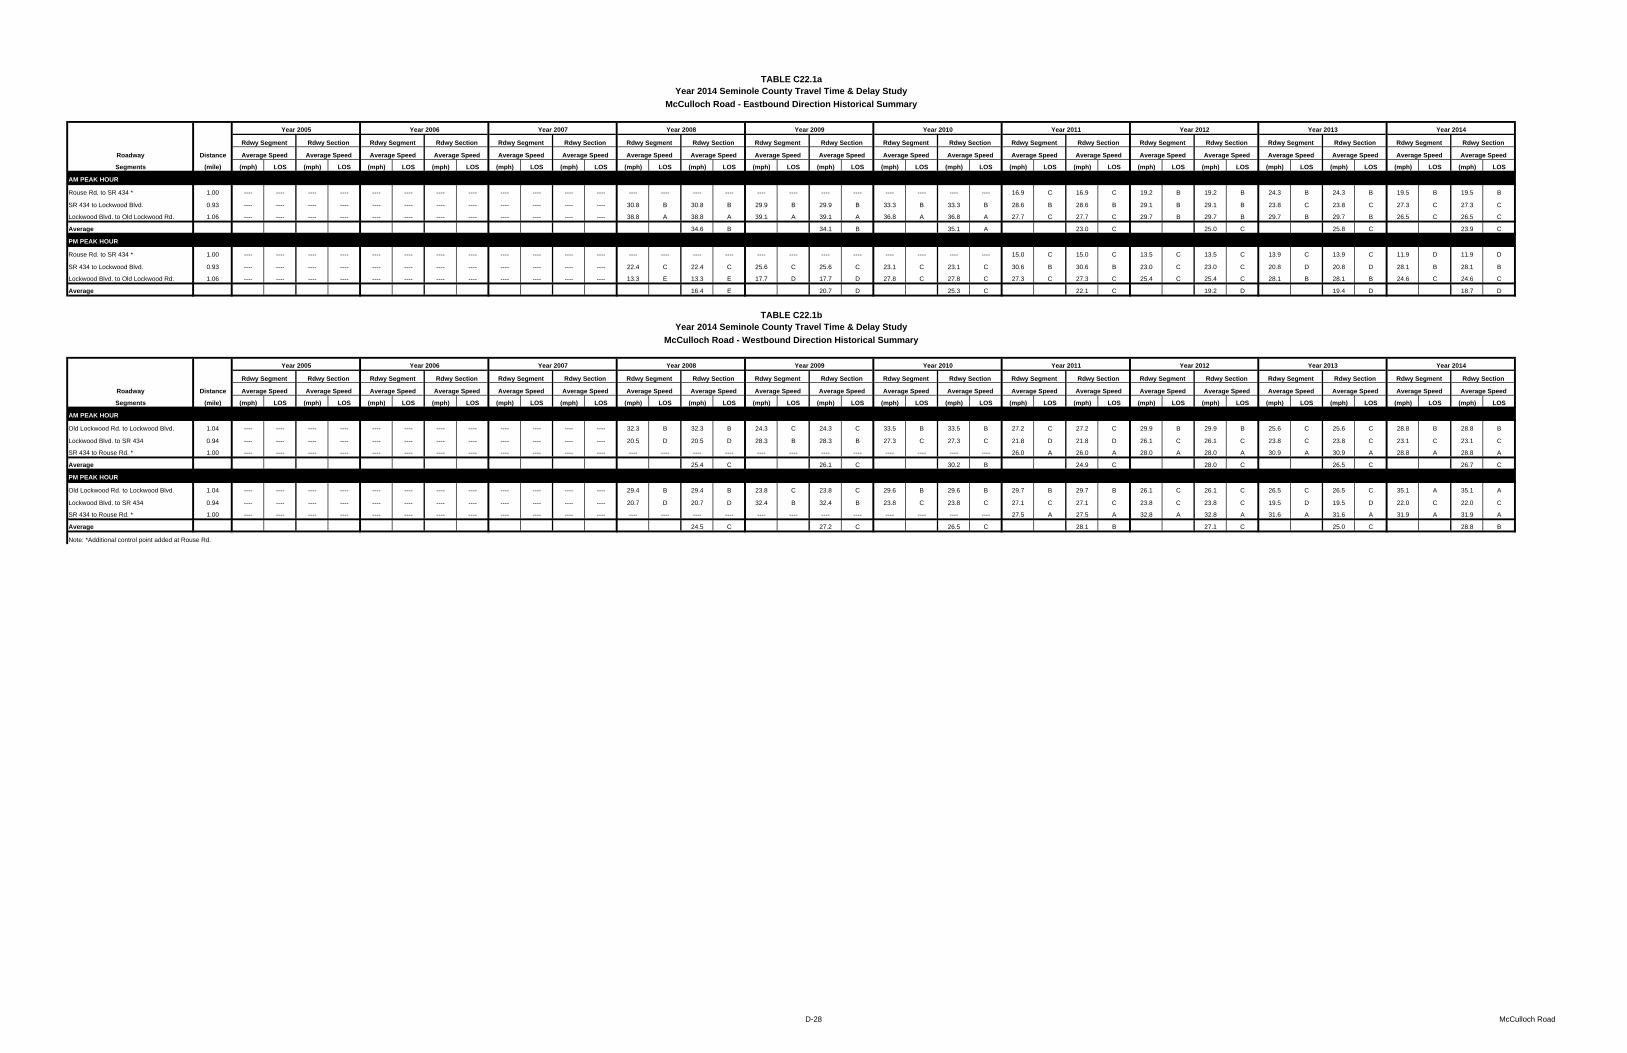
C22 McCulloch Rd. Rouse Rd. Old Lockwood Rd. 3.0
C23 Mitchell Hammock Rd. SR 426 Lockwood Blvd. 2.9
C24 Montgomery Rd. SR 436 SR 434 1.8
C25 Palm Springs Dr. SR 436 SR 434 2.4
C26 Red Bug Lake Rd. SR 436 SR 426 6.3
2014 Seminole County Travel Time and Delay Study
Metric Engineering, Inc. 5
Table 2 (cont.)
Road Number County Road From To
Length Miles
C27 Rinehart Rd. Lake Mary Blvd. SR 46 4.4
C28 Sand Lake Rd. Line Dr. SR 434 2.5
C29 Sanford Ave. Lake Mary Blvd. W. 1st St. 3.5
C30 Tuskawilla Rd. SR 426 SR 434 5.7
C31 Wekiva Springs Rd. Orange Co. Line SR 434 4.1
C32 Wymore Rd. Oranole Rd. SR 436 1.6
C33 Longwood Lake Mary Rd. US 17/92 Lake Mary Blvd. 2.5
Roadway Limit Distance Control Time Delay Roadway Average Speed Average Speed Avg. Speed Avg. Fuel
Segment (mph) (ft) Device (sec) (sec) Class (mph) LOS (mph) LOS (mph) Consump.
AM PEAK HOUR - Part C
SR 419 to Consolidated Services/Orange Ave. 50 950 Signal 31.8 2.4 I 20.4 E
Consolidated/Orange Ave. to Winding Hollow Blvd. 50 2,376 Signal 39.0 3.6 I 41.5 B
Winding Hollow Blvd. to Central Winds Park 50/45 3,802 Signal 62.4 2.4 I 41.5 B
Central Winds Park to Doran Rd. 45 2,218 Signal 33.6 0.0 I 45.0 A
Doran Rd. to Tuskawilla Rd. 45 1,426 Signal 54.6 20.4 I 17.8 E 33.2 C
Tuskawilla Rd. to Spring Ave. 50 8,923 Stop 125.4 0.0 I 48.5 A
Spring Ave. to Vistawilla Dr. 50 1,056 Signal 18.6 1.2 I 38.7 B
Vistawilla Drive to SR 417 (S. Ramps) 45 1,690 Signal 40.2 6.6 I 28.7 C 43.2 A
SR 417 (S. Ramps) to SR 417 (N. Ramps) 45 581 Signal 21.0 4.8 I 18.9 E
SR 417 (N. Ramps) to Palm Dr. 45 1,162 Stop 21.0 0.0 I 37.7 B
Palm Dr. to De Leon St. 45 4,330 Stop 70.8 0.0 I 41.7 B 36.7 B
De Leon St. to Magnolia St. 45/40 4,805 Signal 89.4 1.2 II 36.6 A
Magnolia St. to SR 426/CR 419 40/30 2,482 Signal 112.8 40.2 II 15.0 E 24.6 C
SR 426/CR 419 to Clark St. 30/35 1,320 Stop 45.6 14.4 II 19.7 D
Clark St. to Mitchell Hammock Rd. 35/45 3,960 Signal 196.8 81.6 II 13.7 E
Mitchell Hammock Rd. to Alafaya Woods Blvd. 45 2,376 Signal 40.8 1.2 II 39.7 A 18.4 D
Alafaya Woods Blvd. to Chapman Rd. 50 3,010 Signal 46.8 1.2 II 43.8 A
Chapman Rd. to Stillwater Dr. 50 3,221 Stop 48.0 1.8 II 45.7 A
Stillwater Dr. to Carrigan Ave. 50 2,112 Signal 37.2 3.0 II 38.7 A
Carrigan Ave. to Econ River Pl. 50 845 Stop 12.6 0.0 II 45.7 A
Econ River Pl. to E. Palm Valley Dr. 50 3,062 Signal 57.6 1.8 II 36.2 A
E. Palm Valley Dr. to McCulloch Rd. 50 1,373 Signal 46.8 3.0 II 20.0 D 37.3 A
TOTAL 57,077 1,252.8 190.8 31.1 0.372 gal/veh
PM PEAK HOUR - Part C
SR 419 to Consolidated Services/Orange Ave. 50 950 Signal 31.2 1.2 I 20.8 E
Consolidated/Orange Ave. to Winding Hollow Blvd. 50 2,376 Signal 45.0 3.6 I 36.0 B
Winding Hollow Blvd. to Central Winds Park 50/45 3,802 Signal 56.4 0.0 I 46.0 A
Central Winds Park to Doran Rd. 45 2,218 Signal 42.0 3.0 I 36.0 B
Doran Rd. to Tuskawilla Rd. 45 1,426 Signal 33.6 3.6 I 28.9 C 35.3 B
Tuskawilla Rd. to Spring Ave. 50 8,923 Stop 126.0 0.0 I 48.3 A
Spring Ave. to Vistawilla Dr. 50 1,056 Signal 16.8 0.0 I 42.9 A
Vistawilla Drive to SR 417 (S. Ramps) 45 1,690 Signal 61.2 12.0 I 18.8 E 39.0 B
SR 417 (S. Ramps) to SR 417 (N. Ramps) 45 581 Signal 13.8 0.0 I 28.7 C
SR 417 (N. Ramps) to Palm Dr. 45 1,162 Stop 22.8 0.0 I 34.7 B
Palm Dr. to De Leon St. 45 4,330 Stop 76.8 0.0 I 38.4 B 36.5 B
De Leon St. to Magnolia St. 45/40 4,805 Signal 105.6 7.8 II 31.0 B
Magnolia St. to SR 426/CR 419 40/30 2,482 Signal 111.0 34.2 II 15.2 E 22.9 C
SR 426/CR 419 to Clark St. 30/35 1,320 Stop 56.4 8.4 II 16.0 E
Clark St. to Mitchell Hammock Rd. 35/45 3,960 Signal 184.8 99.6 II 14.6 E
Mitchell Hammock Rd. to Alafaya Woods Blvd. 45 2,376 Signal 60.0 13.8 II 27.0 C 17.3 D
Alafaya Woods Blvd. to Chapman Rd. 50 3,010 Signal 75.0 10.2 II 27.4 C
Chapman Rd. to Stillwater Dr. 50 3,221 Stop 74.4 13.8 II 29.5 B
Stillwater Dr. to Carrigan Ave. 50 2,112 Signal 30.6 0.0 II 47.1 A
Carrigan Ave. to Econ River Pl. 50 845 Stop 11.4 0.0 II 50.5 A
Econ River Pl. to E. Palm Valley Dr. 50 3,062 Signal 56.4 6.6 II 37.0 A
E. Palm Valley Dr. to McCulloch Rd. 50 1,373 Signal 81.0 30.0 II 11.6 F 28.2 B
TOTAL 57,077 1,372.2 247.8 28.4 0.376 gal/veh
* Construction in progress on SR 434 from Jetta Point Dr to Clonts St (Financial Project IDs: 422015-2 & 427259-1) which may have skewed the LOS for the segments.
TABLE S3.1cYear 2014 Seminole County Travel Time & Delay Study
Roadway Limit Distance Control Time Delay Roadway Average Speed Average Speed Avg. Speed Avg. Fuel
Segment (mph) (ft) Device (sec) (sec) Class (mph) LOS (mph) LOS (mph) Consump.
AM PEAK HOUR - Part C
McCulloch Rd to E. Palm Valley Dr. 50 1,373 Signal 22.8 0.0 II 41.1 A
E. Palm Valley Dr. to Econ River Pl. 50 3,062 Stop 42.0 0.0 II 49.7 A
Econ River Pl. to Carrigan Ave. 50 845 Signal 12.0 0.0 II 48.0 A
Carrigan Ave. to Stillwater Dr. 50 2,112 Stop 28.8 0.0 II 50.0 A
Stillwater Dr. to Chapman Rd. 50 3,221 Signal 82.2 13.2 II 26.7 C
Chapman Rd. to Alafaya Woods Blvd. 50 3,010 Signal 58.8 5.4 II 34.9 B 37.7 A
Alafaya Woods Blvd. to Mitchell Hammock Rd. 45 2,376 Signal 77.4 16.8 II 20.9 D
Mitchell Hammock Rd. to Clark St. 45/35 3,960 Stop 79.8 0.0 II 33.8 B
Clark St. to SR 426/CR 419 35/30 1,531 Signal 123.0 58.2 II 8.5 F 19.1 D
SR 426/CR 419 to Magnolia St. 30/40 2,534 Signal 67.2 4.8 II 25.7 C
Magnolia St. to De Leon St. 40 4,805 Stop 88.8 3.0 II 36.9 A 32.1 B
De Leon St. to Palm Dr. 45/40 4,330 Stop 76.2 0.6 I 38.7 B
Palm Dr. to SR 417 (N. Ramps) 45 1,162 Signal 34.2 9.0 I 23.2 D
SR 417 (N. Ramps) to SR 417 (S. Ramps) 45 581 Signal 11.4 0.0 I 34.7 B 34.0 C
SR 417 (S. Ramps) to Vistawilla Dr. 45/50 1,690 Signal 25.8 0.0 I 44.6 A
Vistawilla Dr. to Spring Ave. 50 1,056 Stop 16.8 0.0 I 42.9 A
Spring Ave. to Tuskawilla Rd. 45/50 8,923 Signal 137.4 4.8 I 44.3 A 44.2 A
Tuskawilla Rd. to Doran Rd. 45 1,426 Signal 24.6 0.0 I 39.5 B
Doran Rd. to Central Winds Park 45 2,218 Signal 45.6 3.0 I 33.2 C
Central Winds Park to Winding Hollow Blvd. 50 3,802 Signal 75.6 10.8 I 34.3 B
Winding Hollow Blvd. to Consolidated/Orange Ave. 50 2,376 Signal 44.4 4.2 I 36.5 B
Consolidated/Orange Ave. to SR 419 50 950 Signal 64.2 34.2 I 10.1 F 28.9 C
TOTAL 57,341 1,239.0 168.0 31.6 0.378 gal/veh
PM PEAK HOUR - Part C
McCulloch Rd to E. Palm Valley Dr. 50 1,373 Signal 25.8 0.0 II 36.3 A
E. Palm Valley Dr. to Econ River Pl. 50 3,062 Stop 43.2 0.0 II 48.3 A
Econ River Pl. to Carrigan Ave. 50 845 Signal 19.2 0.6 II 30.0 B
Carrigan Ave. to Stillwater Dr. 50 2,112 Stop 30.0 0.0 II 48.0 A
Stillwater Dr. to Chapman Rd. 50 3,221 Signal 79.8 16.2 II 27.5 C
Chapman Rd. to Alafaya Woods Blvd. 50 3,010 Signal 51.6 0.0 II 39.8 A 37.2 A
Alafaya Woods Blvd. to Mitchell Hammock Rd. 45 2,376 Signal 157.2 83.4 II 10.3 F
Mitchell Hammock Rd. to Clark St. 45/35 3,960 Stop 93.0 0.0 II 29.0 B
Clark St. to SR 426/CR 419 35/30 1,531 Signal 152.4 74.4 II 6.9 F 13.3 E
SR 426/CR 419 to Magnolia St. 30/40 2,534 Signal 66.6 4.2 II 25.9 C
Magnolia St. to De Leon St. 40 4,805 Stop 81.0 0.0 II 40.4 A 33.9 B
De Leon St. to Palm Dr. 45/40 4,330 Stop 76.2 2.4 I 38.7 B
Palm Dr. to SR 417 (N. Ramps) 45 1,162 Signal 38.4 13.8 I 20.6 E
SR 417 (N. Ramps) to SR 417 (S. Ramps) 45 581 Signal 23.4 7.2 I 16.9 E 30.0 C
SR 417 (S. Ramps) to Vistawilla Dr. 45/50 1,690 Signal 27.6 0.0 I 41.7 B
Vistawilla Dr. to Spring Ave. 50 1,056 Stop 15.0 0.0 I 48.0 A
Spring Ave. to Tuskawilla Rd. 45/50 8,923 Signal 169.8 30.6 I 35.8 B 37.5 B
Tuskawilla Rd. to Doran Rd. 45 1,426 Signal 34.8 7.8 I 27.9 C
Doran Rd. to Central Winds Park 45 2,218 Signal 54.6 13.2 I 27.7 C
Central Winds Park to Winding Hollow Blvd. 50 3,802 Signal 63.0 0.6 I 41.1 B
Winding Hollow Blvd. to Consolidated/Orange Ave. 50 2,376 Signal 36.6 0.0 I 44.3 A
Consolidated/Orange Ave. to SR 419 50 950 Signal 42.0 15.0 I 15.4 F 31.8 C
TOTAL 57,341 1,381.2 269.4 28.3 0.379 gal/veh
* Construction in progress on SR 434 from Jetta Point Dr to Clonts St (Financial Project IDs: 422015-2 & 427259-1) which may have skewed the LOS for the segments.
TABLE S3.2cYear 2014 Seminole County Travel Time & Delay Study
Roadway Limit Distance Control Time Delay Roadway Average Speed Average Speed Avg. Speed Avg. Fuel
Segment (mph) (ft) Device (sec) (sec) Class (mph) LOS (mph) LOS (mph) Consump.
AM PEAK HOUR - Part B
North Lake Blvd. to Hattaway Dr. 40 686 Signal 19.8 0.0 II 23.6 C
Hattaway Dr. to Renaissance Dr. 40 686 Signal 12.0 0.0 II 39.0 A
Renaissance Dr. to Essex St. 40 686 Signal 20.4 5.4 II 22.9 C
Essex St. to Mall Entrance 40 634 Signal 12.0 0.0 II 36.0 A
Mall Entrance to Palm Springs Dr. 40 634 Signal 55.2 28.2 II 7.8 F 19.0 D
Palm Springs Dr. to Boston Ave. 40 950 Signal 31.2 5.4 II 20.8 D
Boston Ave. to CR 427/Maitland Ave. 40 1,690 Signal 39.0 6.6 II 29.5 B 25.6 C
CR 427/Maitland Ave. to CR 427/Ronald Reagan Blvd. 40 2,587 Signal 66.6 12.6 II 26.5 C 26.5 C
CR 427/Ronald Reagan Blvd. to Prarie Lake Dr. 40 1,531 Signal 28.8 0.0 II 36.2 A
Prarie Lake Dr. to Anchor Rd. 40 2,429 Signal 42.0 0.0 II 39.4 A
Anchor Rd. to US 17/92 40 1,584 Signal 143.4 78.6 II 7.5 F 17.6 D
US 17/92 to Plaza Entrance 40 898 Signal 18.0 0.0 II 34.0 B
Plaza Entrance to Oxford Rd. 40 528 Signal 9.6 0.0 II 37.5 A
Oxford Rd. to Fern Park Blvd.* 40/45 1,214 Signal 27.6 1.8 II 30.0 B
Fern Park Blvd. to Wilshire Blvd.* 45 2,851 Signal 57.0 9.0 II 34.1 B
Wilshire Blvd. to Kewanee Tr.* 45 1,373 Signal 42.6 15.6 II 22.0 D
Kewanee Tr. to Red Bug Lake Rd.* 45 1,003 Signal 52.2 26.4 II 13.1 E 25.9 C
Red Bug Lake Rd. to Sausalito Blvd.* 45 950 Signal 19.2 0.0 II 33.7 B
Sausalito Blvd. to Lake Howell Rd.* 45/50 1,848 Signal 42.6 0.0 I 29.6 C 30.9 C
Lake Howell Rd. to Lake Howell Square 50 1,320 Signal 54.0 23.4 I 16.7 E
Lake Howell Square to Lake Howell Ln. 50 1,373 Signal 36.6 10.8 I 25.6 D
Lake Howell Ln. to Howell Branch Rd. 50 2,851 Signal 107.4 25.8 I 18.1 E 19.1 E
Howell Branch Rd. to Winter Woods Blvd. 50 2,482 Signal 38.4 0.0 I 44.1 A
Winter Woods Blvd. to Castelton Blvd. 50 2,798 Signal 53.4 7.8 I 35.7 B 39.2 B
TOTAL 35,587 1029.0 257.4 23.6 0.236 gal/veh
PM PEAK HOUR - Part B
North Lake Blvd. to Hattaway Dr. 40 686 Signal 26.4 10.8 II 17.7 D
Hattaway Dr. to Renaissance Dr. 40 686 Signal 19.2 4.2 II 24.4 C
Renaissance Dr. to Essex St. 40 686 Signal 26.4 12.0 II 17.7 D
Essex St. to Mall Entrance 40 634 Signal 16.2 0.6 II 26.7 C
Mall Entrance to Palm Springs Dr. 40 634 Signal 54.6 21.0 II 7.9 F 15.9 E
Palm Springs Dr. to Boston Ave. 40 950 Signal 22.8 1.2 II 28.4 B
Boston Ave. to CR 427/Maitland Ave. 40 1,690 Signal 29.4 0.0 II 39.2 A 34.5 B
CR 427/Maitland Ave. to CR 427/Ronald Reagan Blvd. 40 2,587 Signal 53.4 3.0 II 33.0 B 33.0 B
CR 427/Ronald Reagan Blvd. to Prarie Lake Dr. 40 1,531 Signal 33.0 3.6 II 31.6 B
Prarie Lake Dr. to Anchor Rd. 40 2,429 Signal 45.6 0.0 II 36.3 A
Anchor Rd. to US 17/92 40 1,584 Signal 133.2 78.0 II 8.1 F 17.8 D
US 17/92 to Plaza Entrance 40 898 Signal 36.6 10.2 II 16.7 E
Plaza Entrance to Oxford Rd. 40 528 Signal 14.4 2.4 II 25.0 C
Oxford Rd. to Fern Park Blvd.* 40/45 1,214 Signal 22.8 0.0 II 36.3 A
Fern Park Blvd. to Wilshire Blvd.* 45 2,851 Signal 117.6 37.8 II 16.5 E
Wilshire Blvd. to Kewanee Tr.* 45 1,373 Signal 97.2 43.8 II 9.6 F
Kewanee Tr. to Red Bug Lake Rd.* 45 1,003 Signal 39.6 12.0 II 17.3 D 16.3 E
Red Bug Lake Rd. to Sausalito Blvd.* 45 950 Signal 25.2 3.6 II 25.7 C
Sausalito Blvd. to Lake Howell Rd.* 45/50 1,848 Signal 51.0 18.0 I 24.7 D 25.0 D
Lake Howell Rd. to Lake Howell Square 50 1,320 Signal 66.0 28.8 I 13.6 F
Lake Howell Square to Lake Howell Ln. 50 1,373 Signal 46.2 11.4 I 20.3 E
Lake Howell Ln. to Howell Branch Rd. 50 2,851 Signal 141.0 42.0 I 13.8 F 14.9 F
Howell Branch Rd. to Winter Woods Blvd. 50 2,482 Signal 42.6 1.8 I 39.7 B
Winter Woods Blvd. to Castelton Blvd. 50 2,798 Signal 43.2 0.0 I 44.2 A 42.0 B
TOTAL 35,587 1203.6 346.2 20.2 0.243 gal/veh
* Construction in progress on SR 436 from W of Oxford Rd to Lake Howell Rd (Financial Project IDs: 422707-1-52-01 & 419369-1-52-01) which may have skewed the LOS for the segments.
TABLE S4.1bYear 2014 Seminole County Travel Time & Delay Study
Roadway Limit Distance Control Time Delay Roadway Average Speed Average Speed Avg. Speed Avg. Fuel
Segment (mph) (ft) Device (sec) (sec) Class (mph) LOS (mph) LOS (mph) Consump.
AM PEAK HOUR - Part B
Castelton Blvd. to Winter Woods Blvd. 50 2,798 Signal 48.6 3.6 I 39.3 B
Winter Woods Blvd. to Howell Branch Rd. 50 2,482 Signal 104.4 40.8 I 16.2 E 23.5 D
Howell Branch Rd. to Lake Howell Ln. 50 2,851 Signal 43.2 0.0 I 45.0 A
Lake Howell Ln. to Lake Howell Square 50 1,373 Signal 19.2 0.0 I 48.7 A
Lake Howell Square to Lake Howell Rd. 50 1,320 Signal 22.8 0.0 I 39.5 B 44.4 A
Lake Howell Rd. to Sausalito Blvd.* 50/45 1,848 Signal 48.6 12.0 I 25.9 D
Sausalito Blvd. to Red Bug Lake Rd.* 45 950 Signal 90.6 60.0 II 7.2 F 13.7 E
Red Bug Lake Rd. to Kewanee Tr.* 45 1,003 Signal 52.2 14.4 II 13.1 E
Kewanee Tr. to Wilshire Blvd.* 45 1,373 Signal 47.4 5.4 II 19.7 D
Wilshire Blvd. to Fern Park Blvd.* 45 2,851 Signal 55.2 1.8 II 35.2 A
Fern Park Blvd. to Oxford Rd.* 45/40 1,214 Signal 37.2 10.2 II 22.3 C
Oxford Rd. to Plaza Entrance 40 528 Signal 11.4 0.0 II 31.6 B
Plaza Entrance to US 17/92 40 898 Signal 42.6 17.4 II 14.4 E 21.8 D
US 17/92 to Anchor Rd. 40 1,584 Signal 28.8 0.0 II 37.5 A
Anchor Rd. to Prarie Lake Dr. 40 2,429 Signal 41.4 0.0 II 40.0 A
Prarie Lake Dr. to CR 427/Ronald Reagan Blvd. 40 1,531 Signal 58.8 16.2 II 17.8 D 29.3 B
CR 427/Ronald Reagan Blvd. to CR 427/Maitland Ave. 40 2,587 Signal 57.0 4.8 II 30.9 B 30.9 B
CR 427/Maitland Ave. to Boston Ave. 40 1,690 Signal 41.4 0.0 II 27.8 C
Boston Ave. to Palm Springs Dr. 40 950 Signal 73.8 25.8 II 8.8 F 15.6 E
Palm Springs Dr. to Mall Entrance 40 634 Signal 12.0 0.0 II 36.0 A
Mall Entrance to Essex St. 40 634 Signal 10.8 0.0 II 40.0 A
Essex St. to Renaissance Dr. 40 686 Signal 11.4 0.0 II 41.1 A
Renaissance Dr. to Hattaway Dr. 40 686 Signal 21.0 8.4 II 22.3 C
Hattaway Dr. to North Lake Blvd. 40 686 Signal 58.8 43.8 II 8.0 F 19.9 D
TOTAL 35,587 1,038.6 264.6 23.4 0.237 gal/veh
PM PEAK HOUR - Part B
Castelton Blvd. to Winter Woods Blvd. 50 2,798 Signal 51.0 2.4 I 37.4 B
Winter Woods Blvd. to Howell Branch Rd. 50 2,482 Signal 119.4 64.2 I 14.2 F 21.1 D
Howell Branch Rd. to Lake Howell Ln. 50 2,851 Signal 46.2 0.0 I 42.1 A
Lake Howell Ln. to Lake Howell Square 50 1,373 Signal 45.6 19.8 I 20.5 E
Lake Howell Square to Lake Howell Rd. 50 1,320 Signal 50.4 17.4 I 17.9 E 26.6 D
Lake Howell Rd. to Sausalito Blvd.* 50/45 1,848 Signal 63.0 15.0 I 20.0 E
Sausalito Blvd. to Red Bug Lake Rd.* 45 950 Signal 120.6 55.8 II 5.4 F 10.4 F
Red Bug Lake Rd. to Kewanee Tr.* 45 1,003 Signal 27.0 2.4 II 25.3 C
Kewanee Tr. to Wilshire Blvd.* 45 1,373 Signal 24.0 0.0 II 39.0 A
Wilshire Blvd. to Fern Park Blvd.* 45 2,851 Signal 54.0 6.0 II 36.0 A
Fern Park Blvd. to Oxford Rd.* 45/40 1,214 Signal 63.0 22.2 II 13.1 E
Oxford Rd. to Plaza Entrance 40 528 Signal 10.8 0.0 II 33.3 B
Plaza Entrance to US 17/92 40 898 Signal 43.2 18.6 II 14.2 E 24.2 C
US 17/92 to Anchor Rd. 40 1,584 Signal 29.4 0.0 II 36.7 A
Anchor Rd. to Prarie Lake Dr. 40 2,429 Signal 52.2 4.2 II 31.7 B
Prarie Lake Dr. to CR 427/Ronald Reagan Blvd. 40 1,531 Signal 43.8 9.0 II 23.8 C 30.1 B
CR 427/Ronald Reagan Blvd. to CR 427/Maitland Ave. 40 2,587 Signal 75.6 19.2 II 23.3 C 23.3 C
CR 427/Maitland Ave. to Boston Ave. 40 1,690 Signal 33.6 0.0 II 34.3 B
Boston Ave. to Palm Springs Dr. 40 950 Signal 27.0 4.2 II 24.0 C 29.7 B
Palm Springs Dr. to Mall Entrance 40 634 Signal 14.4 0.6 II 30.0 B
Mall Entrance to Essex St. 40 634 Signal 54.0 25.8 II 8.0 F
Essex St. to Renaissance Dr. 40 686 Signal 87.6 50.4 II 5.3 F
Renaissance Dr. to Hattaway Dr. 40 686 Signal 63.0 12.0 II 7.4 F
Hattaway Dr. to North Lake Blvd. 40 686 Signal 82.8 47.4 II 5.7 F 7.5 F
TOTAL 35,587 1,281.6 396.6 18.9 0.243 gal/veh
* Construction in progress on SR 436 from W of Oxford Rd to Lake Howell Rd (Financial Project IDs: 422707-1-52-01 & 419369-1-52-01) which may have skewed the LOS for the segments.
TABLE S4.2bYear 2014 Seminole County Travel Time & Delay Study
Roadway Limit Distance Control Time Delay Roadway Average Speed Average Speed Avg. Speed Avg. Fuel
Segment (mph) (ft) Device (sec) (sec) Class (mph) LOS (mph) LOS (mph) Consump.
AM PEAK HOUR - Part B
S. Sanford Ave. to Red Cleveland Blvd. 45/50 7,603 Signal 117.6 1.2 II 44.1 A
Red Cleveland Blvd. to Skyway Dr 50 6,758 Stop 94.2 0.0 II 48.9 A
Skyway Dr to Moores Station Rd. 50 7,234 Stop 100.8 0.0 II 48.9 A
Moores Station Rd. to SR 46 50 5,122 Signal 103.2 10.2 II 33.8 B 43.8 A
SR 46 to Celery Ave. 55 4,277 Signal 58.8 0.0 II 49.6 A
Celery Ave. to Volusia County Line 55 1,637 Stop 33.6 0.0 II 33.2 B 43.6 A
TOTAL 32,630 508.2 11.4 43.8 0.207 gal/veh
PM PEAK HOUR - Part B
S. Sanford Ave. to Red Cleveland Blvd. 45/50 7,603 Signal 120.0 0.6 II 43.2 A
Red Cleveland Blvd. to Skyway Dr 50 6,758 Stop 93.0 0.0 II 49.5 A
Skyway Dr to Moores Station Rd. 50 7,234 Stop 99.0 0.0 II 49.8 A
Moores Station Rd. to SR 46 50 5,122 Signal 176.4 76.8 II 19.8 D 37.3 A
SR 46 to Celery Ave. 55 4,277 Signal 101.4 7.8 II 28.8 B
Celery Ave. to Volusia County Line 55 1,637 Stop 36.6 0.0 II 30.5 B 29.2 B
TOTAL 32,630 626.4 85.2 35.5 0.212 gal/veh
* Construction in progress on SR 415 from SR 46 to Volusia County Line (Financial Project ID: 407355-1) which may have skewed the LOS for the segments.
TABLE C18.1bYear 2014 Seminole County Travel Time & Delay Study
Lake Mary Boulevard/SR 415 (Part B) - Eastbound Direction Summary
Roadway Limit Distance Control Time Delay Roadway Average Speed Average Speed Avg. Speed Avg. Fuel
Segment (mph) (ft) Device (sec) (sec) Class (mph) LOS (mph) LOS (mph) Consump.
AM PEAK HOUR - Part B
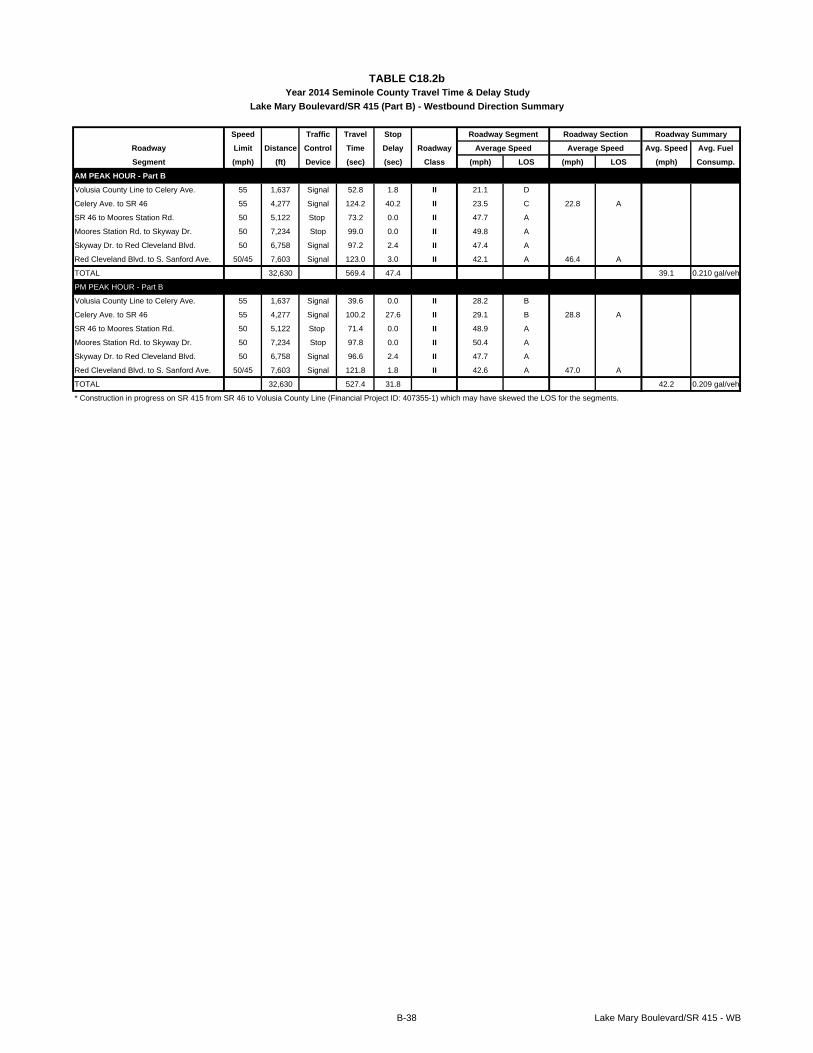
Volusia County Line to Celery Ave. 55 1,637 Signal 52.8 1.8 II 21.1 D
Celery Ave. to SR 46 55 4,277 Signal 124.2 40.2 II 23.5 C 22.8 A
SR 46 to Moores Station Rd. 50 5,122 Stop 73.2 0.0 II 47.7 A
Moores Station Rd. to Skyway Dr. 50 7,234 Stop 99.0 0.0 II 49.8 A
Skyway Dr. to Red Cleveland Blvd. 50 6,758 Signal 97.2 2.4 II 47.4 A
Red Cleveland Blvd. to S. Sanford Ave. 50/45 7,603 Signal 123.0 3.0 II 42.1 A 46.4 A
TOTAL 32,630 569.4 47.4 39.1 0.210 gal/veh
PM PEAK HOUR - Part B
Volusia County Line to Celery Ave. 55 1,637 Signal 39.6 0.0 II 28.2 B
Celery Ave. to SR 46 55 4,277 Signal 100.2 27.6 II 29.1 B 28.8 A
SR 46 to Moores Station Rd. 50 5,122 Stop 71.4 0.0 II 48.9 A
Moores Station Rd. to Skyway Dr. 50 7,234 Stop 97.8 0.0 II 50.4 A
Skyway Dr. to Red Cleveland Blvd. 50 6,758 Signal 96.6 2.4 II 47.7 A
Red Cleveland Blvd. to S. Sanford Ave. 50/45 7,603 Signal 121.8 1.8 II 42.6 A 47.0 A
TOTAL 32,630 527.4 31.8 42.2 0.209 gal/veh
* Construction in progress on SR 415 from SR 46 to Volusia County Line (Financial Project ID: 407355-1) which may have skewed the LOS for the segments.
TABLE C18.2bYear 2014 Seminole County Travel Time & Delay Study
Lake Mary Boulevard/SR 415 (Part B) - Westbound Direction Summary
Roadway Limit Distance Control Time Delay Roadway Average Speed Average Speed Avg. Speed Avg. Fuel
Segment (mph) (ft) Device (sec) (sec) Class (mph) LOS (mph) LOS (mph) Consump.
AM PEAK HOUR
SR 436 to Pedestrian Crossing 30 1,056 Signal 33.6 5.4 III 21.4 C
Pedestrian Crossing to Central Pkwy. 30 1,056 Signal 26.4 2.4 III 27.3 B 24.0 C
Central Pkwy. to Center St. 30 1,109 Stop 34.2 2.4 III 22.1 C
Center St. to Hillcrest St. 30 1,320 Stop 35.4 0.0 III 25.4 B
Hillcrest St. to Oakhurst St. 30 1,003 Signal 37.2 11.4 III 18.4 C
Oakhurst St. to North St. 30 1,690 Signal 48.6 4.2 III 23.7 C 22.5 C
North St. to Stanley St. 30 1,795 Stop 43.2 0.0 III 28.3 B
Stanley St. to Carlton St. 30 1,109 Stop 27.0 0.0 III 28.0 B
Carlton St. to Roxboro Rd. 30 1,003 Stop 24.6 0.0 III 27.8 B
Roxboro Rd. to SR 434* 30 1,531 Signal 111.6 70.8 III 9.4 F 18.0 D
TOTAL 12,672 421.8 96.6 20.5 0.089 gal/veh
PM PEAK HOUR
SR 436 to Pedestrian Crossing 30 1,056 Signal 32.4 5.4 III 22.2 C
Pedestrian Crossing to Central Pkwy. 30 1,056 Signal 40.8 8.4 III 17.6 D 19.7 C
Central Pkwy. to Center St. 30 1,109 Stop 37.2 0.0 III 20.3 C
Center St. to Hillcrest St. 30 1,320 Stop 32.4 0.0 III 27.8 B
Hillcrest St. to Oakhurst St. 30 1,003 Signal 22.2 0.0 III 30.8 A
Oakhurst St. to North St. 30 1,690 Signal 81.6 5.4 III 14.1 D 20.1 C
North St. to Stanley St. 30 1,795 Stop 43.8 0.0 III 27.9 B
Stanley St. to Carlton St. 30 1,109 Stop 26.4 0.0 III 28.6 B
Carlton St. to Roxboro Rd. 30 1,003 Stop 23.4 0.0 III 29.2 B
Roxboro Rd. to SR 434* 30 1,531 Signal 130.8 81.6 III 8.0 F 16.5 D
TOTAL 12,672 471.0 100.8 18.3 0.089 gal/veh
* Construction in progress on SR 434 at the intersection of SR 434 and Palm Springs Dr (Financial Project ID: 240233-3-52-01) which may have skewed the LOS for the segments.
TABLE C25.1aYear 2014 Seminole County Travel Time & Delay Study
Roadway Limit Distance Control Time Delay Roadway Average Speed Average Speed Avg. Speed Avg. Fuel
Segment (mph) (ft) Device (sec) (sec) Class (mph) LOS (mph) LOS (mph) Consump.
AM PEAK HOUR
SR 434 to Roxboro Rd.* 30 1,531 Stop 36.6 0.0 III 28.5 B
Roxboro Rd. to Carlton St. 30 1,003 Stop 23.4 0.0 III 29.2 B
Carlton St. to Stanely St. 30 1,109 Stop 27.6 0.0 III 27.4 B
Stanley St. to North St. 30 1,795 Signal 59.4 14.4 III 20.6 C 25.2 B
North St. to Oakhurst St. 30 1,690 Signal 60.6 13.2 III 19.0 C
Oakhurst St. to Hillcrest St. 30 1,003 Stop 24.0 0.0 III 28.5 B
Hillcrest St. to Center St. 30 1,320 Stop 38.4 0.0 III 23.4 C
Center St. to Central Pkwy. 30 1,109 Signal 42.6 9.6 III 17.7 D 21.1 C
Central Pkwy. to Pedestrian Crossing 30 1,056 Signal 25.2 0.0 III 28.6 B
Pedestrian Crossing to SR 436 30 1,056 Signal 114.6 40.8 III 6.3 F 10.3 D
TOTAL 12,672 452.4 78.0 19.1 0.089 gal/veh
PM PEAK HOUR
SR 434 to Roxboro Rd.* 30 1,531 Stop 35.4 0.0 III 29.5 B
Roxboro Rd. to Carlton St. 30 1,003 Stop 22.8 0.0 III 30.0 B
Carlton St. to Stanely St. 30 1,109 Stop 26.4 0.0 III 28.6 B
Stanley St. to North St. 30 1,795 Signal 58.2 13.8 III 21.0 C 26.0 B
North St. to Oakhurst St. 30 1,690 Signal 38.4 0.0 III 30.0 B
Oakhurst St. to Hillcrest St. 30 1,003 Stop 22.8 0.0 III 30.0 B
Hillcrest St. to Center St. 30 1,320 Stop 30.6 0.0 III 29.4 B
Center St. to Central Pkwy. 30 1,109 Signal 57.0 25.2 III 13.3 E 23.5 C
Central Pkwy. to Pedestrian Crossing 30 1,056 Signal 24.6 0.0 III 29.3 B
Pedestrian Crossing to SR 436 30 1,056 Signal 106.8 75.6 III 6.7 F 11.0 E
TOTAL 12,672 423.0 114.6 20.4 0.087 gal/veh
* Construction in progress on SR 434 at the intersection of SR 434 and Palm Springs Dr (Financial Project ID: 240233-3-52-01) which may have skewed the LOS for the segments.
TABLE C25.1bYear 2014 Seminole County Travel Time & Delay Study
Roadway Limit Distance Control Time Delay Roadway Average Speed Average Speed Avg. Speed Avg. Fuel
Segment (mph) (ft) Device (sec) (sec) Class (mph) LOS (mph) LOS (mph) Consump.
AM PEAK HOUR
SR 434 to Devonshire Blvd.* 35 2,482 Stop 63.0 3.0 IV 26.9 A
Devonshire Blvd. to Church Ave. 35 1,478 Stop 42.0 4.8 IV 24.0 B
Church Ave. to Loch Lomond Ave. 25 792 Stop 32.4 5.4 IV 16.7 C
Loch Lomond Ave. to EE Williamson Rd. 25 792 Signal 52.8 13.8 IV 10.2 D 19.9 B
TOTAL 5,544 190.2 27.0 19.9 0.040 gal/veh
PM PEAK HOUR
SR 434 to Devonshire Blvd.* 35 2,482 Stop 75.0 9.6 IV 22.6 B
Devonshire Blvd. to Church Ave. 35 1,478 Stop 45.6 4.8 IV 22.1 B
Church Ave. to Loch Lomond Ave. 25 792 Stop 42.6 10.8 IV 12.7 D
Loch Lomond Ave. to EE Williamson Rd. 25 792 Signal 57.6 10.8 IV 9.4 D 17.1 C
TOTAL 5,544 220.8 36.0 17.1 0.042 gal/veh
* Construction in progress on SR 434 at the intersection of SR 434 and Rangeline Rd (Financial Project ID: 240233-3-52-01) which may have skewed the LOS for the segments.
TABLE C58.1aYear 2014 Seminole County Travel Time & Delay Study
Roadway Limit Distance Control Time Delay Roadway Average Speed Average Speed Avg. Speed Avg. Fuel
Segment (mph) (ft) Device (sec) (sec) Class (mph) LOS (mph) LOS (mph) Consump.
AM PEAK HOUR
EE Williamson Rd. to Loch Lomond Ave. 25 792 Stop 38.4 7.8 IV 14.1 C
Loch Lomond Ave. to Church Ave. 35 792 Stop 28.8 3.0 IV 18.7 C
Church Ave. to Devonshire Blvd. 35 1,478 Stop 41.4 3.0 IV 24.3 B
Devonshire Blvd. to SR 434* 35 2,482 Signal 124.2 27.0 IV 13.6 C 16.2 C
TOTAL 5,544 232.8 40.8 16.2 0.040 gal/veh
PM PEAK HOUR
EE Williamson Rd. to Loch Lomond Ave. 25 792 Stop 39.0 9.6 IV 13.8 C
Loch Lomond Ave. to Church Ave. 35 792 Stop 31.2 4.2 IV 17.3 C
Church Ave. to Devonshire Blvd. 35 1,478 Stop 48.0 7.2 IV 21.0 B
Devonshire Blvd. to SR 434* 35 2,482 Signal 166.2 78.6 IV 10.2 D 13.3 C
TOTAL 5,544 284.4 99.6 13.3 0.042 gal/veh
* Construction in progress on SR 434 at the intersection of SR 434 and Rangeline Rd (Financial Project ID: 240233-3-52-01) which may have skewed the LOS for the segments.
TABLE C58.1bYear 2014 Seminole County Travel Time & Delay Study
Roadway Limit Distance Control Time Delay Roadway Average Speed Average Speed Avg. Speed Avg. Fuel
Segment (mph) (ft) Device (sec) (sec) Class (mph) LOS (mph) LOS (mph) Consump.
AM PEAK HOUR
North St. to SR 434* 30 3,062 Signal 128.4 37.2 IV 16.3 C 16.3 C
TOTAL 3,062 128.4 37.2 16.3 0.021 gal/veh
PM PEAK HOUR
North St. to SR 434* 30 3,062 Signal 202.2 112.8 IV 10.3 D 10.3 D
TOTAL 3,062 202.2 112.8 10.3 0.022 gal/veh
* Construction in progress on SR 434 at the intersection of SR 434 and Raymond Ave (Financial Project ID: 240233-3-52-01) which may have skewed the LOS for the segments.
TABLE C59.1aYear 2014 Seminole County Travel Time & Delay Study
Roadway Limit Distance Control Time Delay Roadway Average Speed Average Speed Avg. Speed Avg. Fuel
Segment (mph) (ft) Device (sec) (sec) Class (mph) LOS (mph) LOS (mph) Consump.
AM PEAK HOUR
SR 434 to North St.* 30 3,062 Stop 78.0 3.0 IV 26.8 A 26.8 A
TOTAL 3,062 78.0 3.0 26.8 0.021 gal/veh
PM PEAK HOUR
SR 434 to North St.* 30 3,062 Stop 77.4 1.8 IV 27.0 A 27.0 A
TOTAL 3,062 77.4 1.8 27.0 0.021 gal/veh
* Construction in progress on SR 434 at the intersection of SR 434 and Raymond Ave (Financial Project ID: 240233-3-52-01) which may have skewed the LOS for the segments.
TABLE C59.1bYear 2014 Seminole County Travel Time & Delay Study
Roadway Limit Distance Control Time Delay Roadway Average Speed Average Speed Avg. Speed Avg. Fuel
Segment (mph) (ft) Device (sec) (sec) Class (mph) LOS (mph) LOS (mph) Consump.
AM PEAK HOUR
Red Bug Lake Rd. to Wilshire Dr. 30 1,848 Signal 55.2 6.6 IV 22.8 B
Wilshire Dr. to Queens Mirror Cir. 30 3,749 Signal 87.0 0.0 IV 29.4 A
Queens Mirror Cir. to Crystal Bowl Cir. 30 1,478 Signal 99.0 31.2 IV 10.2 D
Crystal Bowl Cir. to Seminola Blvd. 30 4,066 Signal 161.4 45.6 IV 17.2 C 18.9 C
Seminola Blvd. to SR 434* 25 8,870 Signal 281.4 20.4 IV 21.5 B 21.5 B
TOTAL 20,011 684.0 103.8 19.9 0.140 gal/veh
PM PEAK HOUR
Red Bug Lake Rd. to Wilshire Dr. 30 1,848 Signal 57.0 9.0 IV 22.1 B
Wilshire Dr. to Queens Mirror Cir. 30 3,749 Signal 91.8 4.2 IV 27.8 A
Queens Mirror Cir. to Crystal Bowl Cir. 30 1,478 Signal 58.2 17.4 IV 17.3 C
Crystal Bowl Cir. to Seminola Blvd. 30 4,066 Signal 137.4 35.4 IV 20.2 B 22.1 B
Seminola Blvd. to SR 434* 25 8,870 Signal 303.0 57.0 IV 20.0 B 20.0 B
TOTAL 20,011 647.4 123.0 21.1 0.139 gal/veh
* Construction in progress on Red Bug Lake Rd at the intersection of Winter Park Dr (Project ID: 00226301) which may have skewed the LOS for the segments.
TABLE C64.1aYear 2014 Seminole County Travel Time & Delay Study
Roadway Limit Distance Control Time Delay Roadway Average Speed Average Speed Avg. Speed Avg. Fuel
Segment (mph) (ft) Device (sec) (sec) Class (mph) LOS (mph) LOS (mph) Consump.
AM PEAK HOUR
SR 434 to Seminola Blvd. 25 8,870 Signal 348.6 43.8 IV 17.3 C 17.3 C
Seminola Blvd. to Wilshire Dr. 30 4,066 Signal 105.6 9.6 IV 26.2 A
Wilshire Dr. to Queens Mirror Cir. 30 1,478 Signal 64.2 4.2 IV 15.7 C
Queens Mirror Cir. to Crystal Bowl Cir. 30 3,749 Signal 94.8 5.4 IV 27.0 A
Crystal Bowl Cir. to Red Bug Lake Rd.* 30 1,848 Signal 92.4 20.4 IV 13.6 C 21.3 B
TOTAL 20,011 705.6 83.4 19.3 0.140 gal/veh
PM PEAK HOUR
SR 434 to Seminola Blvd. 25 8,870 Signal 305.4 55.8 IV 19.8 B 19.8 B
Seminola Blvd. to Wilshire Dr. 30 4,066 Signal 99.0 0.6 IV 28.0 A
Wilshire Dr. to Queens Mirror Cir. 30 1,478 Signal 41.4 4.2 IV 24.3 B
Queens Mirror Cir. to Crystal Bowl Cir. 30 3,749 Signal 90.6 1.8 IV 28.2 A
Crystal Bowl Cir. to Red Bug Lake Rd.* 30 1,848 Signal 118.8 50.4 IV 10.6 D 21.7 B
TOTAL 20,011 655.2 112.8 20.8 0.139 gal/veh
* Construction in progress on Red Bug Lake Rd at the intersection of Winter Park Dr (Project ID: 00226301) which may have skewed the LOS for the segments.
TABLE C64.1bYear 2014 Seminole County Travel Time & Delay Study
Roadway Limit Distance Control Time Delay Roadway Average Speed Average Speed Avg. Speed Avg. Fuel
Segment (mph) (ft) Device (sec) (sec) Class (mph) LOS (mph) LOS (mph) Consump.
AM PEAK HOUR
SR 436 to Kewanee Tr. 25 4,435 Stop 141.6 6.0 IV 21.4 B
Kewanee Tr. to Oxford Rd. 25 2,798 Stop 108.0 4.2 IV 17.7 C
Oxford Rd. to Derbyshire Rd. 25 3,115 Stop 103.2 3.6 IV 20.6 B
Derbyshire Rd. to Birchwood Dr. 20 1,267 Stop 43.8 0.6 IV 19.7 B 20.0 B
Birchwood Dr. to Spartan Dr. 20 634 Stop 28.2 5.4 IV 15.3 C 15.3 C
TOTAL 12,250 424.8 19.8 19.7 0.092 gal/veh
PM PEAK HOUR
SR 436 to Kewanee Tr. 25 4,435 Stop 137.4 4.2 IV 22.0 B
Kewanee Tr. to Oxford Rd. 25 2,798 Stop 109.8 4.2 IV 17.4 C
Oxford Rd. to Derbyshire Rd. 25 3,115 Stop 105.0 4.2 IV 20.2 B
Derbyshire Rd. to Birchwood Dr. 20 1,267 Stop 43.8 0.0 IV 19.7 B 20.0 B
Birchwood Dr. to Spartan Dr. 20 634 Stop 28.2 5.4 IV 15.3 C 15.3 C
TOTAL 12,250 424.2 18.0 19.7 0.092 gal/veh
TABLE C65.1bYear 2014 Seminole County Travel Time & Delay Study
Derbyshire Road - Westbound Direction Summary
B-132 Derbyshire Road - WB
APPENDIX C
Historical Summary of State Roads
APPENDIX C: HISTORICAL SUMMARY OF STATE ROADS
S1.1a: SR 46 (Part A & B) EB AM Summary………….......………...…………………....C-1
S1.1b: SR 46 (Part A & B) EB PM Summary…………….......….……...………………....C-2
S1.2a: SR 46 (Part A & B) WB AM Summary…….………...………….………………...C-3
S1.2b: SR 46 (Part A & B) WB PM Summary……….....…………….…………………...C-4
S2.1a: SR 419 NB Summary…………………….............……...………………………… C-5
S2.1b: SR 419 SB Summary………………………………....……….…………………… C-5
S3.1a: SR 434 (Part A, B, C) EB AM Summary…………..............……………………… C-6
S3.1b: SR 434 (Part A, B, C) EB PM Summary……………………...............…………… C-7
S3.2a: SR 434 (Part A, B, C) WB AM Summary….........……...………………………… C-8
S3.2b: SR 434 (Part A, B, C) WB PM Summary………….........………………………… C-9
S4.1a: SR 436 (Part A, B) EB AM Summary……………………......…………………… C-10
S4.1b: SR 436 (Part A, B) EB PM Summary……………………...……………………… C-11
S4.2a: SR 436 (Part A, B) WB AM Summary………………….................……………… C-12
S4.2b: SR 436 (Part A, B) WB PM Summary……………......…………………………… C-13
S5.1a: US 17/92 (Part A, B) NB AM Summary…………...............……………………… C-14
S5.1b: US 17/92 (Part A, B) NB PM Summary…………………….......………………… C-15
S5.2a: US 17/92 (Part A, B) SB AM Summary…………...……………............………… C-16
S5.2b: US 17/92 (Part A, B) SB PM Summary…………...……………………….........… C-17
S6.1a: SR 400 (I-4) EB Summary….................…………...……………………………… C-18
S6.1b: SR 400 (I-4) WB Summary……………...........…...……………….……………… C-18
S7.1a: SR 426 EB Summary…………………………................………………………… C-19
S7.1b: SR 426 WB Summary………………………….................…..…………………… C-20
S8.1a: SR 414 (Maitland Blvd) EB Summary………………………….....……………… C-21
S8.1b: SR 414 (Maitland Blvd) WB Summary……….................…..…………………… C-21
S9.1a: SR 417 EB Summary…………………………................………………………… C-22
S9.1b: SR 417 WB Summary………………………….................…..…………………… C-22
Roadway
Segments Distance
(mile) (mph) LOS (mph) LOS (mph) LOS (mph) LOS (mph) LOS (mph) LOS (mph) LOS (mph) LOS (mph) LOS (mph) LOS (mph) LOS (mph) LOS (mph) LOS (mph) LOS (mph) LOS (mph) LOS (mph) LOS (mph) LOS (mph) LOS (mph) LOS
AM PEAK HOUR
Lake County Line to Longwood Markham Rd. 0.85 - - - - - - - - - - - - - - - - - - - - - - - - 46.8 A 51.0 A 43.6 A 44.7 A
Longwood Markham Rd. to Lake Markham Rd.**** 1.08 - - - - - - - - - - - - 54.8 A - - - - - - - - - - 51.4 A 51.8 A 49.8 A 49.1 A
Lake Markham Rd. to Wayside Dr.***** 1.19 - - - - - - - - - - - - 47.2 A - - - - - - - - 48.9 A 49.1 A 47.3 A 49.8 A 48.9 A 51.0 A
Wayside Dr. to Orange Blvd. 0.31 - - - - - - - - - - - - 20.1 E 43.8 A 25.9 D 25.9 D 35.6 B 35.6 B 17.9 E 17.9 E 20.8 E 20.8 E 20.2 E 42.2 A 20.6 E 42.9 A
Orange Blvd. to Lake Forest Blvd. 0.68 42.3 A 42.3 A 46.9 A 46.9 A 34.2 B 34.2 B 36.3 B 36.3 B 40.9 B 40.9 B 51.4 A 51.4 A 46.6 A 46.6 A 49.0 A 49.0 A 45.7 A 45.7 A 48.4 A 48.4 A
Lake Forest Blvd. to International Pkwy. 0.24 28.9 C 34.5 B 43.2 A 22.7 D 33.4 C 34.9 B 29.4 C 38.5 B 32.6 C 31.2 C
International Pkwy. to Wayside Dr. 0.39 33.7 C 31.7 C 38.0 B 36.5 B 38.8 B 40.4 B 38.6 B 30.4 C 30.0 C 41.4 B 35.3 B 38.4 B 18.7 E 21.3 D
Wayside Dr. to Oregon Ave. 0.13
Oregon Ave. to I-4 (W. Ramps) 0.02 18.2 E 13.1 F 14.7 F 22.9 D 31.9 C 21.5 D 23.3 D 16.3 E 20.4 E 34.3 B
I-4 (W. Ramps) to I-4 (E. Ramps) 0.13 16.6 E 14.7 F 13.7 F 17.5 E 34.0 C 31.7 C 36.0 B 34.1 B 31.3 C 30.7 C 31.4 C 30.3 C 23.6 D 22.2 D 18.3 E 24.6 D
I-4 (E. Ramps) to Town Center Blvd. 0.16 38.4 B 24.9 D 34.3 B 24.2 D 39.5 B 42.5 A 28.3 C 30.9 C 21.7 D 23.2 D
Town Center Blvd. to Rinehart Rd. 0.19 38.3 B 25.2 D 36.0 B 19.7 E 13.5 F 16.5 E 20.5 E 21.2 D 37.9 B 38.6 B 42.2 A 42.4 A 38.0 B 32.7 C 25.9 D 28.1 C 38.0 B 28.1 C 34.5 B 28.1 C
Rinehart Rd. to Elder Rd. 0.26
Elder Rd. to Upsala Rd./CR 15 0.25 37.9 B 37.9 B 31.1 C 31.1 C 37.5 B 37.5 B 37.3 B 37.3 B 31.0 C 31.0 C 35.2 B 35.2 B 23.7 D 23.7 D 38.7 B 38.7 B 35.6 B 35.6 B 28.1 C 28.1 C
Upsala Rd./CR 15 to Central Park Dr.** 40.5 B 25.1 D 25.8 D 43.6 A 44.6 A 41.7 B
Central Park Dr. to Cedar Rd.*** 38.8 B 40.0 B 37.2 B 49.1 A 49.1 A 47.0 A
Cedar Rd. to Kennel Rd. 0.25 54.5 A 52.9 A 51.6 A 51.8 A 44.3 A 53.6 A 48.4 A 51.7 A 50.0 A 50.0 A
Kennel Rd. to Rand Yard Rd./MLK Jr. Blvd. 0.50 55.2 A 54.0 A 53.0 A 34.3 B 41.8 B 42.0 B 42.6 A 50.5 A 42.4 A 45.0 A
Rand Yard Rd./MLK Jr. Blvd. to Airport Blvd. 0.26 32.2 C 46.9 A 19.3 E 39.5 B 20.2 E 40.7 B 35.8 B 39.8 B 45.2 A 42.1 A 47.3 A 38.5 B 43.3 A 37.7 B 43.8 A 47.6 A 46.3 A 45.5 A 43.8 A 45.0 A
Airport Blvd. to Persimmon Ave. 0.55 47.3 A 44.8 A 43.9 A 48.3 A 46.2 A 45.2 A 44.0 A 46.0 A 47.3 A 45.4 A
Persimmon Ave. to Mangoustine Ave. 0.38 45.8 A 44.5 A 42.0 B 46.6 A 44.0 A 43.0 A 43.0 A 43.0 A 44.7 A 43.8 A
Mangoustine Ave. to Poplar Ave. 0.29 44.6 A 42.7 A 43.3 A 46.3 A 42.4 A 40.5 B 41.4 A 41.4 A 42.4 A 41.4 A
Poplar Ave. to Holly Ave. 0.16 41.0 B 38.2 B 41.5 B 41.4 B 39.3 B 38.4 B 36.9 A 40.0 A 38.4 A 38.4 A
Holly Ave. to US 17/92 0.13 9.3 F 35.5 B 14.4 F 37.8 B 20.2 E 39.7 B 9.5 F 36.6 B 8.2 F 32.7 C 8.0 F 31.1 C 7.2 F 29.7 B 8.6 F 32.2 B 8.8 F 32.9 B 6.9 F 29.8 B
US 17/92 to Park Ave. 0.32 29.7 C 26.4 D 33.9 C 32.0 C 29.9 C 32.5 C 24.0 C 24.0 C 23.1 C 27.8 C
Park Ave. to Sanford Ave. 0.19 12.1 F 19.3 E 11.6 F 17.8 E 14.8 F 22.6 D 15.2 F 22.6 D 11.4 F 18.7 E 13.9 F 21.7 D 14.8 E 19.5 D 11.0 F 16.6 E 10.8 F 16.4 E 9.5 F 16.4 E
Sanford Ave. to Mellonville Ave. 0.51 37.1 B 37.1 B 38.4 B 38.4 B 41.6 B 41.6 B 40.7 B 40.7 B 37.4 B 37.4 B 37.8 B 37.8 B 36.9 A 36.9 A 35.6 A 35.6 A 40.0 A 40.0 A 38.0 A 38.0 A
Mellonville Ave. to Brisson Ave. 1.02 47.4 A 49.1 A 50.1 A 52.2 A 46.2 A 47.4 A 46.0 A 44.0 A 48.2 A 46.4 A
Brisson Ave. to Beardall Ave. 1.01 44.9 A 46.1 A 50.0 A 49.4 A 50.0 A 50.0 A 48.9 A 50.5 A 47.1 A 46.6 A 48.9 A 48.1 A 47.3 A 46.7 A 46.6 A 45.3 A 48.9 A 48.5 A 49.3 A 47.8 A
Beardall Ave. to SR 415 0.60 44.1 A 44.1 A 40.0 B 40.0 B 38.1 B 38.1 B 35.5 B 35.5 B 21.6 D 21.6 D 30.0 C 30.0 C 22.5 D 22.5 D 18.9 E 18.9 E 16.5 E 16.5 E 20.1 E 20.1 E
SR 415 to Richmond Ave. 0.40 - - - - - - - - - - - - 44.2 A 44.2 A 34.4 B 34.4 B 27.6 C 27.6 C 49.0 A 49.0 A 40.7 B 40.7 B 42.1 A 42.1 A 46.2 A 46.2 A
Richmond Ave. to Osceola Rd. 2.42 - - - - - - - - - - - - - - - - - - - - - - - - 56.1 A 56.1 A 55.4 A 55.4 A 56.1 A 56.1 A 55.8 A 55.8 A
Osceola Rd. to Mullet Lake Park Rd. 1.42 - - - - - - - - - - - - - - - - - - - - - - - - 53.9 A 53.2 A 53.6 A 53.6 A
Mullet Lake Park Rd. to Avenue C 2.36 - - - - - - - - - - - - - - - - - - - - - - - - 52.2 A 52.8 A 53.4 A 53.0 A
Avenue C to Hart Rd. 0.38 - - - - - - - - - - - - - - - - - - - - - - - - 51.8 A 53.0 A 51.8 A 54.3 A
Hart Rd. to Oak St. 0.14 - - - - - - - - - - - - - - - - - - - - - - - - 49.4 A 52.7 A 49.4 A 52.9 A 52.5 A 53.3 A 49.4 A 53.2 A
Oak St. to CR 426 0.27 - - - - - - - - - - - - - - - - - - - - - - - - 20.8 D 20.8 D 23.8 C 23.8 C 23.1 C 23.1 C 24.2 C 24.2 C
CR 426 to Lake Proctor Ct. 0.70 - - - - - - - - - - - - - - - - - - - - - - - - 48.3 A 48.8 A 52.5 A 48.3 A
Lake Proctor Ct. to Jungle Rd. 1.52 - - - - - - - - - - - - - - - - - - - - - - - - 54.6 A 52.4 A 54.0 A 52.2 A 55.9 A 54.8 A 51.8 A 50.6 A
Jungle Rd. to Volusia Co. Line****** 2.94 - - - - - - - - - - - - - - - - - - - - - - - - 55.0 A 55.0 A 54.6 A 54.6 A 55.3 A 55.3 A 53.5 A 53.5 A
Average 36.8 B 35.5 B 36.1 B 38.0 B 34.1 B 36.0 B 41.7 B 42.5 A 41.6 B 41.4 B
Note: * Till Year 2007, the segment limits were used to be " SR 415 to Osceola Road" and segment length was 2.71 miles.
Note: ** From 2009, additional control point has been considered on "Central Park Dr." the segment limits will be Upsala Rd. (CR 15) to Central Park Dr. and the segment length will be 0.32 Mile
Note: *** From 2009, additional control point has been considered on "Central Park Dr." the segment limits will be Central Park Dr. to Cedar Rd. and the segment length will be 0.17 Mile
Note: **** From 2011, additional control point has been considered on "Lake Markham Rd." the segment limits will be Longwood Markham Rd. to Lake Markham Rd. and the segment length will be 1.08 Miles
Note: ***** From 2011, additional control point has been considered on "Lake Markham Rd." the segment limits will be Lake Markham Rd. to Wayside Dr. and the segment length will be 1.19 Miles
Note: ****** From 2011, the segment limits were extended to the Volusia Co. Line and additional control points have been considered on "Osceola Rd., Mullet Lake Park Rd., Avenue C, Hart Rd., Oak St., CR 426, Lake Proctor Ct., and Jungle Rd."
Average Speed
Year 2014
Rdwy Segment Rdwy Section
Average Speed Average Speed
Rdwy Section
Year 2013
Rdwy Segment Rdwy Section
Average Speed Average SpeedAverage Speed Average Speed Average Speed Average Speed Average SpeedAverage Speed Average Speed Average Speed
Year 2005 Year 2006 Year 2007 Year 2008 Year 2009 Year 2010 Year 2011 Year 2012
A46.3
TABLE S1.1aYear 2014 Seminole County Travel Time & Delay Study
SR 46 (Parts A & B) - Eastbound Direction Historical Summary
A48.5A47.8 B40.40.49
C-1 SR 46 - EB - AM
Roadway
Segments Distance
(mile) (mph) LOS (mph) LOS (mph) LOS (mph) LOS (mph) LOS (mph) LOS (mph) LOS (mph) LOS (mph) LOS (mph) LOS (mph) LOS (mph) LOS (mph) LOS (mph) LOS (mph) LOS (mph) LOS (mph) LOS (mph) LOS (mph) LOS (mph) LOS
PM PEAK HOUR
Lake County Line to Longwood Markham Rd. 0.85 - - - - - - - - - - - - 54.8 A - - - - - - - - 44.3 A 47.7 A 47.2 A 49.0 A
Longwood Markham Rd. to Lake Markham Rd.**** 1.08 - - - - - - - - - - - - - - - - - - - - - - - - 49.5 A 44.7 A 53.1 A 53.6 A
Lake Markham Rd. to Wayside Dr.***** 1.19 - - - - - - - - - - - - 56.1 A - - - - - - - - 48.9 A 47.8 A 47.9 A 46.7 A 52.9 A 53.3 A
Wayside Dr. to Orange Blvd. 0.31 - - - - - - - - - - - - 29.3 C 51.7 A 19.2 E 19.2 E 33.9 C 33.9 C 21.6 D 21.6 D 22.2 D 22.2 D 41.2 B 50.1 A 23.9 D 46.8 A
Orange Blvd. to Lake Forest Blvd. 0.68 53.3 A 53.3 A 40.3 B 40.3 B 35.2 B 35.2 B 51.7 A 51.7 A 46.2 A 46.2 A 50.8 A 50.8 A 48.9 A 48.9 A 48.4 A 48.4 A 49.0 A 49.0 A 49.6 A 49.6 A
Lake Forest Blvd. to International Pkwy. 0.24 33.8 C 40.5 B 28.0 C 32.5 C 47.6 A 46.9 A 46.9 A 44.1 A 38.5 B 48.4 A
International Pkwy. to Wayside Dr. 0.39 29.4 C 30.9 C 26.4 D 30.5 C 19.5 E 22.2 D 22.2 D 25.3 D 24.1 D 28.9 C 26.4 D 27.9 C 29.6 C 31.2 C
Wayside Dr. to Oregon Ave. 0.13
Oregon Ave. to I-4 (W. Ramps) 0.02 15.6 F 10.4 F 15.6 F 11.7 F 17.7 E 16.4 E 29.0 C 25.5 D 24.0 D 33.1 C 40.0 B
I-4 (W. Ramps) to I-4 (E. Ramps) 0.13 14.8 F 16.7 E 12.4 F 13.3 F 32.2 C 26.3 D 23.2 D 31.2 C 24.0 D 29.4 C 31.4 C 30.5 C 34.7 B 32.9 C 41.2 B 37.4 B
I-4 (E. Ramps) to Town Center Blvd. 0.16 27.9 C 22.0 D 31.2 C 23.7 D 37.1 B 34.0 C 34.0 C 32.9 C 20.8 E 35.2 B
Town Center Blvd. to Rinehart Rd. 0.19 32.6 C 21.0 D 31.5 C 20.5 E 31.9 C 18.3 E 22.7 D 19.0 E 43.5 A 40.3 B 21.9 D 26.3 D 27.8 C 30.4 C 23.7 D 27.3 C 19.0 E 19.8 E 26.5 D 30.0 C
Rinehart Rd. to Elder Rd. 0.26
Elder Rd. to Upsala Rd./CR 15 0.25 21.4 D 21.4 D 22.2 D 22.2 D 17.4 E 17.4 E 19.6 E 19.6 E 45.4 A 45.4 A 43.1 A 43.1 A 39.7 B 39.7 B 40.3 B 40.3 B 41.9 B 41.9 B 25.5 D 25.5 D
Upsala Rd./CR 15 to Central Park Dr.** 44.6 A 45.4 A 37.2 B 44.6 A 43.6 A 33.1 C
Central Park Dr. to Cedar Rd.*** 45.5 A 51.4 A 47.0 A 49.1 A 49.1 A 47.0 A
Cedar Rd. to Kennel Rd. 0.25 54.6 A 51.4 A 49.6 A 49.8 A 48.6 A 51.7 A 48.4 A 51.7 A 51.7 A 51.7 A
Kennel Rd. to Rand Yard Rd./MLK Jr. Blvd. 0.50 56.2 A 51.7 A 52.0 A 39.8 B 45.4 A 53.5 A 42.6 A 41.7 B 52.4 A 33.5 C
Rand Yard Rd./MLK Jr. Blvd. to Airport Blvd. 0.26 14.8 F 36.5 B 21.3 D 40.6 B 19.4 E 38.3 B 41.5 B 39.9 B 45.4 A 45.8 A 40.0 B 48.3 A 47.3 A 43.4 A 36.8 B 43.5 A 36.0 B 46.2 A 46.3 A 39.0 B
Airport Blvd. to Persimmon Ave. 0.55 45.0 A 42.0 B 44.0 A 46.7 A 46.2 A 44.6 A 44.0 A 46.0 A 46.7 A 45.4 A
Persimmon Ave. to Mangoustine Ave. 0.38 44.7 A 42.5 A 43.5 A 39.5 B 42.9 A 43.0 A 42.2 A 43.8 A 43.8 A 43.8 A
Mangoustine Ave. to Poplar Ave. 0.29 44.3 A 41.3 B 42.0 B 43.2 A 40.6 B 40.5 B 40.5 A 40.5 A 42.4 A 42.4 A
Poplar Ave. to Holly Ave. 0.16 42.0 A 37.7 B 39.2 B 40.4 B 39.6 B 38.4 B 38.4 A 40.0 A 38.4 A 38.4 A
Holly Ave. to US 17/92 0.13 10.3 F 36.2 B 21.0 E 38.9 B 11.3 F 35.5 B 11.5 F 36.2 B 9.4 F 33.9 C 18.1 E 38.1 B 5.8 F 27.4 C 11.0 F 34.7 B 12.8 F 36.3 A 9.5 F 33.3 B
US 17/92 to Park Ave. 0.32 23.1 D 32.2 C 25.8 D 32.1 C 26.4 D 24.9 D 35.6 A 19.6 D 20.6 D 20.6 D
Park Ave. to Sanford Ave. 0.19 8.8 F 14.4 F 6.4 F 12.8 F 17.1 E 21.5 D 9.8 F 17.2 E 10.8 F 17.3 E 13.4 F 18.9 E 16.3 E 24.7 C 11.3 F 15.4 E 11.4 F 16.0 E 10.8 F 15.5 E
Sanford Ave. to Mellonville Ave. 0.51 32.3 C 32.3 C 38.9 B 38.9 B 40.9 B 40.9 B 40.1 B 40.1 B 33.8 C 33.8 C 34.8 B 34.8 B 36.9 A 36.9 A 33.6 B 33.6 B 35.1 A 35.1 A 37.1 A 37.1 A
Mellonville Ave. to Brisson Ave. 1.02 47.9 A 51.1 A 48.4 A 50.3 A 44.3 A 47.8 A 45.7 A 43.1 A 45.7 A 45.3 A
Brisson Ave. to Beardall Ave. 1.01 46.1 A 47.0 A 49.1 A 50.1 A 49.8 A 49.1 A 43.3 A 46.5 A 48.2 A 46.2 A 49.3 A 48.5 A 47.3 A 46.5 A 45.9 A 44.5 A 47.3 A 46.5 A 47.3 A 46.3 A
Beardall Ave. to SR 415 0.60 44.6 A 44.6 A 40.8 B 40.8 B 23.0 D 23.0 D 19.9 E 19.9 E 31.9 C 31.9 C 19.6 E 19.6 E 24.3 D 24.3 D 23.1 D 23.1 D 22.5 D 22.5 D 34.3 B 34.3 B
SR 415 to Richmond Ave. 0.40 - - - - - - - - - - - - 42.7 A 42.7 A 40.2 B 40.2 B 48.0 A 48.0 A 42.9 A 42.9 A 46.2 A 46.2 A 48.0 A 48.0 A 50.0 A 50.0 A
Richmond Ave. to Osceola Rd. 2.42 - - - - - - - - - - - - - - - - - - - - - - - - 55.8 A 55.8 A 55.0 A 55.0 A 55.8 A 55.8 A 55.6 A 55.6 A
Osceola Rd. to Mullet Lake Park Rd. 1.42 - - - - - - - - - - - - - - - - - - - - - - - - 54.3 A 52.9 A 53.2 A 53.6 A
Mullet Lake Park Rd. to Avenue C 2.36 - - - - - - - - - - - - - - - - - - - - - - - - 54.0 A 52.1 A 52.6 A 53.2 A
Avenue C to Hart Rd. 0.38 - - - - - - - - - - - - - - - - - - - - - - - - 54.3 A 51.8 A 50.7 A 53.0 A
Hart Rd. to Oak St. 0.14 - - - - - - - - - - - - - - - - - - - - - - - - 49.4 A 54.0 A 46.7 A 52.1 A 42.0 B 52.2 A 49.4 A 53.2 A
Oak St. to CR 426 0.27 - - - - - - - - - - - - - - - - - - - - - - - - 28.4 B 28.4 B 30.6 B 30.6 B 25.7 C 25.7 C 22.8 C 22.8 C
CR 426 to Lake Proctor Ct. 0.70 - - - - - - - - - - - - - - - - - - - - - - - - 49.4 A 52.5 A 53.8 A 48.3 A
Lake Proctor Ct. to Jungle Rd. 1.52 - - - - - - - - - - - - - - - - - - - - - - - - 53.3 A 52.0 A 51.5 A 51.8 A 56.6 A 55.7 A 53.6 A 51.8 A
Jungle Rd. to Volusia Co. Line****** 2.94 - - - - - - - - - - - - - - - - - - - - - - - - 53.6 A 53.6 A 53.6 A 53.6 A 56.4 A 56.4 A 53.8 A 53.8 A
Average 32.4 C 33.0 C 30.8 C 35.3 B 35.1 B 36.3 B 43.1 A 42.5 A 44.2 A 43.5 A
Note: * Till Year 2007, the segment limits were used to be " SR 415 to Osceola Road" and segment length was 2.71 miles.
Note: ** From 2009, additional control point has been considered on "Central Park Dr." the segment limits will be Upsala Rd. (CR 15) to Central Park Dr. and the segment length will be 0.32 Mile
Note: *** From 2009, additional control point has been considered on "Central Park Dr." the segment limits will be Central Park Dr. to Cedar Rd. and the segment length will be 0.17 Mile
Note: **** From 2011, additional control point has been considered on "Lake Markham Rd." the segment limits will be Longwood Markham Rd. to Lake Markham Rd. and the segment length will be 1.08 Miles
Note: ***** From 2011, additional control point has been considered on "Lake Markham Rd." the segment limits will be Lake Markham Rd. to Wayside Dr. and the segment length will be 1.19 Miles
Note: ****** From 2011, the segment limits were extended to the Volusia Co. Line and additional control points have been considered on "Osceola Rd., Mullet Lake Park Rd., Avenue C, Hart Rd., Oak St., CR 426, Lake Proctor Ct., and Jungle Rd."
Average Speed Average Speed Average Speed Average Speed Average Speed Average Speed Average Speed Average Speed Average Speed Average Speed Average Speed Average Speed Average Speed Average Speed Average Speed Average Speed Average Speed Average Speed
Year 2009 Year 2010 Year 2011 Year 2012 Year 2014Year 2013
TABLE S1.1bYear 2014 Seminole County Travel Time & Delay Study
SR 46 (Parts A & B) - Eastbound Direction Historical Summary
0.49
C-2 SR 46 - EB - PM
Roadway
Segments Distance
(mile) (mph) LOS (mph) LOS (mph) LOS (mph) LOS (mph) LOS (mph) LOS (mph) LOS (mph) LOS (mph) LOS (mph) LOS (mph) LOS (mph) LOS (mph) LOS (mph) LOS (mph) LOS (mph) LOS (mph) LOS (mph) LOS (mph) LOS (mph) LOS
AM PEAK HOUR
Volusia Co. Line to Jungle Rd.****** 2.94 - - - - - - - - - - - - - - - - - - - - - - - - 54.3 A 54.3 A 54.4 A 54.4 A 56.4 A 56.4 A 53.5 A 53.5 A
Jungle Rd. to Lake Proctor Ct. 1.52 - - - - - - - - - - - - - - - - - - - - - - - - 54.9 A 54.3 A 56.3 A 53.6 A
Lake Proctor Ct. to CR 426 0.70 - - - - - - - - - - - - - - - - - - - - - - - - 41.6 B 49.9 A 45.2 A 51.0 A 42.0 B 50.8 A 38.2 B 47.6 A
CR 426 to Oak St. 0.27 - - - - - - - - - - - - - - - - - - - - - - - - 47.6 A 47.6 A 41.5 A 41.5 A 38.6 A 38.6 A 41.5 A 41.5 A
Oak St. to Hart St. 0.14 - - - - - - - - - - - - - - - - - - - - - - - - 49.4 A 52.5 A 49.4 A 52.5 A
Hart St. to Avenue C 0.38 - - - - - - - - - - - - - - - - - - - - - - - - 49.6 A 53.0 A 51.8 A 53.0 A
Avenue C to Mullet Lake Park Rd. 2.36 - - - - - - - - - - - - - - - - - - - - - - - - 53.2 A 53.0 A 53.6 A 53.0 A
Mullet Lake Park Rd. to Osceola Rd. 1.42 - - - - - - - - - - - - - - - - - - - - - - - - 53.9 A 53.0 A 53.2 A 53.1 A 53.6 A 53.3 A 53.2 A 53.1 A
Osceola Rd. to Richmond Ave. 2.42 - - - - - - - - - - - - - - - - - - - - - - - - 53.2 A 53.2 A 53.2 A 53.2 A 54.0 A 54.0 A 53.8 A 53.8 A
Richmond Ave. to SR 415 0.40 - - - - - - - - - - - - 15.8 F 15.8 F 16.1 E 16.1 E 14.0 F 14.0 F 19.5 E 19.5 E 13.2 F 13.2 F 12.8 F 12.8 F 17.0 E 17.0 E
SR 415 to Beardall Ave. 0.60 38.4 B 38.4 B 40.3 B 40.3 B 43.0 A 43.0 A 42.0 B 42.0 B 40.9 B 40.9 B 42.9 A 42.9 A 40.0 B 40.0 B 42.9 A 42.9 A 40.9 B 40.9 B 42.4 A 42.4 A
Beardall Ave. to Brisson Ave. 1.01 44.3 A 47.6 A 47.6 A 46.9 A 45.3 A 47.0 A 46.3 A 39.6 B 45.2 A 47.0 A
Brisson Ave. to Mellonville Ave. 1.02 46.7 A 45.5 A 47.1 A 47.5 A 48.5 A 48.0 A 46.3 A 46.6 A 45.6 A 45.4 A 46.0 A 46.5 A 43.7 A 44.9 A 43.7 A 41.6 B 44.3 A 44.8 A 45.7 A 46.3 A
Mellonville Ave. to Sanford Ave. 0.51 26.8 D 26.8 D 29.5 C 29.5 C 23.2 D 23.2 D 22.8 D 22.8 D 34.0 C 34.0 C 30.9 C 30.9 C 29.7 B 29.7 B 26.6 C 26.6 C 22.9 C 22.9 C 28.4 B 28.4 B
Sanford Ave. to Park Ave. 0.19 32.3 C 29.3 C 27.4 C 32.2 C 34.4 B 36.8 B 30.8 B 34.5 B 34.8 B 27.7 C
Park Ave. to US 17/92 0.32 15.8 F 19.6 E 24.6 D 26.2 D 15.6 F 18.6 E 24.2 D 26.7 D 11.1 F 15.0 F 13.2 F 17.3 E 19.4 D 22.5 C 16.7 E 20.7 D 12.7 F 16.5 E 22.3 C 24.0 C
US 17/92 to Holly Ave. 0.12 28.9 C 27.9 C 31.8 C 28.9 C 26.2 D 30.0 C 21.1 D 35.5 A 33.9 B 33.9 B
Holly Ave. to Poplar Ave. 0.16 46.3 A 41.5 B 41.7 B 45.5 A 38.6 B 41.7 B 41.7 A 41.7 A 41.7 A 40.0 A
Poplar Ave. to Mangoustine Ave. 0.29 47.2 A 43.1 A 43.1 A 48.3 A 41.9 B 40.5 B 41.4 A 41.4 A 43.5 A 41.4 A
Mangoustine Ave. to Persimmon Ave. 0.38 51.4 A 46.9 A 45.5 A 42.9 A 42.1 A 38.6 B 42.2 A 41.5 A 45.6 A 43.8 A
Persimmon Ave. to Airport Blvd. 0.57 46.3 A 45.1 A 39.5 B 40.7 B 32.2 C 37.8 B 51.2 A 44.7 A 40.1 B 39.0 B 42.3 A 39.6 B 40.2 A 38.1 A 44.2 A 41.8 A 42.0 A 42.2 A 42.5 A 41.5 A
Airport Blvd. to Rand Yard Rd. 0.26 53.0 A 44.7 A 40.8 B 53.1 A 31.1 C 27.4 C 24.8 D 32.4 C 36.0 B 32.4 C
Rand Yard Rd. to Kennel Rd. 0.48 54.5 A 52.5 A 45.9 A 53.3 A 43.7 A 46.7 A 49.8 A 48.8 A 45.7 A 46.5 A
Kennel Rd. to Cedar Rd. 0.25 55.9 A 54.3 A 50.3 A 42.8 A 44.3 A 51.7 A 51.7 A 51.7 A 48.4 A 48.4 A
Cedar Rd. to Central Park Dr.*** 29.7 C 42.8 A 22.1 D 35.6 B 20.7 E 32.8 C 18.9 E 49.7 A 20.1 E 36.0 B 31.8 C 30.9 C 19.3 E 21.6 D
Central Park Dr. to Upsala Rd./CR 15** 0.51 34.8 B 34.7 B 31.0 C 37.4 B 19.2 E 31.7 C 19.2 E 33.0 C 30.0 C 34.7 B 25.6 D 33.6 C
Upsala Rd./CR 15 to Elder Rd. 0.25
Elder Rd. to Rinehart Rd. 0.26 42.7 A 42.7 A 42.1 A 42.1 A 35.3 B 35.3 B 38.9 B 38.9 B 44.6 A 44.6 A 39.2 B 39.2 B 31.5 C 31.5 C 31.2 C 31.2 C 42.5 A 42.5 A 36.0 B 36.0 B
Rinehart Rd. to Town Center Blvd. 0.19 41.5 B 40.0 B 23.3 D 19.9 E 28.5 C 26.5 D 40.7 B 27.8 C 36.8 B 42.2 A
Town Center Blvd. to I-4 (E. Ramps) 0.16 26.0 D 32.3 C 34.4 B 11.5 F 15.9 F 20.5 E 25.5 D 26.0 D 42.5 A 41.5 B 26.2 D 27.0 D 17.3 E 24.0 D 29.1 C 34.8 B
I-4 (E. Ramps) to I-4 (W. Ramps) 0.10 38.0 B 33.4 C 10.9 F 23.4 D 34.6 B 29.0 C 13.0 F 14.2 F 12.7 F 21.2 D 26.7 D 20.6 E 33.0 C 36.7 B
I-4 (W. Ramps) to Oregon Ave. 0.03
Oregon Ave. to Wayside Dr. 0.15 23.4 D 15.8 F 17.5 E 30.6 C 20.7 E 33.6 C 33.6 C 35.6 B 38.4 B 36.9 B
Wayside Dr. to International Pkwy. 0.39 40.7 B 41.1 B 41.7 B 34.7 B 38.4 B 31.6 C 35.8 B 37.7 B 45.0 A 39.0 B
International Pkwy. to Lake Forest Blvd. 0.25 36.5 B 34.4 B 44.5 A 31.7 C 39.7 B 32.2 C 38.4 B 34.8 B 29.2 C 25.9 D 34.1 B 30.5 C 27.3 C 31.4 C 36.6 B 33.7 C 48.4 A 42.7 A 39.5 B 38.4 B
Lake Forest Blvd. to Orange Blvd. 0.67 35.4 B 35.4 B 30.2 C 30.2 C 19.3 E 19.3 E 49.8 A 49.8 A 35.2 B 35.2 B 43.5 A 43.5 A 46.6 A 46.6 A 47.9 A 47.9 A 41.0 B 41.0 B 43.2 A 43.2 A
Orange Blvd. to Wayside Dr. 0.33 - - - - - - - - - - - - 44.0 A 40.9 B 40.9 B 48.8 A 48.8 A 33.9 C 33.9 C 45.0 A 45.0 A 41.2 B 41.2 B 40.4 B 40.4 B
Wayside Dr. to Lake Markham Rd.**** 1.19 - - - - - - - - - - - - - - - - - - - - 52.9 A 48.6 A 49.2 A 47.6 A
Lake Markham Rd. to Longwood Markham Rd.***** 1.08 - - - - - - - - - - - - 48.8 A - - - - - - - - 49.8 A 50.6 A 48.7 A 45.3 A
Longwood Markham Rd. to Lake Co. Line 0.85 - - - - - - - - - - - - 55.7 A 49.6 A - - - - - - - - 52.6 A 51.7 A 54.3 A 50.7 A 51.0 A 49.5 A 50.0 A 47.4 A
Average 37.6 B 35.6 B 32.4 C 36.8 B 31.9 C 34.0 B 43.5 A 42.6 A 42.8 A 43.8 A
Note: * Till Year 2007, the segment limits were used to be " SR 415 to Osceola Road" and segment length was 2.71 miles.
Note: ** From 2009, additional control point has been considered on "Central Park Dr." the segment limits will be Central Park Dr. to Upsala Rd. (CR 15) and the segment length will be 0.32 Mile
Note: *** From 2009, additional control point has been considered on "Central Park Dr." the segment limits will be Cedar St. to Central Park Dr. and the segment length will be 0.17 Mile
Note: **** From 2011, additional control point has been considered on "Lake Markham Rd." the segment limits will be Lake Markham Rd. to Wayside Dr. and the segment length will be 1.19 Miles
Note: ***** From 2011, additional control point has been considered on "Lake Markham Rd." the segment limits will be Longwood Markham Rd. to Lake Markham Rd. and the segment length will be 1.08 Miles
Note: ****** From 2011, the segment limits were extended to the Volusia Co. Line and additional control points have been considered on "Osceola Rd., Mullet Lake Park Rd., Avenue C, Hart Rd., Oak St., CR 426, Lake Proctor Ct., and Jungle Rd."
Average Speed Average Speed Average Speed Average Speed Average SpeedAverage Speed Average SpeedAverage Speed Average Speed Average Speed Average Speed Average SpeedAverage Speed Average Speed Average Speed Average Speed Average SpeedAverage Speed Average Speed Average Speed
TABLE S1.2aYear 2014 Seminole County Travel Time & Delay Study
SR 46 (Parts A & B) - Westbound Direction Historical Summary
Year 2005 Year 2006 Year 2007 Year 2008 Year 2009 Year 2010 Year 2011 Year 2012 Year 2014Year 2013
C-3 SR 46 - WB - AM
Roadway
Segments Distance
(mile) (mph) LOS (mph) LOS (mph) LOS (mph) LOS (mph) LOS (mph) LOS (mph) LOS (mph) LOS (mph) LOS (mph) LOS (mph) LOS (mph) LOS (mph) LOS (mph) LOS (mph) LOS (mph) LOS (mph) LOS (mph) LOS (mph) LOS (mph) LOS
PM PEAK HOUR
Volusia Co. Line to Jungle Rd.****** 2.94 - - - - - - - - - - - - - - - - - - - - - - - - 53.3 A 53.3 A 55.0 A 55.0 A 55.8 A 55.8 A 53.0 A 53.0 A
Jungle Rd. to Lake Proctor Ct. 1.52 - - - - - - - - - - - - - - - - - - - - - - - - 53.6 A 53.0 A 56.3 A 53.3 A
Lake Proctor Ct. to CR 426 0.70 - - - - - - - - - - - - - - - - - - - - - - - - 43.3 A 49.9 A 37.2 B 46.7 A 42.0 B 50.8 A 41.2 B 48.8 A
CR 426 to Oak St. 0.27 - - - - - - - - - - - - - - - - - - - - - - - - 45.0 A 45.0 A 40.5 A 40.5 A 36.8 A 36.8 A 42.6 A 42.6 A
Oak St. to Hart St. 0.14 - - - - - - - - - - - - - - - - - - - - - - - - 49.4 A 52.5 A 42.0 B 56.0 A
Hart St. to Avenue C 0.38 - - - - - - - - - - - - - - - - - - - - - - - - 53.0 A 50.7 A 48.5 A 54.3 A
Avenue C to Mullet Lake Park Rd. 2.36 - - - - - - - - - - - - - - - - - - - - - - - - 53.8 A 51.7 A 52.2 A 53.2 A
Mullet Lake Park Rd. to Osceola Rd. 1.42 - - - - - - - - - - - - - - - - - - - - - - - - 53.9 A 53.6 A 52.3 A 51.8 A 52.9 A 51.7 A 53.2 A 53.4 A
Osceola Rd. to Richmond Ave. 2.42 - - - - - - - - - - - - - - - - - - - - - - - - 53.2 A 53.2 A 52.8 A 52.8 A 52.0 A 52.0 A 54.0 A 54.0 A
Richmond Ave. to SR 415 0.40 - - - - - - - - - - - - 11.4 F 11.4 F 13.6 F 13.6 F 18.2 E 18.2 E 12.4 F 12.4 F 12.1 F 12.1 F 17.4 E 17.4 E 22.4 D 22.4 D
SR 415 to Beardall Ave. 0.60 38.3 B 38.3 B 43.4 A 43.4 A 46.2 A 46.2 A 40.4 B 40.4 B 37.7 B 37.7 B 42.4 A 42.4 A 46.2 A 46.2 A 42.9 A 42.9 A 46.2 A 46.2 A 44.4 A 44.4 A
Beardall Ave. to Brisson Ave. 1.01 45.1 A 44.7 A 47.8 A 45.8 A 45.4 A 46.6 A 49.3 A 44.6 A 48.5 A 47.3 A
Brisson Ave. to Mellonville Ave. 1.02 46.3 A 45.7 A 48.3 A 46.5 A 51.3 A 49.5 A 47.9 A 46.8 A 43.8 A 44.6 A 46.7 A 46.7 A 48.2 A 48.7 A 40.5 B 42.4 A 47.1 A 47.8 A 43.4 A 45.3 A
Mellonville Ave. to Sanford Ave. 0.51 26.6 D 26.6 D 20.1 E 20.1 E 29.7 C 29.7 C 24.8 D 24.8 D 26.5 D 26.5 D 21.4 D 21.4 D 19.2 D 19.2 D 34.0 B 34.0 B 30.3 B 30.3 B 25.4 C 25.4 C
Sanford Ave. to Park Ave. 0.19 33.9 C 35.4 B 33.7 C 27.6 C 32.3 C 35.6 B 31.7 B 35.6 A 27.0 C 28.4 B
Park Ave. to US 17/92 0.32 8.6 F 12.0 F 10.2 F 13.9 F 13.2 F 17.1 E 12.2 F 15.4 F 13.1 F 16.8 E 15.6 F 19.7 E 10.2 F 13.7 E 10.1 F 13.7 E 10.4 F 13.3 E 11.0 F 14.2 E
US 17/92 to Holly Ave. 0.12 28.2 C 29.2 C 31.5 C 28.4 C 25.8 D 35.5 B 22.9 C 35.5 A 31.2 B 35.5 A
Holly Ave. to Poplar Ave. 0.16 39.7 B 41.1 B 43.2 A 42.7 A 39.7 B 41.7 B 40.0 A 41.7 A 41.7 A 41.7 A
Poplar Ave. to Mangoustine Ave. 0.29 43.9 A 44.8 A 45.5 A 46.6 A 42.7 A 41.4 B 41.4 A 42.4 A 44.6 A 41.4 A
Mangoustine Ave. to Persimmon Ave. 0.38 47.5 A 47.3 A 42.8 A 49.8 A 42.4 A 43.0 A 41.5 A 43.0 A 43.8 A 43.8 A
Persimmon Ave. to Airport Blvd. 0.57 32.0 C 37.4 B 40.9 B 41.7 B 37.4 B 40.0 B 36.9 B 40.7 B 41.1 B 39.5 B 44.0 A 42.1 A 44.0 A 39.4 A 46.0 A 43.0 A 44.8 A 42.6 A 45.4 A 42.8 A
Airport Blvd. to Rand Yard Rd. 0.26 44.6 A 48.6 A 45.4 A 32.5 C 33.9 C 43.3 A 31.2 C 29.5 C 33.1 C 21.0 D
Rand Yard Rd. to Kennel Rd. 0.48 52.0 A 51.3 A 50.3 A 48.9 A 42.2 A 52.5 A 51.6 A 50.5 A 48.8 A 47.2 A
Kennel Rd. to Cedar Rd. 0.25 51.4 A 51.4 A 52.4 A 22.9 D 44.3 A 53.6 A 51.7 A 51.7 A 51.7 A 51.7 A
Cedar Rd. to Central Park Dr.*** 22.4 D 35.4 B 15.5 F 19.6 E 8.0 F 18.7 E 18.9 E 33.6 C 26.4 D 40.0 B 40.0 B 18.3 E 41.5 B 24.0 D
Central Park Dr. to Upsala Rd./CR 15** 0.51 21.6 D 32.2 C 18.6 E 36.2 B 26.2 D 38.2 B 17.3 E 28.9 C 30.0 C 39.6 B 11.6 F 23.9 D
Upsala Rd./CR 15 to Elder Rd. 0.25
Elder Rd. to Rinehart Rd. 0.26 29.5 C 29.5 C 24.7 D 24.7 D 36.3 B 36.3 B 30.5 C 30.5 C 35.7 B 35.7 B 39.7 B 39.7 B 36.9 B 36.9 B 32.9 C 32.9 C 33.3 C 33.3 C 39.2 B 39.2 B
Rinehart Rd. to Town Center Blvd. 0.19 14.5 F 16.3 E 18.7 E 8.9 F 24.1 D 21.5 D 18.1 E 20.4 E 9.4 F 15.6 F
Town Center Blvd. to I-4 (E. Ramps) 0.16 21.1 D 11.7 F 16.8 E 19.7 E 7.7 F 11.9 F 14.8 F 17.7 E 18.2 E 18.2 E 21.7 D 21.0 E 12.1 F 10.5 F 40.8 B 22.0 D
I-4 (E. Ramps) to I-4 (W. Ramps) 0.10 29.7 C 18.9 E 16.9 E 14.3 F 26.8 D 19.2 E 29.8 C 14.1 F 27.5 C 13.7 F 36.0 B 32.7 C 28.7 C 31.4 C 41.2 B
I-4 (W. Ramps) to Oregon Ave. 0.03
Oregon Ave. to Wayside Dr. 0.15 26.3 D 22.4 D 22.4 D 27.6 C 31.9 C 25.5 D 24.7 D 24.0 D 16.6 E 18.5 E
Wayside Dr. to International Pkwy. 0.39 39.6 B 32.3 C 27.1 C 33.0 C 28.2 C 45.3 A 43.6 A 45.9 A 37.7 B 31.2 C
International Pkwy. to Lake Forest Blvd. 0.25 47.8 A 37.6 B 42.4 A 31.9 C 13.1 F 19.6 E 41.4 B 33.8 C 44.5 A 32.0 C 48.4 A 39.9 B 46.9 A 38.2 B 48.4 A 37.7 B 44.1 A 31.2 C 41.7 B 30.5 C
Lake Forest Blvd. to Orange Blvd. 0.67 36.3 B 36.3 B 27.2 C 27.2 C 40.9 B 40.9 B 41.0 B 41.0 B 39.0 B 39.0 B 45.0 A 45.0 A 42.1 A 42.1 A 41.9 B 41.9 B 36.9 B 36.9 B 37.9 B 37.9 B
Orange Blvd. to Wayside Dr. 0.33 - - - - - - - - - - - - 31.1 C 38.1 B 38.1 B 41.2 B 41.2 B 33.3 C 33.3 C 29.1 C 29.1 C 38.8 B 38.8 B 30.5 C 30.5 C
Wayside Dr. to Lake Markham Rd.**** 1.19 - - - - - - - - - - - - - - - - - - - - 52.1 A 43.5 A 48.6 A 45.5 A
Lake Markham Rd. to Longwood Markham Rd.***** 1.08 - - - - - - - - - - - - 48.8 A - - - - - - - - 47.3 A 41.8 B 49.8 A 45.0 A
Longwood Markham Rd. to Lake Co. Line 0.85 - - - - - - - - - - - - 53.7 A 47.2 A - - - - - - - - 52.0 A 50.3 A 52.0 A 44.9 A 53.7 A 50.3 A 50.5 A 46.6 A
Average 31.8 C 29.4 C 29.0 C 32.3 C 30.4 C 34.5 B 41.5 B 40.2 B 41.3 B 40.7 B
Note: * Till Year 2007, the segment limits were used to be " SR 415 to Osceola Road" and segment length was 2.71 miles.
Note: ** From 2009, additional control point has been considered on "Central Park Dr." the segment limits will be Central Park Dr. to Upsala Rd. (CR 15) and the segment length will be 0.32 Mile
Note: *** From 2009, additional control point has been considered on "Central Park Dr." the segment limits will be Cedar St. to Central Park Dr. and the segment length will be 0.17 Mile
Note: **** From 2011, additional control point has been considered on "Lake Markham Rd." the segment limits will be Lake Markham Rd. to Wayside Dr. and the segment length will be 1.19 Miles
Note: ***** From 2011, additional control point has been considered on "Lake Markham Rd." the segment limits will be Longwood Markham Rd. to Lake Markham Rd. and the segment length will be 1.08 Miles
Note: ****** From 2011, the segment limits were extended to the Volusia Co. Line and additional control points have been considered on "Osceola Rd., Mullet Lake Park Rd., Avenue C, Hart Rd., Oak St., CR 426, Lake Proctor Ct., and Jungle Rd."
Average Speed Average Speed Average Speed Average Speed Average SpeedAverage Speed Average SpeedAverage Speed Average Speed Average Speed Average Speed Average SpeedAverage Speed Average Speed Average Speed Average Speed Average SpeedAverage Speed Average Speed Average Speed
TABLE S1.2bYear 2014 Seminole County Travel Time & Delay Study
SR 46 (Parts A & B) - Westbound Direction Historical Summary
Year 2005 Year 2006 Year 2007 Year 2008 Year 2009 Year 2010 Year 2011 Year 2012 Year 2014Year 2013
C-4 SR 46 - WB - PM
Roadway
Segments Distance
(mile) (mph) LOS (mph) LOS (mph) LOS (mph) LOS (mph) LOS (mph) LOS (mph) LOS (mph) LOS (mph) LOS (mph) LOS (mph) LOS (mph) LOS (mph) LOS (mph) LOS (mph) LOS (mph) LOS (mph) LOS (mph) LOS (mph) LOS (mph) LOS
AM PEAK HOUR
SR 434 to Layer Elementary 0.19 14.7 F 17.3 E 26.1 D 22.0 D 19.2 E 21.6 D 19.7 E 23.4 D 17.2 E 12.5 F
Layer Elementary to Wade St. 0.13 28.6 C 37.7 B 41.9 B 39.7 B 37.3 B 38.8 B 36.7 B 41.2 B 36.7 B 36.7 B
Wade St. to Moss Rd. 0.40 40.0 B 48.2 A 44.0 A 45.1 A 42.7 A 45.3 A 47.1 A 46.2 A 45.3 A 43.6 A
Moss Rd. to Edgemon Ave. 0.14 26.1 D 37.0 B 18.8 E 21.9 D 28.5 C 24.7 D 22.7 D 38.2 B 17.1 E 30.0 C
Edgemon Ave. to Valentine Way 1.19 48.7 A 47.4 A 46.3 A 45.5 A 46.3 A 45.5 A 46.7 A 45.5 A 44.9 A 44.3 A
Valentine Way to US 17/92 0.49 15.1 F 28.4 C 14.9 F 30.2 C 21.1 D 33.7 C 22.7 D 34.1 B 15.1 F 29.6 C 16.1 E 30.4 C 15.6 F 29.8 C 17.5 E 32.5 C 13.2 F 26.5 D 18.8 E 29.1 C
Average 28.2 C 30.2 C 33.7 C 34.1 B 29.6 C 30.4 C 29.8 C 32.5 C 26.5 D 29.1 C
PM PEAK HOUR 15.1 F 28.4 C
SR 434 to Layer Elementary 0.19 32.2 C 22.4 D 29.4 C 33.6 C 24.2 D 28.7 C 32.1 C 36.3 B 34.5 B 35.4 B
Layer Elementary to Wade St. 0.13 40.0 B 31.8 C 34.5 B 40.0 B 38.8 B 41.2 B 41.2 B 44.0 A 44.0 A 38.8 B
Wade St. to Moss Rd. 0.40 45.6 A 47.3 A 45.8 A 46.4 A 45.0 A 44.4 A 46.2 A 48.0 A 43.6 A 42.1 A
Moss Rd. to Edgemon Ave. 0.14 23.1 D 37.6 B 34.4 B 33.0 C 26.3 D 35.0 B 32.3 C 38.2 B 36.5 B 32.3 C
Edgemon Ave. to Valentine Way 1.19 50.0 A 50.0 A 49.6 A 49.2 A 44.8 A 47.0 A 45.5 A 48.2 A 47.0 A 44.3 A
Valentine Way to US 17/92 0.49 29.1 C 39.5 B 23.9 D 36.8 B 28.2 C 39.6 B 18.8 E 35.6 B 26.1 D 35.8 B 18.0 E 33.7 C 13.7 F 30.4 C 15.5 F 33.3 C 15.8 F 32.8 C 23.2 D 36.1 B
Average 39.3 B 36.8 B 39.6 B 35.6 B 35.8 B 33.7 C 30.4 C 33.3 C 32.8 C 36.1 B
Roadway
Segments Distance
(mile) (mph) LOS (mph) LOS (mph) LOS (mph) LOS (mph) LOS (mph) LOS (mph) LOS (mph) LOS (mph) LOS (mph) LOS (mph) LOS (mph) LOS (mph) LOS (mph) LOS (mph) LOS (mph) LOS (mph) LOS (mph) LOS (mph) LOS (mph) LOS
AM PEAK HOUR
US 17/92 to Valentine Way 0.47 43.9 A 42.0 B 40.7 B 41.7 B 37.9 B 42.4 A 40.0 B 42.4 A 41.7 B 42.4 A
Valentine Way to Edgemon Ave. 1.20 48.7 A 47.3 A 43.0 A 48.0 A 44.8 A 43.8 A 43.0 A 46.7 A 43.3 A 46.1 A
Edgemon Ave. to Moss Rd. 0.14 42.7 A 43.1 A 39.8 B 45.6 A 41.8 B 40.0 B 40.0 B 44.2 A 40.0 B 40.0 B
Moss Rd. to Wade St. 0.40 41.9 B 44.9 A 37.0 B 39.1 B 35.7 B 41.4 B 46.2 A 43.6 A 43.6 A 46.2 A
Wade St. to Layer Elementary 0.11 25.9 D 42.9 A 36.4 B 37.4 B 22.4 D 34.7 B 22.8 D 22.8 D 23.6 D 7.6 F
Layer Elementary to SR 434 0.20 14.8 F 38.2 B 13.4 F 38.3 B 16.6 E 36.4 B 15.7 F 38.4 B 16.7 E 35.8 B 12.4 F 34.8 B 13.5 F 34.6 B 9.5 F 32.6 C 8.2 F 30.2 C 12.9 F 31.2 C
Average 38.3 B 38.3 B 36.4 B 38.4 B 35.8 B 34.8 B 34.6 B 32.6 C 30.2 C 31.2 C
PM PEAK HOUR
US 17/92 to Valentine Way 0.47 40.2 B 38.6 B 44.1 A 38.4 B 36.1 B 37.4 B 40.0 B 43.0 A 40.6 B 39.5 B
Valentine Way to Edgemon Ave. 1.20 37.9 B 37.6 B 47.4 A 39.3 B 39.2 B 38.8 B 39.0 B 44.9 A 39.2 B 43.0 A
Edgemon Ave. to Moss Rd. 0.14 41.5 B 42.3 A 41.3 B 43.5 A 40.2 B 36.5 B 40.0 B 44.2 A 38.2 B 42.0 B
Moss Rd. to Wade St. 0.40 40.7 B 39.4 B 37.9 B 42.2 A 39.0 B 39.3 B 47.1 A 42.9 A 45.3 A 44.4 A
Wade St. to Layer Elementary 0.11 40.8 B 28.8 C 39.4 B 28.3 C 28.5 C 41.2 B 44.0 A 28.7 C 36.7 B 33.0 C
Layer Elementary to SR 434 0.20 11.3 F 33.0 C 17.2 E 34.6 B 19.3 E 39.9 B 16.4 E 35.2 B 18.3 E 35.1 B 10.5 F 31.0 C 15.5 F 35.5 B 9.7 F 32.8 C 9.9 F 31.5 C 9.0 F 31.4 C
Average 32.8 C 34.6 B 39.9 B 35.2 B 35.1 B 31.0 C 35.5 B 32.8 C 31.5 C 31.4 C
Average Speed Average Speed Average Speed Average Speed Average SpeedAverage Speed Average Speed Average Speed Average Speed Average SpeedAverage Speed Average Speed Average Speed Average Speed Average SpeedAverage Speed Average Speed Average Speed
Average Speed Average Speed Average Speed Average Speed Average Speed Average SpeedAverage Speed Average Speed Average Speed Average Speed Average Speed Average Speed Average SpeedAverage Speed Average Speed Average Speed Average Speed Average Speed
TABLE S2.1aYear 2014 Seminole County Travel Time & Delay Study
SR 419 - Northbound Direction Historical Summary
TABLE S2.1bYear 2014 Seminole County Travel Time & Delay Study
Year 2005 Year 2006 Year 2007 Year 2008 Year 2009 Year 2010 Year 2011 Year 2012 Year 2014
Rdwy Section
Year 2013
Rdwy Segment Rdwy Section
Average Speed Average Speed
Year 2013
Rdwy Segment Rdwy Section
Average Speed Average Speed
SR 419 - Southbound Direction Historical Summary
Year 2009 Year 2010 Year 2011 Year 2012 Year 2014Year 2005 Year 2006 Year 2007 Year 2008
Rdwy Section Rdwy Segment
C-5 SR 419
Roadway
Segments Distance
(mile) (mph) LOS (mph) LOS (mph) LOS (mph) LOS (mph) LOS (mph) LOS (mph) LOS (mph) LOS (mph) LOS (mph) LOS (mph) LOS (mph) LOS (mph) LOS (mph) LOS (mph) LOS (mph) LOS (mph) LOS (mph) LOS (mph) LOS (mph) LOS
AM PEAK HOUR
Orange County Line to Maitland Blvd. 0.01 1.3 F 1.3 F 0.9 F 1.7 F 1.1 F - - - - - - - - - - - - - - - - - - - -
Maitland Blvd. to Gateway Dr. 0.30 40.6 A 22.5 C 28.6 B 27.1 C 31.2 B 41.5 A 39.5 A 37.7 A 23.7 C 14.2 E
Gateway Dr. to Tailwood Dr./Lotus landing Blvd. 0.45 38.5 A 38.8 A 46.3 A 47.3 A 33.3 B 34.9 B 44.5 A 37.3 A 24.7 C 26.9 C
Trailwood Dr./Lotus Landing Blvd. to W. Town Pkwy. 0.56 32.7 B 27.1 C 27.3 C 23.5 C 40.9 A 26.6 C 23.5 C 25.0 C 35.4 A 25.8 C 35.3 A 36.3 A 39.7 A 41.3 A 30.3 B 34.1 B 41.2 A 29.5 B 44.0 A 26.2 C
W. Town Pkwy. to Orange Ave. 0.24 40.0 A 36.5 A 44.3 A 37.3 A 43.2 A 33.9 B 45.9 A 39.0 A 27.3 C 26.8 C
Orange Ave. to SR 436 0.25 8.1 F 13.9 E 18.9 D 25.1 C 10.8 F 17.9 D 14.2 E 20.9 D 9.9 F 16.4 E 11.9 F 18.0 D 9.7 F 16.5 E 9.2 F 15.3 E 14.1 E 18.7 D 15.8 E 20.0 D
SR 436 to San Sebastian Prado 0.45 40.3 A 34.6 B 27.8 C 38.1 A 41.7 A 44.3 A 37.5 A 38.0 A 40.6 A 36.8 A
San Sebastian Prado to Sand Lake Rd. 0.55 38.1 A 39.1 A 23.5 C 27.6 C 23.8 C 25.5 C 32.2 B 34.7 B 27.5 C 32.6 B 29.5 B 34.7 B 25.8 C 30.0 B 26.2 C 30.5 B 34.7 B 37.2 A 28.7 B 31.9 B
Sand Lake Rd. to Jamestown Blvd. 0.19 19.4 D 14.5 E 21.5 D 30.1 B 22.4 C 22.4 C 32.6 B 36.8 A 21.9 D 19.3 D
Jamestown Blvd. to E. Lake Brantley Rd. 0.48 41.9 A 28.8 B 34.0 B 35.1 A 38.5 A 36.5 A 33.5 B 38.4 A 35.6 A 28.2 B
E. Lake Brantley Rd. to Wekiva Springs Ln. 0.44 25.1 C 15.6 E 38.4 A 29.9 B 41.3 A 37.2 A 35.2 A 40.6 A 28.7 B 33.1 B
Wekiva Springs Ln. to Wekiva Springs Rd./Montgomery Rd. 0.23 5.3 F 16.5 E 4.8 F 12.8 F 6.0 F 18.6 D 5.9 F 18.4 D 8.1 F 22.6 C 6.8 F 19.6 D 26.7 C 32.4 B 9.2 F 24.7 C 8.8 F 20.8 D 12.5 F 22.7 C
Wekiva Springs Rd./Montgomery Rd. to Gum St./The Springs 0.11 10.3 F 8.6 F 17.3 D 10.0 F 16.8 E 22.0 D 28.7 B 33.0 B 26.4 C 31.4 B
Gum St./The Springs to Springs Center Blvd. 0.35 10.2 F 17.0 D 13.6 E 14.1 E 25.3 C 16.8 E 39.7 A 36.6 A 24.4 C 15.7 E
Springs Center Blvd. to Markham Woods Rd. 0.23 12.1 F 10.8 F 8.8 F 11.5 F 9.4 F 12.3 F 14.0 E 13.1 E 7.0 F 13.1 E 10.2 F 14.6 E 19.4 D 29.2 B 9.8 F 20.3 D 10.4 F 17.6 D 9.5 F 14.1 E
Markham Woods Rd. to Douglas Ave. 0.07
Douglas Ave. to I-4 (W. Ramps) 0.14 10.7 F 9.5 F 19.7 D 8.0 F 15.1 E 20.4 D 26.5 C 26.5 C 30.0 B 13.9 E
I-4 (W. Ramps) to I-4 (E. Ramps)* 0.07 27.9 C 12.8 F 24.9 C 11.7 F 11.0 F 16.1 E 30.1 B 10.3 F 27.6 C 17.1 D 38.2 A 23.3 C 26.2 C 26.4 C 32.3 B 27.9 C 36.9 A 31.8 B 32.0 B 16.7 E
I-4 (E. Ramps) to Raymond Ave.* 0.13 29.0 B 29.0 B 30.2 B 30.2 B 36.3 A 36.3 A 30.6 B 30.6 B 16.6 E 16.6 E 28.0 C 28.0 C 32.3 B 32.3 B 19.5 D 19.5 D 8.7 F 8.7 F 30.0 B 30.0 B
Raymond Ave. to Tarrytown Tr./Roxboro Rd.* 0.48 43.1 A 43.9 A 39.5 A 40.9 A 45.0 A 41.7 A 41.7 A 38.4 A 40.3 A 40.3 A
Tarrytown Tr./Roxboro Rd. to Tollgate Tr.* 0.35 41.3 A 43.7 A 38.2 A 43.1 A 41.3 A 34.6 B 41.6 A 40.8 A 42.9 A 43.7 A
Tollgate Tr. to Palm Springs Dr.* 0.17 15.3 E 32.5 B 12.4 F 30.7 B 15.3 E 30.9 B 11.5 F 28.9 B 15.8 E 33.5 B 17.9 D 32.1 B 14.0 E 31.1 B 8.4 F 24.1 C 10.3 F 27.4 C 8.6 F 25.4 C
Palm Springs Dr. to Rangeline Rd.* 0.58 34.5 B 35.5 A 32.3 B 34.9 B 34.9 B 34.4 B 34.4 B 39.7 A 39.7 A 30.3 B 30.3 B 35.9 A 35.9 A 40.5 A 40.5 A 38.2 A 38.2 A 19.8 D 19.8 D
Rangeline Rd. to Florida Central Pkwy. 0.57 23.0 C 21.9 D 20.5 D 18.5 D 24.9 C 18.0 D 33.3 B 26.0 C 30.8 B 22.4 C
Florida Central Pkwy. to CR 427/Ronald Reagan Blvd. 0.40 28.1 B 27.8 C 35.7 A 29.0 B 28.0 B 23.0 C 23.8 C 20.3 D 30.7 B 27.0 C 32.4 B 22.1 C 34.8 B 33.9 B 34.8 B 29.1 B 38.1 A 33.4 B 31.6 B 25.4 C
CR 427/Ronald Reagan Blvd. to Grant St. 0.49 37.9 A 24.2 C 29.7 B 35.2 A 33.8 B 53.6 A 42.9 A 41.1 A 40.0 A 41.1 A
Grant St. to S. Wayman St. 0.25 36.3 A 35.5 A 31.4 B 32.8 B 34.4 B 38.9 A 41.1 A 38.9 A 45.9 A 41.1 A
S. Wayman St. to US 17/92 0.41 19.6 D 28.4 B 14.4 E 20.7 D 18.4 D 24.7 C 19.5 D 27.1 C 13.4 E 22.1 C 14.1 E 28.6 B 16.0 E 26.6 C 13.5 E 23.6 C 22.6 C 32.2 B 14.6 E 25.2 C
US 17/92 to Sun Shadow Dr. 0.33 27.3 C 21.6 D 33.6 B 26.5 C 26.6 C 38.1 A 33.0 B 34.1 B 36.4 A 37.1 A
Sun Shadow Dr. to Timberlane Tr. 0.12 33.2 B 26.2 C 36.3 A 34.0 B 36.8 A 40.5 A 37.8 A 41.4 A 36.0 A 25.7 C
Timberlane Tr. to Sheoah Blvd. 0.37 21.1 D 28.4 B 16.8 E 19.9 D 33.0 B 22.9 C 17.6 D 28.2 B 37.3 A 22.3 C
Sheoah Blvd. to Edgemon Ave. 0.23 18.5 D 25.7 C 29.6 B 22.5 C 36.2 A 22.9 C 17.0 D 29.3 B 27.6 C 40.6 A
Edgemon Ave. to Moss Rd. 0.25 33.4 B 24.5 C 32.9 B 26.2 C 29.9 B 25.4 C 33.8 B 25.1 C 29.3 B 31.4 B 30.0 B 30.1 B 28.3 B 25.1 C 26.8 C 31.7 B 31.2 B 33.6 B 32.6 B 30.5 B
Moss Rd. to Hayes Rd. 0.62 29.3 B 37.3 A 41.5 A 38.7 A 42.0 A 41.1 A 43.0 A 36.0 A 38.3 A 40.9 A
Hayes Rd. to SR 419 0.31 29.4 B 29.3 B 41.9 A 38.6 A 36.3 A 39.7 A 27.9 C 34.4 B 28.8 B 36.7 A 41.3 A 41.2 A 35.1 A 40.0 A 45.4 A 38.6 A 46.2 A 40.6 A 33.3 B 38.1 A
SR 419 to Consolidated Services/Orange Ave. 0.18 39.9 B 37.3 B 31.7 C 29.5 C 35.7 B 41.5 B 34.8 B 40.0 B 47.0 A 20.4 E
Consolidated/Orange Ave. to Winding Hollow Blvd. 0.47 32.1 C 44.0 A 37.3 B 38.4 B 36.5 B 33.0 C 27.2 C 22.4 D 30.7 C 41.5 B
Winding Hollow Blvd. to Central Winds Park 0.74 43.9 A 44.2 A 44.9 A 49.3 A 42.6 A 36.3 B 37.9 B 42.8 A 33.5 C 41.5 B
Central Winds Park to Doran Rd. 0.42 46.6 A 39.4 B 43.8 A 45.6 A 40.0 B 39.4 B 35.5 B 45.0 A
Doran Rd. to Tuskawilla Rd. 0.30 22.8 D 37.4 B 16.8 E 34.5 B 25.6 D 37.4 B 24.0 D 34.8 B 19.1 E 31.1 C 42.0 B 35.0 B 15.4 F 29.4 C 17.8 E 33.2 C
Tuskawilla Rd. to Spring Ave. 1.74 49.2 A 49.2 A 48.8 A 52.4 A 47.5 A 51.8 A 48.3 A 48.1 A 46.7 A 48.5 A
Spring Ave. to Vistawilla Dr. 0.20 26.7 D 20.2 E 37.8 B 48.5 A 26.2 D 21.4 D 32.4 C 44.4 A 26.1 D 38.7 B
Vistawilla Dr. to SR 417 (S. Ramps) 0.33 24.2 D 40.2 B 22.4 D 38.0 B 24.6 D 41.8 B 23.4 D 44.1 A 18.3 E 36.5 B 27.8 C 41.6 B 36.2 B 44.2 A 17.5 E 38.1 B 30.5 C 40.7 B 28.7 C 43.2 A
SR 417 (S. Ramps) to SR 417 (N. Ramps) 0.11 27.2 C 23.8 D 24.1 D 18.8 E 25.4 D 26.7 D 42.4 A 24.8 D 21.3 D 18.9 E
SR 417 (N. Ramps) to Palm Dr. 0.22 39.3 B 40.1 B 39.2 B 33.9 C 34.9 B 40.0 B 36.4 B 37.5 B 36.7 B 37.7 B
Palm Dr. to De Leon St. 0.81 43.9 A 40.8 B 37.5 B 36.2 B 43.2 A 39.6 B 44.1 A 37.7 B 41.6 B 38.1 B 39.7 B 38.0 B 39.4 B 39.1 B 42.8 A 38.9 B 43.5 A 38.3 B 41.7 B 36.7 B
De Leon St. to Magnolia St. 0.92 34.6 B 35.4 A 36.5 A 39.8 A 33.7 B 32.5 B 35.2 A 36.2 A 36.9 A 36.6 A
Magnolia St. to SR 426/CR 419 0.47 17.0 E 25.6 C 16.5 E 25.4 C 12.6 F 22.3 C 16.7 E 27.1 C 16.8 E 24.9 C 15.4 E 23.0 C 13.7 E 23.1 C 12.3 F 21.9 D 12.4 F 22.0 C 15.0 E 24.6 C
SR 426/CR 419 to Clark St. 0.25 32.3 B 31.6 B 31.9 B 32.9 B 23.0 C 31.9 B 24.6 C 30.0 B 32.6 B 19.7 D
Clark St. to Mitchell Hammock Rd. 0.77 23.6 C 19.6 D 16.8 E 17.7 D 22.1 C 18.2 D 22.8 C 20.6 D 16.0 E 13.7 E
Mitchell Hammock Rd. to Alafaya Woods Blvd. 0.44 41.6 A 28.7 B 39.1 A 25.2 C 35.5 A 22.3 C 24.1 C 21.2 D 35.7 A 25.3 C 32.7 B 23.0 C 28.7 B 24.6 C 24.3 C 22.9 C 25.0 C 20.0 D 39.7 A 18.4 D
Alafaya Woods Blvd. to Chapman Rd. 0.57 31.1 B 25.3 C 29.9 B 25.2 C 25.4 C 27.4 C 40.7 A 38.0 A 40.2 A 43.8 A
Chapman Rd. to Stillwater Dr. 0.62 46.3 A 33.9 B 44.7 A 48.0 A 32.7 B 48.3 A 43.8 A 45.4 A 46.9 A 45.7 A
Stillwater Dr. to Carrigan Ave. 0.39 38.1 A 36.7 A 46.0 A 33.7 B 39.8 A 34.9 B 32.1 B 23.4 C 31.2 B 38.7 A
Carrigan Ave. to Econ River Pl. 0.16 43.6 A 35.2 A 50.3 A 44.8 A 37.1 A 46.4 A 46.4 A 25.5 C 26.7 C 45.7 A
Econ River Pl. to E. Palm Valley Dr. 0.58 44.1 A 48.4 A 42.4 A 49.0 A 35.4 A 35.5 A 32.8 B 41.4 A 43.0 A 36.2 A
E. Palm Valley Dr. to McCulloch Rd. 0.26 20.6 D 36.2 A 15.7 E 30.7 B 13.9 E 33.5 B 15.8 E 32.7 B 19.7 D 30.3 B 15.6 E 31.8 B 11.5 F 30.7 B 11.1 F 28.9 B 12.1 F 31.9 B 20.0 D 37.3 A
McCulloch Rd. to Orange County Line 0.03 27.3 C 27.3 C 21.4 D 21.4 D 43.1 A 43.1 A 26.6 C 26.6 C 11.6 F 11.6 F - - - - - - - - - - - - - - - - - - - -
Average 27.1 C 25.5 C 26.9 C 26.9 C 27.2 C 28.6 B 30.7 B 28.5 B 28.4 B 27.4 C
Note: *From 2012, construction in progress on SR 434 from I-4 to Rangeline Rd (Financial Project ID: 240233-3-52-01) which may have skewed the LOS for the segments.
Average Speed Average SpeedAverage Speed Average Speed Average Speed Average Speed Average Speed
Average Speed Average Speed Average Speed Average SpeedAverage Speed Average Speed Average Speed Average Speed Average Speed Average Speed Average Speed
B26.4 29.9 C 37.5
TABLE S3.1aYear 2014 Seminole County Travel Time & Delay Study
SR 434 (Parts A, B, & C) Eastbound Direction Historical Summary
Year 2013
Rdwy Segment Rdwy Section
Average Speed Average Speed
D 33.4 C
C-6 SR 434 - EB - AM
Roadway
Segments Distance
(mile) (mph) LOS (mph) LOS (mph) LOS (mph) LOS (mph) LOS (mph) LOS (mph) LOS (mph) LOS (mph) LOS (mph) LOS (mph) LOS (mph) LOS (mph) LOS (mph) LOS (mph) LOS (mph) LOS (mph) LOS (mph) LOS (mph) LOS (mph) LOS
PM PEAK HOUR
Orange County Line to Maitland Blvd. 0.01 6.8 F 2.0 F 2.1 F 5.2 F 1.9 F - - - - - - - - - - - - - - - - - - - -
Maitland Blvd. to Gateway Dr. 0.30 23.8 C 13.4 E 25.0 C 18.7 D 21.9 D 19.3 D 32.4 B 23.8 C 16.2 E 19.3 D
Gateway Dr. to Tailwood Dr./Lotus landing Blvd. 0.45 37.0 A 26.4 C 31.6 B 26.6 C 28.6 B 27.1 C 46.0 A 43.8 A 30.3 B 43.3 A
Trailwood Dr./Lotus Landing Blvd. to W. Town Pkwy. 0.56 29.7 B 28.9 B 17.6 D 16.9 E 24.4 C 22.8 C 16.9 E 19.3 D 32.7 B 23.9 C 28.6 B 25.5 C 28.4 B 34.1 B 40.8 A 36.2 A 37.5 A 27.3 C 32.7 B 30.6 B
W. Town Pkwy. to Orange Ave. 0.24 29.9 B 35.7 A 29.9 B 20.6 D 32.7 B 20.8 D 22.3 C 16.4 E 22.1 C 20.8 D
Orange Ave. to SR 436 0.25 7.0 F 11.6 F 6.7 F 11.7 F 6.9 F 11.4 F 6.7 F 10.2 F 8.2 F 13.4 E 14.0 E 16.9 E 15.5 E 18.4 D 17.6 D 16.9 E 9.3 F 13.2 E 11.4 F 14.8 E
SR 436 to San Sebastian Prado 0.45 35.7 A 37.8 A 40.4 A 38.1 A 37.3 A 28.4 B 32.1 B 37.5 A 39.4 A 41.8 A
San Sebastian Prado to Sand Lake Rd. 0.55 36.2 A 36.0 A 42.0 A 39.9 A 43.7 A 42.1 A 38.4 A 38.3 A 34.1 B 35.5 A 29.5 B 29.0 B 31.7 B 31.9 B 22.1 C 27.1 C 22.6 C 28.1 B 33.0 B 36.5 A
Sand Lake Rd. to Jamestown Blvd. 0.19 17.3 D 20.0 D 42.1 A 26.9 C 22.4 C 9.7 F 20.0 D 14.8 E 13.4 E 18.7 D
Jamestown Blvd. to E. Lake Brantley Rd. 0.48 30.2 B 37.5 A 34.4 B 34.8 B 26.9 C 28.0 C 30.6 B 30.0 B 28.5 B 29.1 B
E. Lake Brantley Rd. to Wekiva Springs Ln. 0.44 28.3 B 17.0 E 38.4 A 37.5 A 40.1 A 18.9 D 33.0 B 40.0 A 39.7 A 41.0 A
Wekiva Springs Ln. to Wekiva Springs Rd./Montgomery Rd. 0.23 9.2 F 20.0 D 4.4 F 13.4 E 7.0 F 21.5 D 19.5 D 30.3 B 14.8 E 25.4 C 8.6 F 15.3 E 10.0 F 21.6 D 9.9 F 21.1 D 13.8 E 22.6 C 38.9 A 30.9 B
Wekiva Springs Rd./Montgomery Rd. to Gum St./The Springs 0.11 9.3 F 10.9 F 31.6 B 21.3 D 24.2 C 13.2 E 31.4 B 22.0 D 34.7 B 38.8 A
Gum St./The Springs to Springs Center Blvd. 0.35 12.9 F 9.3 F 12.4 F 14.5 E 17.8 D 13.8 E 31.6 B 26.9 C 17.0 E 34.4 B
Springs Center Blvd. to Markham Woods Rd. 0.23 9.1 F 10.7 F 5.7 F 7.8 F 6.6 F 10.5 F 6.1 F 10.3 F 8.3 F 13.4 E 6.0 F 10.0 F 10.5 F 20.1 D 7.8 F 15.6 E 5.4 F 10.9 F 14.2 E 24.5 C
Markham Woods Rd. to Douglas Ave. 0.07
Douglas Ave. to I-4 (W. Ramps) 0.14 23.7 C 8.3 F 8.5 F 5.0 F 10.0 F 14.2 E 20.4 D 13.4 E 12.8 F 15.0 E
I-4 (W. Ramps) to I-4 (E. Ramps)* 0.07 34.0 B 25.8 C 10.6 F 8.8 F 11.6 F 9.2 F 26.8 C 6.5 F 27.6 C 12.2 F 32.3 B 16.8 E 15.0 E 18.6 D 28.0 C 15.6 E 32.0 B 15.6 E 30.0 B 17.6 D
I-4 (E. Ramps) to Raymond Ave.* 0.13 35.7 A 35.7 A 17.4 D 17.4 D 15.7 E 15.7 E 21.5 D 21.5 D 21.0 D 21.0 D 22.1 C 22.1 C 36.5 A 36.5 A 20.0 D 20.0 D 14.7 E 14.7 E 18.6 D 18.6 D
Raymond Ave. to Tarrytown Tr./Roxboro Rd.* 0.48 44.5 A 39.9 A 43.0 A 42.3 A 45.1 A 43.0 A 41.7 A 39.5 A 10.6 F 38.7 A
Tarrytown Tr./Roxboro Rd. to Tollgate Tr.* 0.35 29.6 B 28.9 B 39.7 A 40.2 A 33.7 B 41.6 A 35.2 A 37.1 A 26.2 C 42.0 A
Tollgate Tr. to Palm Springs Dr.* 0.17 10.5 F 25.8 C 14.2 E 27.7 C 19.6 D 35.0 B 19.5 D 34.9 B 13.0 E 29.5 B 13.1 E 30.6 B 14.4 E 30.0 B 35.2 A 37.8 A 18.2 D 14.7 E 6.3 F 21.1 D
Palm Springs Dr. to Rangeline Rd.* 0.58 29.9 B 29.9 B 28.5 B 31.5 B 31.5 B 29.9 B 29.9 B 34.6 B 34.6 B 29.7 B 29.7 B 35.2 A 35.2 A 38.7 A 38.7 A 17.9 D 17.9 D 32.5 B 32.5 B
Rangeline Rd. to Florida Central Pkwy. 0.57 23.6 C 18.9 D 10.9 F 17.3 D 31.1 B 24.2 C 19.8 D 16.8 E 10.5 F 20.4 D
Florida Central Pkwy. to CR 427/Ronald Reagan Blvd. 0.40 11.9 F 20.2 D 13.1 E 19.4 D 15.0 E 12.2 F 21.5 D 18.8 D 23.3 C 27.3 C 13.3 E 18.1 D 17.8 D 18.9 D 14.4 E 15.7 E 15.1 E 12.0 F 18.9 D 19.7 D
CR 427/Ronald Reagan Blvd. to Grant St. 0.49 30.2 B 20.9 D 37.4 A 29.1 B 36.6 A 48.0 A 40.5 A 39.0 A 33.0 B 39.0 A
Grant St. to S. Wayman St. 0.25 23.5 C 31.0 B 43.0 A 37.4 A 37.0 A 31.3 B 40.0 A 37.9 A 33.9 B 42.2 A
S. Wayman St. to US 17/92 0.41 11.5 F 18.5 D 14.8 E 19.5 D 14.0 E 24.1 C 15.4 E 23.1 C 16.2 E 25.4 C 13.2 E 25.9 C 16.0 E 26.1 C 11.6 F 21.1 D 27.0 C 30.8 B 11.7 F 21.7 D
US 17/92 to Sun Shadow Dr. 0.33 11.3 F 17.6 D 32.2 B 27.0 C 18.0 D 22.2 C 28.7 B 31.4 B 17.1 D 29.6 B
Sun Shadow Dr. to Timberlane Tr. 0.12 10.6 F 31.4 B 40.8 A 37.1 A 35.8 A 30.5 B 32.2 B 36.2 A 23.8 C 40.5 A
Timberlane Tr. to Sheoah Blvd. 0.37 20.6 D 39.3 A 39.6 A 38.9 A 37.4 A 26.7 C 32.7 B 42.4 A 33.7 B 30.0 B
Sheoah Blvd. to Edgemon Ave. 0.23 30.0 B 32.5 B 22.4 C 27.8 C 27.8 C 30.0 B 35.0 B 21.0 D 28.7 B 29.4 B
Edgemon Ave. to Moss Rd. 0.25 29.1 B 17.2 D 38.6 A 28.4 B 26.7 C 30.9 B 26.7 C 30.7 B 27.6 C 26.5 C 27.3 C 26.7 C 33.3 B 31.9 B 27.3 C 30.5 B 34.9 B 24.8 C 34.9 B 32.3 B
Moss Rd. to Hayes Rd. 0.62 31.2 B 30.5 B 39.4 A 35.2 A 31.4 B 41.5 A 36.7 A 40.6 A 32.6 B 41.3 A
Hayes Rd. to SR 419 0.31 24.9 C 28.9 B 24.8 C 28.4 B 27.6 C 34.6 B 29.3 B 33.2 B 29.3 B 32.2 B 45.4 A 42.7 A 39.6 A 37.6 A 31.5 B 37.1 A 35.3 A 33.5 B 24.3 C 33.7 B
SR 419 to Consolidated Services/Orange Ave. 0.18 35.2 B 29.0 C 38.0 B 37.1 B 38.4 B 33.7 C 38.6 B 37.2 B 33.7 C 20.8 E
Consolidated/Orange Ave. to Winding Hollow Blvd. 0.47 36.4 B 32.3 C 28.4 C 31.8 C 25.3 D 34.3 B 32.6 C 23.8 D 29.3 C 36.0 B
Winding Hollow Blvd. to Central Winds Park 0.74 48.7 A 42.5 A 38.2 B 47.1 A 43.7 A 47.0 A 48.0 A 36.6 B 42.8 A 46.0 A
Central Winds Park to Doran Rd. 0.42 43.1 A 41.3 B 36.2 B 43.8 A 40.6 B 22.5 D 33.6 C 36.0 B
Doran Rd. to Tuskawilla Rd. 0.30 18.5 E 32.0 C 11.1 F 29.6 C 18.7 E 31.4 C 24.0 D 37.2 B 13.0 F 31.4 C 22.4 D 27.5 C 13.1 F 28.9 C 28.9 C 35.3 B
Tuskawilla Rd. to Spring Ave. 1.74 47.1 A 49.4 A 47.8 A 50.4 A 43.2 A 51.5 A 49.0 A 47.4 A 45.9 A 48.3 A
Spring Ave. to Vistawilla Dr. 0.20 36.6 B 19.6 E 18.2 E 24.5 D 29.4 C 37.5 B 26.7 D 42.9 A 33.3 C 42.9 A
Vistawilla Dr. to SR 417 (S. Ramps) 0.33 17.4 E 37.0 B 18.4 E 35.7 B 14.8 F 32.7 C 17.8 E 37.2 B 22.8 D 37.0 B 36.9 B 47.3 A 19.6 E 37.9 B 26.7 D 42.2 A 27.4 C 40.5 B 18.8 E 39.0 B
SR 417 (S. Ramps) to SR 417 (N. Ramps) 0.11 20.5 E 22.2 D 21.4 D 15.0 F 17.1 E 28.8 C 14.7 F 23.2 D 28.7 C 28.7 C
SR 417 (N. Ramps) to Palm Dr. 0.22 36.4 B 34.0 C 37.5 B 38.5 B 38.1 B 36.4 B 35.3 B 27.9 C 37.7 B 34.7 B
Palm Dr. to De Leon St. 0.81 41.9 B 37.3 B 39.0 B 35.6 B 43.2 A 38.7 B 41.6 B 35.5 B 39.2 B 35.2 B 40.0 B 38.0 B 41.3 B 33.9 C 40.3 B 34.9 B 41.0 B 38.8 B 38.4 B 36.5 B
De Leon St. to Magnolia St. 0.92 37.6 A 41.0 A 34.0 B 38.3 A 35.1 A 32.5 B 35.2 A 37.1 A 34.1 B 31.0 B
Magnolia St. to SR 426/CR 419 0.47 9.3 F 18.6 D 10.6 F 20.7 D 18.8 D 26.6 C 17.3 D 27.1 C 18.6 D 26.9 C 21.1 D 27.1 C 13.8 E 23.2 C 13.3 E 23.2 C 10.1 F 18.8 D 15.2 E 22.9 C
SR 426/CR 419 to Clark St. 0.25 28.9 B 26.4 C 32.5 B 24.5 C 23.7 C 33.3 B 20.0 D 15.5 E 31.9 B 16.0 E
Clark St. to Mitchell Hammock Rd. 0.77 15.4 E 13.7 E 19.2 D 13.0 E 19.9 D 20.8 D 22.9 C 14.7 E 14.0 E 14.6 E
Mitchell Hammock Rd. to Alafaya Woods Blvd. 0.44 24.5 C 19.1 D 22.5 C 17.3 D 43.2 A 25.5 C 37.1 A 18.2 D 22.5 C 21.2 D 31.5 B 25.0 C 25.8 C 23.1 C 37.4 A 18.2 D 38.0 A 19.8 D 27.0 C 17.3 D
Alafaya Woods Blvd. to Chapman Rd. 0.57 27.9 C 29.2 B 24.1 C 30.2 B 25.3 C 19.4 D 49.6 A 46.2 A 29.0 B 27.4 C
Chapman Rd. to Stillwater Dr. 0.62 36.1 A 45.6 A 46.2 A 46.8 A 43.4 A 46.5 A 51.0 A 46.5 A 43.1 A 29.5 B
Stillwater Dr. to Carrigan Ave. 0.39 40.3 A 42.0 A 29.5 B 38.1 A 39.8 A 43.3 A 47.8 A 42.5 A 34.8 B 47.1 A
Carrigan Ave. to Econ River Pl. 0.16 44.0 A 30.1 B 41.5 A 43.7 A 46.4 A 46.4 A 51.0 A 46.4 A 43.6 A 50.5 A
Econ River Pl. to E. Palm Valley Dr. 0.58 44.6 A 44.6 A 43.0 A 29.0 B 48.4 A 45.2 A 49.7 A 41.9 A 43.0 A 37.0 A
E. Palm Valley Dr. to McCulloch Rd. 0.26 26.3 C 35.0 A 23.0 C 35.9 A 26.9 C 33.5 B 24.1 C 33.7 B 30.7 B 36.6 A 8.6 F 26.3 C 17.5 D 42.0 A 14.2 E 36.6 A 16.4 E 32.9 B 11.6 F 28.2 B
McCulloch Rd. to Orange County Line 0.03 40.9 A 40.9 A 24.5 C 24.5 C 37.0 A 37.0 A 19.4 D 19.4 D 30.5 B 30.5 B - - - - - - - - - - - - - - - - - - - -
Average 24.0 C 21.7 D 25.1 C 24.9 C 27.2 C 25.8 C 28.9 B 26.6 C 23.2 C 27.0 C
Note: *From 2012, construction in progress on SR 434 from I-4 to Rangeline Rd (Financial Project ID: 240233-3-52-01) which may have skewed the LOS for the segments.
Average Speed Average Speed Average Speed Average Speed Average SpeedAverage Speed Average Speed Average Speed Average Speed Average SpeedAverage Speed Average Speed Average Speed Average Speed Average SpeedAverage Speed Average Speed Average Speed
(mile) (mph) LOS (mph) LOS (mph) LOS (mph) LOS (mph) LOS (mph) LOS (mph) LOS (mph) LOS (mph) LOS (mph) LOS (mph) LOS (mph) LOS (mph) LOS (mph) LOS (mph) LOS (mph) LOS (mph) LOS (mph) LOS (mph) LOS (mph) LOS
AM PEAK HOUR
Orange County Line to McCullouch Rd. 0.04 5.7 F 5.7 F 28.9 B 28.9 B 25.0 C 25.0 C 31.0 B 31.0 B 1.5 F 1.5 F - - - - - - - - - - - - - - - - - - - -
McCulloch Rd to E. Palm Valley Dr. 0.27 31.7 B 33.4 B 43.0 A 37.5 A 36.4 A 26.0 C 31.8 B 21.1 D 24.8 C 41.1 A
E. Palm Valley Dr. to Econ River Pl. 0.59 50.8 A 49.6 A 51.8 A 50.7 A 44.7 A 50.4 A 47.7 A 47.0 A 45.8 A 49.7 A
Econ River Pl. to Carrigan Ave. 0.16 28.4 B 46.4 A 46.4 A 33.7 B 23.4 C 23.2 C 26.2 C 28.3 B 29.1 B 48.0 A
Carrigan Ave. to Stillwater Dr. 0.40 49.0 A 43.9 A 51.5 A 49.6 A 45.9 A 47.8 A 45.0 A 45.9 A 49.0 A 50.0 A
Stillwater Dr. to Chapman Rd. 0.61 28.2 B 48.8 A 28.1 B 24.0 C 27.3 C 27.0 C 36.1 A 29.8 B 39.4 A 26.7 C
Chapman Rd. to Alafaya Woods Blvd. 0.58 44.6 A 38.0 A 34.9 B 42.3 A 41.4 A 40.4 A 42.5 A 37.0 A 34.7 B 34.7 B 27.4 C 32.0 B 40.2 A 38.8 A 42.7 A 35.3 A 34.9 B 37.6 A 34.9 B 37.7 A
Alafaya Woods Blvd. to Mitchell Hammock Rd. 0.43 17.0 D 19.5 D 19.7 D 18.4 D 15.1 E 16.0 E 31.9 B 19.1 D 31.4 B 20.9 D
Mitchell Hammock Rd. to Clark St. 0.75 31.6 B 28.7 B 34.0 B 30.9 B 33.6 B 33.5 B 33.5 B 34.3 B 34.4 B 33.8 B
Clark St. to SR 426/CR 419 0.25 13.5 E 21.3 D 11.0 F 20.0 D 8.3 F 19.1 D 8.5 F 18.4 D 12.4 F 20.0 D 8.3 F 17.5 D 6.0 F 17.4 D 10.9 F 20.7 D 8.5 F 21.2 D 8.5 F 19.1 D
SR 426/CR 419 to Magnolia St. 0.47 27.3 C 18.6 D 18.0 D 22.8 C 22.0 C 22.6 C 21.3 D 23.0 C 19.6 D 25.7 C
Magnolia St. to De Leon St. 0.93 40.3 A 34.7 B 30.7 B 25.2 C 37.9 A 27.4 C 38.7 A 31.2 B 38.8 A 30.8 B 37.7 A 30.0 B 39.0 A 30.2 B 39.0 A 31.3 B 40.7 A 29.7 B 36.9 A 32.1 B
De Leon St. to Palm Dr. 0.81 41.1 B 31.3 C 39.1 B 41.3 B 41.7 B 40.3 B 40.7 B 33.7 C 37.3 B 38.7 B
Palm Dr. to SR 417 (N. Ramps) 0.23 22.5 D 31.0 C 19.0 E 18.7 E 23.7 D 27.9 C 30.8 C 18.2 E 14.5 F 23.2 D
SR 417 (N. Ramps) to SR 417 (S. Ramps) 0.11 32.5 C 34.7 B 23.5 D 30.2 C 37.1 B 32.5 C 30.4 C 32.9 C 19.7 E 33.2 C 28.8 C 36.4 B 24.8 D 36.2 B 36.0 B 29.5 C 20.6 E 27.1 C 34.7 B 34.0 C
SR 417 (S. Ramps) to Vistawilla Dr. 0.31 45.5 A 26.7 D 36.3 B 35.1 B 42.8 A 39.2 B 42.7 A 44.6 A 48.0 A 44.6 A
Vistawilla Dr. to Spring Ave. 0.21 50.0 A 33.7 C 42.9 A 48.1 A 39.3 B 48.0 A 46.2 A 46.2 A 50.0 A 42.9 A
Spring Ave. to Tuskawilla Rd. 1.76 35.1 B 37.3 B 46.0 A 40.6 B 42.0 B 41.2 B 39.7 B 39.7 B 41.9 B 41.7 B 43.3 A 43.0 A 42.2 A 42.6 A 35.6 B 37.5 B 37.0 B 39.2 B 44.3 A 44.2 A
Tuskawilla Rd. to Doran Rd. 0.30 22.9 D 30.5 C 28.3 C 43.1 A 28.0 C 17.1 E 31.8 C 39.5 B
Doran Rd. to Central Winds Park 0.42 48.8 A 26.5 D 40.1 B 43.0 A 39.4 B 35.0 B 34.1 B 33.2 C
Central Winds Park to Winding Hollow Blvd. 0.74 33.2 C 41.8 B 39.8 B 43.1 A 45.9 A 30.4 C 34.6 B 41.1 B 38.2 B 34.3 B
Winding Hollow Blvd. to Consolidated/Orange Ave. 0.46 34.3 B 34.4 B 39.2 B 40.5 B 37.2 B 43.3 A 41.9 B 38.3 B 33.7 C 36.5 B
Consolidated/Orange Ave. to SR 419 0.18 21.8 D 34.2 B 34.8 B 35.8 B 18.7 E 34.4 B 27.1 C 34.5 B 12.7 F 33.3 C 34.8 B 36.8 B 21.6 D 33.8 C 34.8 B 32.6 C 21.6 D 33.3 C 10.1 F 28.9 C
SR 419 to Hayes Rd. 0.30 38.1 A 38.6 A 37.8 A 37.9 A 40.3 A 38.0 A 44.3 A 43.3 A 35.3 A 35.3 A
Hayes Rd. to Moss Rd. 0.63 43.0 A 41.2 A 41.2 A 40.3 A 40.6 A 39.6 A 37.5 A 37.7 A 41.5 A 41.1 A 40.6 A 39.7 A 43.4 A 43.7 A 43.0 A 43.1 A 32.3 B 33.3 B 37.6 A 36.8 A
Moss Rd. to Edgemon Ave. 0.25 24.9 C 37.5 A 27.8 C 31.7 B 33.3 B 34.9 B 41.7 A 27.3 C 38.5 A 40.5 A
Edgemon Ave. to Sheoah Blvd. 0.24 10.8 F 13.5 E 19.1 D 29.4 B 34.7 B 21.4 D 27.4 C 16.8 E 35.4 A 29.4 B
Sheoah Blvd. to Timberlane Tr. 0.37 31.4 B 25.8 C 28.0 B 28.9 B 34.0 B 32.7 B 43.6 A 28.8 B 33.7 B 30.7 B
Timberlane Tr. to Sun Shadow Dr. 0.13 14.8 E 14.7 E 17.6 D 29.7 B 23.4 C 29.5 B 41.4 A 29.0 B 19.1 D 22.5 C
Sun shadow Dr. to US 17/92 0.34 15.5 E 18.0 D 11.1 F 17.1 D 10.5 F 17.9 D 20.2 D 26.6 C 17.5 D 25.9 C 9.9 F 19.6 D 10.2 F 22.5 C 12.8 F 20.1 D 16.5 E 24.1 C 15.1 E 23.6 C
US 17/92 to S. Wayman St. 0.42 37.2 A 29.4 B 29.3 B 35.0 A 34.1 B 36.7 A 40.3 A 39.0 A 39.7 A 37.3 A
S. Wayman St. to Grant St. 0.26 33.0 B 22.1 C 25.3 C 23.3 C 27.8 C 32.7 B 30.6 B 38.9 A 33.9 B 43.3 A
Grant St. to CR 427/Ronald Reagan Blvd. 0.51 17.1 D 24.5 C 20.8 D 23.6 C 21.3 D 24.6 C 23.2 C 26.5 C 19.3 D 24.9 C 28.0 C 30.9 B 27.5 C 31.8 B 33.7 B 36.5 A 28.6 B 33.0 B 23.8 C 30.8 B
CR 427/Ronald Reagan Blvd. to Florida Central Pkwy. 0.39 36.8 A 24.6 C 18.7 D 22.8 C 29.3 B 32.4 B 35.8 A 37.5 A 29.6 B 36.9 A
Florida Central Pkwy. to Rangeline Rd. 0.56 35.2 A 34.7 B 24.5 C 28.8 B 25.4 C 34.3 B 26.2 C 36.9 A 31.1 B 33.2 B
Rangeline Rd. to Palm Springs Dr.* 0.58 31.7 B 34.2 B 23.9 C 27.2 C 26.0 C 23.2 C 29.4 B 27.1 C 27.8 C 27.2 C 32.5 B 33.1 B 39.5 A 32.6 B 40.5 A 38.3 A 39.1 A 33.2 B 29.5 B 32.5 B
Palm Springs Dr. to Tollgate Tr.* 0.18 28.0 B 31.4 B 30.7 B 23.2 C 26.2 C 39.2 A 42.5 A 40.8 A 42.5 A 24.9 C
Tollgate Tr. to Tarrytown Tr./Roxboro Rd.* 0.34 33.1 B 40.0 A 40.0 A 40.7 A 42.1 A 40.0 A 42.5 A 40.8 A 42.9 A 41.2 A
Tarrytown Tr./Roxboro Rd. to Raymond Ave.* 0.49 14.4 E 20.0 D 13.5 E 21.4 D 26.8 C 29.0 B 22.0 C 27.6 C 26.8 C 29.6 B 22.9 C 30.4 B 28.2 B 34.1 B 11.9 F 18.7 D 14.8 E 22.3 C 19.2 D 24.7 C
Raymond Ave. to I-4 (E. Ramps)* 0.13 6.2 F 6.2 F 9.7 F 9.7 F 11.1 F 11.1 F 9.9 F 9.9 F 9.2 F 9.2 F 7.4 F 7.4 F 13.8 E 13.8 E 9.1 F 9.1 F 8.8 F 8.8 F 7.9 F 7.9 F
I-4 (E. Ramps) to I-4 (W. Ramps)* 0.06 8.3 F 20.3 D 11.6 F 10.3 F 24.6 C 12.0 F 16.2 E 28.0 C 32.0 B 34.3 B
I-4 (W. Ramps) to Douglas Ave. 0.14 7.5 F 7.7 F 6.5 F 8.4 F 6.9 F 7.8 F 5.0 F 5.9 F 14.1 E 16.2 E 9.7 F 10.2 F 10.3 F 11.4 F 39.3 A 35.5 A 17.8 D 20.5 D 22.8 C 25.3 C
Douglas Ave. to Markham Woods Rd. 0.05
Markham Woods Rd. to Springs Center Blvd. 0.24 31.3 B 32.0 B 28.3 B 36.2 A 24.2 C 40.0 A 34.3 B 40.0 A 36.0 A 43.4 A
Springs Center Blvd. to Gum St./The Springs 0.35 28.6 B 24.7 C 28.8 B 33.5 B 29.3 B 33.9 B 26.3 C 26.3 C 22.3 C 30.0 B
Gum St./The Springs to Montgomery Rd./Wekiva Springs Rd. 0.12 9.8 F 22.8 C 7.8 F 20.0 D 10.3 F 22.7 C 7.5 F 22.1 C 11.3 F 22.3 C 9.2 F 24.6 C 8.8 F 21.1 D 22.8 C 28.4 B 15.0 E 23.2 C 33.0 B 33.5 B
Montgomery Rd./Wekiva Springs Rd. to Wekiva Springs Ln. 0.22 37.6 A 35.4 A 39.0 A 37.8 A 42.3 A 36.9 A 41.1 A 40.0 A 40.0 A 15.5 E
Wekiva Springs Ln. to E. Lake Brantley Rd. 0.44 24.1 C 26.2 C 39.6 A 29.8 B 35.8 A 38.8 A 31.1 B 29.3 B 41.6 A 31.5 B
E. Lake Brantley Rd. to Jamestown Blvd. 0.49 27.9 C 15.3 E 27.1 C 32.2 B 34.0 B 28.5 B 37.4 A 24.2 C 22.9 C 26.4 C
Jamestown Blvd. to Sand Lake Rd. 0.19 11.1 F 22.9 C 10.6 F 18.4 D 10.3 F 25.2 C 10.8 F 25.1 C 17.3 D 31.3 B 14.8 E 28.4 B 10.8 F 26.7 C 8.3 F 21.2 D 9.8 F 23.6 C 14.8 E 22.3 C
Sand Lake Rd. to San Sebastian Prado 0.55 34.9 B 32.6 B 40.0 A 27.7 C 35.5 A 39.3 A 32.0 B 37.5 A 40.7 A 40.7 A
San Sebastian Prado to SR 436 0.47 14.3 E 21.3 D 11.8 F 18.3 D 15.9 E 23.9 C 16.3 E 21.1 D 14.4 E 21.4 D 29.7 B 34.3 B 18.6 D 24.2 C 12.8 F 20.1 D 12.1 F 19.6 D 11.0 F 18.2 D
SR 436 to Orange Ave. 0.24 19.5 D 28.1 B 22.0 D 30.5 B 39.5 A 38.9 A 38.9 A 38.9 A 37.9 A 25.7 C
Orange Ave. to W. Town Pkwy. 0.25 19.2 D 19.3 D 25.5 C 26.8 C 26.6 C 24.1 C 35.9 A 32.9 B 44.4 A 41.7 A 42.2 A 40.5 A 40.0 A 39.5 A 37.1 A 38.0 A 29.4 B 33.0 B 30.0 B 27.7 C
W. Town Pkwy. to Trailwood Dr./Lotus Landing Blvd. 0.56 43.7 A 35.8 A 42.1 A 23.4 C 37.4 A 30.9 B 41.3 A 41.8 A 42.9 A 43.4 A
Trailwood Dr./Lotus Landing Blvd. to Gateway Dr. 0.42 26.3 C 29.0 B 23.0 C 27.4 C 32.8 B 25.3 C 46.8 A 37.8 A 40.0 A 41.2 A
Gateway Dr. to Maitland Blvd. 0.26 22.6 C 20.2 D 23.4 C 32.3 B 32.1 B 24.9 C 27.3 C 45.0 A 44.0 A 45.0 A 40.9 A 43.1 A 41.9 A 43.1 A 42.6 A
Maitland Blvd. to Orange County Line 0.05 34.5 B 30.8 B 35.4 A 29.1 B 28.3 B 28.9 B 38.9 A 26.6 C 38.3 A 34.6 B - - - - - - - - - - - - - - - - - - - -
Average 26.6 C 25.6 C 26.9 C 27.3 C 29.0 B 28.8 B 29.5 B 28.7 B 28.7 B 28.8 B
Note: *From 2012, construction in progress on SR 434 from I-4 to Rangeline Rd (Financial Project ID: 240233-3-52-01) which may have skewed the LOS for the segments.
Average Speed Average SpeedAverage Speed Average Speed Average Speed Average Speed Average Speed
Rdwy Section Rdwy Segment Rdwy Section
Average Speed Average SpeedAverage Speed Average Speed Average Speed Average Speed Average Speed Average Speed Average Speed Average Speed Average Speed Average Speed Average Speed
TABLE S3.2aYear 2014 Seminole County Travel Time & Delay Study
SR 434 (Parts A, B, & C) - Westbound Direction Historical Summary
Year 2005 Year 2006 Year 2007 Year 2008 Year 2009 Year 2010 Year 2011 Year 2012
C-8 SR 434 - WB - AM
Roadway
Segments Distance
(mile) (mph) LOS (mph) LOS (mph) LOS (mph) LOS (mph) LOS (mph) LOS (mph) LOS (mph) LOS (mph) LOS (mph) LOS (mph) LOS (mph) LOS (mph) LOS (mph) LOS (mph) LOS (mph) LOS (mph) LOS (mph) LOS (mph) LOS (mph) LOS
PM PEAK HOUR
Orange County Line to McCullouch Rd. 0.04 1.6 F 1.6 F 18.1 D 18.1 D 14.5 E 14.5 E 16.5 E 16.5 E 17.8 D 17.8 D - - - - - - - - - - - - - - - - - - - -
McCulloch Rd to E. Palm Valley Dr. 0.27 34.1 B 36.8 A 33.1 B 21.6 D 32.0 B 23.6 C 39.0 A 22.3 C 31.8 B 36.3 A
E. Palm Valley Dr. to Econ River Pl. 0.59 50.2 A 48.5 A 50.9 A 49.6 A 47.6 A 49.0 A 47.7 A 49.7 A 45.8 A 48.3 A
Econ River Pl. to Carrigan Ave. 0.16 37.7 A 35.4 A 25.3 C 18.9 D 26.4 C 32.9 B 19.2 D 24.9 C 48.0 A 30.0 B
Carrigan Ave. to Stillwater Dr. 0.40 48.9 A 48.8 A 47.8 A 45.9 A 48.4 A 50.9 A 45.9 A 46.8 A 49.0 A 48.0 A
Stillwater Dr. to Chapman Rd. 0.61 34.2 B 26.9 C 27.4 C 28.7 B 23.6 C 32.9 B 35.8 A 33.2 B 30.0 B 27.5 C
Chapman Rd. to Alafaya Woods Blvd. 0.58 29.7 B 37.6 A 32.9 B 36.1 A 32.8 B 35.2 A 34.4 B 32.8 B 33.1 B 33.3 B 35.3 A 36.6 A 39.3 A 38.1 A 45.0 A 37.1 A 38.4 A 38.2 A 39.8 A 37.2 A
Alafaya Woods Blvd. to Mitchell Hammock Rd. 0.43 10.8 F 12.7 F 12.5 F 13.2 E 11.9 F 12.2 F 15.4 E 18.0 D 11.8 F 10.3 F
Mitchell Hammock Rd. to Clark St. 0.75 29.3 B 28.8 B 32.8 B 31.5 B 20.9 D 26.7 C 30.8 B 29.0 B 33.3 B 29.0 B
Clark St. to SR 426/CR 419 0.25 10.4 F 16.1 E 10.0 F 16.7 E 7.1 F 15.3 E 6.8 F 15.2 E 10.4 F 14.8 E 6.4 F 13.6 E 5.9 F 14.6 E 7.1 F 16.3 E 7.2 F 14.8 E 6.9 F 13.3 E
SR 426/CR 419 to Magnolia St. 0.47 28.2 B 21.0 D 26.9 C 26.9 C 26.0 C 26.7 C 27.5 C 27.0 C 25.0 C 25.9 C
Magnolia St. to De Leon St. 0.93 38.6 A 34.3 B 38.4 A 29.9 B 43.5 A 35.8 A 41.1 A 34.8 B 41.6 A 34.5 B 40.7 A 33.9 B 38.7 A 33.9 B 38.4 A 33.5 B 40.4 A 33.4 B 40.4 A 33.9 B
De Leon St. to Palm Dr. 0.81 42.7 A 42.3 A 46.2 A 43.4 A 44.5 A 42.7 A 40.3 B 41.7 B 43.5 A 38.7 B
Palm Dr. to SR 417 (N. Ramps) 0.23 23.3 D 27.5 C 38.1 B 28.0 C 23.9 D 30.8 C 25.5 D 19.4 E 17.8 E 20.6 E
SR 417 (N. Ramps) to SR 417 (S. Ramps) 0.11 32.0 C 35.8 B 20.2 E 34.8 B 47.0 A 44.5 A 29.6 C 37.7 B 31.1 C 36.6 B 19.5 E 36.4 B 21.8 D 33.9 C 37.9 B 34.4 B 25.4 D 32.4 C 16.9 E 30.0 C
SR 417 (S. Ramps) to Vistawilla Dr. 0.31 35.8 B 46.0 A 36.0 B 30.4 C 33.1 C 38.4 B 31.5 C 45.7 A 44.6 A 41.7 B
Vistawilla Dr. to Spring Ave. 0.21 46.9 A 52.0 A 48.6 A 41.7 B 41.5 B 48.0 A 46.2 A 48.0 A 48.0 A 48.0 A
Spring Ave. to Tuskawilla Rd. 1.76 41.1 B 40.7 B 34.9 B 37.3 B 40.0 B 40.1 B 45.9 A 42.5 A 46.6 A 43.6 A 40.6 B 40.8 B 39.5 B 38.5 B 37.7 B 39.5 B 37.4 B 39.1 B 35.8 B 37.5 B
Tuskawilla Rd. to Doran Rd. 0.30 29.6 C 32.3 C 27.4 C 36.5 B 25.5 D 28.0 C 36.8 B 27.9 C
Doran Rd. to Central Winds Park 0.42 40.0 B 37.2 B 31.1 C 39.3 B 31.1 C 27.4 C 36.5 B 27.7 C
Central Winds Park to Winding Hollow Blvd. 0.74 41.1 B 35.8 B 49.3 A 36.5 B 41.2 B 39.3 B 40.8 B 46.0 A 43.2 A 41.1 B
Winding Hollow Blvd. to Consolidated/Orange Ave. 0.46 40.9 B 36.5 B 43.1 A 35.4 B 32.7 C 35.7 B 44.0 A 35.2 B 39.7 B 44.3 A
Consolidated/Orange Ave. to SR 419 0.18 18.6 E 35.7 B 20.2 E 33.7 C 16.2 E 36.7 B 14.1 F 31.7 C 36.2 B 34.2 B 10.2 F 30.5 C 12.0 F 30.4 C 16.1 E 31.5 C 14.4 F 34.4 B 15.4 F 31.8 C
SR 419 to Hayes Rd. 0.30 39.8 A 29.7 B 22.9 C 40.6 A 36.7 A 29.1 B 24.2 C 33.8 B 34.0 B 33.3 B
Hayes Rd. to Moss Rd. 0.63 37.3 A 38.1 A 42.3 A 37.2 A 28.3 B 26.3 C 26.5 C 30.0 B 41.5 A 39.8 A 37.1 A 34.0 B 37.1 A 31.5 B 37.8 A 36.4 A 28.6 B 30.2 B 36.8 A 35.6 A
Moss Rd. to Edgemon Ave. 0.25 37.2 A 20.0 D 35.3 A 32.6 B 24.9 C 34.9 B 35.7 A 34.9 B 28.3 B 27.3 C
Edgemon Ave. to Sheoah Blvd. 0.24 26.6 C 26.2 C 25.3 C 41.5 A 36.5 A 35.0 B 31.5 B 25.7 C 30.7 B 38.3 A
Sheoah Blvd. to Timberlane Tr. 0.37 26.1 C 27.7 C 37.3 A 38.5 A 42.5 A 16.0 E 36.9 A 42.4 A 23.8 C 30.7 B
Timberlane Tr. to Sun Shadow Dr. 0.13 31.5 B 16.9 E 27.5 C 33.4 B 26.0 C 29.0 B 22.0 C 25.2 C 14.5 E 27.9 C
Sun shadow Dr. to US 17/92 0.34 17.6 D 25.0 C 16.7 E 21.1 D 27.0 C 30.5 B 14.3 E 26.2 C 17.5 D 26.0 C 13.6 E 21.1 D 14.6 E 23.6 C 13.1 E 22.9 C 18.1 D 20.8 D 15.8 E 24.5 C
US 17/92 to S. Wayman St. 0.42 35.5 A 37.6 A 36.2 A 28.4 B 36.3 A 35.7 A 41.0 A 37.3 A 30.4 B 27.3 C
S. Wayman St. to Grant St. 0.26 34.1 B 25.7 C 23.7 C 29.8 B 26.6 C 26.7 C 40.0 A 38.9 A 18.4 D 38.0 A
Grant St. to CR 427/Ronald Reagan Blvd. 0.51 17.2 D 24.5 C 19.0 D 24.9 C 26.9 C 28.7 B 17.8 D 22.9 C 14.2 E 21.0 D 19.5 D 23.7 C 10.2 F 17.7 D 17.1 D 24.8 C 26.5 C 25.2 C 13.6 E 20.0 D
CR 427/Ronald Reagan Blvd. to Florida Central Pkwy. 0.39 31.4 B 21.3 D 19.9 D 16.1 E 22.0 C 42.1 A 27.3 C 32.4 B 23.5 C 29.6 B
Florida Central Pkwy. to Rangeline Rd. 0.56 21.8 D 17.4 D 15.9 E 16.6 E 14.6 E 15.0 E 35.0 B 21.5 D 16.0 E 19.1 D
Rangeline Rd. to Palm Springs Dr.* 0.58 29.2 B 26.4 C 28.6 B 21.6 D 26.8 C 20.0 D 24.5 C 18.7 D 24.3 C 19.2 D 23.2 C 21.4 D 36.2 A 33.0 B 34.1 B 27.8 C 20.6 D 19.2 D 31.1 B 25.0 C
Palm Springs Dr. to Tollgate Tr.* 0.18 27.1 C 33.8 B 37.1 A 24.4 C 24.7 C 35.2 A 23.7 C 27.6 C 17.0 E 22.2 C
Tollgate Tr. to Tarrytown Tr./Roxboro Rd.* 0.34 39.9 A 39.7 A 37.8 A 39.1 A 38.0 A 41.6 A 37.8 A 35.8 A 15.6 E 19.6 D
Tarrytown Tr./Roxboro Rd. to Raymond Ave.* 0.49 7.6 F 12.9 F 12.0 F 21.4 D 14.9 E 23.5 C 15.0 E 21.0 D 18.4 D 24.0 C 16.9 E 23.7 C 19.3 D 24.1 C 13.8 E 19.6 D 7.5 F 10.3 F 7.3 F 10.9 F
Raymond Ave. to I-4 (E. Ramps)* 0.13 4.6 F 4.6 F 7.1 F 7.1 F 7.9 F 7.9 F 10.2 F 10.2 F 7.3 F 7.3 F 5.8 F 5.8 F 8.2 F 8.2 F 11.8 F 11.8 F 12.0 F 12.0 F 5.7 F 5.7 F
I-4 (E. Ramps) to I-4 (W. Ramps)* 0.06 18.1 D 18.4 D 25.1 C 9.6 F 23.0 C 11.1 F 28.0 C 26.2 C 28.2 B 28.2 B
I-4 (W. Ramps) to Douglas Ave. 0.14 6.7 F 8.3 F 6.6 F 8.1 F 5.7 F 7.4 F 7.3 F 7.8 F 14.3 E 16.1 E 6.5 F 7.3 F 12.4 F 14.6 E 27.1 C 26.9 C 30.0 B 29.5 B 24.3 C 25.3 C
Douglas Ave. to Markham Woods Rd. 0.05
Markham Woods Rd. to Springs Center Blvd. 0.24 24.4 C 24.3 C 19.6 D 26.0 C 20.3 D 32.4 B 38.7 A 36.4 A 40.6 A 42.0 A
Springs Center Blvd. to Gum St./The Springs 0.35 29.2 B 24.6 C 27.6 C 30.3 B 33.9 B 24.9 C 20.7 D 22.1 C 29.2 B 32.1 B
Gum St./The Springs to Montgomery Rd./Wekiva Springs Rd. 0.12 13.1 E 23.3 C 21.2 D 23.9 C 19.7 D 22.8 C 11.1 F 22.9 C 16.5 E 24.3 C 12.2 F 22.7 C 7.1 F 17.7 D 16.1 E 23.3 C 14.3 E 27.1 C 15.0 E 29.0 B
Montgomery Rd./Wekiva Springs Rd. to Wekiva Springs Ln. 0.22 32.7 B 35.1 A 40.6 A 33.9 B 43.5 A 32.7 B 30.6 B 38.9 A 36.9 A 43.6 A
Wekiva Springs Ln. to E. Lake Brantley Rd. 0.44 18.8 D 18.8 D 19.6 D 27.5 C 16.9 E 25.4 C 26.9 C 33.8 B 38.5 A 43.0 A
E. Lake Brantley Rd. to Jamestown Blvd. 0.49 25.5 C 24.9 C 31.4 B 23.2 C 24.8 C 25.9 C 26.9 C 32.7 B 40.0 A 36.0 A
Jamestown Blvd. to Sand Lake Rd. 0.19 22.3 C 23.2 C 22.4 C 23.3 C 29.4 B 27.0 C 25.5 C 26.3 C 15.2 E 21.3 D 15.4 E 24.3 C 24.3 C 27.1 C 22.4 C 31.9 B 21.1 D 34.7 B 19.7 D 34.8 B
Sand Lake Rd. to San Sebastian Prado 0.55 36.9 A 36.2 A 41.4 A 35.9 A 38.7 A 39.3 A 35.5 A 37.5 A 34.4 B 39.3 A
San Sebastian Prado to SR 436 0.47 14.6 E 21.9 D 10.2 F 16.9 E 21.9 D 29.7 B 11.9 F 18.9 D 28.9 B 33.6 B 13.8 E 21.4 D 14.1 E 21.1 D 12.9 F 20.2 D 11.0 F 17.5 D 10.9 F 18.0 D
SR 436 to Orange Ave. 0.24 35.4 A 29.6 B 36.8 A 30.0 B 36.3 A 35.1 A 35.1 A 37.9 A 16.9 E 38.9 A
Orange Ave. to W. Town Pkwy. 0.25 22.8 C 27.8 C 36.9 A 32.7 B 20.8 D 26.6 C 14.7 E 19.9 D 44.3 A 39.9 A 30.6 B 32.6 B 27.9 C 30.9 B 44.6 A 41.1 A 16.9 E 16.9 E 16.9 E 23.3 C
W. Town Pkwy. to Trailwood Dr./Lotus Landing Blvd. 0.56 36.0 A 29.1 B 40.1 A 40.2 A 40.1 A 46.8 A 38.8 A 38.3 A 41.8 A 43.4 A
Trailwood Dr./Lotus Landing Blvd. to Gateway Dr. 0.42 27.5 C 30.2 B 28.4 B 26.6 C 29.7 B 23.6 C 45.2 A 39.4 A 35.7 A 37.7 A
Gateway Dr. to Maitland Blvd. 0.26 23.5 C 19.4 D 20.6 D 21.5 D 25.7 C 20.0 D 28.4 B 16.4 E 31.2 B 24.5 C 34.5 B 27.5 C 35.6 A 41.0 A 40.7 A
Maitland Blvd. to Orange County Line 0.05 34.0 B 29.6 B 42.4 A 26.9 C 16.9 E 28.9 B 37.7 A 29.8 B 43.0 A 32.7 B - - - - - - - - - - - - - - - - - - - -
Average 25.1 C 25.2 C 27.0 C 25.3 C 26.5 C 25.1 C 26.3 C 28.2 B 24.8 C 25.0 C
Note: *From 2012, construction in progress on SR 434 from I-4 to Rangeline Rd (Financial Project ID: 240233-3-52-01) which may have skewed the LOS for the segments.
Average SpeedAverage Speed Average Speed Average Speed Average Speed Average SpeedAverage Speed Average Speed Average Speed Average Speed Average Speed Average Speed Average Speed
Average Speed Average Speed Average Speed Average Speed Average Speed
C-9 SR 434 - WB - PM
Roadway
Segments Distance
(mile) (mph) LOS (mph) LOS (mph) LOS (mph) LOS (mph) LOS (mph) LOS (mph) LOS (mph) LOS (mph) LOS (mph) LOS (mph) LOS (mph) LOS (mph) LOS (mph) LOS (mph) LOS (mph) LOS (mph) LOS (mph) LOS (mph) LOS (mph) LOS
AM PEAK HOUR
County Line to Line Dr. 0.02 36.9 A 19.4 D 39.8 A 15.5 E 28.4 B - - - - - - - - - - - - - - - - - - - -
Line Dr. to Balmy Beach Dr. 0.32 31.3 B 43.5 A 36.6 A 32.9 B 38.1 A 31.6 B 37.5 A 32.1 B 35.5 A 29.5 B
Balmy Beach Dr. to Hunt Club Blvd. 0.34 16.0 E 21.1 D 28.8 B 32.7 B 24.7 C 29.4 B 29.7 B 29.7 B 38.0 A 37.6 A 43.4 A 36.9 A 26.2 C 30.5 B 37.1 A 34.6 B 29.1 B 31.8 B 25.8 C 27.4 C
Hunt Club Blvd. to Bear Lake Rd. 0.38 23.5 C 23.5 C 29.7 B 29.7 B 33.1 B 33.1 B 42.0 A 42.0 A 38.5 A 38.5 A 33.0 B 33.0 B 28.5 B 28.5 B 27.8 C 27.8 C 35.6 A 35.6 A 35.6 A 35.6 A
Bear Lake Rd. to Harley Lester Ln.* 43.2 A 40.8 A 46.4 A 48.6 A 42.0 A 42.0 A
Harley Lester Ln. to Post Lake Pl.** 44.7 A 45.8 A 38.7 A 39.5 A 41.7 A 44.6 A
Post Lake Pl. to W. Lake Brantley Rd. 0.34 44.2 A 45.0 A 33.0 B 43.4 A 43.6 A 44.3 A 39.2 A 41.6 A 41.6 A 42.5 A
W. Lake Brantley Rd. to Pearl Lake Causeway 0.25 39.2 A 42.9 A 44.1 A 41.9 A 36.4 A 40.0 A 20.0 D 25.6 C 39.5 A 38.5 A
Pearl Lake Causeway to Lake Harriet Dr. 0.22 34.9 B 34.4 B 45.1 A 45.9 A 41.2 A 41.2 A 38.8 A 37.7 A 38.8 A 40.0 A
Lake Harriet Dr. to SR 434 0.28 16.0 E 32.3 B 10.2 F 26.8 C 18.2 D 33.5 B 20.5 D 37.1 A 29.1 B 38.6 A 28.5 B 39.2 A 12.2 F 25.4 C 20.2 D 31.9 B 20.0 D 34.3 B 18.1 D 33.7 B
SR 434 to San Sebastian Prado 0.27 22.9 C 36.1 A 42.7 A 44.9 A 43.6 A 44.2 A 40.0 A 30.0 B 43.1 A 39.1 A
San Sebastian Prado to Weathersfield Ave. 0.53 35.0 A 37.4 A 36.4 A 34.9 B 27.8 C 29.7 B 29.5 B 32.7 B 27.2 C 25.5 C
Weathersfield Ave. to Montgomery Rd. 0.24 9.9 F 12.8 F 13.6 E 17.3 D 20.3 D 28.2 B 30.0 B 32.6 B 32.0 B 32.3 B 30.6 B 31.5 B 24.2 C 29.3 B 24.2 C 27.8 C
Montgomery Rd.to Lynchfield Ave. 0.22 17.6 D 20.2 D 21.6 D 25.3 C 15.8 E 24.3 C 22.4 C 28.4 B 29.1 B 27.5 C 34.7 B 34.7 B 19.4 D 34.5 B
Lynchfield Ave. to Grace Blvd. 0.12 13.0 E 8.5 F 17.0 D 32.0 B 13.3 E 32.5 B 39.0 A 35.5 A 30.0 B 25.7 C
Grace Blvd. to Westmonte Dr. 0.20 7.1 F 5.2 F 8.8 F 17.4 D 7.6 F 21.4 D 24.7 C 11.7 F 15.8 E 12.0 F
Westmonte Dr. to Wymore Rd./Douglas Ave. 0.20 5.4 F 7.0 F 12.1 F 7.5 F 6.3 F 8.4 F 11.4 F 15.9 E 11.4 F 12.3 F 10.9 F 18.9 D 16.7 E 25.2 C 19.4 D 19.8 D 12.6 F 16.9 E 10.8 F 16.1 E
Wymore Rd./Douglas Ave. to I-4 (W. Ramps) 0.07 28.1 B 31.1 B 33.3 B 28.9 B 30.5 B 15.0 E 35.0 B 35.0 B 22.5 C 21.2 D
I-4 (W. Ramps) to I-4 (E. Ramps) 0.09 34.2 B 31.1 B 37.3 A 34.0 B 41.1 A 36.9 A 37.2 A 32.7 B 22.4 C 25.5 C 35.0 B 21.0 D 30.0 B 32.3 B 30.0 B 32.3 B 36.0 A 29.0 B 36.0 A 28.1 B
I-4 (E. Ramps) to North Lake Blvd. 0.22 14.5 E 14.5 E 19.2 D 19.2 D 24.2 C 24.2 C 28.3 B 28.3 B 23.4 C 23.4 C 32.1 B 32.1 B 23.8 C 23.8 C 31.4 B 31.4 B 19.1 D 19.1 D 26.9 C 26.9 C
North Lake Blvd. to Hattaway Dr. 0.12 14.8 E 18.7 D 29.2 B 21.1 D 20.0 D 38.2 A 24.0 C 19.5 D 35.5 A 23.6 C
Hattaway Dr. to Renaissance Dr. 0.15 23.2 C 37.8 A 41.0 A 39.3 A 41.7 A 43.3 A 39.0 A 35.5 A 39.0 A 39.0 A
Renaissance Dr. to Essex St. 0.12 29.1 B 35.9 A 45.7 A 23.1 C 35.5 A 44.2 A 42.0 A 42.0 A 37.1 A 22.9 C
Essex St. to Mall Entrance 0.12 33.3 B 37.6 A 41.0 A 32.0 B 27.6 C 41.2 A 26.4 C 34.7 B 28.8 B 36.0 A
Mall Entrance to Palm Springs Dr. 0.12 19.0 D 21.9 D 32.7 B 31.0 B 35.8 A 37.5 A 26.0 C 27.2 C 24.7 C 28.2 B 30.0 B 38.4 A 22.7 C 28.9 B 36.5 A 31.2 B 36.0 A 35.0 B 7.8 F 19.0 D
Palm Springs Dr. to Boston Ave. 0.18 31.5 B 25.0 C 26.3 C 38.7 A 23.4 C 40.7 A 39.3 A 40.7 A 18.9 D 20.8 D
Boston Ave. to CR 427/Maitland Ave. 0.34 17.6 D 20.8 D 14.8 E 17.2 D 17.2 D 19.6 D 27.2 C 30.4 B 26.3 C 25.2 C 33.1 B 35.6 A 21.1 D 25.5 C 40.8 A 40.8 A 38.4 A 28.0 B 29.5 B 25.6 C
CR 427/Maitland Ave. to CR 427/Ronald Reagan Blvd. 0.47 23.6 C 23.6 C 31.6 B 31.6 B 23.1 C 23.1 C 36.1 A 36.1 A 35.9 A 35.9 A 35.7 A 35.7 A 27.9 C 27.9 C 26.1 C 26.1 C 22.6 C 22.6 C 26.5 C 26.5 C
CR 427/Ronald Reagan Blvd. to Prarie Lake Dr. 0.29 36.4 A 40.9 A 30.1 B 37.0 A 39.2 A 40.0 A 36.7 A 34.6 B 34.1 B 36.2 A
Prarie Lake Dr. to Anchor Rd. 0.45 37.7 A 41.3 A 42.6 A 35.4 A 38.6 A 39.7 A 34.0 B 38.6 A 36.8 A 39.4 A
Anchor Rd. to US 17/92 0.32 11.6 F 22.9 C 11.5 F 23.9 C 14.7 E 25.8 C 9.8 F 20.6 D 9.1 F 20.3 D 8.7 F 19.7 D 5.7 F 14.1 E 7.0 F 16.6 E 12.2 F 23.0 C 7.5 F 17.6 D
US 17/92 to Plaza Entrance 0.15 22.5 C 33.6 B 32.7 B 33.1 B 35.4 A 35.3 A 35.3 A 41.4 A 35.2 A 34.0 B
Plaza Entrance to Oxford Rd. 0.10 32.5 B 38.0 A 17.3 D 38.5 A 11.8 F 9.0 F 21.2 D 8.0 F 40.0 A 37.5 A
Oxford Rd. to Fern Park Blvd. 0.22 42.3 A 45.6 A 44.1 A 43.2 A 44.8 A 19.7 D 35.7 A 41.2 A 31.4 B 30.0 B
Fern Park Blvd. to Wilshire Blvd. 0.54 24.0 C 33.4 B 30.0 B 33.7 B 43.7 A 28.9 B 40.5 A 45.6 A 32.1 B 34.1 B
Wilshire Blvd. to Kewanee Tr.** 0.26 37.4 A 41.0 A 27.4 C 22.8 C 44.1 A 37.1 A 22.0 D 17.7 D 14.3 E 22.0 D
Kewanee Tr. to Red Bug Lake Rd.** 0.19 21.9 D 27.4 C 24.5 C 34.5 B 37.1 A 30.5 B 21.9 D 30.2 B 17.1 D 31.2 B 25.9 C 26.0 C 10.7 F 25.5 C 21.9 D 27.8 C 19.0 D 25.0 C 13.1 E 25.9 C
Red Bug Lake Rd. to Sausalito Blvd.** 0.17 24.6 C 47.7 A 43.7 A 43.2 A 45.7 A 42.2 A 30.0 B 38.0 A 31.8 B 33.7 B
Sausalito Blvd. to Lake Howell Rd.** 0.34 33.6 C 30.0 C 45.4 A 46.1 A 40.4 B 41.4 B 42.9 A 43.0 A 47.4 A 46.8 A 45.0 A 43.9 A 36.0 B 33.4 C 29.5 C 32.3 C 35.6 B 34.2 B 29.6 C 30.9 C
Lake Howell Rd. to Lake Howell Square 0.25 42.9 A 42.4 A 34.0 C 33.0 C 32.6 C 35.3 B 54.5 A 30.5 C 28.3 C 16.7 E
Lake Howell Square to Lake Howell Ln. 0.25 44.5 A 48.1 A 44.0 A 44.2 A 46.5 A 43.3 A 27.4 C 28.4 C 39.0 B 25.6 D
Lake Howell Ln. to Howell Branch Rd. 0.54 15.0 F 22.2 D 14.4 F 21.5 D 20.4 E 26.4 D 22.6 D 28.1 C 19.4 E 25.6 D 19.2 E 25.8 D 22.5 D 28.2 C 32.4 C 30.8 C 28.9 C 30.7 C 18.1 E 19.1 E
Howell Branch Rd. to Winter Woods Blvd. 0.47 43.7 A 40.3 B 35.6 B 27.9 C 37.0 B 37.3 B 35.4 B 46.0 A 44.8 A 44.1 A
Winter Woods Blvd. to Castelton Blvd. 0.53 48.1 A 30.6 C 24.2 D 28.6 C 47.5 A 46.3 A 41.7 B 42.6 A 39.0 B 43.8 A 44.8 A 43.0 A 43.8 A 35.7 B 39.2 B
Castelton Blvd. to Orange County Line 0.08 28.8 C 44.2 A 35.8 B 34.7 B 16.0 F 26.9 D 40.2 B 28.9 C 42.4 A 41.9 B - - - - - - - - - - - - - - - - - - - -
Average 22.3 C 24.4 C 25.5 C 28.7 B 27.9 C 29.7 B 25.9 C 25.9 C 28.1 B 24.8 C
Note: * From 2009, additional control point has been considered on "Harley Lester Ln" the segment limits will be Bear Lake Rd. to Harley Lester Ln. and the segment length will be 0.14 Mile
Note: * From 2009, additional control point has been considered on "Harley Lester Ln" the segment limits will be Harley Lester Ln. to Post Lake Pl. and the segment length will be 0.32 Mile
Note: ** From 2012, construction in progress on SR 436 from Wilshire Blvd to Lake Howell Rd (Financial Project ID: 419369-1-52-01) which may have skewed the LOS for the segments.
Average Speed Average Speed Average Speed Average Speed Average SpeedAverage Speed Average Speed Average Speed Average Speed Average Speed Average Speed Average SpeedAverage Speed Average Speed Average Speed Average Speed Average SpeedAverage Speed Average Speed Average Speed
Year 2009 Year 2010 Year 2011 Year 2012 Year 2014Year 2005 Year 2006 Year 2007 Year 2008 Year 2013
A47.1A45.6A44.4
TABLE S4.1aYear 2014 Seminole County Travel Time & Delay Study
SR 436 (Parts A & B) - Eastbound Direction Historical Summary
0.46 A41.6
C-10 SR 436 - EB - AM
Roadway
Segments Distance
(mile) (mph) LOS (mph) LOS (mph) LOS (mph) LOS (mph) LOS (mph) LOS (mph) LOS (mph) LOS (mph) LOS (mph) LOS (mph) LOS (mph) LOS (mph) LOS (mph) LOS (mph) LOS (mph) LOS (mph) LOS (mph) LOS (mph) LOS (mph) LOS
PM PEAK HOUR
County Line to Line Dr. 0.02 33.3 B 33.0 B 10.7 F 31.9 B 31.2 B - - - - - - - - - - - - - - - - - - - -
Line Dr. to Balmy Beach Dr. 0.32 29.3 B 37.7 A 23.7 C 27.6 C 17.6 D 27.3 C 39.1 A 24.0 C 37.8 A 31.1 B
Balmy Beach Dr. to Hunt Club Blvd. 0.34 38.4 A 33.5 B 31.0 B 33.7 B 33.0 B 26.3 C 31.6 B 29.8 B 26.4 C 21.7 D 42.5 A 33.7 B 35.8 A 37.3 A 37.8 A 29.8 B 26.8 C 31.0 B 26.2 C 28.2 B
Hunt Club Blvd. to Bear Lake Rd. 0.38 18.7 D 18.7 D 38.4 A 38.4 A 40.2 A 40.2 A 43.9 A 43.9 A 28.2 B 28.2 B 16.6 E 16.6 E 16.5 E 16.5 E 21.9 D 21.9 D 40.7 A 40.7 A 40.0 A 40.0 A
Bear Lake Rd. to Harley Lester Ln.* 39.6 A 37.8 A 46.4 A 48.6 A 44.2 A 42.0 A
Harley Lester Ln. to Post Lake Pl.** 20.8 D 45.8 A 40.5 A 38.7 A 35.6 A 30.0 B
Post Lake Pl. to W. Lake Brantley Rd. 0.34 32.8 B 31.5 B 40.1 A 27.9 C 40.0 A 24.0 C 30.4 B 41.6 A 36.4 A 35.8 A
W. Lake Brantley Rd. to Pearl Lake Causeway 0.25 41.3 A 39.8 A 33.9 B 23.4 C 27.8 C 21.4 D 27.4 C 21.1 D 40.5 A 40.5 A
Pearl Lake Causeway to Lake Harriet Dr. 0.22 43.0 A 41.9 A 41.5 A 41.9 A 40.1 A 34.7 B 38.8 A 37.7 A 26.4 C 30.7 B
Lake Harriet Dr. to SR 434 0.28 8.3 F 21.8 D 8.2 F 20.8 D 7.1 F 20.6 D 6.9 F 18.6 D 8.7 F 21.0 D 20.5 D 27.3 C 23.0 C 31.6 B 23.7 C 31.7 B 11.1 F 25.3 C 17.9 D 29.5 B
SR 434 to San Sebastian Prado 0.27 28.7 B 38.6 A 32.3 B 39.9 A 39.1 A 43.1 A 42.0 A 41.0 A 40.0 A 40.0 A
San Sebastian Prado to Weathersfield Ave. 0.53 36.6 A 31.5 B 39.3 A 35.8 A 28.1 B 21.6 D 25.3 C 25.1 C 21.7 D 20.9 D
Weathersfield Ave. to Montgomery Rd. 0.24 18.9 D 36.4 A 21.3 D 19.3 D 12.4 F 23.3 C 17.6 D 23.5 C 9.7 F 20.1 D 25.3 C 28.0 B 18.9 D 23.9 C 15.2 E 21.9 D
Montgomery Rd.to Lynchfield Ave. 0.22 38.1 A 30.0 B 25.4 C 32.1 B 38.1 A 32.6 B 29.3 B 30.7 B 19.9 D 23.6 C 34.7 B 10.8 F 29.4 B 30.0 B
Lynchfield Ave. to Grace Blvd. 0.12 31.8 B 25.1 C 14.6 E 23.3 C 38.2 A 41.1 A 43.3 A 15.9 E 37.9 A 30.0 B
Grace Blvd. to Westmonte Dr. 0.20 16.5 E 10.5 F 10.6 F 15.6 E 30.5 B 37.1 A 22.1 C 25.2 C 19.4 D 9.6 F
Westmonte Dr. to Wymore Rd./Douglas Ave. 0.20 9.1 F 13.8 E 12.5 F 13.0 F 6.2 F 8.8 F 5.1 F 9.2 F 9.6 F 18.0 D 6.0 F 14.8 E 8.2 F 17.5 D 11.3 F 13.9 E 7.5 F 15.6 E 10.6 F 14.6 E
Wymore Rd./Douglas Ave. to I-4 (W. Ramps) 0.07 6.3 F 33.8 B 13.0 F 13.3 E 32.8 B 28.0 C 6.2 F 24.7 C 7.1 F 5.6 F
I-4 (W. Ramps) to I-4 (E. Ramps) 0.09 32.5 B 10.9 F 40.1 A 36.8 A 34.3 B 19.2 D 33.2 B 19.2 D 35.1 A 34.0 B 32.3 B 30.0 B 26.2 C 10.0 F 28.0 C 26.2 C 27.0 C 12.7 F 33.7 B 11.2 F
I-4 (E. Ramps) to North Lake Blvd. 0.22 10.7 F 10.7 F 8.5 F 8.5 F 29.8 B 29.8 B 10.5 F 10.5 F 17.6 D 17.6 D 28.7 B 28.7 B 41.8 A 41.8 A 16.0 E 16.0 E 16.9 E 16.9 E 13.9 E 13.9 E
North Lake Blvd. to Hattaway Dr. 0.12 17.6 D 9.4 F 14.6 E 32.3 B 17.0 E 42.0 A 40.0 A 44.2 A 10.8 F 17.7 D
Hattaway Dr. to Renaissance Dr. 0.15 36.2 A 36.9 A 34.1 B 16.9 E 42.1 A 31.2 B 19.5 D 20.5 D 24.4 C 24.4 C
Renaissance Dr. to Essex St. 0.12 7.2 F 7.6 F 8.4 F 13.3 E 21.0 D 20.5 D 13.8 E 19.1 D 17.0 E 17.7 D
Essex St. to Mall Entrance 0.12 21.1 D 25.9 C 22.3 C 32.6 B 14.5 E 17.4 D 9.6 F 15.7 E 20.0 D 26.7 C
Mall Entrance to Palm Springs Dr. 0.12 17.2 D 15.3 E 33.8 B 15.5 E 16.4 E 15.7 E 16.6 E 19.3 D 27.3 C 21.4 D 12.7 F 20.8 D 17.1 D 16.5 E 14.5 E 19.7 D 11.4 F 15.2 E 7.9 F 15.9 E
Palm Springs Dr. to Boston Ave. 0.18 31.9 B 33.8 B 36.3 A 31.6 B 36.8 A 20.0 D 20.7 D 32.6 B 31.8 B 28.4 B
Boston Ave. to CR 427/Maitland Ave. 0.34 16.3 E 19.7 D 16.3 E 19.9 D 13.7 E 17.6 D 20.9 D 23.8 C 25.7 C 28.8 B 31.5 B 25.9 C 17.6 D 18.7 D 28.2 B 29.7 B 11.9 F 15.4 E 39.2 A 34.5 B
CR 427/Maitland Ave. to CR 427/Ronald Reagan Blvd. 0.47 13.7 E 13.7 E 17.8 D 17.8 D 18.6 D 18.6 D 19.7 D 19.7 D 20.3 D 20.3 D 32.0 B 32.0 B 16.7 E 16.7 E 18.6 D 18.6 D 16.4 E 16.4 E 33.0 B 33.0 B
CR 427/Ronald Reagan Blvd. to Prarie Lake Dr. 0.29 30.3 B 37.5 A 38.5 A 37.7 A 31.3 B 26.5 C 31.6 B 36.7 A 32.2 B 31.6 B
Prarie Lake Dr. to Anchor Rd. 0.45 22.9 C 17.1 D 26.4 C 33.0 B 30.1 B 30.0 B 34.4 B 36.6 A 37.3 A 36.3 A
Anchor Rd. to US 17/92 0.32 7.6 F 15.2 E 7.9 F 14.5 E 10.2 F 19.5 D 16.0 E 26.2 C 9.0 F 18.3 D 9.3 F 17.9 D 10.9 F 20.9 D 8.4 F 18.7 D 8.0 F 17.8 D 8.1 F 17.8 D
US 17/92 to Plaza Entrance 0.15 16.4 E 30.2 B 13.8 E 30.4 B 29.4 B 25.0 C 23.1 C 16.7 E 16.5 E 16.7 E
Plaza Entrance to Oxford Rd. 0.10 34.3 B 36.2 A 9.4 F 34.2 B 14.6 E 3.3 F 3.2 F 3.5 F 8.1 F 25.0 C
Oxford Rd. to Fern Park Blvd. 0.22 29.4 B 20.7 D 38.7 A 40.8 A 41.0 A 33.8 B 33.8 B 26.9 C 19.4 D 36.3 A
Fern Park Blvd. to Wilshire Blvd. 0.54 19.5 D 22.6 C 26.2 C 24.0 C 44.0 A 39.0 A 23.8 C 27.5 C 22.3 C 16.5 E
Wilshire Blvd. to Kewanee Tr.** 0.26 13.8 E 34.1 B 21.4 D 27.5 C 24.7 C 23.3 C 34.7 B 21.7 D 22.0 D 9.6 F
Kewanee Tr. to Red Bug Lake Rd.** 0.19 21.1 D 19.4 D 47.0 A 27.2 C 38.2 A 22.3 C 20.1 D 26.8 C 24.8 C 30.6 B 35.6 A 23.4 C 30.0 B 20.8 D 21.9 D 18.9 D 25.3 C 19.1 D 17.3 D 16.3 E
Red Bug Lake Rd. to Sausalito Blvd.** 0.17 23.5 C 52.2 A 23.6 C 25.7 C 20.7 D 42.2 A 43.8 A 28.5 B 15.4 E 25.7 C
Sausalito Blvd. to Lake Howell Rd.** 0.34 21.4 D 22.1 D 27.1 C 32.2 C 24.7 D 24.3 D 28.3 C 27.4 C 23.3 D 22.4 D 28.1 C 32.3 C 11.6 F 16.2 E 24.3 D 25.8 D 32.8 C 23.7 D 24.7 D 25.0 D
Lake Howell Rd. to Lake Howell Square 0.25 38.9 B 44.8 A 43.1 A 28.9 C 23.4 D 19.6 E 25.4 D 18.2 E 14.6 F 13.6 F
Lake Howell Square to Lake Howell Ln. 0.25 41.5 B 43.4 A 46.2 A 44.8 A 47.6 A 42.2 A 31.2 C 23.6 D 28.9 C 20.3 E
Lake Howell Ln. to Howell Branch Rd. 0.54 14.4 F 21.0 D 11.6 F 18.1 E 13.8 F 20.9 E 20.3 E 25.6 D 18.8 E 23.4 D 11.5 F 16.1 E 25.9 D 26.8 D 14.7 F 17.1 E 15.3 F 17.1 E 13.8 F 14.9 F
Howell Branch Rd. to Winter Woods Blvd. 0.47 35.6 B 37.1 B 19.7 E 18.1 E 32.3 C 28.7 C 41.2 B 41.2 B 41.5 B 39.7 B
Winter Woods Blvd. to Castelton Blvd. 0.53 42.9 A 33.9 C 46.9 A 31.9 C 45.8 A 44.4 A 35.5 B 43.2 A 42.3 A 42.1 A 41.7 B 40.8 B 41.1 B 44.2 A 42.0 B
Castelton Blvd. to Orange County Line 0.08 46.9 A 39.5 B 39.0 B 35.6 B 37.5 B 28.9 C 50.1 A 24.2 D 46.1 A 38.6 B - - - - - - - - - - - - - - - - - - - -
Average 20.0 D 21.3 D 21.1 D 22.3 C 23.4 C 22.7 C 22.3 C 22.3 C 20.6 D 21.0 D
Note: * From 2009, additional control point has been considered on "Harley Lester Ln" the segment limits will be Bear Lake Rd. to Harley Lester Ln. and the segment length will be 0.14 Mile
Note: * From 2009, additional control point has been considered on "Harley Lester Ln" the segment limits will be Harley Lester Ln. to Post Lake Pl. and the segment length will be 0.32 Mile
Note: ** From 2012, construction in progress on SR 436 from Wilshire Blvd to Lake Howell Rd (Financial Project ID: 419369-1-52-01) which may have skewed the LOS for the segments.
Average Speed Average Speed Average Speed Average Speed Average SpeedAverage Speed Average Speed Average Speed Average Speed Average Speed Average Speed Average SpeedAverage Speed Average Speed Average Speed Average Speed Average SpeedAverage Speed Average Speed Average Speed
Year 2009 Year 2010 Year 2011 Year 2012 Year 2014Year 2005 Year 2006 Year 2007 Year 2008 Year 2013
29.0 B 29.4 BC27.7 C 24.40.46
TABLE S4.1b
Year 2014 Seminole County Travel Time & Delay Study
SR 436 (Parts A & B) - Eastbound Direction Historical Summary
C-11 SR 436 - EB - PM
Roadway
Segments Distance
(mile) (mph) LOS (mph) LOS (mph) LOS (mph) LOS (mph) LOS (mph) LOS (mph) LOS (mph) LOS (mph) LOS (mph) LOS (mph) LOS (mph) LOS (mph) LOS (mph) LOS (mph) LOS (mph) LOS (mph) LOS (mph) LOS (mph) LOS (mph) LOS
AM PEAK HOUR
Orange County Line to Castelton Blvd. 0.10 18.3 E 32.5 C 15.5 F 17.3 E 17.7 E - - - - - - - - - - - - - - - - - - - -
Castelton Blvd. to Winter Woods Blvd. 0.52 41.7 B 46.9 A 45.9 A 40.9 B 35.4 B 41.5 B 41.0 B 41.0 B 44.2 A 39.3 B
Winter Woods Blvd. to Howell Branch Rd. 0.47 19.6 E 26.2 D 22.9 D 31.5 C 17.5 E 25.0 D 24.4 D 29.3 C 33.4 C 32.2 C 15.7 F 23.6 D 18.5 E 26.3 D 17.0 E 24.9 D 18.1 E 26.3 D 16.2 E 23.5 D
Howell Branch Rd. to Lake Howell Ln. 0.53 45.6 A 39.8 B 46.5 A 45.1 A 48.5 A 42.6 A 45.0 A 47.0 A 44.4 A 45.0 A
Lake Howell Ln. to Lake Howell Square 0.26 48.1 A 46.9 A 49.1 A 48.3 A 49.1 A 33.9 C 25.2 D 30.0 C 48.7 A 48.7 A
Lake Howell Square to Lake Howell Rd. 0.25 49.8 A 47.2 A 50.5 A 43.6 A 35.1 B 43.8 A 31.8 C 41.7 B 26.2 D 40.7 B 22.2 D 32.5 C 48.6 A 38.6 B 50.0 A 42.0 A 48.4 A 46.3 A 39.5 B 44.4 A
Lake Howell Rd. to Sausalito Blvd.** 0.35 25.5 D 18.8 E 19.3 E 32.3 C 25.4 D 25.7 D 34.0 C 17.0 E 34.4 B 25.9 D
Sausalito Blvd. to Red Bug Lake Rd.** 0.17 6.5 F 12.8 F 8.4 F 13.2 E 6.0 F 11.0 F 11.3 F 20.0 D 11.3 F 17.8 D 12.0 F 17.8 D 11.6 F 19.5 D 5.7 F 9.6 F 7.2 F 15.1 E 7.2 F 13.7 E
Red Bug Lake Rd. to Kewanee Tr.** 0.21 35.3 A 36.4 A 33.1 B 37.6 A 37.7 A 38.0 A 24.8 C 21.9 D 19.0 D 13.1 E
Kewanee Tr. to Wilshire Blvd.** 0.26 42.5 A 40.8 A 41.8 A 44.1 A 43.2 A 42.2 A 37.1 A 17.7 D 37.1 A 19.7 D
Wilshire Blvd. to Fern Park Blvd. 0.54 34.3 B 28.3 B 33.6 B 38.7 A 34.4 B 36.0 A 42.1 A 40.5 A 36.0 A 35.2 A
Fern Park Blvd. to Oxford Rd. 0.23 19.0 D 15.4 E 13.2 E 11.1 F 28.0 B 32.2 B 15.5 E 16.9 E 27.6 C 22.3 C
Oxford Rd. to Plaza Entrance 0.10 24.1 C 32.5 B 23.4 C 33.9 B 37.5 A 36.0 A 20.0 D 18.9 D 13.3 E 31.6 B
Plaza Entrance to US 17/92 0.18 5.6 F 20.9 D 6.2 F 20.1 D 14.9 E 24.8 C 9.5 F 22.9 C 6.5 F 24.0 C 9.8 F 26.6 C 23.1 C 27.6 C 11.8 F 21.0 D 12.3 F 24.2 C 14.4 E 21.8 D
US 17/92 to Anchor Rd. 0.29 38.5 A 39.9 A 26.6 C 42.1 A 39.9 A 37.2 A 37.2 A 41.3 A 29.5 B 37.5 A
Anchor Rd. to Prarie Lake Dr. 0.45 43.6 A 33.6 B 36.1 A 39.5 A 40.6 A 39.2 A 39.2 A 43.4 A 40.6 A 40.0 A
Prarie Lake Dr. to CR 427/Ronald Reagan Blvd. 0.29 15.7 E 28.7 B 14.3 E 25.5 C 17.1 D 25.7 C 11.5 F 24.1 C 21.0 D 32.3 B 18.0 D 29.2 B 18.9 D 29.9 B 41.9 A 42.4 A 25.6 C 32.0 B 17.8 D 29.3 B
CR 427/Ronald Reagan Blvd. to CR 427/Maitland Ave. 0.48 31.4 B 31.4 B 31.6 B 31.6 B 24.8 C 24.8 C 35.9 A 35.9 A 36.9 A 36.9 A 36.2 A 36.2 A 31.7 B 31.7 B 30.0 B 30.0 B 28.5 B 28.5 B 30.9 B 30.9 B
CR 427/Maitland Ave. to Boston Ave. 0.34 40.2 A 31.5 B 25.7 C 29.3 B 40.2 A 34.3 B 27.4 C 31.0 B 24.3 C 27.8 C
Boston Ave. to Palm Springs Dr. 0.18 40.8 A 40.4 A 21.7 D 27.1 C 22.7 C 24.5 C 29.3 B 29.3 B 12.5 F 22.7 C 10.1 F 18.1 D 10.8 F 17.4 D 11.0 F 18.4 D 10.1 F 16.1 E 8.8 F 15.6 E
Palm Springs Dr. to Mall Entrance 0.12 43.2 A 32.2 B 41.0 A 41.6 A 14.3 E 25.5 C 36.5 A 42.0 A 34.3 B 36.0 A
Mall Entrance to Essex St. 0.12 17.4 D 21.4 D 18.6 D 23.4 C 19.2 D 28.7 B 18.9 D 23.6 C 16.4 E 40.0 A
Essex St. to Renaissance Dr. 0.13 21.3 D 19.3 D 22.3 C 39.0 A 39.1 A 42.0 A 40.0 A 42.0 A 35.5 A 41.1 A
Renaissance Dr. to Hattaway Dr. 0.14 19.7 D 10.7 F 23.8 C 19.3 D 23.3 C 16.6 E 13.9 E 14.7 E 18.6 D 22.3 C
Hattaway Dr. to North Lake Blvd. 0.12 34.2 B 23.8 C 9.6 F 15.3 E 15.9 E 22.1 C 9.1 F 20.0 D 12.7 F 18.9 D 35.0 B 26.9 C 29.0 B 24.1 C 22.7 C 25.1 C 21.1 D 22.8 C 8.0 F 19.9 D
North Lake Blvd. to I-4 (E. Ramps) 0.22 15.8 E 15.8 E 11.1 F 11.1 F 21.8 D 21.8 D 20.4 D 20.4 D 15.3 E 15.3 E 11.3 F 11.3 F 14.7 E 14.7 E 11.0 F 11.0 F 13.9 E 13.9 E 12.5 F 12.5 F
I-4 (E. Ramps) to I-4 (W. Ramps) 0.09 22.9 C 21.5 D 28.6 B 11.4 F 24.4 C 32.3 B 20.0 D 23.3 C 27.0 C 28.4 B
I-4 (W. Ramps) to Wymore Rd./Douglas Ave. 0.06 34.0 B 27.0 C 21.7 D 21.6 D 38.9 A 32.9 B 11.5 F 11.4 F 32.5 B 27.3 C 38.2 A 35.0 B 9.5 F 12.9 F 38.2 A 29.0 B 36.0 A 30.0 B 36.0 A 31.0 B
Wymore Rd./Douglas Ave. to Westmonte Dr. 0.19 39.1 A 22.3 C 40.1 A 40.1 A 25.1 C 25.5 C 23.1 C 20.7 D 25.0 C 42.9 A
Westmonte Dr. to Grace Blvd. 0.21 43.3 A 43.9 A 47.0 A 44.3 A 36.2 A 43.4 A 40.6 A 38.2 A 40.0 A 42.9 A
Grace Blvd. to Lynchfield Dr. 0.12 45.4 A 42.1 A 43.3 A 32.1 B 52.3 A 45.2 A 44.2 A 42.6 A 34.6 B 45.9 A 20.5 D 22.3 C 20.0 D 27.7 C
Lynchfield Dr. to Montgomery Rd. 0.23 30.4 B 22.8 C 25.6 C 24.8 C 20.2 D 26.7 C 30.7 B 33.5 B 16.5 E 22.7 C 20.0 D 23.7 C 17.7 D 23.4 C 33.7 B 36.6 A
Montgomery Rd. to Weathersfield Dr. 0.23 40.1 A 39.5 A 43.1 A 39.9 A 38.5 A 40.0 A 29.4 B 43.6 A 30.7 B 39.4 A
Weathersfield Dr. San Sebastian Prado 0.53 33.8 B 38.6 A 43.1 A 44.3 A 37.0 A 35.6 A 37.2 A 42.6 A 37.7 A 33.7 B
San Sebastian Prado to SR 434 0.29 13.4 E 25.7 C 10.6 F 22.9 C 11.8 F 25.5 C 12.2 F 25.7 C 19.5 D 30.0 C 18.7 D 29.3 B 17.0 E 27.1 C 27.5 C 37.4 A 15.0 E 25.9 C 12.1 F 23.3 C
SR 434 to Lake Harriet Dr. 0.28 40.1 A 40.1 A 43.4 A 29.4 B 41.2 A 41.0 A 42.0 A 40.0 A 34.3 B 39.1 A
Lake Harriet Dr. to Pearl Lake Causeway 0.21 37.3 A 43.7 A 39.6 A 35.9 A 32.8 B 25.4 C 42.6 A 36.7 A 37.7 A 41.2 A
Pearl Lake Causeway to W. Lake Brantley Rd. 0.26 37.7 A 44.9 A 47.5 A 30.8 B 39.1 A 26.9 C 17.7 D 32.5 B 41.7 A 41.7 A
W. Lake Brantley Rd. to Post Lake Pl. 0.34 41.7 A 48.4 A 53.1 A 50.6 A 43.9 A 28.7 B 40.8 A 37.8 A 34.0 B 43.4 A
Post Lake Pl. to Harley Lester Ln.** 42.6 A 41.4 A 37.8 A 36.2 A 42.7 A 43.6 A
Harley Lester Ln. to Bear Lake Rd.* 13.3 E 27.0 C 29.1 B 25.5 C 20.8 D 25.1 C 22.2 C 27.8 C 21.0 D 27.8 C 36.5 A 32.8 B
Bear Lake Rd. to Hunt Club Blvd. 0.39 28.8 B 28.8 B 38.5 A 38.5 A 39.0 A 39.0 A 25.5 C 25.5 C 38.9 A 38.9 A 19.5 D 19.5 D 20.0 D 20.0 D 21.5 D 21.5 D 42.2 A 42.2 A 28.1 B 28.1 B
Hunt Club Blvd. to Balmy Beach Dr. 0.34 40.9 A 47.7 A 46.4 A 43.3 A 44.2 A 42.5 A 40.8 A 41.6 A 45.3 A 42.5 A
Balmy Beach Dr. to Line Dr. 0.31 47.4 A 51.2 A 51.0 A 52.7 A 47.1 A 44.4 A 44.3 A 47.4 A 44.6 A 34.6 B 37.6 A 48.6 A 44.6 A 44.6 A 45.0 A 45.8 A 44.0 A
Line Dr. to Orange County Line 0.00 22.7 C 43.4 A 7.5 F 48.4 A 56.6 A 48.6 A - - - - - - - - - - - - - - - - - - - -
Average 27.6 C 25.5 C 27.5 C 27.7 C 28.5 B 27.0 C 26.3 C 26.3 C 26.9 C 26.0 C
Note: * From 2009, additional control point has been considered on "Harley Lester Ln" the segment limits will be Harley Lester Ln. to Bear Lake Rd. and the segment length will be 0.14 Mile
Note: * From 2009, additional control point has been considered on "Harley Lester Ln" the segment limits will be Post Lake Pl. to Harley Lester Ln. and the segment length will be 0.32 Mile
Note: ** From 2012, construction in progress on SR 436 from Wilshire Blvd to Lake Howell Rd (Financial Project ID: 419369-1-52-01) which may have skewed the LOS for the segments.
Average Speed Average Speed Average Speed Average Speed Average SpeedAverage Speed Average Speed Average Speed Average Speed Average Speed Average Speed Average SpeedAverage Speed Average Speed Average Speed Average Speed Average SpeedAverage Speed Average Speed Average Speed
Year 2009 Year 2010 Year 2011 Year 2012 Year 2014Year 2005 Year 2006 Year 2007 Year 2008 Year 2013
B35.0B33.6A40.6B31.6A38.9B30.2A40.9A44.8
TABLE S4.2aYear 2014 Seminole County Travel Time & Delay Study
SR 436 (Parts A & B) - Westbbound Direction Historical Summary
0.45
C-12 SR 436 - WB - AM
Roadway
Segments Distance
(mile) (mph) LOS (mph) LOS (mph) LOS (mph) LOS (mph) LOS (mph) LOS (mph) LOS (mph) LOS (mph) LOS (mph) LOS (mph) LOS (mph) LOS (mph) LOS (mph) LOS (mph) LOS (mph) LOS (mph) LOS (mph) LOS (mph) LOS (mph) LOS
PM PEAK HOUR
Orange County Line to Castelton Blvd. 0.10 16.4 E 13.9 F 32.7 C 21.2 D 29.6 C - - - - - - - - - - - - - - - - - - - -
Castelton Blvd. to Winter Woods Blvd. 0.52 41.0 B 26.3 D 24.1 D 35.0 B 28.5 C 43.2 A 35.6 B 43.8 A 33.5 C 37.4 B
Winter Woods Blvd. to Howell Branch Rd. 0.47 14.1 F 21.1 D 13.2 F 17.6 E 7.1 F 12.0 F 16.2 E 22.6 D 23.1 D 25.9 D 9.1 F 15.9 F 14.7 F 21.5 D 14.2 F 22.3 D 21.7 D 26.7 D 14.2 F 21.1 D
Howell Branch Rd. to Lake Howell Ln. 0.53 42.1 A 25.8 D 27.0 D 29.2 C 24.7 D 30.6 C 42.1 A 43.2 A 41.5 B 42.1 A
Lake Howell Ln. to Lake Howell Square 0.26 38.9 B 44.3 A 37.6 B 21.2 D 35.3 B 41.1 B 19.0 E 36.3 B 25.6 D 20.5 E
Lake Howell Square to Lake Howell Rd. 0.25 24.5 D 35.4 B 23.0 D 28.0 C 45.1 A 32.3 C 25.7 D 25.9 D 14.5 F 22.7 D 24.7 D 30.4 C 38.3 B 32.0 C 27.3 C 35.9 B 16.3 E 27.3 C 17.9 E 26.6 D
Lake Howell Rd. to Sausalito Blvd.** 0.35 21.4 D 20.2 E 27.9 C 25.0 D 23.0 D 20.7 E 20.2 E 9.2 F 13.6 F 20.0 E
Sausalito Blvd. to Red Bug Lake Rd.** 0.17 5.4 F 10.6 F 9.7 F 14.7 E 9.8 F 17.3 D 17.3 D 21.7 D 14.0 E 18.9 D 5.7 F 10.3 F 5.8 F 10.3 F 5.7 F 7.4 F 7.8 F 10.9 F 5.4 F 10.4 F
Red Bug Lake Rd. to Kewanee Tr.** 0.21 34.9 B 35.4 A 35.6 A 37.6 A 38.5 A 38.0 A 36.8 A 34.5 B 30.8 B 25.3 C
Kewanee Tr. to Wilshire Blvd.** 0.26 43.0 A 40.3 A 39.3 A 42.2 A 45.9 A 17.1 D 40.0 A 30.0 B 18.8 D 39.0 A
Wilshire Blvd. to Fern Park Blvd. 0.54 37.0 A 38.8 A 38.6 A 30.3 B 25.3 C 26.8 C 41.5 A 41.5 A 31.5 B 36.0 A
Fern Park Blvd. to Oxford Rd. 0.23 17.7 D 16.6 E 13.3 E 17.8 D 30.5 B 26.9 C 15.3 E 13.5 E 13.5 E 13.1 E
Oxford Rd. to Plaza Entrance 0.10 20.0 D 34.4 B 33.2 B 27.7 C 33.7 B 30.0 B 18.0 D 9.0 F 26.1 C 33.3 B
Plaza Entrance to US 17/92 0.18 9.7 F 24.6 C 9.9 F 25.6 C 24.8 C 28.2 B 11.6 F 25.1 C 9.3 F 25.1 C 11.0 F 21.4 D 7.9 F 21.7 D 12.0 F 22.0 D 10.9 F 20.2 D 14.2 E 24.2 C
US 17/92 to Anchor Rd. 0.29 39.0 A 38.3 A 41.0 A 41.4 A 40.7 A 38.7 A 37.2 A 38.0 A 31.0 B 36.7 A
Anchor Rd. to Prarie Lake Dr. 0.45 27.8 C 23.8 C 22.4 C 27.8 C 36.5 A 40.9 A 38.1 A 41.5 A 38.3 A 31.7 B
Prarie Lake Dr. to CR 427/Ronald Reagan Blvd. 0.29 11.4 F 21.3 D 9.4 F 19.4 D 13.9 E 21.7 D 14.4 E 24.0 C 15.1 E 27.0 C 14.2 E 26.6 C 19.4 D 29.9 B 38.3 A 39.5 A 24.5 C 31.3 B 23.8 C 30.1 B
CR 427/Ronald Reagan Blvd. to CR 427/Maitland Ave. 0.48 20.1 D 20.1 D 22.5 C 22.5 C 19.8 D 19.8 D 26.3 C 26.3 C 23.9 C 23.9 C 17.7 D 17.7 D 23.5 C 23.5 C 26.6 C 26.6 C 28.0 C 28.0 C 23.3 C 23.3 C
CR 427/Maitland Ave. to Boston Ave. 0.34 15.5 E 11.0 F 20.3 D 24.7 C 36.0 A 22.1 C 28.7 B 13.4 E 15.9 E 34.3 B
Boston Ave. to Palm Springs Dr. 0.18 10.7 F 13.4 E 24.3 C 13.7 E 8.1 F 13.1 E 8.4 F 14.7 E 14.2 E 23.3 C 10.1 F 15.3 E 26.5 C 27.8 C 10.5 F 12.1 F 16.6 E 16.1 E 24.0 C 29.7 B
Palm Springs Dr. to Mall Entrance 0.12 26.8 C 33.5 B 28.0 B 20.5 D 14.2 E 20.5 D 30.0 B 28.0 C 32.7 B 30.0 B
Mall Entrance to Essex St. 0.12 35.2 A 38.5 A 34.8 B 15.1 E 39.4 A 16.9 E 12.2 F 6.3 F 17.1 D 8.0 F
Essex St. to Renaissance Dr. 0.13 36.7 A 38.3 A 33.2 B 11.5 F 18.4 D 13.3 E 11.7 F 8.9 F 9.5 F 5.3 F
Renaissance Dr. to Hattaway Dr. 0.14 32.7 B 27.1 C 27.0 C 16.4 E 19.4 D 15.9 E 8.1 F 5.0 F 9.0 F 7.4 F
Hattaway Dr. to North Lake Blvd. 0.12 13.6 E 26.0 C 29.3 B 32.7 B 9.7 F 22.2 C 6.7 F 12.3 F 5.3 F 13.2 E 17.1 D 16.4 E 6.6 F 10.5 F 10.8 F 8.6 F 25.2 C 14.3 E 5.7 F 7.5 F
North Lake Blvd. to I-4 (E. Ramps) 0.22 5.2 F 5.2 F 9.8 F 9.8 F 5.5 F 5.5 F 6.0 F 6.0 F 14.1 E 14.1 E 13.9 E 13.9 E 16.0 E 16.0 E 12.9 F 12.9 F 8.7 F 8.7 F 9.9 F 9.9 F
I-4 (E. Ramps) to I-4 (W. Ramps) 0.09 12.7 F 25.0 C 8.7 F 14.8 E 18.2 D 21.0 D 15.6 E 23.3 C 27.0 C 16.4 E
I-4 (W. Ramps) to Wymore Rd./Douglas Ave. 0.06 7.6 F 9.7 F 7.8 F 12.3 F 26.7 C 12.8 F 12.2 F 13.4 E 30.6 B 22.1 C 32.3 B 25.5 C 35.0 B 21.5 D 7.1 F 10.9 F 8.0 F 13.8 E 30.0 B 20.0 D
Wymore Rd./Douglas Ave. to Westmonte Dr. 0.19 23.4 C 38.5 A 20.0 D 15.0 E 34.0 B 40.0 A 31.6 B 22.6 C 35.3 A 30.8 B
Westmonte Dr. to Grace Blvd. 0.21 40.6 A 30.6 B 25.8 C 25.4 C 40.1 A 42.0 A 39.4 A 30.7 B 38.7 A 36.4 A
Grace Blvd. to Lynchfield Dr. 0.12 23.2 C 27.9 C 14.5 E 25.9 C 24.4 C 23.0 C 23.3 C 19.8 D 41.4 A 41.1 A 39.0 A 15.0 E 36.0 A 37.9 A
Lynchfield Dr. to Montgomery Rd. 0.23 19.5 D 22.0 C 19.6 D 16.0 E 40.8 A 38.7 A 36.7 A 39.7 A 19.7 D 29.0 B 19.4 D 21.3 D 10.0 F 20.2 D 30.7 B 33.1 B
Montgomery Rd. to Weathersfield Dr. 0.23 42.3 A 29.7 B 27.6 C 33.4 B 43.2 A 45.0 A 41.1 A 36.0 A 32.9 B 28.2 B
Weathersfield Dr. San Sebastian Prado 0.53 32.7 B 45.2 A 22.4 C 32.9 B 21.1 D 21.5 D 30.6 B 34.8 B 36.8 A 24.5 C
San Sebastian Prado to SR 434 0.29 12.1 F 22.7 C 7.3 F 18.8 D 9.8 F 17.7 D 8.6 F 18.3 D 15.9 E 21.6 D 15.1 E 21.6 D 17.1 D 26.6 C 21.8 D 30.3 B 15.7 E 26.6 C 17.0 E 22.5 C
SR 434 to Lake Harriet Dr. 0.28 39.4 A 37.8 A 38.3 A 34.4 B 39.5 A 40.0 A 39.1 A 40.0 A 38.2 A 30.5 B
Lake Harriet Dr. to Pearl Lake Causeway 0.21 41.6 A 39.1 A 44.6 A 33.1 B 42.2 A 40.0 A 38.8 A 29.3 B 38.8 A 25.9 C
Pearl Lake Causeway to W. Lake Brantley Rd. 0.26 32.1 B 37.3 A 40.9 A 22.3 C 39.4 A 26.4 C 21.1 D 22.3 C 31.9 B 36.6 A
W. Lake Brantley Rd. to Post Lake Pl. 0.34 29.4 B 47.1 A 44.2 A 43.0 A 43.3 A 42.5 A 40.8 A 34.6 B 38.5 A 41.6 A
Post Lake Pl. to Harley Lester Ln.** 41.6 A 42.4 A 37.0 A 29.0 B 42.7 A 42.7 A
Harley Lester Ln. to Bear Lake Rd.* 40.3 A 32.7 B 28.3 B 29.4 B 31.9 B 27.2 C 23.2 C 23.8 C 42.0 A 30.4 B 36.5 A 28.0 C
Bear Lake Rd. to Hunt Club Blvd. 0.39 19.9 D 19.9 D 22.4 C 22.4 C 16.6 E 16.6 E 22.5 C 22.5 C 12.2 F 12.2 F 29.6 B 29.6 B 33.0 B 33.0 B 19.5 D 19.5 D 13.3 E 13.3 E 11.9 F 11.9 F
Hunt Club Blvd. to Balmy Beach Dr. 0.34 25.5 C 36.2 A 43.1 A 30.1 B 33.0 B 44.3 A 42.5 A 38.5 A 40.8 A 34.0 B
Balmy Beach Dr. to Line Dr. 0.31 43.8 A 34.1 B 26.9 C 50.0 A 36.7 A 44.7 A 37.4 A 48.6 A 46.3 A 47.4 A 44.6 A 45.0 A 41.3 A 31.6 B 36.0 A 27.2 C 30.5 B
Line Dr. to Orange County Line 0.00 34.9 B 31.7 B 19.1 D 35.0 B 43.4 A 34.0 B - - - - - - - - - - - - - - - - - - - -
Average 21.1 D 21.9 D 20.2 D 21.2 D 24.0 C 22.4 C 23.4 C 23.4 C 21.9 D 20.8 D
Note: * From 2009, additional control point has been considered on "Harley Lester Ln" the segment limits will be Harley Lester Ln. to Bear Lake Rd. and the segment length will be 0.14 Mile
Note: * From 2009, additional control point has been considered on "Harley Lester Ln" the segment limits will be Post Lake Pl. to Harley Lester Ln. and the segment length will be 0.32 Mile
Note: ** From 2012, construction in progress on SR 436 from Wilshire Blvd to Lake Howell Rd (Financial Project ID: 419369-1-52-01) which may have skewed the LOS for the segments.
Average Speed Average Speed Average Speed Average Speed Average SpeedAverage Speed Average Speed Average Speed Average Speed Average Speed Average Speed Average SpeedAverage Speed Average Speed Average Speed Average Speed Average SpeedAverage Speed Average Speed Average Speed
Year 2009 Year 2010 Year 2011 Year 2012 Year 2014Year 2005 Year 2006 Year 2007 Year 2008 Year 2013
41.2 A 42.6 BA 42.0 A 29.8 B 31.4A29.7 B 32.9 B 43.50.45
TABLE S4.2b
Year 2014 Seminole County Travel Time & Delay StudySR 436 (Parts A & B) - Westbbound Direction Historical Summary
C-13 SR 436 - WB - PM
Roadway
Segments Distance
(mile) (mph) LOS (mph) LOS (mph) LOS (mph) LOS (mph) LOS (mph) LOS (mph) LOS (mph) LOS (mph) LOS (mph) LOS (mph) LOS (mph) LOS (mph) LOS (mph) LOS (mph) LOS (mph) LOS (mph) LOS (mph) LOS (mph) LOS (mph) LOS
AM PEAK HOUR
Orange County Line to Spartan Dr. 0.28 36.8 B 27.4 C 39.5 B 12.6 F 23.9 D 37.1 B 26.4 D 45.0 A 46.3 A 45.0 A
Spartan Dr. to O'Brien Rd. 0.47 35.7 B 44.6 A 44.9 A 25.2 D 43.6 A 42.4 A 42.4 A 42.7 A 44.8 A 37.6 B
O'Brien Rd. to Lake of the Woods Blvd. 0.32 26.2 D 32.4 C 17.4 E 27.4 C 22.5 D 33.7 C 22.5 D 19.7 E 26.0 D 30.9 C 21.2 D 32.0 C 42.9 A 36.9 B 17.7 E 30.4 C 23.0 D 35.2 B 28.2 C 35.6 B
Lake of the Woods Blvd. to Prairie Lake Dr. 0.25 43.0 A 42.8 A 38.0 B 27.4 C 24.0 D 33.9 C 26.4 D
Prairie Lake Dr. to Fernwood Blvd. 0.27 29.5 C 36.0 B 40.4 B 25.8 D 46.4 A 42.6 A 30.6 C 35.5 B 34.7 B 39.0 B
Fernwood Blvd. to SR 436 0.20 13.0 F 21.9 D 9.1 F 19.8 E 8.0 F 19.3 E 20.7 E 27.9 C 7.8 F 19.8 E 8.8 F 20.4 E 5.8 F 13.9 F 9.3 F 18.4 E 9.5 F 20.2 E 9.4 F 19.4 E
SR 436 to Live Oaks Blvd. 0.23 39.6 B 42.0 A 39.4 B 40.9 B 40.7 B 39.5 B 37.5 B 39.4 B 40.6 B 38.3 B
Live Oaks Blvd. to Triplet Lake Dr. 0.53 45.0 A 43.1 A 48.9 A 46.5 A 47.8 A 44.8 A 44.1 A 43.1 A 45.4 A 43.8 A 33.4 C 35.1 B 40.5 B 39.5 B 44.4 A 42.8 A 44.4 A 43.2 A 43.2 A 41.6 B
Triplet Lake Dr. to Plumosa Ave.*** 34.1 B 44.0 A 45.0 A 44.0 A
Plumosa Ave. to Button Rd.**** 26.9 D 13.4 F 11.0 F 12.7 F
Button Rd. to Seminola Blvd./Dog Track Rd. 0.27 43.2 A 43.4 A 42.8 A 37.9 B 39.8 B 39.9 B 15.7 F 26.3 D 27.9 C 31.1 C 30.0 C 35.8 B 18.4 E 25.3 D 38.2 B 25.5 D 39.1 B 22.8 D 37.3 B 24.5 D
Seminola Blvd./Dog Track Rd. to Laura St.* 46.2 A 44.3 A 44.3 A 42.6 A 44.5 A 44.5 A
Laura St. to SR 434** 27.7 C 33.8 C 19.6 E 26.2 D 28.4 C 33.9 C 39.2 B 40.6 B 38.7 B 41.1 B 34.4 B 38.3 B
SR 434 to Orange Ave. 0.41 43.6 A 45.7 A 44.2 A 45.2 A 45.0 A 43.0 A 29.3 C 41.9 B 38.3 B 42.6 A
Orange Ave. to Shepard Rd./Raven Ave. 0.76 41.7 B 42.4 A 41.9 B 43.2 A 46.7 A 45.7 A 49.4 A 47.7 A 41.9 B 43.0 A 39.5 B 40.7 B 31.0 C 30.4 C 42.9 A 42.5 A 41.7 B 40.3 B 45.0 A 44.1 A
Shepard Rd./Raven Ave. to Gen. Hutchinson Pkwy. 0.55 45.0 A 49.5 A 45.0 A 48.8 A 50.4 A 46.0 A 38.9 B 43.5 A 47.0 A 43.5 A
Gen. Hutchinson Pkwy. to SR 419/CR 427 0.85 35.4 B 38.6 B 36.2 B 40.7 B 36.1 B 39.2 B 32.2 C 37.2 B 33.2 C 38.5 B 39.5 B 42.0 B 37.7 B 38.2 B 38.9 B 40.7 B 45.8 A 46.3 A 30.8 C 35.0 B
SR 419/CR 427 to CR 427 0.22 29.0 C 29.0 C 23.2 D 23.2 D 33.7 C 33.7 C 36.5 B 36.5 B 38.0 B 38.0 B 31.4 C 31.4 C 38.8 B 38.8 B 19.2 E 19.2 E 26.5 D 26.5 D 21.2 D 21.2 D
CR 427 to Weldon Blvd. 0.21 41.4 B 43.7 A 40.9 B 44.4 A 42.2 A 46.2 A 46.2 A 42.2 A 47.5 A 36.8 B
Weldon Blvd. to County Home Rd. 0.61 41.5 B 41.5 B 42.7 A 42.9 A 47.6 A 45.7 A 37.4 B 39.0 B 47.9 A 46.3 A 44.5 A 44.9 A 34.1 B 36.3 B 45.5 A 44.7 A 50.4 A 49.7 A 45.5 A 43.2 A
County Home Rd. to Bargain Blvd. 0.32 40.7 B 44.9 A 42.0 A 35.0 B 40.9 B 43.6 A 48.0 A 42.9 A 45.0 A 45.0 A
Bargain Blvd. to Bush Blvd. 0.11 44.1 A 47.3 A 47.2 A 38.2 B 42.1 A 25.7 D 48.0 A 45.0 A 48.0 A 51.4 A
Bush Blvd. to Collins Dr./Lake Minnie Dr. 0.35 46.7 A 44.0 A 45.2 A 46.3 A 48.2 A 39.6 B 36.2 B 44.1 A 47.0 A 49.1 A
Collins Dr./Lake Minnie Dr. to Lake Mary Blvd. 0.44 23.6 D 33.8 C 17.9 E 29.1 C 21.5 D 31.9 C 17.7 E 27.5 C 22.0 D 32.4 C 20.3 E 28.9 C 23.0 D 32.4 C 23.4 D 33.3 C 18.0 E 29.5 C 20.2 E 32.0 C
Lake Mary Blvd. to Plaza/Walmart Entrance 0.25 38.7 B 40.2 B 43.0 A 35.8 B 31.9 C 37.5 B 48.6 A 38.6 B 33.7 C 38.6 B
Plaza/Walmart Entrance to Americana Blvd. 0.20 38.6 B 41.0 B 43.9 A 38.9 B 43.9 A 33.3 C 33.3 C 47.0 A 45.0 A 47.0 A
Americana Blvd. to Airport Blvd. 0.51 41.0 B 40.1 B 40.8 B 40.6 B 35.3 B 32.8 C 31.4 C 33.5 C 27.6 C 31.0 C 29.1 C 34.1 B 23.9 D 29.8 C 20.4 E 25.9 D 19.0 E 25.5 D
Airport Blvd. to SR 417 0.55 39.6 B 40.6 B 36.4 B 36.9 B 37.7 B 36.5 B 40.0 B 41.5 B 37.8 B 41.5 B
SR 417 to 27th St. 0.16 21.7 D 30.2 C 23.0 D 24.0 D 26.4 D 22.0 D 23.1 D 31.0 C 34.3 B 24.0 D
27th St. to Park Dr. 0.27 38.6 B 32.9 C 26.9 D 29.8 C 25.2 D 36.0 B 32.3 C 36.5 B 31.1 C 37.3 B
Park Dr. to 25th St. 0.32 25.6 D 32.0 C 29.9 C 34.5 B 14.9 F 24.3 D 20.0 E 28.0 C 28.1 C 30.4 C 24.6 D 29.9 C 27.8 C 32.2 C 32.5 C 36.5 B 17.3 E 28.1 C 25.6 D 32.9 C
25th St. to 20th St. 0.50 36.4 B 37.6 B 39.0 B 36.9 B 40.5 B 36.4 B 40.0 B 42.3 A 37.5 B 42.3 A
20th St. to 15th St. 0.32 29.2 C 29.4 C 38.7 B 31.5 C 35.3 B 29.5 C 34.9 B 38.4 B 33.7 C 34.9 B
15th St. to 13th St. 0.15 32.5 C 36.8 B 35.1 B 33.6 C 36.5 B 19.6 E 37.5 B 37.5 B 22.5 D 25.0 D
13th St. to 3rd St. 0.63 33.4 C 37.7 B 40.8 B 33.9 C 27.9 C 31.8 C 37.8 B 39.4 B 39.4 B 38.6 B
3rd St. to SR 46/1st St. 0.12 12.0 F 29.5 C 17.8 E 33.3 C 37.9 B 39.1 B 7.1 F 26.9 D 20.3 E 32.0 C 26.0 D 30.4 C 21.7 D 35.8 B 26.0 D 38.3 B 23.6 D 33.9 C 25.2 D 35.7 B
SR 46/1st St. to Seminole Blvd. 0.26 - - - - - - - - 38.7 B 38.7 B 36.9 B 36.9 B 38.1 B 38.1 B 37.5 B 37.5 B
Jessamine Ave. to Oak Dr. 0.75 44.2 A 44.2 A 45.2 A 45.2 A 47.0 A 47.0 A 41.8 B 41.8 B - - - - - - - - 48.3 A 48.3 A 48.0 A 48.0 A 47.7 A 47.7 A 49.4 A 49.4 A
Oak Dr. to Central Florida Zoo 1.60 - - - - - - - -
Central Florida Zoo to CR 15/I-4 (E. Ramps) 0.27 48.9 A 51.1 A 53.7 A 44.0 A - - - - - - - - 46.9 A 46.9 A 45.6 A 45.6 A 47.5 A 47.5 A 51.8 A 51.8 A
CR 15/I-4 (E. Ramps) to I-4 (W. Ramps) 0.22 42.2 A 48.1 A 41.6 B 49.9 A 40.3 B 43.6 A - - - - - - - - 45.0 A 34.5 B 41.5 B 47.6 A
I-4 (W. Ramps) to Volusia County Line 0.09 41.3 B 41.3 B 75.7 A 75.7 A 43.6 A 43.6 A - - - - - - - - 55.4 A 47.8 A 48.0 A 37.7 B 51.4 A 44.1 A 48.0 A 47.8 A
Average 36.4 B 37.0 B 37.5 B 32.8 C 33.5 C 31.9 C 33.8 C 35.7 B 34.9 B 35.2 B
Note: * From 2009, additional control point has been considered on "Laura St." the segment limits will be Seminola/Dogtrack Dr to Laura St. and the segment length will be 0.51 Mile
Note: ** From 2009, additional control point has been considered on "Laura St." the segment limits will be Laura St. to SR 434 and the segment length will be 0.62 Mile
Note: *** From 2011, additional control point has been considered on "Plumosa Ave." The segment limits will be Triplet Lake Dr. to Plumosa Ave. and the segment length will be .33 Mile
Note: **** From 2011, additional control point has been considered on "Plumosa Ave." The segment limits will be Plumosa Ave. to Button Rd. and the segment length will be .26 Mile
Average Speed Average SpeedAverage Speed Average Speed Average Speed Average Speed Average Speed Average Speed Average Speed Average Speed Average SpeedAverage Speed Average Speed Average Speed Average Speed Average Speed Average Speed Average Speed
TABLE S5.1aYear 2014 Seminole County Travel Time & Delay Study
US 17-92 (Parts A & B) Northbound Direction Historical Summary
Under Construction
0.59 43.5 B
Year 2013
Rdwy Segment Rdwy Section
Average Speed Average Speed
39.9 B 37.7 B 32.8 C 39.3 B
Year 2007 Year 2008 Year 2009 Year 2010
C-14 US 17-92 - NB - AM
Roadway
Segments Distance
(mile) (mph) LOS (mph) LOS (mph) LOS (mph) LOS (mph) LOS (mph) LOS (mph) LOS (mph) LOS (mph) LOS (mph) LOS (mph) LOS (mph) LOS (mph) LOS (mph) LOS (mph) LOS (mph) LOS (mph) LOS (mph) LOS (mph) LOS (mph) LOS
PM PEAK HOUR
Orange County Line to Spartan Dr. 0.28 27.5 C 20.0 E 26.9 D 14.8 F 21.4 D 36.3 B 33.9 C 28.9 C 27.0 D 30.6 C
Spartan Dr. to O'Brien Rd. 0.47 22.4 D 30.0 C 30.5 C 31.6 C 33.9 C 43.0 A 32.7 C 37.1 B 42.1 A 34.0 C
O'Brien Rd. to Lake of the Woods Blvd. 0.32 14.9 F 20.3 E 12.4 F 19.3 E 14.7 F 22.4 D 13.8 F 18.9 E 32.2 C 29.3 C 39.1 B 40.0 B 36.0 B 33.9 C 29.5 C 32.3 C 38.7 B 36.0 B 23.5 D 29.3 C
Lake of the Woods Blvd. to Prairie Lake Dr. 0.25 37.5 B 43.3 A 31.8 C 27.9 C 28.4 C 37.1 B 38.0 B
Prairie Lake Dr. to Fernwood Blvd. 0.27 16.0 E 13.3 F 16.7 E 26.8 D 40.0 B 18.4 E 15.7 F 24.4 D 19.0 E 17.5 E
Fernwood Blvd. to SR 436 0.20 3.9 F 8.6 F 4.2 F 8.4 F 3.8 F 8.7 F 5.1 F 12.9 F 6.7 F 17.2 E 5.7 F 12.6 F 6.7 F 13.0 F 6.7 F 14.7 F 5.5 F 12.8 F 6.9 F 14.4 F
SR 436 to Live Oaks Blvd. 0.23 37.8 B 37.5 B 20.0 E 38.1 B 42.2 A 41.7 B 14.3 F 38.3 B 39.4 B 37.3 B
Live Oaks Blvd. to Triplet Lake Dr. 0.53 38.1 B 38.0 B 29.4 C 31.5 C 45.4 A 32.6 C 32.7 C 34.3 B 44.8 A 44.0 A 45.6 A 44.3 A 41.0 B 25.8 D 33.7 C 35.0 B 42.6 A 41.6 B 38.1 B 37.9 B
Triplet Lake Dr. to Plumosa Ave.*** 42.1 A 39.6 B 43.0 A 43.0 A
Plumosa Ave. to Button Rd.**** 39.0 B 27.4 C 39.0 B 39.0 B
Button Rd. to Seminola Blvd./Dog Track Rd. 0.27 34.2 B 34.8 B 31.8 C 29.4 C 37.9 B 38.0 B 23.5 D 23.2 D 44.0 A 42.9 A 33.7 C 32.0 C 40.5 B 40.6 B 34.3 B 33.5 C 35.7 B 39.2 B 22.4 D 32.4 C
Seminola Blvd./Dog Track Rd. to Laura St.* 48.1 A 45.0 A 46.4 A 43.9 A 43.9 A 43.9 A
Laura St. to SR 434** 27.2 C 33.9 C 24.4 D 30.8 C 30.2 C 35.9 B 16.9 E 23.2 D 17.8 E 24.1 D 16.2 E 22.4 D
SR 434 to Orange Ave. 0.41 41.8 B 43.4 A 41.7 B 44.2 A 45.2 A 45.3 A 21.7 D 67.7 A 42.6 A 39.4 B
Orange Ave. to Shepard Rd./Raven Ave. 0.76 44.9 A 43.7 A 47.8 A 45.9 A 42.0 A 41.9 B 48.1 A 46.6 A 41.0 B 42.5 A 26.6 D 31.3 C 34.4 B 28.3 C 43.7 A 50.3 A 45.0 A 44.1 A 44.6 A 42.5 A
Shepard Rd./Raven Ave. to Gen. Hutchinson Pkwy. 0.55 47.0 A 47.6 A 47.4 A 50.2 A 51.6 A 47.8 A 39.3 B 45.8 A 47.7 A 47.0 A
Gen. Hutchinson Pkwy. to SR 419/CR 427 0.85 25.9 D 31.6 C 22.3 D 28.5 C 32.1 C 36.8 B 26.6 D 32.7 C 24.7 D 31.2 C 24.5 D 30.9 C 33.7 C 35.9 B 36.0 B 39.5 B 36.8 B 40.7 B 38.0 B 41.3 B
SR 419/CR 427 to CR 427 0.22 41.8 B 41.8 B 38.8 B 38.8 B 40.9 B 40.9 B 24.5 D 24.5 D 39.2 B 39.2 B 21.6 D 21.6 D 16.7 E 16.7 E 24.6 D 24.6 D 23.0 D 23.0 D 31.4 C 31.4 C
CR 427 to Weldon Blvd. 0.21 40.1 B 39.5 B 45.7 A 45.4 A 45.5 A 50.0 A 48.0 A 30.0 C 42.2 A 39.3 B
Weldon Blvd. to County Home Rd. 0.61 45.2 A 43.8 A 39.6 B 39.6 B 42.7 A 43.4 A 44.6 A 44.8 A 46.1 A 45.9 A 40.6 B 42.6 A 42.0 B 43.3 A 47.8 A 42.1 A 49.7 A 47.8 A 48.5 A 46.0 A
County Home Rd. to Bargain Blvd. 0.32 39.0 B 37.4 B 38.8 B 41.5 B 42.6 A 44.6 A 46.8 A 45.0 A 45.0 A 46.2 A
Bargain Blvd. to Bush Blvd. 0.11 23.3 D 25.9 D 30.2 C 49.1 A 26.3 D 31.3 C 42.4 A 48.0 A 42.4 A 48.0 A
Bush Blvd. to Collins Dr./Lake Minnie Dr. 0.35 42.5 A 29.3 C 44.1 A 33.8 C 41.2 B 36.2 B 45.7 A 40.0 B 40.8 B 45.0 A
Collins Dr./Lake Minnie Dr. to Lake Mary Blvd. 0.44 20.9 E 29.1 C 20.7 E 26.4 D 14.6 F 24.4 D 18.9 E 28.0 C 20.8 E 29.6 C 21.0 E 29.5 C 18.9 E 30.2 C 20.8 E 31.0 C 26.1 D 34.7 B 22.8 D 33.6 C
Lake Mary Blvd. to Plaza/Walmart Entrance 0.25 26.0 D 37.7 B 39.6 B 34.9 B 34.0 B 32.1 C 34.0 C 20.0 E 17.4 E 33.1 C
Plaza/Walmart Entrance to Americana Blvd. 0.20 35.7 B 31.3 C 37.3 B 37.5 B 37.0 B 38.4 B 41.4 B 37.5 B 37.2 B 39.1 B 31.0 C 26.3 D 36.0 B 40.0 B
Americana Blvd. to Airport Blvd. 0.51 30.7 C 41.3 B 41.7 B 38.4 B 29.1 C 31.3 C 35.2 B 34.1 B 21.4 D 21.7 D 22.0 D 22.0 D 20.4 E 25.5 D
Airport Blvd. to SR 417 0.55 31.9 C 35.5 B 40.6 B 36.7 B 36.5 B 28.7 C 36.1 B 35.0 B 32.9 C 36.5 B
SR 417 to 27th St. 0.16 15.8 F 29.0 C 32.8 C 20.8 E 36.8 B 18.0 E 25.0 D 19.2 E 15.2 F 32.0 C
27th St. to Park Dr. 0.27 39.9 B 39.7 B 40.1 B 38.7 B 36.9 B 33.2 C 32.9 C 34.3 B 30.0 C 36.5 B
Park Dr. to 25th St. 0.32 16.4 E 24.4 D 12.4 F 24.4 D 15.4 F 28.5 C 12.4 F 23.5 D 32.1 C 35.4 B 18.9 E 23.9 D 13.9 F 24.7 D 20.9 E 27.6 C 16.4 E 23.4 D 28.7 C 33.7 C
25th St. to 20th St. 0.50 27.8 C 27.2 C 22.8 D 32.3 C 32.8 C 32.9 C 33.0 C 38.0 B 37.5 B 38.5 B
20th St. to 15th St. 0.32 23.9 D 22.1 D 22.2 D 32.2 C 36.6 B 27.8 C 33.7 C 34.9 B 31.0 C 36.2 B
15th St. to 13th St. 0.15 14.2 F 18.4 E 23.2 D 22.6 D 34.1 B 23.7 D 36.0 B 36.0 B 28.1 C 36.0 B
13th St. to 3rd St. 0.63 30.5 C 30.4 C 35.8 B 33.5 C 29.9 C 25.0 D 37.8 B 38.6 B 36.3 B 38.6 B
3rd St. to SR 46/1st St. 0.12 14.3 F 24.2 D 13.7 F 24.3 D 10.3 F 23.9 D 14.3 F 29.0 C 26.8 D 31.9 C 17.0 E 26.3 D 31.2 C 34.8 B 25.2 D 36.0 B 27.9 C 33.9 C 32.5 C 37.3 B
SR 46/1st St. to Seminole Blvd. 0.26 - - - - - - - - 37.5 B 37.5 B 36.9 B 36.9 B 37.5 B 37.5 B 35.8 B 35.8 B
Seminole Blvd. to Jessamine Ave. 0.56 42.1 A 42.1 A 43.9 A 43.9 A - - - - - - - -
Jessamine Ave. to Oak Dr. 0.75 35.7 B 35.7 B 46.2 A 46.2 A - - - - - - - - 46.1 A 46.1 A 45.8 A 45.8 A 48.0 A 48.0 A 45.8 A 45.8 A
Oak Dr. to Central Florida Zoo 1.60 - - - - - - - -
Central Florida Zoo to CR 15/I-4 (E. Ramps) 0.27 46.4 A 41.0 B 17.8 E 44.9 A - - - - - - - - 46.5 A 46.5 A 43.1 A 43.1 A 37.3 B 37.3 B 41.4 B 41.4 B
CR 15/I-4 (E. Ramps) to I-4 (W. Ramps) 0.22 43.2 A 46.0 A 28.7 C 39.2 B 40.8 B 44.4 A - - - - - - - - 47.6 A 37.7 B 41.5 B 42.6 A
I-4 (W. Ramps) to Volusia County Line 0.09 45.1 A 45.1 A 47.7 A 47.7 A 44.2 A 44.2 A - - - - - - - - 55.4 A 49.8 A 48.0 A 40.3 B 51.4 A 44.1 A 48.0 A 44.1 A
Average 28.5 C 27.2 C 25.7 D 30.1 C 33.3 C 28.5 C 31.9 C 32.3 C 31.8 C 33.1 C
Note: * From 2009, additional control point has been considered on "Laura St." the segment limits will be Seminola/Dogtrack Dr to Laura St. and the segment length will be 0.51 Mile
Note: ** From 2009, additional control point has been considered on "Laura St." the segment limits will be Laura St. to SR 434 and the segment length will be 0.62 Mile
Note: *** From 2011, additional control point has been considered on "Plumosa Ave." The segment limits will be Triplet Lake Dr. to Plumosa Ave. and the segment length will be .33 Mile
Note: **** From 2011, additional control point has been considered on "Plumosa Ave." The segment limits will be Plumosa Ave. to Button Rd. and the segment length will be .26 Mile
Average Speed Average SpeedAverage Speed Average Speed Average Speed Average Speed Average Speed Average Speed Average Speed Average Speed Average Speed
Year 2005 Year 2006 Year 2009 Year 2010 Year 2011 Year 2012
C 30.5 C
Under Construction
D 25.7 D 25.7 D 30.5D 26.0 D 25.5 D 25.526.0
TABLE S5.1b
Year 2014 Seminole County Travel Time & Delay Study
US 17-92 (Parts A & B) Northbound Direction Historical Summary
0.59 D
1.13
Average Speed Average Speed
23.0
Year 2007 Year 2008
Average Speed Average Speed Average Speed Average Speed Average Speed
Year 2013
Rdwy Segment Rdwy Section
Average Speed Average Speed
42.4 A 31.3 C35.1 B 28.4 C 38.0 B
C-15 US 17-92 - NB - PM
Roadway
Segments Distance
(mile) (mph) LOS (mph) LOS (mph) LOS (mph) LOS (mph) LOS (mph) LOS (mph) LOS (mph) LOS (mph) LOS (mph) LOS (mph) LOS (mph) LOS (mph) LOS (mph) LOS (mph) LOS (mph) LOS (mph) LOS (mph) LOS (mph) LOS (mph) LOS
AM PEAK HOUR
Volusia County Line to I-4 (W. Ramps) 0.41 43.1 A 48.8 A 47.1 A - - - - - - - - 37.9 B 15.3 F 45.0 A 42.4 A
I-4 (W. Ramps) to I-4 (E. Ramps)/CR15 0.23 26.3 D 35.1 B 26.6 D 37.7 B 16.0 E 26.6 D - - - - - - - - 20.8 E 24.1 D 16.4 E 16.0 E 11.4 F 14.8 F 11.7 F 15.0 F
I-4 (E. Ramps)/CR 15 to Central Florida Zoo 0.28 - - - - - - - -
Central Florida Zoo to Oak Dr. 1.60 47.4 A 49.3 A 49.8 A 49.0 A - - - - - - - - 49.7 A 49.7 A 50.1 A 50.1 A 49.9 A 49.9 A 51.1 A 51.1 A
Oak Dr. to Jessamine Ave. 0.75 - - - - - - - -
Jessamine Ave. to Seminole Blvd. 0.55 - - - - - - - - 46.1 A 46.1 A 48.0 A 48.0 A 46.7 A 46.7 A 47.0 A 47.0 A
Seminole Blvd. to SR 46/1st St. 0.25 36.4 B 41.7 B 41.9 B 45.6 A 34.8 B 41.7 B 37.4 B 43.0 A - - - - - - - - 24.0 D 24.0 D 17.3 E 17.3 E 25.5 D 25.5 D 24.5 D 24.5 D
SR 46/1st St. to 3rd St. 0.12 27.1 C 30.0 C 30.9 C 16.6 E 30.5 C 22.3 D 37.1 B 32.5 C 35.5 B 35.5 B
3rd St. to 13th St. 0.62 35.2 B 39.4 B 39.9 B 38.7 B 31.3 C 29.1 C 31.2 C 38.6 B 39.8 B 38.2 B
13th St. to 15th St. 0.15 30.4 C 35.1 B 34.7 B 36.1 B 33.2 C 25.7 D 26.5 D 36.0 B 37.5 B 37.5 B
15th St. to 20th St. 0.32 21.9 D 25.1 D 31.8 C 28.1 C 33.2 C 24.0 D 24.6 D 27.0 C 29.1 C 33.7 C
20th St. to 25th St./CR 46A 0.50 22.7 D 26.9 D 34.3 B 33.3 C 28.6 C 33.3 C 33.0 C 31.5 C 29.3 C 31.1 C 26.8 D 26.5 D 27.5 C 28.6 C 34.1 B 33.9 C 31.9 C 34.5 B 32.6 C 35.3 B
25th St./CR 46A to Park Dr. 0.33 25.4 D 30.2 C 40.5 B 37.6 B 40.8 B 40.3 B 41.7 B 39.2 B 39.2 B 42.7 A
Park Dr. to 27th St. 0.27 25.1 D 22.2 D 44.2 A 40.0 B 43.2 A 21.4 D 41.0 B 29.5 C 27.5 C 42.0 B
27th St. to SR 417 0.16 38.9 B 26.9 D 43.8 A 39.6 B 42.5 A 37.5 B 37.5 B 20.0 E 25.9 D 24.6 D
SR 417 to Airport Blvd. 0.58 24.7 D 26.3 D 32.2 C 28.4 C 34.1 B 38.5 B 24.3 D 31.2 C 23.9 D 32.0 C 24.5 D 28.3 C 29.0 C 34.6 B 26.0 D 28.1 C 29.5 C 30.3 C 26.2 D 31.4 C
Airport Blvd. to Americana Blvd. 0.53 38.0 B 36.6 B 41.0 B 22.2 D 41.4 B 40.8 B 39.7 B 44.3 A 37.8 B 46.4 A
Americana Blvd. to Plaza/Walmart Entrance 0.20 26.3 D 40.9 B 47.7 A 42.9 A 32.1 C 37.5 B 40.0 B 40.0 B
Plaza/Walmart Entrance to Lake Mary Blvd. 0.25 15.6 F 25.0 D 25.8 D 31.8 C 34.2 B 35.1 B 25.1 D 25.3 D 35.0 B 40.6 B 32.7 C 38.1 B 40.9 B 38.7 B 27.7 C 36.5 B 26.6 D 34.1 B 34.5 B 41.1 B
Lake Mary Blvd. to Collins Dr./Lake Minie Dr. 0.43 42.5 A 31.4 C 48.3 A 45.3 A 47.7 A 44.0 A 47.1 A 45.5 A 43.3 A 42.6 A
Collins Dr./Lake Minie Dr. to Bush Blvd. 0.36 34.0 C 39.8 B 48.2 A 47.0 A 48.7 A 42.9 A 47.7 A 45.7 A 39.3 B 46.0 A
Bush Blvd. to Bargain Blvd. 0.11 37.2 B 31.2 C 50.2 A 47.0 A 47.2 A 45.0 A 48.0 A 48.0 A 42.4 A 48.0 A
Bargain Blvd. to County Home Rd. 0.31 34.8 B 37.3 B 38.2 B 35.1 B 46.9 A 48.0 A 49.6 A 46.9 A 50.2 A 48.5 A 39.2 B 42.4 A 54.9 A 49.2 A 40.8 B 44.5 A 38.3 B 40.7 B 50.0 A 45.7 A
County Home Rd. to Weldon Blvd. 0.62 36.6 B 29.1 C 37.1 B 32.4 C 36.7 B 34.7 B 29.3 C 30.7 C 31.8 C 30.5 C
Weldon Blvd. to CR 427 0.22 24.7 D 32.8 C 15.3 F 23.8 D 28.3 C 34.5 B 24.1 D 29.9 C 20.0 E 30.5 C 18.7 E 28.8 C 36.4 B 30.7 C 40.7 B 32.6 C 19.0 E 27.5 C 19.7 E 27.0 C
CR 427 to SR 419/CR 427 0.22 22.4 D 22.4 D 21.0 D 21.0 D 29.1 C 29.1 C 28.0 C 28.0 C 33.0 C 33.0 C 33.0 C 33.0 C 32.2 C 32.2 C 36.0 B 36.0 B 14.8 F 14.8 F 37.3 B 37.3 B
SR 419/CR 427 to Gen. Hutchinson Pkwy. 0.81 41.7 B 35.8 B 33.1 C 43.5 A 39.7 B 43.0 A 46.7 A 37.3 B 48.1 A 49.1 A
Gen. Hutchinson Pkwy. to Shepard Rd./Raven Ave. 0.57 28.8 C 35.4 B 46.3 A 39.3 B 31.8 C 32.6 C 40.2 B 42.1 A 33.9 C 37.1 B 38.1 B 40.8 B 35.4 B 41.2 B 38.7 B 37.8 B 46.4 A 47.4 A 45.2 A 47.4 A
Shepard Rd./Raven Ave. to Orange Ave. 0.76 44.7 A 49.5 A 48.6 A 46.8 A 47.2 A 44.1 A 43.7 A 43.3 A 43.3 A 44.6 A
Orange Ave. to SR 434 0.45 11.8 F 22.4 D 10.5 F 21.1 D 9.6 F 19.9 E 17.9 E 29.8 C 20.5 E 32.2 C 20.8 E 31.3 C 12.3 F 22.7 D 28.1 C 36.1 B 23.4 D 32.9 C 28.4 C 36.8 B
SR 434 to Laura St.** 41.7 B 37.7 B 37.0 B 43.5 A 44.3 A 43.8 A
Laura St. to Seminola Blvd./Dog Track Rd.* 27.1 C 33.8 C 30.6 C 34.1 B 32.9 C 35.0 B 29.6 C 37.1 B 43.9 A 44.1 A 20.0 E 28.7 C
Seminole Blvd./Dog Track Rd. to Button Rd. 0.29 30.0 C 40.9 B 29.7 C 37.4 B 37.1 B 38.6 B 37.7 B 41.0 B 42.0 B 30.5 C
Button Rd. to Plumosa Ave. *** 41.1 B 42.2 A 43.3 A 40.0 B
Plumosa Ave. to Triplet Lake Dr. **** 43.0 A 40.6 B 44.0 A 42.4 A 43.0 A 42.8 A 42.1 A 37.0 B
Triplet Lake Dr. to Live Oaks Blvd. 0.54 18.5 E 26.9 D 28.9 C 36.8 B 42.7 A 34.8 B 34.8 B 31.2 C 19.9 E 35.2 B
Live Oaks Blvd. to SR 436 0.23 7.3 F 12.7 F 6.9 F 14.4 F 6.5 F 14.2 F 10.6 F 21.2 D 8.0 F 18.8 E 9.6 F 19.0 E 7.4 F 16.0 E 11.8 F 20.9 E 6.4 F 12.2 F 8.1 F 17.6 E
SR 436 to Fernwood Blvd. 0.20 37.1 B 37.7 B 39.6 B 29.8 C 39.3 B 34.3 B 30.0 C 30.8 C 30.8 C 38.0 B
Fernwood Blvd. to Prairie Lake Dr. 0.25 27.6 C 44.8 A 41.5 B 42.6 A 21.4 D 26.0 D 31.8 C
Prairie Lake Dr. to Lake of the Woods Blvd. 0.26 24.4 D 27.1 C 24.3 D 27.1 C 25.1 D 28.1 C 12.9 F 19.8 E 31.9 C 37.5 B 36.3 B 37.4 B 40.0 B 37.4 B 31.8 C 26.8 D 17.7 E 23.0 D 29.4 C 32.3 C
Lake of the Woods Blvd. to O'Brien Rd. 0.32 39.5 B 35.0 B 22.4 D 16.1 E 30.6 C 41.9 B 34.6 B 18.8 E 33.8 C 42.3 A
O'Brien Rd. to Spartan Dr. 0.46 37.7 B 40.4 B 42.1 A 9.4 F 42.4 A 43.6 A 43.0 A 42.1 A 40.9 B 45.5 A
Spartan Dr. to Orange County Line 0.26 42.9 A 39.4 B 48.0 A 40.0 B 41.8 B 33.1 C 38.4 B 13.8 F 46.6 A 38.6 B 48.7 A 44.3 A 45.9 A 40.8 B 46.3 A 31.3 C 46.3 A 39.6 B 49.1 A 45.3 A
Average 29.7 C 31.8 C 32.5 C 30.4 C 33.8 C 32.5 C 33.7 C 33.8 C 32.2 C 34.8 B
Note: * From 2009, additional control point has been considered on "Laura St." the segment limits will be Laura St. to Seminola/Dogtrack Dr. and the segment length will be 0.49 Mile
Note: ** From 2009, additional control point has been considered on "Laura St." the segment limits will be SR 434 to Laura St. and the segment length will be 0.63 Mile
Note: *** From 2011, additional control point has been considered on "Plumosa Ave." The segment limits will be Button Rd. to Plumosa Ave. and the segment length will be .26 Mile
Note: **** From 2011, additional control point has been considered on "Plumosa Ave." The segment limits will be Plumosa Ave. to Triplet Lake Dr. and the segment length will be .33 Mile
Average Speed Average SpeedAverage Speed Average Speed Average Speed Average Speed Average Speed Average Speed Average Speed Average Speed Average Speed Average Speed Average SpeedAverage Speed Average Speed Average Speed Average Speed Average Speed Average Speed Average Speed
(mile) (mph) LOS (mph) LOS (mph) LOS (mph) LOS (mph) LOS (mph) LOS (mph) LOS (mph) LOS (mph) LOS (mph) LOS (mph) LOS (mph) LOS (mph) LOS (mph) LOS (mph) LOS (mph) LOS (mph) LOS (mph) LOS (mph) LOS (mph) LOS
PM PEAK HOUR
Volusia County Line to I-4 (W. Ramps) 0.41 43.0 A 50.9 A 45.6 A - - - - - - - - 51.4 A 37.9 B 48.0 A 51.4 A
I-4 (W. Ramps) to I-4 (E. Ramps)/CR15 0.23 11.5 F 21.7 D 13.6 F 25.9 D 15.4 F 26.0 D - - - - - - - - 19.3 E 23.9 D 21.0 D 24.4 D 12.9 F 16.6 E 9.7 F 12.9 F
I-4 (E. Ramps)/CR 15 to Central Florida Zoo 0.28 - - - - - - - -
Central Florida Zoo to Oak Dr. 1.60 49.1 A 50.3 A 46.8 A 48.5 A - - - - - - - - 49.7 A 49.7 A 48.2 A 48.2 A 48.6 A 48.6 A 49.5 A 49.5 A
Oak Dr. to Jessamine Ave. 0.75 - - - - - - - -
Jessamine Ave. to Seminole Blvd. 0.55 - - - - - - - - 44.3 A 44.3 A 46.1 A 46.1 A 47.3 A 47.3 A 48.0 A 48.0 A
Seminole Blvd. to SR 46/1st St. 0.25 32.9 C 40.2 B 37.3 B 43.4 A 38.5 B 42.6 A 31.5 C 38.9 B - - - - - - - - 13.3 F 13.3 F 14.5 F 14.5 F 17.4 E 17.4 E 21.4 D 21.4 D
SR 46/1st St. to 3rd St. 0.12 29.9 C 11.3 F 33.3 C 21.2 D 18.6 E 24.4 D 33.9 C 30.0 C 33.9 C 35.5 B
3rd St. to 13th St. 0.62 29.1 C 28.1 C 32.5 C 28.9 C 30.8 C 29.5 C 39.0 B 36.0 B 38.6 B 36.3 B
13th St. to 15th St. 0.15 28.1 C 30.7 C 26.8 D 28.9 C 22.0 D 31.0 C 36.0 B 36.0 B 36.0 B 36.0 B
15th St. to 20th St. 0.32 30.3 C 26.7 D 26.9 D 26.6 D 33.2 C 31.0 C 28.7 C 36.9 B 28.2 C 30.0 C
20th St. to 25th St./CR 46A 0.50 24.9 D 27.9 C 23.3 D 23.8 D 29.2 C 29.8 C 20.5 E 24.9 D 19.9 E 25.1 D 26.4 D 28.4 C 31.6 C 33.8 C 38.0 B 36.2 B 26.3 D 31.6 C 30.3 C 33.1 C
25th St./CR 46A to Park Dr. 0.33 30.4 C 30.1 C 36.7 B 29.5 C 37.5 B 39.0 B 41.7 B 40.8 B 39.2 B 43.6 A
Park Dr. to 27th St. 0.27 21.7 D 31.9 C 31.1 C 39.1 B 32.1 C 21.7 D 33.6 C 42.0 B 32.9 C 32.9 C
27th St. to SR 417 0.16 36.4 B 22.8 D 33.6 C 42.8 A 33.4 C 36.0 B 36.0 B 34.6 B 35.6 B 29.1 C
SR 417 to Airport Blvd. 0.58 23.2 D 25.6 D 23.0 D 25.9 D 34.3 B 34.0 B 20.3 E 26.9 D 25.9 D 30.4 C 17.4 E 23.4 D 23.5 D 29.8 C 32.3 C 36.2 B 27.3 C 31.7 C 16.8 E 24.1 D
Airport Blvd. to Americana Blvd. 0.53 33.6 C 23.1 D 26.1 D 31.9 C 34.4 B 34.0 C 35.2 B 25.9 D 29.7 C 29.7 C
Americana Blvd. to Plaza/Walmart Entrance 0.20 25.9 D 30.6 C 33.2 C 36.0 B 16.4 E 32.1 C 40.0 B 37.2 B
Plaza/Walmart Entrance to Lake Mary Blvd. 0.25 25.0 D 29.9 C 31.0 C 25.4 D 16.5 E 19.7 E 18.3 E 22.3 D 11.8 F 16.6 E 22.5 D 25.7 D 40.9 B 31.0 C 34.0 C 28.9 C 22.5 D 28.5 C 21.0 D 27.6 C
Lake Mary Blvd. to Collins Dr./Lake Minie Dr. 0.43 41.6 B 21.3 D 26.7 D 42.8 A 34.8 B 40.6 B 37.2 B 45.5 A 32.2 C 46.3 A
Collins Dr./Lake Minie Dr. to Bush Blvd. 0.36 32.2 C 31.4 C 40.8 B 45.5 A 42.7 A 38.9 B 45.7 A 32.3 C 37.9 B 37.2 B
Bush Blvd. to Bargain Blvd. 0.11 40.6 B 31.9 C 44.4 A 47.2 A 48.4 A 45.0 A 48.0 A 42.4 A 45.0 A 42.4 A
Bargain Blvd. to County Home Rd. 0.31 24.3 D 33.0 C 46.8 A 28.8 C 27.0 C 31.1 C 49.6 A 45.5 A 49.6 A 41.1 B 38.4 B 39.9 B 53.3 A 43.9 A 51.9 A 41.7 B 36.0 B 35.7 B 47.4 A 43.1 A
County Home Rd. to Weldon Blvd. 0.62 32.9 C 30.2 C 34.5 B 32.5 C 44.6 A 35.7 B 32.9 C 34.4 B 29.5 C 26.8 D
Weldon Blvd. to CR 427 0.22 20.5 E 28.7 C 33.0 C 30.8 C 35.5 B 34.8 B 14.5 F 24.8 D 28.0 C 39.0 B 18.5 E 29.1 C 20.3 E 28.6 C 42.2 A 35.9 B 16.3 E 24.8 D 19.0 E 24.5 D
CR 427 to SR 419/CR 427 0.22 38.2 B 38.2 B 45.3 A 45.3 A 41.5 B 41.5 B 39.5 B 39.5 B 30.5 C 30.5 C 31.4 C 31.4 C 42.6 A 42.6 A 42.4 A 42.4 A 43.1 A 43.1 A 28.2 C 28.2 C
SR 419/CR 427 to Gen. Hutchinson Pkwy. 0.81 43.4 A 43.8 A 41.6 B 39.6 B 46.9 A 46.7 A 44.6 A 35.8 B 43.0 A 46.7 A
Gen. Hutchinson Pkwy. to Shepard Rd./Raven Ave. 0.57 31.3 C 37.6 B 42.0 B 43.0 A 37.1 B 39.7 B 40.6 B 40.0 B 36.2 B 42.0 B 28.3 C 36.7 B 32.5 C 38.5 B 30.0 C 33.3 C 39.1 B 41.3 B 30.0 C 37.9 B
Shepard Rd./Raven Ave. to Orange Ave. 0.76 44.1 A 47.4 A 47.4 A 47.0 A 47.8 A 45.5 A 44.6 A 41.7 B 44.1 A 42.5 A
Orange Ave. to SR 434 0.45 18.1 E 29.2 C 19.2 E 31.0 C 18.3 E 30.2 C 24.4 D 35.3 B 19.9 E 31.8 C 17.3 E 28.5 C 19.4 E 30.3 C 19.4 E 29.3 C 18.9 E 29.5 C 17.5 E 27.8 C
SR 434 to Laura St.** 44.7 A 42.1 A 42.6 A 37.4 B 42.3 A 37.2 B
Laura St. to Seminola Blvd./Dog Track Rd.* 42.3 A 43.6 A 40.3 B 41.2 B 43.7 A 43.1 A 40.3 B 38.4 B 42.0 B 42.2 A 35.0 B 36.2 B
Seminole Blvd./Dog Track Rd. to Button Rd. 0.29 42.3 A 45.2 A 46.2 A 37.1 B 43.0 A 40.5 B 40.5 B 41.0 B 41.0 B 26.2 D
Button Rd. to Plumosa Ave. *** 42.2 A 40.0 B 42.2 A 39.0 B
Plumosa Ave. to Triplet Lake Dr. **** 22.8 D 31.5 C 21.1 D 30.0 C 26.4 D 34.1 B 19.0 E 25.1 D
Triplet Lake Dr. to Live Oaks Blvd. 0.54 30.0 C 34.0 C 30.7 C 32.7 C 40.3 B 40.0 B 37.2 B 28.7 C 39.0 B 30.9 C
Live Oaks Blvd. to SR 436 0.23 9.8 F 18.6 E 12.2 F 22.2 D 21.2 D 27.1 C 10.9 F 20.6 E 11.7 F 23.4 D 9.6 F 20.0 E 17.2 E 27.2 C 9.7 F 18.1 E 11.4 F 22.6 D 13.9 F 22.6 D
SR 436 to Fernwood Blvd. 0.20 36.9 B 34.1 B 39.4 B 40.2 B 34.7 B 40.0 B 41.4 B 35.6 B 39.3 B 30.0 C
Fernwood Blvd. to Prairie Lake Dr. 0.25 44.7 A 46.2 A 45.0 A 45.0 A 41.1 B 42.2 A 42.2 A
Prairie Lake Dr. to Lake of the Woods Blvd. 0.26 29.6 C 31.4 C 26.4 D 28.3 C 32.4 C 34.1 B 25.2 D 34.3 B 46.0 A 42.1 A 27.4 C 35.6 B 31.2 C 38.1 B 35.5 B 37.4 B 35.5 B 38.7 B 39.0 B 37.0 B
Lake of the Woods Blvd. to O'Brien Rd. 0.32 24.4 D 26.8 D 32.8 C 32.4 C 43.3 A 41.9 B 40.0 B 39.6 B 40.4 B 42.3 A
O'Brien Rd. to Spartan Dr. 0.46 36.1 B 28.2 C 27.8 C 19.4 E 32.0 C 41.7 B 36.5 B 42.7 A 35.2 B 44.8 A
Spartan Dr. to Orange County Line 0.26 44.4 A 32.8 C 40.8 B 29.9 C 41.6 B 31.8 C 41.9 B 26.3 D 44.6 A 37.5 B 48.7 A 43.3 A 45.9 A 39.5 B 47.6 A 42.9 A 45.0 A 38.9 B 49.1 A 45.0 A
Average 31.4 C 31.8 C 34.3 B 31.8 C 32.5 C 30.6 C 33.7 C 33.7 C 33.2 C 31.6 C
Note: * From 2009, additional control point has been considered on "Laura St." the segment limits will be Laura St. to Seminola/Dogtrack Dr. and the segment length will be 0.49 Mile
Note: ** From 2009, additional control point has been considered on "Laura St." the segment limits will be SR 434 to Laura St. and the segment length will be 0.63 Mile
Note: *** From 2011, additional control point has been considered on "Plumosa Ave." The segment limits will be Button Rd. to Plumosa Ave. and the segment length will be .26 Mile
Note: **** From 2011, additional control point has been considered on "Plumosa Ave." The segment limits will be Plumosa Ave. to Triplet Lake Dr. and the segment length will be .33 Mile
Average Speed Average Speed Average Speed Average Speed Average Speed Average SpeedAverage Speed Average Speed Average Speed Average Speed Average Speed Average Speed Average Speed Average Speed Average Speed
D 26.9 DB 31.1 C 34.3 B 23.2B 40.9 B 42.2 A 39.638.7 B 39.8
1.11
Year 2007 Year 2008
0.59
46.6 A 46.043.2 A 46.6 A43.2 A
Average Speed Average Speed Average Speed
TABLE S5.2b
Under Construction
Year 2014 Seminole County Travel Time & Delay Study
US 17-92 (Parts A & B) - Southbound Direction Historical Summary
Year 2013
Rdwy Segment Rdwy Section
Average Speed Average Speed
C-17 US 17-92 - SB - PM
Roadway
Segments Distance
(mile) (mph) LOS (mph) LOS (mph) LOS (mph) LOS (mph) LOS (mph) LOS (mph) LOS (mph) LOS (mph) LOS (mph) LOS (mph) LOS (mph) LOS (mph) LOS (mph) LOS (mph) LOS (mph) LOS (mph) LOS (mph) LOS (mph) LOS (mph) LOS
AM PEAK HOUR
Orange County Line to Wymore Rd. 0.05 50.4 E 48.1 F 48.0 F 48.4 F - - - - - - - - 60.0 D 60.0 D 60.0 D 48.0 F
Wymore Rd. to SR 436 1.47 68.6 C 67.7 C 67.0 C 66.0 C 65.0 C 64.2 C 66.4 C 65.5 C - - - - - - - - 58.8 E 58.8 E 57.6 E 57.7 E 62.1 D 62.1 D 56.9 E 56.6 E
SR 436 to Central Pkwy. 0.74 65.5 C 69.7 C 65.4 C 70.6 C - - - - - - - - 58.4 E 56.9 E 63.4 D 56.9 E
Central Pkwy. to SR 434 1.26 69.2 C 67.8 C 70.7 C 70.3 C 69.2 C 67.7 C 73.1 C 72.1 C - - - - - - - - 59.0 E 58.8 E 57.7 E 57.4 E 63.0 D 63.2 D 56.8 E 56.8 E
SR 434 to E.E. Williamson Rd. 1.66 70.0 C 70.4 C 65.7 C 70.3 C - - - - - - - - 60.7 D 59.3 E 63.8 D 59.3 E
E.E. Williamson Rd. to Lake Mary Blvd. 3.16 73.1 B 72.0 C 69.9 B 70.1 B 68.7 B 67.6 B 73.8 B 72.6 B - - - - - - - - 61.0 D 60.9 D 59.8 D 59.6 E 64.8 C 64.4 D 60.6 D 60.1 D
Lake Mary Blvd. to CR 46A 2.22 73.1 B 74.1 B 68.3 B 75.2 B - - - - - - - - 61.7 D 61.4 D 65.9 A 62.5 D
CR 46A to SR 46* 1.91 74.4 B 74.0 B 71.1 B 78.2 B - - - - - - - - 63.0 D 61.3 D 66.7 A 62.3 D
SR 46 to CR 431/Orange Blvd.* 1.54 71.8 B 75.2 B 70.6 B 68.0 B - - - - - - - - 62.5 D 61.7 D 67.2 A 61.7 D
Orange Blvd. to US 17/92 0.23 - - - - - - - - 60.0 D 60.0 D 66.9 A 56.1 E
US 17/92 to Volusia County Line 0.29 70.2 B 73.0 C 69.6 B 74.2 B 68.5 B 69.8 B 62.4 D 73.5 B - - - - - - - - 65.7 A 62.3 D 69.0 A 61.6 D 65.7 A 66.5 A 65.7 A 62.0 D
Average 71.3 B 71.2 B 68.1 B 72.1 B 61.0 D 59.9 D 64.9 C 60.0 C
PM PEAK HOUR
Orange County Line to Wymore Rd. 0.05 45.0 F 38.6 F 35.6 F 37.9 F - - - - - - - - 60.0 D 48.0 F 48.0 F 48.0 F
Wymore Rd. to SR 436 1.47 61.8 C 61.1 C 58.5 C 57.5 C 46.4 F 45.9 F 55.3 C 54.4 E - - - - - - - - 56.5 E 56.6 E 54.4 E 54.2 E 57.6 E 57.3 E 52.4 E 52.3 E
SR 436 to Central Pkwy. 0.74 65.6 C 63.3 C 45.9 F 49.1 F - - - - - - - - 57.7 E 57.7 E 57.7 E 53.5 E
Central Pkwy. to SR 434 1.26 61.8 C 63.2 C 56.9 C 59.1 C 61.0 C 54.3 E 65.1 C 58.1 C - - - - - - - - 58.6 E 58.2 E 55.9 E 56.6 E 60.5 D 59.4 E 55.9 E 55.0 E
SR 434 to E.E. Williamson Rd. 1.66 48.3 F 43.4 F 60.5 C 64.4 D - - - - - - - - 56.3 E 59.3 E 60.0 D 58.3 E
E.E. Williamson Rd. to Lake Mary Blvd. 3.16 66.8 B 58.9 E 63.7 D 54.7 D 65.7 B 63.8 D 66.9 B 66.0 B - - - - - - - - 60.8 D 59.1 E 61.2 D 60.5 D 64.8 C 63.0 D 58.1 E 58.2 E
Lake Mary Blvd. to CR 46A 2.22 71.3 B 69.7 B 67.6 B 70.3 B - - - - - - - - 62.2 D 61.4 D 66.9 A 61.4 D
CR 46A to SR 46* 1.91 74.0 B 70.3 B 57.9 E 68.6 B - - - - - - - - 56.1 E 61.6 D 66.7 A 62.3 D
SR 46 to CR 431/Orange Blvd.* 1.54 72.4 B 56.9 D 35.9 F 51.2 F - - - - - - - - 48.3 F 61.2 D 58.4 E 60.8 D
Orange Blvd. to US 17/92 0.23 - - - - - - - - 48.3 F 60.0 D 54.4 E 47.0 F
US 17/92 to Volusia County Line 0.29 68.4 B 72.3 C 60.2 D 65.7 B 45.2 F 51.9 F 56.5 E 63.0 D - - - - - - - - 49.3 F 55.2 E 69.0 A 61.6 D 51.1 F 63.2 D 44.5 F 59.8 D
Average 64.8 C 59.8 D 55.0 D 62.2 D 57.0 E 59.7 E 61.9 C 57.7 C
Roadway
Segments Distance
(mile) (mph) LOS (mph) LOS (mph) LOS (mph) LOS (mph) LOS (mph) LOS (mph) LOS (mph) LOS (mph) LOS (mph) LOS (mph) LOS (mph) LOS (mph) LOS (mph) LOS (mph) LOS (mph) LOS (mph) LOS (mph) LOS (mph) LOS (mph) LOS
AM PEAK HOUR
Volusia County Line to US 17/92 0.29 67.6 B 64.4 D - - - - - - - - 65.7 A 65.7 A 65.7 A 60.0 D
US 17/92 to CR 431/Orange Blvd. 0.29 70.5 B 65.4 B - - - - - - - - 64.4 D 62.1 D 69.6 A 60.0 D
CR 431/Orange Blvd. to SR 46* 1.51 70.3 B 70.7 B 68.3 B 73.4 B - - - - - - - - 61.7 D 60.0 D 63.9 D 58.8 E
SR 46 to CR 46A* 1.88 70.8 B 72.6 B 67.4 B 73.8 B - - - - - - - - 60.3 D 61.0 D 64.8 C 61.3 D
CR 46A to Lake Mary Blvd. 2.25 52.9 E 70.0 B 55.3 E 62.3 D 69.3 B 71.7 B - - - - - - - - 45.4 F 54.4 E 56.7 E 59.3 E 56.0 E 61.3 D 53.5 E 57.6 E
Lake Mary Blvd. to E.E. Williamson Rd. 3.13 26.9 F 35.7 F 29.1 F 43.4 F - - - - - - - - 37.9 F 50.6 F 33.3 F 34.6 F
E.E. Williamson Rd. to SR 434 1.72 31.3 F 41.3 F 27.3 F 46.6 F 22.6 F 26.4 F 34.1 F 39.6 F - - - - - - - - 31.5 F 35.4 F 49.1 F 50.1 F 31.9 F 32.8 F 29.6 F 32.7 F
SR 434 to Central Pkwy. 1.22 23.7 F 25.1 F 21.8 F 28.2 F - - - - - - - - 26.2 F 25.0 F 20.3 F 16.1 F
Central Pkwy. to SR 436 0.75 34.2 F 26.8 F 28.9 F 26.4 F 23.9 F 22.5 F 25.2 F 27.0 F - - - - - - - - 32.6 F 28.3 F 35.0 F 28.0 F 29.6 F 23.0 F 28.6 F 19.3 F
SR 436 to Wymore Rd. 1.45 22.4 F 31.1 F 26.2 F 31.9 F - - - - - - - - 27.0 F 30.6 F 24.5 F 22.2 F
Wymore Rd. to Orange County Line 0.05 49.7 F 22.8 F 49.2 F 31.4 F 42.8 F 26.4 F 50.1 E 32.1 F - - - - - - - - 48.0 F 27.3 F 60.0 D 31.0 F 40.0 F 24.8 F 40.0 F 22.5 F
Average 35.5 F 40.5 F 33.7 F 44.4 F 38.6 F 45.3 F 36.7 F 34.1 F
PM PEAK HOUR
Volusia County Line to US 17/92 0.29 71.0 B 69.0 B - - - - - - - - 65.7 A 65.7 A 65.7 A 62.7 D
US 17/92 to CR 431/Orange Blvd. 0.29 72.0 B 71.3 B - - - - - - - - 64.4 D 64.4 D 66.9 A 62.1 D
CR 431/Orange Blvd. to SR 46* 1.51 72.9 B 71.3 B 72.0 B 74.3 B - - - - - - - - 62.1 D 60.8 D 64.8 C 59.6 E
SR 46 to CR 46A* 1.88 72.5 B 71.2 B 71.3 B 72.0 B - - - - - - - - 62.7 D 61.6 D 66.4 A 63.0 D
CR 46A to Lake Mary Blvd. 2.25 71.6 B 72.8 B 71.4 B 71.4 B 59.6 E 67.3 B - - - - - - - - 63.1 D 62.9 D 62.2 D 61.9 D 66.2 A 65.9 A 62.2 D 61.8 D
Lake Mary Blvd. to E.E. Williamson Rd. 3.13 70.6 B 73.1 B 68.0 B 58.6 E - - - - - - - - 62.2 D 62.0 D 64.6 D 59.6 E
E.E. Williamson Rd. to SR 434 1.72 69.8 C 71.3 C 71.0 C 71.9 C 69.0 C 68.3 B 65.9 C 61.0 B - - - - - - - - 60.4 D 61.5 D 59.6 E 61.1 D 62.2 D 63.7 D 57.6 E 58.9 E
SR 434 to Central Pkwy. 1.22 69.1 C 70.0 C 68.7 C 66.0 C - - - - - - - - 59.5 E 61.0 D 65.3 A 58.6 E
Central Pkwy. to SR 436 0.75 67.5 C 68.5 C 69.0 C 69.7 C 68.2 C 68.5 C 59.5 C 63.4 C - - - - - - - - 41.5 F 51.2 F 60.0 D 60.6 D 64.3 D 64.9 C 57.7 E 58.2 E
SR 436 to Wymore Rd. 1.45 62.1 C 63.8 C 67.0 C 53.9 E - - - - - - - - 56.9 E 54.4 E 63.5 D 56.9 E
Wymore Rd. to Orange County Line 0.05 57.7 C 61.9 C 58.4 D 63.7 C 63.9 C 66.9 C 68.5 C 54.1 E - - - - - - - - 60.0 D 56.9 E 60.0 D 54.5 E 60.0 D 63.4 D 60.0 D 56.9 E
Average 69.9 B 70.7 B 69.5 B 63.1 D 59.9 D 60.6 D 64.8 C 59.8 C
Note : Data was not collected from Year 2009
Note: * From 2013, construction in progress on SR 400 (I-4) at SR 46 (Financial Project ID: 407573-1-52-01) which may have skewed the LOS for the segments.
Average Speed Average SpeedAverage Speed Average Speed Average Speed Average Speed Average Speed
(mile) (mph) LOS (mph) LOS (mph) LOS (mph) LOS (mph) LOS (mph) LOS (mph) LOS (mph) LOS (mph) LOS (mph) LOS (mph) LOS (mph) LOS (mph) LOS (mph) LOS (mph) LOS (mph) LOS (mph) LOS (mph) LOS (mph) LOS (mph) LOS
AM PEAK HOUR
Orange County Line to Old Howell Branch Rd. 0.06 12.3 F 12.3 F 20.5 D 20.5 D 11.9 F 11.9 F 8.5 F 8.5 F 12.9 F 12.9 F - - - - - - - - - - - - - - - - - - - -
Old Howell Branch Rd. to Hall Rd./Howell Branch Rd. 0.24 18.0 D 18.0 D 17.1 D 17.1 D 22.0 C 22.0 C 15.6 E 15.6 E 14.1 E 14.1 E 26.7 C 26.7 C 15.8 E 15.8 E 17.8 D 17.8 D 16.4 E 16.4 E 19.7 D 19.7 D
Hall Rd./Howell Branch Rd. to Trinity Prep. Sch. 0.41 22.9 C 25.7 C 27.7 C 39.6 A 36.9 A 29.3 B 14.8 E 42.1 A 38.1 A 31.6 B
Trinity Prep. Sch. to Tuskawilla Rd. 0.52 29.6 B 26.2 C 38.0 A 31.4 B 40.5 A 33.6 B 42.4 A 41.1 A 40.3 A 38.7 A 41.6 A 35.2 A 35.5 A 22.1 C 33.2 B 36.6 A 34.3 B 35.8 A 32.8 B 32.3 B
Tuskawilla Rd. to Deep Lake Rd. 0.26 42.0 A 28.0 C 20.5 D 37.5 A 37.5 A 21.1 D 33.9 B
Deep Lake Rd. to SR 417 (W. Ramps) 0.17 34.4 B 34.4 B 42.4 A 42.4 A 43.4 A 43.4 A 42.9 A 42.3 A 38.2 A 31.2 B 30.9 B 23.9 C 49.1 A 41.6 A 49.1 A 41.6 A 38.4 A 25.5 C 34.3 B 34.1 B
SR 417 (W. Ramps) to SR 417 (E. Ramps) 0.09 25.1 C 25.1 C 29.0 B 29.0 B 19.9 D 19.9 D 20.4 D 20.4 D 8.9 F 8.9 F 40.0 A 40.0 A 36.0 A 36.0 A 36.0 A 36.0 A 26.2 C 26.2 C 42.0 A 42.0 A
SR 417 (E. Ramps) to Dean Rd. 0.54 30.6 B 30.6 B 40.9 A 40.9 A 40.0 A 40.0 A 41.5 A 41.5 A 24.6 C 24.6 C 45.2 A 45.2 A 33.3 B 33.3 B 27.0 C 27.0 C 18.7 D 18.7 D 38.6 A 38.6 A
Dean Rd. to Loma Vista Cr. 0.34 44.8 A 47.3 A 43.3 A 39.4 A 43.0 A 36.0 A 33.6 B 34.0 B 41.6 A
Loma Vista Cr. to Aloma Woods Blvd. 0.20 32.7 B 28.2 B 36.8 A 29.0 B 21.3 D 25.5 C 29.3 B 23.5 C 39.3 A 40.7 A
Aloma Woods Blvd. to Security Ave. 0.36 47.1 A 47.8 A 44.4 A 38.6 A 41.0 A 44.7 A 43.8 A 47.5 A 46.5 A 45.6 A
Security Ave. to Mikler Rd. 0.29 49.7 A 49.8 A 51.3 A 48.9 A 43.3 A 46.3 A 47.6 A 50.6 A 46.9 A 44.1 A
Mikler Rd. to Chapman Rd. 0.60 27.6 C 34.5 B 26.5 C 35.3 A 30.3 B 38.8 A 40.6 A 38.6 A 36.9 A 36.1 A 22.0 C 31.3 B 25.4 C 33.1 B 20.0 D 29.0 B 21.3 D 31.1 B 44.4 A 43.6 A
Chapman Rd. to Slavia Rd. 0.52 30.5 B 41.6 A 27.4 C 37.2 A 37.4 A 40.7 A 35.5 A 42.9 A 39.5 A 43.8 A
Slavia Rd. to Red Bug Lake Rd./Mitchell Hammock Rd. 0.60 23.0 C 26.1 C 21.0 D 27.7 C 21.2 D 23.8 C 18.6 D 21.6 D 18.7 D 24.6 C 36.5 A 38.5 A 20.5 D 25.9 C 21.0 D 28.1 B 27.8 C 32.5 B 26.6 C 32.8 B
Red Bug Lake Rd./Mitchell Hammock Rd. to Oviedo Mktpl. B 0.42 26.2 C 36.0 A 23.1 C 27.1 C 15.9 E 38.8 A 38.3 A 34.3 B 35.3 A 37.9 A
Oviedo Mktpl. Blvd. to Winter Springs Blvd. 0.45 43.9 A 32.8 B 29.6 B 32.5 B 32.3 B 26.9 C 23.8 C 26.2 C 21.1 D 18.2 D 43.5 A 41.1 A 34.6 B 36.3 A 33.7 B 34.0 B 32.1 B 33.6 B 23.1 C 28.5 B
Winter Springs Blvd. to Pine Ave. 0.27 33.0 B 25.4 C 29.2 B 31.5 B 28.6 B 24.2 C 24.9 C 37.7 A 34.3 B 34.3 B
Pine Ave. to Aulin Ave. 0.13 40.1 A 28.0 B 33.3 B 37.3 A 31.0 B 32.7 B 23.2 C 45.0 A 38.8 A 38.8 A
Aulin Ave. to Lake Jessup Ave. 0.38 24.2 C 28.9 B 23.3 C 24.8 C 24.2 C 27.1 C 32.3 B 27.4 C 24.2 C 26.6 C 33.9 B 29.6 B 31.2 B 27.4 C 33.0 B 36.0 A 28.9 B 31.8 B 21.6 D 26.8 C
Lake Jessup Ave. to SR 434 0.25 13.3 E 13.3 E 9.3 F 9.3 F 20.1 D 20.1 D 19.6 D 19.6 D 17.8 D 17.8 D 11.7 F 11.7 F 15.0 E 15.0 E 12.4 F 12.4 F 13.8 E 13.8 E 12.2 F 12.2 F
Average 27.9 C 28.4 B 30.0 B 30.8 B 25.9 C 31.6 B 27.8 C 29.2 B 28.1 B 31.2 B
PM PEAK HOUR
Orange County Line to Old Howell Branch Rd. 0.06 22.7 C 22.7 C 7.7 F 7.7 F 24.1 C 24.1 C 4.1 F 4.1 F 15.1 E 15.1 E - - - - - - - - - - - - - - - - - - - -
Old Howell Branch Rd. to Hall Rd./Howell Branch Rd. 0.24 10.3 F 10.3 F 11.7 F 11.7 F 8.3 F 8.3 F 14.6 E 14.6 E 10.7 F 10.7 F 8.6 F 8.6 F 11.0 F 11.0 F 10.9 F 10.9 F 14.3 E 14.3 E 15.8 E 15.8 E
Hall Rd./Howell Branch Rd. to Trinity Prep. Sch. 0.41 29.1 B 32.4 B 40.7 A 41.4 A 32.7 B 34.8 B 36.4 A 40.7 A 39.3 A 42.1 A
Trinity Prep. Sch. to Tuskawilla Rd. 0.52 29.6 B 29.3 B 37.4 A 35.0 A 40.5 A 40.6 A 39.2 A 40.2 A 33.9 B 33.3 B 32.2 B 33.3 B 22.3 C 26.8 C 23.3 C 28.6 B 24.4 C 29.2 B 29.7 B 34.1 B
Tuskawilla Rd. to Deep Lake Rd. 0.26 30.3 B 32.5 B 28.8 B 24.2 C 18.5 D 13.8 E 27.9 C
Deep Lake Rd. to SR 417 (W. Ramps) 0.17 34.2 B 34.2 B 33.6 B 33.6 B 30.6 B 30.6 B 35.1 A 32.0 B 24.3 C 28.7 B 34.8 B 31.1 B 20.4 D 22.4 C 32.7 B 22.6 C 34.3 B 17.9 D 21.8 D 25.2 C
SR 417 (W. Ramps) to SR 417 (E. Ramps) 0.09 16.7 E 16.7 E 37.8 A 37.8 A 20.6 D 20.6 D 30.9 B 30.9 B 20.6 D 20.6 D 24.0 C 24.0 C 27.7 C 27.7 C 36.0 A 36.0 A 38.2 A 38.2 A 32.3 B 32.3 B
SR 417 (E. Ramps) to Dean Rd. 0.54 27.4 C 27.4 C 39.1 A 39.1 A 35.5 A 35.5 A 35.2 A 35.2 A 26.3 C 26.3 C 28.7 B 28.7 B 21.3 D 21.3 D 21.2 D 21.2 D 18.6 D 18.6 D 28.9 B 28.9 B
Dean Rd. to Loma Vista Cr. 0.34 34.3 B 41.7 A 38.3 A 37.6 A 38.8 A 35.4 A 30.5 B 32.4 B 27.9 C
Loma Vista Cr. to Aloma Woods Blvd. 0.20 35.5 A 36.8 A 37.0 A 27.4 C 22.4 C 27.3 C 46.2 A 28.6 B 22.4 C 29.2 B
Aloma Woods Blvd. to Security Ave. 0.36 47.3 A 45.7 A 41.9 A 46.2 A 40.6 A 46.5 A 46.5 A 45.6 A 43.8 A 46.5 A
Security Ave. to Mikler Rd. 0.29 50.5 A 47.8 A 49.6 A 49.1 A 41.9 A 46.3 A 49.1 A 50.6 A 44.1 A 45.5 A
Mikler Rd. to Chapman Rd. 0.60 30.6 B 37.1 A 38.1 A 39.7 A 27.4 C 35.8 A 27.3 C 35.7 A 19.8 D 27.9 C 20.5 D 30.3 B 26.0 C 35.4 A 26.8 C 33.1 B 16.4 E 25.1 C 23.5 C 30.4 B
Chapman Rd. to Slavia Rd. 0.52 39.4 A 36.1 A 41.7 A 41.9 A 33.9 B 41.2 A 39.8 A 41.8 A 29.5 B 42.1 A
Slavia Rd. to Red Bug Lake Rd./Mitchell Hammock Rd. 0.60 21.1 D 27.3 C 22.2 C 27.3 C 16.8 E 23.6 C 17.2 D 19.9 D 26.5 C 29.6 B 28.0 C 33.3 B 13.9 E 20.5 D 16.6 E 23.7 C 15.1 E 19.7 D 21.9 D 28.5 B
Red Bug Lake Rd./Mitchell Hammock Rd. to Oviedo Mktpl. B 0.42 37.2 A 21.4 D 36.4 A 25.0 C 19.6 D 38.3 A 34.7 B 38.8 A 37.4 A 38.5 A
Oviedo Mktpl. Blvd. to Winter Springs Blvd. 0.45 35.6 A 36.3 A 36.3 A 27.1 C 40.5 A 38.4 A 21.5 D 24.3 C 20.4 D 20.0 D 42.9 A 40.5 A 38.0 A 36.3 A 40.3 A 39.6 A 42.2 A 39.7 A 40.3 A 39.4 A
Winter Springs Blvd. to Pine Ave. 0.27 36.8 A 27.7 C 36.4 A 30.6 B 22.4 C 40.5 A 36.8 A 26.6 C 29.0 B 41.0 A
Pine Ave. to Aulin Ave. 0.13 39.6 A 31.1 B 36.4 A 36.4 A 31.1 B 40.0 A 31.3 B 27.7 C 30.0 B 22.0 D
Aulin Ave. to Lake Jessup Ave. 0.38 30.0 B 33.5 B 31.7 B 30.2 B 19.3 D 25.6 C 12.5 F 8.0 F 17.4 D 20.6 D 26.6 C 32.1 B 18.7 D 24.4 C 18.9 D 22.2 C 21.2 D 24.6 C 15.3 E 20.8 D
Lake Jessup Ave. to SR 434 0.25 7.0 F 7.0 F 10.5 F 10.5 F 6.8 F 6.8 F 4.1 F 4.1 F 6.6 F 6.6 F 10.9 F 10.9 F 6.2 F 6.2 F 5.6 F 5.6 F 9.3 F 9.3 F 7.1 F 7.1 F
Average 26.5 C 28.2 B 26.0 C 22.4 C 22.7 C 27.8 C 23.0 C 23.1 C 22.5 C 25.7 C
Average SpeedAverage Speed Average Speed Average Speed Average Speed Average Speed
Rdwy Segment Rdwy Section
Average Speed Average Speed Average Speed Average Speed Average Speed Average Speed Average Speed Average Speed Average Speed Average Speed Average Speed Average Speed
TABLE S7.1aYear 2014 Seminole County Travel Time & Delay Study
SR 426 - Eastbound Direction Historical Summary
Year 2005 Year 2006 Year 2007 Year 2008 Year 2009 Year 2010 Year 2013
Rdwy Segment Rdwy Section
Average Speed Average Speed
C-19 SR 426 - EB
Roadway
Segments Distance
(mile) (mph) LOS (mph) LOS (mph) LOS (mph) LOS (mph) LOS (mph) LOS (mph) LOS (mph) LOS (mph) LOS (mph) LOS (mph) LOS (mph) LOS (mph) LOS (mph) LOS (mph) LOS (mph) LOS (mph) LOS (mph) LOS (mph) LOS (mph) LOS
AM PEAK HOUR
SR 434 to Lake Jessup Ave. 0.25 17.7 D 17.7 D 11.3 F 11.3 F 15.2 E 15.2 E 19.8 D 19.8 D 12.8 F 12.8 F 20.8 D 20.8 D 28.3 B 28.3 B 21.4 D 21.4 D 30.0 B 30.0 B 19.7 D 19.7 D
Lake Jessup Ave. to Aulin Ave. 0.38 32.7 B 23.9 C 18.7 D 34.4 B 23.3 C 33.0 B 26.9 C 34.4 B 37.5 A 25.5 C
Aulin Ave. to Pine Ave. 0.13 26.8 C 9.0 F 21.3 D 25.1 C 11.8 F 36.0 A 26.7 C 25.7 C 44.0 A 27.5 C
Pine Ave. to Winter Springs Blvd. 0.28 20.6 D 26.3 C 30.1 B 20.1 D 29.6 B 22.0 C 17.1 D 24.4 C 21.1 D 19.6 D 22.8 C 28.9 B 37.7 A 29.8 B 33.1 B 32.3 B 44.2 A 40.5 A 19.1 D 23.0 C
Winter Springs Blvd. to Oviedo Mrktpl. Blvd. 0.45 34.3 B 33.9 B 31.4 B 22.9 C 14.3 E 42.2 A 37.5 A 35.1 A 38.6 A 31.8 B
Oviedo Mrktpl. Blvd. to Red Bug Lake Rd./Mitchell Hammock Rd. 0.45 13.7 E 19.9 D 17.6 D 23.4 C 10.9 F 16.5 E 13.4 E 17.1 D 11.8 F 13.0 F 19.0 D 26.3 C 20.2 D 26.3 C 14.1 E 20.2 D 12.0 F 18.5 D 12.3 F 17.9 D
Red Bug Lake Rd./Mitchell Hammock Rd. to Slavia Rd. 0.56 40.6 A 26.4 C 26.5 C 35.1 A 24.0 C 28.0 C 39.5 A 18.4 D 16.9 E 25.2 C
Slavia Rd. to Chapman Rd. 0.54 39.9 A 40.3 A 39.5 A 31.4 B 45.2 A 33.0 B 31.0 B 33.0 B 39.5 A 29.5 B 34.0 B 30.7 B 35.9 A 37.6 A 27.0 C 21.8 D 23.6 C 19.6 D 29.7 B 27.2 C
Chapman Rd. to Mikler Rd. 0.58 48.0 A 45.6 A 50.3 A 46.5 A 42.8 A 46.4 A 42.4 A 43.5 A 42.9 A 45.0 A
Mikler Rd. to Security Ave. 0.29 50.1 A 44.3 A 52.2 A 50.0 A 43.8 A 45.0 A 47.6 A 50.6 A 46.9 A 44.1 A
Security Ave. to Aloma Woods Blvd. 0.38 42.1 A 39.4 A 36.1 A 38.0 A 31.5 B 42.2 A 34.5 B 35.6 A 37.4 A 38.6 A
Aloma Woods Blvd. to Loma Vista Cr. 0.20 32.5 B 22.8 C 34.2 B 38.7 A 42.9 A 41.4 A 34.3 B 36.8 A 38.0 A
Loma Vista Cr. to Dean Rd. 0.34 32.4 B 41.1 A 26.3 C 37.4 A 31.6 B 38.1 A 22.6 C 36.5 A 33.9 B 37.8 A 20.6 D 36.5 A 19.6 D 33.8 B 27.5 C 37.3 A 21.5 D 34.9 B 44.3 A 42.4 A
Dean Rd. to SR 417 (E. Ramps) 0.53 24.8 C 24.8 C 20.2 D 20.2 D 27.7 C 27.7 C 24.5 C 24.5 C 31.5 B 31.5 B 29.2 B 29.2 B 37.9 A 37.9 A 39.8 A 39.8 A 37.7 A 37.7 A 30.9 B 30.9 B
SR 417 (E. Ramps) to SR 417 (W. Ramps) 0.08 11.9 F 11.9 F 12.4 F 12.4 F 27.0 C 27.0 C 17.5 D 17.5 D 34.9 B 34.9 B 18.0 D 18.0 D 30.0 B 30.0 B 32.7 B 32.7 B 35.0 B 35.0 B 35.0 B 35.0 B
SR 417 (W. Ramps) to Deep Lake Rd. 0.16 33.6 B 22.7 C 20.8 D 45.0 A 12.4 F 16.0 E 13.2 E
Deep Lake Rd. to Tuskawilla Rd. 0.26 9.3 F 9.3 F 9.6 F 9.6 F 16.2 E 16.2 E 15.7 E 19.7 D 9.8 F 12.4 F 21.4 D 21.1 D 16.0 E 21.9 D 31.2 B 19.1 D 20.0 D 18.3 D 25.2 C 18.7 D
Tuskawilla Rd. to Trinity Prep. Sch. 0.52 37.3 A 38.3 A 24.7 C 42.1 A 39.1 A 39.5 A 35.1 A 43.9 A 34.3 B 25.2 C
Trinity Prep. Sch. to Hall Rd./Howell Branch Rd. 0.40 14.7 E 22.7 C 12.8 F 20.8 D 12.0 F 17.1 D 16.2 E 25.1 C 18.3 D 26.4 C 26.7 C 32.7 B 20.3 D 26.7 C 14.1 E 22.9 C 28.6 B 31.5 B 21.6 D 23.5 C
Hall Rd./Howell Branch Rd. to Old Howell Branch Rd. 0.24 36.5 A 36.5 A 39.1 A 39.1 A 28.8 B 28.8 B 24.3 C 18.8 D 35.4 A 35.4 A 33.5 B 33.5 B 34.3 B 34.3 B 18.7 D 18.7 D 36.9 A 36.9 A 41.1 A 41.1 A
Old Howell Branch Rd. to Orange County Line 0.02 48.0 A 48.0 A 41.3 A 41.3 A 61.9 A 61.9 A 30.3 B 30.3 B 37.8 A 37.8 A - - - - - - - - - - - - - - - - - - - -
Average 24.9 C 22.8 C 23.7 C 25.7 C 22.8 C 29.7 B 30.7 B 26.0 C 27.1 C 26.3 C
PM PEAK HOUR
SR 434 to Lake Jessup Ave. 0.25 24.9 C 24.9 C 19.4 D 19.4 D 22.3 C 22.3 C 20.0 D 20.0 D 21.3 D 21.3 D 26.3 C 26.3 C 21.1 D 21.1 D 23.1 C 23.1 C 23.4 C 23.4 C 23.4 C 23.4 C
Lake Jessup Ave. to Aulin Ave. 0.38 39.1 A 36.5 A 34.5 B 36.7 A 31.1 B 36.0 A 34.4 B 36.6 A 36.4 A 34.3 B
Aulin Ave. to Pine Ave. 0.13 22.2 C 20.8 D 26.0 C 39.6 A 13.4 E 31.3 B 28.8 B 36.0 A 38.8 A 34.7 B
Pine Ave. to Winter Springs Blvd. 0.28 20.0 D 26.9 C 19.4 D 25.5 C 25.4 C 29.3 B 28.0 C 33.4 B 15.9 E 20.2 D 17.8 D 26.1 C 16.9 E 24.8 C 35.2 A 36.0 A 15.7 E 24.9 C 23.3 C 29.4 B
Winter Springs Blvd. to Oviedo Mrktpl. Blvd. 0.45 29.5 B 26.4 C 24.2 C 23.3 C 23.3 C 42.2 A 26.0 C 42.2 A 38.0 A 36.0 A
Oviedo Mrktpl. Blvd. to Red Bug Lake Rd./Mitchell Hammock Rd. 0.45 18.5 D 22.9 C 15.1 E 19.4 D 16.5 E 19.8 D 11.8 F 15.9 E 13.8 E 17.4 D 28.7 B 34.2 B 16.2 E 20.0 D 17.3 D 24.6 C 14.7 E 21.5 D 13.2 E 19.6 D
Red Bug Lake Rd./Mitchell Hammock Rd. to Slavia Rd. 0.56 35.1 A 28.6 B 33.7 B 34.0 B 29.7 B 39.5 A 39.5 A 38.6 A 39.1 A 41.9 A
Slavia Rd. to Chapman Rd. 0.54 46.3 A 39.6 A 39.1 A 32.8 B 41.0 A 36.8 A 38.9 A 36.2 A 41.3 A 34.3 B 34.0 B 36.6 A 44.6 A 41.9 A 41.2 A 39.9 A 43.8 A 41.2 A 45.0 A 43.4 A
Chapman Rd. to Mikler Rd. 0.58 50.3 A 47.7 A 48.1 A 49.2 A 42.7 A 45.8 A 43.5 A 44.6 A 46.8 A 45.6 A
Mikler Rd. to Security Ave. 0.29 52.0 A 48.2 A 49.7 A 53.0 A 43.5 A 43.8 A 46.3 A 49.1 A 45.5 A 44.1 A
Security Ave. to Aloma Woods Blvd. 0.38 51.3 A 45.9 A 42.1 A 36.6 A 39.2 A 36.2 A 43.8 A 40.7 A 44.7 A 42.2 A
Aloma Woods Blvd. to Loma Vista Cr. 0.20 28.6 B 42.4 A 43.2 A 39.5 A 41.4 A 44.4 A 42.9 A 33.5 B 42.2 A
Loma Vista Cr. to Dean Rd. 0.34 26.8 C 40.2 A 35.5 A 41.7 A 17.7 D 35.2 A 27.0 C 40.0 A 21.9 D 35.4 A 24.7 C 37.1 A 13.3 E 30.8 B 28.7 B 40.0 A 22.9 C 37.2 A 27.9 C 39.5 A
Dean Rd. to SR 417 (E. Ramps) 0.53 27.4 C 27.4 C 22.7 C 22.7 C 27.7 C 27.7 C 36.0 A 36.0 A 28.3 B 28.3 B 28.2 B 28.2 B 25.0 C 25.0 C 25.8 C 25.8 C 18.1 D 18.1 D 18.4 D 18.4 D
SR 417 (E. Ramps) to SR 417 (W. Ramps) 0.08 37.5 A 37.5 A 20.1 D 20.1 D 30.1 B 30.1 B 41.5 A 41.5 A 22.9 C 22.9 C 30.0 B 30.0 B 27.7 C 27.7 C 30.0 B 30.0 B 35.0 B 35.0 B 35.0 B 35.0 B
SR 417 (W. Ramps) to Deep Lake Rd. 0.16 42.6 A 28.9 B 22.5 C 23.5 C 27.0 C 10.4 F 40.0 A
Deep Lake Rd. to Tuskawilla Rd. 0.26 18.7 D 18.7 D 24.1 C 24.1 C 30.6 B 30.6 B 30.1 B 33.9 B 26.0 C 27.0 C 22.7 C 22.6 C 12.9 F 15.9 E 15.8 E 19.1 D 25.6 C 16.5 E 23.3 C 27.7 C
Tuskawilla Rd. to Trinity Prep. Sch. 0.52 30.9 B 35.2 A 35.9 A 47.2 A 40.6 A 17.7 D 35.1 A 27.6 C 35.5 A 43.9 A
Trinity Prep. Sch. to Hall Rd./Howell Branch Rd. 0.40 17.1 D 23.0 C 27.0 C 31.2 B 18.9 D 25.9 C 41.6 A 44.7 A 23.3 C 30.9 B 21.4 D 19.2 D 16.1 E 23.2 C 34.8 B 30.3 B 27.6 C 31.5 B 42.1 A 43.1 A
Hall Rd./Howell Branch Rd. to Old Howell Branch Rd. 0.24 21.7 D 21.7 D 27.7 C 27.7 C 35.2 A 35.2 A 42.7 A 42.1 A 38.1 A 38.1 A 40.0 A 40.0 A 37.9 A 37.9 A 30.0 B 30.0 B 40.0 A 40.0 A 46.5 A 46.5 A
Old Howell Branch Rd. to Orange County Line 0.02 37.9 A 37.9 A 46.6 A 46.6 A 36.1 A 36.1 A 45.5 A 45.5 A 49.1 A 49.1 A - - - - - - - - - - - - - - - - - - - -
Average 28.4 B 28.3 B 29.0 B 31.6 B 27.2 C 29.4 B 26.0 C 31.1 B 27.9 C 31.0 B
Average Speed Average Speed Average Speed Average Speed Average SpeedAverage Speed Average Speed Average Speed Average Speed Average SpeedAverage Speed Average Speed Average Speed Average Speed Average SpeedAverage Speed Average Speed Average Speed
TABLE S7.1bYear 2014 Seminole County Travel Time & Delay Study
Year 2013
Rdwy Segment Rdwy Section
Average Speed Average Speed
C-20 SR 426 - WB
Roadway
Segments Distance
(mile) (mph) LOS (mph) LOS (mph) LOS (mph) LOS (mph) LOS (mph) LOS (mph) LOS (mph) LOS (mph) LOS (mph) LOS (mph) LOS (mph) LOS (mph) LOS (mph) LOS (mph) LOS (mph) LOS (mph) LOS (mph) LOS (mph) LOS (mph) LOS
AM PEAK HOUR
Bear Lake Rd. to Eden Park Rd. 0.49 - - - - - - - - - - - - - - - - - - - - - - - - - - - - 46.7 A 29.7 C 21.8 D
Eden Park Rd. to Magnolia Holmes Rd. 0.50 - - - - - - - - - - - - - - - - - - - - - - - - - - - - 46.9 A 46.8 A 46.9 A 36.4 B 46.2 A 29.7 C
Magnolia Holmes Rd. to SR 434 0.73 - - - - - - - - - - - - - - - - - - - - - - - - - - - - 52.8 A 46.1 A 51.5 A
SR 434 to Maitland Summit Blvd 0.88 - - - - - - - - - - - - - - - - - - - - - - - - - - - - 35.2 B 41.5 B 16.3 E 23.1 D 20.8 E 28.5 C
Average 43.3 A 26.8 D 28.9 C
PM PEAK HOUR 15.1 F 28.4 C
Bear Lake Rd. to Eden Park Rd. 0.49 - - - - - - - - - - - - - - - - - - - - - - - - - - - - 47.4 A 42.6 A 33.4 C
Eden Park Rd. to Magnolia Holmes Rd. 0.50 - - - - - - - - - - - - - - - - - - - - - - - - - - - - 48.4 A 47.9 A 38.5 B 40.4 B 43.5 A 37.8 B
Magnolia Holmes Rd. to SR 434 0.73 - - - - - - - - - - - - - - - - - - - - - - - - - - - - 50.9 A 49.2 A 52.1 A
SR 434 to Maitland Summit Blvd 0.88 - - - - - - - - - - - - - - - - - - - - - - - - - - - - 29.2 C 36.2 B 30.5 C 36.9 B 29.0 C 36.3 B
Average 39.9 B 38.1 B 36.9 B
Roadway
Segments Distance
(mile) (mph) LOS (mph) LOS (mph) LOS (mph) LOS (mph) LOS (mph) LOS (mph) LOS (mph) LOS (mph) LOS (mph) LOS (mph) LOS (mph) LOS (mph) LOS (mph) LOS (mph) LOS (mph) LOS (mph) LOS (mph) LOS (mph) LOS (mph) LOS
AM PEAK HOUR
Maitland Summit Blvd. to SR 434 0.88 - - - - - - - - - - - - - - - - - - - - - - - - - - - - 51.8 A 50.3 A 51.3 A
SR 434 to Magnolia Holmes Rd. 0.73 - - - - - - - - - - - - - - - - - - - - - - - - - - - - 53.4 A 52.5 A 45.2 A 47.8 A 36.8 B 43.5 A
Magnolia Holmes Rd. to Eden Park Rd. 0.50 - - - - - - - - - - - - - - - - - - - - - - - - - - - - 38.5 B 45.5 A 43.5 A
Eden Park Rd. to Bear Lake Rd. 0.49 - - - - - - - - - - - - - - - - - - - - - - - - - - - - 37.2 B 37.8 B 23.5 D 31.1 C 47.4 A 45.3 A
Average 45.7 A 39.7 B 44.2 A
PM PEAK HOUR
Maitland Summit Blvd. to SR 434 0.88 - - - - - - - - - - - - - - - - - - - - - - - - - - - - 51.3 A 46.7 A 53.3 A
SR 434 to Magnolia Holmes Rd. 0.73 - - - - - - - - - - - - - - - - - - - - - - - - - - - - 48.1 A 49.8 A 34.8 B 40.4 B 44.7 A 49.0 A
Magnolia Holmes Rd. to Eden Park Rd. 0.50 - - - - - - - - - - - - - - - - - - - - - - - - - - - - 48.4 A 23.6 D 21.0 E
Eden Park Rd. to Bear Lake Rd. 0.49 - - - - - - - - - - - - - - - - - - - - - - - - - - - - 23.3 D 31.6 C 23.0 D 23.3 D 23.9 D 22.3 D
Average 40.8 B 31.6 C 33.7 C
Average Speed Average Speed Average Speed Average Speed Average SpeedAverage Speed Average Speed Average Speed Average Speed Average Speed Average Speed Average SpeedAverage Speed Average Speed Average Speed Average Speed Average SpeedAverage Speed Average Speed Average Speed
Year 2009 Year 2010 Year 2011 Year 2012 Year 2014Year 2005 Year 2006 Year 2007 Year 2008 Year 2013
Average Speed Average SpeedAverage Speed Average Speed Average Speed Average Speed Average Speed Average Speed Average Speed
Rdwy Section
Average Speed Average Speed Average Speed Average Speed Average SpeedAverage Speed Average Speed Average Speed Average Speed Average Speed Average Speed
TABLE S8.1aYear 2014 Seminole County Travel Time & Delay Study
SR 414 (Maitland Blvd) - Eastbound Direction Historical Summary
Year 2005 Year 2006 Year 2007 Year 2008 Year 2009 Year 2010 Year 2011 Year 2012 Year 2014Year 2013
SR 414 (Maitland Blvd) - Westbound Direction Historical Summary
TABLE S8.1b
Year 2014 Seminole County Travel Time & Delay Study
(mile) (mph) LOS (mph) LOS (mph) LOS (mph) LOS (mph) LOS (mph) LOS (mph) LOS (mph) LOS (mph) LOS (mph) LOS (mph) LOS (mph) LOS (mph) LOS (mph) LOS (mph) LOS (mph) LOS (mph) LOS (mph) LOS (mph) LOS (mph) LOS
AM PEAK HOUR
Orange Co. Line to SR 426 0.49 - - - - - - - - - - - - - - - - - - - - - - - - - - - - 62.6 D 63.9 D 65.3 A
SR 426 to Red Bug Lake Rd. 3.20 - - - - - - - - - - - - - - - - - - - - - - - - - - - - 63.8 D 64.9 C 64.9 C
Red Bug Lake Rd. to SR 434 2.40 - - - - - - - - - - - - - - - - - - - - - - - - - - - - 63.4 D 64.9 C 64.6 D
SR 434 to CR 427 5.27 - - - - - - - - - - - - - - - - - - - - - - - - - - - - 63.6 D 65.1 A 64.5 D
CR 427 to Lake Mary Blvd. 0.22 - - - - - - - - - - - - - - - - - - - - - - - - - - - - 62.9 D 66.0 A 66.0 A
Lake Mary Blvd. to Airport Blvd. 0.73 - - - - - - - - - - - - - - - - - - - - - - - - - - - - 62.6 D 64.4 D 64.4 D
Airport Blvd. to US 17-92 0.29 - - - - - - - - - - - - - - - - - - - - - - - - - - - - 60.0 D 62.1 D 62.1 D
US 17-92 to SR 46 1.87 - - - - - - - - - - - - - - - - - - - - - - - - - - - - 64.9 C 66.0 A 66.0 A
SR 46 to Rinehart Rd. 2.52 - - - - - - - - - - - - - - - - - - - - - - - - - - - - 62.5 D 64.3 D 63.8 D
Rinehart Rd. to I-4 0.83 - - - - - - - - - - - - - - - - - - - - - - - - - - - - 54.7 E 64.7 C 54.7 E
I-4 to International Pkwy. 0.54 - - - - - - - - - - - - - - - - - - - - - - - - - - - - 32.7 F 61.3 D 47.0 F 64.2 D 23.6 F 61.0 D
Average 61.3 D 64.2 D 61.0 D
PM PEAK HOUR
Orange Co. Line to SR 426 0.49 - - - - - - - - - - - - - - - - - - - - - - - - - - - - 62.6 D 65.3 A 65.3 A
SR 426 to Red Bug Lake Rd. 3.20 - - - - - - - - - - - - - - - - - - - - - - - - - - - - 63.6 D 65.3 A 65.5 A
Red Bug Lake Rd. to SR 434 2.40 - - - - - - - - - - - - - - - - - - - - - - - - - - - - 63.2 D 64.9 C 65.2 A
SR 434 to CR 427 5.27 - - - - - - - - - - - - - - - - - - - - - - - - - - - - 63.4 D 64.5 D 65.5 A
CR 427 to Lake Mary Blvd. 0.22 - - - - - - - - - - - - - - - - - - - - - - - - - - - - 62.9 D 62.9 D 66.0 A
Lake Mary Blvd. to Airport Blvd. 0.73 - - - - - - - - - - - - - - - - - - - - - - - - - - - - 61.7 D 63.5 D 64.4 D
Airport Blvd. to US 17-92 0.29 - - - - - - - - - - - - - - - - - - - - - - - - - - - - 60.0 D 60.0 D 62.1 D
US 17-92 to SR 46 1.87 - - - - - - - - - - - - - - - - - - - - - - - - - - - - 64.1 D 65.6 A 65.2 A
SR 46 to Rinehart Rd. 2.52 - - - - - - - - - - - - - - - - - - - - - - - - - - - - 62.5 D 63.5 D 63.8 D
Rinehart Rd. to I-4 0.83 - - - - - - - - - - - - - - - - - - - - - - - - - - - - 54.1 E 63.8 D 57.9 E
I-4 to International Pkwy. 0.54 - - - - - - - - - - - - - - - - - - - - - - - - - - - - 33.7 F 61.1 D 42.6 F 63.6 D 28.4 F 62.3 D
Average 61.1 D 63.6 D 62.3 D
Roadway
Segments Distance
(mile) (mph) LOS (mph) LOS (mph) LOS (mph) LOS (mph) LOS (mph) LOS (mph) LOS (mph) LOS (mph) LOS (mph) LOS (mph) LOS (mph) LOS (mph) LOS (mph) LOS (mph) LOS (mph) LOS (mph) LOS (mph) LOS (mph) LOS (mph) LOS
AM PEAK HOUR
Volusia County Line to US 17/92 0.54 - - - - - - - - - - - - - - - - - - - - - - - - - - - - 43.8 F 47.6 F 41.5 F
US 17/92 to CR 431/Orange Blvd. 0.83 - - - - - - - - - - - - - - - - - - - - - - - - - - - - 53.0 E 60.0 D 56.0 E
CR 431/Orange Blvd. to SR 46 2.52 - - - - - - - - - - - - - - - - - - - - - - - - - - - - 63.5 D 65.7 A 65.5 A
SR 46 to CR 46A 1.87 - - - - - - - - - - - - - - - - - - - - - - - - - - - - 63.7 D 65.2 A 65.2 A
CR 46A to Lake Mary Blvd. 0.29 - - - - - - - - - - - - - - - - - - - - - - - - - - - - 60.0 D 62.1 D 62.1 D
Lake Mary Blvd. to E.E. Williamson Rd. 0.73 - - - - - - - - - - - - - - - - - - - - - - - - - - - - 64.4 D 66.4 A 66.4 A
E.E. Williamson Rd. to SR 434 0.22 - - - - - - - - - - - - - - - - - - - - - - - - - - - - 66.0 A 66.0 A 66.0 A
SR 434 to Central Pkwy. 5.27 - - - - - - - - - - - - - - - - - - - - - - - - - - - - 63.4 D 65.3 A 64.9 C
Central Pkwy. to SR 436 2.40 - - - - - - - - - - - - - - - - - - - - - - - - - - - - 63.7 D 65.8 A 64.6 D
SR 436 to Wymore Rd. 3.20 - - - - - - - - - - - - - - - - - - - - - - - - - - - - 63.4 D 65.1 A 61.7 D
Wymore Rd. to Orange County Line 0.49 - - - - - - - - - - - - - - - - - - - - - - - - - - - - 65.3 A 62.2 D 65.3 A 64.4 D 33.4 F 61.4 D
Average 62.2 D 64.4 D 61.4 D
PM PEAK HOUR
Volusia County Line to US 17/92 0.54 - - - - - - - - - - - - - - - - - - - - - - - - - - - - 45.6 F 47.0 F 42.6 F
US 17/92 to CR 431/Orange Blvd. 0.83 - - - - - - - - - - - - - - - - - - - - - - - - - - - - 54.1 E 60.0 D 57.2 E
CR 431/Orange Blvd. to SR 46 2.52 - - - - - - - - - - - - - - - - - - - - - - - - - - - - 63.5 D 64.9 C 65.5 A
SR 46 to CR 46A 1.87 - - - - - - - - - - - - - - - - - - - - - - - - - - - - 63.7 D 65.2 A 60.6 D
CR 46A to Lake Mary Blvd. 0.29 - - - - - - - - - - - - - - - - - - - - - - - - - - - - 60.0 D 64.4 D 62.1 D
Lake Mary Blvd. to E.E. Williamson Rd. 0.73 - - - - - - - - - - - - - - - - - - - - - - - - - - - - 64.4 D 66.4 A 66.4 A
E.E. Williamson Rd. to SR 434 0.22 - - - - - - - - - - - - - - - - - - - - - - - - - - - - 66.0 A 66.0 A 66.0 A
SR 434 to Central Pkwy. 5.27 - - - - - - - - - - - - - - - - - - - - - - - - - - - - 63.5 D 64.5 D 65.2 A
Central Pkwy. to SR 436 2.40 - - - - - - - - - - - - - - - - - - - - - - - - - - - - 63.7 D 65.2 A 65.5 A
SR 436 to Wymore Rd. 3.20 - - - - - - - - - - - - - - - - - - - - - - - - - - - - 63.4 D 64.9 C 65.1 A
Wymore Rd. to Orange County Line 0.49 - - - - - - - - - - - - - - - - - - - - - - - - - - - - 65.3 A 62.4 D 65.3 A 64.0 D 65.3 A 63.4 D
Average 62.4 D 64.0 D 63.4 D
Average Speed Average Speed Average Speed Average Speed Average SpeedAverage Speed Average Speed Average Speed Average Speed Average SpeedAverage Speed Average Speed Average Speed Average Speed Average SpeedAverage Speed Average Speed Average Speed
Year 2009 Year 2010 Year 2011 Year 2012 Year 2014Year 2005 Year 2006 Year 2007 Year 2008
Average Speed Average Speed Average Speed Average SpeedAverage Speed Average Speed Average Speed Average Speed Average SpeedAverage Speed Average Speed Average SpeedAverage Speed Average Speed Average Speed Average Speed
TABLE S9.1aYear 2014 Seminole County Travel Time & Delay Study
SR 417 - Northbound Direction Historical Summary
TABLE S6.1bYear 2014 Seminole County Travel Time & Delay Study
Year 2005 Year 2006 Year 2007 Year 2008 Year 2009 Year 2010 Year 2011 Year 2012 Year 2014
Segments (mile) (mph) LOS (mph) LOS (mph) LOS (mph) LOS (mph) LOS (mph) LOS (mph) LOS (mph) LOS (mph) LOS (mph) LOS (mph) LOS (mph) LOS (mph) LOS (mph) LOS (mph) LOS (mph) LOS (mph) LOS (mph) LOS (mph) LOS (mph) LOS
AM PEAK HOUR
SR 46 to St. Johns Pkwy 0.46 32.6 B 37.6 A 41.8 A 38.9 A 34.5 B 38.9 A 40.0 A
St. Johns Pkwy to Airport Blvd. 1.16 36.0 A 41.2 A 40.0 A 37.7 A 37.9 A 38.4 A 43.3 A
Airport Blvd. to CR 46A/25th St. 0.21 5.4 F 22.6 C 13.8 E 32.6 B 12.6 F 32.3 B 13.3 E 31.4 B 8.1 F 26.2 C 9.4 F 28.5 B 9.6 F 30.5 B
CR 46A 25th St. to Old Lake Mary Rd. 0.47 19.1 D 28.8 B 29.4 B 25.6 C 27.4 C 25.9 C 26.9 C
Old Lake Mary Rd. to Placid Lake Dr. 0.18 23.5 C 33.9 B 40.0 A 36.0 A 30.9 B 37.2 A 33.7 B
Placid Lake Dr. to Live Oak Blvd. 0.23 19.7 D 19.9 D 44.5 A 33.7 B 25.6 C 20.0 D 30.7 B
Live Oak Blvd. to US 17/92 0.87 23.6 C 21.6 D 31.4 B 28.6 B 23.8 C 28.2 B 21.5 D 24.8 C 21.4 D 24.1 C 23.9 C 24.7 C 23.4 C 25.9 C
US 17-92 to Windleshore Way** 0.23 33.8 B ---- ---- ---- ---- ---- ---- ---- ---- 32.0 A 33.5 A 32.7 A 34.3 A
Windleshore Way to Park Ave.*** 0.55 38.6 A ---- ---- ---- ---- ---- ---- ---- ---- 32.7 A 34.4 A 34.0 A 35.1 A
Park Ave. to CR 425/Sanford Ave. 0.23 27.4 C 34.5 B ---- ---- ---- ---- ---- ---- ---- ---- 9.7 F 21.5 C 17.6 D 28.3 B 12.2 E 24.3 B 21.3 C 30.6 A
Average NA NA 24.1 C NA NA NA NA 30.6 B 30.2 B 26.1 C 25.8 C 26.0 C 29 B
PM PEAK HOUR
SR 46 to St. Johns Pkwy 0.46 34.8 B 38.3 A 41.8 A 38.9 A 32.5 B 37.3 A 41.8 A
St. Johns Pkwy to Airport Blvd. 1.16 19.5 D 40.2 A 42.7 A 37.5 A 40.1 A 40.1 A 41.3 A
Airport Blvd. to CR 46A/25th St. 0.21 3.0 F 14.0 E 10.2 F 29.8 B 14.3 E 34.6 B 9.5 F 28.3 B 11.9 F 30.2 B 13.8 E 32.5 B 8.9 F 29.2 B
CR 46A 25th St. to Old Lake Mary Rd. 0.47 20.4 D 25.9 C 30.0 B 28.5 B 32.4 B 24.7 C 32.4 B
Old Lake Mary Rd. to Placid Lake Dr. 0.18 22.9 C 29.1 B 23.0 C 22.5 C 32.7 B 22.0 C 27.0 C
Placid Lake Dr. to Live Oak Blvd. 0.23 17.1 D 27.2 C 20.3 D 30.0 B 28.2 B 19.2 D 27.6 C
Live Oak Blvd. to US 17/92 0.87 23.6 C 21.5 D 25.5 C 26.2 C 19.5 D 22.0 C 21.1 D 23.9 C 22.1 C 25.9 C 20.6 D 21.5 D 21.5 D 25.0 C
US 17-92 to Windleshore Way** 0.23 15.3 E ---- ---- ---- ---- ---- ---- ---- ---- 33.5 A 33.5 A 32.7 A 33.5 A
Windleshore Way to Park Ave.*** 0.55 33.7 B ---- ---- ---- ---- ---- ---- ---- ---- 34.0 A 35.9 A 33.3 A 35.5 A
Park Ave. to CR 425/Sanford Ave. 0.23 29.0 B 24.6 C ---- ---- ---- ---- ---- ---- ---- ---- 11.5 E 23.8 C 15.7 D 27.7 B 17.4 D 27.7 B 15.2 D 27.2 B
Average NA NA 18.3 D NA NA NA NA 27.9 C 27.1 C 25.4 C 27.9 C 26.4 C 27.0 C
Roadway Distance
Segments (mile) (mph) LOS (mph) LOS (mph) LOS (mph) LOS (mph) LOS (mph) LOS (mph) LOS (mph) LOS (mph) LOS (mph) LOS (mph) LOS (mph) LOS (mph) LOS (mph) LOS (mph) LOS (mph) LOS (mph) LOS (mph) LOS (mph) LOS (mph) LOS
AM PEAK HOUR
CR 425/Sanford Ave. to Park Ave. 0.22 32.9 B ---- ---- ---- ---- ---- ---- ---- ---- 31.4 A 33.0 A 32.2 A 33.0 A
Park Ave. to Windleshore Way *** 0.55 39.9 A ---- ---- ---- ---- ---- ---- ---- ---- 34.7 A 35.5 A 34.7 A 37.1 A
Windleshore Way to US 17/92 ** 0.25 9.2 F 22.3 C ---- ---- ---- ---- ---- ---- ---- ---- 10.2 E 21.8 C 10.1 E 22.0 C 12.6 E 24.2 B 11.7 E 24.0 B
US 17/92 to Live Oak Blvd. 0.86 32.4 B 32.8 B 32.1 B 28.8 B 33.5 B 31.3 B 35.5 A
Live Oak Blvd. to Placid Lake Dr. 0.24 27.5 C 26.7 C 30.7 B 21.2 D 20.6 D 24.2 C 24.6 C
Placid Lake Dr. to Old Lake Mary Rd. 0.18 16.3 E 21.8 D 25.1 C 22.5 C 22.5 C 16.4 E 26.3 C
Old Lake Mary Rd. to CR 46A/25th St. 0.47 21.3 D 25.7 C 21.7 D 26.9 C 22.9 C 28.1 B 22.4 C 25.0 C 21.4 D 26.1 C 18.7 D 23.8 C 18.9 D 26.7 C
CR 46A/25th St. to Airport Blvd. 0.21 19.8 D 30.1 B 32.3 B 26.2 C 28.6 B 27.4 C 28.6 B
Airport Blvd. to St. Johns Pkwy 1.16 37.1 A 42.7 A 44.3 A 42.8 A 43.1 A 44.1 A 44.7 A
St. Johns Pkwy to SR 46 0.46 26.9 C 29.8 B 29.8 B 34.7 B 27.3 C 37.0 A 22.8 C 33.2 B 20.6 D 32.4 B 24.2 C 34.6 B 19.9 D 32.5 B
Average NA NA 26.2 C NA NA NA NA 30.4 B 32.0 B 26.8 C 27.1 C 27.3 C 28.0 B
PM PEAK HOUR
CR 425/Sanford Ave. to Park Ave. 0.22 29.9 B ---- ---- ---- ---- ---- ---- ---- ---- 30.0 B 33.0 A 32.2 A 33.8 A
Park Ave. to Windleshore Way *** 0.55 38.8 A ---- ---- ---- ---- ---- ---- ---- ---- 36.3 A 35.5 A 35.9 A 37.9 A
Windleshore Way to US 17/92 ** 0.25 8.3 F 20.9 D ---- ---- ---- ---- ---- ---- ---- ---- 8.5 F 19.9 C 8.1 F 19.5 C 12.1 E 24.0 B 8.0 F 19.9 C
US 17/92 to Live Oak Blvd. 0.86 28.0 C 31.0 B 32.3 B 32.4 B 31.4 B 35.5 A 36.0 A
Live Oak Blvd. to Placid Lake Dr. 0.24 23.1 C 34.2 B 38.3 A 33.7 B 38.3 A 33.7 B 38.3 A
Placid Lake Dr. to Old Lake Mary Rd. 0.18 23.2 C 34.2 B 30.0 B 33.7 B 22.0 C 30.0 B 38.6 A
Old Lake Mary Rd. to CR 46A/25th St. 0.47 17.1 D 22.9 C 20.2 D 27.6 C 16.6 E 25.9 C 17.7 D 26.7 C 19.3 D 26.4 C 20.6 D 29.1 B 15.2 E 26.6 C
CR 46A/25th St. to Airport Blvd. 0.21 20.7 D 25.4 C 30.7 B 27.4 C 29.3 B 22.5 C 25.7 C
Airport Blvd. to St. Johns Pkwy 1.16 33.8 B 41.6 A 44.0 A 42.8 A 42.3 A 43.3 A 45.3 A
St. Johns Pkwy to SR 46 0.46 30.5 B 30.5 B 28.3 B 32.8 B 22.3 C 34.0 B 19.2 D 31.2 B 18.3 D 30.7 B 19.2 D 30.5 B 19.9 D 32.2 B
Average NA NA 24.7 C NA NA NA NA 30.0 B 29.5 B 26.2 C 25.9 C 28.3 B 26.5 C
Note: * Till Year 2008 this segment used to be SR 46 to Academy Ave. with approximate distance of 3800 Ft.
** Till Year 2008 this segment used to be Academy Ave. to Country Club Rd. with approximate distance of 4300 Ft.
~ Till Year 2008 this segment used to be Country Club Dr. to CR 46A/25th St. with approximate distance of 900 Ft.
Note: ** Till Year 2011 this segment used to be US 17-92 to Southgate Dr.
Note: *** Till Year 2011 this segment used to be Southgate Dr. to Park Ave.
Year 2013
Rdwy Segment Rdwy Section
Average Speed Average Speed
Year 2013
Rdwy Segment Rdwy Section
UNDER CONSTRUCTION
UNDER CONSTRUCTION
Year 2011
Rdwy Segment Rdwy Section
Rdwy Segment Rdwy Section
Year 2012
Year 2012
Rdwy Segment Rdwy Section
UNDER CONSTRUCTION
UNDER CONSTRUCTION
UNDER CONSTRUCTION
UNDER CONSTRUCTION
UNDER CONSTRUCTION
UNDER CONSTRUCTION
UNDER CONSTRUCTION
UNDER CONSTRUCTION
UNDER CONSTRUCTION
UNDER CONSTRUCTION
UNDER CONSTRUCTION
UNDER CONSTRUCTION
UNDER CONSTRUCTION
UNDER CONSTRUCTION
UNDER CONSTRUCTION
UNDER CONSTRUCTION
UNDER CONSTRUCTION
UNDER CONSTRUCTION
UNDER CONSTRUCTION
UNDER CONSTRUCTION
UNDER CONSTRUCTION UNDER CONSTRUCTION
UNDER CONSTRUCTION UNDER CONSTRUCTION
UNDER CONSTRUCTION
UNDER CONSTRUCTION
UNDER CONSTRUCTION
UNDER CONSTRUCTION
UNDER CONSTRUCTION
UNDER CONSTRUCTION
UNDER CONSTRUCTION
UNDER CONSTRUCTION
UNDER CONSTRUCTION
UNDER CONSTRUCTION
UNDER CONSTRUCTION
UNDER CONSTRUCTION
UNDER CONSTRUCTION
UNDER CONSTRUCTION
UNDER CONSTRUCTION
UNDER CONSTRUCTION
UNDER CONSTRUCTION
UNDER CONSTRUCTION
UNDER CONSTRUCTION UNDER CONSTRUCTION
UNDER CONSTRUCTION UNDER CONSTRUCTION
UNDER CONSTRUCTION UNDER CONSTRUCTION
UNDER CONSTRUCTION UNDER CONSTRUCTION
UNDER CONSTRUCTION UNDER CONSTRUCTION
UNDER CONSTRUCTION UNDER CONSTRUCTION
UNDER CONSTRUCTION UNDER CONSTRUCTION
UNDER CONSTRUCTION UNDER CONSTRUCTION
UNDER CONSTRUCTION UNDER CONSTRUCTION
UNDER CONSTRUCTION UNDER CONSTRUCTION
UNDER CONSTRUCTION UNDER CONSTRUCTION
UNDER CONSTRUCTION UNDER CONSTRUCTION
UNDER CONSTRUCTION UNDER CONSTRUCTION
UNDER CONSTRUCTION UNDER CONSTRUCTION
UNDER CONSTRUCTION UNDER CONSTRUCTION
UNDER CONSTRUCTION UNDER CONSTRUCTION
UNDER CONSTRUCTION UNDER CONSTRUCTION
UNDER CONSTRUCTION UNDER CONSTRUCTION
UNDER CONSTRUCTION UNDER CONSTRUCTION
UNDER CONSTRUCTION UNDER CONSTRUCTION
UNDER CONSTRUCTION UNDER CONSTRUCTION
UNDER CONSTRUCTION UNDER CONSTRUCTION
UNDER CONSTRUCTION UNDER CONSTRUCTION
UNDER CONSTRUCTION UNDER CONSTRUCTION
UNDER CONSTRUCTION UNDER CONSTRUCTION
UNDER CONSTRUCTION UNDER CONSTRUCTION
UNDER CONSTRUCTION UNDER CONSTRUCTION
UNDER CONSTRUCTION UNDER CONSTRUCTION
UNDER CONSTRUCTION UNDER CONSTRUCTION
UNDER CONSTRUCTION UNDER CONSTRUCTION
UNDER CONSTRUCTION
UNDER CONSTRUCTION UNDER CONSTRUCTION
UNDER CONSTRUCTION UNDER CONSTRUCTION
UNDER CONSTRUCTION UNDER CONSTRUCTION
Year 2014
Year 2011 Year 2014
TABLE C1.1aYear 2014 Seminole County Travel Time & Delay Study
Airport Boulevard/MLK Jr. Boulevard - Eastbound Direction Historical Summary
TABLE C1.1b
Year 2014 Seminole County Travel Time & Delay Study
Airport Boulevard/MLK Jr. Boulevard - Westbound Direction Historical Summary
UNDER CONSTRUCTION UNDER CONSTRUCTION
UNDER CONSTRUCTION UNDER CONSTRUCTION
UNDER CONSTRUCTION UNDER CONSTRUCTION
UNDER CONSTRUCTION UNDER CONSTRUCTION
UNDER CONSTRUCTION
Year 2005 Year 2006 Year 2007 Year 2008 Year 2009 Year 2010
Average Speed Average Speed Average Speed Average Speed Average Speed Average Speed Average Speed Average Speed Average Speed Average Speed Average Speed Average Speed Average Speed Average Speed Average Speed Average Speed
Rdwy Segment Rdwy Section
Average Speed Average Speed
Year 2005 Year 2006 Year 2007 Year 2008 Year 2009 Year 2010
Average Speed Average Speed Average Speed Average Speed Average Speed Average Speed Average Speed Average Speed Average Speed Average Speed Average Speed Average Speed Average Speed Average Speed Average Speed Average SpeedAverage Speed Average Speed
D-1 Airport Boulevard/MLK Jr. Boulevard
Roadway Distance
Segments (mile) (mph) LOS (mph) LOS (mph) LOS (mph) LOS (mph) LOS (mph) LOS (mph) LOS (mph) LOS (mph) LOS (mph) LOS (mph) LOS (mph) LOS (mph) LOS (mph) LOS (mph) LOS (mph) LOS (mph) LOS (mph) LOS (mph) LOS (mph) LOS
AM PEAK HOUR
CR 427 to Continental Blvd.** 0.17 28.0 B 30.6 A 30.8 A 29.7 B 30.1 A 36.4 A 32.9 A 34.0 A 30.0 B 31.9 A
Continental Blvd. to North Rd.** 0.30 37.1 A 39.2 A 35.0 A 39.3 A 39.6 A 40.0 A 38.3 A 36.7 A 35.3 A 39.1 A
North Rd. to Main Rd.** 0.51 37.8 A 41.6 A 36.0 A 37.7 A 39.1 A 39.0 A 36.1 A 36.9 A 36.0 A 36.9 A
Main Rd. to Broadmoor Rd.** 0.26 32.1 A 34.6 A 30.6 A 36.7 A 30.8 A 33.8 A 30.9 A 35.1 A 33.9 A 36.6 A 31.2 A 37.0 A 30.0 B 34.7 A 27.9 B 34.1 A 29.4 B 33.4 A 32.5 A 35.6 A
Broadmoor Rd. to Evansdale Rd.** 0.38 26.9 B 28.5 B 30.7 A 30.8 A 32.0 A 29.2 B 25.6 B 26.5 B 27.5 B 28.5 B
Evansdale Rd. to Lake Mary Blvd.** 0.40 12.2 E 16.7 D 14.5 D 19.1 C 11.5 E 16.7 D 10.6 E 15.6 D 15.4 D 20.8 C 17.9 D 22.1 C 15.1 D 18.9 C 10.5 E 14.9 D 17.4 D 21.2 C 12.4 E 17.1 D
Lake Mary Blvd. to Crystal Lake Dr.** 0.19 26.5 B 30.0 A 25.5 B 26.8 B 28.3 B 31.7 A 25.3 B 27.8 B 30.0 B 27.8 B
Crystal Lake Dr. to Rantoul Ln.** 0.87 29.3 B 28.8 B 32.0 A 31.6 A 33.4 A 31.5 A 35.5 A 33.4 A 34.9 A 33.4 A 32.7 A 32.5 A 32.9 A 31.2 A 33.7 A 32.4 A 33.7 A 33.0 A 33.0 A 32.0 A
Rantoul Ln. to CR 46A W.** 1.24 ---- ---- ---- ---- ---- ---- ---- ---- ---- ---- ---- ---- 31.9 A 31.9 A 31.1 A 31.1 A 31.7 A 31.7 A
CR 46A W to CR 46A E.** 0.10 ---- ---- ---- ---- ---- ---- ---- ---- ---- ---- ---- ---- 30.2 A 27.3 B 27.3 B 28.4 B 28.4 B 27.9 B 27.9 B 8.2 F 8.2 F 12.2 E 12.2 E 8.7 F 8.7 F
CR 46A to Briarwood Dr.** 0.16 ---- ---- ---- ---- ---- ---- ---- ---- ---- ---- ---- ---- 13.9 E 13.1 E 31.0 A 28.2 B 29.1 B 33.1 A 27.4 B
Briarwood Dr. to Central Park Dr.** 0.78 ---- ---- ---- ---- ---- ---- ---- ---- ---- ---- ---- ---- 34.8 A 36.2 A 33.2 A 32.8 A 34.7 A 33.4 A 35.7 A 34.4 A 37.1 A 36.4 A 35.5 A 33.8 A
Central Park Dr. to St. Johns Pkwy.** 0.66 ---- ---- ---- ---- ---- ---- ---- ---- ---- ---- ---- ---- 32.4 A 32.9 A 31.2 A 31.2 A 28.7 B 28.7 B 28.7 B 28.7 B 32.7 A 32.7 A 24.3 B 24.3 B
St. Johns Pkwy to SR 46** 0.52 ---- ---- ---- ---- ---- ---- ---- ---- ---- ---- ---- ---- 16.1 D 23.1 C 26.3 B 16.8 D 16.8 D 15.2 D 15.2 D 20.9 C 20.9 C 20.1 C 20.1 C 17.7 D 17.7 D
SR 46 to Orange Blvd.** 1.15 ---- ---- ---- ---- ---- ---- ---- ---- ---- ---- ---- ---- 35.6 A 28.1 B 35.8 A 35.8 A 34.2 A 34.2 A 37.9 A 37.9 A 36.3 A 36.3 A 38.1 A 38.1 A
Orange Blvd. to US 17/92** 0.31 ---- ---- ---- ---- ---- ---- ---- ---- ---- ---- ---- ---- ---- ---- ---- ---- ---- ---- ---- ---- 36.5 A 36.5 A 16.3 D 16.3 D 13.6 E 13.6 E 10.2 E 10.2 E 19.2 C 19.2 C
Average 25.9 B 28.5 B 26.4 B 27.4 B 28.1 B 29.6 B 26.9 B 26.6 B 27.8 B 27.1 B
PM PEAK HOUR
CR 427 to Continental Blvd.** 0.17 27.3 B 31.0 A 30.5 A 28.9 B 26.6 B 36.4 A 32.9 A 32.9 A 31.9 A 35.2 A
Continental Blvd. to North Rd.** 0.30 37.0 A 39.1 A 38.1 A 41.4 A 40.7 A 40.0 A 38.3 A 40.9 A 39.1 A 37.5 A
North Rd. to Main Rd.** 0.51 36.9 A 41.1 A 38.1 A 40.1 A 39.2 A 39.0 A 37.0 A 38.7 A 38.2 A 36.9 A
Main Rd. to Broadmoor Rd.** 0.26 33.8 A 34.5 A 35.3 A 37.8 A 31.3 A 35.3 A 35.3 A 37.3 A 36.3 A 36.5 A 35.7 A 38.1 A 35.7 A 36.4 A 35.5 A 37.6 A 15.1 D 28.5 B 36.3 A 36.6 A
Broadmoor Rd. to Evansdale Rd.** 0.38 32.2 A 28.7 B 32.6 A 33.6 A 36.0 A 35.1 A 33.0 A 35.6 A 29.6 B 35.6 A
Evansdale Rd. to Lake Mary Blvd.** 0.40 10.3 E 15.5 D 12.1 E 16.9 D 13.7 E 19.2 C 9.6 F 14.9 D 9.1 F 14.5 D 11.1 E 16.7 D 8.6 F 13.5 E 15.1 D 21.0 C 10.9 E 15.8 D 12.9 E 18.7 C
Lake Mary Blvd. to Crystal Lake Dr.** 0.19 27.5 B 26.8 B 26.6 B 26.5 B 27.3 B 27.8 B 28.5 B 27.1 B 26.5 B 27.8 B
Crystal Lake Dr. to Rantoul Ln.** 0.87 31.3 A 30.5 A 32.5 A 31.3 A 33.2 A 31.8 A 33.5 A 31.9 A 34.7 A 33.0 A 32.9 A 31.8 A 34.4 A 33.2 A 32.6 A 31.5 A 32.8 A 31.5 A 33.2 A 32.1 A
Rantoul Ln. to CR 46A W.** 1.24 ---- ---- ---- ---- ---- ---- ---- ---- ---- ---- ---- ---- 24.6 B 31.2 A 31.2 A 24.5 B 24.5 B 26.9 B 26.9 B 31.0 A 31.0 A 27.2 B 27.2 B 30.1 A 30.1 A
CR 46A W to CR 46A E.** 0.10 ---- ---- ---- ---- ---- ---- ---- ---- ---- ---- ---- ---- 9.8 F 9.8 F 11.8 E 11.8 E 8.5 F 8.5 F
CR 46A to Briarwood Dr.** 0.16 ---- ---- ---- ---- ---- ---- ---- ---- ---- ---- ---- ---- 27.1 B 19.9 C 30.0 B 31.0 A 28.2 B 30.0 B 27.4 B
Briarwood Dr. to Central Park Dr.** 0.78 ---- ---- ---- ---- ---- ---- ---- ---- ---- ---- ---- ---- 35.3 A 33.9 A 37.7 A 36.2 A 35.7 A 34.8 A 33.4 A 32.4 A 36.6 A 35.2 A 36.0 A 34.2 A
Central Park Dr. to St. Johns Pkwy.** 0.66 ---- ---- ---- ---- ---- ---- ---- ---- ---- ---- ---- ---- 32.6 A 30.8 A 33.3 A 33.3 A 24.1 B 24.1 B 26.2 B 26.2 B 23.7 C 23.7 C 27.3 B 27.3 B
St. Johns Pkwy to SR 46** 0.52 ---- ---- ---- ---- ---- ---- ---- ---- ---- ---- ---- ---- 16.2 D 19.1 C 26.2 B 12.0 E 12.0 E 11.7 E 11.7 E 11.9 E 11.9 E 21.1 C 21.1 C 17.1 D 17.1 D
SR 46 to Orange Blvd.** 1.15 ---- ---- ---- ---- ---- ---- ---- ---- ---- ---- ---- ---- 22.4 C 24.7 B 36.2 A 36.2 A 37.2 A 37.2 A 38.5 A 38.5 A 21.9 C 21.9 C 16.4 D 16.4 D
Orange Blvd. to US 17/92** 0.31 ---- ---- ---- ---- ---- ---- ---- ---- ---- ---- ---- ---- ---- ---- ---- ---- ---- ---- ---- ---- 32.1 A 32.1 A 11.6 E 11.6 E 14.1 D 14.1 D 21.6 C 21.6 C 23.2 C 23.2 C
Average 25.6 B 27.3 B 28.3 B 25.2 B 26.8 B 26.8 B 24.2 B 26.3 B 24.5 B 24.5 B
Note: *From the year 2012, additional control point has been added at CR 46A W.
Note: ** CR 15 was under limited construction (resurfacing and more) during the 2012 study.
UNDER CONSTRUCTION
UNDER CONSTRUCTION
TABLE C2.1aYear 2014 Seminole County Travel Time & Delay Study
CR 15 - Northbound Direction Historical Summary
Year 2014Year 2005 Year 2006 Year 2007 Year 2008 Year 2009 Year 2010 Year 2011
Average Speed Average Speed Average Speed Average Speed Average SpeedAverage Speed Average Speed Average Speed Average Speed Average SpeedAverage Speed Average Speed Average Speed Average Speed Average Speed Average Speed
Year 2012
Rdwy Segment Rdwy Section
Average Speed Average Speed
Rdwy Section
Year 2013
Average Speed Average Speed
D-2 CR 15 - NB
Roadway Distance
Segments (mile) (mph) LOS (mph) LOS (mph) LOS (mph) LOS (mph) LOS (mph) LOS (mph) LOS (mph) LOS (mph) LOS (mph) LOS (mph) LOS (mph) LOS (mph) LOS (mph) LOS (mph) LOS (mph) LOS (mph) LOS (mph) LOS (mph) LOS (mph) LOS
AM PEAK HOUR
US 17/92 to Orange Blvd.** 0.31 ---- ---- ---- ---- ---- ---- ---- ---- ---- ---- ---- ---- ---- ---- ---- ---- ---- ---- ---- ---- 24.2 B 24.2 B 19.4 C 19.4 C 21.4 C 21.4 C 25.1 B 25.1 B 21.6 C 21.6 C
Orange Blvd. to SR 46** 1.15 ---- ---- ---- ---- ---- ---- ---- ---- ---- ---- ---- ---- 21.6 C 28.7 B 28.7 B 32.7 A 32.7 A 29.9 B 29.9 B 27.6 B 27.6 B 26.7 B 26.7 B
SR 46 to St. Johns Pkwy.** 0.52 ---- ---- ---- ---- ---- ---- ---- ---- ---- ---- ---- ---- 24.8 B 22.8 C 26.5 B 26.5 B 24.7 B 24.7 B 26.0 B 26.0 B 26.7 B 26.7 B 23.6 C 23.6 C
St. Johns Pkwy. to Central Park Dr.** 0.66 ---- ---- ---- ---- ---- ---- ---- ---- ---- ---- ---- ---- 29.2 B 30.7 A 35.1 A 35.1 A 34.8 A 34.8 A 35.7 A 35.7 A 32.2 A 32.2 A 33.8 A 33.8 A
Central Park Dr. to Briarwood Dr.** 0.78 ---- ---- ---- ---- ---- ---- ---- ---- ---- ---- ---- ---- 30.3 A 35.1 A 33.0 A 35.5 A 31.4 A 34.7 A 36.6 A
Briarwood Dr. to CR 46A E.** 0.16 ---- ---- ---- ---- ---- ---- ---- ---- ---- ---- ---- ---- 16.7 D 21.5 C 28.6 B 16.6 D 28.2 B 16.6 D 29.7 B 16.3 D 27.1 B 16.3 D 29.1 B 19.6 C 31.9 A
CR 46A E to CR 46A W.** 0.10 ---- ---- ---- ---- ---- ---- ---- ---- ---- ---- ---- ---- 18.2 C 18.2 C 20.7 C 20.7 C 14.3 D 14.3 D
CR 46A W to Rantoul Ln.** 1.24 ---- ---- ---- ---- ---- ---- ---- ---- ---- ---- ---- ---- 30.4 A 24.2 B 24.2 B 29.3 B 29.3 B 29.2 B 29.2 B 31.4 A 31.4 A 29.3 B 29.3 B 30.7 A 30.7 A
Rantoul Ln. to Crystal Lake Dr.** 0.87 32.5 A 34.4 A 32.3 A 31.9 A 26.1 B 31.0 A 33.7 A 30.4 A 30.7 A 30.2 A 32.8 A
Crystal Lake Dr. to Lake Mary Blvd.** 0.19 5.2 F 17.5 D 5.2 F 17.7 D 3.4 F 13.5 E 5.2 F 17.3 D 6.8 F 19.6 C 4.9 F 16.2 D 4.7 F 15.4 D 7.0 F 19.2 C 5.2 F 16.2 D 6.0 F 18.2 C
Lake Mary Blvd. to Evansdale Rd.** 0.40 15.0 D 25.8 B 26.0 B 25.8 B 18.9 C 28.6 B 25.3 B 24.5 B 26.4 B 24.7 B
Evansdale Rd. to Broadmoor Rd.** 0.38 26.5 B 18.9 C 29.2 B 27.3 B 29.3 B 27.5 B 30.4 A 27.8 B 33.1 A 23.8 C 31.7 A 30.0 B 28.1 B 26.6 B 25.1 B 24.8 B 28.1 B 27.2 B 28.1 B 26.3 B
Broadmoor Rd. to Main Rd.** 0.26 32.9 A 34.1 A 32.8 A 32.9 A 37.3 A 33.3 A 28.8 B 30.0 B 31.2 A 32.5 A
Main Rd. to North Rd.** 0.51 37.7 A 39.2 A 37.0 A 40.9 A 39.2 A 39.0 A 33.7 A 38.2 A 40.3 A 38.2 A
North Rd. to Continental Blvd.** 0.30 36.5 A 39.4 A 37.8 A 41.9 A 39.5 A 40.0 A 36.7 A 37.5 A 39.1 A 38.3 A
Continental Blvd. to CR 427** 0.17 13.6 E 30.0 B 14.6 D 31.7 A 21.5 C 33.2 A 14.0 D 32.1 A 14.0 D 34.0 A 12.6 E 29.5 B 16.2 D 28.9 B 11.7 E 27.9 B 11.3 E 28.4 B 18.5 C 32.3 A
Average 21.5 C 24.2 B 21.5 C 25.3 B 25.9 B 26.4 B 25.8 B 26.4 B 25.7 B 26.5 B
PM PEAK HOUR
US 17/92 to Orange Blvd.** 0.31 ---- ---- ---- ---- ---- ---- ---- ---- ---- ---- ---- ---- ---- ---- ---- ---- ---- ---- ---- ---- 26.2 B 26.2 B 23.8 C 23.8 C 22.7 C 22.7 C 23.0 C 23.0 C 9.2 F 9.2 F
Orange Blvd. to SR 46** 1.15 ---- ---- ---- ---- ---- ---- ---- ---- ---- ---- ---- ---- 28.0 B 25.8 B 25.8 B 27.7 B 27.7 B 25.1 B 25.1 B 20.1 C 20.1 C 27.4 B 27.4 B
SR 46 to St. Johns Pkwy.** 0.52 ---- ---- ---- ---- ---- ---- ---- ---- ---- ---- ---- ---- 19.9 C 22.1 C 17.9 D 17.9 D 18.5 C 18.5 C 16.7 D 16.7 D 22.3 C 22.3 C 20.0 C 20.0 C
St. Johns Pkwy. to Central Park Dr.** 0.66 ---- ---- ---- ---- ---- ---- ---- ---- ---- ---- ---- ---- 34.2 A 32.9 A 35.1 A 35.1 A 35.1 A 35.1 A 32.7 A 32.7 A 33.6 A 33.6 A 34.1 A 34.1 A
Central Park Dr. to Briarwood Dr.** 0.78 ---- ---- ---- ---- ---- ---- ---- ---- ---- ---- ---- ---- 34.8 A 35.0 A 33.2 A 33.9 A 33.2 A 29.6 B 33.7 A
Briarwood Dr. to CR 46A E.** 0.16 ---- ---- ---- ---- ---- ---- ---- ---- ---- ---- ---- ---- 26.1 B 20.5 C 28.7 B 17.8 D 28.9 B 22.3 C 31.2 A 25.3 B 31.5 A 24.6 B 28.6 B 13.3 E 26.7 B
CR 46A E to CR 46A W.** 0.10 ---- ---- ---- ---- ---- ---- ---- ---- ---- ---- ---- ---- 15.8 D 15.8 D 18.2 C 18.2 C 16.2 D 16.2 D
CR 46A W to Rantoul Ln.** 1.24 ---- ---- ---- ---- ---- ---- ---- ---- ---- ---- ---- ---- 29.5 B 28.6 B 25.3 B 25.3 B 27.6 B 27.6 B 24.0 C 24.0 C 28.5 B 28.5 B 29.8 B 29.8 B 32.5 A 32.5 A
Rantoul Ln. to Crystal Lake Dr.** 0.87 32.4 A 34.3 A 34.6 A 34.1 A 31.5 A 31.1 A 32.2 A 33.0 A 16.6 D 32.4 A
Crystal Lake Dr. to Lake Mary Blvd.** 0.19 8.5 F 22.1 C 5.7 F 18.6 C 5.2 F 17.9 D 7.6 F 21.6 C 8.5 F 21.8 C 6.0 F 17.7 D 4.7 F 15.6 D 7.0 F 19.8 C 6.6 F 13.1 E 6.1 F 18.3 C
Lake Mary Blvd. to Evansdale Rd.** 0.40 30.4 A 27.8 B 28.8 B 24.0 C 22.1 C 32.0 A 32.9 A 25.8 B 33.3 A 28.9 B
Evansdale Rd. to Broadmoor Rd.** 0.38 32.9 A 31.6 A 32.7 A 30.0 B 34.9 A 31.4 A 30.7 A 26.8 B 33.2 A 26.3 B 33.0 A 32.5 A 34.5 A 33.7 A 33.5 A 29.1 B 32.6 A 33.0 A 34.0 A 31.2 A
Broadmoor Rd. to Main Rd.** 0.26 33.7 A 34.2 A 37.1 A 34.2 A 36.9 A 34.9 A 36.6 A 35.5 A 33.9 A 36.3 A
Main Rd. to North Rd.** 0.51 36.6 A 36.8 A 40.9 A 38.4 A 40.1 A 38.0 A 38.5 A 38.7 A 24.9 B 37.3 A
North Rd. to Continental Blvd.** 0.30 37.3 A 37.2 A 38.0 A 37.4 A 36.9 A 38.3 A 40.0 A 39.1 A 32.1 A 37.5 A
Continental Blvd. to CR 427** 0.17 29.1 B 35.1 A 13.2 E 29.8 B 23.5 C 36.2 A 21.6 C 34.1 A 15.3 D 32.5 A 13.2 E 29.8 B 17.9 D 33.1 A 13.2 E 30.2 A 13.8 E 24.9 B 7.9 F 24.6 B
Average 28.1 B 24.8 B 26.1 B 21.5 C 26.9 B 25.7 B 25.3 B 25.6 B 23.0 C 24.0 C
Note: *From the year 2012, additional control point has been added at CR 46A W.
Note: ** CR 15 was under limited construction (resurfacing and more) during the 2012 study.
UNDER CONSTRUCTION
TABLE C2.1bYear 2014 Seminole County Travel Time & Delay Study
CR 15 - Southbound Direction Historical Summary
Year 2014
UNDER CONSTRUCTION
Year 2005 Year 2006 Year 2007 Year 2008 Year 2009 Year 2010 Year 2011
Average Speed Average Speed Average Speed Average Speed Average SpeedAverage Speed Average Speed Average Speed Average Speed Average SpeedAverage Speed Average Speed Average Speed Average Speed Average Speed Average Speed
Year 2012
Rdwy Segment Rdwy Section
Average Speed Average Speed
Rdwy Section
Year 2013
Average Speed Average Speed
D-3 CR 15 - SB
Roadway Distance
Segments (mile) (mph) LOS (mph) LOS (mph) LOS (mph) LOS (mph) LOS (mph) LOS (mph) LOS (mph) LOS (mph) LOS (mph) LOS (mph) LOS (mph) LOS (mph) LOS (mph) LOS (mph) LOS (mph) LOS (mph) LOS (mph) LOS (mph) LOS (mph) LOS
AM PEAK HOUR
Montgomery Rd. to Marion Ave. 0.24 29.8 B 31.1 A 32.8 A 31.1 A 27.9 B 32.6 A 22.1 C 31.2 A 30.6 A 23.8 C
Marion Ave. to Franklin Ave. 0.25 36.8 A 35.0 A 39.6 A 39.9 A 35.3 A 36.6 A 33.3 A 35.7 A 34.1 A 34.1 A
Franklin Ave. to Douglas Ave. 0.25 12.5 E 21.4 C 10.5 E 19.3 C 12.8 E 22.8 C 9.2 F 18.3 C 9.0 F 16.9 D 9.6 F 18.4 C 9.3 F 16.4 D 11.3 E 20.2 C 9.2 F 17.6 D 8.2 F 15.6 D
Douglas Ave. to Raymond Ave. 0.23 29.4 B 31.3 A 31.0 A 29.2 B 32.9 A 33.5 A 32.1 A 32.1 A 28.7 B 29.4 B
Raymond Ave. to Center Pointe Dr. 0.29 25.5 B 36.4 A 33.5 A 32.8 A 30.0 B 31.8 A 34.8 A 31.6 A 32.8 A 32.8 A
Center Pointe Dr. to Cranes Roost Blvd. 0.21 28.3 B 30.5 A 29.9 B 28.4 B 30.2 A 34.7 A 30.0 B 28.0 B 28.6 B 29.3 B
Cranes Roost Blvd. to One Center Blvd. 0.23 34.3 A 34.8 A 33.5 A 36.0 A 32.2 A 33.2 A 33.7 A 33.7 A 31.4 A 32.9 A
One Center Blvd. to Palm Springs Dr. 0.15 17.2 D 26.6 B 10.3 E 25.4 B 19.7 C 29.7 B 23.9 C 30.2 A 15.8 D 27.7 B 6.7 F 22.2 C 12.6 E 26.7 B 12.0 E 25.5 B 20.0 C 28.4 B 14.5 D 26.8 B
Average 24.2 B 22.6 C 26.5 B 23.9 C 22.1 C 20.5 C 21.3 C 23.0 C 22.8 C 21 C
PM PEAK HOUR
Montgomery Rd. to Marion Ave. 0.24 32.0 A 33.7 A 30.6 A 31.9 A 30.1 A 30.6 A 23.4 C 31.9 A 30.0 B 31.9 A
Marion Ave. to Franklin Ave. 0.25 39.5 A 40.7 A 36.0 A 40.0 A 35.3 A 34.9 A 34.1 A 34.9 A 32.6 A 34.9 A
Franklin Ave. to Douglas Ave. 0.25 8.2 F 17.0 D 10.4 E 20.0 C 6.6 F 14.4 D 8.2 F 17.1 D 8.3 F 16.3 D 11.1 E 19.8 C 10.6 E 18.0 D 6.7 F 14.4 D 7.5 F 15.2 D 8.3 F 16.7 D
Douglas Ave. to Raymond Ave. 0.23 28.3 B 30.3 A 26.6 B 20.9 C 31.6 A 30.6 A 31.4 A 28.7 B 26.5 B 27.1 B
Raymond Ave. to Center Pointe Dr. 0.29 31.2 A 27.5 B 32.9 A 35.3 A 32.1 A 25.7 B 30.0 B 30.0 B 30.0 B 27.6 B
Center Pointe Dr. to Cranes Roost Blvd. 0.21 28.4 B 24.5 B 27.1 B 25.1 B 29.8 B 20.3 C 22.5 C 17.0 D 25.7 B 25.7 B
Cranes Roost Blvd. to One Center Blvd. 0.23 33.2 A 35.1 A 23.6 C 35.0 A 32.8 A 33.9 A 33.7 A 32.1 A 31.4 A 32.1 A
One Center Blvd. to Palm Springs Dr. 0.15 6.5 F 20.5 C 15.2 D 25.9 B 21.0 C 26.4 B 32.4 A 28.5 B 20.3 C 29.5 B 12.7 E 23.6 C 14.1 D 25.2 B 15.2 D 23.5 C 18.5 C 26.4 B 19.2 C 26.2 B
Average 19.0 C 23.2 C 19.8 C 22.5 C 22.3 C 21.9 C 21.7 C 18.7 C 20.4 C 21.3 C
Roadway Distance
Segments (mile) (mph) LOS (mph) LOS (mph) LOS (mph) LOS (mph) LOS (mph) LOS (mph) LOS (mph) LOS (mph) LOS (mph) LOS (mph) LOS (mph) LOS (mph) LOS (mph) LOS (mph) LOS (mph) LOS (mph) LOS (mph) LOS (mph) LOS (mph) LOS
AM PEAK HOUR
Palm Springs Dr. to One Center Blvd. 0.16 26.3 B 28.4 B 28.7 B 27.2 B 24.3 B 18.3 C 20.9 C 29.1 B 25.9 B 27.4 B
One Center Blvd. to Cranes Roost Blvd. 0.22 32.3 A 32.1 A 37.5 A 36.6 A 27.3 B 38.0 A 33.7 A 32.1 A 30.0 B 23.8 C
Cranes Roost Blvd. to Center Pointe Dr. 0.22 29.9 B 32.4 A 37.9 A 33.5 A 25.6 B 8.4 F 27.4 B 27.4 B 22.1 C 24.7 B
Center Pointe Dr. to Raymond Ave. 0.29 32.0 A 32.9 A 38.3 A 33.4 A 31.2 A 37.7 A 29.5 B 27.2 B 28.1 B 28.5 B
Raymond Ave. to Douglas Ave. 0.24 10.3 E 21.7 C 25.4 B 30.1 A 12.5 E 25.7 B 17.8 D 27.9 B 13.8 E 22.6 C 28.2 B 20.1 C 9.1 F 19.6 C 17.2 D 25.3 B 13.3 E 22.0 C 8.0 F 17.8 D
Douglas Ave. to Franklin Ave. 0.24 34.5 A 36.4 A 38.1 A 39.3 A 35.0 A 39.5 A 34.1 A 34.9 A 34.9 A 34.9 A
Franklin Ave. to Marion Ave. 0.25 34.9 A 37.3 A 39.4 A 37.1 A 35.2 A 33.3 A 34.1 A 34.9 A 32.6 A 34.9 A
Marion Ave. to Montgomery Rd. 0.25 10.0 E 19.4 C 16.1 D 26.2 B 30.6 A 35.8 A 28.4 B 34.4 A 13.8 E 23.8 C 11.9 E 21.5 C 11.1 E 20.2 C 14.9 D 24.1 B 30.6 A 32.6 A 16.1 D 25.1 B
Average 20.7 C 28.4 B 28.9 B 30.1 A 23.1 C 20.6 C 19.8 C 24.8 B 25.3 B 20.2 C
PM PEAK HOUR
Palm Springs Dr. to One Center Blvd. 0.16 27.8 B 30.7 A 27.0 B 29.7 B 27.2 B 26.2 B 23.4 C 26.7 B 25.9 B 26.7 B
One Center Blvd. to Cranes Roost Blvd. 0.22 26.5 B 29.7 B 37.8 A 33.2 A 26.7 B 32.5 A 33.7 A 27.1 B 22.6 C 25.1 B
Cranes Roost Blvd. to Center Pointe Dr. 0.22 29.3 B 33.7 A 29.9 B 28.2 B 27.2 B 32.2 A 20.3 C 22.9 C 22.9 C 28.6 B
Center Pointe Dr. to Raymond Ave. 0.29 25.2 B 33.5 A 28.4 B 35.5 A 32.4 A 31.8 A 30.5 A 24.9 B 23.2 C 25.2 B
Raymond Ave. to Douglas Ave. 0.24 9.8 F 19.6 C 7.9 F 19.6 C 6.7 F 17.3 D 7.8 F 19.3 C 16.6 D 24.8 B 8.2 F 19.5 C 6.4 F 16.2 D 7.8 F 17.3 D 6.7 F 15.5 D 9.1 F 18.9 C
Douglas Ave. to Franklin Ave. 0.24 33.6 A 36.2 A 31.0 A 32.2 A 35.1 A 34.1 A 34.9 A 34.9 A 32.6 A 34.9 A
Franklin Ave. to Marion Ave. 0.25 35.3 A 36.7 A 33.3 A 23.6 C 34.3 A 34.9 A 34.9 A 33.3 A 31.2 A 33.3 A
Marion Ave. to Montgomery Rd. 0.25 15.2 D 24.6 B 8.8 F 18.5 C 15.3 D 23.7 C 13.8 E 20.9 C 12.8 E 22.5 C 11.2 E 20.4 C 10.2 E 19.3 C 19.0 C 26.9 B 21.1 C 27.3 B 12.1 E 21.2 C
Average 21.3 C 19.1 C 19.4 C 19.9 C 23.8 C 19.8 C 17.3 D 20.2 C 18.7 C 19.8 C
Year 2013
Rdwy Segment Rdwy Section
Average Speed Average Speed
Year 2013
Rdwy Segment Rdwy Section
Average Speed Average Speed
TABLE C3.1aYear 2014 Seminole County Travel Time & Delay Study
Central Parkway - Eastbound Direction Historical Summary
TABLE C3.1b
Year 2014Year 2005 Year 2006 Year 2007 Year 2008 Year 2009 Year 2010 Year 2011
Average Speed Average Speed Average Speed Average Speed Average SpeedAverage Speed Average Speed Average Speed Average Speed Average Speed Average Speed
Year 2012
Rdwy Segment Rdwy Section
Average Speed Average Speed
Year 2012
Rdwy Segment Rdwy Section
Average Speed Average Speed
Rdwy Section
Year 2014
Year 2014 Seminole County Travel Time & Delay StudyCentral Parkway - Westbound Direction Historical Summary
Segments (mile) (mph) LOS (mph) LOS (mph) LOS (mph) LOS (mph) LOS (mph) LOS (mph) LOS (mph) LOS (mph) LOS (mph) LOS (mph) LOS (mph) LOS (mph) LOS (mph) LOS (mph) LOS (mph) LOS (mph) LOS (mph) LOS (mph) LOS (mph) LOS
AM PEAK HOUR
SR 426 to Woodpecker Ln. 0.30 ---- ---- ---- ---- ---- ---- ---- ---- ---- ---- ---- ---- 27.3 C 30.6 B 30.0 B 32.1 B 23.5 C 34.4 B 35.1 A
Woodpecker Ln. to Wembley Pl. 0.35 ---- ---- ---- ---- ---- ---- ---- ---- ---- ---- ---- ---- 38.9 A 32.5 B 38.3 A 34.2 B 29.2 B 29.5 B 35.8 A 33.9 B 32.9 B 27.7 C 38.5 A 36.4 A 40.8 A 37.9 A
Wembley Pl. to SR 434 0.91 ---- ---- ---- ---- ---- ---- ---- ---- ---- ---- ---- ---- 21.3 D 21.3 D 30.8 B 30.8 B 23.5 C 23.5 C 19.0 D 19.0 D 18.4 D 18.4 D 18.6 D 18.6 D 18.8 D 18.8 D
Average 24.9 C 32.2 B 25.7 C 23.3 C 21.4 D 23.4 C 23.8 C
PM PEAK HOUR
SR 426 to Woodpecker Ln. 0.30 ---- ---- ---- ---- ---- ---- ---- ---- ---- ---- ---- ---- 20.5 D 28.1 B 26.5 C 28.2 B 23.0 C 28.2 B 31.5 B
Woodpecker Ln. to Wembley Pl. 0.35 ---- ---- ---- ---- ---- ---- ---- ---- ---- ---- ---- ---- 35.6 A 26.5 C 37.2 A 32.2 B 41.2 A 32.8 B 37.8 A 32.5 B 32.9 B 27.3 C 38.5 A 32.8 B 39.2 A 35.1 A
Wembley Pl. to SR 434 0.91 ---- ---- ---- ---- ---- ---- ---- ---- ---- ---- ---- ---- 20.8 D 20.8 D 28.5 B 28.5 B 23.6 C 23.6 C 19.8 D 19.8 D 17.0 E 17.0 E 26.8 C 26.8 C 21.8 D 21.8 D
Average 22.8 C 29.9 B 26.7 C 23.6 C 20.1 D 29.0 B 25.9 C
Roadway Distance
Segments (mile) (mph) LOS (mph) LOS (mph) LOS (mph) LOS (mph) LOS (mph) LOS (mph) LOS (mph) LOS (mph) LOS (mph) LOS (mph) LOS (mph) LOS (mph) LOS (mph) LOS (mph) LOS (mph) LOS (mph) LOS (mph) LOS (mph) LOS (mph) LOS
AM PEAK HOUR
SR 434 to Wembley Pl. 0.91 ---- ---- ---- ---- ---- ---- ---- ---- ---- ---- ---- ---- 35.9 A 35.9 A 35.0 A 35.0 A 41.4 A 41.4 A 35.9 A 35.9 A 31.7 B 31.7 B 37.1 A 37.1 A 33.1 B 33.1 B
Wembley Pl. to Woodpecker Ln. 0.35 ---- ---- ---- ---- ---- ---- ---- ---- ---- ---- ---- ---- 27.3 C 34.9 B 33.9 B 37.1 A 28.3 B 37.8 A 39.2 A
Woodpecker Ln. to SR 426 0.30 ---- ---- ---- ---- ---- ---- ---- ---- ---- ---- ---- ---- 18.7 D 22.5 C 12.6 F 19.3 D 11.8 F 18.1 D 15.8 E 22.5 C 16.0 E 20.7 D 10.2 F 16.5 E 9.9 F 16.2 E
Average 28.8 B 26.3 C 27.0 C 28.8 B 26.0 C 24.4 C 23.1 C
PM PEAK HOUR
SR 434 to Wembley Pl. 0.91 ---- ---- ---- ---- ---- ---- ---- ---- ---- ---- ---- ---- 27.9 C 27.9 C 36.9 A 36.9 A 40.7 A 40.7 A 38.4 A 38.4 A 33.3 B 33.3 B 37.1 A 37.1 A 36.6 A 36.6 A
Wembley Pl. to Woodpecker Ln. 0.35 ---- ---- ---- ---- ---- ---- ---- ---- ---- ---- ---- ---- 27.6 C 38.3 A 35.6 A 34.0 B 27.9 C 35.2 A 34.0 B
Woodpecker Ln. to SR 426 0.30 ---- ---- ---- ---- ---- ---- ---- ---- ---- ---- ---- ---- 12.2 F 17.4 D 13.9 E 21.1 D 10.6 F 17.0 D 13.8 E 20.0 D 9.0 F 14.0 E 11.2 F 17.4 D 13.6 E 19.8 D
Average 22.3 C 28.3 B 25.8 C 27.8 C 21.1 D 25.2 C 27.1 C
Year 2013
Rdwy Segment Rdwy Section
Average Speed Average Speed
Year 2013
Rdwy Segment Rdwy Section
Average Speed Average Speed
TABLE C4.1aYear 2014 Seminole County Travel Time & Delay Study
Chapman Road - Eastbound Direction Historical Summary
TABLE C4.1bYear 2014 Seminole County Travel Time & Delay Study
Year 2014Year 2005 Year 2006 Year 2007 Year 2008 Year 2009 Year 2010 Year 2011
Average Speed Average Speed Average Speed Average SpeedAverage Speed Average Speed Average Speed Average Speed Average Speed Average SpeedAverage Speed Average Speed
D-5 Chapman Road
Roadway Distance
Segments (mile) (mph) LOS (mph) LOS (mph) LOS (mph) LOS (mph) LOS (mph) LOS (mph) LOS (mph) LOS (mph) LOS (mph) LOS (mph) LOS (mph) LOS (mph) LOS (mph) LOS (mph) LOS (mph) LOS (mph) LOS (mph) LOS (mph) LOS (mph) LOS
AM PEAK HOUR
SR 434 to CR 426 0.05 18.8 D 18.8 D 7.0 F 7.0 F 5.1 F 5.1 F 14.5 E 14.5 E 9.3 F 9.3 F 13.6 E 13.6 E 21.4 B 21.4 B 17.6 C 17.6 C 20.0 B 20.0 B 27.3 A 27.3 A
CR 426 to Division St. 0.20 27.0 C 30.6 B 21.8 D 23.1 C 17.4 D 23.1 C 21.1 B 15.8 C 13.0 C 13.2 C
Division St. to Academy St. 0.55 18.6 D 34.3 B 18.6 D 32.9 B 31.7 B 31.2 B 28.7 A 25.0 B 24.3 B 25.2 A
Academy St. to Reed Rd. 0.29 35.1 A 22.9 C 36.4 A 34.0 B 39.5 A 22.6 C 39.3 A 31.8 B 33.2 B 27.6 C 37.5 A 30.6 B 34.8 A 28.1 A 35.5 A 24.3 B 35.5 A 22.5 B 37.8 A 23.3 B
Reed Rd. to Lockwood Rd. 1.07 - - - - - - - - - - - - 20.3 D 20.3 D 22.6 C 22.6 C 27.8 C 27.8 C 26.5 C 26.5 C 25.7 C 25.7 C 24.7 C 24.7 C 33.4 B 33.4 B
Lockwood Rd. to Twin Rivers Blvd. 1.28 - - - - - - - - - - - - 41.6 A 37.0 A 46.3 A 30.1 B 34.6 B 35.1 A 39.8 A
Twin Rivers Blvd. to Live Oak Reserve Blvd.* 0.50 - - - - - - - - - - - - 34.4 B 29.4 B 22.3 C 56.6 A 50.8 A 47.6 A 29.6 B
Live Oak Reserve Blvd. to Snow Hill Rd.**** 0.91 34.2 B 41.5 A 40.0 A 36.2 A 32.3 B 41.7 A 35.0 B
Snow Hill Rd. to 2nd St.** 0.36 - - - - - - - - - - - - 41.6 A 38.2 A 39.9 A 37.4 A 43.2 A 37.5 A 38.6 A 35.6 A 36.0 A 35.9 A 45.0 A 39.7 A 43.2 A 37.1 A
2nd St. to 7th St.** 0.35 - - - - - - - - - - - - - - - - - - - - - - - - 42.9 A 45.7 A 46.7 A 47.7 A
7th St. to 11th St.*** 0.30 - - - - - - - - - - - - - - - - - - - - - - - - 45.0 A 43.8 A 46.2 A 45.9 A 47.4 A 47.0 A 47.4 A 47.6 A
11th St. to Lake Mills Rd. 0.38 - - - - - - - - - - - - - - - - - - - - 51.8 A 49.6 A 50.7 A 51.8 A
Lake Mills Rd. to Orange County Line 1.21 - - - - - - - - - - - - 49.5 A 49.5 A - - - - - - - - 51.8 A 51.8 A 55.4 A 53.9 A 56.2 A 54.8 A 51.8 A 51.8 A
Average 22.8 C 28.5 B 19.5 D 34.9 B 30.2 B 33.1 B 35.3 A 34.5 B 35.2 A 36.3 A
PM PEAK HOUR
SR 434 to CR 426 0.05 9.6 F 9.6 F 15.4 E 15.4 E 16.7 E 16.7 E 8.9 F 8.9 F 17.7 D 17.7 D 20.0 D 20.0 D 20.0 B 20.0 B 17.6 C 17.6 C 20.0 B 20.0 B 9.7 D 9.7 D
CR 426 to Division St. 0.20 24.6 C 24.8 C 20.0 D 13.5 E 16.2 E 13.8 E 12.6 D 15.2 C 10.3 D 13.6 C
Division St. to Academy St. 0.55 29.5 B 25.9 C 31.8 B 14.8 E 28.0 C 24.4 C 19.5 B 21.2 B 16.3 C 25.4 A
Academy St. to Reed Rd. 0.29 36.6 A 29.9 B 33.1 B 27.3 C 38.7 A 29.9 B 36.6 A 17.5 D 32.8 B 25.5 C 36.7 A 23.2 C 34.1 A 19.8 B 36.2 A 22.0 B 36.2 A 17.0 C 37.8 A 23.6 B
Reed Rd. to Lockwood Rd. 1.07 - - - - - - - - - - - - 26.9 C 26.9 C 23.1 C 23.1 C 26.2 C 26.2 C 26.3 C 26.3 C 22.5 C 22.5 C 21.0 D 21.0 D 22.6 C 22.6 C
Lockwood Rd. to Twin Rivers Blvd. 1.28 - - - - - - - - - - - - 38.9 A 39.3 A 44.6 A 32.6 B 37.2 A 38.9 A 40.8 A
Twin Rivers Blvd. to Live Oak Reserve Blvd.* 0.50 - - - - - - - - - - - - 26.7 C 30.9 B 26.4 C 56.6 A 41.1 A 65.2 A 35.6 A
Live Oak Reserve Blvd. to Snow Hill Rd.**** 0.91 40.6 A 32.7 B 39.1 A 39.9 A 30.0 B 43.0 A 35.5 A
Snow Hill Rd. to 2nd St.** 0.36 - - - - - - - - - - - - 43.2 A 37.7 A 36.8 A 35.7 A 40.8 A 38.2 A 38.6 A 38.0 A 40.8 A 35.6 A 45.0 A 43.7 A 42.4 A 38.6 A
2nd St. to 7th St.** 0.35 - - - - - - - - - - - - - - - - - - - - - - - - 42.0 A 45.7 A 45.7 A 47.7 A
7th St. to 11th St.*** 0.30 - - - - - - - - - - - - - - - - - - - - - - - - 42.9 A 42.4 A 47.4 A 46.4 A 48.6 A 47.0 A 50.0 A 48.7 A
11th St. to Lake Mills Rd. 0.38 - - - - - - - - - - - - - - - - - - - - 48.5 A 53.0 A 51.8 A 53.0 A
Lake Mills Rd. to Orange County Line 1.21 - - - - - - - - - - - - 50.4 A 50.4 A - - - - - - - - 51.1 A 50.4 A 56.7 A 55.8 A 55.8 A 54.8 A 55.4 A 54.8 A
Average 27.1 C 26.3 C 28.8 B 32.3 B 29.6 B 31.0 B 33.4 B 33.0 B 32.8 B 34.2 B
Note: * Till Year 2007 this segment was used to be Twin Rivers Blvd. to Lake Eva Dr.
** Till Year 2007 this segment was used to be Lake Eva Dr. to 2nd St.
~ Till Year 2007 this segment was used to be 2nd St. to Lake Eva Dr.
~~ Till Year 2007 this segment was used to be Lake Eva Dr. to Twin Rivers Blvd.
Note: ** Additional Control Point Added at 7th St.
Note: *** Additional Control Point Added at 11th St.
Note: **** Construction in progress on CR 419 at the intersection of Snow Hill Rd during the 2012 study.
TABLE C5.1a
Year 2014 Seminole County Travel Time & Delay Study
CR 419 - Eastbound Direction Historical Summary
Year 2005 Year 2006 Year 2007 Year 2008 Year 2009 Year 2010 Year 2011
Average Speed Average Speed Average Speed Average Speed Average Speed Average Speed Average Speed Average Speed Average Speed Average Speed Average Speed Average Speed Average Speed Average Speed Average SpeedAverage Speed Average Speed Average Speed
Year 2012
Rdwy Segment Rdwy Section
Average Speed Average Speed
Year 2014Year 2013
Rdwy Segment Rdwy Section
D-6 CR 419 - EB
Roadway Distance
Segments (mile) (mph) LOS (mph) LOS (mph) LOS (mph) LOS (mph) LOS (mph) LOS (mph) LOS (mph) LOS (mph) LOS (mph) LOS (mph) LOS (mph) LOS (mph) LOS (mph) LOS (mph) LOS (mph) LOS (mph) LOS (mph) LOS (mph) LOS (mph) LOS
AM PEAK HOUR
Orange Co. Line to Lake Mills Rd. 1.21 - - - - - - - - - - - - - - - - - - - - 52.6 A 56.7 A 54.5 A 54.5 A
Lake Mills Rd. to 11th St. *** 0.38 - - - - - - - - - - - - - - - - - - - - - - - - 49.6 A 51.8 A 49.6 A 54.8 A 49.6 A 53.3 A 53.0 A 54.2 A
11th St. to 7th St.** 0.30 - - - - - - - - - - - - - - - - - - - - - - - - 42.9 A 45.0 A 48.6 A 47.4 A
7th St. to 2nd St. 0.35 - - - - - - - - - - - - 50.4 A 50.4 A - - - - - - - - 41.2 A 41.9 A 43.7 A 44.3 A 46.7 A 47.6 A 45.7 A 46.4 A
2nd St. to Snow Hill Rd.**** 0.36 - - - - - - - - - - - - 27.0 C 24.2 C 27.3 C 33.7 B 22.7 C 18.9 D 21.4 D
Snow Hill Rd.~ to Live Oak Reserve Blvd. 0.91 36.1 A 36.7 A 42.5 A 35.5 A 40.7 A 41.4 A 36.2 A
Live Oak Reserve Blvd. to Twin Rivers Blvd.~~ 0.50 - - - - - - - - - - - - 16.3 E 25.9 C 26.8 C 31.9 B 32.6 B 39.0 A 31.3 B
Twin Rivers Blvd. to Lockwood Rd. 1.28 - - - - - - - - - - - - 41.8 A 32.5 B 33.5 B 32.0 B 36.7 A 34.6 B 34.8 B 34.3 B 28.5 B 31.0 B 30.1 B 31.7 B 34.1 B 32.1 B
Lockwood Rd. to Reed Rd. 1.07 - - - - - - - - - - - - 43.2 A 43.2 A 38.3 A 38.3 A 40.4 A 40.4 A 40.9 A 40.9 A 40.1 A 40.1 A 38.9 A 38.9 A 41.7 A 41.7 A
Reed Rd. to Academy St. 0.29 18.7 D 21.3 D 14.9 E 16.0 E 33.4 B 26.9 C 28.5 A 19.3 B 16.7 C 22.9 B
Academy St. to Division St. 0.55 31.7 B 24.9 C 28.9 B 19.6 D 27.0 C 24.2 C 22.4 B 26.0 A 26.2 A 27.7 A
Division St. to CR 426 0.20 4.7 F 13.8 E 5.0 F 13.6 E 7.4 F 15.8 E 7.1 F 13.9 E 15.2 E 24.7 C 16.4 E 22.8 C 5.4 F 14.4 C 8.0 F 17.0 C 12.9 D 19.3 B 6.7 F 16.7 C
CR 426 to SR 434 0.05 20.3 D 20.3 D 16.4 E 16.4 E 21.4 D 21.4 D 4.8 F 4.8 F 16.9 E 16.9 E 18.7 D 18.7 D 15.8 C 15.8 C 18.7 C 18.7 C 10.0 D 10.0 D 25.0 B 25.0 B
Average 14.0 E 13.7 E 16.0 E 30.3 B 31.0 B 32.0 B 31.5 B 32.0 B 32.9 B 32.6 B
PM PEAK HOUR
Orange Co. Line to Lake Mills Rd. 1.21 - - - - - - - - - - - - - - - - - - - - 51.1 A 55.8 A 54.1 A 55.0 A
Lake Mills Rd. to 11th St. *** 0.38 - - - - - - - - - - - - - - - - - - - - - - - - 49.6 A 50.7 A 48.5 A 53.9 A 50.7 A 53.3 A 54.3 A 54.8 A
11th St. to 7th St.** 0.30 - - - - - - - - - - - - - - - - - - - - - - - - 42.9 A 45.0 A 48.6 A 50.0 A
7th St. to 2nd St. 0.35 - - - - - - - - - - - - 50.4 A 50.4 A - - - - - - - - 41.2 A 41.9 A 43.7 A 44.3 A 46.7 A 47.6 A 46.7 A 48.1 A
2nd St. to Snow Hill Rd.**** 0.36 - - - - - - - - - - - - 34.0 B 28.1 B 33.2 B 32.7 B 33.7 B 21.0 D 20.4 D
Snow Hill Rd.~ to Live Oak Reserve Blvd. 0.91 46.6 A 38.3 A 41.9 A 40.1 A 41.4 A 46.7 A 45.1 A
Live Oak Reserve Blvd. to Twin Rivers Blvd.~~ 0.50 - - - - - - - - - - - - 36.9 A 33.3 B 33.6 B 31.6 B 60.0 A 65.2 A 30.4 B
Twin Rivers Blvd. to Lockwood Rd. 1.28 - - - - - - - - - - - - 37.5 A 39.4 A 30.6 B 32.6 B 34.0 B 35.8 A 35.1 A 35.5 A 30.7 B 36.9 A 29.1 B 34.5 B 31.1 B 32.0 B
Lockwood Rd. to Reed Rd. 1.07 - - - - - - - - - - - - 42.6 A 42.6 A 38.4 A 38.4 A 38.0 A 38.0 A 40.6 A 40.6 A 39.4 A 39.4 A 42.8 A 42.8 A 42.0 A 42.0 A
Reed Rd. to Academy St. 0.29 34.7 B 27.4 C 34.1 B 25.5 C 27.5 C 24.7 C 25.6 A 24.9 B 27.2 A 16.1 C
Academy St. to Division St. 0.55 32.8 B 26.0 C 28.9 B 28.0 B 24.2 C 25.7 C 26.2 A 19.1 B 27.5 A 23.1 B
Division St. to CR 426 0.20 12.3 F 25.2 C 3.8 F 12.1 F 10.4 F 22.2 C 4.2 F 13.1 E 9.5 F 19.2 D 10.7 F 20.1 D 9.1 D 19.1 B 4.7 F 12.5 D 8.5 F 19.1 B 6.5 F 14.3 C
CR 426 to SR 434 0.05 10.4 F 10.4 F 12.3 F 12.3 F 9.4 F 9.4 F 4.6 F 4.6 F 21.9 D 21.9 D 27.3 C 27.3 C 20.0 B 20.0 B 25.0 B 25.0 B 33.3 A 33.3 A 23.1 B 23.1 B
Average 23.8 C 12.3 F 20.9 D 31.6 B 29.3 B 31.2 B 34.5 B 31.1 B 35.0 A 31.3 B
Note: * Till Year 2007 this segment was used to be Twin Rivers Blvd. to Lake Eva Dr.
** Till Year 2007 this segment was used to be Lake Eva Dr. to 2nd St.
~ Till Year 2007 this segment was used to be 2nd St. to Lake Eva Dr.
~~ Till Year 2007 this segment was used to be Lake Eva Dr. to Twin Rivers Blvd.
Note: ** Additional Control Point Added at 7th St.
Note: *** Additional Control Point Added at 11th St.
Note: **** Construction in progress on CR 419 at the intersection of Snow Hill Rd during the 2012 study.
TABLE C5.1b
Year 2014 Seminole County Travel Time & Delay Study
CR 419 - Westbound Direction Historical Summary
Year 2014Year 2005 Year 2006 Year 2007 Year 2008 Year 2009 Year 2010 Year 2011
Average Speed Average Speed Average Speed Average Speed Average SpeedAverage Speed Average Speed Average Speed Average Speed Average SpeedAverage Speed Average Speed Average Speed Average Speed Average Speed Average Speed
Year 2012
Rdwy Segment Rdwy Section
Average Speed Average Speed
Rdwy Section
Year 2013
Average Speed Average Speed
D-7 CR 419 - WB
Roadway Distance
Segments (mile) (mph) LOS (mph) LOS (mph) LOS (mph) LOS (mph) LOS (mph) LOS (mph) LOS (mph) LOS (mph) LOS (mph) LOS (mph) LOS (mph) LOS (mph) LOS (mph) LOS (mph) LOS (mph) LOS (mph) LOS (mph) LOS (mph) LOS (mph) LOS
AM PEAK HOUR
CR 419 to Division St. 0.29 28.6 B 28.1 B 28.1 B 26.8 C 24.2 C 25.6 C 22.9 B 22.9 B 21.2 B 21.2 B 22.9 B 22.9 B 24.2 B 24.2 B
Division St. to Lake Charm Dr. 0.43 37.9 A 33.4 B 38.5 A 37.4 A 37.9 A 34.4 B 31.1 A 31.1 A 34.4 A 34.4 A 31.9 A 31.9 A 34.4 A 34.4 A
Lake Charm Dr. to Reed Rd. 0.49 39.2 A 35.5 A 37.6 A 33.2 B 43.6 A 36.9 A 41.7 A 35.5 A 41.7 A 34.4 B 36.9 A 32.6 B 37.7 A 37.7 A 33.8 B 33.8 B 39.7 A 39.7 A 40.3 A 40.3 A
Reed Rd. to Oklahoma St. 0.72 ---- ---- ---- ---- ---- ---- ---- ---- ---- ---- ---- ---- 38.6 A 40.8 A 39.3 A 42.8 A
Oklahoma St. to Lockwood Rd./Stone St. 0.54 ---- ---- ---- ---- ---- ---- ---- ---- ---- ---- ---- ---- 41.0 A 39.6 A 42.6 A 41.5 A 44.4 A 41.3 A 43.8 A 43.2 A
Lockwood Rd./Stone St. to Van Arsdale St. 0.27 ---- ---- ---- ---- ---- ---- ---- ---- ---- ---- ---- ---- ---- ---- ---- ---- ---- ---- ---- ---- ---- ---- ---- ---- 43.8 A 43.8 A 42.6 A 42.6 A 45.0 A 45.0 A 46.3 A 46.3 A
Van Arsdale St. to Seminole Woods Blvd. 2.89 ---- ---- ---- ---- ---- ---- ---- ---- ---- ---- ---- ---- ---- ---- ---- ---- ---- ---- ---- ---- ---- ---- ---- ---- 46.4 A 46.4 A 50.1 A 50.1 A 47.6 A 47.6 A 51.6 A 51.6 A
Seminole Woods Blvd. to Old Mims Rd. 0.76 ---- ---- ---- ---- ---- ---- ---- ---- ---- ---- ---- ---- ---- ---- ---- ---- ---- ---- ---- ---- ---- ---- ---- ---- 42.2 A 43.8 A 40.0 A 46.1 A
Old Mims Rd. to Snow Hill Rd. 0.53 ---- ---- ---- ---- ---- ---- ---- ---- ---- ---- ---- ---- ---- ---- ---- ---- ---- ---- ---- ---- ---- ---- ---- ---- 43.6 A 44.2 A 44.2 A 45.4 A
Snow Hill Rd. to SR 46 * 0.84 ---- ---- ---- ---- ---- ---- ---- ---- ---- ---- ---- ---- ---- ---- ---- ---- ---- ---- ---- ---- ---- ---- ---- ---- 37.6 A 40.6 A 40.3 A 42.5 A 34.5 B 38.5 A 36.5 A 41.6 A
Average 35.5 A 33.2 B 36.9 A 38.9 A 38.5 A 40.3 A 40.3 A 41.9 A 40.6 A 43.4 A
PM PEAK HOUR
CR 419 to Division St. 0.29 28.8 B 26.3 C 21.2 D 21.2 D 20.7 D 21.0 D 18.9 C 18.9 C 15.7 C 15.7 C 21.7 B 21.7 B 22.0 B 22.0 B
Division St. to Lake Charm Dr. 0.43 37.5 A 32.7 B 36.9 A 36.3 A 37.9 A 35.8 A 32.2 B 32.2 B 28.0 B 28.0 B 31.1 B 31.1 B 35.8 A 35.8 A
Lake Charm Dr. to Reed Rd. 0.49 38.7 A 35.2 A 39.3 A 32.8 B 43.6 A 33.0 B 40.6 A 32.1 B 40.0 A 32.1 B 40.6 A 31.9 B 38.7 A 38.7 A 38.7 A 38.7 A 39.2 A 39.2 A 40.3 A 40.3 A
Reed Rd. to Oklahoma St. 0.72 ---- ---- ---- ---- ---- ---- ---- ---- ---- ---- ---- ---- 39.6 A 40.8 A 40.4 A 44.1 A
Oklahoma St. to Lockwood Rd./Stone St. 0.54 ---- ---- ---- ---- ---- ---- ---- ---- ---- ---- ---- ---- 42.1 A 40.6 A 44.4 A 42.2 A 45.0 A 42.2 A 46.3 A 45.0 A
Lockwood Rd./Stone St. to Van Arsdale St. 0.27 ---- ---- ---- ---- ---- ---- ---- ---- ---- ---- ---- ---- ---- ---- ---- ---- ---- ---- ---- ---- ---- ---- ---- ---- 43.8 A 43.8 A 45.0 A 45.0 A 45.0 A 45.0 A 46.3 A 46.3 A
Van Arsdale St. to Seminole Woods Blvd. 2.89 ---- ---- ---- ---- ---- ---- ---- ---- ---- ---- ---- ---- ---- ---- ---- ---- ---- ---- ---- ---- ---- ---- ---- ---- 49.5 A 49.5 A 49.7 A 49.7 A 52.2 A 52.2 A 52.1 A 52.1 A
Seminole Woods Blvd. to Old Mims Rd. 0.76 ---- ---- ---- ---- ---- ---- ---- ---- ---- ---- ---- ---- ---- ---- ---- ---- ---- ---- ---- ---- ---- ---- ---- ---- 44.3 A 46.1 A 43.8 A 47.0 A
Old Mims Rd. to Snow Hill Rd. 0.53 ---- ---- ---- ---- ---- ---- ---- ---- ---- ---- ---- ---- ---- ---- ---- ---- ---- ---- ---- ---- ---- ---- ---- ---- 44.8 A 46.1 A 44.8 A 48.9 A
Snow Hill Rd. to SR 46 * 0.84 ---- ---- ---- ---- ---- ---- ---- ---- ---- ---- ---- ---- ---- ---- ---- ---- ---- ---- ---- ---- ---- ---- ---- ---- 34.8 B 40.1 A 43.4 A 45.0 A 37.1 A 41.1 A 35.2 A 41.9 A
Average 35.2 A 32.8 B 33.0 B 37.0 A 36.4 A 40.8 A 40.8 A 41.3 A 42.5 A 43.7 A
Roadway Distance
Segments (mile) (mph) LOS (mph) LOS (mph) LOS (mph) LOS (mph) LOS (mph) LOS (mph) LOS (mph) LOS (mph) LOS (mph) LOS (mph) LOS (mph) LOS (mph) LOS (mph) LOS (mph) LOS (mph) LOS (mph) LOS (mph) LOS (mph) LOS (mph) LOS
AM PEAK HOUR
SR 46 to Snow Hill Rd. * 0.84 ---- ---- ---- ---- ---- ---- ---- ---- ---- ---- ---- ---- ---- ---- ---- ---- ---- ---- ---- ---- ---- ---- ---- ---- 40.6 A 34.8 B 42.0 A 43.8 A
Snow Hill Rd. to Old Mims Rd. 0.53 ---- ---- ---- ---- ---- ---- ---- ---- ---- ---- ---- ---- ---- ---- ---- ---- ---- ---- ---- ---- ---- ---- ---- ---- 44.2 A 44.8 A 44.8 A 46.1 A
Old Mims Rd. to Seminole Woods Blvd. 0.76 ---- ---- ---- ---- ---- ---- ---- ---- ---- ---- ---- ---- ---- ---- ---- ---- ---- ---- ---- ---- ---- ---- ---- ---- 42.6 A 42.2 A 44.3 A 40.1 A 43.8 A 43.3 A 46.1 A 45.2 A
Seminole Woods Blvd. to Van Arsdale St. 2.89 ---- ---- ---- ---- ---- ---- ---- ---- ---- ---- ---- ---- ---- ---- ---- ---- ---- ---- ---- ---- ---- ---- ---- ---- 48.6 A 48.6 A 50.4 A 50.4 A 50.3 A 50.3 A 53.2 A 53.2 A
Van Arsdale St. to Lockwood Rd./Stone St. 0.27 ---- ---- ---- ---- ---- ---- ---- ---- ---- ---- ---- ---- ---- ---- ---- ---- ---- ---- ---- ---- ---- ---- ---- ---- 45.0 A 45.0 A 45.0 A 45.0 A 43.8 A 43.8 A 46.3 A 46.3 A
Lockwood Rd./Stone St. to Oklahoma St. 0.54 ---- ---- ---- ---- ---- ---- ---- ---- ---- ---- ---- ---- 43.8 A 43.8 A 43.8 A 45.0 A
Oklahoma St. to Reed Rd. 0.72 ---- ---- ---- ---- ---- ---- ---- ---- ---- ---- ---- ---- 38.2 A 40.4 A 42.8 A 43.2 A 39.6 A 41.3 A 41.9 A 43.2 A
Reed Rd. to Lake Charm Dr. 0.49 37.6 A 37.4 A 43.0 A 44.3 A 43.6 A 41.1 A 39.2 A 39.2 A 40.3 A 40.3 A 39.7 A 39.7 A 40.8 A 40.8 A
Lake Charm Dr. to Division St. 0.43 36.1 A 34.8 B 32.2 B 26.9 C 30.7 B 27.4 C 25.5 B 25.5 B 27.7 B 27.7 B 26.1 B 26.1 B 27.7 B 27.7 B
Division St. to CR 419 0.29 13.6 E 26.3 C 9.1 F 21.1 D 7.3 F 18.7 D 7.1 F 17.7 D 18.7 D 29.6 B 8.2 F 19.1 D 6.6 F 6.6 F 12.4 A 12.4 A 13.4 A 13.4 A 8.9 B 8.9 B
Average 26.3 C 21.1 D 18.7 D 24.7 C 34.7 B 26.5 C 35.2 A 39.5 A 40.0 A 39.5 A
PM PEAK HOUR
SR 46 to Snow Hill Rd. * 0.84 ---- ---- ---- ---- ---- ---- ---- ---- ---- ---- ---- ---- ---- ---- ---- ---- ---- ---- ---- ---- ---- ---- ---- ---- 41.0 A 35.0 B 43.1 A 44.2 A
Snow Hill Rd. to Old Mims Rd. 0.53 ---- ---- ---- ---- ---- ---- ---- ---- ---- ---- ---- ---- ---- ---- ---- ---- ---- ---- ---- ---- ---- ---- ---- ---- 44.8 A 45.4 A 38.3 A 46.8 A
Old Mims Rd. to Seminole Woods Blvd. 0.76 ---- ---- ---- ---- ---- ---- ---- ---- ---- ---- ---- ---- ---- ---- ---- ---- ---- ---- ---- ---- ---- ---- ---- ---- 43.4 A 42.7 A 45.1 A 40.6 A 44.7 A 42.3 A 46.5 A 45.6 A
Seminole Woods Blvd. to Van Arsdale St. 2.89 ---- ---- ---- ---- ---- ---- ---- ---- ---- ---- ---- ---- ---- ---- ---- ---- ---- ---- ---- ---- ---- ---- ---- ---- 50.0 A 50.0 A 48.6 A 48.6 A 52.4 A 52.4 A 51.8 A 51.8 A
Van Arsdale St. to Lockwood Rd./Stone St. 0.27 ---- ---- ---- ---- ---- ---- ---- ---- ---- ---- ---- ---- ---- ---- ---- ---- ---- ---- ---- ---- ---- ---- ---- ---- 46.3 A 46.3 A 46.3 A 46.3 A 46.3 A 46.3 A 47.6 A 47.6 A
Lockwood Rd./Stone St. to Oklahoma St. 0.54 ---- ---- ---- ---- ---- ---- ---- ---- ---- ---- ---- ---- 43.8 A 43.8 A 44.4 A 45.0 A
Oklahoma St. to Reed Rd. 0.72 ---- ---- ---- ---- ---- ---- ---- ---- ---- ---- ---- ---- 39.6 A 41.3 A 41.5 A 42.5 A 40.4 A 42.0 A 42.8 A 43.7 A
Reed Rd. to Lake Charm Dr. 0.49 37.7 A 38.3 A 43.0 A 40.0 A 42.4 A 42.4 A 39.7 A 39.7 A 41.4 A 41.4 A 39.7 A 39.7 A 40.8 A 40.8 A
Lake Charm Dr. to Division St. 0.43 34.8 B 35.9 A 31.1 B 31.1 B 29.7 B 30.4 B 27.4 B 27.4 B 31.9 A 31.9 A 27.7 B 27.7 B 28.4 B 28.4 B
Division St. to CR 419 0.29 7.4 F 19.0 D 7.2 F 18.7 D 5.8 F 16.0 E 9.3 F 21.0 D 10.1 F 22.0 C 9.7 F 21.6 D 8.7 E 8.7 E 22.0 E 22.0 E 9.8 D 9.8 D 6.0 F 6.0 F
Average 19.0 D 18.7 D 16.0 E 28.1 B 28.6 B 28.3 B 37.8 A 41.7 A 39.0 A 36.6 A
Note: * Roadway segment extended to SR 46 in 2011
Year 2013
Rdwy Segment Rdwy Section
Average Speed Average Speed
Year 2013
Rdwy Segment Rdwy Section
Average Speed Average Speed
41.1 A 41.1 A
41.339.4 A 39.4 A 41.3 A
39.6 A 39.6 A
A
A
Year 2014
Year 2014
41.5 A 41.5 A
40.0 A 40.0 A
Year 2009 Year 2010 Year 2011
Rdwy Section Rdwy Segment
Average Speed Average Speed Average Speed Average Speed Average Speed
Rdwy Section
TABLE C6.1aYear 2014 Seminole County Travel Time & Delay Study
CR 426 - Eastbound Direction Historical Summary
TABLE C6.1b
43.4 A 43.4 A42.7 A 42.7 A
A 41.543.1 A 43.1 A
A
Rdwy Segment Rdwy Section Rdwy Segment
Year 2005 Year 2006 Year 2007 Year 2008
Rdwy Segment Rdwy Section
Average Speed Average Speed Average Speed Average Speed Average Speed Average Speed Average Speed Average Speed Average Speed Average Speed Average Speed
Average Speed Average Speed Average Speed Average Speed Average SpeedAverage Speed Average Speed Average Speed Average Speed Average Speed Average Speed Average Speed Average Speed
Year 2012
Rdwy Segment Rdwy Section
Average Speed Average Speed
Year 2012
Rdwy Segment Rdwy Section
Average Speed Average Speed
Rdwy Section
CR 426 - Westbound Direction Historical SummaryYear 2014 Seminole County Travel Time & Delay Study
43.4 A 43.4 A
43.4 A 43.4
41.5
D-8 CR 426
Roadway Distance
Segments (mile) (mph) LOS (mph) LOS (mph) LOS (mph) LOS (mph) LOS (mph) LOS (mph) LOS (mph) LOS (mph) LOS (mph) LOS (mph) LOS (mph) LOS (mph) LOS (mph) LOS (mph) LOS (mph) LOS (mph) LOS (mph) LOS (mph) LOS (mph) LOS
AM PEAK HOUR
Ballard St. to Orienta Ave.* 0.54 ---- ---- ---- ---- ---- ---- ---- ---- ---- ---- ---- ---- ---- ---- ---- ---- ---- ---- ---- ---- ---- ---- ---- ---- 31.8 A 31.8 A 34.8 A 34.8 A 27.5 B 27.5 B 31.5 A 31.5 A
Orienta Ave. to SR 436 0.14 ---- ---- ---- ---- ---- ---- ---- ---- ---- ---- ---- ---- ---- ---- ---- ---- ---- ---- ---- ---- 8.4 F 8.4 F 5.2 F 5.2 F 5.2 F 5.2 F 7.9 F 7.9 F 6.6 F 6.6 F
SR 436 to First St. 0.36 41.3 A 39.8 A 38.2 A 37.0 A 39.4 A 39.6 A 37.9 A 38.6 A 37.9 A 36.6 A
First St. to Magnolia/Plumosa Ave. 0.67 43.6 A 39.9 A 42.8 A 40.6 A 38.6 A 36.7 A 36.7 A 38.8 A 33.3 B 34.7 B
Magnolia/Plumosa Ave. to North St. 0.59 43.8 A 43.1 A 39.3 A 39.6 A 29.4 B 35.8 A 30.7 B 35.6 A 30.1 B 35.1 A 31.1 B 35.0 B 32.1 B 35.1 A 33.6 B 36.6 A 34.9 B 34.8 B 30.8 B 33.5 B
North St. to Dogtrack Rd. 0.12 19.1 D 19.1 D 12.7 F 12.7 F 11.1 F 11.1 F 20.1 D 20.1 D 12.5 F 12.5 F 14.3 E 14.3 E 7.3 F 7.3 F 7.6 F 7.6 F 15.0 E 15.0 E 25.4 C 25.4 C
Dog Track Rd. to Wildmere Ave. 0.50 34.9 B 33.7 B 35.8 A 35.3 A 34.7 B 36.7 A 32.6 B 35.2 A 36.9 A 33.6 B
Wildmere Ave. to SR 434 0.38 16.9 E 24.1 C 14.0 E 21.4 D 11.1 F 18.7 D 12.3 F 19.9 D 9.0 F 16.0 E 15.5 E 23.4 C 19.3 D 25.2 C 15.5 E 22.8 C 15.7 E 23.4 C 12.5 F 19.5 D
SR 434 to Church Ave. 0.21 26.0 C 22.1 C 17.2 D 24.9 C 18.8 D 27.4 C 23.8 C 24.7 C 26.8 C 33.2 B
Church Ave. to Longwood Hills Rd. 0.93 37.3 A 34.3 B 38.3 A 33.6 B 35.0 A 29.3 B 32.1 B 30.5 B 36.5 A 31.0 B 34.4 B 32.9 B 36.9 A 33.5 B 38.4 A 34.8 B 43.4 A 39.0 A 41.8 A 39.9 A
Longwood Hills Rd. to Longwood Lake Mary Rd. 0.59 45.0 A 45.0 A 33.8 B 33.8 B 37.0 A 37.0 A 32.7 B 32.7 B 38.0 A 38.0 A 41.8 A 41.8 A 41.6 A 41.6 A 34.7 B 34.7 B 40.2 A 40.2 A 44.2 A 44.2 A
Longwood Lake Mary Rd. to General Hutchison Rd. 0.10 32.2 B 11.8 F 19.3 D 33.9 B 21.7 D 22.0 D 33.3 B 25.0 C 30.0 B 37.5 A
General Hutchison Rd. to Country Club Rd. 1.02 46.1 A 44.2 A 46.2 A 32.4 B 40.2 A 36.4 A 44.4 A 43.1 A 41.0 A 37.8 A 42.8 A 38.2 A 42.5 A 41.5 A 42.5 A 40.0 A 44.0 A 42.3 A 41.9 A 41.5 A
Country Club Rd. to Silkwood Ct. 0.71 44.1 A 41.0 A 43.8 A 39.9 A 42.6 A 39.1 A 31.4 B 31.8 B 43.1 A 42.2 A
Silkwood Ct. to US 17/92 0.27 15.6 E 29.1 B 18.6 D 30.7 B 10.0 F 22.5 C 10.0 F 21.7 D 15.6 E 28.7 B 13.4 E 25.2 C 8.1 F 17.0 E 8.5 F 17.6 D 5.7 F 14.7 E 5.9 F 14.9 E
US 17/92 to County Home Rd. 0.85 36.4 A 36.4 A 43.6 A 43.6 A 44.1 A 44.1 A 43.6 A 43.6 A 44.2 A 44.2 A 42.9 A 42.9 A 42.7 A 42.7 A 42.4 A 42.4 A 43.8 A 43.8 A 41.7 A 41.7 A
County Home Rd. to Bedford Rd. 1.49 52.3 A 48.1 A 48.4 A 48.4 A 47.3 A 43.9 A 45.8 A 45.2 A 45.4 A 43.4 A
Bedford Rd. to SR 417 (SB Ramps) 0.61 52.1 A 42.8 A 31.8 B 40.2 A 34.8 B 27.3 C 30.2 B 33.5 B 33.5 B 29.1 B
SR 417 (SB Ramps) to SR 417 (NB Ramps) 0.09 24.1 C 21.5 D 19.3 D 17.8 D 32.0 B 25.0 C 14.6 E 19.3 D 30.0 B 30.0 B
SR 417 (NB Ramps) to Lake Mary Blvd. 0.26 30.6 B 47.2 A 33.5 B 43.2 A 22.8 C 37.5 A 24.2 C 40.3 A 24.7 C 39.7 A 16.2 E 32.9 B 12.5 F 31.1 B 16.7 E 34.6 B 13.1 E 33.6 B 9.5 F 29.0 B
Average 37.4 A 34.5 B 30.8 B 32.2 B 31.6 B 30.9 B 28.0 B 28.6 B 29.1 B 27.7 C
PM PEAK HOUR
Ballard St. to Orienta Ave.* 0.54 ---- ---- ---- ---- ---- ---- ---- ---- ---- ---- ---- ---- ---- ---- ---- ---- ---- ---- ---- ---- ---- ---- ---- ---- 30.0 B 30.0 B 31.8 A 31.8 A 33.1 A 33.1 A 31.2 A 31.2 A
Orienta Ave. to SR 436 0.14 ---- ---- ---- ---- ---- ---- ---- ---- ---- ---- ---- ---- ---- ---- ---- ---- ---- ---- ---- ---- 5.5 F 5.5 F 5.6 F 5.6 F 4.7 F 4.7 F 4.7 F 4.7 F 4.6 F 4.6 F
SR 436 to First St. 0.36 41.0 A 36.7 A 39.9 A 38.4 A 38.6 A 39.6 A 38.6 A 36.6 A 38.6 A 36.0 A
First St. to Magnolia/Plumosa Ave. 0.67 44.3 A 37.8 A 42.3 A 39.4 A 39.6 A 34.1 B 38.8 A 30.7 B 36.3 A 33.6 B
Magnolia/Plumosa Ave. to North St. 0.59 21.1 D 31.1 B 26.0 C 32.1 B 23.8 C 32.5 B 23.1 C 31.0 B 24.3 C 32.0 B 29.3 B 23.6 C 25.1 C 32.2 B 30.8 B 31.9 B 28.4 B 33.3 B 22.3 C 28.6 B
North St. to Dogtrack Rd. 0.12 15.6 E 15.6 E 16.7 E 16.7 E 20.7 D 20.7 D 20.5 D 20.5 D 18.7 D 18.7 D 12.9 F 12.9 F 8.1 F 8.1 F 8.0 F 8.0 F 10.6 F 10.6 F 8.5 F 8.5 F
Dog Track Rd. to Wildmere Ave. 0.50 30.0 B 33.9 B 36.2 A 38.0 A 40.3 A 39.5 A 36.0 A 37.8 A 37.8 A 37.3 A
Wildmere Ave. to SR 434 0.38 7.3 F 13.1 E 8.3 F 15.0 E 6.2 F 12.1 F 11.8 F 19.8 D 12.0 F 20.4 D 14.0 E 22.4 C 11.3 F 18.7 D 9.0 F 16.0 E 17.4 D 25.2 C 6.7 F 12.6 F
SR 434 to Church Ave. 0.21 17.4 D 13.3 E 10.2 F 21.5 D 18.1 D 18.5 D 14.8 E 20.3 D 33.2 B 26.2 C
Church Ave. to Longwood Hills Rd. 0.93 35.0 A 29.4 B 35.3 A 26.9 C 36.0 A 24.5 C 39.0 A 33.8 B 32.8 B 28.5 B 39.9 A 32.9 B 36.6 A 28.9 B 37.6 A 32.5 B 35.9 A 35.4 A 36.6 A 34.2 B
Longwood Hills Rd. to Longwood Lake Mary Rd. 0.59 43.3 A 43.3 A 32.1 B 32.1 B 29.8 B 29.8 B 40.3 A 40.3 A 37.0 A 37.0 A 40.2 A 40.2 A 32.2 B 32.2 B 39.3 A 39.3 A 41.6 A 41.6 A 36.5 A 36.5 A
Longwood Lake Mary Rd. to General Hutchison Rd. 0.10 32.2 B 21.9 D 34.8 B 33.4 B 33.2 B 28.1 B 28.6 B 27.3 C 33.3 B 24.0 C
General Hutchison Rd. to Country Club Rd. 1.02 50.5 A 47.8 A 43.7 A 35.7 A 38.9 A 38.5 A 44.2 A 42.9 A 46.5 A 44.8 A 41.1 A 38.8 A 41.9 A 40.2 A 39.5 A 38.0 A 39.0 A 38.4 A 41.9 A 39.3 A
Country Club Rd. to Silkwood Ct. 0.71 47.8 A 42.1 A 36.7 A 37.1 A 43.1 A 41.4 A 40.2 A 37.6 A 39.1 A 33.7 B
Silkwood Ct. to US 17/92 0.27 10.2 F 23.6 C 16.2 E 29.1 B 6.8 F 16.6 E 8.6 F 19.3 D 6.9 F 17.5 D 10.0 F 21.7 D 13.2 E 25.0 C 10.1 F 20.8 D 6.9 F 16.4 E 13.6 E 23.4 C
US 17/92 to County Home Rd. 0.85 47.0 A 47.0 A 36.0 A 36.0 A 38.4 A 38.4 A 39.3 A 39.3 A 45.0 A 45.0 A 41.5 A 41.5 A 42.0 A 42.0 A 43.1 A 43.1 A 42.7 A 42.7 A 40.3 A 40.3 A
County Home Rd. to Bedford Rd. 1.49 52.8 A 47.3 A 48.1 A 48.5 A 49.5 A 43.9 A 44.5 A 43.2 A 44.3 A 42.4 A
Bedford Rd. to SR 417 (SB Ramps) 0.61 37.9 A 33.2 B 37.6 A 30.2 B 40.4 A 34.5 B 34.4 B 29.5 B 36.1 A 30.5 B
SR 417 (SB Ramps) to SR 417 (NB Ramps) 0.09 11.0 F 32.6 B 35.5 A 30.4 B 40.4 A 35.3 A 28.4 B 20.8 D 30.0 B 20.8 D
SR 417 (NB Ramps) to Lake Mary Blvd. 0.26 32.3 B 40.7 A 17.9 D 37.0 A 18.4 D 39.1 A 25.3 C 38.5 A 12.0 F 36.5 A 15.9 E 35.7 A 26.7 C 38.3 A 20.3 D 34.0 B 12.7 F 33.6 B 20.3 D 34.0 B
Average 30.2 B 29.6 B 26.5 C 31.1 B 30.2 B 29.5 B 28.7 B 27.1 C 28.3 B 26.0 C
Note: *Additional control point added at Ballard St.
Average Speed Average SpeedAverage SpeedAverage Speed Average Speed Average Speed
TABLE C7.1aYear 2014 Seminole County Travel Time & Delay Study
CR 427 (Ronald Regan Boulevard) - Northbound Direction Historical Summary
Year 2005 Year 2006 Year 2007 Year 2008
Average Speed Average Speed
Year 2012
Rdwy Segment Rdwy Section
Average Speed Average SpeedAverage Speed Average Speed
Segments (mile) (mph) LOS (mph) LOS (mph) LOS (mph) LOS (mph) LOS (mph) LOS (mph) LOS (mph) LOS (mph) LOS (mph) LOS (mph) LOS (mph) LOS (mph) LOS (mph) LOS (mph) LOS (mph) LOS (mph) LOS (mph) LOS (mph) LOS (mph) LOS
AM PEAK HOUR
Lake Mary Blvd. to SR 417 (NB Ramps) 0.23 29.8 B 20.2 D 23.0 C 23.3 C 26.4 C 35.0 B 40.0 A 37.9 A 32.7 B 40.0 A
SR 417 (NB Ramps) to SR 417 (SB Ramps) 0.09 41.5 A 29.1 B 29.0 B 26.6 C 33.7 B 30.0 B 41.5 A 17.4 D 45.0 A 45.0 A
SR 417 (SB Ramps) to Bedford Rd. 0.60 51.8 A 45.2 A 46.7 A 42.9 A 46.7 A 44.1 A 44.8 A 43.3 A 44.3 A 43.8 A
Bedford Rd. to County Home Rd. 1.49 53.1 A 48.4 A 49.7 A 42.0 A 50.1 A 43.0 A 48.4 A 41.4 A 49.1 A 44.1 A 44.3 A 42.5 A 46.3 A 45.0 A 46.3 A 42.1 A 44.5 A 42.9 A 43.8 A 43.4 A
County Home Rd. to US 17/92 1.06 26.9 C 26.9 C 27.4 C 27.4 C 28.0 B 28.0 B 28.0 B 28.0 B 32.7 B 32.7 B 27.6 C 27.6 C 22.6 C 22.6 C 21.7 D 21.7 D 18.5 D 18.5 D 17.4 D 17.4 D
US 17-92 to Silkwood Ct. 0.30 17.8 D 28.0 B 26.4 C 23.4 C 22.2 C 31.7 B 23.5 C 17.9 D 18.9 D 19.8 D
Silkwood Ct. to Country Club Rd. 0.69 49.1 A 32.0 B 38.6 A 34.6 B 41.8 A 35.5 A 37.6 A 31.7 B 42.9 A 33.4 B 32.9 B 32.5 B 31.1 B 28.4 B 33.4 B 26.6 C 36.6 A 28.7 B 39.4 A 30.5 B
Country Club Rd. to General Hutchison 1.01 40.2 A 38.2 A 39.9 A 37.6 A 46.2 A 39.7 A 37.8 A 38.5 A 42.8 A 41.9 A
General Hutchison to Longwood Lake Mary Rd. 0.10 9.7 F 30.6 B 6.9 F 23.7 C 16.7 E 35.1 A 12.6 F 31.5 B 24.5 C 42.5 A 22.5 C 36.2 A 16.2 E 33.8 B 17.1 D 34.6 B 15.8 E 37.1 A 17.6 D 37.3 A
Longwood Lake Mary Rd. to Longwood Hills Rd. 0.59 26.4 C 26.4 C 18.5 D 18.5 D 21.4 D 21.4 D 23.8 C 23.8 C 33.0 B 33.0 B 21.0 D 21.0 D 30.3 B 30.3 B 26.8 C 26.8 C 24.9 C 24.9 C 26.4 C 26.4 C
Longwood Hills Rd. to Church Ave. 0.93 21.5 D 21.1 D 21.1 D 30.9 B 31.5 B 37.7 A 33.8 B 33.6 B 40.3 A 37.1 A
Church Ave. to SR 434 0.21 6.5 F 15.0 E 3.7 F 11.4 F 3.8 F 11.6 F 4.4 F 14.9 E 9.6 F 22.4 C 9.3 F 24.1 C 7.6 F 20.8 D 6.7 F 19.4 D 7.5 F 22.5 C 5.2 F 17.5 D
SR 434 to Wildmere Ave. 0.37 28.2 B 36.5 A 33.9 B 22.9 C 14.1 E 37.0 A 36.8 A 37.4 A 37.4 A 36.2 A
Wildmere Ave. to Dog Track Rd. 0.52 18.7 D 22.0 C 29.3 B 32.1 B 27.4 C 29.9 B 34.0 B 28.0 B 32.5 B 20.6 D 30.3 B 32.8 B 34.4 B 35.4 A 26.2 C 30.0 B 36.9 A 37.1 A 33.3 B 34.5 B
Dog Track Rd. to North St. 0.11 13.4 E 13.4 E 17.9 D 17.9 D 19.0 D 19.0 D 25.3 C 25.3 C 29.2 B 29.2 B 26.4 C 26.4 C 12.0 F 12.0 F 17.4 D 17.4 D 16.9 E 16.9 E 16.1 E 16.1 E
North St. to Magnolia/Plumosa Ave. 0.60 36.3 A 31.8 B 33.1 B 37.5 A 35.7 A 30.8 B 35.9 A 36.2 A 38.1 A 32.4 B
Magnolia/Plumosa Ave. to First St. 0.65 45.6 A 42.0 A 44.3 A 44.4 A 42.4 A 39.2 A 41.7 A 42.6 A 41.2 A 39.2 A
First St. to SR 436 0.37 27.5 C 37.0 A 18.8 D 30.4 B 21.1 D 32.7 B 14.4 E 29.6 B 29.8 B 36.6 A 15.9 E 27.2 C 10.9 F 24.8 C 11.1 F 25.2 C 10.3 F 24.4 C 13.6 E 26.2 C
SR 436 to Orienta Blvd. 0.14 ---- ---- ---- ---- ---- ---- ---- ---- ---- ---- ---- ---- ---- ---- ---- ---- ---- ---- ---- ---- 27.1 C 27.1 C 28.0 B 28.0 B 28.0 B 28.0 B 29.0 B 29.0 B 28.0 B 28.0 B
Orienta Ave. to Ballard St.* 0.54 ---- ---- ---- ---- ---- ---- ---- ---- ---- ---- ---- ---- ---- ---- ---- ---- ---- ---- ---- ---- ---- ---- ---- ---- 30.3 A 30.3 A 30.0 B 30.0 B 26.6 B 26.6 B 23.3 C 23.3 C
Average 28.6 B 25.7 C 27.2 C 28.0 B 32.8 B 30.9 B 29.2 B 28.1 B 28.7 B 27.6 C
PM PEAK HOUR
Lake Mary Blvd. to SR 417 (NB Ramps) 0.23 29.5 B 22.8 C 26.7 C 18.6 D 36.6 A 40.6 A 36.0 A 41.1 A 40.0 A 37.9 A
SR 417 (NB Ramps) to SR 417 (SB Ramps) 0.09 35.0 A 35.8 A 38.5 A 37.3 A 43.0 A 27.3 C 41.5 A 27.0 C 45.0 A 38.6 A
SR 417 (SB Ramps) to Bedford Rd. 0.60 50.8 A 46.3 A 48.3 A 47.5 A 47.6 A 43.1 A 43.8 A 44.3 A 44.3 A 41.8 A
Bedford Rd. to County Home Rd. 1.49 49.1 A 45.7 A 48.7 A 43.2 A 50.0 A 45.1 A 48.7 A 42.0 A 49.0 A 46.8 A 44.8 A 42.8 A 44.9 A 43.4 A 46.3 A 44.1 A 44.7 A 44.1 A 44.3 A 42.7 A
County Home Rd. to US 17/92 1.06 27.0 C 27.0 C 23.9 C 23.9 C 24.8 C 24.8 C 27.1 C 27.1 C 27.7 C 27.7 C 21.7 D 21.7 D 17.1 D 17.1 D 18.0 D 18.0 D 21.0 D 21.0 D 15.5 E 15.5 E
US 17-92 to Silkwood Ct. 0.30 13.4 E 18.5 D 18.7 D 19.7 D 37.1 A 35.7 A 30.0 B 39.5 A 32.8 B 31.1 B
Silkwood Ct. to Country Club Rd. 0.69 35.4 A 23.6 C 31.2 B 25.8 C 39.9 A 29.7 B 37.4 A 29.4 B 37.9 A 37.7 A 31.8 B 32.9 B 35.4 A 33.6 B 30.4 B 32.7 B 40.6 A 37.9 A 37.6 A 35.4 A
Country Club Rd. to General Hutchison 1.01 47.2 A 40.7 A 42.2 A 30.3 B 38.3 A 40.5 A 40.0 A 38.5 A 38.5 A 40.3 A
General Hutchison to Longwood Lake Mary Rd. 0.10 15.9 E 39.6 A 17.1 D 35.9 A 10.5 F 32.9 B 10.8 F 25.7 C 14.3 E 32.9 B 14.5 E 33.0 B 13.0 E 33.8 B 14.0 E 33.3 B 9.5 F 30.3 B 10.9 F 32.5 B
Longwood Lake Mary Rd. to Longwood Hills Rd. 0.59 30.8 B 30.8 B 27.5 C 27.5 C 24.3 C 24.3 C 27.1 C 27.1 C 20.8 D 20.8 D 28.0 C 28.0 C 23.1 C 23.1 C 26.0 C 26.0 C 31.3 B 31.3 B 23.9 C 23.9 C
Longwood Hills Rd. to Church Ave. 0.93 36.9 A 31.1 B 28.3 B 32.1 B 34.4 B 37.0 A 37.3 A 33.6 B 36.6 A 31.3 B
Church Ave. to SR 434 0.21 6.1 F 19.5 D 9.2 F 21.9 D 6.5 F 17.7 D 9.4 F 22.5 C 10.9 F 24.8 C 6.4 F 19.7 D 6.4 F 19.9 D 5.9 F 18.2 D 12.4 F 27.0 C 5.9 F 17.5 D
SR 434 to Wildmere Ave. 0.37 37.7 A 24.2 C 34.2 B 24.9 C 36.3 A 36.4 A 35.6 A 37.4 A 36.8 A 36.2 A
Wildmere Ave. to Dog Track Rd. 0.52 36.1 A 36.8 A 34.1 B 29.0 B 39.4 A 36.9 A 39.3 A 31.3 B 33.0 B 34.4 B 28.9 B 31.6 B 30.3 B 32.4 B 34.0 B 35.4 A 35.2 A 35.8 A 35.6 A 35.8 A
Dog Track Rd. to North St. 0.11 27.6 C 27.6 C 23.6 C 23.6 C 26.9 C 26.9 C 18.5 D 18.5 D 15.6 E 15.6 E 15.3 E 15.3 E 10.6 F 10.6 F 15.7 E 15.7 E 17.8 D 17.8 D 20.6 D 20.6 D
North St. to Magnolia/Plumosa Ave. 0.60 39.5 A 43.4 A 35.6 A 33.0 B 38.6 A 35.0 A 34.9 B 35.9 A 32.1 B 30.2 B
Magnolia/Plumosa Ave. to First St. 0.65 46.4 A 46.5 A 43.9 A 43.5 A 45.0 A 39.6 A 40.0 A 41.7 A 42.1 A 38.8 A
First St. to SR 436 0.37 24.9 C 37.2 A 8.3 F 23.1 C 35.0 A 38.6 A 16.9 E 30.0 B 23.2 C 35.7 A 14.2 E 25.9 C 13.7 E 27.0 C 7.3 F 19.9 D 10.9 F 24.1 C 11.1 F 23.5 C
SR 436 to Orienta Blvd. 0.14 ---- ---- ---- ---- ---- ---- ---- ---- ---- ---- ---- ---- ---- ---- ---- ---- ---- ---- ---- ---- 25.5 C 25.5 C 27.1 B 27.1 B 30.0 B 30.0 B 28.0 B 28.0 B 28.0 B 28.0 B
Orienta Ave. to Ballard St.* 0.54 ---- ---- ---- ---- ---- ---- ---- ---- ---- ---- ---- ---- ---- ---- ---- ---- ---- ---- ---- ---- ---- ---- ---- ---- 23.8 C 23.8 C 26.6 B 26.6 B 24.2 B 24.2 B 25.3 B 25.3 B
Average 32.0 B 28.6 B 31.0 B 29.8 B 33.0 B 29.1 B 27.7 C 26.7 C 30.2 B 26.8 C
Note: *Additional control point added at Ballard St.
Year 2013
Rdwy Segment Rdwy Section
Average Speed Average Speed
TABLE C7.1bYear 2014 Seminole County Travel Time & Delay Study
CR 427 (Ronald Regan Boulevard) - Southbound Direction Historical Summary
Year 2014Year 2005 Year 2006 Year 2007 Year 2008 Year 2009 Year 2010 Year 2011
Average Speed Average Speed Average Speed Average Speed Average Speed Average Speed Average Speed Average Speed Average Speed Average Speed Average Speed Average Speed Average Speed Average Speed
D-10 CR 427 - SB
Roadway Distance
Segments (mile) (mph) LOS (mph) LOS (mph) LOS (mph) LOS (mph) LOS (mph) LOS (mph) LOS (mph) LOS (mph) LOS (mph) LOS (mph) LOS (mph) LOS (mph) LOS (mph) LOS (mph) LOS (mph) LOS (mph) LOS (mph) LOS (mph) LOS (mph) LOS
AM PEAK HOUR
Orange Blvd. to International Blvd. 0.30 11.9 F 15.5 E 10.5 F 9.3 F 8.1 F 15.5 E 13.8 E 16.7 E 10.7 F 7.3 F
International Blvd. to I-4 WB Ramps 0.24 18.2 D 12.7 F 17.3 D 11.7 F 13.6 E 17.5 D 26.0 C 17.9 D 32.1 B 12.2 F
I-4 WB Ramps to I-4 EB Ramps 0.27 22.9 C 16.3 E 25.1 C 33.6 B 29.1 B 32.4 B 31.8 B 37.7 A 38.6 A 35.2 A
I-4 EB Ramps to Rinehart Rd. 0.15 9.2 F 14.5 E 8.3 F 13.1 E 8.2 F 13.5 E 16.7 E 13.8 E 18.7 D 13.4 E 14.8 E 18.6 D 9.8 F 17.5 D 36.0 A 22.5 C 34.6 B 20.4 D 21.4 D 12.8 F
Rinehart Rd. to Bright Meadow Dr. 0.56 38.0 A 30.6 B 29.1 B 43.8 A 39.2 A 38.4 A 39.3 A 38.9 A 39.3 A 37.6 A
Bright Meadow Dr. to Oregon Ave. 0.57 40.2 A 39.4 A 36.3 A 38.0 A 33.2 B 34.2 B 39.8 A 34.5 B 34.5 B 38.0 A
Oregon Ave. to Rantoul Ln. 0.40 41.1 A 43.3 A 43.3 A 45.3 A 39.6 A 37.8 A 43.2 A 42.4 A 41.0 A 39.7 A
Rantoul Ln. to Country Club (West) 0.25 39.4 A 42.8 A 41.4 A 45.3 A 34.5 B 26.7 C 30.6 B 32.0 B 36.9 A 29.4 B
Country Club (West) to Upsala Rd. 0.10 20.0 D 21.0 D 26.3 C 34.6 B 35.6 A 35.3 A 40.0 A 30.0 B 42.9 A 35.3 A
Upsala Rd. to Vihlen Rd. 0.49 30.0 B 35.9 A 32.3 B 38.0 A 31.8 B 34.9 B 36.6 A 37.0 A 38.0 A 31.9 B
Vihlen Rd. to Country Club (East) 0.07 31.0 B 30.4 B 36.2 A 36.4 A 30.1 B 34.3 B 24.0 C 24.0 C 24.0 C 17.1 D
Country Club (East) to Casa Verde Blvd. 0.09 26.0 C 36.3 A 37.9 A 40.0 A 42.4 A 48.0 A 40.0 A
Casa Verde Blvd. to SR 417 SB 0.18 32.6 B 40.7 A 40.8 A 37.8 A 37.8 A 36.4 A 32.9 B
SR 417 SB to SR 417 NB 0.11 10.6 F 16.6 E 9.8 F 24.9 C 20.5 D 25.7 C 25.7 C 21.2 D 40.0 A 37.9 A
SR 417 NB to Airport Blvd. 0.21 6.5 F 25.5 C 8.9 F 28.1 B 12.5 F 28.3 B 16.2 E 35.9 A 18.0 D 32.6 B 18.4 D 32.8 B 22.4 C 35.6 A 21.5 D 33.9 B 10.2 F 32.0 B 14.6 E 32.0 B
Airport Blvd. to Old Lake Mary Rd. 0.25 25.3 C 28.4 B 14.9 E 21.5 D 20.6 D 22.7 C 35.7 A 37.5 A 35.7 A 32.6 B
Old Lake Mary Rd. to RR Tracks 0.09 25.6 C 26.1 C 22.5 C 33.9 B 31.9 B 31.6 B 40.0 A 40.0 A 40.0 A 37.5 A
RR Tracks to Hardy Ave. 0.27 34.0 B 37.9 A 36.0 A 42.3 A 37.3 A 36.8 A 36.8 A 38.6 A 40.5 A 39.5 A
Hardy Ave. to Ridgewood Ave. 0.23 22.6 C 34.2 B 39.4 A 26.4 C 30.1 B 12.9 F 24.4 C 35.7 A 26.4 C 40.0 A
Ridgewood Ave. to Georgia Ave. 0.15 31.2 B 22.6 C 27.3 C 34.7 B 34.9 B 25.3 C 31.0 B 36.9 A 36.9 A 38.4 A
Georgia Ave. to Hartwell Ave. 0.06 30.8 B 20.8 D 37.2 A 22.5 C 22.9 C 27.7 C 25.7 C 18.9 D 24.0 C 40.0 A
Hartwell Ave. to Grenada Ave. 0.25 35.8 A 30.3 B 37.6 A 39.2 A 37.1 A 31.2 B 36.6 A 35.7 A 37.5 A 41.7 A
Grenada Ave. to US 17/92 0.19 13.9 E 25.8 C 11.5 F 25.1 C 11.2 F 23.4 C 10.0 F 25.0 C 14.0 E 26.7 C 17.5 D 22.8 C 11.4 D 26.4 A 8.8 F 25.7 C 11.6 F 27.6 C 9.7 F 27.8 C
Average 22.6 C 22.9 C 22.7 C 25.6 C 25.0 C 26.2 C 28.0 C 29.0 B 28.2 B 24.7 C
PM PEAK HOUR
Orange Blvd. to International Blvd. 0.30 11.4 F 8.1 F 13.5 E 11.9 F 14.7 E 12.3 F 22.2 C 15.8 E 13.5 E 9.3 F
International Blvd. to I-4 WB Ramps 0.24 15.0 E 14.0 E 13.5 E 9.1 F 12.5 F 13.1 E 22.3 C 17.2 D 31.4 B 14.7 E
I-4 WB Ramps to I-4 EB Ramps 0.27 19.0 D 28.9 B 17.2 D 20.3 D 19.1 D 21.6 D 25.7 C 35.2 A 27.0 C 23.1 C
I-4 EB Ramps to Rinehart Rd. 0.15 9.3 F 13.2 E 12.1 F 12.8 F 12.2 F 14.1 E 12.2 F 12.5 F 10.0 F 14.0 E 6.4 F 12.2 F 10.5 F 19.5 D 12.5 F 18.3 D 27.3 C 21.1 D 19.1 D 14.1 E
Rinehart Rd. to Bright Meadow Dr. 0.56 38.8 A 38.9 A 37.8 A 39.4 A 37.1 A 36.4 A 37.6 A 38.0 A 39.3 A 36.0 A
Bright Meadow Dr. to Oregon Ave. 0.57 36.0 A 32.3 B 33.8 B 38.9 A 35.5 A 37.6 A 37.2 A 26.1 C 38.4 A 24.6 C
Oregon Ave. to Rantoul Ln. 0.40 40.5 A 40.7 A 43.0 A 45.1 A 39.5 A 41.0 A 41.7 A 41.0 A 41.7 A 37.8 A
Rantoul Ln. to Country Club (West) 0.25 24.7 C 41.2 A 42.1 A 21.4 D 26.6 C 24.0 C 26.7 C 38.9 A 22.9 C 30.0 B
Country Club (West) to Upsala Rd. 0.10 16.2 E 37.0 A 21.5 D 37.4 A 20.4 D 35.3 A 37.5 A 40.0 A 40.0 A 37.5 A
Upsala Rd. to Vihlen Rd. 0.49 33.4 B 32.7 B 33.7 B 45.4 A 39.7 A 40.0 A 38.0 A 41.1 A 39.5 A 36.6 A
Vihlen Rd. to Country Club (East) 0.07 33.0 B 33.0 B 36.4 A 46.8 A 39.2 A 40.0 A 24.0 C 26.7 C 16.0 E 24.0 C
Country Club (East) to Casa Verde Blvd. 0.09 30.5 B 26.7 C 37.9 A 51.4 A 40.0 A 51.4 A 48.0 A
Casa Verde Blvd. to SR 417 SB 0.18 39.8 A 33.8 B 27.6 C 36.4 A 39.2 A 25.5 C 32.9 B
SR 417 SB to SR 417 NB 0.11 13.6 E 12.4 F 15.8 E 45.3 A 37.4 A 28.8 B 27.7 C 37.9 A 32.7 B 36.0 A
SR 417 NB to Airport Blvd. 0.21 8.9 F 26.4 C 12.1 F 29.2 B 7.3 F 25.9 C 16.5 E 35.5 A 25.1 C 34.2 B 20.4 D 33.5 B 19.3 D 34.0 B 33.5 B 35.3 A 21.1 D 33.6 B 30.0 B 32.1 B
Airport Blvd. to Old Lake Mary Rd. 0.25 9.9 F 10.7 F 21.9 D 25.5 C 21.7 D 34.9 B 34.9 B 35.7 A 37.5 A 34.9 B
Old Lake Mary Rd. to RR Tracks 0.09 29.7 B 17.8 D 29.9 B 33.9 B 34.8 B 31.6 B 37.5 A 37.5 A 40.0 A 35.3 A
RR Tracks to Hardy Ave. 0.27 37.0 A 39.2 A 36.3 A 39.0 A 37.3 A 31.8 B 35.2 A 36.0 A 37.7 A 37.7 A
Hardy Ave. to Ridgewood Ave. 0.23 23.2 C 23.7 C 26.8 C 26.8 C 18.5 D 11.2 F 20.3 D 21.3 D 31.4 B 40.0 A
Ridgewood Ave. to Georgia Ave. 0.15 29.5 B 23.1 C 28.0 B 33.9 B 32.5 B 31.0 B 31.0 B 28.2 B 38.4 A 21.3 D
Georgia Ave. to Hartwell Ave. 0.06 27.6 C 31.8 B 35.5 A 35.4 A 35.6 A 30.0 B 16.4 E 22.5 C 45.0 A 40.0 A
Hartwell Ave. to Grenada Ave. 0.25 34.0 B 35.2 A 35.2 A 37.7 A 27.8 C 30.6 B 31.2 B 33.3 B 41.7 A 39.5 A
Grenada Ave. to US 17/92 0.19 4.2 F 14.8 E 6.1 F 16.8 E 3.0 F 15.0 E 5.9 F 21.7 D 9.3 F 22.2 C 9.2 F 20.1 D 9.7 D 23.2 B 7.5 F 21.8 D 10.3 F 28.1 B 7.1 F 23.1 C
Average 19.1 D 20.6 D 19.3 D 23.7 C 24.4 C 22.6 C 27.2 C 26.6 C 29.3 B 24.3 C
Rdwy Section
Year 2005 Year 2006 Year 2007 Year 2008 Year 2009 Year 2010 Year 2011
Rdwy Segment Rdwy Section Rdwy Segment
Average Speed Average Speed Average Speed Average Speed Average Speed
B
C23.7 C25.1 D
29.0 B 26.9 C 31.7
18.5
TABLE C8.1aYear 2014 Seminole County Travel Time & Delay Study
Average Speed Average Speed Average Speed Average Speed Average Speed Average Speed Average Speed Average Speed
Rdwy Segment
Year 2012
Rdwy Segment Rdwy Section
Average Speed Average Speed
Rdwy Segment Rdwy Section
Year 2014Year 2013
Rdwy Segment Rdwy Section
Average Speed Average SpeedAverage Speed Average Speed
D-11 CR 46A - EB
Roadway Distance
Segments (mile) (mph) LOS (mph) LOS (mph) LOS (mph) LOS (mph) LOS (mph) LOS (mph) LOS (mph) LOS (mph) LOS (mph) LOS (mph) LOS (mph) LOS (mph) LOS (mph) LOS (mph) LOS (mph) LOS (mph) LOS (mph) LOS (mph) LOS (mph) LOS
AM PEAK HOUR
US 17/92 to Grenada Ave. 0.18 31.4 B 28.0 C 30.5 B 34.6 B 30.0 B 31.7 B 35.6 A 36.8 A 38.0 A 36.8 A
Grenada Ave. to Hartwell Ave. 0.25 36.7 A 32.5 B 33.0 B 39.6 A 32.5 B 34.1 B 36.6 A 34.1 B 42.9 A 27.8 C
Hartwell Ave. to Georgia Ave. 0.06 33.2 B 24.2 C 31.0 B 40.6 A 35.5 A 30.0 B 40.0 A 36.0 A 40.0 A 40.0 A
Georgia Ave. to Ridgewood Ave. 0.16 25.5 C 12.0 F 26.4 C 27.4 C 20.8 D 15.5 E 21.3 D 22.9 C 40.0 A 23.4 C
Ridgewood Ave. to Hardy Ave. 0.23 38.7 A 34.1 B 38.6 A 38.7 A 36.6 A 34.7 B 40.0 A 40.0 A 44.0 A 41.2 A
Hardy Ave. to RR Tracks 0.27 35.7 A 37.0 A 35.5 A 42.2 A 39.2 A 37.7 A 39.5 A 24.5 C 39.5 A 39.5 A
RR Tracks to Old Lake Mary Rd. 0.10 24.2 C 14.1 E 14.6 E 11.2 F 24.2 C 22.2 C 19.4 D 37.5 A 42.9 A 25.0 C
Old Lake Mary Rd. to Airport Blvd. 0.25 8.8 F 22.6 C 11.4 F 21.0 D 8.4 F 21.2 D 21.2 D 29.5 B 28.5 B 30.7 B 23.4 C 27.6 C 26.3 C 31.1 B 29.4 B 30.7 B 34.9 B 39.8 A 32.6 B 32.4 B
Airport Blvd. to SR 417 NB 0.20 23.3 C 16.8 E 17.7 D 34.6 B 37.5 A 35.6 A 34.5 B 31.7 B 34.5 B 36.8 A
SR 417 NB to SR 417 SB 0.11 27.5 C 26.4 C 23.6 C 39.9 A 41.5 A 42.4 A 42.4 A 37.9 A 40.0 A 42.4 A
SR 417 SB to Casa Verde Blvd. 0.17 39.7 A 39.2 A 42.5 A 39.2 A 26.8 C 36.4 A 37.8 A
Casa Verde Blvd. to Country Club (East) 0.10 39.2 A 38.1 A 42.4 A 48.0 A 40.0 A 51.4 A 48.0 A
Country Club (East) to Vihlen Rd. 0.05 10.0 F 21.9 D 16.5 E 28.3 B 15.9 E 48.0 A 24.0 C 21.8 D 26.7 C 24.0 C
Vihlen Rd. to Upsala Rd. 0.51 28.2 B 23.3 C 25.9 C 42.4 A 35.6 A 34.1 B 38.0 A 38.0 A 39.5 A 37.5 A
Upsala Rd. to Country Club (West) 0.10 32.9 B 32.5 B 32.9 B 42.7 A 37.1 A 37.5 A 37.5 A 35.3 A 42.9 A 40.0 A
Country Club (West) to Rantoul Ln. 0.25 39.4 A 41.5 A 41.3 A 45.4 A 40.2 A 41.1 A 37.9 A 37.9 A 36.9 A 36.0 A
Rantoul Ln. to Oregon Ave. 0.39 34.8 B 33.1 B 31.6 B 39.0 A 31.7 B 36.7 A 34.2 B 33.2 B 41.0 A 37.8 A
Oregon Ave. to Bright Meadow Dr. 0.58 41.4 A 42.3 A 39.8 A 45.0 A 37.8 A 39.8 A 38.4 A 39.8 A 38.0 A 37.6 A
Bright Meadow Dr. to Rinehart Rd. 0.58 18.7 D 26.4 C 22.0 C 27.0 C 22.5 C 27.3 C 22.3 C 35.5 A 18.7 D 30.2 B 20.2 D 32.3 B 19.3 D 31.5 B 22.7 C 32.5 B 14.8 E 29.5 B 19.6 D 32.0 B
Rinehart Rd. to I-4 EB Ramps 0.15 11.3 F 31.4 B 23.1 C 16.2 E 31.5 B 26.5 C 20.5 D 14.5 E 31.0 B 33.3 B
I-4 EB Ramps to I-4 WB Ramps 0.26 19.9 D 24.3 C 36.6 A 36.6 A 30.3 B 24.5 C 25.7 C 26.6 C 33.7 B 34.5 B
I-4 WB Ramps to International Blvd. 0.22 17.4 D 16.6 E 13.6 E 25.1 C 28.2 B 22.6 C 18.2 D 10.2 F 9.2 F 11.0 F
International Blvd. to Orange Blvd. 0.30 22.8 C 17.8 D 31.1 B 24.1 C 26.0 C 22.5 C 33.4 B 27.2 C 31.9 B 30.4 B 26.1 C 24.8 C 25.7 C 22.5 C 24.7 C 17.2 D 25.4 C 19.1 D 20.2 D 19.8 D
Average 23.4 C 24.6 C 24.4 C 32.1 B 30.6 B 29.6 B 29.5 B 27.6 C 29.0 B 29.1 B
PM PEAK HOUR
US 17/92 to Grenada Ave. 0.18 30.9 B 30.9 B 30.9 B 33.6 B 30.6 B 28.5 B 34.5 A 36.8 A 38.0 A 35.6 A
Grenada Ave. to Hartwell Ave. 0.25 24.2 C 25.2 C 28.3 B 37.3 A 38.7 A 30.6 B 32.6 B 34.9 B 33.3 B 32.6 B
Hartwell Ave. to Georgia Ave. 0.06 24.0 C 24.9 C 34.5 B 38.3 A 20.3 D 30.0 B 36.0 A 36.0 A 40.0 A 40.0 A
Georgia Ave. to Ridgewood Ave. 0.16 32.6 B 22.2 C 16.8 E 30.6 B 20.0 D 29.1 B 21.3 D 15.0 E 28.2 B 25.3 C
Ridgewood Ave. to Hardy Ave. 0.23 38.1 A 27.4 C 37.6 A 40.4 A 36.8 A 33.0 B 37.7 A 40.0 A 41.2 A 38.8 A
Hardy Ave. to RR Tracks 0.27 25.0 C 25.5 C 36.4 A 42.9 A 38.5 A 33.1 B 38.6 A 40.5 A 27.9 C 37.7 A
RR Tracks to Old Lake Mary Rd. 0.10 14.5 E 14.3 E 9.5 F 21.7 D 23.0 C 14.3 E 12.8 F 20.7 D 37.5 A 14.6 E
Old Lake Mary Rd. to Airport Blvd. 0.25 9.4 F 20.4 D 11.3 F 20.5 D 15.8 E 23.2 C 17.6 D 30.5 B 23.4 C 29.3 B 18.5 D 26.0 C 21.1 D 27.4 C 16.0 E 26.2 C 33.3 B 33.5 B 23.4 C 29.3 B
Airport Blvd. to SR 417 NB 0.20 26.3 C 29.1 B 18.8 D 33.3 B 15.5 E 15.6 E 29.2 B 36.8 A 28.5 B 34.5 B
SR 417 NB to SR 417 SB 0.11 20.8 D 19.0 D 15.7 E 41.5 A 32.4 B 28.8 B 31.3 B 24.0 C 40.0 A 37.9 A
SR 417 SB to Casa Verde Blvd. 0.17 30.7 B 40.8 A 39.2 A 32.9 B 37.8 A 39.2 A 35.2 A
Casa Verde Blvd. to Country Club (East) 0.10 36.7 A 39.9 A 40.0 A 48.0 A 40.0 A 51.4 A 48.0 A
Country Club (East) to Vihlen Rd. 0.05 13.1 E 16.8 E 11.4 F 28.4 B 13.8 E 18.5 D 26.7 C 26.7 C 18.5 D 24.0 C
Vihlen Rd. to Upsala Rd. 0.51 28.7 B 27.8 C 24.8 C 26.7 C 29.1 B 32.3 B 31.2 B 28.8 B 21.7 D 17.5 D
Upsala Rd. to Country Club (West) 0.10 35.8 A 35.9 A 34.6 B 24.8 C 27.8 C 25.0 C 37.5 A 35.3 A 35.3 A 35.3 A
Country Club (West) to Rantoul Ln. 0.25 42.5 A 44.5 A 46.3 A 41.7 A 40.4 A 37.9 A 38.9 A 37.9 A 31.3 B 35.1 A
Rantoul Ln. to Oregon Ave. 0.39 33.4 B 34.7 B 35.4 A 38.6 A 37.0 A 28.0 C 33.7 B 32.8 B 28.3 B 28.6 B
Oregon Ave. to Bright Meadow Dr. 0.58 41.1 A 42.2 A 45.0 A 43.1 A 41.2 A 39.8 A 38.4 A 37.6 A 38.0 A 35.3 A
Bright Meadow Dr. to Rinehart Rd. 0.58 17.3 D 27.8 C 16.2 E 27.5 C 21.4 D 27.7 C 19.4 D 30.3 B 16.8 E 26.6 C 19.8 D 27.2 C 14.7 E 27.3 C 20.1 D 29.5 B 16.2 E 25.5 C 21.1 D 26.4 C
Rinehart Rd. to I-4 EB Ramps 0.15 30.9 B 17.9 D 18.3 D 19.2 D 18.5 D 20.5 D 18.0 D 20.0 D 19.1 D 32.1 B
I-4 EB Ramps to I-4 WB Ramps 0.26 39.6 A 39.4 A 32.2 B 37.5 A 29.1 B 28.9 B 32.4 B 36.0 A 27.9 C 31.8 B
I-4 WB Ramps to International Blvd. 0.22 8.6 F 20.5 D 9.4 F 14.1 E 11.7 F 13.1 E 28.7 B 18.9 D 10.7 F 10.1 F
International Blvd. to Orange Blvd. 0.30 19.5 D 17.8 D 22.8 C 24.0 C 20.8 D 17.2 D 18.5 D 20.0 D 19.1 D 18.1 D 20.9 D 19.6 D 19.1 D 23.6 C 19.6 D 22.4 C 18.6 D 17.2 D 17.1 D 17.8 D
Average 23.2 C 24.6 C 23.9 C 27.9 C 25.4 C 25.4 C 26.7 C 27.2 C 25.3 C 25.2 C
Year 2013
Rdwy Segment Rdwy Section
Average Speed Average Speed
32.9 B35.4 A 31.5 B
C23.1 C 23.9
TABLE C8.1bYear 2014 Seminole County Travel Time & Delay Study
CR 46A - Westbound Direction Historical Summary
19.1 D
Rdwy Section
Year 2014
Average Speed
Year 2005 Year 2006 Year 2007 Year 2008 Year 2009 Year 2010 Year 2011
Average Speed Average Speed Average Speed Average Speed Average Speed Average Speed Average Speed Average Speed Average Speed Average Speed Average Speed Average Speed Average Speed Average Speed Average Speed
D-12 CR 46A - WB
Roadway Distance
Segments (mile) (mph) LOS (mph) LOS (mph) LOS (mph) LOS (mph) LOS (mph) LOS (mph) LOS (mph) LOS (mph) LOS (mph) LOS (mph) LOS (mph) LOS (mph) LOS (mph) LOS (mph) LOS (mph) LOS (mph) LOS (mph) LOS (mph) LOS (mph) LOS
AM PEAK HOUR
Orange County Line to SR 426 0.64 ---- ---- ---- ---- ---- ---- ---- ---- ---- ---- ---- ---- 18.4 D 18.4 D 24.3 C 24.3 C 22.5 C 22.5 C 17.5 D 17.5 D 19.0 D 19.0 D 23.1 C 23.1 C 24.2 C 24.2 C
Average 18.4 D 24.3 C 22.5 C 17.5 D 19.0 D 23.1 C 24.2 C
PM PEAK HOUR
Orange County Line to SR 426 0.64 ---- ---- ---- ---- ---- ---- ---- ---- ---- ---- ---- ---- 22.9 C 22.9 C 20.6 D 20.6 D 24.5 C 24.5 C 17.9 D 17.9 D 19.5 D 19.5 D 14.8 E 14.8 E 16.9 E 16.9 E
Average 22.9 C 20.6 D 24.5 C 17.9 D 19.5 D 14.5 E 16.9 E
Roadway Distance
Segments (mile) (mph) LOS (mph) LOS (mph) LOS (mph) LOS (mph) LOS (mph) LOS (mph) LOS (mph) LOS (mph) LOS (mph) LOS (mph) LOS (mph) LOS (mph) LOS (mph) LOS (mph) LOS (mph) LOS (mph) LOS (mph) LOS (mph) LOS (mph) LOS
AM PEAK HOUR
SR 426 to Orange County Line 0.64 ---- ---- ---- ---- ---- ---- ---- ---- ---- ---- ---- ---- 29.1 B 29.1 B 33.7 B 33.7 B 33.7 B 33.7 B 29.5 B 29.5 B 29.8 B 29.8 B 34.9 B 34.9 B 32.8 B 32.8 B
Average 29.1 B 33.7 B 33.7 B 29.5 B 29.8 B 34.9 B 32.8 B
PM PEAK HOUR
SR 426 to Orange County Line 0.64 ---- ---- ---- ---- ---- ---- ---- ---- ---- ---- ---- ---- 24.6 C 24.6 C 37.3 A 37.3 A 35.6 A 35.6 A 32.0 B 32.0 B 33.1 B 33.1 B 34.0 B 34.0 B 33.1 B 33.1 B
Average 24.6 C 37.3 A 35.6 A 32.0 B 33.1 B 34.0 B 33.1 B
Year 2013
Rdwy Segment Rdwy Section
Average Speed Average Speed
Year 2013
Rdwy Segment Rdwy Section
Average Speed Average Speed
TABLE C9.1aYear 2014 Seminole County Travel Time & Delay Study
Dean Road - Northbound Direction Historical Summary
TABLE C9.1b
Year 2014Year 2005 Year 2006 Year 2007 Year 2008 Year 2009 Year 2010 Year 2011
Average Speed Average Speed Average Speed Average Speed Average SpeedAverage Speed Average Speed Average Speed Average Speed Average Speed Average Speed
Year 2012
Rdwy Segment Rdwy Section
Average Speed Average Speed
Year 2012
Rdwy Segment Rdwy Section
Average Speed Average Speed
Rdwy Section
Year 2014
Year 2014 Seminole County Travel Time & Delay StudyDean Road - Southbound Direction Historical Summary
Segments (mile) (mph) LOS (mph) LOS (mph) LOS (mph) LOS (mph) LOS (mph) LOS (mph) LOS (mph) LOS (mph) LOS (mph) LOS (mph) LOS (mph) LOS (mph) LOS (mph) LOS (mph) LOS (mph) LOS (mph) LOS (mph) LOS (mph) LOS (mph) LOS
AM PEAK HOUR
Howell Branch Rd. to Dike Rd. 1.08 ---- ---- ---- ---- ---- ---- ---- ---- ---- ---- ---- ---- 34.6 B ---- ---- ---- ---- ---- ---- ---- ---- 27.8 C 30.0 B 28.9 B 30.0 B
Dike Rd. to Red Bug Lake Rd. 0.75 ---- ---- ---- ---- ---- ---- ---- ---- ---- ---- ---- ---- 33.8 B 34.3 B ---- ---- ---- ---- ---- ---- ---- ---- 25.8 C 27.0 C 26.5 C 28.5 B 20.5 D 24.8 C 23.4 C 26.9 C
Average 34.3 B 27.0 C 28.5 B 24.8 C 26.9 C
PM PEAK HOUR
Howell Branch Rd. to Dike Rd. 1.08 ---- ---- ---- ---- ---- ---- ---- ---- ---- ---- ---- ---- 34.6 B ---- ---- ---- ---- ---- ---- ---- ---- 32.0 B 31.1 B 34.0 B 31.3 B
Dike Rd. to Red Bug Lake Rd. 0.75 ---- ---- ---- ---- ---- ---- ---- ---- ---- ---- ---- ---- 26.8 C 30.9 B ---- ---- ---- ---- ---- ---- ---- ---- 18.1 D 24.4 C 21.6 D 26.4 C 18.7 D 25.5 C 24.5 C 28.1 B
Average 30.9 B 26.0 C 26.4 C 25.5 C 28.1 B
Roadway Distance
Segments (mile) (mph) LOS (mph) LOS (mph) LOS (mph) LOS (mph) LOS (mph) LOS (mph) LOS (mph) LOS (mph) LOS (mph) LOS (mph) LOS (mph) LOS (mph) LOS (mph) LOS (mph) LOS (mph) LOS (mph) LOS (mph) LOS (mph) LOS (mph) LOS
AM PEAK HOUR
Red Bug Lake Rd. to Dike Rd. 0.77 ---- ---- ---- ---- ---- ---- ---- ---- ---- ---- ---- ---- 30.6 B ---- ---- ---- ---- ---- ---- ---- ---- 27.8 C 32.1 B 33.5 B 26.7 C
Dike Rd. to Howell Branch Rd. 1.08 ---- ---- ---- ---- ---- ---- ---- ---- ---- ---- ---- ---- 37.6 A 34.3 B ---- ---- ---- ---- ---- ---- ---- ---- 32.5 B 30.4 B 35.3 A 33.9 B 31.4 B 32.3 B 33.2 B 30.2 B
Average 34.3 B 30.4 B 33.9 B 32.3 B 30.2 B
PM PEAK HOUR
Red Bug Lake Rd. to Dike Rd. 0.77 ---- ---- ---- ---- ---- ---- ---- ---- ---- ---- ---- ---- 36.6 A ---- ---- ---- ---- ---- ---- ---- ---- 36.5 A 30.4 B 30.8 B 32.3 B
Dike Rd. to Howell Branch Rd. 1.08 ---- ---- ---- ---- ---- ---- ---- ---- ---- ---- ---- ---- 38.0 A 37.4 A ---- ---- ---- ---- ---- ---- ---- ---- 28.6 B 31.3 B 35.7 A 33.3 B 35.7 A 33.5 B 38.1 A 35.5 A
Average 37.4 A 31.3 B 33.3 B 33.5 B 35.5 A
Note : Data was collected only in Year 2008
Year 2013
Rdwy Segment Rdwy Section
Average Speed Average Speed
Year 2013
Rdwy Segment Rdwy Section
Average Speed Average Speed
TABLE C10.1aYear 2014 Seminole County Travel Time & Delay Study
Dodd Road - Northbound Direction Historical Summary
TABLE C10.1b
Year 2014Year 2005 Year 2006 Year 2007 Year 2008 Year 2009 Year 2010 Year 2011
Average Speed Average Speed Average Speed Average Speed Average SpeedAverage Speed Average Speed Average Speed Average Speed Average Speed Average Speed
Year 2012
Rdwy Segment Rdwy Section
Average Speed Average Speed
Year 2012
Rdwy Segment Rdwy Section
Average Speed Average Speed
Rdwy Section
Year 2014
Year 2014 Seminole County Travel Time & Delay Study
Dodd Road - Southbound Direction Historical Summary
Segments (mile) (mph) LOS (mph) LOS (mph) LOS (mph) LOS (mph) LOS (mph) LOS (mph) LOS (mph) LOS (mph) LOS (mph) LOS (mph) LOS (mph) LOS (mph) LOS (mph) LOS (mph) LOS (mph) LOS (mph) LOS (mph) LOS (mph) LOS (mph) LOS
AM PEAK HOUR
CR 427 to Molly Loop 0.35 33.5 B 26.6 C 33.4 B 35.9 A 34.1 B 35.7 A 31.9 B 35.7 A 34.1 B 35.7 A
Molly Loop to Northland Church 0.24 45.2 A 42.2 A 42.9 A 40.0 A 40.5 A 39.5 A 40.5 A 38.7 A
Northland Church to US 17/92 0.13 23.4 C 24.3 C 11.4 F 22.3 C 10.9 F 21.5 D 7.7 F 17.2 D 5.8 F 15.3 E 7.6 F 17.9 D 9.2 F 20.5 D 8.2 F 19.1 D 8.6 F 19.6 D
US 17/92 to Button Rd. 0.27 24.2 C 13.3 E 16.3 E 20.1 D 18.1 D 18.0 D 24.2 C 22.8 C 17.2 D 17.4 D
Button Rd. to Lake Kathryn Cir. 0.42 38.2 A 38.4 A 38.3 A 41.0 A 39.1 A 36.0 A 36.0 A 36.0 A 36.0 A 36.5 A
Lake Kathryn Cir. to Triplet Dr. 0.24 43.7 A 40.6 A 33.4 B 41.6 A 32.0 B 38.9 A 36.9 A 36.9 A 30.6 B
Triplet Dr. to Winter Park Dr. 0.38 23.1 C 26.7 C 17.9 D 22.6 C 21.5 D 25.5 C 15.1 E 23.4 C 21.0 D 26.4 C 20.2 D 24.7 C 18.5 D 26.5 C 33.5 B 31.7 B 16.1 E 22.8 C 24.3 C 25.9 C
Winter Park Dr. to Lake Dr./Seminola Dr. 0.42 35.6 A 35.6 A 23.5 C 23.5 C 29.2 B 29.2 B 29.8 B 29.8 B 30.8 B 30.8 B 26.7 C 26.7 C 28.6 B 28.6 B 28.6 B 28.6 B 24.2 C 24.2 C 29.6 B 29.6 B
Lake Dr./Seminola Dr. to Park Dr. 0.30 30.6 A 31.2 A
Park Dr. to East Lake Dr.* 0.28 36.9 A 34.2 A 43.9 A 44.7 A 33.3 B 43.0 A 40.4 A 40.1 A 42.4 A
East Lake Dr. to Beverly Rd.** 0.59 39.9 A 37.8 A
Beverly Rd. to Bird Rd. 0.41 32.8 A 35.3 A 33.3 A 34.5 A 40.2 A 46.2 A 35.0 B 43.6 A 41.5 A 41.5 A 42.8 A
Bird Rd. to Center Dr. 0.21 30.4 A 28.5 B
Center Dr. to Huntridge Dr. 0.79
Huntridge Dr. to Tuskawilla Rd. 0.09 28.4 B 28.8 B 36.8 A 34.8 A 30.8 B 36.9 B 39.8 A 43.1 A 27.0 C 30.9 B 31.3 B 37.8 A 35.8 A 38.8 A 32.5 B 37.1 A 39.4 A 41.3 A
Average 29.6 A 24.0 A NA NA 29.2 B 30.8 B 25.2 C 29.3 B 32.0 B 27.9 C 30.9 B
PM PEAK HOUR
CR 427 to Molly Loop 0.35 33.0 B 35.4 A 37.2 A 35.4 A 35.1 A 36.6 A 34.9 B 36.6 A 35.7 A 35.7 A
Molly Loop to Northland Church 0.24 45.6 A 29.3 B 42.2 A 40.9 A 37.8 A 40.5 A 38.7 A 39.5 A
Northland Church to US 17/92 0.13 12.5 F 16.0 E 14.1 E 17.7 D 7.4 F 17.0 D 13.9 E 22.7 C 8.8 F 18.8 D 12.4 F 24.7 C 11.3 F 22.8 C 5.2 F 14.1 E 6.6 F 16.4 E 5.7 F 15.1 E
US 17/92 to Button Rd. 0.27 31.6 B 17.6 D 25.2 C 15.4 E 18.6 D 16.5 E 19.3 D 20.2 D 18.8 D 21.6 D
Button Rd. to Lake Kathryn Cir. 0.42 38.8 A 34.1 B 41.5 A 40.5 A 38.9 A 36.5 A 36.5 A 37.1 A 35.5 A 36.5 A
Lake Kathryn Cir. to Triplet Dr. 0.24 43.3 A 43.6 A 38.1 A 39.8 A 31.3 B 37.9 A 37.9 A 37.9 A 33.5 B
Triplet Dr. to Winter Park Dr. 0.38 26.1 C 30.4 B 22.1 C 25.9 C 27.5 C 32.6 B 24.3 C 26.1 C 19.4 D 25.6 C 21.7 D 24.7 C 30.8 B 29.7 B 26.8 C 29.0 B 19.8 D 25.4 C 20.0 D 26.1 C
Winter Park Dr. to Lake Dr./Seminola Dr. 0.42 28.6 B 28.6 B 36.3 A 36.3 A 27.9 C 27.9 C 23.7 C 23.7 C 30.6 B 30.6 B 31.9 B 31.9 B 24.7 C 24.7 C 21.9 D 21.9 D 24.0 C 24.0 C 26.0 C 26.0 C
Lake Dr./Seminola Dr. to Park Dr. 0.30 31.1 A 31.6 A
Park Dr. to East Lake Dr.* 0.28 37.2 A 35.6 A 44.6 A 35.5 A 35.0 A 42.1 A 41.2 A 40.9 A 41.2 A
East Lake Dr. to Beverly Rd.** 0.59 39.1 A 36.6 A
Beverly Rd. to Bird Rd. 0.41 31.6 A 34.9 A 30.9 A 33.8 A 41.8 A 46.1 A 36.3 A 43.2 A 43.6 A 42.4 A 43.2 A
Bird Rd. to Center Dr. 0.21 30.7 A 31.7 A
Center Dr. to Huntridge Dr. 0.79
Huntridge Dr. to Tuskawilla Rd. 0.09 31.4 A 31.3 A 32.1 A 32.0 A 34.9 B 39.6 A 38.6 A 39.2 A 36.2 A 35.9 A 31.0 B 37.3 A 38.2 A 40.6 A 34.2 B 38.4 A 36.0 A 39.5 A
Average 28.6 A 28.5 A NA NA 30.8 B 29.9 B 30.1 B 31.2 B 28.3 B 28.1 B 28.3 B
Note: * Till Year 2007, the segment limits Park Dr to E. Lake Dr was used to be Park Dr to Sterling Oaks Dr
Note:** Till Year 2007, the segment limits to E. Lake Dr to Beverly Rd was used to be Sterling Oaks Dr to Beverly Rd
Year 2013
Rdwy Segment Rdwy Section
Average Speed Average Speed
TABLE C11.1aYear 2014 Seminole County Travel Time & Delay Study
Dog Track Road / Seminola Boulevard/Lake Drive - Eastbound Direction Historical Summary
Year 2014Year 2009 Year 2010 Year 2011 Year 2012
Rdwy Segment Rdwy Section
Average Speed Average SpeedAverage Speed Average Speed Average Speed
Average SpeedAverage Speed Average Speed Average Speed
Rdwy Segment
D-15 Dog Track Road/Seminola Boulevard/Lake Drive - EB
Roadway Distance
Segments (mile) (mph) LOS (mph) LOS (mph) LOS (mph) LOS (mph) LOS (mph) LOS (mph) LOS (mph) LOS (mph) LOS (mph) LOS (mph) LOS (mph) LOS (mph) LOS (mph) LOS (mph) LOS (mph) LOS (mph) LOS (mph) LOS (mph) LOS (mph) LOS
AM PEAK HOUR
Tuskawilla Rd. to Huntridge Dr. 0.08
Huntridge Dr. to Center Dr. 0.78 37.6 A 36.2 A
Center Dr. to Bird Rd. 0.21 11.1 E 25.9 B 14.9 D 28.4 B 38.0 A 42.3 A 40.5 A 42.9 A 40.4 A 40.4 A 40.9 A
Bird Rd. to Beverly Rd. 0.41 32.0 A 32.0 A
Beverly Rd. to East Lake Dr.** 0.60 38.6 A 38.8 A 41.8 A 46.4 A 38.9 A 44.5 A 42.4 A 44.1 A 42.8 A
East Lake Dr. to Park Dr.* 0.27 35.0 A 37.5 A
Park Dr. to Lake Dr./Seminola Dr. 0.32 24.5 B 32.7 A 34.5 A 35.7 A 40.2 A 39.8 A 38.2 A 41.6 A 24.7 C 33.7 B 41.8 A 42.9 A 38.4 A 40.1 A 38.6 A 40.6 A 34.2 B 38.6 A
Lake Dr./Seminola Dr. to Winter Park Dr. 0.42 19.2 D 19.2 D 26.7 C 26.7 C 19.5 D 19.5 D 20.5 D 20.5 D 25.5 C 25.5 C 22.6 C 22.6 C 18.1 D 18.1 D 33.6 B 33.6 B 19.2 D 19.2 D 23.3 C 23.3 C
Winter Park Dr. to Triplet Dr. 0.38 39.3 A 35.0 B 38.8 A 40.1 A 35.5 A 35.6 A 38.6 A 36.2 A 37.4 A
Triplet Dr. to Lake Kathryn Cir. 0.25 39.6 A 43.2 A 42.4 A 42.9 A 42.7 A 40.0 A 40.0 A 40.0 A 37.9 A 37.9 A
Lake Kathryn Cir. to Button Rd. 0.40 36.6 A 41.7 A 37.3 A 39.1 A 41.0 A 39.4 A 40.0 A 38.8 A 38.8 A 38.2 A
Button Rd. to US 17-92 0.27 11.9 F 26.4 C 9.3 F 24.3 C 13.5 E 27.4 C 9.6 F 24.2 C 8.9 F 23.7 C 9.3 F 23.3 C 10.5 F 24.8 C 8.5 F 22.4 C 6.6 F 19.0 D 6.9 F 19.6 D
US 17/92 to Northland Church 0.25 32.7 B 35.6 A 36.1 A 32.4 B 34.3 B 33.3 B 33.3 B 33.3 B
Northland Church to Molly Loop 0.14 36.4 A 38.4 A 37.7 A 41.5 A 41.4 A 38.3 A 38.7 A 37.8 A 38.7 A 37.8 A
Molly Loop to CR 427 0.33 23.9 C 31.4 B 15.8 E 26.7 C 23.3 C 30.2 B 14.3 E 25.3 C 27.2 C 34.3 B 12.6 F 22.2 C 18.1 D 27.2 C 21.7 D 29.4 B 31.9 B 34.7 B 30.0 B 33.6 B
Average 27.8 C 28.9 B NA NA 30.2 B 32.8 B 27.4 C 31.2 B 31.7 B 29.1 B 29.4 B
PM PEAK HOUR
Tuskawilla Rd. to Huntridge Dr. 0.08
Huntridge Dr. to Center Dr. 0.78 36.7 A 37.9 A
Center Dr. to Bird Rd. 0.21 24.6 B 33.6 A 24.3 B 34.2 A 39.1 A 42.6 A 39.8 A 41.4 A 40.6 A 40.6 A 41.7 A
Bird Rd. to Beverly Rd. 0.41 34.9 A 32.3 A
Beverly Rd. to East Lake Dr.** 0.60 40.2 A 38.0 A 41.9 A 45.3 A 38.9 A 44.1 A 43.2 A 43.2 A 43.2 A
East Lake Dr. to Park Dr.* 0.27 34.8 A 37.4 A
Park Dr. to Lake Dr./Seminola Dr. 0.32 26.3 B 34.5 A 32.6 A 35.2 A 35.0 B 38.4 A 33.2 B 39.4 A 25.1 C 33.7 B 39.9 A 41.5 A 39.6 A 40.9 A 40.1 A 41.1 A 38.1 A 40.7 A
Lake Dr./Seminola Dr. to Winter Park Dr. 0.42 24.5 C 24.5 C 34.2 B 34.2 B 25.6 C 25.6 C 30.9 B 30.9 B 20.0 D 20.0 D 25.9 C 25.9 C 23.6 C 23.6 C 28.3 B 28.3 B 20.5 D 20.5 D 24.5 C 24.5 C
Winter Park Dr. to Triplet Dr. 0.38 38.2 A 47.1 A 36.6 A 29.6 B 37.7 A 37.4 A 36.8 A 36.2 A 36.8 A
Triplet Dr. to Lake Kathryn Cir. 0.25 41.5 A 43.3 A 53.5 A 40.5 A 43.0 A 41.1 A 38.9 A 37.9 A 40.0 A 37.9 A
Lake Kathryn Cir. to Button Rd. 0.40 41.1 A 39.6 A 49.4 A 38.3 A 40.7 A 31.5 B 36.0 A 38.8 A 39.4 A 35.5 A
Button Rd. to US 17-92 0.27 14.3 E 29.8 B 10.0 F 24.8 C 8.0 F 24.0 C 12.1 F 26.6 C 14.8 E 28.0 C 7.2 F 19.7 D 6.3 F 18.5 D 11.2 F 25.4 C 9.4 F 23.4 C 9.9 F 23.5 C
US 17/92 to Northland Church 0.25 33.8 B 32.4 B 16.5 E 34.3 B 33.3 B 35.3 A 32.4 B 33.3 B
Northland Church to Molly Loop 0.14 36.1 A 36.1 A 42.9 A 41.3 A 36.7 A 39.1 A 34.8 B 37.8 A 37.0 A 38.7 A
Molly Loop to CR 427 0.33 17.1 D 27.0 C 24.3 C 31.4 B 32.8 B 36.2 A 18.3 D 27.9 C 18.1 D 21.1 D 14.6 E 24.5 C 12.5 F 21.6 D 18.1 D 27.2 C 21.4 D 28.8 B 34.9 B 35.8 A
Average 31.0 B 31.3 B NA NA 32.5 B 30.2 B 26.7 C 27.6 C 32.5 B 30.9 B 32.4 B
Note: * Till Year 2007, the segment limits Park Dr to E. Lake Dr was used to be Park Dr to Sterling Oaks Dr
Note:** Till Year 2007, the segment limits to E. Lake Dr to Beverly Rd was used to be Sterling Oaks Dr to Beverly Rd
Rdwy Section
Average Speed Average Speed
TABLE C11.1bYear 2014 Seminole County Travel Time & Delay Study
Dog Track Road / Seminola Boulevard/Lake Drive - Westbound Direction Historical Summary
Average Speed Average Speed Average Speed Average Speed Average SpeedAverage Speed Average Speed Average Speed Average Speed Average Speed Average Speed
Year 2012
Rdwy Segment Rdwy Section
Average Speed Average SpeedAverage Speed Average Speed Average Speed Average Speed Average Speed
D-16 Dog Track Road/Seminola Boulevard/Lake Drive - WB
Roadway Distance
Segments (mile) (mph) LOS (mph) LOS (mph) LOS (mph) LOS (mph) LOS (mph) LOS (mph) LOS (mph) LOS (mph) LOS (mph) LOS (mph) LOS (mph) LOS (mph) LOS (mph) LOS (mph) LOS (mph) LOS (mph) LOS (mph) LOS (mph) LOS (mph) LOS
AM PEAK HOUR
SR 436 to Westmonte Ave. 0.30 29.5 B 25.2 B 26.9 B 27.2 B 32.1 A 31.0 A 27.8 B 27.0 B 29.1 B 27.0 B
Westmonte Ave. to Central Pkwy. 0.44 14.2 D 18.4 C 15.3 D 18.2 C 14.1 D 17.8 D 18.3 C 21.1 C 15.6 D 20.1 C 24.2 B 26.7 B 16.8 D 20.2 C 17.9 D 20.9 C 15.8 D 19.7 C 13.4 E 17.0 D
Central Pkwy. to Citrus St. 0.12 31.4 A 18.5 C 13.5 E 30.6 A 30.6 A 31.2 A 27.9 B 27.9 B 31.2 A 22.3 C
Citrus St. to North St. 0.62 37.9 A 36.5 A 34.9 A 30.0 A 40.0 A 29.4 B 34.4 A 33.7 A 34.4 A 33.6 A 34.7 A 34.0 A 31.5 A 30.8 A 33.5 A 32.4 A 32.9 A 32.6 A 29.1 B 27.6 B
North St. to New Signal-Douglas Ave. 36.8 A 38.2 A 32.9 A 32.9 A 30.7 A 27.1 B
New Signal-Douglas Ave. to SR 434 15.4 D 24.0 B 5.8 F 10.7 E 5.3 F 10.8 E 7.3 F 13.8 E 4.2 F 8.8 F 5.4 F 10.5 E
Average 21.1 C 21.7 C 20.1 C 24.3 B 25.0 B 21.8 C 19.4 C 21.7 C 18.0 C 17.5 D
PM PEAK HOUR
SR 436 to Westmonte Ave. 0.30 18.1 C 11.3 E 20.9 C 18.8 C 25.1 B 24.6 B 16.6 D 21.3 C 25.9 B 23.7 C
Westmonte Ave. to Central Pkwy. 0.44 9.7 F 12.1 E 8.4 F 9.4 F 7.5 F 10.4 E 11.5 E 13.7 E 19.2 C 21.4 C 10.7 E 14.1 D 8.2 F 10.5 E 9.9 F 12.8 E 13.8 E 17.2 D 12.5 E 15.7 D
Central Pkwy. to Citrus St. 0.12 30.8 A 23.8 C 29.2 B 27.3 B 31.1 A 33.9 A 30.0 B 30.0 B 25.2 B 28.9 B
Citrus St. to North St. 0.62 36.0 A 34.9 A 35.5 A 32.6 A 35.6 A 34.3 A 35.6 A 33.7 A 31.2 A 31.2 A 36.7 A 36.2 A 32.6 A 32.1 A 33.8 A 33.1 A 34.4 A 32.4 A 32.3 A 31.7 A
North St. to New Signal-Douglas Ave. 33.1 A 32.3 A 25.6 B 22.3 C 20.9 C 18.9 C
New Signal-Douglas Ave. to SR 434 6.1 F 12.5 E 3.3 F 6.3 F 3.7 F 7.7 F 5.4 F 10.0 F 5.4 F 9.8 F 5.1 F 9.1 F
Average 16.1 D 13.8 E 13.9 E 15.8 D 21.3 C 14.0 E 13.0 E 15.8 D 17.8 D 16.6 D
Roadway Distance
Segments (mile) (mph) LOS (mph) LOS (mph) LOS (mph) LOS (mph) LOS (mph) LOS (mph) LOS (mph) LOS (mph) LOS (mph) LOS (mph) LOS (mph) LOS (mph) LOS (mph) LOS (mph) LOS (mph) LOS (mph) LOS (mph) LOS (mph) LOS (mph) LOS
AM PEAK HOUR
SR 434 to New Signal-Douglas Ave. 20.2 C 25.7 B 23.7 C 20.0 C 30.0 B 23.7 C
New Signal-Douglas Ave. to North St. 32.2 A 26.1 B 29.3 B 27.5 B 28.7 B 26.5 B 33.7 A 26.5 B 25.6 B 27.1 B 30.0 B 27.1 B
North St. to Citrus St. 0.62 32.8 A 24.8 B 23.0 C 35.5 A 34.4 A 34.7 A 32.1 A 29.1 B 32.1 A 28.0 B
Citrus St. to Central Pkwy. 0.14 6.6 F 20.3 C 6.0 F 16.7 D 4.9 F 14.7 D 6.5 F 21.2 C 7.7 F 22.5 C 8.0 F 22.0 C 11.5 E 24.5 B 7.7 F 19.7 C 4.7 F 15.9 D 5.8 F 16.8 D
Central Pkwy. to Westmonte Dr. 0.42 21.6 C 20.7 C 17.2 D 18.1 C 32.0 A 26.5 B 21.1 C 25.3 B 24.3 B 19.3 C
Westmonte Dr. to SR 436 0.32 10.5 E 15.0 D 12.0 E 16.0 D 11.0 E 14.0 D 10.3 E 13.9 E 11.8 E 18.9 C 15.5 D 20.3 C 7.7 F 12.1 E 8.8 F 14.1 D 6.5 F 11.2 E 8.7 F 12.7 E
Average 18.8 C 17.9 D 16.3 D 18.4 C 21.5 C 22.2 C 17.6 D 17.8 D 14.7 D 16.0 D
PM PEAK HOUR
SR 434 to New Signal-Douglas Ave. 26.8 B 30.0 B 14.3 D 20.0 C 23.1 C 18.7 C
New Signal-Douglas Ave. to North St. 33.0 A 30.2 A 31.5 A 30.8 A 31.4 A 21.3 C 30.0 B 25.1 B 32.9 A 28.1 B 30.0 B 24.3 B
North St. to Citrus St. 0.62 33.8 A 36.4 A 34.6 A 34.5 A 35.7 A 34.7 A 32.1 A 32.9 A 30.2 A 23.4 C
Citrus St. to Central Pkwy. 0.14 13.8 E 27.7 B 6.5 F 21.1 C 6.7 F 21.1 C 6.2 F 20.3 C 9.5 F 25.2 B 11.3 E 25.6 B 9.6 F 22.8 C 6.7 F 19.6 C 6.0 F 17.9 D 4.9 F 14.1 D
Central Pkwy. to Westmonte Dr. 0.42 17.5 D 21.8 C 21.4 C 15.0 D 25.4 B 23.6 C 24.1 B 25.8 B 20.6 C 21.7 C
Westmonte Dr. to SR 436 0.32 8.6 F 12.3 E 9.2 F 13.9 E 10.6 E 15.1 D 11.8 E 13.5 E 21.2 C 23.5 C 10.1 E 14.9 D 12.2 E 17.0 D 9.9 F 15.3 D 11.4 E 15.3 D 12.2 E 16.2 D
Average 18.9 C 18.6 C 19.5 C 17.8 D 25.4 B 20.6 C 19.8 C 18.3 C 18.0 D 16.3 D
Year 2013
Rdwy Segment Rdwy Section
Average Speed Average Speed
Year 2013
Rdwy Segment Rdwy Section
Average Speed Average Speed
0.39 B29.9B29.9A31.9A31.9A32.9A32.9A31.7A31.7
28.8 B 30.0 B32.2 A 32.2 A 30.0 B28.4 B 28.4 B 28.8 B
0.40
0.39
9.0E10.9E10.9E10.9E10.9
18.7 C
8.7 FF8.7F9.0F
C 18.2 C 14.5 D 14.5 D 18.7 C13.3 E 13.3 E 18.2
Year 2014
Year 2014
TABLE C12.1aYear 2014 Seminole County Travel Time & Delay Study
Douglas Avenue - Northbound Direction Historical Summary
TABLE C12.1bYear 2014 Seminole County Travel Time & Delay Study
Douglas Avenue - Southbound Direction Historical Summary
0.40
Year 2005 Year 2006 Year 2007 Year 2008 Year 2009 Year 2010 Year 2011
Average Speed Average Speed Average Speed Average Speed Average Speed Average Speed Average Speed Average Speed Average Speed Average Speed Average Speed Average Speed Average Speed Average Speed Average Speed Average Speed
Year 2005 Year 2006 Year 2007 Year 2008 Year 2009 Year 2010 Year 2011
Average Speed Average Speed Average Speed Average Speed Average Speed Average Speed Average Speed Average Speed Average Speed Average Speed Average Speed Average Speed Average Speed Average Speed Average Speed Average Speed
Year 2012
Rdwy Segment Rdwy Section
Average Speed Average Speed
Year 2012
Rdwy Segment Rdwy Section
Average Speed Average Speed
D-17 Douglas Avenue
Roadway Distance
Segments (mile) (mph) LOS (mph) LOS (mph) LOS (mph) LOS (mph) LOS (mph) LOS (mph) LOS (mph) LOS (mph) LOS (mph) LOS (mph) LOS (mph) LOS (mph) LOS (mph) LOS (mph) LOS (mph) LOS (mph) LOS (mph) LOS (mph) LOS (mph) LOS
AM PEAK HOUR
Orange County Line/Lakemont Ave. to Lake Howell Rd. 0.25 - - - - - - - - - - - - - - - - - - - - 16.7 E 12.3 F 15.0 E 19.5 D 20.3 D
Lake Howell Rd. to Plaza Entrance 0.32 28.6 B 30.9 B 40.0 A 40.9 A 34.6 B 38.3 A 34.4 B 35.8 A 25.5 C 36.5 A
Plaza Entrance to SR 436 0.20 11.4 F 18.2 D 6.8 F 13.1 E 14.1 E 23.1 C 10.6 F 19.1 D 12.6 F 20.4 D 20.7 D 23.1 C 10.7 F 16.0 E 9.0 F 16.1 E 5.7 F 12.8 F 10.8 F 19.5 D
SR 436 to Eastbrook Blvd. 0.80 34.4 B 34.4 B 39.3 A 39.3 A 39.8 A 39.8 A 38.9 A 38.9 A 43.4 A 43.4 A 39.5 A 39.5 A 36.8 A 36.8 A 32.2 B 32.2 B 34.0 B 34.0 B 35.0 B 35.0 B
Eastbrook Blvd. to Dike Rd. 0.47 22.7 C 26.8 C 22.2 C 24.1 C 36.6 A 37.1 A 27.4 C 26.1 C 21.0 D 28.2 B
Dike Rd. to Emergency Signal 0.44 36.7 40.5 A 45.0 A 44.3 A 44.3 A 39.7 A 38.0 A 39.1 A 38.6 A 39.1 A
Emergency signal to Dodd Rd. 0.25 36.7 A 29.3 B 31.8 B 32.0 B 41.1 A 31.4 B 36.9 A 32.1 B 37.9 A 39.5 A 31.3 B 36.6 A 28.8 B 31.1 B 34.3 B 31.8 B 27.2 C 27.1 C 28.8 B 31.8 B
Dodd Rd. to Old Howell Branch Rd. 0.33 34.8 B 35.5 A 31.3 B 39.3 A 36.6 A 22.3 C 26.8 C 29.1 B 32.4 B 37.8 A
Old Howell Branch Rd. to SR 426 0.54 15.4 E 19.9 D 12.5 F 16.8 E 16.0 E 19.9 D 13.3 E 18.2 D 13.9 E 18.6 D 14.3 E 16.7 E 11.1 F 14.3 E 11.9 F 15.4 E 15.7 E 19.6 D 14.4 E 18.9 D
Average 24.8 C 22.8 C 27.2 C 25.4 C 27.9 C 26.2 C 21.5 D 21.8 D 21.2 D 24.9 C
PM PEAK HOUR
Orange County Line/Lakemont Ave. to Lake Howell Rd. 0.25 - - - - - - - - - - - - - - - - - - - - 11.1 F 10.6 F 14.1 E 8.7 F 11.6 F
Lake Howell Rd. to Plaza Entrance 0.32 14.9 E 21.0 D 15.1 E 17.3 D 25.4 C 26.9 C 20.9 D 26.2 C 29.1 B 34.4 B
Plaza Entrance to SR 436 0.20 5.4 F 8.9 F 7.2 F 12.1 F 6.7 F 10.1 F 10.5 F 13.8 E 11.9 F 17.4 D 11.5 F 14.7 E 7.5 F 11.7 F 8.0 F 14.1 E 7.0 F 11.3 F 9.4 F 14.8 E
SR 436 to Eastbrook Blvd. 0.80 32.7 B 32.7 B 35.6 A 35.6 A 36.0 A 36.0 A 39.8 A 39.8 A 38.3 A 38.3 A 37.4 A 37.4 A 30.2 B 30.2 B 35.7 A 35.7 A 38.9 A 38.9 A 35.0 B 35.0 B
Eastbrook Blvd. to Dike Rd. 0.47 23.4 C 30.3 B 31.7 B 28.2 B 35.2 A 29.1 B 28.2 B 28.2 B 36.2 A 30.0 B
Dike Rd. to Emergency Signal 0.44 42.0 A 40.3 A 45.0 A 42.2 A 39.7 A 38.0 A 39.1 A 39.7 A 38.0 A
Emergency signal to Dodd Rd. 0.25 33.1 B 28.2 B 35.9 A 35.2 A 22.2 C 31.5 B 38.9 A 35.3 A 33.5 B 37.2 A 33.5 B 33.5 B 26.2 C 30.8 B 22.5 C 29.9 B 29.4 B 35.7 A 30.0 B 32.7 B
Dodd Rd. to Old Howell Branch Rd. 0.33 27.9 C 30.1 B 30.9 B 43.2 A 33.7 B 21.6 D 24.3 C 30.0 B 22.9 C 29.1 B
Old Howell Branch Rd. to SR 426 0.54 10.7 F 14.2 E 14.1 E 17.9 D 22.1 C 25.0 C 12.1 F 17.1 D 13.5 E 17.8 D 11.7 F 14.4 E 16.4 E 18.8 D 15.5 E 19.1 D 13.6 E 16.1 E 13.7 E 17.2 D
Average 18.2 D 23.0 C 23.2 C 23.7 C 25.6 C 21.3 D 20.6 D 22.4 C 20.7 D 22.5 C
Roadway Distance
Segments (mile) (mph) LOS (mph) LOS (mph) LOS (mph) LOS (mph) LOS (mph) LOS (mph) LOS (mph) LOS (mph) LOS (mph) LOS (mph) LOS (mph) LOS (mph) LOS (mph) LOS (mph) LOS (mph) LOS (mph) LOS (mph) LOS (mph) LOS (mph) LOS
AM PEAK HOUR
SR 426 to Old Howell Branch Rd. 0.56 35.8 A 38.5 A 30.6 B 43.0 A 38.3 A 31.2 B 33.1 B 34.1 B 30.3 B 33.7 B
Old Howell Branch Rd. to Dodd Rd. 0.33 23.7 C 30.0 B 25.5 C 32.2 B 37.9 A 33.2 B 26.3 C 34.2 B 34.8 B 36.8 A 21.6 D 26.4 C 24.9 C 29.3 B 26.8 C 30.9 B 31.4 B 30.7 B 31.9 B 33.0 B
Dodd Rd. to Emergency Signal 0.25 17.7 D 39.3 A 45.0 A 45.0 A 48.0 A 40.0 A 36.0 A 37.9 A 37.9 A 37.9 A
Emergency Signal to Dike Rd. 0.44 26.9 C 19.4 D 18.4 D 21.6 D 27.8 C 25.2 C 24.8 C 20.9 D 24.1 C
Dike Rd. to Eastbrook Blvd. 0.47 34.3 B 22.0 D 33.6 B 31.5 B 41.5 A 29.1 B 38.6 A 27.6 C 35.2 A 29.6 B 37.6 A 33.5 B 29.4 B 28.6 B 39.7 A 31.9 B 35.2 A 28.2 B 35.7 A 30.4 B
Eastbrook Blvd. to SR 436 0.82 20.8 D 20.8 D 20.5 D 20.5 D 20.3 D 20.3 D 21.8 D 21.8 D 19.9 D 19.9 D 22.0 D 22.0 D 17.4 D 17.4 D 20.1 D 20.1 D 26.6 C 26.6 C 21.7 D 21.7 D
SR 436 to Plaza Entrance 0.20 21.6 D 32.0 B 33.3 B 34.3 B 37.5 A 33.3 B 30.0 B 33.5 B 24.8 C 30.0 B
Plaza Entrance to Lake Howell Rd. 0.32 16.9 E 18.5 D 18.9 D 22.7 C 16.5 E 20.7 D 18.7 D 22.9 C 41.9 A 40.0 A 18.2 D 17.5 D 21.1 D 24.5 C 14.8 E
Lake Howell Rd. to Orange County Line/Lakemont Ave. 0.24 - - - - - - - - - - - - - - - - - - - - 39.5 A 26.0 C 36.0 A 24.1 C 35.1 A 27.2 C 40.0 A 28.1 B 35.1 A 21.7 D
Average 22.6 C 26.7 C 25.7 C 26.5 C 28.8 B 26.9 C 24.3 C 27.1 C 28.3 B 26.3 C
PM PEAK HOUR
SR 426 to Old Howell Branch Rd. 0.56 34.7 B 36.5 A 34.2 B 29.2 B 32.1 B 24.5 C 32.4 B 30.6 B 30.0 B 28.9 B
Old Howell Branch Rd. to Dodd Rd. 0.33 30.9 B 33.2 B 25.7 C 31.4 B 26.3 C 30.5 B 22.3 C 25.9 C 29.6 B 31.0 B 25.4 C 24.8 C 27.6 C 30.3 B 21.7 D 26.4 C 26.2 C 28.4 B 28.3 B 28.7 B
Dodd Rd. to Emergency Signal 0.25 36.7 A 46.5 A 45.0 A 45.0 A 41.1 A 36.9 A 36.9 A 37.9 A 36.0 A
Emergency Signal to Dike Rd. 0.44 24.9 C 28.6 B 35.5 A 31.8 B 40.9 A 27.8 C 28.1 B 28.4 B 26.2 C 29.7 B
Dike Rd. to Eastbrook Blvd. 0.47 33.0 B 27.6 C 37.8 A 33.4 B 42.7 A 40.2 A 38.1 A 36.4 A 31.7 B 37.2 A 36.2 A 33.1 B 36.2 A 32.7 B 39.7 A 34.0 B 38.6 A 32.5 B 35.2 A 33.0 B
Eastbrook Blvd. to SR 436 0.82 28.5 B 28.5 B 20.5 D 20.5 D 16.2 E 16.2 E 14.3 E 14.3 E 20.3 D 20.3 D 14.2 E 14.2 E 19.3 D 19.3 D 25.7 C 25.7 C 17.9 D 17.9 D 23.9 C 23.9 C
SR 436 to Plaza Entrance 0.20 29.3 B 26.5 C 34.3 B 36.4 A 33.3 B 33.3 B 32.6 B 22.8 C 35.6 A 27.8 C
Plaza Entrance to Lake Howell Rd. 0.32 16.8 E 20.3 D 31.8 B 29.4 B 19.8 D 23.8 C 41.9 A 39.5 A 38.3 A 36.1 A 36.7 A 11.6 F 25.1 C 21.4 D 22.1 C
Lake Howell Rd. to Orange County Line/Lakemont Ave. 0.24 - - - - - - - - - - - - - - - - - - - - 40.5 A 36.9 A 34.3 B 18.7 D 38.9 A 27.6 C 40.0 A 28.6 B 40.0 A 27.6 C
Average 27.6 C 28.1 B 26.0 C 24.8 C 29.6 B 24.3 C 24.6 C 28.5 B 26.1 C 28.4 B
Year 2013
Rdwy Segment Rdwy Section
Average Speed Average Speed
Year 2013
Rdwy Segment Rdwy Section
Average Speed Average Speed
TABLE C13.1aYear 2014 Seminole County Travel Time & Delay Study
Howell Branch Road - Eastbound Direction Historical Summary
TABLE C13.1b
Year 2014Year 2005 Year 2006 Year 2007 Year 2008 Year 2009 Year 2010 Year 2011
Average Speed Average Speed Average Speed Average Speed Average SpeedAverage Speed Average Speed Average Speed Average Speed Average Speed Average Speed
Year 2012
Rdwy Segment Rdwy Section
Average Speed Average Speed
Year 2012
Rdwy Segment Rdwy Section
Average Speed Average Speed
Rdwy Section
Year 2014
Year 2014 Seminole County Travel Time & Delay StudyHowell Branch Road - Westbound Direction Historical Summary
Segments (mile) (mph) LOS (mph) LOS (mph) LOS (mph) LOS (mph) LOS (mph) LOS (mph) LOS (mph) LOS (mph) LOS (mph) LOS (mph) LOS (mph) LOS (mph) LOS (mph) LOS (mph) LOS (mph) LOS (mph) LOS (mph) LOS (mph) LOS (mph) LOS
AM PEAK HOUR
SR 436 to Ross (Plaza) 0.20 31.6 A 34.8 A 26.5 B 35.1 A 29.4 B 29.4 B 32.1 A 26.5 B 34.5 A 30.7 A
Ross (Plaza) to Sand Lake Rd. 0.54 18.7 C 21.3 C 20.5 C 22.6 C 15.7 D 17.8 D 21.4 C 24.4 B 16.1 D 18.7 C 15.5 D 18.2 C 17.8 D 20.5 C 17.1 D 19.2 C 20.1 C 23.0 C 26.3 B 27.5 B
Sand Lake Rd. to S. Wekiva Tr. 0.50 24.0 C 34.3 A 22.2 C 34.6 A 34.6 A 29.4 B 29.4 B 24.7 B 24.7 B 18.3 C 18.3 C 24.0 C 24.0 C 22.9 C 22.9 C 20.8 C 20.8 C
S. Wekiva Tr. to Needles Dr. 0.51 35.4 A 34.1 A 36.1 A - - - - - - - - - - - - 32.2 A 33.9 A 34.3 A 33.9 A
Needles Dr. to N. Wekiva Tr. 0.23 28.1 B 28.6 B 27.5 B 32.8 A 31.5 A 28.3 B - - - - - - - - - - - - 23.8 C 23.0 C 24.6 B 24.6 B
N. Wekiva Tr. to Wekiva Springs Rd. 0.82 31.9 A 31.9 A 32.3 A 32.3 A 29.7 B 29.7 B - - - - - - - - - - - - 19.8 C 23.4 C 22.5 C 25.4 B 24.8 B 27.3 B 23.4 C 26.3 B
Average 26.9 B 29.1 B 24.7 B 27.6 B 21.8 C 20.3 C 21.5 C 23.1 C 25.2 B 25.4 B
PM PEAK HOUR
SR 436 to Ross (Plaza) 0.21 31.8 A 29.7 B 23.2 C 26.7 B 26.2 B 32.0 A 30.0 B 23.4 C 32.9 A 24.6 B
Ross (Plaza) to Sand Lake Rd. 0.54 25.0 B 26.8 B 20.4 C 21.9 C 19.9 C 20.8 C 20.8 C 22.4 C 20.8 C 22.2 C 18.9 C 21.7 C 15.0 D 17.7 D 16.4 D 18.0 C 14.8 D 17.7 D 19.9 C 21.1 C
Sand Lake Rd. to S. Wekiva Tr. 0.49 33.3 A 28.7 B 31.7 A 33.0 A 33.0 A 31.6 A 31.6 A 27.7 B 27.7 B 28.3 B 28.3 B 30.3 A 30.3 A 26.8 B 26.8 B 29.4 B 29.4 B
S. Wekiva Tr. to Needles Dr. 0.51 37.1 A 37.1 A 34.5 A - - - - - - - - - - - - 32.5 A 34.7 A 35.1 A 32.2 A
Needles Dr. to N. Wekiva Tr. 0.23 26.4 B 33.1 A 27.0 B 31.4 A 27.0 B 31.8 A - - - - - - - - - - - - 23.8 C 21.9 C 26.0 B 25.1 B
N. Wekiva Tr. to Wekiva Springs Rd. 0.82 27.7 B 27.7 B 33.9 A 33.9 A 25.9 B 25.9 B - - - - - - - - - - - - 18.4 C 22.3 C 24.1 B 26.4 B 23.7 C 26.9 B 19.4 C 23.3 C
Average 29.5 B 28.6 B 26.2 B 25.6 B 25.2 B 23.7 C 21.6 C 23.9 C 23.6 C 23.5 C
Roadway Distance
Segments (mile) (mph) LOS (mph) LOS (mph) LOS (mph) LOS (mph) LOS (mph) LOS (mph) LOS (mph) LOS (mph) LOS (mph) LOS (mph) LOS (mph) LOS (mph) LOS (mph) LOS (mph) LOS (mph) LOS (mph) LOS (mph) LOS (mph) LOS (mph) LOS
AM PEAK HOUR
Wekiva Springs Rd. tp N. Wekiva Tr. 0.80 31.0 A 31.0 A 33.1 A 33.1 A 33.8 A 33.8 A - - - - - - - - - - - - 29.3 B 29.6 B 30.9 A 30.2 A
N. Wekiva Tr. to Needles Dr. 0.24 33.4 A 34.8 A 32.4 A - - - - - - - - - - - - 29.4 B 30.7 A 31.4 A 26.5 B
Needles Dr. to S. Wekiva Tr. 0.51 24.5 B 18.4 C 25.0 B - - - - - - - - - - - - 20.4 C 25.6 B 17.0 D 23.8 C 17.1 D 24.5 B 23.1 C 26.9 B
S. Wekiva Tr. to Sand Lake Rd. 0.50 19.0 C 22.9 C 27.5 B 23.6 C 26.3 B 26.7 B 17.7 D 17.7 D 19.6 C 19.6 C 17.5 D 17.5 D 18.9 C 18.9 C 14.6 D 14.6 D 13.8 E 13.8 E 14.7 D 14.7 D
Sand Lake Rd. to Ross (Plaza) 0.54 38.5 A 37.3 A 36.8 A 36.7 A 33.9 A 34.3 A 33.1 A 32.1 A 35.7 A 36.1 A
Ross (Plaza) to SR 436 0.20 16.0 D 28.0 B 5.2 F 15.7 D 9.6 F 21.0 C 8.9 F 18.5 C 9.8 F 19.1 C 9.3 F 18.5 C 6.6 F 14.9 D 9.9 F 19.1 C 8.1 F 17.6 D 12.0 E 22.5 C
Average 26.2 B 22.4 C 26.4 B 18.2 C 19.3 C 18.1 C 20.4 C 20.2 C 19.7 C 22.4 C
PM PEAK HOUR
Wekiva Springs Rd. tp N. Wekiva Tr. 0.80 32.1 A 32.1 A 31.7 A 31.7 A 27.9 B 27.9 B - - - - - - - - - - - - 30.0 B 30.4 A 32.2 A 29.1 B
N. Wekiva Tr. to Needles Dr. 0.24 26.8 B 29.8 B 35.8 A - - - - - - - - - - - - 27.6 B 31.4 A 31.4 A 28.2 B
Needles Dr. to S. Wekiva Tr. 0.51 32.1 A 32.6 A 24.7 B - - - - - - - - - - - - 23.5 C 27.1 B 25.0 B 28.5 B 23.5 C 28.5 B 29.2 B 29.0 B
S. Wekiva Tr. to Sand Lake Rd. 0.50 23.5 C 27.1 B 25.5 B 28.9 B 17.2 D 22.3 C 17.1 D 17.1 D 17.8 D 17.8 D 16.6 D 16.6 D 19.7 C 19.7 C 27.0 B 27.0 B 19.6 C 19.6 C 16.9 D 16.9 D
Sand Lake Rd. to Ross (Plaza) 0.54 33.9 A 31.8 A 28.3 B 38.5 A 33.2 A 31.5 A 31.5 A 33.1 A 32.1 A 31.2 A
Ross (Plaza) to SR 436 0.21 6.0 F 15.0 D 7.9 F 17.6 D 7.9 F 17.9 D 7.5 F 16.6 D 7.5 F 15.9 D 9.3 F 18.0 D 13.3 E 22.2 C 8.1 F 17.1 D 10.6 E 19.9 C 11.5 E 20.5 C
Average 23.2 C 22.1 C 25.3 B 16.8 D 16.6 D 17.4 D 24.1 B 23.9 C 23.8 C 23.4 C
Rdwy Segment Rdwy Section
Average Speed Average Speed
Year 2013
Rdwy Segment Rdwy Section
Average Speed Average Speed
TABLE C14.1aYear 2014 Seminole County Travel Time & Delay Study
Hunt Club Boulevard - Northbound Direction Historical Summary
Year 2014Year 2005 Year 2006 Year 2007 Year 2008 Year 2009 Year 2010 Year 2011 Year 2013
Average Speed Average Speed Average Speed Average Speed Average Speed
Rdwy Section Rdwy Segment Rdwy Section
Average Speed Average Speed Average Speed Average Speed Average Speed Average Speed Average Speed Average Speed Average Speed Average Speed Average Speed
Average Speed Average Speed Average Speed Average Speed Average SpeedAverage Speed Average Speed Average Speed Average Speed Average Speed Average Speed Average Speed Average Speed
Year 2012
Rdwy Segment Rdwy Section
Average Speed Average Speed
Year 2012
Rdwy Segment Rdwy Section
Average Speed Average Speed
Rdwy Section
Year 2014
TABLE C14.1bYear 2014 Seminole County Travel Time & Delay Study
Hunt Club Boulevard - Southbound Direction Historical Summary
Average Speed Average Speed Average Speed
Rdwy Section Rdwy Segment Rdwy Section
D-19 Hunt Club Boulevard
Roadway Distance
Segments (mile) (mph) LOS (mph) LOS (mph) LOS (mph) LOS (mph) LOS (mph) LOS (mph) LOS (mph) LOS (mph) LOS (mph) LOS (mph) LOS (mph) LOS (mph) LOS (mph) LOS (mph) LOS (mph) LOS (mph) LOS (mph) LOS (mph) LOS (mph) LOS
AM PEAK HOUR
International Pkwy. S to Lake Mary Blvd** 0.11 ---- ---- ---- ---- ---- ---- ---- ---- ---- ---- ---- ---- ---- ---- ---- ---- ---- ---- ---- ---- ---- ---- ---- ---- ---- ---- ---- ---- 5.2 F 5.2 F ---- ---- ---- ---- ---- ---- ---- ----
Lake Mary Blvd. to AAA Dr. 1.18 ---- ---- ---- ---- ---- ---- ---- ---- ---- ---- ---- ---- 37.4 A 37.4 A ---- ---- ---- ---- ---- ---- ---- ---- 28.9 B 28.9 B 28.3 B 28.3 B 26.1 B 26.1 B 30.1 A 30.1 A
*AAA Dr. to CR 46A 1.13 ---- ---- ---- ---- ---- ---- ---- ---- ---- ---- ---- ---- 22.0 C 22.0 C 10.7 E 10.7 E 11.7 F 11.7 F 24.1 B 24.1 B 21.1 C 21.1 C 20.1 C 20.1 C 21.3 C 21.3 C
CR 46A to SR 417** 0.70 ---- ---- ---- ---- ---- ---- ---- ---- ---- ---- ---- ---- 25.9 C 25.9 C 29.4 B 29.4 B 27.8 C 27.8 C
SR 417 to Wilson Rd. 0.57 ---- ---- ---- ---- ---- ---- ---- ---- ---- ---- ---- ---- 45.7 A 45.7 A 42.8 A 42.8 A 43.3 A 43.3 A 35.2 A 35.2 A 40.7 A 40.7 A 37.6 A 37.6 A 42.7 A 42.7 A
Wilson Rd. to Wayside Dr. 0.50 ---- ---- ---- ---- ---- ---- ---- ---- ---- ---- ---- ---- 49.2 A 44.3 A 44.3 A 38.0 A 42.9 A 39.0 A 34.5 B
Wayside Dr. to SR 46 0.21 ---- ---- ---- ---- ---- ---- ---- ---- ---- ---- ---- ---- 40.2 A 42.0 A 15.2 E 26.1 C 39.4 A 38.7 A 9.2 F 19.7 D 12.9 F 25.4 C 13.5 E 25.1 C 13.8 E 23.9 C
Average 34.0 B 26.2 C 30.0 B 26.8 C 23.8 C 25.4 C 26.7 C
PM PEAK HOUR
International Pkwy. S to Lake Mary Blvd** 0.11 ---- ---- ---- ---- ---- ---- ---- ---- ---- ---- ---- ---- ---- ---- ---- ---- ---- ---- ---- ---- ---- ---- ---- ---- ---- ---- ---- ---- 4.0 F 4.0 F ---- ---- ---- ---- ---- ---- ---- ----
Lake Mary Blvd. to AAA Dr. 1.18 ---- ---- ---- ---- ---- ---- ---- ---- ---- ---- ---- ---- 38.9 A 38.9 A ---- ---- ---- ---- ---- ---- ---- ---- 27.6 B 27.6 B 28.0 B 28.0 B 26.2 B 26.2 B 28.1 B 28.1 B
*AAA Dr. to CR 46A 1.13 30.4 A 30.4 A 13.0 E 13.0 E 12.7 F 12.7 F 17.4 D 17.4 D 26.5 B 26.5 B 19.6 C 19.6 C 14.3 D 14.3 D
CR 46A to SR 417** 0.70 33.6 B 33.6 B 32.1 B 32.1 B 29.0 B 29.0 B
SR 417 to Wilson Rd. 0.57 ---- ---- ---- ---- ---- ---- ---- ---- ---- ---- ---- ---- 44.3 A 44.3 A 43.2 A 43.2 A 43.8 A 43.8 A 35.2 A 35.2 A 41.2 A 41.2 A 37.2 A 37.2 A 42.7 A 42.7 A
Wilson Rd. to Wayside Dr. 0.50 ---- ---- ---- ---- ---- ---- ---- ---- ---- ---- ---- ---- 47.2 A 42.7 A 45.7 A 40.5 A 38.0 A 37.5 A 39.5 A
Wayside Dr. to SR 46 0.21 ---- ---- ---- ---- ---- ---- ---- ---- ---- ---- ---- ---- 19.3 D 30.9 B 9.3 F 19.8 D 14.3 E 24.9 C 10.7 F 22.2 C 8.1 F 18.1 D 22.1 C 31.1 B 11.4 F 22.8 C
Average 36.7 A 25.9 C 27.9 C 24.4 C 23.7 C 26.4 C 22.6 C
Note: * For the year 2009 the roadway segment is from Heathrow Park Ln to CR 46A of 0.39 Miles
Note: ** From 2012, the segment limits were extended to International Pkwy S. and additional control points have been considered at SR 417.
Roadway Distance
Segments (mile) (mph) LOS (mph) LOS (mph) LOS (mph) LOS (mph) LOS (mph) LOS (mph) LOS (mph) LOS (mph) LOS (mph) LOS (mph) LOS (mph) LOS (mph) LOS (mph) LOS (mph) LOS (mph) LOS (mph) LOS (mph) LOS (mph) LOS (mph) LOS
AM PEAK HOUR
SR 46 to Wayside Dr. 0.21 ---- ---- ---- ---- ---- ---- ---- ---- ---- ---- ---- ---- 27.8 C 33.6 B 42.0 A 26.2 C 29.3 B 17.0 D 29.3 B
Wayside Dr. to Wilson Rd. 0.50 ---- ---- ---- ---- ---- ---- ---- ---- ---- ---- ---- ---- 46.0 A 38.2 A 44.5 A 40.5 A 45.7 A 44.5 A 38.5 A 33.8 B 41.7 A 37.0 A 38.5 A 28.0 B 44.1 A 38.4 A
Wilson Rd. to SR 417 0.57 ---- ---- ---- ---- ---- ---- ---- ---- ---- ---- ---- ---- 27.8 C 27.8 C 25.5 C 25.5 C 22.0 D 22.0 D 25.9 B 25.9 B 40.2 A 40.2 A 34.5 B 34.5 B 33.2 B 33.2 B
SR 417 to CR 46A 0.70 ---- ---- ---- ---- ---- ---- ---- ---- ---- ---- ---- ---- 22.7 C 22.7 C 18.7 D 18.7 D 18.1 D 18.1 D
*CR 46A to AAA Dr. 1.13 ---- ---- ---- ---- ---- ---- ---- ---- ---- ---- ---- ---- 32.7 A 32.7 A 34.6 B 34.6 B 34.5 B 34.5 B 32.6 A 32.6 A 33.1 A 33.1 A 29.6 B 29.6 B 33.4 A 33.4 A
AAA Dr. to Lake Mary Blvd 1.17 ---- ---- ---- ---- ---- ---- ---- ---- ---- ---- ---- ---- 30.6 A 30.6 A ---- ---- ---- ---- ---- ---- ---- ---- 27.3 B 27.3 B 22.2 C 22.2 C 21.7 C 21.7 C 20.0 C 20.0 C
Lake Mary Blvd to International Pkwy. S** 0.21 ---- ---- ---- ---- ---- ---- ---- ---- ---- ---- ---- ---- ---- ---- ---- ---- ---- ---- ---- ---- ---- ---- ---- ---- ---- ---- ---- ---- 35.0 A 35.0 A ---- ---- ---- ---- ---- ---- ---- ----
Average 31.3 B 30.3 B 27.7 C 29.0 B 28.6 B 25.0 C 25.7 C
PM PEAK HOUR
SR 46 to Wayside Dr. 0.21 ---- ---- ---- ---- ---- ---- ---- ---- ---- ---- ---- ---- 33.5 B 33.4 B 40.6 A 30.0 B 36.0 A 30.0 B 30.7 B
Wayside Dr. to Wilson Rd. 0.50 ---- ---- ---- ---- ---- ---- ---- ---- ---- ---- ---- ---- 45.6 A 40.9 A 44.7 A 40.4 A 45.0 A 43.6 A 39.5 A 36.1 A 42.9 A 40.6 A 38.5 A 35.5 A 42.3 A 38.0 A
Wilson Rd. to SR 417 0.57 ---- ---- ---- ---- ---- ---- ---- ---- ---- ---- ---- ---- 30.5 B 30.5 B 27.1 C 27.1 C 21.6 D 21.6 D 26.2 B 26.2 B 35.3 A 35.3 A 33.9 B 33.9 B 35.6 A 35.6 A
SR 417 to CR 46A 0.70 ---- ---- ---- ---- ---- ---- ---- ---- ---- ---- ---- ---- 22.7 C 22.7 C 23.0 C 23.0 C 20.3 D 20.3 D
*CR 46A to AAA Dr. 1.13 ---- ---- ---- ---- ---- ---- ---- ---- ---- ---- ---- ---- 36.1 A 36.1 A 34.2 B 34.2 B 36.8 A 36.8 A 31.7 A 31.7 A 32.8 A 32.8 A 27.8 B 27.8 B 29.1 B 29.1 B
AAA Dr. to Lake Mary Blvd 1.17 ---- ---- ---- ---- ---- ---- ---- ---- ---- ---- ---- ---- 27.9 B 27.9 B ---- ---- ---- ---- ---- ---- ---- ---- 25.8 B 25.8 B 20.7 C 20.7 C 19.1 C 19.1 C 23.9 C 23.9 C
Lake Mary Blvd to International Pkwy. S** 0.21 ---- ---- ---- ---- ---- ---- ---- ---- ---- ---- ---- ---- ---- ---- ---- ---- ---- ---- ---- ---- ---- ---- ---- ---- ---- ---- ---- ---- 35.0 A 35.0 A ---- ---- ---- ---- ---- ---- ---- ----
Average 32.4 B 31.3 B 27.6 C 28.7 B 27.8 C 25.3 C 27.3 C
Note: * For the year 2009 the roadway segment is from Heathrow Park Ln to CR 46A of 0.39 Miles
Note: ** From 2012, the segment limits were extended to International Pkwy S. and additional control points have been considered at SR 417.
TABLE C15.1aYear 2014 Seminole County Travel Time & Delay Study
International Parkway - Northbound Direction Historical Summary
TABLE C15.1bYear 2014 Seminole County Travel Time & Delay Study
International Parkway - Southbound Direction Historical Summary
Year 2005 Year 2006 Year 2007 Year 2008 Year 2009 Year 2010 Year 2011
Average Speed Average Speed Average Speed Average Speed Average SpeedAverage Speed Average Speed Average Speed Average Speed Average Speed Average Speed Average Speed
Rdwy Segment Rdwy Section
Average Speed Average Speed
Year 2012
Rdwy Segment Rdwy Section
Average Speed Average Speed
Year 2012
Rdwy Segment Rdwy Section
Average Speed Average Speed
Rdwy Section
Year 2014
Year 2014Year 2013
Year 2013
Average Speed
D-20 International Parkway
Roadway Distance
Segments (mile) (mph) LOS (mph) LOS (mph) LOS (mph) LOS (mph) LOS (mph) LOS (mph) LOS (mph) LOS (mph) LOS (mph) LOS (mph) LOS (mph) LOS (mph) LOS (mph) LOS (mph) LOS (mph) LOS (mph) LOS (mph) LOS (mph) LOS (mph) LOS
AM PEAK HOUR
Longwood Hills Rd. to Danbury Rd. 0.28 32.9 B 31.3 B 19.1 D 35.4 A 30.2 B 30.0 B 33.6 A 39.1 A 36.5 A 35.7 A
Danbury Rd. to Equestrian Club Ln. 0.65 40.7 A 35.2 A 35.8 A 40.4 A 38.5 A 30.5 B 39.0 A 41.5 A 41.5 A 40.6 A
Equestrian Club Ln. to Greenway Blvd. 0.47 35.5 A 37.1 A 27.7 C 31.6 B 27.1 C 27.8 C 31.1 B 35.8 A 29.6 B 33.3 B 19.4 D 25.6 C 32.5 B 35.5 A 37.8 A 39.7 A 32.1 B 36.9 A 32.9 B 36.7 A
Greenway Blvd. to Technology Dr. 0.30 22.8 C 22.8 C 29.8 B 29.8 B 26.9 C 26.9 C 36.5 A 36.5 A 23.4 C 23.4 C 25.4 C 25.4 C 29.0 B 29.0 B 40.0 A 40.0 A 27.7 C 27.7 C 27.3 C 27.3 C
Technology Dr. to Sand Pond Rd. 0.28 32.3 B 28.8 B 31.1 B 35.3 A 33.5 B 28.1 B 29.5 B 41.0 A 39.1 A 32.9 B
Sand Pond Rd. to Greenwood Blvd. 0.53 30.7 B 31.2 B 26.5 C 27.2 C 34.6 B 33.2 B 39.7 A 38.0 A 42.3 A 38.8 A 38.3 A 33.9 B 37.4 A 34.2 B 26.5 C 30.2 B 34.9 B 36.3 A 24.1 C 26.6 C
Greenwood Blvd. to Lake Mary Center 0.31 27.7 C 27.7 C 25.3 C 25.3 C 36.5 A 36.5 A 35.2 A 35.2 A 27.5 C 27.5 C 26.2 C 26.2 C 22.6 C 22.6 C 35.6 A 35.6 A 39.2 A 39.2 A 21.8 D 21.8 D
Lake Mary Center to Lake Mary Blvd. 0.17 9.2 F 9.2 F 6.5 F 6.5 F 11.1 F 11.1 F 10.2 F 10.2 F 4.5 F 4.5 F 5.7 F 5.7 F 7.8 F 7.8 F 8.1 F 8.1 F 5.9 F 5.9 F 5.4 F 5.4 F
Average 28.4 B 24.9 C 27.5 C 32.2 B 24.7 C 23.2 C 27.6 C 30.4 B 28.0 B 24.1 C
PM PEAK HOUR
Longwood Hills Rd. to Danbury Rd. 0.28 34.3 B 32.9 B 31.1 B 36.3 A 29.6 B 31.6 B 33.6 A 34.3 B 35.7 A 35.7 A
Danbury Rd. to Equestrian Club Ln. 0.65 43.5 A 41.3 A 41.9 A 39.9 A 36.2 A 29.3 B 37.9 A 41.1 A 41.1 A 41.1 A
Equestrian Club Ln. to Greenway Blvd. 0.47 33.7 B 37.8 A 29.8 B 35.0 A 27.9 C 33.9 B 29.0 B 34.9 B 33.2 B 33.7 B 23.4 C 27.5 C 30.7 B 34.3 B 29.1 B 34.9 B 29.7 B 35.5 A 32.1 B 36.6 A
Greenway Blvd. to Technology Dr. 0.30 20.6 D 20.6 D 22.6 C 22.6 C 17.1 D 17.1 D 20.4 D 20.4 D 28.6 B 28.6 B 27.7 C 27.7 C 23.4 C 23.4 C 29.5 B 29.5 B 28.6 B 28.6 B 25.0 C 25.0 C
Technology Dr. to Sand Pond Rd. 0.28 28.6 B 24.9 C 28.1 B 26.0 C 24.5 C 22.9 C 28.5 B 32.9 B 26.7 C 30.5 B
Sand Pond Rd. to Greenwood Blvd. 0.53 25.3 C 26.3 C 23.4 C 23.9 C 18.7 D 21.2 D 18.7 D 20.7 D 29.2 B 27.4 C 23.9 C 23.5 C 25.9 C 26.7 C 19.0 D 22.3 C 17.6 D 19.9 D 23.2 C 25.3 C
Greenwood Blvd. to Lake Mary Center 0.31 19.1 D 19.1 D 17.5 D 17.5 D 10.2 F 10.2 F 16.8 E 16.8 E 23.0 C 23.0 C 17.5 D 17.5 D 15.9 E 15.9 E 9.2 F 9.2 F 10.4 F 10.4 F 13.3 E 13.3 E
Lake Mary Center to Lake Mary Blvd. 0.17 7.5 F 7.5 F 9.2 F 9.2 F 7.8 F 7.8 F 10.9 F 10.9 F 6.1 F 6.1 F 5.2 F 5.2 F 5.3 F 5.3 F 4.7 F 4.7 F 4.3 F 4.3 F 4.7 F 4.7 F
Average 25.0 C 24.5 C 20.2 D 23.5 C 25.0 C 20.8 D 22.2 C 19.2 D 18.8 D 21.3 D
Roadway Distance
Segments (mile) (mph) LOS (mph) LOS (mph) LOS (mph) LOS (mph) LOS (mph) LOS (mph) LOS (mph) LOS (mph) LOS (mph) LOS (mph) LOS (mph) LOS (mph) LOS (mph) LOS (mph) LOS (mph) LOS (mph) LOS (mph) LOS (mph) LOS (mph) LOS
AM PEAK HOUR
Lake Mary Blvd. to Lake Mary Center 0.15 17.1 D 17.1 D 17.3 D 17.3 D 13.6 E 13.6 E 27.6 C 27.6 C 24.9 C 24.9 C 29.0 B 29.0 B 16.8 D 16.8 D 21.3 C 21.3 C 19.6 C 19.6 C 24.0 C 24.0 C
Lake Mary Center to Greenwood Blvd. 0.31 18.0 D 18.0 D 17.0 E 17.0 E 25.5 C 25.5 C 30.7 B 30.7 B 26.1 C 26.1 C 40.4 A 40.4 A 25.6 C 25.6 C 27.8 C 27.8 C 24.6 C 24.6 C 28.2 B 28.2 B
Greenwood Blvd. to Sand Pond Rd. 0.53 36.1 A 36.1 A 23.8 C 23.8 C 34.2 B 34.2 B 35.7 A 35.7 A 37.5 A 37.5 A 35.3 A 35.3 A 41.3 A 41.3 A 41.8 A 41.8 A 43.0 A 43.0 A 40.8 A 40.8 A
Sand Pond Rd. to Technology Dr. 0.27 34.9 B 34.9 B 32.6 B 32.6 B 31.1 B 31.1 B 29.1 B 29.1 B 34.4 B 34.4 B 25.6 C 25.6 C 35.7 A 35.7 A 41.0 A 41.0 A 32.3 B 32.3 B 29.5 B 29.5 B
Technology Dr. to Greenway Blvd. 0.31 30.8 B 28.7 B 27.3 C 30.5 B 34.4 B 23.7 C 38.3 A 32.1 B 31.0 B 30.5 B
Greenway Blvd. to Equestrian Club Ln. 0.46 37.6 A 38.5 A 36.3 A 39.7 A 36.2 A 37.3 A 39.4 A 41.2 A 39.4 A 37.8 A
Equestrian Club Ln. to Danbury Rd. 0.66 28.7 B 38.6 A 37.9 A 40.0 A 37.0 A 25.5 C 35.5 A 41.9 A 40.2 A 37.5 A
Danbury Rd. to Longwood Hills Rd. 0.28 12.2 F 25.2 C 21.7 D 32.5 B 31.1 B 33.9 B 32.6 B 36.6 A 31.9 B 35.4 A 16.7 E 25.1 C 23.3 C 33.9 A 23.0 C 35.1 A 28.5 B 35.7 A 26.2 C 33.8 B
Average 25.5 C 26.9 C 30.4 B 34.3 B 33.6 B 27.8 C 32.2 B 34.4 B 33.3 B 32.9 B
PM PEAK HOUR
Lake Mary Blvd. to Lake Mary Center 0.15 24.7 C 24.7 C 14.7 E 14.7 E 14.8 E 14.8 E 17.4 D 17.4 D 17.7 D 17.7 D 19.6 D 19.6 D 20.0 C 20.0 C 24.0 C 24.0 C 28.2 B 28.2 B 31.0 A 31.0 A
Lake Mary Center to Greenwood Blvd. 0.31 17.3 D 17.3 D 18.4 D 18.4 D 22.7 C 22.7 C 28.4 B 28.4 B 26.0 C 26.0 C 29.1 B 29.1 B 24.3 C 24.3 C 24.0 C 24.0 C 31.0 B 31.0 B 21.3 D 21.3 D
Greenwood Blvd. to Sand Pond Rd. 0.53 31.9 B 31.9 B 18.1 D 18.1 D 24.7 C 24.7 C 29.4 B 29.4 B 23.4 C 23.4 C 39.7 A 39.7 A 28.1 B 28.1 B 33.5 B 33.5 B 38.3 A 38.3 A 34.6 B 34.6 B
Sand Pond Rd. to Technology Dr. 0.28 18.3 D 18.3 D 18.5 D 18.5 D 19.1 D 19.1 D 28.7 B 28.7 B 21.8 D 21.8 D 25.2 C 25.2 C 25.5 C 25.5 C 21.3 D 21.3 D 29.0 B 29.0 B 25.5 C 25.5 C
Technology Dr. to Greenway Blvd. 0.34 30.3 B 29.6 B 25.4 C 36.3 A 26.7 C 30.0 B 36.0 A 36.0 A 33.3 B 33.3 B 30.0 B 30.0 B 35.3 A 35.3 A
Greenway Blvd. to Equestrian Club Ln. 0.46 40.5 A 38.8 A 39.4 A 38.3 A 36.3 A 37.8 A 38.9 A 37.3 A 40.0 A 40.6 A
Equestrian Club Ln. to Danbury Rd. 0.66 40.0 A 38.1 A 39.4 A 36.7 A 32.0 B 28.3 B 37.9 A 37.9 A 39.0 A 41.5 A
Danbury Rd. to Longwood Hills Rd. 0.28 12.2 F 28.3 B 14.0 E 28.9 B 8.4 F 22.9 C 10.0 F 26.1 C 19.7 D 29.0 B 23.5 C 29.6 B 16.2 D 30.9 A 28.5 B 35.0 B 28.0 C 35.1 A 23.7 C 35.7 A
Average 25.6 C 22.9 C 22.1 C 26.4 C 25.9 C 29.6 B 28.2 B 30.6 B 34.0 B 31.8 B
Year 2013
Rdwy Segment Rdwy Section
Average Speed Average Speed
Year 2013
Rdwy Segment Rdwy Section
Average Speed Average Speed
TABLE C16.1aYear 2014 Seminole County Travel Time & Delay Study
Lake Emma Road - Northbound Direction Historical Summary
Year 2014
Year 2014
Lake Emma Road - Southbound Direction Historical Summary
TABLE C16.1bYear 2014 Seminole County Travel Time & Delay Study
Year 2005 Year 2006 Year 2007 Year 2008 Year 2009 Year 2010 Year 2011
Average Speed Average Speed Average Speed Average Speed Average Speed Average Speed Average Speed Average Speed Average Speed Average Speed Average Speed Average Speed Average Speed
Average Speed Average Speed Average Speed Average Speed Average Speed
Rdwy Section Rdwy Segment Rdwy Section
Average Speed Average Speed Average Speed Average Speed Average Speed Average Speed Average Speed Average Speed Average Speed Average Speed Average Speed
Segments (mile) (mph) LOS (mph) LOS (mph) LOS (mph) LOS (mph) LOS (mph) LOS (mph) LOS (mph) LOS (mph) LOS (mph) LOS (mph) LOS (mph) LOS (mph) LOS (mph) LOS (mph) LOS (mph) LOS (mph) LOS (mph) LOS (mph) LOS (mph) LOS
AM PEAK HOUR
Orange County Line to Linden Rd. 0.75 ---- ---- ---- ---- ---- ---- ---- ---- ---- ---- ---- ---- 23.4 C ---- ---- ---- ---- ---- ---- ---- ---- 25.9 B 27.9 B 29.6 B 29.2 B
Linden Rd. to Howell Branch Rd. 0.28 ---- ---- ---- ---- ---- ---- ---- ---- ---- ---- ---- ---- 11.4 E 18.2 C 8.5 F 8.5 F 14.4 D 14.4 D 24.3 B 25.4 B 24.7 B 27.0 B 24.7 B 28.1 B 22.1 C 26.9 B
Howell Branch Rd. to Lake Howell Ln. 0.51 ---- ---- ---- ---- ---- ---- ---- ---- ---- ---- ---- ---- 28.4 B 29.5 B 24.2 B 16.3 D 14.6 D 15.8 D 13.9 E
Lake Howell Ln. to Tuscarora Tr. 0.06 ---- ---- ---- ---- ---- ---- ---- ---- ---- ---- ---- ---- 20.4 C 27.3 B 23.9 C 28.8 B 27.7 B 24.5 B 30.0 B 17.3 D 35.0 A 15.7 D 35.0 A 16.9 D 30.0 B 14.9 D
Tuscarora Tr. to SR 436 0.44 ---- ---- ---- ---- ---- ---- ---- ---- ---- ---- ---- ---- 28.6 B 28.6 B 33.3 A 33.3 A 21.9 C 21.9 C 10.9 E 10.9 E 9.6 F 9.6 F 10.6 E 10.6 E 20.0 C 20.0 C
Average 22.0 C 19.5 C 20.6 C 17.7 D 16.7 D 18.0 D 20.7 C
PM PEAK HOUR
Orange County Line to Linden Rd. 0.75 ---- ---- ---- ---- ---- ---- ---- ---- ---- ---- ---- ---- 16.0 D ---- ---- ---- ---- ---- ---- ---- ---- 27.1 B 28.7 B 23.3 C 23.2 C
Linden Rd. to Howell Branch Rd. 0.28 ---- ---- ---- ---- ---- ---- ---- ---- ---- ---- ---- ---- 7.7 F 12.3 E 7.2 F 7.2 F 8.9 F 8.9 F 17.5 D 23.6 C 11.7 E 20.6 C 11.4 E 18.1 C 9.5 F 16.7 D
Howell Branch Rd. to Lake Howell Ln. 0.51 ---- ---- ---- ---- ---- ---- ---- ---- ---- ---- ---- ---- 23.5 C 27.2 B 22.4 C 11.8 E 17.3 D 12.3 E 12.3 E
Lake Howell Ln. to Tuscarora Tr. 0.06 ---- ---- ---- ---- ---- ---- ---- ---- ---- ---- ---- ---- 22.2 C 23.3 C 29.9 B 27.5 B 27.7 B 22.9 C 32.3 A 12.8 E 35.0 A 18.5 C 35.0 A 13.4 E 35.0 A 13.4 E
Tuscarora Tr. to SR 436 0.44 ---- ---- ---- ---- ---- ---- ---- ---- ---- ---- ---- ---- 29.8 B 29.8 B 28.8 B 28.8 B 14.9 D 14.9 D 11.1 E 11.1 E 13.7 E 13.7 E 14.8 D 14.8 D 11.6 E 11.6 E
Average 16.6 D 17.3 D 15.0 D 15.8 D 18.0 D 15.8 D 14.3 D
Roadway Distance
Segments (mile) (mph) LOS (mph) LOS (mph) LOS (mph) LOS (mph) LOS (mph) LOS (mph) LOS (mph) LOS (mph) LOS (mph) LOS (mph) LOS (mph) LOS (mph) LOS (mph) LOS (mph) LOS (mph) LOS (mph) LOS (mph) LOS (mph) LOS (mph) LOS
AM PEAK HOUR
SR 436 to Tuscarora Tr. 0.44 ---- ---- ---- ---- ---- ---- ---- ---- ---- ---- ---- ---- 31.4 A 31.4 A 28.4 B 28.4 B 25.4 B 25.4 B 23.4 C 23.4 C 29.4 B 29.4 B 12.5 E 12.5 E 29.1 B 29.1 B
Tuscarora Tr. to Lake Howell Ln. 0.07 ---- ---- ---- ---- ---- ---- ---- ---- ---- ---- ---- ---- 23.2 C 18.9 C 18.0 D 28.0 B 24.7 B 32.3 A 35.0 A
Lake Howell Ln. to Howell Branch Rd. 0.50 ---- ---- ---- ---- ---- ---- ---- ---- ---- ---- ---- ---- 10.6 E 11.3 E 13.7 E 14.2 D 16.5 D 16.6 D 13.4 E 14.3 D 16.0 D 16.8 D 20.0 C 21.0 C 15.1 D 16.2 D
Howell Branch Rd. to Linden Rd. 0.28 ---- ---- ---- ---- ---- ---- ---- ---- ---- ---- ---- ---- 20.2 C 20.7 C 20.7 C 19.3 C 19.3 C 19.8 C 17.9 D 16.3 D 19.5 C
Linden Rd. to Orange County Line 0.76 ---- ---- ---- ---- ---- ---- ---- ---- ---- ---- ---- ---- 17.3 D 18.0 D ---- ---- ---- ---- ---- ---- ---- ---- 20.5 C 20.3 C 23.2 C 21.5 C 23.7 C 21.1 C 23.0 C 21.9 C
Average 16.8 D 18.7 C 19.8 C 18.7 C 21.2 C 18.2 C 21.1 C
PM PEAK HOUR
SR 436 to Tuscarora Tr. 0.44 ---- ---- ---- ---- ---- ---- ---- ---- ---- ---- ---- ---- 28.7 B 28.7 B 29.1 B 29.1 B 29.1 B 29.1 B 16.6 D 16.6 D 27.2 B 27.2 B 14.4 D 14.4 D 27.7 B 27.7 B
Tuscarora Tr. to Lake Howell Ln. 0.07 ---- ---- ---- ---- ---- ---- ---- ---- ---- ---- ---- ---- 28.3 B 21.1 C 22.5 C 24.7 B 23.3 C 19.1 C 16.8 D
Lake Howell Ln. to Howell Branch Rd. 0.50 ---- ---- ---- ---- ---- ---- ---- ---- ---- ---- ---- ---- 14.5 D 15.3 D 16.3 D 16.8 D 10.8 E 11.4 E 15.7 D 16.4 D 20.4 C 20.7 C 13.2 E 13.7 E 14.9 D 15.1 D
Howell Branch Rd. to Linden Rd. 0.28 ---- ---- ---- ---- ---- ---- ---- ---- ---- ---- ---- ---- 19.2 C 20.8 C 20.8 C 19.5 C 19.5 C 19.5 C 16.5 D 21.5 C 19.5 C
Linden Rd. to Orange County Line 0.76 ---- ---- ---- ---- ---- ---- ---- ---- ---- ---- ---- ---- 24.4 B 22.7 C ---- ---- ---- ---- ---- ---- ---- ---- 22.2 C 21.4 C 22.5 C 20.5 C 24.5 B 23.6 C 23.4 C 22.2 C
Average 20.8 C 20.7 C 16.6 D 18.6 C 21.8 C 17.5 D 20.5 C
Year 2013
Rdwy Segment Rdwy Section
Average Speed Average Speed
Year 2013
Rdwy Segment Rdwy Section
Average Speed Average Speed
TABLE C17.1aYear 2014 Seminole County Travel Time & Delay Study
Lake Howell Road - Northbound Direction Historical Summary
TABLE C17.1b
Year 2014Year 2005 Year 2006 Year 2007 Year 2008 Year 2009 Year 2010 Year 2011
Average Speed Average Speed Average Speed Average Speed Average SpeedAverage Speed Average Speed Average Speed Average Speed Average Speed Average Speed
Year 2012
Rdwy Segment Rdwy Section
Average Speed Average Speed
Year 2012
Rdwy Segment Rdwy Section
Average Speed Average Speed
Rdwy Section
Year 2014
Year 2014 Seminole County Travel Time & Delay StudyLake Howell Road - Southbound Direction Historical Summary
Segments (mile) (mph) LOS (mph) LOS (mph) LOS (mph) LOS (mph) LOS (mph) LOS (mph) LOS (mph) LOS (mph) LOS (mph) LOS (mph) LOS (mph) LOS (mph) LOS (mph) LOS (mph) LOS (mph) LOS (mph) LOS (mph) LOS (mph) LOS (mph) LOS
AM PEAK HOUR
Markham Woods Rd. to Heathrow Blvd. 0.66 39.3 A 36.5 A 35.9 A 39.2 A 39.7 A 40.0 A 37.4 A 31.7 B 32.7 B 44.0 A
Heathrow Blvd. to International Pkwy. 0.20 23.2 C 23.7 C 22.9 C 24.8 C 15.0 E 25.3 C 10.1 F 16.8 E 10.2 F 16.3 E
International Pkwy. to I-4 WB Ramps 0.15 45.7 A 37.3 A 15.0 E 32.6 B 16.1 E 17.5 D 12.0 F 40.0 A 38.4 A 36.9 A
I-4 WB Ramps to I-4 EB Ramps 0.27 26.3 C 33.1 B 18.4 D 28.3 B 15.7 E 23.5 C 14.4 E 26.7 C 15.8 E 22.8 C 17.6 D 26.6 C 18.8 D 19.9 D 31.8 B 28.6 B 18.1 D 22.2 C 30.0 B 32.0 B
I-4 EB Ramps to Lake Emma Rd. 0.21 26.7 C 26.7 C 14.0 E 14.0 E 16.7 E 16.7 E 16.6 E 16.6 E 20.1 D 20.1 D 18.0 D 18.0 D 23.2 C 23.2 C 14.0 E 14.0 E 12.5 F 12.5 F 11.3 F 11.3 F
Lake Emma Rd. to Lake Mary Center 0.17 43.5 A 25.6 C 38.1 A 36.9 A 40.7 A 24.6 C 35.6 A 22.9 C 32.0 B 40.0 A
Lake Mary Center to Sun Dr. 0.15 20.6 D 25.1 C 44.5 A 42.4 A 41.2 A 26.5 C 13.9 E 17.1 D 40.0 A 22.3 C
Sun Dr. to Rinehart Rd. 0.31 23.7 C 26.0 C 23.2 C 24.3 C 44.9 A 42.8 A 40.0 A 39.6 A 39.1 A 40.0 A 26.2 C 25.8 C 21.3 D 20.6 D 29.5 B 23.6 C 33.7 B 34.6 B 16.1 E 20.6 D
Rinehart Rd. to Forest Blvd. 0.30 41.3 A 39.7 A 30.7 B 42.6 A 41.0 A 40.9 A 39.1 A 40.9 A 30.5 B 36.0 A
Forest Blvd. to Longwood Lake Mary Rd. 0.53 27.3 C 31.2 B 27.2 C 30.8 B 28.4 B 29.2 B 41.5 A 41.9 A 37.1 A 38.4 A 44.2 A 42.9 A 43.2 A 41.7 A 29.7 B 32.9 B 32.4 B 31.7 B 30.6 B 32.3 B
Longwood Lake Mary Rd. to 4th St./Lake Mary Elem. Sch. 0.57 34.4 B 40.9 A 34.1 B 35.5 A 35.4 A 30.3 B 32.6 B 42.0 A 41.0 A 42.5 A
4th St./Lake Mary Elem. Sch. to County Club Rd. 0.13 12.0 F 26.0 C 14.7 E 31.2 B 8.1 F 21.6 D 14.7 E 28.4 B 18.5 D 30.4 B 8.9 F 21.2 D 22.5 C 30.2 B 36.0 A 40.8 A 32.7 B 39.2 A 42.4 A 42.5 A
Country Club Rd. to RR Tracks 0.06
RR Tracks to Sir Lawrence Dr. 0.57 38.1 A 38.1 A 37.5 A 37.5 A 36.5 A 36.5 A 37.6 A 37.6 A 37.1 A 37.1 A 37.8 A 37.8 A 35.0 B 35.0 B 39.4 A 39.4 A 33.2 B 33.2 B 37.4 A 37.4 A
Sir Lawrence Rd. to College/Art Ln. 0.76 41.2 A 37.1 A 41.1 A 40.6 A 34.6 B 38.1 A 32.6 B 40.7 A 36.8 A 39.7 A
College/Art Ln. to Hidden Lake Dr. 0.35 41.2 A 41.2 A 39.3 A 37.8 A 39.1 A 40.5 A 38.7 A 40.0 A 38.4 A 35.7 A 40.0 A 38.7 A 34.6 B 33.2 B 34.6 B 38.6 A 32.9 B 35.5 A 39.2 A 39.5 A
Hidden Lake Dr. to Live Oak Blvd. 0.17 32.4 B 40.9 A 41.9 A 42.6 A 40.1 A 40.0 A 39.2 A 30.9 B 37.8 A 44.3 A
Live Oak Blvd. to US 17-92 0.24 13.7 E 18.2 D 10.4 F 15.2 E 14.0 E 19.4 D 10.2 F 15.0 E 8.4 F 12.6 F 8.9 F 13.1 E 7.1 F 10.8 F 8.5 F 12.1 F 9.2 F 13.4 E 7.1 F 10.9 F
US 17-92 to SR 417 SB Ramps 1.07 36.4 A 44.8 A 38.2 A 38.8 A 40.9 A 36.9 A 39.8 A 40.5 A 41.0 A 39.3 A
SR 417 SB Ramps to SR 417 NB Ramps 0.10 36.7 A 38.8 A 37.8 A 28.3 B 23.3 C 36.0 A 15.0 E 13.2 E 23.5 C 24.5 C
SR 417 NB Ramps to CR 427 0.20 7.9 F 11.6 F 17.5 D 15.0 E 15.2 E 10.7 F 18.8 D
CR 427 to Sanford Ave. 0.09 16.1 E 30.5 B 31.5 B 41.9 A 13.8 E 30.6 B 32.6 B 24.6 C 29.1 B 28.9 B 38.2 A 31.8 B 46.7 A 29.8 B 42.0 A 29.6 B 38.2 A 28.1 B 21.0 D 31.8 B
Sanford Ave. to Red Cleveland Blvd.* 1.43 --- --- --- --- --- --- --- --- --- --- --- --- 49.4 A 45.0 A 42.4 A 43.9 A 45.2 A 43.0 A 44.1 A
Red Cleveland Blvd. to Beardall Ave.** 1.30 --- --- --- --- --- --- --- --- --- --- --- --- 53.4 A 48.0 A 44.0 A 48.0 A 47.4 A 46.0 A 48.9 A
Beardall Ave. to Moores Station Rd. 1.37 --- --- --- --- --- --- --- --- --- --- --- --- 54.8 A 48.5 A 42.8 A 47.8 A 47.2 A 47.8 A 48.9 A
Moores Station Rd. to SR 46 0.96 --- --- --- --- --- --- --- --- --- --- --- --- 29.5 B 46.5 A 41.2 A 45.8 A 29.2 B 39.4 A 32.5 B 42.9 A 30.5 B 42.3 A 37.8 A 43.7 A 33.8 B 43.8 A
SR 46 to Celery Ave. 0.83 --- --- --- --- --- --- --- --- --- --- --- --- 42.6 A 36.9 A 43.4 A 46.3 A 46.3 A 45.4 A 49.6 A
Celery Ave. to Volusia County line 0.04 --- --- --- --- --- --- --- --- --- --- --- --- 49.3 A 42.8 A 59.5 A 37.6 A 56.2 A 46.2 A 53.1 A 48.0 A 53.1 A 48.0 A 50.3 A 46.7 A 33.2 B 43.6 A
Average 30.5 B 29.8 B 28.4 B 34.6 B 33.8 B 32.7 B 31.5 B 33.6 B 32.8 B 33.4 B
PM PEAK HOUR
Markham Woods Rd. to Heathrow Blvd. 0.66 43.7 A 43.1 A 41.1 A 39.9 A 36.2 A 33.6 B 36.7 A 38.8 A 39.6 A 40.0 A
Heathrow Blvd. to International Pkwy. 0.20 16.1 E 12.4 F 16.9 E 13.2 E 16.3 E 12.1 F 10.0 F 15.0 E 19.3 D 13.3 E
International Pkwy. to I-4 WB Ramps 0.15 47.9 A 35.1 A 39.3 A 39.3 A 40.9 A 38.2 A 31.0 B 43.6 A 38.4 A 45.7 A
I-4 WB Ramps to I-4 EB Ramps 0.27 40.1 A 34.5 B 20.2 D 26.2 C 35.5 A 32.7 B 24.3 C 27.8 C 38.9 A 31.2 B 29.5 B 26.2 C 21.4 D 23.4 C 23.6 C 28.6 B 33.2 B 33.0 B 37.1 A 30.7 B
I-4 EB Ramps to Lake Emma Rd. 0.21 38.3 A 38.3 A 16.0 E 16.0 E 15.9 E 15.9 E 18.1 D 18.1 D 17.4 D 17.4 D 16.2 E 16.2 E 11.8 F 11.8 F 8.1 F 8.1 F 9.9 F 9.9 F 11.3 F 11.3 F
Lake Emma Rd. to Lake Mary Center 0.17 22.2 C 21.9 D 33.3 B 34.5 B 22.1 C 19.2 D 34.3 B 36.9 A 32.0 B 15.7 E
Lake Mary Center to Sun Dr. 0.15 40.0 A 37.8 A 31.8 B 28.5 B 25.9 C 30.0 B 28.2 B 15.7 E 40.0 A 16.6 E
Sun Dr. to Rinehart Rd. 0.31 11.6 F 16.5 E 12.9 F 17.6 D 19.4 D 24.5 C 10.6 F 16.0 E 18.8 D 21.0 D 16.3 E 19.2 D 14.2 E 19.5 D 27.8 C 24.6 C 20.6 D 26.1 C 16.8 E 16.5 E
Rinehart Rd. to Forest Blvd. 0.30 38.2 A 29.3 B 30.1 B 37.8 A 34.4 B 30.0 B 26.5 C 25.4 C 22.5 C 29.0 B
Forest Blvd. to Longwood Lake Mary Rd. 0.53 40.1 A 39.4 A 26.4 C 27.4 C 30.2 B 30.1 B 28.9 B 31.7 B 34.4 B 34.4 B 30.6 B 30.4 B 37.2 A 32.5 B 28.7 B 27.4 C 20.6 D 21.3 D 33.7 B 31.9 B
Longwood Lake Mary Rd. to 4th St./Lake Mary Elem. Sch. 0.57 38.7 A 35.5 A 36.5 A 34.8 B 31.4 B 35.7 A 38.6 A 38.2 A 36.1 A 35.0 B
4th St./Lake Mary Elem. Sch. to County Club Rd. 0.13 15.2 E 30.3 B 21.7 D 31.9 B 8.6 F 23.7 C 7.5 F 21.1 D 10.3 F 23.2 C 36.0 A 35.8 A 10.9 F 26.7 C 22.5 C 34.0 B 13.3 E 27.8 C 12.6 F 26.7 C
Country Club Rd. to RR Tracks 0.06
RR Tracks to Sir Lawrence Dr. 0.57 36.1 A 36.1 A 34.1 B 34.1 B 31.8 B 31.8 B 36.9 A 36.9 A 37.9 A 37.9 A 35.0 B 35.0 B 37.1 A 37.1 A 39.8 A 39.8 A 33.2 B 33.2 B 39.4 A 39.4 A
Sir Lawrence Rd. to College/Art Ln. 0.76 34.8 B 33.2 B 36.3 A 32.3 B 36.0 A 34.6 B 38.6 A 39.3 A 29.2 B 34.3 B
College/Art Ln. to Hidden Lake Dr. 0.35 42.3 A 36.9 A 34.7 B 33.6 B 35.3 A 36.0 A 35.9 A 33.4 B 37.7 A 36.5 A 37.8 A 35.5 A 33.4 B 36.9 A 42.5 A 40.2 A 36.4 A 31.1 B 40.0 A 35.9 A
Hidden Lake Dr. to Live Oak Blvd. 0.17 45.7 A 36.7 A 40.2 A 33.8 B 37.2 A 40.0 A 37.8 A 37.8 A 40.8 A 44.3 A
Live Oak Blvd. to US 17-92 0.24 10.7 F 15.9 E 8.2 F 12.2 F 12.1 F 17.3 D 14.7 E 19.3 D 9.0 F 13.2 E 14.7 E 19.8 D 8.3 F 12.3 F 11.6 F 16.3 E 13.8 E 19.1 D 9.1 F 13.6 E
US 17-92 to SR 417 SB Ramps 1.07 43.8 A 40.4 A 35.3 A 41.5 A 38.2 A 39.6 A 37.0 A 40.5 A 36.4 A 38.6 A
SR 417 SB Ramps to SR 417 NB Ramps 0.10 45.9 A 34.7 B 35.3 A 27.1 C 32.8 B 31.8 B 31.8 B 13.5 E 15.0 E 18.6 D
SR 417 NB Ramps to CR 427 0.20 7.6 F 12.6 F 9.9 F 13.3 E 14.8 E 17.0 D 15.0 E
CR 427 to Sanford Ave. 0.09 27.2 C 40.5 A 15.9 E 32.8 B 16.0 E 30.3 B 11.8 F 23.0 C 17.2 D 28.2 B 38.2 A 27.3 C 42.0 A 29.3 B 46.7 A 29.6 B 38.2 A 29.1 B 42.0 A 29.9 B
Sanford Ave. to Red Cleveland Blvd.* 1.43 --- --- --- --- --- --- --- --- --- --- --- --- 48.0 A 47.6 A 42.4 A 46.5 A 45.2 A 41.1 A 43.2 A
Red Cleveland Blvd. to Beardall Ave.** 1.30 --- --- --- --- --- --- --- --- --- --- --- --- 53.1 A 48.4 A 43.7 A 48.0 A 47.7 A 45.4 A 49.5 A
Beardall Ave. to Moores Station Rd. 1.37 --- --- --- --- --- --- --- --- --- --- --- --- 54.3 A 48.4 A 43.7 A 48.1 A 47.5 A 45.9 A 49.8 A
Moores Station Rd. to SR 46 0.96 --- --- --- --- --- --- --- --- --- --- --- --- 15.8 E 37.3 A 18.5 D 36.9 A 20.1 D 35.4 A 22.3 C 39.0 A 30.5 B 42.4 A 27.6 C 39.5 A 19.8 D 37.3 A
SR 46 to Celery Ave. 0.83 --- --- --- --- --- --- --- --- --- --- --- --- 44.8 A 46.1 A 47.6 A 47.2 A 47.2 A 44.6 A 28.8 B
Celery Ave. to Volusia County line 0.04 --- --- --- --- --- --- --- --- --- --- --- --- 56.9 A 45.3 A 47.0 A 46.1 A 58.3 A 50.1 A 54.7 A 49.0 A 56.4 A 49.4 A 51.7 A 46.3 A 30.5 B 29.2 B
Average 31.0 B 26.0 C 28.2 B 29.5 B 31.3 B 31.3 B 30.4 B 32.9 B 31.4 B 29.8 B
Note : * Till Year 2007, the segment was used to be Sanford Ave to Ohio Ave.
Note : * *Till Year 2007, the segment was used to be Ohio Ave. to Sanford Airport
TABLE C18.1aYear 2014 Seminole County Travel Time & Delay Study
Lake Mary Boulevard/SR 415 (Part A & B) - Eastbound Direction Historical Summary
Year 2005 Year 2006 Year 2007 Year 2008 Year 2009 Year 2010 Year 2011
Average Speed Average Speed Average Speed Average Speed Average Speed Average Speed Average Speed Average Speed Average SpeedAverage Speed Average Speed Average Speed Average Speed Average Speed Average Speed Average Speed
Segments (mile) (mph) LOS (mph) LOS (mph) LOS (mph) LOS (mph) LOS (mph) LOS (mph) LOS (mph) LOS (mph) LOS (mph) LOS (mph) LOS (mph) LOS (mph) LOS (mph) LOS (mph) LOS (mph) LOS (mph) LOS (mph) LOS (mph) LOS (mph) LOS
AM PEAK HOUR
Volusia County Line to Celery Ave. 0.56 --- --- --- --- --- --- --- --- --- --- --- --- 37.5 A 48.6 A 51.4 A 46.5 A 53.1 A 42.3 A 21.1 D
Celery Ave. to SR 46 0.80 --- --- --- --- --- --- --- --- --- --- --- --- 20.9 D 25.5 C 31.5 B 36.8 A 28.6 B 32.5 A 32.6 B 35.6 A 26.4 C 30.7 A 20.9 D 24.3 A 23.5 C 22.8 A
SR 46 to Moores Station Rd. 1.02 --- --- --- --- --- --- --- --- --- --- --- --- 49.5 A 46.1 A 42.7 A 46.6 A 47.3 A 45.8 A 47.7 A
Moores Station Rd. to Beardall Ave. 1.37 --- --- --- --- --- --- --- --- --- --- --- --- 53.6 A 48.3 A 44.9 A 47.8 A 48.6 A 48.4 A 49.8 A
Beardall Ave. to Red Cleveland Blvd.** 1.26 --- --- --- --- --- --- --- --- --- --- --- --- 51.5 A 46.6 A 41.5 A 42.0 A 46.8 A 41.1 A 47.4 A
Red Cleveland Blvd. to Sanford Ave.* 1.43 --- --- --- --- --- --- --- --- --- --- --- --- 42.0 A 48.5 A 44.1 A 46.2 A 40.2 A 42.2 A 43.9 A 44.8 A 41.3 A 45.7 A 41.9 A 44.0 A 42.1 A 46.4 A
Sanford Ave. to CR 427 0.05 21.6 D 24.1 C 31.7 B 6.7 F 13.8 E 5.8 F 7.6 F 6.2 F 4.9 F 6.4 F
CR 427 to SR 417 NB Ramps 0.21 29.5 B 35.3 A 36.0 A 39.4 A 28.6 B 37.1 A 43.4 A
SR 417 NB Ramp to SR 417 SB Ramps 0.09 36.8 A 32.9 B 29.3 B 23.0 C 17.3 D 30.0 B 38.6 A 25.7 C 38.6 A 30.0 B
SR 417 SB Ramps to US 17-92 1.08 26.5 C 23.1 C 25.5 C 24.0 C 22.6 C 27.3 C 26.2 C 19.7 D 19.1 D 22.7 C 22.5 C 24.6 C 22.0 D 23.0 C 21.0 D 29.5 B 26.1 C
US 17-92 to Live Oak Blvd. 0.24 36.6 A 27.2 C 26.6 C 24.1 C 27.2 C 26.7 C 18.3 D 25.5 C 28.2 B 26.7 C 38.9 A 35.1 A 40.0 A
Live Oak Blvd. to Hidden Lake Dr. 0.17 39.9 A 39.9 A 41.6 A 41.6 A 38.6 A 38.6 A 25.6 C 20.7 D 37.7 A 29.3 B 34.3 B 30.4 B 34.0 B 29.3 B 42.5 A 40.3 A 30.0 B 32.8 B 40.8 A 40.3 A
Hidden Lake Dr. to Art/College Ln. 0.33 40.8 A 40.5 A 39.5 A 31.6 B 36.3 A 33.4 B 38.5 A 38.5 A 39.2 A 35.8 A
Art/College Ln. to Sir Lawrence Dr. 0.77 42.7 A 42.1 A 44.7 A 43.3 A 44.4 A 42.8 A 44.0 A 39.2 A 42.7 A 40.5 A 38.8 A 36.9 A 42.6 A 41.2 A 39.7 A 39.3 A 34.0 B 35.5 A 39.7 A 38.4 A
Sir Lawrence Dr. to RR Tracks 0.57
RR Tracks to Country Club Rd. 0.06 25.9 C 25.9 C 17.9 D 17.9 D 21.7 D 21.7 D 15.5 E 15.5 E 20.5 D 20.5 D 23.9 C 23.9 C 13.5 E 13.5 E 23.5 C 23.5 C 22.0 D 22.0 D 17.4 D 17.4 D
County Club Rd. to 4th St./Lake Mary Elem. Sch. 0.13 29.9 B 35.4 A 34.5 B 36.5 A 35.6 A 36.0 A 32.7 B 32.7 B 36.0 A 37.9 A
4th St./Lake Mary Elem. Sch. to Longwood Lake Mary Rd. 0.57 37.4 A 35.7 A 37.1 A 36.8 A 39.1 A 38.2 A 39.8 A 39.2 A 37.1 A 36.8 A 29.2 B 30.2 B 33.9 B 33.7 B 38.2 A 37.1 A 30.8 B 31.6 B 31.7 B 32.6 B
Longwood Lake Mary Rd. to Forest Blvd. 0.53 35.5 A 44.6 A 43.1 A 42.0 A 42.8 A 36.1 A 38.6 A 44.4 A 42.1 A 41.5 A
Forest Blvd. to Rinehart Rd. 0.31 22.7 C 29.5 B 43.1 A 44.1 A 19.6 D 30.0 B 28.1 B 35.7 A 32.5 B 38.4 A 27.3 C 32.3 B 21.7 D 30.2 B 25.7 C 35.2 A 21.7 D 31.5 B 14.3 E 24.7 C
Rinehart Rd. to Sun Dr. 0.31 36.5 A 43.3 A 42.8 A 30.7 B 26.8 C 30.0 B 40.0 A 36.2 A 25.9 C 22.6 C
Sun Dr. to Lake Mary Center 0.16 43.0 A 39.6 A 12.6 F 15.1 E 15.8 E 14.1 E 9.6 F 33.1 B 22.3 C 19.6 D
Lake Mary Center to Lake Emma Rd. 0.17 25.0 C 33.8 B 22.3 C 34.3 B 24.7 B 24.1 C 20.9 D 22.4 C 20.8 D 21.5 D 13.3 E 18.8 D 21.8 D 20.0 D 25.3 C 32.0 B 17.1 D 22.2 C 21.3 D 21.5 D
Lake Emma Rd. to I-4 EB Ramps 0.21 19.5 D 19.5 D 21.1 D 21.1 D 33.4 B 33.4 B 32.0 B 32.0 B 39.3 A 39.3 A 28.0 C 28.0 C 20.6 D 20.6 D 37.7 A 37.7 A 42.6 A 42.6 A 24.9 C 24.9 C
I-4 EB Ramps to I-4 WB Ramps 0.27 30.1 B 27.1 C 28.0 D 16.1 E 29.6 B 23.1 C 19.5 D 33.9 B 31.8 B 33.2 B
I-4 WB Ramps to International Pkwy. 0.16 13.4 E 18.4 D 18.6 A 19.2 D 19.3 D 20.5 D 17.1 D 36.9 A 17.5 D 33.1 B
International Pkwy. to Heathrow Blvd. 0.19 30.1 B 10.5 F 40.5 B 34.1 B 29.4 B 40.7 A 22.4 C 25.9 C 36.8 A 26.5 C
Heathrow Blvd. to Markham Woods Rd. 0.66 30.9 B 26.5 C 28.5 B 21.3 D 28.8 F 28.1 B 24.0 C 22.0 C 34.0 B 29.7 B 24.7 C 25.3 C 25.1 C 22.1 C 26.8 C 28.9 B 24.9 C 25.9 C 20.8 D 24.7 C
Average 29.9 B 28.7 B 29.4 B 29.4 B 34.9 B 30.5 B 30.2 B 34.4 B 30.9 B 31.8 B
PM PEAK HOUR
Volusia County Line to Celery Ave. 0.56 --- --- --- --- --- --- --- --- --- --- --- --- 46.8 A 54.2 A 51.4 A 53.1 A 53.1 A 50.3 A 28.2 B
Celery Ave. to SR 46 0.80 --- --- --- --- --- --- --- --- --- --- --- --- 29.8 B 35.0 A 37.4 A 42.9 A 28.4 B 32.3 A 32.8 B 36.7 A 34.7 B 38.4 A 27.2 C 31.1 A 29.1 B 28.8 A
SR 46 to Moores Station Rd. 0.99 --- --- --- --- --- --- --- --- --- --- --- --- 50.8 A 47.4 A 43.0 A 45.8 A 47.7 A 44.1 A 48.9 A
Moores Station Rd. to Beardall Ave. 1.37 --- --- --- --- --- --- --- --- --- --- --- --- 52.8 A 48.6 A 43.5 A 48.1 A 48.4 A 46.4 A 50.4 A
Beardall Ave. to Red Cleveland Blvd.** 1.27 --- --- --- --- --- --- --- --- --- --- --- --- 51.3 A 46.2 A 42.7 A 46.5 A 46.0 A 44.1 A 47.7 A
Red Cleveland Blvd. to Sanford Ave.* 1.44 --- --- --- --- --- --- --- --- --- --- --- --- 47.0 A 50.1 A 46.6 A 47.2 A 40.6 A 42.3 A 39.8 A 44.6 A 45.0 A 46.6 A 39.3 A 43.2 A 42.6 A 47.0 A
Sanford Ave. to CR 427 0.05 26.4 C 22.4 C 31.9 B 3.3 F 6.2 F 5.3 F 6.0 F 4.1 F 5.2 F 6.8 F
CR 427 to SR 417 NB Ramps 0.21 16.1 E 20.4 D 28.0 C 22.9 C 24.2 C 28.0 C 22.5 C
SR 417 NB Ramp to SR 417 SB Ramps 0.09 41.3 A 32.4 B 20.5 D 31.9 B 24.9 C 23.5 C 22.5 C 33.7 B 30.0 B 27.0 C
SR 417 SB Ramps to US 17-92 1.08 26.6 C 29.8 B 29.1 B 22.1 C 17.9 D 34.1 B 26.6 C 22.8 C 20.2 D 30.7 B 24.2 C 23.0 C 19.2 D 27.1 C 22.8 C 33.9 B 26.4 C
US 17-92 to Live Oak Blvd. 0.24 26.7 C 27.1 C 23.0 C 27.6 C 22.2 C 27.5 C 27.0 C 16.4 E 31.4 B 26.2 C 21.2 D 23.2 C 23.2 C
Live Oak Blvd. to Hidden Lake Dr. 0.17 40.5 A 40.5 A 27.2 C 27.2 C 26.6 C 26.6 C 30.0 B 28.1 B 27.4 C 19.5 D 33.1 B 32.1 B 21.2 D 23.9 C 35.2 A 25.4 C 34.0 B 26.7 C 37.8 A 27.6 C
Hidden Lake Dr. to Art/College Ln. 0.33 28.3 B 30.4 B 31.4 B 25.9 C 33.6 B 29.6 B 32.9 B 25.5 C 34.0 B 29.6 B
Art/College Ln. to Sir Lawrence Dr. 0.77 39.3 A 35.1 A 39.4 A 36.0 A 38.3 A 35.9 A 40.7 A 34.6 B 41.3 A 38.5 A 34.6 B 32.9 B 39.0 A 36.9 A 37.1 A 32.5 B 37.4 A 36.3 A 44.3 A 38.4 A
Sir Lawrence Dr. to RR Tracks 0.57
RR Tracks to Country Club Rd. 0.06 23.3 C 23.3 C 23.7 C 23.7 C 19.5 D 19.5 D 16.6 E 16.6 E 17.7 D 17.7 D 17.5 D 17.5 D 20.8 D 20.8 D 22.6 C 22.6 C 13.2 E 13.2 E 16.6 E 16.6 E
County Club Rd. to 4th St./Lake Mary Elem. Sch. 0.13 35.4 A 41.5 A 36.4 A 38.0 A 36.7 A 26.7 C 37.9 A 34.3 B 31.3 B 36.0 A
4th St./Lake Mary Elem. Sch. to Longwood Lake Mary Rd. 0.57 41.3 A 40.1 A 43.9 A 43.5 A 31.5 B 32.3 B 34.0 B 34.7 B 38.3 A 38.0 A 33.3 B 31.9 B 32.6 B 33.4 B 28.5 B 29.4 B 28.2 B 28.7 B 24.5 C 26.0 C
Longwood Lake Mary Rd. to Forest Blvd. 0.53 44.3 A 44.0 A 36.0 A 39.0 A 41.7 A 37.9 A 38.6 A 41.0 A 37.2 A 37.7 A
Forest Blvd. to Rinehart Rd. 0.31 11.7 F 22.2 C 14.7 E 25.7 C 26.8 C 32.0 B 13.0 E 22.7 C 18.5 D 28.6 B 17.6 D 26.8 C 16.2 E 25.8 C 14.5 E 24.8 C 19.6 D 28.2 B 29.0 B 34.1 B
Rinehart Rd. to Sun Dr. 0.31 15.5 E 13.9 E 38.3 A 29.2 B 34.1 B 25.1 C 33.1 B 39.2 A 18.8 D 28.2 B
Sun Dr. to Lake Mary Center 0.16 30.2 B 29.8 B 9.1 F 9.1 F 9.0 F 9.3 F 8.6 F 38.4 A 10.7 F 20.4 D
Lake Mary Center to Lake Emma Rd. 0.17 19.5 D 18.7 D 24.2 C 18.3 D 18.0 D 18.6 D 20.5 D 17.8 D 21.9 D 18.9 D 8.0 F 12.8 F 9.1 F 14.0 E 5.1 F 14.7 E 5.3 F 10.3 F 10.3 F 18.5 D
Lake Emma Rd. to I-4 EB Ramps 0.21 17.6 D 17.6 D 29.2 B 29.2 B 43.8 A 43.8 A 40.9 A 40.9 A 39.7 A 39.7 A 39.4 A 39.4 A 41.2 A 41.2 A 42.6 A 42.6 A 38.8 A 38.8 A 44.0 A 44.0 A
I-4 EB Ramps to I-4 WB Ramps 0.27 42.7 A 36.9 A 22.1 C 17.3 D 20.2 D 21.3 D 18.1 D 44.6 A 41.1 A 35.5 A
I-4 WB Ramps to International Pkwy. 0.16 5.5 F 6.6 F 27.9 C 31.6 B 32.7 B 20.0 D 7.1 F 19.2 D 10.2 F 11.9 F
International Pkwy. to Heathrow Blvd. 0.19 28.0 C 25.2 C 42.2 A 42.2 A 39.8 A 38.0 A 24.3 C 30.8 B 24.3 C 22.8 C
Heathrow Blvd. to Markham Woods Rd. 0.66 38.9 A 22.4 C 24.1 C 19.6 D 35.6 A 31.3 B 32.8 B 28.3 B 36.3 A 31.1 B 28.1 B 26.2 C 29.1 B 18.9 D 26.8 C 28.2 B 25.1 C 22.6 C 35.4 A 26.5 C
Average 25.6 C 25.8 C 28.1 B 30.5 B 33.7 B 28.9 B 29.7 B 30.4 B 27.5 C 31.9 B
Note : * Till Year 2007, the segment was used to be Ohio Ave. to Sanford Ave
Note : * *Till Year 2007, the segment was used to be Sanford Airport to Ohio Ave.
Year 2005 Year 2006 Year 2007 Year 2008
Year 2014 Seminole County Travel Time & Delay StudyLake Mary Boulevard/SR 415 (Part A & B) - Westbound Direction Historical Summary
Average Speed Average Speed Average Speed Average Speed Average Speed Average Speed Average Speed Average Speed Average SpeedAverage Speed Average Speed Average Speed Average Speed Average Speed Average Speed Average Speed
Segments (mile) (mph) LOS (mph) LOS (mph) LOS (mph) LOS (mph) LOS (mph) LOS (mph) LOS (mph) LOS (mph) LOS (mph) LOS (mph) LOS (mph) LOS (mph) LOS (mph) LOS (mph) LOS (mph) LOS (mph) LOS (mph) LOS (mph) LOS (mph) LOS
AM PEAK HOUR
McCulloch Rd. to School Entrances 1.18 ---- ---- ---- ---- ---- ---- ---- ---- ---- ---- ---- ---- 34.8 A 33.1 A 32.3 A 32.2 A 32.4 A 32.7 A 33.5 A
School Entrances to Old Lockwood Rd. 0.69 ---- ---- ---- ---- ---- ---- ---- ---- ---- ---- ---- ---- 31.5 A 33.5 A 33.0 A 33.1 A 34.5 A 33.0 A 32.7 A 32.4 A 32.7 A 32.5 A 31.9 A 32.4 A 33.3 A 33.5 A
Old Lockwood Rd. to Riviera Blvd. 0.58 ---- ---- ---- ---- ---- ---- ---- ---- ---- ---- ---- ---- 37.0 A 38.3 A 36.7 A 33.5 A 32.9 A 34.9 A 34.5 A
Riviera Blvd. to Mitchell Hammock Rd. 1.17 ---- ---- ---- ---- ---- ---- ---- ---- ---- ---- ---- ---- 36.0 A 31.1 A 31.5 A 32.0 A 30.1 A 34.8 A 29.9 B
Mitchell Hammock Rd. to CR 419 0.23 ---- ---- ---- ---- ---- ---- ---- ---- ---- ---- ---- ---- 7.6 F 25.1 B 29.4 B 32.7 A 11.3 E 26.4 B 7.9 F 23.7 C 11.0 E 25.4 B 8.4 F 25.3 B 6.2 F 21.1 C
Average 28.6 B 32.9 A 29.3 B 27.2 B 28.4 B 28.3 B 25.7 B
PM PEAK HOUR
McCulloch Rd. to School Entrances 1.18 ---- ---- ---- ---- ---- ---- ---- ---- ---- ---- ---- ---- 36.5 A 36.6 A 36.4 A 33.4 A 32.8 A 34.7 A 34.9 A
School Entrances to Old Lockwood Rd. 0.69 ---- ---- ---- ---- ---- ---- ---- ---- ---- ---- ---- ---- 36.9 A 36.7 A 37.9 A 37.1 A 37.9 A 36.9 A 35.0 A 33.8 A 33.3 A 33.0 A 35.6 A 35.0 A 35.3 A 35.0 A
Old Lockwood Rd. to Riviera Blvd. 0.58 ---- ---- ---- ---- ---- ---- ---- ---- ---- ---- ---- ---- 37.8 A 39.5 A 37.6 A 34.9 A 33.2 A 34.5 A 35.3 A
Riviera Blvd. to Mitchell Hammock Rd. 1.17 ---- ---- ---- ---- ---- ---- ---- ---- ---- ---- ---- ---- 32.8 A 24.7 B 32.6 A 31.9 A 25.7 B 26.2 B 24.5 B
Mitchell Hammock Rd. to CR 419 0.23 ---- ---- ---- ---- ---- ---- ---- ---- ---- ---- ---- ---- 10.6 E 27.3 B 22.0 C 27.3 B 7.4 F 23.3 C 11.6 E 26.9 B 11.0 E 23.4 C 9.7 F 23.1 C 9.4 F 22.2 C
Average 31.1 A 31.3 A 28.5 B 29.9 B 27.3 B 27.7 B 27.0 B
Roadway Distance
Segments (mile) (mph) LOS (mph) LOS (mph) LOS (mph) LOS (mph) LOS (mph) LOS (mph) LOS (mph) LOS (mph) LOS (mph) LOS (mph) LOS (mph) LOS (mph) LOS (mph) LOS (mph) LOS (mph) LOS (mph) LOS (mph) LOS (mph) LOS (mph) LOS
AM PEAK HOUR
CR 419 to Mitchell Hammock Rd. 0.22 ---- ---- ---- ---- ---- ---- ---- ---- ---- ---- ---- ---- 17.4 D 11.5 E 17.9 D 19.7 C 15.0 D 14.1 D 15.8 D
Mitchell Hammock Rd. to Riviera Blvd. 1.21 ---- ---- ---- ---- ---- ---- ---- ---- ---- ---- ---- ---- 37.2 A 39.3 A 34.3 A 30.8 A 32.5 A 34.7 A 34.5 A
Riviera Blvd. to Old Lockwood Rd. 0.57 ---- ---- ---- ---- ---- ---- ---- ---- ---- ---- ---- ---- 37.8 A 33.2 A 39.0 A 30.1 A 37.6 A 31.4 A 33.9 A 29.6 B 33.2 A 28.6 B 36.0 A 29.8 B 35.3 A 30.4 A
Old Lockwood Rd. to School Entrances 0.54 ---- ---- ---- ---- ---- ---- ---- ---- ---- ---- ---- ---- 34.7 A 32.2 A 27.2 B 29.5 B 32.1 A 31.9 A 29.5 B
School Entrances to McCulloch Rd. 1.32 ---- ---- ---- ---- ---- ---- ---- ---- ---- ---- ---- ---- 23.7 C 26.1 B 27.6 B 29.0 B 26.9 B 27.0 B 25.5 B 26.7 B 26.4 B 28.0 B 22.1 C 24.5 B 27.1 B 27.8 B
Average 29.4 B 29.5 B 29.0 B 28.1 B 28.3 B 27.0 B 29.1 B
PM PEAK HOUR
CR 419 to Mitchell Hammock Rd. 0.22 ---- ---- ---- ---- ---- ---- ---- ---- ---- ---- ---- ---- 16.3 D 8.6 F 11.6 E 8.2 F 9.3 F 6.9 F 6.9 F
Mitchell Hammock Rd. to Riviera Blvd. 1.21 ---- ---- ---- ---- ---- ---- ---- ---- ---- ---- ---- ---- 36.6 A 39.4 A 37.4 A 34.2 A 33.5 A 35.0 A 35.2 A
Riviera Blvd. to Old Lockwood Rd. 0.57 ---- ---- ---- ---- ---- ---- ---- ---- ---- ---- ---- ---- 37.3 A 32.3 A 39.9 A 27.2 B 38.5 A 29.3 B 33.9 A 24.7 B 33.2 A 25.5 B 35.6 A 23.6 C 35.3 A 23.5 C
Old Lockwood Rd. to School Entrances 0.54 ---- ---- ---- ---- ---- ---- ---- ---- ---- ---- ---- ---- 36.9 A 37.5 A 38.4 A 33.0 A 31.9 A 35.3 A 35.0 A
School Entrances to McCulloch Rd. 1.32 ---- ---- ---- ---- ---- ---- ---- ---- ---- ---- ---- ---- 29.0 B 30.9 A 31.8 A 33.5 A 23.2 C 26.7 B 17.4 D 20.5 C 20.3 C 23.0 C 32.2 A 33.2 A 24.8 B 27.3 B
Average 31.6 A 30.1 A 28.0 B 22.5 C 24.2 B 27.4 B 25.2 B
Year 2013
Rdwy Segment Rdwy Section
Average Speed Average Speed
Year 2013
Rdwy Segment Rdwy Section
Average Speed Average Speed
TABLE C19.1aYear 2014 Seminole County Travel Time & Delay Study
Lockwood Boulevard - Northbound Direction Historical Summary
TABLE C19.1b
Year 2014Year 2005 Year 2006 Year 2007 Year 2008 Year 2009 Year 2010 Year 2011
Average Speed Average Speed Average Speed Average Speed Average SpeedAverage Speed Average Speed Average Speed Average Speed Average Speed Average Speed
Year 2012
Rdwy Segment Rdwy Section
Average Speed Average Speed
Year 2012
Rdwy Segment Rdwy Section
Average Speed Average Speed
Rdwy Section
Year 2014
Year 2014 Seminole County Travel Time & Delay StudyLockwood Boulevard - Southbound Direction Historical Summary
Segments (mile) (mph) LOS (mph) LOS (mph) LOS (mph) LOS (mph) LOS (mph) LOS (mph) LOS (mph) LOS (mph) LOS (mph) LOS (mph) LOS (mph) LOS (mph) LOS (mph) LOS (mph) LOS (mph) LOS (mph) LOS (mph) LOS (mph) LOS (mph) LOS
AM PEAK HOUR
Orange County Line to Oranole Rd. 0.24 - - - - - - - - - - - - 28.8 B 29.4 B 26.3 C 29.4 B
Oranole Rd. to Spring Lake Rd. 0.24 23.9 C 29.3 B 20.8 D 22.7 C 25.2 C 30.0 B 20.6 D 25.3 C 28.8 B 25.7 C
Spring Lake Rd. to Ballard St. 0.40 39.6 A 34.1 B 32.5 B 29.3 B 29.2 B 35.3 A 32.4 B 33.3 B 30.4 B 27.6 C
Ballard St. to Highland Dr. 0.22 43.7 A 39.6 A 40.6 A 40.6 A 34.9 B 39.4 A 33.8 B 37.7 A 35.7 A 34.7 B
Highland Dr. to Orienta Dr. 0.32 35.6 A 33.8 B 33.0 B 27.5 C 29.4 B 38.8 A 30.5 B 33.7 B 33.1 B 37.6 A
Orienta Dr. to SR 436 0.16 12.4 F 28.8 B 13.8 E 28.9 B 5.9 F 20.8 D 7.8 F 22.1 C 21.1 D 28.0 C 9.6 F 27.4 C 8.3 F 23.0 C 9.1 F 25.3 C 5.4 F 20.8 D 10.2 F 25.3 C
Average 28.8 B 28.9 B 20.8 D 22.1 C 28.0 C 27.4 C 23.0 C 25.3 C 20.8 D 25.3 C
PM PEAK HOUR
Orange County Line to Oranole Rd. 0.24 - - - - - - - - - - - - 25.0 C 35.7 A 27.3 C 25.9 C
Oranole Rd. to Spring Lake Rd. 0.24 24.0 C 32.0 B 28.8 B 26.8 C 22.7 C 26.3 C 27.2 C 30.6 B 28.2 B 26.2 C
Spring Lake Rd. to Ballard St. 0.40 32.7 B 29.7 B 32.5 B 33.8 B 26.3 C 36.4 A 28.2 B 32.9 B 30.8 B 34.3 B
Ballard St. to Highland Dr. 0.22 38.5 A 36.0 A 40.6 A 39.4 A 34.4 B 39.4 A 34.7 B 36.7 A 31.4 B 36.7 A
Highland Dr. to Orienta Ave. 0.32 28.5 B 28.5 B 30.9 B 27.5 C 25.4 C 37.4 A 32.5 B 33.1 B 28.7 B 37.6 A
Orienta Ave. to SR 436 0.16 14.1 E 26.7 C 11.0 F 25.6 C 7.1 F 22.9 C 7.1 F 22.6 C 13.8 E 23.9 C 5.7 F 22.2 C 5.4 F 20.2 D 8.7 F 26.1 C 4.6 F 19.0 D 5.3 F 21.1 D
Average 26.7 C 25.6 C 22.9 C 22.6 C 23.9 C 22.2 C 20.2 D 26.1 C 19.0 D 21.1 D
Roadway Distance
Segments (mile) (mph) LOS (mph) LOS (mph) LOS (mph) LOS (mph) LOS (mph) LOS (mph) LOS (mph) LOS (mph) LOS (mph) LOS (mph) LOS (mph) LOS (mph) LOS (mph) LOS (mph) LOS (mph) LOS (mph) LOS (mph) LOS (mph) LOS (mph) LOS
AM PEAK HOUR
SR 436 to Orienta Ave. 0.15 22.6 C 21.6 D 18.4 D 23.7 C 19.6 D 26.5 C 29.1 B 18.8 D 27.4 C 25.3 C
Orienta Ave. to Highland Dr. 0.32 34.8 B 39.8 A 32.5 B 33.0 B 37.2 A 39.6 A 36.9 A 36.9 A 39.2 A 36.9 A
Highland Dr. to Ballard St. 0.22 34.6 B 33.5 B 27.1 C 25.1 C 23.5 C 39.4 A 35.7 A 33.0 B 29.3 B 25.9 C
Ballard St. to Spring Lake Rd. 0.40 38.0 A 30.5 B 31.6 B 22.9 C 29.1 B 38.1 A 34.8 B 31.2 B 31.2 B 32.0 B
Spring Lake Rd. to Oranole Rd. 0.25 29.0 B 32.6 B 33.6 B 31.9 B 20.5 D 26.8 C 20.3 D 24.6 C 29.5 B 27.9 C 30.0 B 35.2 A 23.6 C 33.5 B 36.0 A 23.2 C
Oranole Rd. to Orange County Line 0.22 - - - - - - - - - - - - - - - - - - - - - - - - 34.1 B 32.2 B 37.5 A 31.5 B 37.5 A 33.4 B 34.1 B 29.6 B
Average 32.6 B 31.9 B 26.8 C 24.6 C 27.9 C 35.2 A 32.2 B 31.5 B 33.4 B 29.6 B
PM PEAK HOUR
SR 436 to Orienta Ave. 0.15 19.1 D 20.2 D 20.5 D 25.0 C 18.9 D 25.7 C 21.8 D 25.9 C 30.0 B 26.7 C
Orienta Ave. to Highland Dr. 0.32 39.0 A 38.4 A 32.5 B 32.5 B 36.7 A 33.0 B 36.9 A 39.2 A 40.8 A 39.2 A
Highland Dr. to Ballard St. 0.22 37.5 A 28.5 B 28.7 B 27.1 C 26.4 C 36.3 A 37.7 A 25.4 C 30.0 B 37.7 A
Ballard St. to Spring Lake Rd. 0.40 38.1 A 31.6 B 32.9 B 33.3 B 35.6 A 38.7 A 34.8 B 36.4 A 35.8 A 36.9 A
Spring Lake Rd. to Oranole Rd. 0.25 32.4 B 33.4 B 24.8 C 29.1 B 30.6 B 30.1 B 25.9 C 29.4 B 25.4 C 29.0 B 29.4 B 33.2 B 20.3 D 25.3 C 30.6 B 25.3 C
Oranole Rd. to Orange County Line 0.22 - - - - - - - - - - - - - - - - - - - - - - - - 31.9 B 30.0 B 37.5 A 31.7 B 36.6 A 34.3 B 34.9 B 33.5 B
Average 33.4 B 29.1 B 30.1 B 29.4 B 29.0 B 33.2 B 30.0 B 31.7 B 34.3 B 33.5 B
Year 2013
Rdwy Segment Rdwy Section
Average Speed Average Speed
Year 2013
Rdwy Segment Rdwy Section
Average Speed Average Speed
TABLE C20.1aYear 2014 Seminole County Travel Time & Delay Study
Maitland Avenue - Northbound Direction Historical Summary
TABLE C20.1b
Year 2014Year 2005 Year 2006 Year 2007 Year 2008 Year 2009 Year 2010 Year 2011
Average Speed Average Speed Average Speed Average Speed Average SpeedAverage Speed Average Speed Average Speed Average Speed Average Speed Average Speed
Year 2012
Rdwy Segment Rdwy Section
Average Speed Average Speed
Year 2012
Rdwy Segment Rdwy Section
Average Speed Average Speed
Rdwy Section
Year 2014
Year 2014 Seminole County Travel Time & Delay Study
Maitland Avenue - Southbound Direction Historical Summary
Segments (mile) (mph) LOS (mph) LOS (mph) LOS (mph) LOS (mph) LOS (mph) LOS (mph) LOS (mph) LOS (mph) LOS (mph) LOS (mph) LOS (mph) LOS (mph) LOS (mph) LOS (mph) LOS (mph) LOS (mph) LOS (mph) LOS (mph) LOS (mph) LOS
AM PEAK HOUR
New Signal - Douglas Ave. to SR 434** 0.15 - - - - - - - - - - - - - - - - 2.8 F 4.4 F - - - - - - - - - - - - - - - -
SR 434 to Spring Landing Blvd. 0.98 - - - - - - - - 43.8 A 43.8 A 43.0 A 43.0 A 41.7 A 14.6 E 42.4 A 18.7 D 40.3 A 40.3 A 41.7 A 41.7 A 40.6 A 40.6 A 40.3 A 40.3 A
Spring Landing Blvd. to E.E. Williamson Rd. 0.77 - - - - - - - - 33.9 B 33.9 B 37.5 A 37.5 A 31.9 B 31.9 B 35.6 A 35.6 A 32.7 B 32.7 B 27.2 C 27.2 C 30.6 B 30.6 B 21.0 D 21.0 D
E.E. Williamson Blvd. to Wingfield Dr./Glen Ethel Ln.* 0.69 42.2 A 40.7 A 37.9 A 38.8 A 38.8 A 39.2 A 39.2 A 33.7 B 33.7 B 39.1 A 38.0 A 33.4 B 36.6 A
Wingfield Dr./Glen Ethel Ln. to Wingfield Dr./Spanish Oaks Tr. 0.62 46.4 A 46.8 A 43.0 A - - - - - - - - - - - - 41.5 A 41.5 A 42.0 A 42.0 A
Wingfield Dr./Spanish Oak Tr. to Vista Oak Dr. 0.67 45.9 A 45.1 A 41.1 A - - - - - - - - - - - - 40.0 A 39.6 A 43.6 A 41.9 A
Vista Oak Dr. to Alaqua Dr. 0.27 45.4 A 45.4 A 36.4 A - - - - - - - - - - - - 41.0 A 43.1 A 42.0 A 42.0 A
Alaqua Dr. to Lake Mary Blvd. 0.88 24.2 C 36.3 A 27.7 C 37.9 A 26.6 C 34.8 B - - - - - - - - - - - - 27.9 C 35.8 A 26.0 C 34.7 B 24.4 C 33.6 B 28.5 B 36.1 A
Lake Mary Blvd. to Bridgewater Dr. 0.43 38.2 A 30.7 B 35.3 A - - - - - - - - - - - - 38.8 A 38.3 A 40.0 A 36.2 A
Bridgewater Dr. to Greentree Ln. 0.42 45.6 A 45.1 A 40.1 A - - - - - - - - - - - - 41.3 A 42.0 A 44.2 A 39.4 A
Greentree Ln. to Carter Rd. 0.78 43.4 A 40.5 A 40.4 A - - - - - - - - - - - - 40.0 A 39.3 A 43.6 A 38.7 A
Carter Rd. to Markham Rd. 0.90 22.8 C 32.7 B 39.8 A 38.7 A 24.2 C 32.2 B - - - - - - - - - - - - 37.1 A 38.9 A 31.6 B 36.4 A 33.8 B 39.1 A 31.2 B 35.4 A
Average 34.6 B 38.2 A 34.8 B 40.0 A 20.9 D 24.7 C 37.0 A 35.0 A 35.8 A 33.8 B
PM PEAK HOUR
New Signal - Douglas Ave to SR 434** 0.15 - - - - - - - - - - - - - - - - 2.1 F 3.4 F - - - - - - - - - - - - - - - -
SR 434 to Spring Landing Blvd. 0.98 - - - - - - - - 41.6 A 41.6 A 44.3 A 44.3 A 38.5 A 11.6 F 40.1 A 15.6 E 39.7 A 39.7 A 40.8 A 40.8 A 42.3 A 42.3 A 40.0 A 40.0 A
Spring Landing Blvd. to E.E. Williamson Rd. 0.77 - - - - - - - - 36.5 A 36.5 A 32.2 B 32.2 B 27.1 C 27.1 C 30.0 B 30.0 B 28.0 B 28.0 B 37.4 A 37.4 A 27.9 C 27.9 C 29.1 B 29.1 B
E.E. Williamson Blvd. to Wingfield Dr./Glen Ethel Ln.* 0.69 44.2 A 39.6 A 39.1 A 41.1 A 41.1 A 33.9 B 33.9 B 34.9 B 34.9 B 37.3 A 40.6 A 40.2 A 38.3 A
Wingfield Dr./Glen Ethel Ln. to Wingfield Dr./Spanish Oaks Tr. 0.62 48.7 A 45.6 A 47.1 A - - - - - - - - - - - - 41.0 A 42.5 A 44.2 A 42.0 A
Wingfield Dr./Spanish Oak Tr. to Vista Oak Dr. 0.67 46.3 A 45.9 A 46.2 A - - - - - - - - - - - - 40.0 A 42.4 A 43.6 A 42.8 A
Vista Oak Dr. to Alaqua Dr. 0.27 46.8 A 45.8 A 45.3 A - - - - - - - - - - - - 41.0 A 43.1 A 44.2 A 42.0 A
Alaqua Dr. to Lake Mary Blvd. 0.88 36.6 A 43.2 A 32.7 B 40.0 A 30.6 B 38.6 A - - - - - - - - - - - - 25.2 C 34.1 B 24.6 C 35.1 A 31.1 B 38.7 A 26.8 C 35.7 A
Lake Mary Blvd. to Bridgewater Dr. 0.43 40.3 A 40.5 A 29.2 B - - - - - - - - - - - - 38.8 A 39.4 A 38.8 A 37.7 A
Bridgewater Dr. to Greentree Ln. 0.42 45.8 A 44.5 A 44.0 A - - - - - - - - - - - - 45.0 A 42.0 A 42.7 A 40.6 A
Greentree Ln. to Carter Rd. 0.78 45.3 A 43.8 A 43.6 A - - - - - - - - - - - - 42.9 A 40.0 A 42.5 A 39.3 A
Carter Rd. to Markham Rd. 0.90 38.6 A 41.9 A 38.9 A 41.5 A 40.9 A 39.3 A - - - - - - - - - - - - 35.1 A 39.4 A 36.8 A 39.0 A 37.3 A 39.9 A 36.8 A 38.3 A
Average 42.6 A 40.7 A 39.3 A 38.6 A 17.0 D 21.2 D 35.6 A 37.3 A 38.0 A 36.2 A
Note: * From the Year 2008 the segment limits will be E.E.Williamson Blvd to Dixon Rd. and the segment length will be 0.48 Mile
Note: ** From the Year 2009 additional control point has been considered as a "New Signal - Douglas Ave" approximately 0.15 Mile south of SR 434
Roadway Distance
Segments (mile) (mph) LOS (mph) LOS (mph) LOS (mph) LOS (mph) LOS (mph) LOS (mph) LOS (mph) LOS (mph) LOS (mph) LOS (mph) LOS (mph) LOS (mph) LOS (mph) LOS (mph) LOS (mph) LOS (mph) LOS (mph) LOS (mph) LOS (mph) LOS
AM PEAK HOUR
Markham Rd. to Carter Rd. 0.89 36.6 A 38.9 A 36.7 A - - - - - - - - - - - - 30.7 B 32.8 B 36.1 A 34.2 B
Carter Rd. to Greentree Ln. 0.79 43.7 A 42.9 A 41.7 A - - - - - - - - - - - - 39.3 A 39.7 A 37.8 A 38.1 A
Greentree Ln. to Bridgewater Dr. 0.42 46.4 A 44.0 A 42.8 A - - - - - - - - - - - - 41.3 A 42.7 A 44.2 A 40.0 A
Bridgewater Dr. to Lake Mary Blvd. 0.45 27.5 C 37.7 A 26.1 C 37.6 A 26.2 C 36.5 A - - - - - - - - - - - - 24.9 C 33.0 B 27.2 C 34.8 B 27.2 C 35.7 A 24.0 C 33.6 B
Lake Mary Blvd. to Alaqua Dr. 0.86 45.3 A 32.4 B 44.4 A - - - - - - - - - - - - 38.1 A 40.5 A 42.4 A 39.8 A
Alaqua Dr. to Vista Oak Dr. 0.28 45.7 A 45.5 A 44.1 A - - - - - - - - - - - - 41.0 A 41.0 A 43.1 A 42.0 A
Vista Oak Dr. to Wingfield Dr./Spanish Oaks Tr. 0.72 47.3 A 46.4 A 45.1 A - - - - - - - - - - - - 41.1 A 41.9 A 43.6 A 41.9 A
Wingfield Dr./Spanish Oaks Tr. to Wingfield Dr./Glen Ethel Ln. 0.63 42.4 A 44.0 A 37.8 A - - - - - - - - - - - - 40.0 A 41.0 A 42.5 A 41.0 A
Wingfield Dr./Glen Ethel Ln. to E.E. Williamson Rd.* 0.62 30.1 B 40.8 A 23.6 C 34.6 B 14.9 E 30.4 B 22.3 C 22.3 C 25.9 C 25.9 C 24.6 C 24.6 C 27.6 C 36.2 A 23.7 C 35.3 A 22.3 C 35.6 A 19.9 D 33.2 B
E.E. Williamson Rd. to Spring Landing Blvd. 0.78 - - - - - - - - 32.9 B 32.9 B 28.2 B 28.2 B 40.8 A 40.8 A 32.3 B 32.3 B 33.9 B 33.9 B 40.3 A 40.3 A 31.8 B 31.8 B 25.2 C 25.2 C
Spring Landing Blvd. to SR 434 0.98 - - - - - - - - 12.1 F 12.1 F 18.0 D 18.0 D 13.8 E 14.5 E 19.0 D 19.0 D 20.6 D 20.6 D 15.2 E 15.2 E 17.1 D 17.1 D
SR 434 to New Signal - Douglas Ave. 0.14 - - - - - - - - - - - - - - - - 28.0 C 14.8 E 21.7 D 15.3 E - - - - - - - - - - - - - - - -
Average 39.4 A 35.9 A 26.9 C 21.7 D 21.1 D 20.2 D 31.2 B 32.5 B 30.0 B 28.8 B
PM PEAK HOUR
Markham Rd. to Carter Rd. 0.89 37.1 A 41.6 A 40.0 A - - - - - - - - - - - - 35.8 A 37.6 A 38.7 A 37.9 A
Carter Rd. to Greentree Ln. 0.79 41.4 A 45.7 A 42.4 A - - - - - - - - - - - - 42.1 A 40.3 A 42.9 A 38.7 A
Greentree Ln. to Bridgewater Dr. 0.42 44.0 A 46.3 A 43.9 A - - - - - - - - - - - - 44.2 A 41.3 A 44.2 A 40.6 A
Bridgewater Dr. to Lake Mary Blvd. 0.45 23.7 C 35.8 A 27.5 C 39.9 A 27.4 C 38.2 A - - - - - - - - - - - - 20.2 D 33.9 B 25.4 C 35.9 A 28.4 B 38.2 A 29.0 B 36.6 A
Lake Mary Blvd. to Alaqua Dr. 0.86 42.1 A 38.0 A 42.6 A - - - - - - - - - - - - 39.0 A 40.5 A 40.5 A 41.4 A
Alaqua Dr. to Vista Oak Dr. 0.28 44.4 A 44.9 A 43.1 A - - - - - - - - - - - - 40.0 A 44.2 A 43.1 A 44.2 A
Vista Oak Dr. to Wingfield Dr./Spanish Oaks Tr. 0.72 40.8 A 45.8 A 44.9 A - - - - - - - - - - - - 40.0 A 43.2 A 43.6 A 41.9 A
Wingfield Dr./Spanish Oaks Tr. to Wingfield Dr./Glen Ethel Ln. 0.63 42.3 A 42.4 A 44.7 A - - - - - - - - - - - - 39.1 A 42.0 A 42.5 A 38.6 A
Wingfield Dr./Glen Ethel Ln. to E.E. Williamson Rd.* 0.62 41.5 A 41.9 A 37.9 A 41.0 A 34.3 B 41.3 A 39.5 A 39.5 A 21.8 D 21.8 D 35.3 A 35.3 A 32.6 B 37.7 A 32.9 B 39.6 A 39.4 A 41.5 A 27.1 C 36.9 A
E.E. Williamson Rd. to Spring Landing Blvd. 0.78 - - - - - - - - 41.4 A 41.4 A 44.0 A 44.0 A 37.7 A 37.7 A 43.8 A 43.8 A 39.3 A 39.3 A 41.4 A 41.4 A 43.7 A 43.7 A 40.7 A 40.7 A
Spring Landing Blvd. to SR 434 0.98 - - - - - - - - 16.4 E 16.4 E 26.4 C 26.4 C 12.9 F 12.4 F 21.5 D 21.5 D 21.3 D 21.3 D 27.5 C 27.5 C 23.4 C 23.4 C
SR 434 to New Signal - Douglas Ave. 0.14 - - - - - - - - - - - - - - - - 25.7 C 13.7 E 36.4 A 13.7 E - - - - - - - - - - - - - - - -
Average 38.9 A 40.5 A 33.7 B 33.6 B 19.2 D 20.8 D 33.2 B 34.6 B 38.0 A 34.5 B
Note: * From the Year 2008 the segment limits will be Dixon Rd.to E.E.Williamson Blvd and the segment length will be 0.48 Mile
Note: ** From the Year 2009 additional control point has been considered as a "New Signal - Douglas Ave" approximately 0.15 Mile south of SR 434
Year 2013
Rdwy Segment Rdwy Section
Average Speed Average Speed
Year 2013
Rdwy Segment Rdwy Section
Average Speed Average Speed
TABLE C21.1aYear 2014 Seminole County Travel Time & Delay Study
Markham Woods Road - Northound Direction Historical Summary
TABLE C21.1b
Year 2014Year 2005 Year 2006 Year 2007 Year 2008 Year 2009 Year 2010 Year 2011
Average Speed Average Speed Average Speed Average Speed Average SpeedAverage Speed Average Speed Average Speed Average Speed Average Speed Average Speed
Year 2012
Rdwy Segment Rdwy Section
Average Speed Average Speed
Year 2012
Rdwy Segment Rdwy Section
Average Speed Average Speed
Rdwy Section
Year 2014
Year 2014 Seminole County Travel Time & Delay StudyMarkham Woods Road - Southound Direction Historical Summary
Segments (mile) (mph) LOS (mph) LOS (mph) LOS (mph) LOS (mph) LOS (mph) LOS (mph) LOS (mph) LOS (mph) LOS (mph) LOS (mph) LOS (mph) LOS (mph) LOS (mph) LOS (mph) LOS (mph) LOS (mph) LOS (mph) LOS (mph) LOS (mph) LOS
AM PEAK HOUR
Rouse Rd. to SR 434 * 1.00 ---- ---- ---- ---- ---- ---- ---- ---- ---- ---- ---- ---- ---- ---- ---- ---- ---- ---- ---- ---- ---- ---- ---- ---- 16.9 C 16.9 C 19.2 B 19.2 B 24.3 B 24.3 B 19.5 B 19.5 B
SR 434 to Lockwood Blvd. 0.93 ---- ---- ---- ---- ---- ---- ---- ---- ---- ---- ---- ---- 30.8 B 30.8 B 29.9 B 29.9 B 33.3 B 33.3 B 28.6 B 28.6 B 29.1 B 29.1 B 23.8 C 23.8 C 27.3 C 27.3 C
Lockwood Blvd. to Old Lockwood Rd. 1.06 ---- ---- ---- ---- ---- ---- ---- ---- ---- ---- ---- ---- 38.8 A 38.8 A 39.1 A 39.1 A 36.8 A 36.8 A 27.7 C 27.7 C 29.7 B 29.7 B 29.7 B 29.7 B 26.5 C 26.5 C
Average 34.6 B 34.1 B 35.1 A 23.0 C 25.0 C 25.8 C 23.9 C
PM PEAK HOUR
Rouse Rd. to SR 434 * 1.00 ---- ---- ---- ---- ---- ---- ---- ---- ---- ---- ---- ---- ---- ---- ---- ---- ---- ---- ---- ---- ---- ---- ---- ---- 15.0 C 15.0 C 13.5 C 13.5 C 13.9 C 13.9 C 11.9 D 11.9 D
SR 434 to Lockwood Blvd. 0.93 ---- ---- ---- ---- ---- ---- ---- ---- ---- ---- ---- ---- 22.4 C 22.4 C 25.6 C 25.6 C 23.1 C 23.1 C 30.6 B 30.6 B 23.0 C 23.0 C 20.8 D 20.8 D 28.1 B 28.1 B
Lockwood Blvd. to Old Lockwood Rd. 1.06 ---- ---- ---- ---- ---- ---- ---- ---- ---- ---- ---- ---- 13.3 E 13.3 E 17.7 D 17.7 D 27.8 C 27.8 C 27.3 C 27.3 C 25.4 C 25.4 C 28.1 B 28.1 B 24.6 C 24.6 C
Average 16.4 E 20.7 D 25.3 C 22.1 C 19.2 D 19.4 D 18.7 D
Roadway Distance
Segments (mile) (mph) LOS (mph) LOS (mph) LOS (mph) LOS (mph) LOS (mph) LOS (mph) LOS (mph) LOS (mph) LOS (mph) LOS (mph) LOS (mph) LOS (mph) LOS (mph) LOS (mph) LOS (mph) LOS (mph) LOS (mph) LOS (mph) LOS (mph) LOS
AM PEAK HOUR
Old Lockwood Rd. to Lockwood Blvd. 1.04 ---- ---- ---- ---- ---- ---- ---- ---- ---- ---- ---- ---- 32.3 B 32.3 B 24.3 C 24.3 C 33.5 B 33.5 B 27.2 C 27.2 C 29.9 B 29.9 B 25.6 C 25.6 C 28.8 B 28.8 B
Lockwood Blvd. to SR 434 0.94 ---- ---- ---- ---- ---- ---- ---- ---- ---- ---- ---- ---- 20.5 D 20.5 D 28.3 B 28.3 B 27.3 C 27.3 C 21.8 D 21.8 D 26.1 C 26.1 C 23.8 C 23.8 C 23.1 C 23.1 C
SR 434 to Rouse Rd. * 1.00 ---- ---- ---- ---- ---- ---- ---- ---- ---- ---- ---- ---- ---- ---- ---- ---- ---- ---- ---- ---- ---- ---- ---- ---- 26.0 A 26.0 A 28.0 A 28.0 A 30.9 A 30.9 A 28.8 A 28.8 A
Average 25.4 C 26.1 C 30.2 B 24.9 C 28.0 C 26.5 C 26.7 C
PM PEAK HOUR
Old Lockwood Rd. to Lockwood Blvd. 1.04 ---- ---- ---- ---- ---- ---- ---- ---- ---- ---- ---- ---- 29.4 B 29.4 B 23.8 C 23.8 C 29.6 B 29.6 B 29.7 B 29.7 B 26.1 C 26.1 C 26.5 C 26.5 C 35.1 A 35.1 A
Lockwood Blvd. to SR 434 0.94 ---- ---- ---- ---- ---- ---- ---- ---- ---- ---- ---- ---- 20.7 D 20.7 D 32.4 B 32.4 B 23.8 C 23.8 C 27.1 C 27.1 C 23.8 C 23.8 C 19.5 D 19.5 D 22.0 C 22.0 C
SR 434 to Rouse Rd. * 1.00 ---- ---- ---- ---- ---- ---- ---- ---- ---- ---- ---- ---- ---- ---- ---- ---- ---- ---- ---- ---- ---- ---- ---- ---- 27.5 A 27.5 A 32.8 A 32.8 A 31.6 A 31.6 A 31.9 A 31.9 A
Average 24.5 C 27.2 C 26.5 C 28.1 B 27.1 C 25.0 C 28.8 B
Note: *Additional control point added at Rouse Rd.
Year 2013
Rdwy Segment Rdwy Section
Average Speed Average Speed
Year 2013
Rdwy Segment Rdwy Section
Average Speed Average Speed
TABLE C22.1aYear 2014 Seminole County Travel Time & Delay Study
McCulloch Road - Eastbound Direction Historical Summary
TABLE C22.1b
Year 2014Year 2005 Year 2006 Year 2007 Year 2008 Year 2009 Year 2010 Year 2011
Average Speed Average Speed Average Speed Average Speed Average SpeedAverage Speed Average Speed Average Speed Average Speed Average Speed Average Speed
Year 2012
Rdwy Segment Rdwy Section
Average Speed Average Speed
Year 2012
Rdwy Segment Rdwy Section
Average Speed Average Speed
Rdwy Section
Year 2014
Year 2014 Seminole County Travel Time & Delay Study
McCulloch Road - Westbound Direction Historical Summary
Segments (mile) (mph) LOS (mph) LOS (mph) LOS (mph) LOS (mph) LOS (mph) LOS (mph) LOS (mph) LOS (mph) LOS (mph) LOS (mph) LOS (mph) LOS (mph) LOS (mph) LOS (mph) LOS (mph) LOS (mph) LOS (mph) LOS (mph) LOS (mph) LOS
AM PEAK HOUR
SR 426 to SR 434 1.08 ---- ---- ---- ---- ---- ---- ---- ---- ---- ---- ---- ---- 34.2 B 29.2 B 22.8 C 28.1 B 23.5 C 21.5 D 22.7 C
SR 434 to Oviedo Blvd. /Division St. 0.47 ---- ---- ---- ---- ---- ---- ---- ---- ---- ---- ---- ---- 42.7 A 36.4 A 40.4 A 31.9 B 43.1 A 26.5 C 31.7 B 29.1 B 42.7 A 27.2 C 36.2 A 24.5 C 37.6 A 25.8 C
Oviedo Blvd./Division St. to Alafaya Woods Blvd. 0.72 ---- ---- ---- ---- ---- ---- ---- ---- ---- ---- ---- ---- 34.8 B 31.0 B 39.8 A 41.9 A 47.0 A 42.8 A 43.6 A
Alafaya Woods Blvd. to Lockwood Blvd. 0.57 ---- ---- ---- ---- ---- ---- ---- ---- ---- ---- ---- ---- 24.6 C 29.5 B 38.2 A 33.8 B 19.4 D 27.1 C 13.5 E 21.6 D 14.1 E 23.1 C 13.5 E 21.8 D 13.6 E 22.0 C
Average 32.9 B 32.7 B 26.8 C 25.1 C 25.1 C 23.2 C 23.9 C
PM PEAK HOUR
SR 426 to SR 434 1.08 ---- ---- ---- ---- ---- ---- ---- ---- ---- ---- ---- ---- 17.9 D 18.9 D 16.0 E 20.9 D 18.2 D 23.7 C 19.4 D
SR 434 to Oviedo Blvd. /Division St. 0.47 ---- ---- ---- ---- ---- ---- ---- ---- ---- ---- ---- ---- 27.4 C 20.0 D 32.4 B 21.6 D 36.3 A 19.3 D 41.5 A 24.6 C 36.6 A 21.4 D 40.9 A 27.2 C 32.0 B 22.0 C
Oviedo Blvd./Division St. to Alafaya Woods Blvd. 0.72 ---- ---- ---- ---- ---- ---- ---- ---- ---- ---- ---- ---- 37.2 A 35.2 A 30.9 B 43.6 A 41.1 A 44.5 A 32.5 B
Alafaya Woods Blvd. to Lockwood Blvd. 0.57 ---- ---- ---- ---- ---- ---- ---- ---- ---- ---- ---- ---- 38.3 A 37.7 A 29.8 B 32.6 B 21.4 D 25.8 C 39.5 A 41.7 A 37.4 A 39.4 A 33.1 B 38.6 A 19.2 D 24.8 C
Average 25.3 C 25.4 C 21.8 D 30.3 B 27.1 C 31.4 B 23.2 C
Roadway Distance
Segments (mile) (mph) LOS (mph) LOS (mph) LOS (mph) LOS (mph) LOS (mph) LOS (mph) LOS (mph) LOS (mph) LOS (mph) LOS (mph) LOS (mph) LOS (mph) LOS (mph) LOS (mph) LOS (mph) LOS (mph) LOS (mph) LOS (mph) LOS (mph) LOS
AM PEAK HOUR
Lockwood Blvd. to Alafaya Woods Blvd. 0.56 ---- ---- ---- ---- ---- ---- ---- ---- ---- ---- ---- ---- 26.6 C 29.6 B 26.9 C 25.0 C 25.2 C 22.5 C 32.5 B
Alafaya Woods Blvd. to Oviedo Blvd./Division St. 0.71 ---- ---- ---- ---- ---- ---- ---- ---- ---- ---- ---- ---- 37.2 A 31.6 B 38.3 A 33.8 B 30.4 B 28.8 B 41.5 A 32.1 B 37.6 A 30.8 B 34.3 B 27.8 C 31.5 B 32.0 B
Oviedo Blvd./Division St. to SR 434 0.48 ---- ---- ---- ---- ---- ---- ---- ---- ---- ---- ---- ---- 20.0 D 23.4 C 17.9 D 20.4 D 16.7 E 18.7 D 15.3 E
SR 434 to SR 426 1.06 ---- ---- ---- ---- ---- ---- ---- ---- ---- ---- ---- ---- 23.0 C 22.0 D 25.9 C 25.1 C 29.7 B 24.8 C 41.0 A 31.4 B 27.3 C 22.9 C 32.9 B 26.7 C 29.2 B 22.9 C
Average 25.5 C 28.5 B 26.5 C 31.7 B 25.9 C 27.2 C 26.3 C
PM PEAK HOUR
Lockwood Blvd. to Alafaya Woods Blvd. 0.56 ---- ---- ---- ---- ---- ---- ---- ---- ---- ---- ---- ---- 33.1 B 31.7 B 31.4 B 40.9 A 40.9 A 41.4 A 33.8 B
Alafaya Woods Blvd. to Oviedo Blvd./Division St. 0.71 ---- ---- ---- ---- ---- ---- ---- ---- ---- ---- ---- ---- 38.4 A 35.8 A 34.6 B 33.2 B 35.5 A 33.5 B 26.3 C 31.3 B 29.4 B 33.6 B 27.0 C 32.0 B 26.7 C 29.4 B
Oviedo Blvd./Division St. to SR 434 0.48 ---- ---- ---- ---- ---- ---- ---- ---- ---- ---- ---- ---- 17.8 D 21.0 D 16.9 E 22.9 C 26.1 C 14.5 E 22.4 C
SR 434 to SR 426 1.06 ---- ---- ---- ---- ---- ---- ---- ---- ---- ---- ---- ---- 40.4 A 29.0 B 38.5 A 30.6 B 28.7 B 23.7 C 40.0 A 32.6 B 17.3 D 19.3 D 32.9 B 23.8 C 35.0 A 29.9 B
Average 31.8 B 31.7 B 27.4 C 32.0 B 23.9 C 26.9 C 29.7 B
Year 2013
Rdwy Segment Rdwy Section
Average Speed Average Speed
Year 2013
Rdwy Segment Rdwy Section
Average Speed Average Speed
TABLE C23.1aYear 2014 Seminole County Travel Time & Delay Study
Mitchell Hammock Road - Eastbound Direction Historical Summary
TABLE C23.1b
Year 2014Year 2005 Year 2006 Year 2007 Year 2008 Year 2009 Year 2010 Year 2011
Average Speed Average Speed Average Speed Average Speed Average SpeedAverage Speed Average Speed Average Speed Average Speed Average Speed Average Speed
Year 2012
Rdwy Segment Rdwy Section
Average Speed Average Speed
Year 2012
Rdwy Segment Rdwy Section
Average Speed Average Speed
Rdwy Section
Year 2014
Year 2014 Seminole County Travel Time & Delay StudyMitchell Hammock Road - Westbound Direction Historical Summary
Segments (mile) (mph) LOS (mph) LOS (mph) LOS (mph) LOS (mph) LOS (mph) LOS (mph) LOS (mph) LOS (mph) LOS (mph) LOS (mph) LOS (mph) LOS (mph) LOS (mph) LOS (mph) LOS (mph) LOS (mph) LOS (mph) LOS (mph) LOS (mph) LOS
AM PEAK HOUR
SR 436 to Tamarack St. 0.50 39.5 A 33.0 B 41.1 A 38.0 A 38.0 A 37.1 A 28.9 B 35.5 A 38.0 A 38.5 A
Tamarack St. to Central Pkwy. 0.24 13.1 E 24.8 C 15.8 E 24.8 C 18.2 D 29.6 B 15.7 E 26.5 C 26.5 C 33.6 B 16.0 E 26.5 C 18.4 D 24.6 C 18.9 D 27.9 C 12.9 F 23.8 C 16.6 E 27.4 C
Central Pkwy. to Greenbriar Blvd. 0.12 23.6 C 37.4 A 39.0 A 31.2 B 32.5 B 37.1 A 22.3 C 35.5 A 28.9 B 23.6 C
Greenbriar Blvd. to Little Wekiva Rd. 0.24 39.7 A 28.3 B 43.6 A 41.1 A 38.9 A 40.0 A 37.5 A 39.5 A 38.5 A 39.5 A
Little Wekiva Rd. to Jamestown Blvd. 0.21 30.0 B 23.1 C 26.8 C 22.5 C 20.3 D 21.0 D 22.5 C 32.3 B 23.3 C 28.0 C
Jamestown Blvd. to North St. 0.17 33.2 B 35.0 B 25.5 C 26.2 C 32.9 B 30.0 B 24.9 C 27.6 C 31.9 B 24.3 C
North St. to Plaza Entrance 0.10 40.1 A 36.6 A 20.7 D 28.6 B 35.3 A 35.3 A 28.7 B 26.4 C 38.8 A 30.0 B
Plaza Entrance to SR 434 0.15 5.5 F 20.0 D 4.8 F 17.1 D 4.6 F 17.0 E 9.5 F 22.5 C 5.8 F 18.7 D 6.1 F 19.4 D 4.4 F 15.7 E 7.9 F 22.7 C 7.5 F 21.6 D 5.8 F 18.6 D
Average 21.8 D 19.7 D 20.8 D 24.1 C 23.1 C 21.9 D 18.6 D 24.7 C 22.5 C 21.6 D
PM PEAK HOUR
SR 436 to Tamarack St. 0.50 39.2 A 36.4 A 38.0 A 40.5 A 37.1 A 38.0 A 38.0 A 35.9 A 36.7 A 40.0 A
Tamarack St. to Central Pkwy. 0.24 16.2 E 27.7 C 11.1 F 21.4 D 15.9 E 26.6 C 8.8 F 19.3 D 20.3 D 29.6 B 11.9 F 22.7 C 12.9 F 23.8 C 14.2 E 24.5 C 18.6 D 28.3 B 17.0 D 28.3 B
Central Pkwy. to Greenbriar Blvd. 0.12 35.2 A 35.1 A 39.0 A 32.5 B 33.9 B 22.9 C 23.6 C 30.0 B 35.5 A 23.6 C
Greenbriar Blvd. to Little Wekiva Rd. 0.24 41.0 A 40.6 A 41.1 A 38.9 A 37.9 A 38.9 A 37.5 A 37.5 A 37.5 A 38.5 A
Little Wekiva Rd. to Jamestown Blvd. 0.21 16.6 E 24.4 C 24.2 C 22.1 C 35.0 B 19.7 D 19.4 D 25.2 C 28.0 C 25.7 C
Jamestown Blvd. to North St. 0.17 31.2 B 19.1 D 35.2 A 30.9 B 30.0 B 27.6 C 34.0 B 34.0 B 35.2 A 35.2 A
North St. to Plaza Entrance 0.10 29.3 B 17.9 D 23.1 C 14.0 E 21.4 D 17.1 D 22.0 D 34.7 B 36.7 A 36.7 A
Plaza Entrance to SR 434 0.15 7.8 F 21.0 D 3.8 F 14.3 E 4.5 F 17.1 D 5.1 F 16.5 E 9.1 F 23.7 C 6.8 F 18.0 D 6.6 F 18.6 D 13.3 E 26.6 C 8.5 F 24.0 C 6.3 F 20.1 D
Average 23.5 C 16.7 E 20.2 D 17.6 D 25.9 C 19.8 D 20.5 D 25.6 C 25.6 C 23.0 C
Roadway Distance
Segments (mile) (mph) LOS (mph) LOS (mph) LOS (mph) LOS (mph) LOS (mph) LOS (mph) LOS (mph) LOS (mph) LOS (mph) LOS (mph) LOS (mph) LOS (mph) LOS (mph) LOS (mph) LOS (mph) LOS (mph) LOS (mph) LOS (mph) LOS (mph) LOS
AM PEAK HOUR
SR 434 to Plaza Entrance 0.14 25.2 C 30.1 B 25.5 C 33.6 B 29.0 B 30.0 B 31.1 B 27.1 C 33.6 B 35.0 B
Plaza Entrance to North St. 0.11 27.3 C 36.0 A 21.4 D 35.3 A 31.6 B 37.5 A 33.0 B 19.4 D 41.2 A 38.8 A
North St. to Jamestown Blvd. 0.17 10.0 F 18.0 D 13.8 E 12.4 F 19.2 D 15.9 E 25.5 C 29.1 B 37.8 A 35.2 A
James town Blvd. to Little Wekiva Rd. 0.20 37.4 A 38.8 A 40.6 A 38.2 A 39.4 A 38.2 A 38.2 A 37.1 A 39.4 A 40.6 A
Little Wekiva Rd. to Greenbriar Blvd. 0.25 30.8 B 40.3 A 23.6 C 28.8 B 34.3 B 32.0 B 36.6 A 36.6 A 40.5 A 40.5 A
Greenbriar Blvd. to Central Pkwy. 0.12 17.5 D 21.2 D 18.6 D 28.1 B 20.0 D 22.3 C 19.5 D 24.0 C 19.5 D 27.6 C 23.6 C 27.1 C 26.0 C 31.7 B 37.1 A 30.9 B 39.0 A 38.6 A 39.0 A 38.4 A
Central Pkwy. to Tamarack St. 0.23 39.4 A 38.5 A 43.1 A 38.3 A 39.4 A 36.3 A 39.4 A 39.4 A 40.6 A 39.4 A
Tamarack St. to SR 436 0.52 37.9 A 38.4 A 18.3 D 21.8 D 19.5 D 23.4 C 21.1 D 24.5 C 19.0 D 22.6 C 13.8 E 17.0 D 17.6 D 21.2 D 16.1 E 19.7 D 15.4 E 19.0 D 19.3 D 22.8 C
Average 26.1 C 25.0 C 22.8 C 24.2 C 25.2 C 21.6 D 26.2 C 24.8 C 26.8 C 29.7 B
PM PEAK HOUR
SR 434 to Plaza Entrance 0.14 20.7 D 25.2 C 18.3 D 28.0 C 24.7 C 22.7 C 27.1 C 29.0 B 35.0 B 36.5 A
Plaza Entrance to North St. 0.11 33.3 B 24.3 C 27.3 C 25.0 C 35.3 A 33.3 B 21.3 D 30.0 B 22.8 C 25.4 C
North St. to Jamestown Blvd. 0.17 15.4 E 9.4 F 13.8 E 8.2 F 19.6 D 20.0 D 13.4 E 12.0 F 14.8 E 11.0 F
James town Blvd. to Little Wekiva Rd. 0.20 37.2 A 30.2 B 39.4 A 37.1 A 36.0 A 38.2 A 36.0 A 35.0 B 36.0 A 36.0 A
Little Wekiva Rd. to Greenbriar Blvd. 0.25 37.2 A 24.6 C 30.6 B 31.3 B 34.3 B 35.1 A 37.5 A 32.6 B 34.1 B 37.5 A
Greenbriar Blvd. to Central Pkwy. 0.12 22.8 C 25.7 C 36.5 A 20.6 D 26.0 C 23.7 C 39.0 A 21.3 D 30.0 B 28.8 B 19.5 D 27.0 C 17.3 D 23.5 C 16.2 E 22.8 C 17.3 D 24.6 C 31.2 B 25.0 C
Central Pkwy. to Tamarack St. 0.23 40.1 A 40.1 A 46.0 A 43.1 A 38.3 A 40.6 A 38.3 A 35.4 A 36.3 A 39.4 A
Tamarack St. to SR 436 0.52 21.9 D 25.8 C 15.6 E 19.1 D 13.7 E 17.4 D 18.2 D 22.2 C 17.6 D 21.1 D 15.9 E 19.6 D 13.7 E 17.1 D 19.0 D 22.2 C 17.0 D 20.4 D 17.4 D 21.0 D
Average 25.8 C 19.9 D 20.5 D 21.7 D 24.9 C 23.2 C 20.3 D 22.5 C 22.6 C 23.2 C
Rdwy Segment Rdwy Section
Average Speed Average Speed
Year 2013
Rdwy Segment Rdwy Section
Average Speed Average Speed
TABLE C24.1aYear 2014 Seminole County Travel Time & Delay Study
Montgomery Road - Northbound Direction Historical Summary
Year 2014Year 2005 Year 2006 Year 2007 Year 2008 Year 2009 Year 2010 Year 2011 Year 2013
Average Speed Average Speed Average Speed Average Speed Average Speed
Rdwy Section Rdwy Segment Rdwy Section
Average Speed Average Speed Average Speed Average Speed Average Speed Average Speed Average Speed Average Speed Average Speed Average Speed Average Speed
Average Speed Average Speed Average Speed Average Speed Average SpeedAverage Speed Average Speed Average Speed Average Speed Average Speed Average Speed Average Speed Average Speed
Year 2012
Rdwy Segment Rdwy Section
Average Speed Average Speed
Year 2012
Rdwy Segment Rdwy Section
Average Speed Average Speed
Rdwy Section
Year 2014
TABLE C24.1bYear 2014 Seminole County Travel Time & Delay Study
Montgomery Road - Southbound Direction Historical Summary
Average Speed Average Speed Average Speed
Rdwy Section Rdwy Segment Rdwy Section
D-30 Montgomery Road
Roadway Distance
Segments (mile) (mph) LOS (mph) LOS (mph) LOS (mph) LOS (mph) LOS (mph) LOS (mph) LOS (mph) LOS (mph) LOS (mph) LOS (mph) LOS (mph) LOS (mph) LOS (mph) LOS (mph) LOS (mph) LOS (mph) LOS (mph) LOS (mph) LOS (mph) LOS
AM PEAK HOUR
SR 436 to Pedestrian Crossing 0.20 29.1 B 28.6 B 30.8 A 26.4 B 28.0 B 27.1 B 22.6 C 30.8 A 23.1 C 21.4 C
Pedestrian Crossing to Central Pkwy. 0.19 36.0 A 32.1 A 28.1 B 28.3 B 29.8 B 30.2 A 24.5 B 25.4 B 28.8 B 28.4 B 30.7 A 28.9 B 25.5 B 24.0 C 24.0 C 27.0 B 26.1 B 24.5 B 27.3 B 24.0 C
Central Pkwy. to Center St. 0.21 29.1 B 25.5 B 30.9 A 25.1 B 19.5 C 26.1 B 24.2 B 23.8 C 24.2 B 22.1 C
Center St. to Hillcrest St. 0.25 27.4 B 22.7 C 31.9 A 27.7 B 24.9 B 26.3 B 27.3 B 25.9 B 25.0 B 25.4 B
Hillcrest St. to Oakhurst St. 0.19 24.8 B 18.6 C 22.5 C 18.1 C 24.9 B 21.1 C 18.1 C 18.7 C 19.0 C 18.4 C
Oakhurst St. to North St. 0.31 16.6 D 22.6 C 15.3 D 19.3 C 26.8 B 27.8 B 13.7 E 19.1 C 20.0 C 21.8 C 20.2 C 22.9 C 19.6 C 21.7 C 27.4 B 24.0 B 22.1 C 22.5 C 23.7 C 22.5 C
North St. to Stanley St. 0.33 30.6 A 28.5 B 27.5 B 28.2 B 30.7 A 28.3 B 28.3 B 30.4 A 28.3 B 28.3 B
Stanley St. to Carlton St. 0.22 33.3 A 31.5 A 32.9 A 31.3 A 33.3 A 27.4 B 27.4 B 28.6 B 28.6 B 28.0 B
Carlton St. to Roxboro Rd. 0.23 28.9 B 31.8 A 34.7 A 32.3 A 32.2 A 29.4 B 27.8 B 29.2 B 30.0 B 27.8 B
Roxboro Rd. to Waverly Way 0.18
Waverly Way to SR 434 0.08 22.0 C 28.2 B 22.3 C 28.0 B 15.9 D 25.4 B 10.1 E 21.0 C 13.5 E 24.4 B 18.2 C 25.1 B 10.2 E 18.7 C 8.1 F 16.9 D 7.6 F 16.1 D 9.4 F 18.0 D
Average 26.1 B 23.7 C 27.1 B 20.7 C 23.8 C 24.7 B 20.6 C 20.7 C 19.4 C 20.5 C
PM PEAK HOUR
SR 436 to Pedestrian Crossing 0.20 26.7 B 22.8 C 28.6 B 29.3 B 28.1 B 28.5 B 23.5 C 30.0 B 22.2 C 22.2 C
Pedestrian Crossing to Central Pkwy. 0.19 20.1 C 23.1 C 20.8 C 21.8 C 20.3 C 23.9 C 12.4 E 17.1 D 32.0 A 29.9 B 13.1 E 17.4 D 15.6 D 18.7 C 14.0 E 19.0 C 23.5 C 22.9 C 17.6 D 19.7 C
Central Pkwy. to Center St. 0.21 22.1 C 24.5 B 24.3 B 21.1 C 30.3 A 25.5 B 26.8 B 23.8 C 28.0 B 20.3 C
Center St. to Hillcrest St. 0.25 26.8 B 30.0 A 30.6 A 29.9 B 32.1 A 28.8 B 30.6 A 27.8 B 29.4 B 27.8 B
Hillcrest St. to Oakhurst St. 0.19 28.8 B 23.3 C 21.6 C 23.3 C 33.2 A 24.8 B 31.7 A 27.8 B 27.1 B 30.8 A
Oakhurst St. to North St. 0.31 11.7 E 18.5 C 18.7 C 23.0 C 19.8 C 23.2 C 13.5 E 19.4 C 17.8 D 25.3 B 18.8 C 23.4 C 19.0 C 25.0 B 19.0 C 23.4 C 12.6 E 20.1 C 14.1 D 20.1 C
North St. to Stanley St. 0.33 30.6 A 28.4 B 30.8 A 25.3 B 29.1 B 28.3 B 30.0 B 27.9 B 29.6 B 27.9 B
Stanley St. to Carlton St. 0.22 33.6 A 31.7 A 31.0 A 32.3 A 30.9 A 28.6 B 30.0 B 28.6 B 30.7 A 28.6 B
Carlton St. to Roxboro Rd. 0.23 31.7 A 32.9 A 33.1 A 32.7 A 29.8 B 30.0 B 30.0 B 28.5 B 31.7 A 29.2 B
Roxboro Rd. to Waverly Way 0.18
Waverly Way to SR 434 0.08 20.0 C 28.0 B 13.1 E 23.5 C 16.9 D 26.4 B 17.5 D 25.3 B 16.2 D 25.0 B 10.0 F 20.1 C 14.1 D 22.8 C 7.5 F 15.9 D 10.5 E 19.9 C 8.0 F 16.5 D
Average 22.5 C 23.0 C 24.6 B 21.1 C 25.9 B 20.7 C 22.8 C 18.9 C 20.4 C 18.3 C
Roadway Distance
Segments (mile) (mph) LOS (mph) LOS (mph) LOS (mph) LOS (mph) LOS (mph) LOS (mph) LOS (mph) LOS (mph) LOS (mph) LOS (mph) LOS (mph) LOS (mph) LOS (mph) LOS (mph) LOS (mph) LOS (mph) LOS (mph) LOS (mph) LOS (mph) LOS
AM PEAK HOUR
SR 434 to Waverly Way 0.06
Waverly Way to Roxboro Rd. 0.18 31.7 A 28.1 B 32.1 A 29.3 B 29.8 B 26.2 B 28.5 B 28.5 B 29.5 B 28.5 B
Roxboro Rd. to Carlton St. 0.23 36.3 A 32.5 A 35.6 A 31.5 A 27.4 B 29.4 B 31.7 A 30.0 B 30.8 A 29.2 B
Carlton St. to Stanely St. 0.21 36.0 A 32.2 A 33.1 A 31.0 A 32.9 A 27.4 B 29.3 B 27.4 B 30.0 B 27.4 B
Stanley St. to North St. 0.34 18.2 C 26.8 B 19.7 C 26.1 B 25.7 B 30.6 A 16.1 D 23.8 C 21.2 C 27.0 B 21.5 C 25.2 B 25.8 B 28.2 B 17.6 D 23.7 C 14.3 D 22.0 C 20.6 C 25.2 B
North St. to Oakhurst St. 0.31 18.8 C 22.8 C 24.4 B 21.6 C 25.9 B 18.8 C 22.6 C 28.7 B 24.9 B 19.0 C
Oakhurst St. to Hillcrest St. 0.19 30.9 A 26.7 B 33.1 A 24.3 B 24.9 B 28.5 B 28.5 B 30.0 B 26.5 B 28.5 B
Hillcrest St. to Center St. 0.25 23.9 C 19.4 C 24.0 B 21.3 C 24.2 B 26.8 B 25.9 B 24.6 B 24.6 B 23.4 C
Center St. to Central Pkwy. 0.22 13.8 E 19.9 C 10.4 E 17.9 D 12.6 E 21.2 C 14.1 D 19.7 C 14.5 D 21.8 C 17.9 D 21.8 C 12.2 E 20.3 C 12.7 E 22.0 C 22.5 C 24.6 B 17.7 D 21.1 C
Central Pkwy. to Pedestrian Crossing 0.21 27.7 B 26.5 B 25.7 B 31.0 A 22.6 C 22.8 C 29.3 B 30.0 B 30.8 A 28.6 B
Pedestrian Crossing to SR 436 0.20 12.8 E 18.0 D 17.0 D 21.0 C 21.6 C 23.6 D 12.1 E 18.0 D 13.1 E 17.0 D 10.8 E 15.0 D 8.8 F 13.5 D 12.9 E 18.0 D 8.8 F 13.7 D 6.3 F 10.3 E
Average 21.9 C 21.3 C 24.9 B 20.9 C 22.6 C 21.4 C 21.1 C 21.9 C 20.8 C 19.1 C
PM PEAK HOUR
SR 434 to Waverly Way 0.06
Waverly Way to Roxboro Rd. 0.18 30.5 A 29.5 B 31.8 A 29.3 B 29.4 B 27.2 B 29.5 B 29.0 B 30.0 B 29.5 B
Roxboro Rd. to Carlton St. 0.23 33.3 A 31.8 A 36.8 A 31.9 A 34.4 A 30.6 A 30.8 A 30.0 B 30.8 A 30.0 B
Carlton St. to Stanely St. 0.21 35.9 A 28.5 B 36.8 A 32.1 A 35.2 A 28.6 B 28.6 B 28.6 B 30.0 B 28.6 B
Stanley St. to North St. 0.34 19.1 C 26.7 B 19.6 C 25.6 B 18.7 C 27.3 B 21.9 C 27.4 B 18.2 C 26.0 B 17.9 D 24.0 C 28.7 B 29.3 B 20.6 C 25.6 B 18.4 C 24.9 B 21.0 C 26.0 B
North St. to Oakhurst St. 0.31 26.1 B 30.2 A 25.1 B 25.9 B 24.3 B 26.2 B 25.6 B 29.5 B 25.6 B 30.0 B
Oakhurst St. to Hillcrest St. 0.19 28.0 B 32.1 A 31.2 A 18.8 C 30.8 A 29.2 B 30.0 B 30.0 B 29.2 B 30.0 B
Hillcrest St. to Center St. 0.25 27.4 B 31.3 A 19.4 C 13.7 E 27.0 B 29.4 B 30.6 A 30.0 B 30.0 B 29.4 B
Center St. to Central Pkwy. 0.22 14.8 D 23.0 C 10.2 E 21.7 C 8.8 F 17.5 D 8.9 F 15.1 D 8.6 F 18.4 C 10.3 E 20.6 C 10.9 E 20.9 C 11.9 E 22.5 C 17.3 D 24.6 B 13.3 E 23.5 C
Central Pkwy. to Pedestrian Crossing 0.21 34.5 A 27.9 B 30.8 A 31.6 A 29.1 B 18.1 C 25.0 B 30.0 B 30.0 B 29.3 B
Pedestrian Crossing to SR 436 0.20 12.6 E 19.0 C 15.7 D 20.6 C 20.8 C 25.2 B 10.2 E 16.1 D 11.4 E 16.9 D 6.4 F 9.8 F 5.7 F 9.2 F 6.2 F 10.3 E 5.4 F 9.2 F 6.7 F 11.0 E
Average 23.6 C 23.0 C 22.0 C 18.9 C 20.7 C 18.3 C 19.2 C 19.7 C 19.3 C 20.4 C
Rdwy Segment Rdwy Section
Average Speed Average Speed
Year 2013
Rdwy Segment Rdwy Section
Average Speed Average Speed
TABLE C25.1aYear 2014 Seminole County Travel Time & Delay Study
Palm Springs Drive - Northbound Direction Historical Summary
Year 2014Year 2005 Year 2006 Year 2007 Year 2008 Year 2009 Year 2010 Year 2011 Year 2013
Average Speed Average Speed Average Speed Average Speed Average Speed
Rdwy Section Rdwy Segment Rdwy Section
Average Speed Average Speed Average Speed Average Speed Average Speed Average Speed Average Speed Average Speed Average Speed Average Speed Average Speed
Average Speed Average Speed Average Speed Average Speed Average SpeedAverage Speed Average Speed Average Speed Average Speed Average Speed Average Speed Average Speed Average Speed
Year 2012
Rdwy Segment Rdwy Section
Average Speed Average Speed
Year 2012
Rdwy Segment Rdwy Section
Average Speed Average Speed
Rdwy Section
Year 2014
TABLE C25.1bYear 2014 Seminole County Travel Time & Delay Study
Palm Springs Drive - Southbound Direction Historical Summary
Average Speed Average Speed Average Speed
Rdwy Section Rdwy Segment Rdwy Section
D-31 Palm Springs Drive
Roadway Distance
Segments (mile) (mph) LOS (mph) LOS (mph) LOS (mph) LOS (mph) LOS (mph) LOS (mph) LOS (mph) LOS (mph) LOS (mph) LOS (mph) LOS (mph) LOS (mph) LOS (mph) LOS (mph) LOS (mph) LOS (mph) LOS (mph) LOS (mph) LOS (mph) LOS
AM PEAK HOUR
SR 436 to Winter Park Dr. 0.05 39.1 A 30.6 B 16.0 E 18.7 D 16.3 E 7.7 F 5.5 F 26.7 C
Winter Park Dr. to Fire Station 0.12 31.3 B 27.4 C 21.6 D 34.3 B 32.7 B 37.9 A
Fire Station to Mark David Blvd. 0.25 44.9 A 42.2 A 36.0 A 43.6 A 36.9 A 43.6 A
Mark David Blvd. to Eagle Cr. 0.25 28.1 B 33.7 B 28.2 B 29.6 B 32.1 B 32.9 B 40.1 A 35.1 A 27.5 C 27.2 C 33.9 B 30.2 B 29.4 B 25.0 C 44.1 A 41.1 A
Eagle Cr. to Jericho Dr. 1.05 47.5 A 42.3 A 48.4 A 44.0 A 47.6 A 44.5 A 39.4 A 43.1 A 43.4 A 43.7 A
Jericho Dr. to Merivale Dr. 0.26 46.9 A 40.7 A 46.3 A 48.4 A 48.4 A 43.3 A 33.9 B 44.6 A 44.6 A 43.3 A
Merivale Dr. to Nodding Pines Way 0.42 39.9 A 32.3 B 34.3 B 45.0 A 27.9 C 26.8 C 40.0 A 45.0 A 40.6 A 34.5 B
Nodding Pines way to Dodd Rd. 0.28 15.2 E 35.8 A 19.6 D 34.5 B 17.6 D 36.3 A 22.1 C 39.2 A 19.8 D 35.6 A 17.8 D 33.1 B 21.3 D 34.7 B 31.1 B 41.4 A 36.5 A 41.9 A 21.5 D 36.4 A
Dodd Rd. to Willa Springs Dr. 0.30
Willa Springs Dr. to Willa Springs Center 0.09 32.8 B 31.9 B 30.6 B 41.0 A 41.2 A 38.6 A 39.7 A 40.3 A 43.3 A 40.3 A
Willa Springs Center to Plaza Entrance 0.18 39.8 A 29.7 B 26.8 C 29.9 B 43.7 A 24.3 C 25.9 C 34.5 B 40.7 A 18.4 D
Plaza Entrance to Tuskawilla Rd. 0.11 21.1 D 31.9 B 22.9 C 29.8 B 9.2 F 22.6 C 13.6 E 30.0 B 15.4 E 34.0 B 14.6 E 27.7 C 14.0 E 27.9 C 31.6 B 37.1 A 20.7 D 36.8 A 10.3 F 22.9 C
Tuskawilla Rd. to Red Willow Plaza 0.12 33.5 B 35.6 A 12.0 F 36.7 A 39.9 A 41.5 A 36.0 A 41.5 A 41.5 A 36.0 A
Red Willow Plaza to Rising Sun Blvd. 0.46 45.4 A 43.7 A 37.9 A 48.3 A 47.6 A 44.1 A 41.4 A 24.5 C 21.7 D 23.0 C
Rising Sun Blvd. to S. Citrus Rd. 0.26 44.3 A 44.7 A 49.5 A 49.4 A 48.1 A 46.3 A 41.1 A 35.5 A 40.0 A 39.0 A
S. Citrus Rd. to Mikler Rd.** 47.2 A 31.9 B 30.0 B 41.1 A 43.6 A 43.6 A
Mikler Rd. to Slavia Rd.*** 47.8 A 46.8 A 32.7 B 38.8 A 32.5 B 36.4 A 43.6 A 32.6 B 45.7 A 31.8 B 44.6 A 32.3 B
Slavia Rd. to Dovera Dr. 0.60 48.5 A 44.3 A 45.6 A 51.4 A 47.4 A 43.8 A 40.9 A 43.4 A 44.4 A 43.9 A
Dovera Dr. to Oviedo Market Pl. 0.21 47.4 A 44.6 A 44.1 A 49.9 A 47.7 A 46.7 A 38.2 A 29.3 B 45.0 A 40.6 A
Oviedo Market Pl. to SR 417 (W. Ramps) 0.21 48.1 A 46.2 A 45.3 A 52.3 A 26.3 C 25.7 C 31.3 B 45.0 A 46.5 A 43.6 A
SR 417 (W. Ramps) to SR 417 (E. Ramps) 0.17 46.6 A 48.0 A 34.5 B 43.3 A 22.6 C 40.6 A 50.4 A 51.2 A 27.2 C 37.8 A 24.3 C 35.7 A 31.0 B 36.7 A 45.7 A 40.6 A 33.1 B 43.0 A 32.0 B 41.2 A
SR 417 (E. Ramps) to SR 426 0.32 23.5 C 23.5 C 16.0 E 16.0 E 11.9 F 11.9 F 19.8 D 19.8 D 35.7 A 35.7 A 11.9 F 11.9 F 33.2 B 33.2 B 37.2 A 37.2 A 41.3 A 41.3 A 17.9 D 17.9 D
Average 37.8 A 34.5 B 31.1 B 39.0 A 36.6 A 30.8 B 33.1 B 37.9 A 38.3 A 32.8 B
PM PEAK HOUR
SR 436 to Winter Park Dr. 0.05 35.5 A 33.6 B 14.2 E 16.2 E 6.4 F 11.4 F 14.1 E 21.8 D
Winter Park Dr. to Fire Station 0.12 30.5 B 29.5 B 30.4 B 36.0 A 32.7 B 37.9 A
Fire Station to Mark David Blvd. 0.25 44.7 A 46.4 A 44.2 A 42.4 A 37.9 A 43.6 A
Mark David Blvd. to Eagle Cr. 0.25 27.4 C 31.7 B 30.5 B 32.3 B 40.7 A 34.8 B 35.0 B 34.2 B 36.5 A 27.2 C 38.0 A 34.1 B 39.5 A 33.9 B 42.9 A 39.8 A
Eagle Cr. to Jericho Dr. 1.05 45.6 A 46.4 A 48.4 A 44.6 A 43.8 A 44.8 A 42.0 A 43.1 A 43.4 A 43.1 A
Jericho Dr. to Merivale Dr. 0.26 41.8 A 39.5 A 47.7 A 36.1 A 39.3 A 28.4 B 28.4 B 44.6 A 45.9 A 36.3 A
Merivale Dr. to Nodding Pines Way 0.42 43.4 A 31.6 B 42.8 A 34.4 B 43.3 A 41.3 A 30.4 B 33.2 B 29.6 B 42.7 A
Nodding Pines way to Dodd Rd. 0.28 15.4 E 35.3 A 13.4 E 31.9 B 30.9 B 43.7 A 27.5 C 37.9 A 13.0 F 32.6 B 17.2 D 34.3 B 20.7 D 32.7 B 14.9 E 32.6 B 16.5 E 32.9 B 21.3 D 36.9 A
Dodd Rd. to Willa Springs Dr. 0.30
Willa Springs Dr. to Willa Springs Center 0.09 38.6 A 36.5 A 28.0 B 24.7 C 38.7 A 39.3 A 35.5 A 39.7 A 41.8 A 40.3 A
Willa Springs Center to Plaza Entrance 0.18 19.1 D 22.5 C 11.3 F 14.0 E 12.7 F 12.8 F 15.0 E 24.3 C 29.2 B 21.1 D
Plaza Entrance to Tuskawilla Rd. 0.11 14.4 E 25.7 C 14.1 E 26.4 C 7.8 F 16.2 E 22.6 C 20.3 D 29.3 B 24.5 C 14.2 E 21.4 D 14.3 E 22.2 C 14.6 E 27.8 C 13.0 E 28.9 B 23.1 C 29.6 B
Tuskawilla Rd. to Red Willow Plaza 0.12 36.1 A 15.5 E 28.1 B 35.4 A 39.4 A 36.0 A 38.6 A 33.7 B 36.0 A 38.6 A
Red Willow Plaza to Rising Sun Blvd. 0.46 47.2 A 38.7 A 49.8 A 48.2 A 46.6 A 44.8 A 41.9 A 44.3 A 44.3 A 26.2 C
Rising Sun Blvd. to S. Citrus Rd. 0.26 51.1 A 45.7 A 49.4 A 47.2 A 44.4 A 41.5 A 41.1 A 32.5 B 43.3 A 40.0 A
S. Citrus Rd. to Mikler Rd.** 43.0 A 45.5 A 33.5 B 43.6 A 45.0 A 42.4 A
Mikler Rd. to Slavia Rd.*** 44.9 A 44.4 A 45.0 A 43.6 A 29.5 B 36.6 A 43.6 A 40.6 A 40.0 A 42.6 A 40.8 A 33.9 B
Slavia Rd. to Dovera Dr. 0.60 45.1 A 36.5 A 47.3 A 47.6 A 45.9 A 45.9 A 38.7 A 43.9 A 43.9 A 40.0 A
Dovera Dr. to Oviedo Market Pl. 0.21 40.4 A 32.9 B 25.6 C 41.6 A 30.5 B 38.2 A 35.0 B 34.1 B 39.4 A 42.0 A
Oviedo Market Pl. to SR 417 (W. Ramps) 0.21 45.6 A 42.3 A 36.0 A 48.6 A 41.6 A 34.3 B 38.9 A 42.4 A 43.6 A 43.6 A
SR 417 (W. Ramps) to SR 417 (E. Ramps) 0.17 45.9 A 44.4 A 44.6 A 37.7 A 42.2 A 38.6 A 47.9 A 46.7 A 43.6 A 41.2 A 39.1 A 40.9 A 28.2 B 36.3 A 40.0 A 41.0 A 40.0 A 42.5 A 43.6 A 41.5 A
SR 417 (E. Ramps) to SR 426 0.32 19.3 D 19.3 D 18.2 D 18.2 D 10.0 F 10.0 F 22.0 D 22.0 D 35.3 A 35.3 A 11.1 F 11.1 F 17.4 D 17.4 D 33.8 B 33.8 B 35.1 A 35.1 A 18.1 D 18.1 D
Average 35.4 A 31.5 B 31.1 B 35.5 A 34.2 B 31.4 B 31.2 B 35.2 A 36.3 A 34.5 B
Note: ** From 2009, additional control point has been considered as "Mikler Rd" the segment limits will be S. Citrus Rd to Mikler Rd. and the segment length will be 0.24 Mile
Note: *** From 2009, additional control point has been considered as "Mikler Rd" the segment limits will be Mikler Rd to Slavia Rd. and the segment length will be 0.32 Mile
Rdwy Section
Average Speed Average Speed
UNDER CONSTRUCTION
UNDER CONSTRUCTION
UNDER CONSTRUCTION
UNDER CONSTRUCTION
A41.2
A47.9A50.8
Average Speed Average Speed Average Speed Average Speed Average Speed Average Speed Average Speed
A46.2A46.6 A37.3 A45.1A44.90.56 B34.1A37.2
49.7 A43.8A46.2 B34.2A45.5
TABLE C26.1aYear 2014 Seminole County Travel Time & Delay Study
Red Bug Lake Road - Eastbound Direction Historical Summary
0.56 A45.1A
Year 2005 Year 2006 Year 2007 Year 2008 Year 2009 Year 2010 Year 2011
Average Speed Average Speed Average Speed Average Speed Average Speed Average Speed Average Speed Average Speed Average Speed
UNDER CONSTRUCTION
UNDER CONSTRUCTION
UNDER CONSTRUCTION
UNDER CONSTRUCTION
Year 2012
Rdwy Segment Rdwy Section
Average Speed Average Speed
UNDER CONSTRUCTION
UNDER CONSTRUCTION
UNDER CONSTRUCTION
UNDER CONSTRUCTION
Year 2014
Rdwy Segment Rdwy Section
UNDER CONSTRUCTION
UNDER CONSTRUCTION
UNDER CONSTRUCTION
UNDER CONSTRUCTION
Year 2013
Rdwy Segment
D-32 Red Bug Lake Road - EB
Roadway Distance
Segments (mile) (mph) LOS (mph) LOS (mph) LOS (mph) LOS (mph) LOS (mph) LOS (mph) LOS (mph) LOS (mph) LOS (mph) LOS (mph) LOS (mph) LOS (mph) LOS (mph) LOS (mph) LOS (mph) LOS (mph) LOS (mph) LOS (mph) LOS (mph) LOS
AM PEAK HOUR
SR 426 to SR 417 (E. Ramps) 0.27 25.4 C 25.4 C 35.0 A 35.0 A 28.3 B 28.3 B 31.0 B 31.0 B 23.2 C 23.2 C 31.5 B 31.5 B 39.6 A 39.6 A 20.2 D 20.2 D 20.9 D 20.9 D 43.3 A 43.3 A
SR 417 (E. Ramps) to SR 417 (W. Ramps) 0.19 31.7 B 30.5 B 27.3 C 43.8 A 27.3 C 20.5 D 43.6 A 36.9 A 36.9 A 45.7 A
SR 417 (W. Ramps) tp Oviedo Market Pl. 0.25 45.2 A 35.6 A 30.8 B 48.9 A 47.6 A 38.9 A 42.4 A 45.0 A 43.6 A 45.0 A
Oviedo Market Pl. to Dovera Dr. 0.21 47.6 A 32.9 B 33.2 B 49.0 A 47.9 A 30.0 B 38.2 A 43.4 A 45.0 A 43.4 A
Dovera Dr. to Slavia Rd. 0.59 50.0 A 45.5 A 47.6 A 39.2 A 42.3 A 35.6 A 51.5 A 49.5 A 49.8 A 44.5 A 38.7 A 33.4 B 40.4 A 40.8 A 30.5 B 35.4 A 34.0 B 37.6 A 38.3 A 41.2 A
Slavia Rd. to Mikler Rd.*** 39.4 A 33.3 B 29.5 B 42.7 A 42.7 A 42.7 A
Mikler Rd. to S. Citrus Rd.** 34.6 B 32.6 B 38.9 A 34.3 B 43.6 A 42.4 A
S. Citrus Rd. to Rising Sun Blvd. 0.26 31.6 B 42.9 A 31.7 B 46.8 A 44.9 A 45.0 A 23.6 C 38.0 A 40.0 A 42.2 A
Rising Sun Blvd. to Red Willow Plaza 0.46 45.0 A 40.0 A 43.6 A 37.6 A 13.0 E 21.5 D 48.1 A 42.7 A 46.1 A 42.3 A 44.8 A 41.1 A 40.8 A 32.8 B 38.7 A 38.5 A 38.7 A 40.7 A 40.3 A
Red willow Plaza to Tuskawilla Rd. 0.15 22.0 D 12.3 F 11.9 F 32.2 B 37.8 A 16.9 E 6.8 F 9.5 F 20.8 D 30.0 B 40.6 A
Tuskawilla Rd. to Plaza Entrance 0.10 36.7 A 37.1 A 20.8 D 42.0 A 40.4 A 31.8 B 35.3 A 37.5 A 35.3 A 40.0 A
Plaza Entrance to Willa Springs Center 0.18 41.6 A 42.1 A 40.6 A 44.0 A 42.5 A 39.3 A 39.3 A 42.2 A 39.3 A 43.8 A
Willa Springs Center to Willa Springs Dr. 0.09
Willa Springs Dr. to Dodd Rd. 0.31 10.9 F 16.6 E 26.3 C 25.1 C 23.3 C 21.7 D 30.5 B 34.8 B 33.6 B 36.9 A 35.1 A 31.5 B 26.6 C 21.7 D 35.5 A 27.8 C 28.2 B 29.8 B 25.4 C 30.6 B
Dodd Rd. to Nodding Pines Way 0.28 19.8 D 16.4 E 21.9 D 10.9 F 34.0 B 29.5 B 18.5 D 25.1 C 22.1 C 31.7 B
Nodding Pines Way to Merivale Dr. 0.41 42.9 A 41.3 A 23.8 C 42.1 A 27.6 C 34.1 B 34.5 B 45.0 A 44.2 A 44.2 A
Merivale Dr. to Jericho Dr. 0.26 46.9 A 45.4 A 39.3 A 47.9 A 47.5 A 45.9 A 40.0 A 44.6 A 44.6 A 43.3 A
Jericho Dr. to Eagle Cr. 1.05 32.3 B 32.4 B 29.4 B 29.2 B 30.8 B 28.3 B 33.1 B 27.5 C 34.0 B 33.7 B 35.5 A 35.3 A 34.4 B 31.2 B 43.4 A 39.8 A 43.7 A 38.7 A 40.4 A 39.9 A
Eagle Cr. to Mark David Blvd. 0.25 33.5 B 21.0 D 32.2 B 38.1 A 33.0 B 38.0 A 34.9 B 38.5 A
Mark David Blvd.to Fire Station 0.24 29.1 B 23.0 C 25.6 C 17.6 D 21.8 D 36.0 A
Fire Station to Winter Park Dr. 0.12 5.3 F 7.5 F 6.3 F 8.4 F 7.1 F 4.8 F
Winter Park Dr. to SR 436 0.02 14.5 E 19.0 D 9.4 F 12.0 F 5.5 F 15.0 E 26.6 C 18.7 D 23.4 C 17.3 D 34.3 B 18.3 D 34.3 B 18.0 D 40.0 A 16.7 E
Average 29.2 B 27.5 C 24.5 C 32.1 B 32.9 B 31.8 B 29.3 B 34.7 B 35.7 A 34.3 B
PM PEAK HOUR
SR 426 to SR 417 (E. Ramps) 0.27 27.6 C 27.6 C 37.4 A 37.4 A 35.6 A 35.6 A 28.3 B 28.3 B 31.1 B 31.1 B 29.1 B 29.1 B 38.7 A 38.7 A 13.0 E 13.0 E 15.8 E 15.8 E 29.1 B 29.1 B
SR 417 (E. Ramps) to SR 417 (W. Ramps) 0.19 37.5 A 45.1 A 29.2 B 42.8 A 26.7 C 24.3 C 33.1 B 38.4 A 40.0 A 38.4 A
SR 417 (W. Ramps) tp Oviedo Market Pl. 0.25 45.0 A 29.5 B 36.2 A 16.2 E 19.9 D 24.4 C 20.3 D 43.6 A 45.0 A 42.4 A
Oviedo Market Pl. to Dovera Dr. 0.21 33.7 B 29.2 B 45.3 A 42.7 A 42.1 A 31.5 B 37.1 A 11.5 F 19.1 D 42.0 A
Dovera Dr. to Slavia Rd. 0.59 45.0 A 41.5 A 34.2 B 33.2 B 41.3 A 38.9 A 35.7 A 30.3 B 35.0 A 30.3 B 35.8 A 30.5 B 39.1 A 32.1 B 24.8 C 23.2 C 35.6 A 32.6 B 32.4 B 36.3 A
Slavia Rd. to Mikler Rd.*** 43.4 A 43.9 A 40.8 A 41.7 A 44.6 A 42.7 A
Mikler Rd. to S. Citrus Rd.** 47.2 A 42.9 A 37.9 A 30.6 B 30.6 B 33.5 B
S. Citrus Rd. to Rising Sun Blvd. 0.26 36.7 A 36.2 A 18.2 D 15.8 E 22.4 C 21.3 D 24.0 C 16.1 E 18.8 D 18.8 D
Rising Sun Blvd. to Red Willow Plaza 0.46 26.8 C 30.8 B 23.9 C 28.9 B 23.2 C 27.5 C 26.7 C 27.4 C 37.8 A 33.2 B 22.6 C 25.1 C 22.5 C 27.9 C 39.7 A 29.9 B 38.2 A 31.5 B 21.9 D
Red willow Plaza to Tuskawilla Rd. 0.15 11.5 F 7.9 F 10.9 F 13.5 E 19.9 D 8.4 F 5.1 F 27.0 C 20.8 D 4.3 F 19.5 D
Tuskawilla Rd. to Plaza Entrance 0.10 33.8 B 29.0 B 35.2 A 39.2 A 37.5 A 31.8 B 27.3 C 37.5 A 40.0 A 33.3 B
Plaza Entrance to Willa Springs Center 0.18 39.8 A 38.5 A 41.3 A 44.7 A 41.9 A 38.0 A 35.6 A 40.7 A 42.2 A 39.3 A
Willa Springs Center to Willa Springs Dr. 0.09
Willa Springs Dr. to Dodd Rd. 0.31 22.8 C 22.6 C 35.8 A 22.9 C 36.2 A 27.1 C 37.0 A 30.4 B 41.3 A 35.2 A 24.3 C 22.0 D 32.1 B 19.9 D 33.9 B 34.7 B 39.0 A 36.1 A 13.7 E 13.4 E
Dodd Rd. to Nodding Pines Way 0.28 33.2 B 40.9 A 41.6 A 44.1 A 39.2 A 39.5 A 35.7 A 40.0 A 41.0 A 28.0 C
Nodding Pines Way to Merivale Dr. 0.41 38.7 A 30.1 B 47.3 A 48.7 A 45.8 A 38.8 A 40.0 A 44.2 A 37.1 A 42.0 A
Merivale Dr. to Jericho Dr. 0.26 43.4 A 41.3 A 47.8 A 50.3 A 47.6 A 45.9 A 41.1 A 43.3 A 44.6 A 43.3 A
Jericho Dr. to Eagle Cr. 1.05 38.9 A 38.4 A 41.4 A 38.4 A 44.3 A 44.9 A 42.2 A 44.6 A 43.8 A 43.9 A 39.7 A 40.2 A 39.1 A 39.0 A 20.6 D 27.3 C 39.1 A 39.5 A 43.4 A 40.1 A
Eagle Cr. to Mark David Blvd. 0.25 40.0 A 35.7 A 42.7 A 42.2 A 43.6 A 40.0 A 38.5 A 42.9 A
Mark David Blvd.to Fire Station 0.24 44.3 A 40.2 A 39.5 A 32.7 B 34.3 B 40.0 A
Fire Station to Winter Park Dr. 0.12 3.0 F 3.0 F 3.9 F 9.6 F 10.3 F 4.5 F
Winter Park Dr. to SR 436 0.02 18.6 D 24.0 C 17.7 D 22.2 C 21.2 D 12.0 F 6.1 F 11.5 F 2.3 F 12.4 F 34.3 B 24.0 C 34.3 B 24.7 C 40.0 A 16.5 E
Average 31.8 B 30.4 B 29.3 B 27.9 C 30.3 B 29.9 B 29.9 B 26.0 C 32.9 B 25.8 C
Note: ** From 2009, additional control point has been considered on "Mikler Rd" the segment limits will be S. Mikler Rd to Citrus Rd. and the segment length will be 0.24 Mile
Note: *** From 2009, additional control point has been considered on "Mikler Rd" the segment limits will be Slavia Rd to Mikler Rd. and the segment length will be 0.32 Mile
UNDER CONSTRUCTION
UNDER CONSTRUCTION
UNDER CONSTRUCTION
UNDER CONSTRUCTION
Year 2013
Rdwy Segment Rdwy Section
Average Speed Average Speed
UNDER CONSTRUCTION
UNDER CONSTRUCTION
UNDER CONSTRUCTION
UNDER CONSTRUCTION
A45.5B31.1B 44.1
B
0.56 32.3
0.56 A41.2
TABLE C26.1bYear 2014 Seminole County Travel Time & Delay Study
Red Bug Lake Road - Westbound Direction Historical Summary
37.6 AB34.632.1
Average Speed Average SpeedAverage Speed Average Speed
Average Speed Average Speed Average Speed Average Speed Average Speed Average Speed
UNDER CONSTRUCTION
UNDER CONSTRUCTION
UNDER CONSTRUCTION
UNDER CONSTRUCTION
UNDER CONSTRUCTION
UNDER CONSTRUCTION
UNDER CONSTRUCTION
UNDER CONSTRUCTION
Average Speed Average Speed Average Speed Average Speed Average Speed
D-33 Red Bug Lake Road - WB
Roadway Distance
Segments (mile) (mph) LOS (mph) LOS (mph) LOS (mph) LOS (mph) LOS (mph) LOS (mph) LOS (mph) LOS (mph) LOS (mph) LOS (mph) LOS (mph) LOS (mph) LOS (mph) LOS (mph) LOS (mph) LOS (mph) LOS (mph) LOS (mph) LOS (mph) LOS
AM PEAK HOUR
Lake Mary Blvd. to Pine Circle Dr. 0.26 37.8 A 38.5 A 38.5 A 38.6 A 36.0 A 40.0 A 39.0 A 39.0 A 39.0 A 40.0 A
Pine Circle Dr. to Public Works* 0.14 48.2 A 47.5 A 31.1 B 18.3 D 20.7 D 29.0 B 22.0 D 18.3 D 22.7 C 23.3 C
Public Works to Anderson Ln.* 0.14 47.1 A 42.0 A 44.3 A 42.0 A 41.4 A 37.2 A 39.8 A 30.5 B 36.9 A 31.0 B 42.0 A 36.7 A 49.4 A 33.7 B 38.2 A 30.0 B 38.2 A 32.7 B 38.2 A 33.4 B
Anderson Ln. to Primera Blvd. 0.08 47.2 A 31.0 B 33.2 B 42.9 A 27.3 C 24.0 C 20.9 D 20.0 D 13.7 E 28.2 B
Primera Blvd. to Stromberg/Seimens Dr./Manderley Run 0.14 38.9 A 35.0 B 38.8 A 42.0 A 26.3 C 40.9 A 37.5 A 38.2 A 29.0 B 20.0 D
Stromberg/Seimens Dr./Manderley Run to Wallace Rd. 0.48 49.5 A 44.7 A 48.0 A 45.6 A 42.1 A 42.6 A 43.9 A 43.6 A 37.4 A 39.5 A
Wallace Rd. to Postal Dist. Ctr. 0.33 42.2 A 46.5 A 46.4 A 42.4 A 44.6 A 44.0 A 43.0 A 38.1 A 43.0 A 33.0 B
Postal Dist. Ctr. to Timacuan Blvd. 0.21 39.2 A 47.2 A 33.9 B 29.8 B 37.4 A 31.5 B 17.3 D 24.7 C 28.0 C 27.4 C
Timacuan Blvd. to CR 46A 0.30 16.5 E 33.4 B 19.1 D 34.7 B 19.3 D 34.6 B 15.0 E 30.8 B 23.6 C 33.9 B 15.7 E 30.1 B 22.8 C 30.0 B 15.4 E 27.8 C 20.9 D 29.1 B 12.5 F 24.2 C
CR 46A to Seminole Town Center 0.80 35.8 A 41.6 A 41.7 A 40.2 A 41.7 A 38.3 A 42.3 A 39.0 A 43.2 A 36.4 A
Seminole Town Center to SR 417 (S. Ramps) 0.48 33.2 B 39.4 A 41.2 A 30.0 B 41.2 A 41.5 A 39.7 A 38.8 A 38.6 A 40.8 A 32.7 B 36.4 A 36.5 A 40.4 A 29.4 B 33.4 B
SR 417 (S. Ramps) to SR 417 (N. Ramps) 0.22 19.3 D 16.7 E 16.7 E 16.5 E 22.6 C 21.0 D 28.1 B 22.4 C 28.1 B 32.2 B
SR 417 (N. Ramps) to ST. Johns Pkwy. 0.37 41.7 A 35.1 A 30.2 B 30.7 B 41.9 A 31.3 B 24.8 C 32.6 B 29.2 B 27.1 C
ST. Johns Pkwy. to SR 46 0.43 41.1 A 33.1 B 29.3 B 26.5 C 20.7 D 22.1 C 34.0 B 26.7 C 33.6 B 32.5 B 24.6 C 25.6 C 26.7 C 26.3 C 20.8 D 24.4 C 19.8 D 24.2 C 16.9 E 22.2 C
Average 34.7 B 34.4 B 32.3 B 30.9 B 35.0 A 31.6 B 31.9 B 29.1 B 30.6 B 26.7 C
PM PEAK HOUR
Lake Mary Blvd. to Pine Circle Dr. 0.26 39.3 A 38.9 A 38.5 A 40.5 A 34.8 B 40.0 A 38.0 A 39.0 A 39.0 A 41.1 A
Pine Circle Dr. to Public Works* 0.14 46.4 A 47.8 A 34.8 B 34.2 B 40.3 A 42.9 A 20.5 D 36.5 A 42.0 A 38.2 A
Public Works to Anderson Ln.* 0.14 40.2 A 41.3 A 45.6 A 42.8 A 42.9 A 38.7 A 44.8 A 39.9 A 41.4 A 37.6 A 40.0 A 40.7 A 49.4 A 32.4 B 38.2 A 38.1 A 38.2 A 39.5 A 40.0 A 40.0 A
Anderson Ln. to Primera Blvd. 0.08 15.1 E 36.5 A 25.8 C 18.2 D 41.1 A 25.3 C 17.8 D 10.7 F 9.6 F 14.1 E
Primera Blvd. to Stromberg/Seimens Dr./Manderley Run 0.14 27.8 C 44.8 A 38.9 A 28.7 B 26.1 C 40.9 A 21.4 D 38.2 A 33.6 B 30.0 B
Stromberg/Seimens Dr./Manderley Run to Wallace Rd. 0.48 37.7 A 45.0 A 45.2 A 41.9 A 33.4 B 36.7 A 34.2 B 37.9 A 35.1 A 38.4 A
Wallace Rd. to Postal Dist. Ctr. 0.33 35.9 A 37.6 A 40.6 A 30.7 B 40.4 A 30.5 B 24.4 C 26.8 C 16.0 E 31.4 B
Postal Dist. Ctr. to Timacuan Blvd. 0.21 32.0 B 37.6 A 23.4 C 19.8 D 22.2 C 13.7 E 11.7 F 11.2 F 8.0 F 13.4 E
Timacuan Blvd. to CR 46A 0.30 17.8 D 28.0 C 15.9 E 31.5 B 22.2 C 32.4 B 12.7 F 23.7 C 20.9 D 28.9 B 22.0 D 26.0 C 10.7 F 18.2 D 13.2 E 19.8 D 14.0 E 16.3 E 9.6 F 19.2 D
CR 46A to Seminole Town Center 0.80 42.7 A 34.9 B 33.7 B 36.8 A 32.1 B 38.0 A 39.5 A 36.6 A 41.7 A 40.7 A
Seminole Town Center to SR 417 (S. Ramps) 0.48 36.8 A 46.7 A 28.5 B 40.1 A 33.6 B 32.7 B 26.9 C 33.0 B 28.2 B 34.4 B 32.7 B 35.1 A 43.6 A 42.4 A 35.1 A 38.4 A
SR 417 (S. Ramps) to SR 417 (N. Ramps) 0.22 15.6 E 10.9 F 18.3 D 25.1 C 15.8 E 18.6 D 29.3 B 19.1 D 44.0 A 22.8 C
SR 417 (N. Ramps) to ST. Johns Pkwy. 0.37 30.8 B 20.6 D 31.2 B 30.2 B 38.2 A 18.5 D 19.5 D 17.2 D 39.6 A 36.4 A
ST. Johns Pkwy. to SR 46 0.43 28.7 B 24.8 C 19.7 D 17.0 D 27.3 C 25.7 C 19.5 D 23.8 C 27.6 C 26.0 C 24.6 C 20.6 D 26.7 C 24.0 C 18.3 D 18.1 D 19.4 D 27.9 C 22.4 C 26.2 C
Average 31.1 B 28.2 B 30.9 B 28.3 B 30.0 B 27.3 C 24.2 C 23.7 C 25.0 C 26.4 C
Roadway Distance
Segments (mile) (mph) LOS (mph) LOS (mph) LOS (mph) LOS (mph) LOS (mph) LOS (mph) LOS (mph) LOS (mph) LOS (mph) LOS (mph) LOS (mph) LOS (mph) LOS (mph) LOS (mph) LOS (mph) LOS (mph) LOS (mph) LOS (mph) LOS (mph) LOS
AM PEAK HOUR
SR 46 to ST. Johns Pkwy. 0.43 34.5 B 37.4 A 32.8 B 32.7 B 36.2 A 37.8 A 28.9 B 30.7 B 24.8 C 21.5 D
ST. Johns Pkwy. to SR 417 (N. Ramps) 0.37 24.6 C 21.5 D 22.8 C 26.8 C 35.2 A 26.0 C 20.2 D 27.4 C 33.1 B 30.8 B
SR 417 (N. Ramps) to SR 417 (S. Ramps) 0.22 37.0 A 37.6 A 35.8 A 35.3 A 42.7 A 37.0 A 40.0 A 32.8 B 33.0 B 25.6 C 40.0 A 30.9 B 37.7 A 29.7 B 40.0 A 27.2 C
SR 417 (S. Ramps) to Seminole Town Center 0.48 41.3 A 40.5 A 35.2 A 32.1 B 35.3 A 24.7 C 31.0 B 31.3 B 37.4 A 41.1 A
Seminole Town Center to CR 46A 0.80 21.2 D 27.8 C 23.7 C 28.6 B 27.1 C 29.2 B 28.6 B 30.2 B 22.9 C 26.3 C 29.1 B 27.3 C 23.8 C 26.0 C 23.3 C 25.8 C 32.0 B 33.8 B 22.5 C 27.1 C
CR 46A to Timacuan Blvd. 0.30 36.1 A 34.6 B 22.1 C 32.2 B 39.9 A 27.7 C 27.3 C 34.6 B 28.1 B 32.7 B
Timacuan Blvd. to Postal Dist. Ctr. 0.21 34.5 B 34.2 B 44.9 A 37.6 A 44.5 A 35.0 B 40.6 A 40.6 A 35.0 B 37.1 A
Postal Dist. Ctr. to Wallace Rd. 0.33 47.0 A 42.2 A 39.4 A 46.2 A 41.4 A 36.7 A 40.4 A 42.1 A 34.1 B 37.4 A
Wallace Rd. to Stromberg/Seimens Dr./Manderley Run 0.48 50.1 A 41.9 A 44.2 A 41.8 A 40.3 A 38.2 A 36.3 A 38.9 A 40.6 A 38.4 A
Stromberg/Seimens Dr./Manderley to Primera Blvd. 0.14 25.5 C 27.4 C 20.8 D 16.4 E 24.5 C 28.1 B 15.3 E 20.5 D 18.3 D 13.5 E
Primera Blvd. to Anderson Ln. 0.08 40.9 A 40.0 A 40.3 A 37.3 A 31.9 B 32.7 B 32.5 B 34.5 B 41.1 A 38.6 A 40.0 A 33.9 B 32.0 B 31.1 B 36.9 A 35.8 A 36.9 A 32.1 B 34.3 B 31.5 B
Anderson Ln. to Public Works* 0.14 34.2 B 43.9 A 42.7 A 29.2 B 38.1 A 24.0 C 44.2 A 23.3 C 32.3 B 28.0 C
Public Works to Pine Circle Dr.* 0.14 47.3 A 46.7 A 39.3 A 41.8 A 42.4 A 42.9 A 25.0 C 40.0 A 42.0 A 40.0 A
Pine Circle Dr. to Lake Mary Blvd. 0.26 12.2 F 19.6 D 17.6 D 26.1 C 24.7 C 31.4 B 11.6 F 18.1 D 23.2 C 29.9 B 11.8 F 17.6 D 9.3 F 14.8 E 10.4 F 15.7 E 9.8 F 15.8 E 12.6 F 18.5 D
Average 29.6 B 30.8 B 30.7 B 29.2 B 32.7 B 28.4 B 25.0 C 27.3 C 28.4 B 26.9 C
PM PEAK HOUR
SR 46 to ST. Johns Pkwy. 0.43 26.9 C 29.8 B 24.7 C 32.9 B 19.8 D 17.2 D 16.0 E 14.5 E 17.1 D 20.2 D
ST. Johns Pkwy. to SR 417 (N. Ramps) 0.37 22.6 C 19.3 D 23.6 C 13.6 E 22.3 C 18.6 D 17.4 D 20.2 D 30.4 B 37.6 A
SR 417 (N. Ramps) to SR 417 (S. Ramps) 0.22 36.2 A 34.4 B 27.8 C 37.9 A 38.0 A 23.1 C 30.0 B 19.6 D 37.7 A 19.0 D 40.0 A 19.1 D 42.6 A 24.0 C 42.6 A 28.1 B
SR 417 (S. Ramps) to Seminole Town Center 0.48 30.9 B 31.2 B 31.2 B 37.1 A 31.8 B 23.5 C 28.2 B 30.3 B 40.6 A 41.1 A
Seminole Town Center to CR 46A 0.80 28.3 B 28.0 C 25.8 C 26.6 C 22.7 C 25.1 C 28.7 B 26.5 C 29.7 B 30.5 B 26.6 C 25.3 C 22.6 C 24.4 C 24.0 C 26.0 C 19.9 D 24.6 C 19.1 D 23.9 C
CR 46A to Timacuan Blvd. 0.30 24.8 C 43.7 A 35.4 A 42.0 A 26.5 C 19.8 D 26.5 C 26.5 C 24.0 C 29.0 B
Timacuan Blvd. to Postal Dist. Ctr. 0.21 31.5 B 41.1 A 40.9 A 45.8 A 38.8 A 25.2 C 28.6 B 30.7 B 29.3 B 39.4 A
Postal Dist. Ctr. to Wallace Rd. 0.33 35.7 A 46.9 A 35.6 A 41.3 A 39.1 A 34.1 B 28.3 B 39.6 A 33.0 B 34.7 B
Wallace Rd. to Stromberg/Seimens Dr./Manderley Run 0.48 37.6 A 39.7 A 44.1 A 38.2 A 33.2 B 38.7 A 43.2 A 36.5 A 34.3 B 36.5 A
Stromberg/Seimens Dr./Manderley to Primera Blvd. 0.14 39.9 A 30.4 B 27.6 C 18.1 D 14.2 E 24.3 C 14.5 E 17.9 D 15.0 E 16.5 E
Primera Blvd. to Anderson Ln. 0.08 33.1 B 33.0 B 39.9 A 40.8 A 41.6 A 37.7 A 38.2 A 36.3 A 33.4 B 29.6 B 40.0 A 28.9 B 34.3 B 28.7 B 36.9 A 31.0 B 36.9 A 27.9 C 34.3 B 31.3 B
Anderson Ln. to Public Works* 0.14 48.4 A 42.7 A 36.7 A 41.9 A 44.2 A 42.0 A 49.4 A 32.3 B 42.0 A 36.5 A
Public Works to Pine Circle Dr.* 0.14 50.6 A 48.9 A 43.4 A 42.1 A 43.8 A 45.0 A 34.6 B 42.0 A 44.2 A 42.0 A
Pine Circle Dr. to Lake Mary Blvd. 0.26 15.4 E 24.5 C 13.7 E 21.8 D 12.2 F 19.5 D 15.1 E 23.1 C 18.6 D 26.7 C 13.1 E 20.8 D 10.1 F 16.8 E 8.3 F 13.8 E 9.9 F 16.5 E 8.0 F 13.7 E
Average 28.9 B 29.3 B 27.5 C 28.8 B 27.7 C 24.1 C 22.8 C 22.9 C 24.0 C 24.5 C
Note: * From 2008 the segment Public works is replaced by Crystal Lake Elementary School
Year 2013
Rdwy Segment Rdwy Section
Average Speed Average Speed
Year 2013
Rdwy Segment Rdwy Section
Average Speed Average Speed
TABLE C27.1aYear 2014 Seminole County Travel Time & Delay Study
Rinehart Road - Northbound Direction Historical Summary
TABLE C27.1b
Year 2014Year 2005 Year 2006 Year 2007 Year 2008 Year 2009 Year 2010 Year 2011
Average Speed Average Speed Average Speed Average Speed Average SpeedAverage Speed Average Speed Average Speed Average Speed Average Speed Average Speed
Year 2012
Rdwy Segment Rdwy Section
Average Speed Average Speed
Year 2012
Rdwy Segment Rdwy Section
Average Speed Average Speed
Rdwy Section
Year 2014
Year 2013 Seminole County Travel Time & Delay StudyRinehart Road - Southbound Direction Historical Summary
Segments (mile) (mph) LOS (mph) LOS (mph) LOS (mph) LOS (mph) LOS (mph) LOS (mph) LOS (mph) LOS (mph) LOS (mph) LOS (mph) LOS (mph) LOS (mph) LOS (mph) LOS (mph) LOS (mph) LOS (mph) LOS (mph) LOS (mph) LOS (mph) LOS
AM PEAK HOUR
Lime Dr. to Burlington Dr. 0.11 - - - - - - - - - - - - 26.7 B 25.7 B 31.3 A 25.7 B
Burlington Dr. to Wekiva Cove Rd. 0.30 - - - - - - - - - - - - 28.9 B 31.8 A 35.5 A 33.2 A
Wekiva Cove Rd. to Hunt Club Blvd. 0.15 - - - - - - - - - - - - - - - - - - - - - - - - 11.2 E 18.2 C 9.1 F 16.4 D 12.9 E 21.5 C 9.1 F 16.6 D
Hunt Club Blvd. to W. Lake Brantley Rd. 0.84 29.2 B 29.0 B 30.2 A 30.2 A 23.3 C 29.5 B 25.9 B 27.6 B 25.4 B 28.7 B
W. Lake Brantley Rd. (W) to W. Lake Brantley Rd. (E) 0.27 18.5 C 15.9 D 23.3 C 19.7 C 26.9 B 22.0 C 23.0 C 19.5 C 26.4 B 20.0 C 24.3 B 22.0 C 26.0 B 22.6 C 24.7 B 13.8 E 22.9 C
W. Lake Brantley Rd. (E) to Classic Dr. 0.33 20.8 C 19.1 C 14.9 D 33.8 A 19.0 C 17.9 D 15.5 D 15.2 D 20.9 C 18.6 C
Classic Dr. to Elem. Sch. 0.07 10.1 E 7.8 F 8.9 F 9.8 F 11.4 E 26.2 B 22.1 C 24.7 B 8.1 F 7.2 F
Elem. Sch. to High Sch. Ent./Exit 0.23 17.5 D 21.8 C 27.7 B 25.3 B 25.3 B 23.2 C 27.7 B 16.6 D 14.0 E 30.6 A
High Sch. Ent./Exit to SR 434 0.11 3.5 F 16.3 D 4.3 F 16.6 D 4.3 F 17.4 D 4.0 F 12.8 E 4.2 F 11.9 E 3.6 F 11.3 E 7.2 F 15.0 D 6.7 F 13.1 E 5.3 F 11.5 E 4.9 F 12.4 E
Average 16.3 D 16.6 D 17.4 D 18.6 C 16.7 D 17.2 D 19.2 C 18.1 C 17.8 D 17.0 D
PM PEAK HOUR
Lime Dr. to Burlington Dr. 0.11 - - - - - - - - - - - - 31.3 A 21.8 C 28.8 B 27.7 B
Burlington Dr. to Wekiva Cove Rd. 0.30 - - - - - - - - - - - - 33.2 A 31.8 A 35.5 A 33.2 A
Wekiva Cove Rd. to Hunt Club Blvd. 0.15 - - - - - - - - - - - - - - - - - - - - - - - - 7.3 F 14.6 D 6.5 F 12.9 E 15.6 D 23.6 C 12.6 E 20.5 C
Hunt Club Blvd. to W. Lake Brantley Rd. 0.84 34.5 A 35.8 A 37.1 A 36.6 A 34.6 A 34.9 A 31.5 A 31.5 A 29.2 B 31.7 A
W. Lake Brantley Rd. (W) to W. Lake Brantley Rd. (E) 0.27 27.0 B 23.4 C 33.9 A 24.4 B 32.8 A 26.0 B 32.2 A 21.7 C 30.5 A 23.6 C 29.2 B 20.5 C 28.0 B 23.3 C 27.5 B 16.8 D 26.2 B
W. Lake Brantley Rd. (E) to Classic Dr. 0.33 29.7 B 36.2 A 34.4 A 35.1 A 34.4 A 31.5 A 32.1 A 31.5 A 33.2 A 31.5 A
Classic Dr. to Elem. Sch. 0.07 7.6 F 15.0 D 12.7 E 23.3 C 35.0 A 9.5 F 12.4 E 14.5 D 17.5 D 24.7 B
Elem. Sch. to High Sch. Ent./Exit 0.23 29.6 B 32.5 A 32.7 A 31.3 A 34.3 A 20.6 C 30.0 B 28.8 B 30.6 A 29.4 B
High Sch. Ent./Exit to SR 434 0.11 6.2 F 22.8 C 4.8 F 22.5 C 4.3 F 22.6 C 4.0 F 14.5 D 3.6 F 14.0 E 5.6 F 14.4 D 5.9 F 16.5 D 5.9 F 16.7 D 5.9 F 17.4 D 5.8 F 17.4 D
Average 22.8 C 22.5 C 22.6 C 21.7 C 21.1 C 21.1 C 19.8 C 18.8 C 22.6 C 21.5 C
Roadway Distance
Segments (mile) (mph) LOS (mph) LOS (mph) LOS (mph) LOS (mph) LOS (mph) LOS (mph) LOS (mph) LOS (mph) LOS (mph) LOS (mph) LOS (mph) LOS (mph) LOS (mph) LOS (mph) LOS (mph) LOS (mph) LOS (mph) LOS (mph) LOS (mph) LOS
AM PEAK HOUR
SR 434 to High Sch. Ent./Exit 0.13 17.6 D 11.6 E 11.0 E 21.1 C 21.1 C 16.2 D 14.7 D 18.6 C 14.7 D 21.7 C
High Sch. Ent./Exit to Elem. Sch. 0.21 29.1 B 22.7 C 28.8 B 26.7 B 34.3 A 27.7 B 19.7 C 16.7 D 26.2 B 26.7 B
Elem. Sch. to Classic Dr. 0.09 29.4 B 34.9 A 32.3 A 35.0 A 35.0 A 35.0 A 32.3 A 32.3 A 35.0 A 26.2 B
Classic Dr. to W. lake Brantley Rd. (E) 0.31 26.7 B 29.0 B 28.2 B 33.2 A 28.3 B 33.2 A 30.6 A 32.1 A 26.5 B 23.5 C 20.6 C 25.5 B 21.0 C 23.2 C 22.5 C 33.8 A 27.9 B
W. Lake Brantley Rd. (E) to W. lake Brantley Rd. (W) 0.26 19.0 C 26.4 B 20.3 C 24.0 C 30.0 B 24.4 B 21.1 C 26.0 B 20.8 C 24.4 B
W. Lake Brantley Rd. (W) to Hunt Club Blvd. 0.84 20.9 C 22.1 C 21.7 C 22.3 C 23.5 C 22.6 C 24.1 B 24.1 B 23.7 C 24.9 B 31.3 A 29.3 B 19.7 C 20.0 C 19.2 C 20.4 C 20.5 C 20.5 C 19.3 C 20.3 C
Hunt Club Blvd. to Wekiva Cove Rd. 0.17 - - - - - - - - - - - - 30.0 B 31.5 A 35.0 A 34.1 A
Wekiva Cove Rd. to Burlington Dr. 0.30 - - - - - - - - - - - - 30.6 A 29.4 B 33.9 A 35.5 A
Burlington Dr. to Lime Dr. 0.11 - - - - - - - - - - - - - - - - - - - - - - - - 22.5 C 28.3 B 23.2 C 28.5 B 22.5 C 31.1 A 23.2 C 31.6 A
Average 22.1 C 22.3 C 22.6 C 25.6 B 26.9 B 28.1 B 21.7 C 22.1 C 23.0 C 24.4 B
PM PEAK HOUR
SR 434 to High Sch. Ent./Exit 0.13 19.4 C 17.2 D 24.4 B 25.2 B 26.9 B 21.1 C 21.7 C 17.3 D 16.6 D 13.4 E
High Sch. Ent./Exit to Elem. Sch. 0.21 21.3 C 19.5 C 25.3 B 29.4 B 32.0 A 28.2 B 23.6 C 17.1 D 19.7 C 23.2 C
Elem. Sch. to Classic Dr. 0.09 20.0 C 30.9 A 35.0 A 38.2 A 38.2 A 32.3 A 35.0 A 30.0 B 28.0 B 32.3 A
Classic Dr. to W. lake Brantley Rd. (E) 0.31 27.8 B 27.8 B 27.0 B 32.1 A 30.2 A 27.8 B 29.6 B 27.0 B 26.5 B 20.0 C 22.3 C 24.2 B 20.5 C 25.8 B 21.7 C 27.0 B 22.3 C
W. Lake Brantley Rd. (E) to W. lake Brantley Rd. (W) 0.26 29.4 B 24.6 B 23.3 C 27.4 B 22.9 C 22.3 C 14.7 D 26.4 B 28.4 B 20.0 C
W. Lake Brantley Rd. (W) to Hunt Club Blvd. 0.84 21.4 C 22.9 C 22.2 C 22.7 C 24.1 B 24.9 B 27.7 B 27.7 B 24.8 B 24.3 B 21.3 C 21.5 C 20.3 C 18.7 C 25.9 B 26.0 B 19.5 C 21.0 C 20.6 C 20.4 C
Hunt Club Blvd. to Wekiva Cove Rd. 0.17 - - - - - - - - - - - - 31.5 A 32.3 A 34.1 A 32.3 A
Wekiva Cove Rd. to Burlington Dr. 0.30 - - - - - - - - - - - - 32.5 A 33.2 A 34.7 A 34.7 A
Burlington Dr. to Lime Dr. 0.11 - - - - - - - - - - - - - - - - - - - - - - - - 24.0 C 30.0 B 26.7 B 31.3 A 24.8 B 31.9 A 22.5 C 30.5 A
Average 22.9 C 22.7 C 24.9 B 28.6 B 26.2 B 23.3 C 21.7 C 25.0 B 23.1 C 22.8 C
Rdwy Segment Rdwy Section
Average Speed Average Speed
Year 2013
Rdwy Segment Rdwy Section
Average Speed Average Speed
TABLE C28.1aYear 2014 Seminole County Travel Time & Delay Study
Sand Lake Road - Eastbound Direction Historical Summary
Year 2014Year 2005 Year 2006 Year 2007 Year 2008 Year 2009 Year 2010 Year 2011 Year 2013
Average Speed Average Speed Average Speed Average Speed Average Speed
Rdwy Section Rdwy Segment Rdwy Section
Average Speed Average Speed Average Speed Average Speed Average Speed Average Speed Average Speed Average Speed Average Speed Average Speed Average Speed
Average Speed Average Speed Average Speed Average Speed Average SpeedAverage Speed Average Speed Average Speed Average Speed Average Speed Average Speed Average Speed Average Speed
Year 2012
Rdwy Segment Rdwy Section
Average Speed Average Speed
Year 2012
Rdwy Segment Rdwy Section
Average Speed Average Speed
Rdwy Section
Year 2014
TABLE C28.1bYear 2014 Seminole County Travel Time & Delay Study
Sand Lake Road - Westbound Direction Historical Summary
Average Speed Average Speed Average Speed
Rdwy Section Rdwy Segment Rdwy Section
D-35 Sand Lake Road
Roadway Distance Distance
Segments (mile) (ft) (mph) LOS (mph) LOS (mph) LOS (mph) LOS (mph) LOS (mph) LOS (mph) LOS (mph) LOS (mph) LOS (mph) LOS (mph) LOS (mph) LOS (mph) LOS (mph) LOS (mph) LOS (mph) LOS (mph) LOS (mph) LOS (mph) LOS (mph) LOS
AM PEAK HOUR
Lake Mary Blvd. to Sanora Blvd. 0.49 2,604 39.5 A 40.5 A 35.4 A 33.8 B 40.3 A 38.2 A 39.7 A 39.7 A 41.7 A 40.0 A
Sanora Blvd. to Airport Blvd. 0.27 1,438 28.1 B 34.5 B 32.6 B 36.9 A 31.1 B 33.7 B 29.5 B 32.1 B 29.0 B 35.2 A 38.7 A 38.4 A 26.8 C 33.7 B 24.5 C 32.3 B 30.5 B 36.7 A 29.5 B 35.3 A
Airport Blvd. to 27th St. 0.51 2,693 41.6 A 40.5 A 43.7 A 41.9 A 42.5 A 38.2 A 36.9 A 39.2 A 38.7 A 36.4 A
27th St. to 25th Pl. 0.40 2,105 41.6 A 41.9 A 43.6 A 43.6 A 41.4 A 38.1 A 36.9 A 40.7 A 42.1 A 36.4 A
25th Pl. to SR 46 0.14 746 13.7 E 33.1 B 12.5 F 31.3 B 19.1 D 37.0 A 9.9 F 29.0 B 12.2 F 31.2 B 21.4 D 34.4 B 8.9 F 25.5 C 7.4 F 24.7 C 9.7 F 27.8 C 9.2 F 25.6 C
SR 46 to 20th St. 0.50 2,640 - - - - - - - - - - - - - - - - - - - - - - - - - - - - - - - - 23.1 C 23.1 C
Celery Ave. to 6th St. 0.41 2,165 - - - - - - - - - - - - - - - - - - - - - - - - - - - - - - - - 30.0 B 20.4 C 30.4 A 20.8 C
6th St. to 1st St. 0.31 1,637 - - - - - - - - - - - - - - - - - - - - - - - - - - - - - - - - 23.2 B 23.2 B 12.0 D 12.0 D
Average 33.6 B 33.5 B 35.5 A 30.2 B 32.8 B 36.0 A 28.5 B 27.4 C 25.1 C 22.6 C
PM PEAK HOUR
Lake Mary Blvd. to Sanora Blvd. 0.49 2,604 42.2 A 39.7 A 23.5 C 35.9 A 41.4 A 38.2 A 41.4 A 40.8 A 42.4 A 39.5 A
Sanora Blvd. to Airport Blvd. 0.27 1,438 23.3 C 32.9 B 27.6 C 34.2 B 39.5 A 27.7 C 19.3 D 27.2 C 34.8 B 38.7 A 24.9 C 31.8 B 35.5 A 39.0 A 34.8 B 38.4 A 19.1 D 29.1 B 34.1 B 37.3 A
Airport Blvd. to 27th St. 0.51 2,693 34.2 B 41.0 A 39.7 A 39.7 A 43.1 A 38.7 A 36.9 A 39.7 A 39.7 A 37.3 A
27th St. to 25th Pl. 0.40 2,105 47.6 A 43.6 A 40.0 A 42.9 A 42.1 A 38.7 A 37.5 A 38.1 A 42.1 A 36.9 A
25th Pl. to SR 46 0.14 746 8.6 F 26.9 C 10.0 F 28.9 B 8.0 F 25.5 C 10.2 F 28.8 B 12.0 F 31.3 B 18.4 D 33.5 B 12.9 F 29.3 B 10.8 F 28.5 B 6.2 F 22.9 C 10.0 F 26.8 C
SR 46 to 20th St. 0.50 2,640 - - - - - - - - - - - - - - - - - - - - - - - - - - - - - - - - 27.3 B 21.4 C
Celery Ave. to 6th St. 0.41 2,165 - - - - - - - - - - - - - - - - - - - - - - - - - - - - - - - - 31.9 A 22.1 C 26.7 B 20.7 C
6th St. to 1st St. 0.31 1,637 - - - - - - - - - - - - - - - - - - - - - - - - - - - - - - - - 18.8 C 18.8 C 13.4 C 13.4 C
Average 29.2 B 31.0 B 26.4 C 28.1 B 34.1 B 32.8 B 32.8 B 32.0 B 23.2 C 23.5 C
Roadway Distance Distance
Segments (mile) (ft) (mph) LOS (mph) LOS (mph) LOS (mph) LOS (mph) LOS (mph) LOS (mph) LOS (mph) LOS (mph) LOS (mph) LOS (mph) LOS (mph) LOS (mph) LOS (mph) LOS (mph) LOS (mph) LOS (mph) LOS (mph) LOS (mph) LOS (mph) LOS
AM PEAK HOUR
1st St. to 6th St. 0.31 1,637 - - - - - - - - - - - - - - - - - - - - - - - - - - - - - - - - 25.1 A 25.1 A 15.2 C 15.2 C
20th St. to SR 46 0.50 2,640 - - - - - - - - - - - - - - - - - - - - - - - - - - - - - - - - 14.1 D 17.9 D 15.5 D 20.2 C
SR 46 to 25th Pl. 0.16 848 29.8 B 31.8 B 31.0 B 33.3 B 33.3 B 33.3 B 31.0 B 34.6 B 33.3 B 32.1 B
25th Pl. to 27th St. 0.40 2,102 42.1 A 45.4 A 44.4 A 42.1 A 42.1 A 37.5 A 37.5 A 38.1 A 41.4 A 35.8 A
27th St. to Airport Blvd. 0.49 2,600 26.5 C 31.4 B 31.0 B 35.3 A 34.4 B 37.0 A 29.4 B 33.8 B 28.6 B 33.3 B 30.6 B 33.3 B 34.0 B 34.8 B 32.6 B 34.8 B 26.4 C 31.6 B 24.3 C 28.8 B
Airport Blvd. to Sanora Blvd. 0.29 1,528 38.1 A 41.5 A 43.5 A 43.5 A 43.5 A 41.4 A 41.4 A 40.5 A 42.4 A 38.7 A
Sanora Blvd. to Lake Mary Blvd. 0.47 2,461 30.7 B 33.2 B 35.5 A 37.4 A 29.1 B 33.2 B 19.5 D 24.5 C 19.3 D 24.4 C 22.8 C 27.4 C 20.9 D 25.6 C 27.2 C 31.0 B 20.1 D 25.1 C 19.3 D 23.8 C
Average 32.2 B 36.2 A 35.3 A 29.1 B 28.8 B 30.5 B 30.2 B 33.1 B 22.9 C 22.3 C
PM PEAK HOUR
1st St. to 6th St. 0.31 1,637 - - - - - - - - - - - - - - - - - - - - - - - - - - - - - - - - 24.8 B 24.8 B 17.1 C 17.1 C
20th St. to SR 46 0.50 2,640 - - - - - - - - - - - - - - - - - - - - - - - - - - - - - - - - 13.5 E 17.6 D 14.2 D 17.5 D
SR 46 to 25th Pl. 0.16 848 32.3 B 31.7 B 32.1 B 33.3 B 33.3 B 34.6 B 29.0 B 33.3 B 34.6 B 33.3 B
25th Pl. to 27th St. 0.40 2,102 46.0 A 42.8 A 42.9 A 42.1 A 42.9 A 38.7 A 36.4 A 38.7 A 40.7 A 38.1 A
27th St. to Airport Blvd. 0.49 2,600 29.8 B 34.8 B 40.7 A 39.7 A 28.3 B 33.1 B 22.5 C 28.9 B 32.6 B 35.9 A 28.3 B 32.4 B 26.6 C 30.0 B 30.9 B 33.8 B 25.5 C 31.0 B 30.6 B 33.5 B
Airport Blvd. to Sanora Blvd. 0.29 1,528 42.5 A 43.8 A 42.4 A 41.4 A 42.4 A 41.4 A 39.5 A 38.7 A 40.5 A 41.4 A
Sanora Blvd. to Lake Mary Blvd. 0.47 2,461 27.6 C 32.1 B 24.4 C 29.2 B 19.6 D 24.5 C 33.0 B 35.7 A 19.9 D 24.8 C 33.4 B 36.0 A 22.4 C 26.7 C 23.7 C 27.7 C 36.5 A 37.9 A 22.0 D 26.7 C
Average 33.6 B 34.5 B 28.8 B 31.5 B 30.2 B 33.9 B 28.5 B 30.9 B 24.1 C 22.3 C
Rdwy Segment Rdwy Section
Average Speed Average Speed
Year 2013
Rdwy Segment Rdwy Section
Average Speed Average Speed
TABLE C29.1aYear 2014 Seminole County Travel Time & Delay Study
Sanford Avenue - Northbound Direction Historical Summary
Year 2014Year 2005 Year 2006 Year 2007 Year 2008 Year 2009 Year 2010 Year 2011 Year 2013
Average Speed Average Speed Average Speed Average Speed Average Speed
Rdwy Section Rdwy Segment Rdwy Section
Average Speed Average Speed Average Speed Average Speed Average Speed Average Speed Average Speed Average Speed Average Speed Average Speed Average Speed
Average Speed Average Speed Average Speed Average Speed Average SpeedAverage Speed Average Speed Average Speed Average Speed Average Speed Average Speed Average Speed Average Speed
Year 2012
Rdwy Segment Rdwy Section
Average Speed Average Speed
Year 2012
Rdwy Segment Rdwy Section
Average Speed Average Speed
Rdwy Section
Year 2014
TABLE C29.1bYear 2014 Seminole County Travel Time & Delay Study
Sanford Avenue - Southbound Direction Historical Summary
Average Speed Average Speed Average Speed
Rdwy Section Rdwy Segment Rdwy Section
D-36 Sanford Avenue
Roadway Distance
Segments (mile) (mph) LOS (mph) LOS (mph) LOS (mph) LOS (mph) LOS (mph) LOS (mph) LOS (mph) LOS (mph) LOS (mph) LOS (mph) LOS (mph) LOS (mph) LOS (mph) LOS (mph) LOS (mph) LOS (mph) LOS (mph) LOS (mph) LOS (mph) LOS
AM PEAK HOUR
SR 426/Aloma Ave. to Trail Crossing* 0.74 36.2 A 38.2 A 18.8 D 30.2 B 29.8 B 24.0 C 28.8 B 26.7 C 28.8 B 34.3 B
Trail Crossing to Gabriella Ln. 38.1 A 41.9 A 45.9 A 41.1 A 39.4 A 38.2 A 40.6 A 39.4 A
Gabriella Ln. to Dike Rd. 0.50 32.3 B 34.5 B 35.5 A 37.1 A 36.0 A 34.5 B 35.3 A 37.9 A 37.1 A 40.2 A 35.0 B 36.1 A 31.2 B 34.6 B 29.7 B 33.0 B 30.3 B 34.6 B 28.0 B 33.5 B
Dike Rd. to Red Bug Lake Rd. 0.78 25.7 C 25.7 C 29.4 B 29.4 B 30.3 B 30.3 B 30.1 B 30.1 B 28.0 C 28.0 C 22.8 C 22.8 C 20.9 D 20.9 D 16.8 E 16.8 E 19.6 D 19.6 D 19.5 D 19.5 D
Red Bug Lake Rd. to Eagle Blvd. 0.83 41.3 A 40.1 A 33.3 B 40.6 A 36.0 A 37.3 A 39.8 A 40.2 A 39.8 A 36.3 A
Eagle Blvd. to E. Lake Dr. 0.32 36.0 A 39.7 A 33.2 B 38.0 A 44.3 A 35.7 A 36.3 A 39.3 A 41.8 A 37.3 A 35.1 A 36.6 A 39.6 A 39.8 A 41.3 A 40.5 A 35.8 A 38.6 A 36.5 A 36.4 A
E. Lake Dr. to Dyson Dr. 0.10 37.5 A 31.9 B 27.6 C 31.0 B 21.7 D 26.1 C 20.7 D 42.9 A 37.5 A 28.6 B
Dyson Dr. to Winter Springs Blvd. 0.89 30.2 B 30.8 B 38.2 A 37.4 A 33.3 B 32.7 B 39.8 A 38.7 A 42.2 A 38.6 A 35.2 A 34.0 B 38.1 A 35.1 A 35.6 A 36.2 A 38.4 A 38.3 A 31.2 B 30.9 B
Winter Springs Blvd. to Trotwood Blvd. 0.67 27.5 C 24.8 C 23.5 C 27.0 C 37.0 A 28.1 B 34.1 B 33.8 B 23.0 C 25.6 C
Trotwood Blvd. to SR 434 0.86 18.2 D 21.4 D 18.5 D 20.8 D 17.5 D 19.7 D 28.2 B 27.6 C 28.9 B 32.0 B 17.2 D 20.7 D 19.4 D 23.9 C 28.5 B 30.6 B 36.3 A 29.0 B 22.7 C 23.9 C
Average 28.6 B 30.0 B 28.2 B 33.7 B 35.0 B 28.0 B 29.3 B 30.0 B 30.9 B 27.8 C
PM PEAK HOUR
SR 426/Aloma Ave. to Trail Crossing* 0.74 41.0 A 41.7 A 31.2 B 19.3 D 29.2 B 28.8 B 14.4 E 25.7 C 15.7 E 28.8 B
Trail Crossing to Gabriella Ln. 43.6 A 45.5 A 42.2 A 39.8 A 43.0 A 38.6 A 38.6 A 36.7 A
Gabriella Ln. to Dike Rd. 0.50 37.2 A 39.4 A 37.9 A 40.1 A 26.4 C 33.7 B 37.0 A 38.1 A 25.5 C 32.5 B 30.6 B 34.4 B 26.3 C 29.8 B 36.1 A 35.9 A 33.3 B 32.1 B 34.1 B 34.7 B
Dike Rd. to Red Bug Lake Rd. 0.78 22.1 C 22.1 C 17.9 D 17.9 D 19.8 D 19.8 D 19.3 D 19.3 D 16.7 E 16.7 E 22.9 C 22.9 C 23.6 C 23.6 C 20.4 D 20.4 D 21.6 D 21.6 D 22.3 C 22.3 C
Red Bug Lake Rd. to Eagle Blvd. 0.83 36.6 A 32.9 B 37.8 A 39.5 A 36.6 A 39.4 A 36.1 A 43.3 A 36.9 A 35.3 A
Eagle Blvd. to E. Lake Dr. 0.32 40.6 A 37.6 A 37.7 A 34.1 B 33.3 B 36.5 A 33.9 B 37.8 A 30.7 B 34.8 B 29.1 B 35.9 A 38.7 A 36.8 A 36.5 A 41.2 A 33.2 B 35.8 A 29.1 B 33.4 B
E. Lake Dr. to Dyson Dr. 0.10 43.6 A 29.3 B 38.4 A 40.8 A 36.0 A 37.5 A 42.9 A 28.6 B 22.2 C 28.6 B
Dyson Dr. to Winter Springs Blvd. 0.89 40.6 A 40.9 A 45.3 A 43.1 A 41.4 A 41.1 A 39.2 A 39.3 A 42.3 A 41.6 A 40.0 A 39.7 A 34.5 B 35.1 A 45.3 A 42.7 A 33.4 B 31.8 B 30.9 B 30.6 B
Winter Springs Blvd. to Trotwood Blvd. 0.67 37.9 A 35.7 A 33.9 B 43.4 A 39.1 A 42.3 A 35.6 A 45.7 A 30.2 B 36.5 A
Trotwood Blvd. to SR 434 0.86 23.8 C 28.5 B 28.3 B 31.2 B 22.4 C 26.4 C 27.5 C 32.8 B 32.3 B 35.0 A 25.5 C 30.9 B 26.5 C 29.8 B 17.0 E 23.4 C 35.6 A 33.0 B 18.0 D 23.2 C
Average 32.5 B 31.6 B 30.0 B 32.5 B 30.8 B 32.2 B 30.7 B 30.1 B 30.8 B 28.0 C
Note: * The distance, 0.74 mile, is from SR 426 (Aloma Av) to Gabriella Ln
Roadway Distance
Segments (mile) (mph) LOS (mph) LOS (mph) LOS (mph) LOS (mph) LOS (mph) LOS (mph) LOS (mph) LOS (mph) LOS (mph) LOS (mph) LOS (mph) LOS (mph) LOS (mph) LOS (mph) LOS (mph) LOS (mph) LOS (mph) LOS (mph) LOS (mph) LOS
AM PEAK HOUR
SR 434 to Trotwood Blvd. 0.86 23.8 C 19.5 D 24.7 C 23.0 C 29.0 B 34.5 B 26.7 C 34.6 B 28.4 B 25.2 C
Trotwood Blvd. to Winter Springs Blvd. 0.67 33.9 B 27.4 C 25.9 C 21.9 D 38.5 A 29.4 B 32.7 B 26.5 C 36.5 A 31.8 B 36.2 A 35.2 A 28.5 B 27.5 C 37.9 A 36.0 A 33.5 B 30.4 B 34.7 B 28.6 B
Winter Springs Blvd. to Dyson Dr. 0.89 36.7 A 39.7 A 34.2 B 37.4 A 42.7 A 37.7 A 38.7 A 37.9 A 33.6 B 40.5 A
Dyson Dr. to E. Lake Dr. 0.10 20.7 D 34.2 B 17.0 E 35.2 A 13.4 E 29.8 B 10.4 F 30.1 B 16.7 E 37.3 A 16.7 E 33.4 B 16.7 E 34.1 B 10.7 F 30.2 B 11.8 F 28.3 B 12.5 F 33.0 B
E. Lake Dr. to Eagle Blvd. 0.31 29.3 B 29.8 B 38.0 A 38.1 A 33.3 B 25.8 C 30.5 B 25.1 C 24.8 C 27.0 C
Eagle Blvd. to Red Bug Lake Rd. 0.84 18.1 D 20.3 D 19.6 D 21.7 D 15.4 E 18.4 D 31.0 B 32.7 B 26.0 C 27.7 C 27.5 C 27.0 C 16.0 E 18.4 D 26.6 C 26.2 C 17.2 D 18.8 D 20.3 D 21.8 D
Red Bug Lake Rd. to Dike Rd. 0.77 42.4 A 42.4 A 40.4 A 40.4 A 35.6 A 35.6 A 36.0 A 36.0 A 34.7 B 34.7 B 38.7 A 38.7 A 35.2 A 35.2 A 32.7 B 32.7 B 33.4 B 33.4 B 27.9 C 27.9 C
Dike Rd. to Gabriella Ln. 0.50 33.1 B 31.8 B 33.4 B 33.0 B 31.8 B 29.1 B 36.1 A 26.1 C 25.9 C 30.3 B
Gabriella Ln. to Trail Crossing 31.1 B 23.8 C 42.1 A 39.8 A 40.2 A 39.4 A 39.8 A 40.6 A
Trail Crossing. to SR 426/Aloma Ave.* 0.76 16.5 E 20.7 D 23.1 C 26.0 C 7.8 F 26.2 C 6.3 F 22.3 C 4.5 F 24.9 C 4.6 F 21.1 D 4.7 F 22.7 C 5.5 F 21.9 D 16.4 E 29.4 B 6.4 F 24.7 C
Average 25.9 C 26.1 C 26.3 C 28.0 B 30.2 B 29.2 B 25.4 C 28.5 B 26.9 C 26.5 C
PM PEAK HOUR
SR 434 to Trotwood Blvd. 0.86 35.8 A 41.9 A 35.9 A 35.3 A 35.0 B 37.2 A 32.7 B 38.8 A 32.5 B 35.6 A
Trotwood Blvd. to Winter Springs Blvd. 0.67 31.9 B 34.0 B 32.0 B 36.9 A 36.9 A 36.3 A 38.7 A 36.7 A 39.3 A 36.7 A 40.6 A 38.6 A 32.7 B 32.7 B 34.7 B 36.9 A 35.9 A 33.9 B 31.7 B 33.7 B
Winter Springs Blvd. to Dyson Dr. 0.89 43.2 A 40.9 A 41.3 A 42.0 A 44.9 A 41.9 A 41.1 A 42.7 A 39.0 A 37.3 A
Dyson Dr. to E. Lake Dr. 0.10 12.0 F 34.6 B 11.2 F 32.3 B 14.8 E 35.3 A 12.7 F 34.6 B 9.9 F 33.8 B 18.2 D 37.0 A 13.0 E 33.7 B 16.7 E 36.9 A 16.2 E 34.1 B 13.0 E 31.4 B
E. Lake Dr. to Eagle Blvd. 0.31 23.0 C 30.4 B 25.9 C 32.6 B 42.0 A 36.5 A 32.1 B 37.2 A 33.8 B 35.1 A
Eagle Blvd. to Red Bug Lake Rd. 0.84 33.2 B 29.6 B 22.0 C 23.9 C 22.0 C 22.9 C 23.3 C 25.3 C 19.5 D 23.0 C 23.0 C 25.6 C 18.2 D 20.7 D 23.9 C 26.5 C 22.7 C 25.0 C 23.4 C 25.7 C
Red Bug Lake Rd. to Dike Rd. 0.77 32.5 B 32.5 B 29.1 B 29.1 B 35.3 A 35.3 A 28.8 B 28.8 B 34.3 B 34.3 B 29.2 B 29.2 B 35.2 A 35.2 A 27.5 C 27.5 C 30.0 B 30.0 B 34.7 B 34.7 B
Dike Rd. to Gabriella Ln. 0.50 43.9 A 40.2 A 32.6 B 42.5 A 41.9 A 40.8 A 33.0 B 37.0 A 32.6 B 40.0 A
Gabriella Ln. to Trail Crossing 44.4 A 44.6 A 43.7 A 42.0 A 42.5 A 41.5 A 39.0 A 41.1 A
Trail Crossing. to SR 426/Aloma Ave.* 0.76 25.4 C 30.6 B 24.4 C 29.0 B 7.0 F 29.7 B 3.3 F 24.0 C 5.2 F 29.4 B 7.9 F 29.4 B 5.1 F 23.3 C 4.7 F 23.1 C 8.9 F 27.8 C 6.7 F 27.4 C
Average 32.1 B 30.0 B 30.9 B 29.2 B 30.6 B 31.6 B 27.5 C 29.4 B 29.8 B 30.1 B
Note: * The distance, 0.76 mile, is from Gabriella Ln to SR 426/Aloma Ave.
Year 2013
Rdwy Segment Rdwy Section
Average Speed Average Speed
Year 2013
Rdwy Segment Rdwy Section
Average Speed Average Speed
TABLE C30.1aYear 2014 Seminole County Travel Time & Delay Study
Tuskawilla Road - Northbound Direction Historical Summary
TABLE C30.1b
Year 2014Year 2005 Year 2006 Year 2007 Year 2008 Year 2009 Year 2010 Year 2011
Average Speed Average Speed Average Speed Average Speed Average SpeedAverage Speed Average Speed Average Speed Average Speed Average Speed Average Speed
Year 2012
Rdwy Segment Rdwy Section
Average Speed Average Speed
Year 2012
Rdwy Segment Rdwy Section
Average Speed Average Speed
Rdwy Section
Year 2014
Year 2014 Seminole County Travel Time & Delay StudyTuskawilla Road - Southbound Direction Historical Summary
Segments (mile) (mph) LOS (mph) LOS (mph) LOS (mph) LOS (mph) LOS (mph) LOS (mph) LOS (mph) LOS (mph) LOS (mph) LOS (mph) LOS (mph) LOS (mph) LOS (mph) LOS (mph) LOS (mph) LOS (mph) LOS (mph) LOS (mph) LOS (mph) LOS
AM PEAK HOUR
Orange County Line to Hunt Club Blvd. 0.90 - - - - - - - - - - - - - - - - - - - - - - - - 29.5 B 29.5 B 25.8 C 25.8 C 31.4 B 31.4 B 31.6 B 31.6 B
Hunt Club Blvd. to Sweetwater Cove Blvd. 0.44 15.0 D 30.9 A 31.3 A 35.2 A 16.6 D 29.3 B 22.7 C 19.4 C 33.7 A 28.1 B
Sweetwater Cove Blvd. to Riverbend Blvd. 0.32 9.8 F 22.1 C 20.7 C 18.1 C 26.4 B 18.2 C 16.7 D 12.3 E 23.6 C 25.0 B
Riverbend Blvd. to Sweetwater Blvd. 0.05 18.2 C 30.2 A 30.2 A 27.5 B 34.3 A 34.3 A 30.0 B 14.1 D 30.0 B 30.0 B
Sweetwater Blvd. to Fox Valley Rd. 0.76 14.0 E 13.2 E 15.6 D 19.8 C 17.8 D 21.3 C 26.5 B 26.0 B 18.5 C 19.3 C 19.6 C 21.5 C 20.5 C 20.2 C 19.6 C 17.1 D 17.5 D 22.0 C 21.6 C 24.1 B
Fox Valley Rd. to Sabal Palm Dr. 0.17 34.3 A 30.0 A 31.8 A 20.4 C 34.0 A 24.3 B 26.2 B 24.3 B 21.7 C 35.2 A
Sabal Palm Dr. to Cutler Rd. 0.03
Cutler Rd. to Sabal Club Way 0.31 35.8 A 41.2 A 41.1 A 37.9 A 42.5 A 37.1 A 34.0 A 37.8 A 38.5 A 36.4 A
Sabal Club Way to E. Lake Brantley Rd. 0.29 18.5 C 26.7 B 23.4 C 30.4 A 29.0 B 33.9 A 13.4 E 20.7 C 26.1 B 33.4 A 20.2 C 26.4 B 26.2 B 29.1 B 21.8 C 27.4 B 23.7 C 27.7 B 36.5 A 36.2 A
E. Lake Brantley to Wekiva Springs Ln. 0.50 38.4 A 33.7 A 36.2 A 32.3 A 39.2 A 35.9 A 33.3 A 34.4 A 33.3 A 36.0 A
Wekiva Springs Ln. to SR 434 0.37 9.3 F 16.9 D 10.4 E 17.6 D 15.3 D 23.3 C 18.0 C 22.8 C 13.3 E 20.9 C 18.5 C 25.2 B 11.3 E 18.3 C 16.6 D 23.7 C 18.0 C 24.6 B 11.2 E 18.6 C
Average 16.1 D 20.9 C 24.1 B 24.1 B 22.0 C 23.5 C 22.5 C 21.5 C 25.1 B 25.4 B
PM PEAK HOUR
Orange County Line to Hunt Club Blvd. 0.90 - - - - - - - - - - - - - - - - - - - - - - - - 32.0 B 32.0 B 30.9 B 30.9 B 31.8 B 31.8 B 26.4 C 26.4 C
Hunt Club Blvd. to Sweetwater Cove Blvd. 0.44 35.5 A 33.4 A 32.0 A 34.8 A 20.5 C 35.7 A 35.5 A 32.5 A 39.1 A 36.0 A
Sweetwater Cove Blvd. to Riverbend Blvd. 0.32 22.0 C 29.8 B 32.1 A 24.6 B 39.6 A 33.0 A 31.8 A 24.7 B 37.5 A 35.0 A
Riverbend Blvd. to Sweetwater Blvd. 0.05 27.1 B 30.0 A 29.9 B 34.2 A 40.0 A 34.3 A 34.3 A 16.0 D 40.0 A 34.3 A
Sweetwater Blvd. to Fox Valley Rd. 0.76 33.0 A 30.3 A 34.0 A 32.7 A 33.6 A 32.7 A 33.5 A 31.5 A 34.4 A 29.6 B 29.6 B 32.0 A 31.2 A 32.6 A 34.9 A 30.6 A 37.2 A 37.9 A 32.1 A 33.8 A
Fox Valley Rd. to Sabal Palm Dr. 0.17 33.6 A 29.6 B 35.7 A 27.7 B 40.8 A 25.5 B 26.2 B 34.0 A 27.6 B 35.2 A
Sabal Palm Dr. to Cutler Rd. 0.03
Cutler Rd. to Sabal Club Way 0.31 39.9 A 39.0 A 42.1 A 36.3 A 43.4 A 37.1 A 35.2 A 38.5 A 39.2 A 37.8 A
Sabal Club Way to E. Lake Brantley Rd. 0.29 22.1 C 30.1 A 20.0 C 27.7 B 25.4 B 33.1 A 21.1 C 27.4 B 22.2 C 32.3 A 26.1 B 29.8 B 21.3 C 26.9 B 24.3 B 31.2 A 31.1 A 33.1 A 31.1 A 34.6 A
E. Lake Brantley to Wekiva Springs Ln. 0.50 38.4 A 31.8 A 37.3 A 31.6 A 38.7 A 35.4 A 31.5 A 36.9 A 38.7 A 34.8 A
Wekiva Springs Ln. to SR 434 0.37 9.9 F 17.8 D 6.1 F 11.5 E 12.7 E 20.9 C 11.3 E 18.4 C 18.0 C 25.5 B 11.3 E 18.0 C 10.8 E 17.5 D 31.3 A 34.3 A 32.2 A 35.7 A 22.7 C 28.4 B
Average 25.5 B 21.2 C 28.5 B 25.7 B 28.9 B 26.0 B 26.5 B 31.5 A 35.0 A 30.9 A
Roadway Distance
Segments (mile) (mph) LOS (mph) LOS (mph) LOS (mph) LOS (mph) LOS (mph) LOS (mph) LOS (mph) LOS (mph) LOS (mph) LOS (mph) LOS (mph) LOS (mph) LOS (mph) LOS (mph) LOS (mph) LOS (mph) LOS (mph) LOS (mph) LOS (mph) LOS
AM PEAK HOUR
SR 434 to Wekiva Springs Ln. 0.35 30.7 A 33.6 A 31.4 A 30.5 A 40.7 A 33.8 A 31.7 A 35.2 A 35.2 A 36.4 A
Wekiva Springs Ln. to E. Lake Brantley Rd. 0.53 27.1 B 28.5 B 34.9 A 34.3 A 30.0 A 30.6 A 29.3 B 29.8 B 26.0 B 31.0 A 30.0 B 31.6 A 27.3 B 29.0 B 23.4 C 27.2 B 22.3 C 26.4 B 18.3 C 23.2 C
E. Lake Brantley Rd. to Sabal Club Way 0.28 39.0 A 40.2 A 33.3 A 35.3 A 38.6 A 36.8 A 35.0 A 36.5 A 38.2 A 35.7 A
Sabal Club Way to Cutler Rd. 0.30
Cutler Rd. to Sabal Palm Dr. 0.03 31.2 A 38.5 A 23.9 C 22.3 C 38.5 A 34.6 A 29.6 B 37.1 A 37.8 A 26.2 B
Sabel Palm Dr. to Fox Valley Dr. 0.18 24.7 B 31.7 A 19.4 C 31.9 A 17.8 D 24.7 B 14.2 D 22.5 C 16.5 D 29.8 B 13.4 E 26.1 B 27.6 B 30.8 A 31.9 A 35.6 A 24.9 B 34.1 A 30.9 A 30.0 B
Fox Valley Dr. to Sweetwater Blvd. 0.77 29.6 B 28.1 B 28.5 B 30.5 A 31.3 A 28.3 B 31.7 A 32.6 A 35.2 A 32.8 A
Sweetwater Blvd. to Riverbend Blvd. 0.04 29.8 B 26.4 B 29.3 B 29.7 B 40.0 A 30.0 B 12.0 E 18.5 C 11.4 E 20.0 C
Riverbend Blvd. to Sweetwater Cove Blvd. 0.33 35.6 A 39.4 A 39.5 A 38.3 A 34.7 A 36.0 A 33.9 A 36.8 A 38.2 A 36.2 A
Sweetwater Cove Blvd. to Hunt Club Blvd. 0.45 33.8 A 31.8 A 24.9 B 28.8 B 32.9 A 31.5 A 29.8 B 31.6 A 40.0 A 34.3 A 36.2 A 31.7 A 32.9 A 31.2 A 33.7 A 33.1 A 29.3 B 32.2 A 30.0 B 32.1 A
Hunt Club Blvd. to Orange County Line 0.87 - - - - - - - - - - - - - - - - - - - - - - - - 37.3 A 37.3 A 38.4 A 38.4 A 40.8 A 40.8 A 38.1 A 38.1 A
Average 30.8 A 30.9 A 29.3 B 28.3 B 32.2 A 30.1 A 31.7 A 33.0 A 32.5 A 30.2 A
PM PEAK HOUR
SR 434 to Wekiva Springs Ln. 0.35 31.5 A 30.9 A 29.1 B 28.1 B 34.3 A 30.8 A 30.8 A 34.7 A 35.8 A 26.4 B
Wekiva Springs Ln. to E. Lake Brantley Rd. 0.53 17.8 D 22.0 C 19.7 C 23.2 C 29.0 B 29.0 B 15.1 D 18.9 C 28.0 B 30.5 A 26.2 B 28.1 B 33.3 A 32.2 A 24.9 B 28.2 B 25.1 B 28.7 B 32.9 A 29.8 B
E. Lake Brantley Rd. to Sabal Club Way 0.28 28.6 B 25.0 B 40.7 A 28.3 B 39.5 A 26.1 B 36.5 A 35.0 A 37.3 A 37.3 A
Sabal Club Way to Cutler Rd. 0.30
Cutler Rd. to Sabal Palm Dr. 0.03 13.4 E 15.3 D 16.9 D 17.9 D 20.0 C 18.2 C 19.8 C 21.5 C 24.0 C 26.2 B
Sabel Palm Dr. to Fox Valley Dr. 0.18 24.4 B 19.1 C 21.3 C 19.3 C 20.1 C 22.7 C 18.8 C 21.0 C 16.5 D 22.8 C 19.6 C 20.7 C 20.4 C 23.8 C 24.3 B 25.6 B 22.2 C 26.9 B 28.3 B 29.8 B
Fox Valley Dr. to Sweetwater Blvd. 0.77 27.8 B 28.3 B 27.0 B 27.3 B 30.2 A 26.1 B 29.2 B 27.8 B 31.2 A 29.8 B
Sweetwater Blvd. to Riverbend Blvd. 0.04 31.1 A 34.8 A 34.3 A 33.0 A 40.0 A 34.3 A 30.0 B 30.0 B 34.3 A 30.0 B
Riverbend Blvd. to Sweetwater Cove Blvd. 0.33 36.7 A 39.6 A 40.7 A 35.9 A 40.4 A 35.4 A 34.4 A 36.8 A 39.6 A 35.6 A
Sweetwater Cove Blvd. to Hunt Club Blvd. 0.45 25.7 B 28.8 B 30.0 B 30.7 A 33.0 A 30.9 A 25.1 B 28.2 B 37.7 A 34.2 A 31.4 A 29.3 B 26.0 B 29.2 B 25.0 B 28.5 B 33.7 A 33.6 A 24.5 B 29.1 B
Hunt Club Blvd. to Orange County Line 0.87 - - - - - - - - - - - - - - - - - - - - - - - - 37.6 A 37.6 A 39.2 A 39.2 A 40.2 A 40.2 A 38.1 A 38.1 A
Average 23.8 C 24.9 B 27.9 B 23.1 C 29.6 B 26.4 B 29.9 B 29.5 B 32.0 A 30.9 A
Year 2013
Rdwy Segment Rdwy Section
Average Speed Average Speed
Year 2013
Rdwy Segment Rdwy Section
Average Speed Average Speed
TABLE C31.1aYear 2014 Seminole County Travel Time & Delay Study
Wekiva Springs Road - Eastbound Direction Historical Summary
TABLE C31.1b
Year 2014 Seminole County Travel Time & Delay Study
Year 2014Year 2005 Year 2006 Year 2007 Year 2008 Year 2009 Year 2010 Year 2011
Average Speed Average Speed Average Speed Average SpeedAverage Speed Average Speed Average Speed Average Speed Average Speed Average SpeedAverage Speed Average Speed
D-38 Wekiva Springs Road
Roadway Distance
Segments (mile) (mph) LOS (mph) LOS (mph) LOS (mph) LOS (mph) LOS (mph) LOS (mph) LOS (mph) LOS (mph) LOS (mph) LOS (mph) LOS (mph) LOS (mph) LOS (mph) LOS (mph) LOS (mph) LOS (mph) LOS (mph) LOS (mph) LOS (mph) LOS
Oranole Rd. to Lake Destiny Dr. 0.28 27.5 B 26.9 B 32.2 A 27.9 B 25.6 B 29.5 B 22.7 C 29.0 B 30.0 B 26.7 B
Lake Destiny Dr. to Spring Lake Hills Rd. 0.15 26.7 B 14.8 D 34.1 A 26.9 B 28.6 B 27.1 B 23.3 C 26.2 B 29.0 B 29.0 B
Spring Lake Hills Rd. to Spring Valley Dr. 0.78 35.2 A 31.9 A 32.4 A 35.8 A 32.0 A 29.1 B 22.8 C 30.6 A 25.1 B 33.2 A
Spring Valley Dr. to Westmonte Dr. 0.17 24.5 B 30.2 A 24.2 B 26.6 B 23.8 C 31.0 A 33.9 A 32.5 A 24.7 B 28.9 B 21.2 C 27.6 B 17.3 D 21.8 C 27.1 B 29.3 B 22.8 C 26.0 B 29.2 B 30.7 A
Westmonte Dr. to SR 436 0.23 12.9 E 12.9 E 11.5 E 11.5 E 9.9 F 9.9 F 16.4 D 16.4 D 14.3 D 14.3 D 15.2 D 15.2 D 15.2 D 15.2 D 9.1 F 9.1 F 14.3 D 14.3 D 7.1 F 7.1 F
Average 26.3 B 22.8 C 24.8 B 29.2 B 25.8 B 25.0 B 20.6 C 22.7 C 23.4 C 21.3 C
Oranole Rd. to Lake Destiny Dr. 0.28 30.4 A 21.4 C 25.7 B 23.5 C 21.4 C 22.9 C 17.5 D 21.0 C 15.8 D 17.5 D
Lake Destiny Dr. to Spring Lake Hills Rd. 0.15 27.5 B 17.7 D 30.2 A 29.7 B 26.5 B 30.0 B 24.7 B 22.1 C 26.2 B 22.1 C
Spring Lake Hills Rd. to Spring Valley Dr. 0.78 28.8 B 13.5 E 31.5 A 32.9 A 31.7 A 30.4 A 27.3 B 29.2 B 25.0 B 19.2 C
Spring Valley Dr. to Westmonte Dr. 0.17 19.3 C 24.1 B 11.5 E 14.7 D 24.4 B 28.8 B 24.9 B 28.9 B 25.3 B 27.4 B 24.0 C 27.5 B 22.4 C 23.7 C 19.0 C 24.6 B 24.8 B 22.4 C 20.7 C 19.3 C
Westmonte Dr. to SR 436 0.23 9.2 F 9.2 F 6.3 F 6.3 F 9.3 F 9.3 F 10.9 E 10.9 E 5.3 F 5.3 F 15.8 D 15.8 D 6.8 F 6.8 F 12.4 E 12.4 E 5.6 F 5.6 F 9.8 F 9.8 F
Average 20.3 C 12.5 E 23.2 C 24.3 B 18.5 C 25.1 B 17.9 D 21.8 C 16.1 D 17.1 D
Roadway Distance
Segments (mile) (mph) LOS (mph) LOS (mph) LOS (mph) LOS (mph) LOS (mph) LOS (mph) LOS (mph) LOS (mph) LOS (mph) LOS (mph) LOS (mph) LOS (mph) LOS (mph) LOS (mph) LOS (mph) LOS (mph) LOS (mph) LOS (mph) LOS (mph) LOS
AM PEAK HOUR
SR 436 to Westmonte Dr. 0.20 32.3 A 32.3 A 30.3 A 30.3 A 30.9 A 30.9 A 29.2 B 29.2 B 29.7 B 29.7 B 32.4 A 32.4 A 30.7 A 30.7 A 30.0 B 30.0 B 30.7 A 30.7 A 33.2 A 33.2 A
Westmonte Dr. to Spring Valley Dr. 0.19 21.8 C 21.5 C 18.9 C 21.6 C 20.5 C 21.6 C 25.3 B 23.7 C 16.1 D 21.5 C
Spring Valley Dr. to Spring Lake Hills Rd. 0.78 25.5 B 30.5 A 29.1 B 34.8 A 31.8 A 36.1 A 31.0 A 31.9 A 31.4 A 29.6 B
Spring Lake Hills Rd. to Lake Destiny Dr. 0.14 18.6 C 19.0 C 22.8 C 24.9 B 20.9 C 20.5 C 18.3 C 19.5 C 18.3 C 15.6 D
Lake Destiny Dr. to Oranole Rd. 0.27 9.5 F 25.3 B 26.3 B 16.7 D 23.4 C 16.5 D 26.0 B 23.9 C 26.7 B 15.4 D 24.9 B 12.0 E 21.8 C 19.1 C 25.6 B 19.5 C 23.7 C 17.1 D 22.9 C
Oranole Rd. to Orange County Line 0.03 15.0 D 18.1 C - - - - - - - - - - - - - - - - - - - - - - - - - - - - - - - - - - - -
Average 19.2 C 26.7 B 24.2 B 26.4 B 27.1 B 25.7 B 22.7 C 26.1 B 24.4 B 23.9 C
PM PEAK HOUR
SR 436 to Westmonte Dr. 0.20 30.2 A 30.2 A 31.0 A 31.0 A 31.0 A 31.0 A 29.9 B 29.9 B 27.9 B 27.9 B 35.3 A 35.3 A 33.2 A 33.2 A 32.3 A 32.3 A 31.5 A 31.5 A 33.2 A 33.2 A
Westmonte Dr. to Spring Valley Dr. 0.19 27.9 B 24.8 B 24.8 B 26.2 B 18.2 C 23.0 C 23.7 C 27.1 B 27.8 B 29.2 B
Spring Valley Dr. to Spring Lake Hills Rd. 0.78 31.5 A 32.0 A 29.0 B 32.2 A 31.1 A 36.4 A 33.7 A 33.0 A 31.6 A 31.6 A
Spring Lake Hills Rd. to Lake Destiny Dr. 0.14 17.5 D 8.9 F 10.0 E 12.2 E 14.3 D 10.5 E 9.7 F 15.8 D 11.1 E 11.7 E
Lake Destiny Dr. to Oranole Rd. 0.27 19.8 C 14.1 D 20.4 15.7 D 21.1 C 18.8 C 24.1 B 18.8 C 23.2 C 19.1 C 24.0 C 14.9 D 21.5 C 17.1 D 24.9 B 16.3 D 22.6 C 18.7 C 23.9 C
Oranole Rd. to Orange County Line 0.03 14.6 D 25.6 B - - - - - - - - - - - - - - - - - - - - - - - - - - - - - - - - - - - -
Average 26.1 B 21.3 C 22.1 C 24.8 B 23.8 C 25.0 B 22.6 C 25.6 B 23.5 C 24.8 B
Rdwy Segment Rdwy Section
Average Speed Average Speed
Year 2013
Rdwy Segment Rdwy Section
Average Speed Average Speed
TABLE C32.1aYear 2014 Seminole County Travel Time & Delay Study
Wymore Road - Northbound Direction Historical Summary
Year 2014Year 2005 Year 2006 Year 2007 Year 2008 Year 2009 Year 2010 Year 2011 Year 2013
Average Speed Average Speed Average Speed Average Speed Average Speed
Rdwy Section Rdwy Segment Rdwy Section
Average Speed Average Speed Average Speed Average Speed Average Speed Average Speed Average Speed Average Speed Average Speed Average Speed Average Speed
Average Speed Average Speed Average Speed Average Speed Average SpeedAverage Speed Average Speed Average Speed Average Speed Average Speed Average Speed Average Speed Average Speed
Year 2012
Rdwy Segment Rdwy Section
Average Speed Average Speed
Year 2012
Rdwy Segment Rdwy Section
Average Speed Average Speed
Rdwy Section
Year 2014
TABLE C32.1bYear 2014 Seminole County Travel Time & Delay Study
Wymore Road - Southbound Direction Historical Summary
Average Speed Average Speed Average Speed
Rdwy Section Rdwy Segment Rdwy Section
D-39 Wymore Road
Roadway Distance
Segments (mile) (mph) LOS (mph) LOS (mph) LOS (mph) LOS (mph) LOS (mph) LOS (mph) LOS (mph) LOS (mph) LOS (mph) LOS (mph) LOS (mph) LOS (mph) LOS (mph) LOS (mph) LOS (mph) LOS (mph) LOS (mph) LOS (mph) LOS (mph) LOS
AM PEAK HOUR
CR 427 to Green Way Blvd. 0.98 ---- ---- ---- ---- ---- ---- ---- ---- ---- ---- ---- ---- ---- ---- ---- ---- ---- ---- ---- ---- 27.0 C 27.0 C 26.8 B 26.8 B 33.9 A 33.9 A 32.9 A 32.9 A 28.4 B 28.4 B
Green Way Blvd. to Lake Mary H.S. 0.20 ---- ---- ---- ---- ---- ---- ---- ---- ---- ---- ---- ---- ---- ---- ---- ---- ---- ---- ---- ---- 30.8 B 24.0 C 33.0 A 26.9 B 31.4 A
Lake Mary H. S. to Lake Way Rd. 0.64 ---- ---- ---- ---- ---- ---- ---- ---- ---- ---- ---- ---- ---- ---- ---- ---- ---- ---- ---- ---- 32.0 B 28.6 B 35.8 A 31.3 A 33.2 A
Lake Way Rd. to Lake Mary Blvd. 0.73 ---- ---- ---- ---- ---- ---- ---- ---- ---- ---- ---- ---- ---- ---- ---- ---- ---- ---- ---- ---- 18.2 D 23.6 C 21.0 C 23.9 C 19.8 C 25.8 B 16.6 D 21.7 C 23.4 C 27.6 B
Average 24.8 C 24.9 C 28.3 B 24.9 C 27.9 C
PM PEAK HOUR
CR 427 to Green Way Blvd. 0.98 ---- ---- ---- ---- ---- ---- ---- ---- ---- ---- ---- ---- ---- ---- ---- ---- ---- ---- ---- ---- 35.0 B 35.0 B 26.3 B 26.3 B 33.7 A 33.7 A 34.1 A 34.1 A 34.3 A 34.3 A
Green Way Blvd. to Lake Mary H.S. 0.20 ---- ---- ---- ---- ---- ---- ---- ---- ---- ---- ---- ---- ---- ---- ---- ---- ---- ---- ---- ---- 32.4 B 25.4 B 32.2 A 33.0 A 28.1 B
Lake Mary H. S. to Lake Way Rd. 0.64 ---- ---- ---- ---- ---- ---- ---- ---- ---- ---- ---- ---- ---- ---- ---- ---- ---- ---- ---- ---- 36.6 A 29.5 B 36.1 A 35.1 A 32.1 A
Lake Way Rd. to Lake Mary Blvd. 0.73 ---- ---- ---- ---- ---- ---- ---- ---- ---- ---- ---- ---- ---- ---- ---- ---- ---- ---- ---- ---- 17.6 D 24.1 C 17.2 D 21.7 C 20.5 C 26.3 B 15.5 D 21.9 C 12.7 E 18.5 C
Average 27.4 C 23.2 C 28.6 B 25.3 C 22.4 C
Roadway Distance
Segments (mile) (mph) LOS (mph) LOS (mph) LOS (mph) LOS (mph) LOS (mph) LOS (mph) LOS (mph) LOS (mph) LOS (mph) LOS (mph) LOS (mph) LOS (mph) LOS (mph) LOS (mph) LOS (mph) LOS (mph) LOS (mph) LOS (mph) LOS (mph) LOS
AM PEAK HOUR
Lake Mary Blvd. to Lake Way Rd. 0.73 ---- ---- ---- ---- ---- ---- ---- ---- ---- ---- ---- ---- ---- ---- ---- ---- ---- ---- ---- ---- 30.4 B 27.2 B 30.2 A 32.2 A 25.4 B
Lake Way Rd. to Lake Mary H.S. 0.64 ---- ---- ---- ---- ---- ---- ---- ---- ---- ---- ---- ---- ---- ---- ---- ---- ---- ---- ---- ---- 29.8 B 25.7 B 33.5 A 35.8 A 28.6 B
Lake Mary H. S. to Green Way Blvd. 0.20 ---- ---- ---- ---- ---- ---- ---- ---- ---- ---- ---- ---- ---- ---- ---- ---- ---- ---- ---- ---- 18.2 D 27.8 C 12.6 E 23.0 C 17.1 D 28.3 B 21.0 C 31.1 A 24.4 B 26.4 B
Green Way Blvd. to CR 427 0.98 ---- ---- ---- ---- ---- ---- ---- ---- ---- ---- ---- ---- ---- ---- ---- ---- ---- ---- ---- ---- 26.1 C 26.1 C 24.5 B 24.5 B 32.8 A 32.8 A 30.5 A 30.5 A 32.2 A 32.2 A
Average 27.1 C 23.5 C 29.8 B 30.9 B 28.3 B
PM PEAK HOUR
Lake Mary Blvd. to Lake Way Rd. 0.73 ---- ---- ---- ---- ---- ---- ---- ---- ---- ---- ---- ---- ---- ---- ---- ---- ---- ---- ---- ---- 29.8 B 29.0 B 31.3 A 31.0 A 36.1 A
Lake Way Rd. to Lake Mary H.S. 0.64 ---- ---- ---- ---- ---- ---- ---- ---- ---- ---- ---- ---- ---- ---- ---- ---- ---- ---- ---- ---- 36.2 A 29.8 B 39.2 A 38.3 A 37.6 A
Lake Mary H. S. to Green Way Blvd. 0.20 ---- ---- ---- ---- ---- ---- ---- ---- ---- ---- ---- ---- ---- ---- ---- ---- ---- ---- ---- ---- 20.0 D 30.1 B 21.6 C 28.0 B 20.0 C 31.3 A 20.6 C 31.2 A 26.9 B 35.0 A
Green Way Blvd. to CR 427 0.98 ---- ---- ---- ---- ---- ---- ---- ---- ---- ---- ---- ---- ---- ---- ---- ---- ---- ---- ---- ---- 27.3 C 27.3 C 27.0 B 27.0 B 26.8 B 26.8 B 22.9 C 22.9 C 31.7 A 31.7 A
Average 29.0 B 27.6 C 29.4 B 27.4 C 33.7 B
Year 2013
Rdwy Segment Rdwy Section
Average Speed Average Speed
Year 2013
Rdwy Segment Rdwy Section
Average Speed Average Speed
TABLE C33.1aYear 2014 Seminole County Travel Time & Delay Study
Longwood Lake Mary Road - Northbound Direction Historical Summary
TABLE C33.1b
Year 2014Year 2005 Year 2006 Year 2007 Year 2008 Year 2009 Year 2010 Year 2011
Average Speed Average Speed Average Speed Average Speed Average SpeedAverage Speed Average Speed Average Speed Average Speed Average Speed Average Speed
Year 2012
Rdwy Segment Rdwy Section
Average Speed Average Speed
Year 2012
Rdwy Segment Rdwy Section
Average Speed Average Speed
Rdwy Section
Year 2014
Year 2014 Seminole County Travel Time & Delay StudyLongwood Lake Mary Road - Southbound Direction Historical Summary
Segments (mile) (mph) LOS (mph) LOS (mph) LOS (mph) LOS (mph) LOS (mph) LOS (mph) LOS (mph) LOS (mph) LOS (mph) LOS (mph) LOS (mph) LOS (mph) LOS (mph) LOS (mph) LOS (mph) LOS (mph) LOS (mph) LOS (mph) LOS (mph) LOS
AM PEAK HOUR
Raymond Ave. to Country Club Dr. * 0.58 ---- ---- ---- ---- ---- ---- ---- ---- ---- ---- ---- ---- ---- ---- ---- ---- ---- ---- ---- ---- ---- ---- ---- ---- 30.3 A 33.1 A 29.2 B 31.4 A
Country Club Dr. to Palm Springs Dr. 0.17 ---- ---- ---- ---- ---- ---- ---- ---- ---- ---- ---- ---- ---- ---- ---- ---- ---- ---- ---- ---- 12.4 E 11.1 E 11.5 E 11.6 E 10.9 E
Palm Springs Dr. to Seminole Ave. 0.70 ---- ---- ---- ---- ---- ---- ---- ---- ---- ---- ---- ---- ---- ---- ---- ---- ---- ---- ---- ---- 28.2 B 22.6 C 27.3 B 24.1 B 30.4 A 26.2 B 27.3 B 24.1 B 28.4 B 24.7 B
Seminole Ave. to Bennett Dr. 0.61 ---- ---- ---- ---- ---- ---- ---- ---- ---- ---- ---- ---- ---- ---- ---- ---- ---- ---- ---- ---- 32.7 A 27.9 B 31.3 A 29.5 B 29.5 B
Bennett Dr. to CR 427 0.37 ---- ---- ---- ---- ---- ---- ---- ---- ---- ---- ---- ---- ---- ---- ---- ---- ---- ---- ---- ---- 18.8 C 25.6 B 12.8 E 19.3 C 16.1 D 23.1 C 15.0 D 21.6 C 14.7 D 21.4 C
Average 24.1 B 21.9 C 24.9 B 23.1 C 23.2 C
PM PEAK HOUR
Raymond Ave. to Country Club Dr. * 0.58 ---- ---- ---- ---- ---- ---- ---- ---- ---- ---- ---- ---- ---- ---- ---- ---- ---- ---- ---- ---- ---- ---- ---- ---- 29.2 B 30.3 A 34.5 A 31.4 A
Country Club Dr. to Palm Springs Dr. 0.17 ---- ---- ---- ---- ---- ---- ---- ---- ---- ---- ---- ---- ---- ---- ---- ---- ---- ---- ---- ---- 9.7 F 17.6 D 9.9 F 12.9 E 10.4 E
Palm Springs Dr. to Seminole Ave. 0.70 ---- ---- ---- ---- ---- ---- ---- ---- ---- ---- ---- ---- ---- ---- ---- ---- ---- ---- ---- ---- 29.4 B 21.0 C 24.1 B 24.7 B 29.0 B 24.0 C 24.8 B 24.9 B 23.2 C 22.3 C
Seminole Ave. to Bennett Dr. 0.61 ---- ---- ---- ---- ---- ---- ---- ---- ---- ---- ---- ---- ---- ---- ---- ---- ---- ---- ---- ---- 29.5 B 27.3 B 30.0 B 28.6 B 25.4 B
Bennett Dr. to CR 427 0.37 ---- ---- ---- ---- ---- ---- ---- ---- ---- ---- ---- ---- ---- ---- ---- ---- ---- ---- ---- ---- 21.1 C 25.7 B 12.3 E 18.7 C 26.7 B 28.7 B 17.2 D 22.9 C 12.0 E 17.9 D
Average 23.3 C 21.9 C 25.7 B 24.0 B 20.3 C
Roadway Distance
Segments (mile) (mph) LOS (mph) LOS (mph) LOS (mph) LOS (mph) LOS (mph) LOS (mph) LOS (mph) LOS (mph) LOS (mph) LOS (mph) LOS (mph) LOS (mph) LOS (mph) LOS (mph) LOS (mph) LOS (mph) LOS (mph) LOS (mph) LOS (mph) LOS
AM PEAK HOUR
CR 427 to Bennett Dr. 0.37 ---- ---- ---- ---- ---- ---- ---- ---- ---- ---- ---- ---- ---- ---- ---- ---- ---- ---- ---- ---- 21.8 C 23.6 C 22.0 C 22.7 C 22.2 C
Bennett Dr. to Seminole Ave. 0.61 ---- ---- ---- ---- ---- ---- ---- ---- ---- ---- ---- ---- ---- ---- ---- ---- ---- ---- ---- ---- 29.5 B 26.0 B 26.9 B 25.6 B 28.8 B 25.8 B 26.9 B 25.1 B 26.5 B 24.7 B
Seminole Ave. to Palm Springs Dr. 0.70 ---- ---- ---- ---- ---- ---- ---- ---- ---- ---- ---- ---- ---- ---- ---- ---- ---- ---- ---- ---- 26.4 B 24.9 B 32.5 A 22.7 C 26.1 B
Palm Springs Dr. to Country Club Dr. 0.17 ---- ---- ---- ---- ---- ---- ---- ---- ---- ---- ---- ---- ---- ---- ---- ---- ---- ---- ---- ---- 37.8 A 28.1 B 30.9 A 34.0 A 27.6 B 30.9 A
Country Club Dr. to Raymond Ave. * 0.58 ---- ---- ---- ---- ---- ---- ---- ---- ---- ---- ---- ---- ---- ---- ---- ---- ---- ---- ---- ---- ---- ---- ---- ---- 28.5 B 26.9 B 31.6 A 32.3 A 27.2 B 24.8 B 27.4 B 27.1 B
Average 26.9 B 26.3 B 29.3 B 24.9 B 26.1 B
PM PEAK HOUR
CR 427 to Bennett Dr. 0.37 ---- ---- ---- ---- ---- ---- ---- ---- ---- ---- ---- ---- ---- ---- ---- ---- ---- ---- ---- ---- 23.1 C 21.1 C 20.9 C 25.5 B 18.8 C
Bennett Dr. to Seminole Ave. 0.61 ---- ---- ---- ---- ---- ---- ---- ---- ---- ---- ---- ---- ---- ---- ---- ---- ---- ---- ---- ---- 23.6 C 23.4 C 23.6 C 22.6 C 23.9 C 22.7 C 20.7 C 22.3 C 16.6 D 17.4 D
Seminole Ave. to Palm Springs Dr. 0.70 ---- ---- ---- ---- ---- ---- ---- ---- ---- ---- ---- ---- ---- ---- ---- ---- ---- ---- ---- ---- 27.3 B 25.4 B 28.4 B 27.5 B 26.8 B
Palm Springs Dr. to Country Club Dr. 0.17 ---- ---- ---- ---- ---- ---- ---- ---- ---- ---- ---- ---- ---- ---- ---- ---- ---- ---- ---- ---- 36.4 A 28.7 B 29.1 B 30.9 A 31.9 A 31.9 A
Country Club Dr. to Raymond Ave. * 0.58 ---- ---- ---- ---- ---- ---- ---- ---- ---- ---- ---- ---- ---- ---- ---- ---- ---- ---- ---- ---- ---- ---- ---- ---- 27.0 B 26.4 B 31.1 A 29.7 B 29.7 B 28.8 B 29.0 B 28.2 B
Average 25.6 B 24.7 B 26.4 B 25.8 B 22.6 C
Note: *Additional control point added at Raymond Ave.
Year 2013
Rdwy Segment Rdwy Section
Average Speed Average Speed
Year 2013
Rdwy Segment Rdwy Section
Average Speed Average Speed
TABLE C34.1aYear 2014 Seminole County Travel Time & Delay Study
North Street - Eastbound Direction Historical Summary
TABLE C34.1b
Year 2014Year 2005 Year 2006 Year 2007 Year 2008 Year 2009 Year 2010 Year 2011
Average Speed Average Speed Average Speed Average Speed Average SpeedAverage Speed Average Speed Average Speed Average Speed Average Speed Average Speed
Year 2012
Rdwy Segment Rdwy Section
Average Speed Average Speed
Year 2012
Rdwy Segment Rdwy Section
Average Speed Average Speed
Rdwy Section
Year 2014
Year 2014 Seminole County Travel Time & Delay StudyNorth Street - Westbound Direction Historical Summary
Segments (mile) (mph) LOS (mph) LOS (mph) LOS (mph) LOS (mph) LOS (mph) LOS (mph) LOS (mph) LOS (mph) LOS (mph) LOS (mph) LOS (mph) LOS (mph) LOS (mph) LOS (mph) LOS (mph) LOS (mph) LOS (mph) LOS (mph) LOS (mph) LOS
AM PEAK HOUR
Raywood Ash Ct. to CR 419* 0.10 ---- ---- ---- ---- ---- ---- ---- ---- ---- ---- ---- ---- ---- ---- ---- ---- ---- ---- ---- ---- 6.7 F 6.7 F 7.6 E 7.6 E 4.1 E 4.1 E ---- ---- ---- ---- ---- ---- ---- ----
CR 419 to Medallion Pl. 0.95 ---- ---- ---- ---- ---- ---- ---- ---- ---- ---- ---- ---- ---- ---- ---- ---- ---- ---- ---- ---- 34.2 B 33.9 B 28.8 B 33.1 B 36.3 A
Medallion Pl. to Avenue H 0.30 ---- ---- ---- ---- ---- ---- ---- ---- ---- ---- ---- ---- ---- ---- ---- ---- ---- ---- ---- ---- 46.2 A 36.5 A 45.0 A 36.1 A 39.1 A 30.7 B 42.9 A 35.0 A 46.2 A 38.3 A
Avenue H to Kyle Ct. 0.55 ---- ---- ---- ---- ---- ---- ---- ---- ---- ---- ---- ---- ---- ---- ---- ---- ---- ---- ---- ---- ---- ---- ---- ---- 45.2 A 45.2 A 40.7 A 40.7 A 44.6 A 44.6 A 42.3 A 42.3 A
Kyle Ct. to Butterfly Forest Rd. 3.12 ---- ---- ---- ---- ---- ---- ---- ---- ---- ---- ---- ---- ---- ---- ---- ---- ---- ---- ---- ---- ---- ---- ---- ---- 52.1 A 52.1 A 49.0 A 49.0 A 50.5 A 50.5 A 53.5 A 53.5 A
Butterfly Forest Rd. to Old Mims Rd. 1.00 ---- ---- ---- ---- ---- ---- ---- ---- ---- ---- ---- ---- ---- ---- ---- ---- ---- ---- ---- ---- ---- ---- ---- ---- 34.9 A 32.3 A 35.5 A 31.7 A
Old Mims Rd. to CR 426 0.48 ---- ---- ---- ---- ---- ---- ---- ---- ---- ---- ---- ---- ---- ---- ---- ---- ---- ---- ---- ---- ---- ---- ---- ---- 31.0 A 33.5 A 32.0 A 32.2 A 31.0 A 33.9 A 30.3 A 31.3 A
Average 27.4 C 39.6 B 34.5 B 41.7 B 42.3 A
PM PEAK HOUR
Raywood Ash Ct. to CR 419* 0.10 ---- ---- ---- ---- ---- ---- ---- ---- ---- ---- ---- ---- ---- ---- ---- ---- ---- ---- ---- ---- 6.6 F 6.6 F 3.5 F 3.5 F 2.7 F 2.7 F ---- ---- ---- ---- ---- ---- ---- ----
CR 419 to Medallion Pl. 0.95 ---- ---- ---- ---- ---- ---- ---- ---- ---- ---- ---- ---- ---- ---- ---- ---- ---- ---- ---- ---- 44.1 A 38.8 A 41.0 A 43.5 A 45.2 A
Medallion Pl. to Avenue H 0.30 ---- ---- ---- ---- ---- ---- ---- ---- ---- ---- ---- ---- ---- ---- ---- ---- ---- ---- ---- ---- 47.4 A 44.8 A 45.0 A 40.1 A 42.9 A 41.4 A 46.2 A 44.1 A 46.2 A 45.5 A
Avenue H to Kyle Ct. 0.55 ---- ---- ---- ---- ---- ---- ---- ---- ---- ---- ---- ---- ---- ---- ---- ---- ---- ---- ---- ---- ---- ---- ---- ---- 44.6 A 44.6 A 43.4 A 43.4 A 45.8 A 45.8 A 45.8 A 45.8 A
Kyle Ct. to Butterfly Forest Rd. 3.12 ---- ---- ---- ---- ---- ---- ---- ---- ---- ---- ---- ---- ---- ---- ---- ---- ---- ---- ---- ---- ---- ---- ---- ---- 51.7 A 51.7 A 51.0 A 51.0 A 49.9 A 49.9 A 54.6 A 54.6 A
Butterfly Forest Rd. to Old Mims Rd. 1.00 ---- ---- ---- ---- ---- ---- ---- ---- ---- ---- ---- ---- ---- ---- ---- ---- ---- ---- ---- ---- ---- ---- ---- ---- 34.7 A 34.1 A 39.2 A 34.9 A
Old Mims Rd. to CR 426 0.48 ---- ---- ---- ---- ---- ---- ---- ---- ---- ---- ---- ---- ---- ---- ---- ---- ---- ---- ---- ---- ---- ---- ---- ---- 31.6 A 33.6 A 31.3 A 33.1 A 34.3 A 37.5 A 33.1 A 34.3 A
Average 31.3 C 36.9 B 34.9 B 45.0 A 45.8 A
Roadway Distance
Segments (mile) (mph) LOS (mph) LOS (mph) LOS (mph) LOS (mph) LOS (mph) LOS (mph) LOS (mph) LOS (mph) LOS (mph) LOS (mph) LOS (mph) LOS (mph) LOS (mph) LOS (mph) LOS (mph) LOS (mph) LOS (mph) LOS (mph) LOS (mph) LOS
AM PEAK HOUR
CR 426 to Old Mims Rd. 0.48 ---- ---- ---- ---- ---- ---- ---- ---- ---- ---- ---- ---- ---- ---- ---- ---- ---- ---- ---- ---- ---- ---- ---- ---- 33.1 A 30.6 A 34.3 A 31.6 A
Old Mims Rd. to Butterfly Forest Rd. 1.00 ---- ---- ---- ---- ---- ---- ---- ---- ---- ---- ---- ---- ---- ---- ---- ---- ---- ---- ---- ---- ---- ---- ---- ---- 35.9 A 35.0 A 32.6 A 31.9 A 37.0 A 36.1 A 36.1 A 34.6 A
Butterfly Forest Rd. to Kyle Ct. 3.12 ---- ---- ---- ---- ---- ---- ---- ---- ---- ---- ---- ---- ---- ---- ---- ---- ---- ---- ---- ---- ---- ---- ---- ---- 51.0 A 51.0 A 49.0 A 49.0 A 50.3 A 50.3 A 54.9 A 54.9 A
Kyle Ct. to Avenue H 0.55 ---- ---- ---- ---- ---- ---- ---- ---- ---- ---- ---- ---- ---- ---- ---- ---- ---- ---- ---- ---- ---- ---- ---- ---- 44.0 A 44.0 A 41.2 A 41.2 A 41.2 A 41.2 A 45.2 A 45.2 A
Avenue H to Medallion Pl. 0.30 ---- ---- ---- ---- ---- ---- ---- ---- ---- ---- ---- ---- ---- ---- ---- ---- ---- ---- ---- ---- 45.0 A 42.9 A 30.5 B 40.0 A 43.9 A
Medallion Pl. to CR 419* 0.95 ---- ---- ---- ---- ---- ---- ---- ---- ---- ---- ---- ---- ---- ---- ---- ---- ---- ---- ---- ---- 21.2 D 24.3 C 28.4 B 30.9 B 19.4 D 21.2 D 21.5 D 24.2 C 22.8 C 25.8 C
CR 419 to Raywood Ash Ct. 0.10 ---- ---- ---- ---- ---- ---- ---- ---- ---- ---- ---- ---- ---- ---- ---- ---- ---- ---- ---- ---- 30.0 B 30.0 B 28.6 A 28.6 A 27.3 A 27.3 A ---- ---- ---- ---- ---- ---- ---- ----
Average 24.7 D 40.6 B 35.0 B 38.1 B 39.9 B
PM PEAK HOUR
CR 426 to Old Mims Rd. 0.48 ---- ---- ---- ---- ---- ---- ---- ---- ---- ---- ---- ---- ---- ---- ---- ---- ---- ---- ---- ---- ---- ---- ---- ---- 32.4 A 32.7 A 36.0 A 32.0 A
Old Mims Rd. to Butterfly Forest Rd. 1.00 ---- ---- ---- ---- ---- ---- ---- ---- ---- ---- ---- ---- ---- ---- ---- ---- ---- ---- ---- ---- ---- ---- ---- ---- 37.3 A 35.5 A 34.3 A 33.8 A 40.3 A 38.8 A 37.5 A 35.5 A
Butterfly Forest Rd. to Kyle Ct. 3.12 ---- ---- ---- ---- ---- ---- ---- ---- ---- ---- ---- ---- ---- ---- ---- ---- ---- ---- ---- ---- ---- ---- ---- ---- 51.6 A 51.6 A 50.3 A 50.3 A 50.9 A 50.9 A 54.9 A 54.9 A
Kyle Ct. to Avenue H 0.55 ---- ---- ---- ---- ---- ---- ---- ---- ---- ---- ---- ---- ---- ---- ---- ---- ---- ---- ---- ---- ---- ---- ---- ---- 42.9 A 42.9 A 42.9 A 42.9 A 45.2 A 45.2 A 45.8 A 45.8 A
Avenue H to Medallion Pl. 0.30 ---- ---- ---- ---- ---- ---- ---- ---- ---- ---- ---- ---- ---- ---- ---- ---- ---- ---- ---- ---- 46.2 A 45.0 A 42.9 A 46.2 A 45.0 A
Medallion Pl. to CR 419* 0.95 ---- ---- ---- ---- ---- ---- ---- ---- ---- ---- ---- ---- ---- ---- ---- ---- ---- ---- ---- ---- 25.9 C 28.9 B 20.7 D 23.8 C 25.8 C 28.5 B 23.3 C 26.4 C 28.9 B 31.6 B
CR 419 to Raywood Ash Ct. 0.10 ---- ---- ---- ---- ---- ---- ---- ---- ---- ---- ---- ---- ---- ---- ---- ---- ---- ---- ---- ---- 28.6 B 28.6 B 25.0 B 25.0 B 27.3 A 27.3 A ---- ---- ---- ---- ---- ---- ---- ----
Average 28.9 C 37.9 B 39.1 B 40.3 B 42.7 A
Note: * Construction in progress on Snow Hill Rd at the intersection of CR 419 during the 2012 study.
TABLE C35.1aYear 2014 Seminole County Travel Time & Delay Study
Snow Hill Road - Eastbound Direction Historical Summary
TABLE C35.1bYear 2014 Seminole County Travel Time & Delay Study
Snow Hill Road - Westbound Direction Historical Summary
Year 2005 Year 2006 Year 2007 Year 2008 Year 2009 Year 2010 Year 2011
Average Speed Average Speed Average Speed Average Speed Average SpeedAverage Speed Average Speed Average Speed Average Speed Average Speed Average Speed Average Speed
Rdwy Segment Rdwy Section
Average Speed Average Speed
Year 2012
Rdwy Segment Rdwy Section
Average Speed Average Speed
Year 2012
Rdwy Segment Rdwy Section
Average Speed Average Speed
Rdwy Section
Year 2014
Year 2014
Year 2013
Year 2013
Average Speed
D-42 Snow Hill Road
Roadway Distance
Segments (mile) (mph) LOS (mph) LOS (mph) LOS (mph) LOS (mph) LOS (mph) LOS (mph) LOS (mph) LOS (mph) LOS (mph) LOS (mph) LOS (mph) LOS (mph) LOS (mph) LOS (mph) LOS (mph) LOS (mph) LOS (mph) LOS (mph) LOS (mph) LOS
AM PEAK HOUR
US 17/92 to Park St. 0.31 ---- ---- ---- ---- ---- ---- ---- ---- ---- ---- ---- ---- ---- ---- ---- ---- ---- ---- ---- ---- ---- ---- ---- ---- 23.5 B 23.5 B 24.2 B 24.2 B 24.2 B 24.2 B 24.2 B 24.2 B
Park St. to Sanford Ave. S. 0.18 ---- ---- ---- ---- ---- ---- ---- ---- ---- ---- ---- ---- ---- ---- ---- ---- ---- ---- ---- ---- ---- ---- ---- ---- 9.0 E 9.0 E 10.3 D 10.3 D 7.8 E 7.8 E 12.6 D 12.6 D
Sanford Ave. S. to Sanford Ave. N. 0.03 ---- ---- ---- ---- ---- ---- ---- ---- ---- ---- ---- ---- ---- ---- ---- ---- ---- ---- ---- ---- ---- ---- ---- ---- 16.4 C 16.4 C 16.4 C 16.4 C 16.4 C 16.4 C 15.0 C 15.0 C
Sanford Ave. N. to Mellonville Ave. 0.56 ---- ---- ---- ---- ---- ---- ---- ---- ---- ---- ---- ---- ---- ---- ---- ---- ---- ---- ---- ---- ---- ---- ---- ---- 24.2 B 24.2 B 22.4 C 22.4 C 17.4 D 17.4 D 23.8 C 23.8 C
Mellonville Ave. to Beardall Ave. 1.99 ---- ---- ---- ---- ---- ---- ---- ---- ---- ---- ---- ---- ---- ---- ---- ---- ---- ---- ---- ---- ---- ---- ---- ---- 36.5 A 36.5 A 33.7 B 33.7 B 39.9 A 39.9 A 36.3 A 36.3 A
Beardall Ave. to SR 415* 0.91 ---- ---- ---- ---- ---- ---- ---- ---- ---- ---- ---- ---- ---- ---- ---- ---- ---- ---- ---- ---- ---- ---- ---- ---- 24.6 C 24.6 C 33.4 B 33.4 B 30.2 B 30.2 B 27.7 C 27.7 C
Average 26.7 C 27.6 C 26.5 C 28.4 B
PM PEAK HOUR
US 17/92 to Park St. 0.31 ---- ---- ---- ---- ---- ---- ---- ---- ---- ---- ---- ---- ---- ---- ---- ---- ---- ---- ---- ---- ---- ---- ---- ---- 23.2 B 23.2 B 23.5 B 23.5 B 29.5 A 29.5 A 24.8 B 24.8 B
Park St. to Sanford Ave. S. 0.18 ---- ---- ---- ---- ---- ---- ---- ---- ---- ---- ---- ---- ---- ---- ---- ---- ---- ---- ---- ---- ---- ---- ---- ---- 8.4 E 8.4 E 10.0 D 10.0 D 13.3 C 13.3 C 11.4 D 11.4 D
Sanford Ave. S. to Sanford Ave. N. 0.03 ---- ---- ---- ---- ---- ---- ---- ---- ---- ---- ---- ---- ---- ---- ---- ---- ---- ---- ---- ---- ---- ---- ---- ---- 15.0 C 15.0 C 16.4 C 16.4 C 18.0 C 18.0 C 15.0 C 15.0 C
Sanford Ave. N. to Mellonville Ave. 0.56 ---- ---- ---- ---- ---- ---- ---- ---- ---- ---- ---- ---- ---- ---- ---- ---- ---- ---- ---- ---- ---- ---- ---- ---- 19.4 C 19.4 C 24.5 B 24.5 B 20.6 C 20.6 C 22.9 C 22.9 C
Mellonville Ave. to Beardall Ave. 1.99 ---- ---- ---- ---- ---- ---- ---- ---- ---- ---- ---- ---- ---- ---- ---- ---- ---- ---- ---- ---- ---- ---- ---- ---- 38.4 A 38.4 A 37.5 A 37.5 A 37.9 A 37.9 A 37.8 A 37.8 A
Beardall Ave. to SR 415* 0.91 ---- ---- ---- ---- ---- ---- ---- ---- ---- ---- ---- ---- ---- ---- ---- ---- ---- ---- ---- ---- ---- ---- ---- ---- 34.1 B 34.1 B 33.1 B 33.1 B 36.7 A 36.7 A 27.6 C 27.6 C
Average 27.4 C 29.1 B 30.4 B 28.3 B
Roadway Distance
Segments (mile) (mph) LOS (mph) LOS (mph) LOS (mph) LOS (mph) LOS (mph) LOS (mph) LOS (mph) LOS (mph) LOS (mph) LOS (mph) LOS (mph) LOS (mph) LOS (mph) LOS (mph) LOS (mph) LOS (mph) LOS (mph) LOS (mph) LOS (mph) LOS
AM PEAK HOUR
SR 415 to Beardall Ave.* 0.91 ---- ---- ---- ---- ---- ---- ---- ---- ---- ---- ---- ---- ---- ---- ---- ---- ---- ---- ---- ---- ---- ---- ---- ---- 32.5 B 32.5 B 33.6 B 33.6 B 36.7 A 36.7 A 31.7 B 31.7 B
Beardall Ave. to Mellonville Ave. 1.99 ---- ---- ---- ---- ---- ---- ---- ---- ---- ---- ---- ---- ---- ---- ---- ---- ---- ---- ---- ---- ---- ---- ---- ---- 28.6 B 28.6 B 31.9 B 31.9 B 34.1 B 34.1 B 29.6 B 29.6 B
Mellonville Ave. to Sanford Ave. N. 0.56 ---- ---- ---- ---- ---- ---- ---- ---- ---- ---- ---- ---- ---- ---- ---- ---- ---- ---- ---- ---- ---- ---- ---- ---- 19.1 C 19.1 C 20.4 C 20.4 C 16.6 D 16.6 D 19.6 C 19.6 C
Sanford Ave. N. to Sanford Ave. S. 0.03 ---- ---- ---- ---- ---- ---- ---- ---- ---- ---- ---- ---- ---- ---- ---- ---- ---- ---- ---- ---- ---- ---- ---- ---- 16.4 C 16.4 C 18.0 C 18.0 C 16.4 C 16.4 C 16.4 C 16.4 C
Sanford Ave. S. to Park St. 0.18 ---- ---- ---- ---- ---- ---- ---- ---- ---- ---- ---- ---- ---- ---- ---- ---- ---- ---- ---- ---- ---- ---- ---- ---- 18.9 C 18.9 C 22.0 B 22.0 B 24.0 B 24.0 B 24.0 B 24.0 B
Park St. to US 17/92 0.31 ---- ---- ---- ---- ---- ---- ---- ---- ---- ---- ---- ---- ---- ---- ---- ---- ---- ---- ---- ---- ---- ---- ---- ---- 10.0 D 10.0 D 10.2 D 10.2 D 11.8 D 11.8 D 9.1 D 9.1 D
Average 23.3 C 25.1 C 25.8 C 23.7 C
PM PEAK HOUR
SR 415 to Beardall Ave.* 0.91 ---- ---- ---- ---- ---- ---- ---- ---- ---- ---- ---- ---- ---- ---- ---- ---- ---- ---- ---- ---- ---- ---- ---- ---- 32.9 B 32.9 B 33.1 B 33.1 B 35.9 A 35.9 A 33.5 B 33.5 B
Beardall Ave. to Mellonville Ave. 1.99 ---- ---- ---- ---- ---- ---- ---- ---- ---- ---- ---- ---- ---- ---- ---- ---- ---- ---- ---- ---- ---- ---- ---- ---- 32.2 B 32.2 B 38.0 A 38.0 A 37.3 A 37.3 A 33.5 B 33.5 B
Mellonville Ave. to Sanford Ave. N. 0.56 ---- ---- ---- ---- ---- ---- ---- ---- ---- ---- ---- ---- ---- ---- ---- ---- ---- ---- ---- ---- ---- ---- ---- ---- 19.3 C 19.3 C 20.6 C 20.6 C 14.2 D 14.2 D 20.5 C 20.5 C
Sanford Ave. N. to Sanford Ave. S. 0.03 ---- ---- ---- ---- ---- ---- ---- ---- ---- ---- ---- ---- ---- ---- ---- ---- ---- ---- ---- ---- ---- ---- ---- ---- 15.0 C 15.0 C 18.0 C 18.0 C 18.0 C 18.0 C 16.4 C 16.4 C
Sanford Ave. S. to Park St. 0.18 ---- ---- ---- ---- ---- ---- ---- ---- ---- ---- ---- ---- ---- ---- ---- ---- ---- ---- ---- ---- ---- ---- ---- ---- 18.6 C 18.6 C 20.4 B 20.4 B 24.0 B 24.0 B 18.6 C 18.6 C
Park St. to US 17/92 0.31 ---- ---- ---- ---- ---- ---- ---- ---- ---- ---- ---- ---- ---- ---- ---- ---- ---- ---- ---- ---- ---- ---- ---- ---- 6.6 F 6.6 F 8.6 E 8.6 E 9.5 D 9.5 D 10.6 D 10.6 D
Average 22.3 C 25.8 C 24.7 C 25.8 C
Note: *From the year 2014, Celery Ave from Beardall Ave to SR 415 distance changed from 0.79 miles to 0.91 miles due to roadway realignment.
Rdwy Segment Rdwy Section
Average Speed Average Speed
Year 2013
Rdwy Segment Rdwy Section
Average Speed Average SpeedAverage Speed Average Speed Average Speed Average SpeedAverage Speed Average Speed Average Speed Average Speed Average Speed Average SpeedAverage Speed Average Speed
Average Speed Average Speed Average SpeedAverage Speed
Rdwy SectionRdwy Segment
Year 2014
Average Speed Average Speed
Year 2012
Rdwy Segment Rdwy Section
Average Speed Average Speed
Average Speed Average Speed
TABLE C36.1b
Year 2014 Seminole County Travel Time & Delay Study
13th Street/Celery Avenue - Westbound Direction Historical Summary
D-43 13th Street/Celery Avenue
Roadway Distance
Segments (mile) (mph) LOS (mph) LOS (mph) LOS (mph) LOS (mph) LOS (mph) LOS (mph) LOS (mph) LOS (mph) LOS (mph) LOS (mph) LOS (mph) LOS (mph) LOS (mph) LOS (mph) LOS (mph) LOS (mph) LOS (mph) LOS (mph) LOS (mph) LOS
AM PEAK HOUR
SR 414 to Don Mar St. 0.35 30.5 A 35.0 A 30.0 B ---- ---- ---- ---- ---- ---- ---- ---- ---- ---- ---- ---- 28.0 B 28.0 B 31.8 A 31.3 A
Don Mar St. to Bear Lake Cir. 0.21 28.1 B 31.3 A 31.6 A ---- ---- ---- ---- ---- ---- ---- ---- ---- ---- ---- ---- 22.5 C 22.9 C 30.0 B 27.4 B
Bear Lake Cir. To Cub Lake Dr. 0.12 31.0 A 33.3 A 28.8 B ---- ---- ---- ---- ---- ---- ---- ---- ---- ---- ---- ---- 22.5 C 24.0 C 28.8 B 26.7 B
Cub Lake Dr. to Bunnell Rd. 0.25 26.5 B 28.9 B 30.0 B 32.5 A 34.1 A 31.2 A ---- ---- ---- ---- ---- ---- ---- ---- ---- ---- ---- ---- 23.8 C 24.7 B 25.4 B 25.5 B 26.3 B 29.4 B 22.4 C 27.0 B
Bunnell Rd. to Holliday Ave. 0.16 28.4 B 30.3 A 31.0 A ---- ---- ---- ---- ---- ---- ---- ---- ---- ---- ---- ---- 31.0 A 31.0 A 31.0 A 32.0 A
Holliday Ave. to McNeil Ave. 0.09 23.8 C 26.7 B 21.6 C 26.5 B 19.3 C 25.4 B ---- ---- ---- ---- ---- ---- ---- ---- ---- ---- ---- ---- 21.6 C 26.8 B 19.3 C 25.4 B 23.5 C 27.8 B 25.7 B 29.4 B
McNeil Ave. to Curtis Dr. 0.37 25.3 B 24.7 B 27.4 B ---- ---- ---- ---- ---- ---- ---- ---- ---- ---- ---- ---- 23.1 C 26.4 B 30.4 A 30.8 A
Curtis Dr. to Gleaves Ct. 0.32 20.5 C 28.8 B 30.0 B ---- ---- ---- ---- ---- ---- ---- ---- ---- ---- ---- ---- 27.0 B 26.7 B 30.0 B 31.5 A
Gleaves Ct. to SR 436 0.21 6.8 F 15.3 D 8.0 F 17.4 D 11.5 E 21.4 C ---- ---- ---- ---- ---- ---- ---- ---- ---- ---- ---- ---- 8.6 F 17.2 D 11.4 E 20.2 C 9.7 F 20.2 C 7.5 F 18.0 D
Average 20.8 C 23.2 C 25.5 B 20.9 C 22.9 C 24.4 B 22.4 C
PM PEAK HOUR
SR 414 to Don Mar St. 0.35 32.6 A 35.0 A 30.9 A ---- ---- ---- ---- ---- ---- ---- ---- ---- ---- ---- ---- 29.6 B 28.8 B 31.3 A 29.6 B
Don Mar St. to Bear Lake Cir. 0.21 30.6 A 31.3 A 30.8 A ---- ---- ---- ---- ---- ---- ---- ---- ---- ---- ---- ---- 22.5 C 24.2 B 29.3 B 24.7 B
Bear Lake Cir. To Cub Lake Dr. 0.12 30.9 A 30.9 A 34.3 A ---- ---- ---- ---- ---- ---- ---- ---- ---- ---- ---- ---- 21.2 C 25.7 B 28.8 B 24.8 B
Cub Lake Dr. to Bunnell Rd. 0.25 32.4 A 31.8 A 23.7 C 29.8 B 19.7 C 27.1 B ---- ---- ---- ---- ---- ---- ---- ---- ---- ---- ---- ---- 19.2 C 23.3 C 24.6 B 26.1 B 28.8 B 29.8 B 27.8 B 27.2 B
Bunnell Rd. to Holliday Ave. 0.16 31.8 A 30.3 A 34.3 A ---- ---- ---- ---- ---- ---- ---- ---- ---- ---- ---- ---- 29.1 B 33.1 A 33.1 A 33.1 A
Holliday Ave. to McNeil Ave. 0.09 29.3 B 30.8 A 29.4 B 30.0 B 38.6 A 35.7 A ---- ---- ---- ---- ---- ---- ---- ---- ---- ---- ---- ---- 30.0 B 29.4 B 31.8 A 32.6 A 20.0 C 26.8 B 33.7 A 33.3 A
McNeil Ave. to Curtis Dr. 0.37 31.7 A 29.0 B 33.6 A ---- ---- ---- ---- ---- ---- ---- ---- ---- ---- ---- ---- 31.3 A 33.6 A 29.6 B 33.1 A
Curtis Dr. to Gleaves Ct. 0.32 28.3 B 33.9 A 35.6 A ---- ---- ---- ---- ---- ---- ---- ---- ---- ---- ---- ---- 33.1 A 35.6 A 34.9 A 34.3 A
Gleaves Ct. to SR 436 0.21 6.7 F 17.4 D 8.4 F 19.3 C 9.9 F 22.2 C ---- ---- ---- ---- ---- ---- ---- ---- ---- ---- ---- ---- 8.0 F 18.8 C 8.8 F 20.5 C 7.0 F 17.4 D 9.5 F 21.2 C
Average 23.4 C 24.2 B 25.4 B 21.6 C 23.9 C 22.5 C 24.7 B
Roadway Distance
Segments (mile) (mph) LOS (mph) LOS (mph) LOS (mph) LOS (mph) LOS (mph) LOS (mph) LOS (mph) LOS (mph) LOS (mph) LOS (mph) LOS (mph) LOS (mph) LOS (mph) LOS (mph) LOS (mph) LOS (mph) LOS (mph) LOS (mph) LOS (mph) LOS
AM PEAK HOUR
SR 436 to Gleaves Ct. 0.21 25.7 B 23.2 C 24.0 C ---- ---- ---- ---- ---- ---- ---- ---- ---- ---- ---- ---- 23.8 C 22.5 C 26.2 B 26.2 B
Gleaves Ct. to Curtis Dr. 0.32 31.5 A 26.8 B 26.7 B ---- ---- ---- ---- ---- ---- ---- ---- ---- ---- ---- ---- 26.7 B 28.2 B 32.0 A 32.0 A
Curtis Dr. to McNeil Ave. 0.37 25.3 B 27.2 B 24.7 B 25.0 B 22.0 C 23.9 C ---- ---- ---- ---- ---- ---- ---- ---- ---- ---- ---- ---- 24.1 B 24.9 B 24.1 B 25.0 B 29.2 B 29.3 B 30.0 B 29.7 B
McNeil Ave. to Holliday Ave. 0.09 26.8 B 24.9 B 22.5 C ---- ---- ---- ---- ---- ---- ---- ---- ---- ---- ---- ---- 21.6 C 23.5 C 25.7 B 25.7 B
Holliday Ave. to Bunnell Rd. 0.16 25.8 B 26.1 B 25.0 B 25.0 B 26.7 B 25.0 B ---- ---- ---- ---- ---- ---- ---- ---- ---- ---- ---- ---- 24.6 B 23.4 C 25.9 B 25.0 B 24.6 B 25.0 B 22.3 C 23.4 C
Bunnell Rd. to Cub Lake Dr. 0.25 31.1 A 30.0 B 24.2 B ---- ---- ---- ---- ---- ---- ---- ---- ---- ---- ---- ---- 25.9 B 25.9 B 25.9 B 29.4 B
Cub Lake Dr. to Bear Lake Cir. 0.12 28.8 B 30.9 A 28.8 B ---- ---- ---- ---- ---- ---- ---- ---- ---- ---- ---- ---- 21.2 C 23.2 C 26.7 B 26.7 B
Bear Lake Cir. to Don Mar St. 0.21 27.1 B 28.8 B 30.8 A ---- ---- ---- ---- ---- ---- ---- ---- ---- ---- ---- ---- 22.1 C 24.2 B 26.8 B 28.0 B
Don Mar St. to SR 414 0.35 22.0 C 26.0 B 18.8 C 24.4 B 22.1 C 25.0 B ---- ---- ---- ---- ---- ---- ---- ---- ---- ---- ---- ---- 17.2 D 20.6 C 15.0 D 19.9 C 17.1 D 21.9 C 12.7 E 19.4 C
Average 26.6 B 24.7 B 24.5 B 22.6 C 22.4 C 25.0 B 23.4 C
PM PEAK HOUR
SR 436 to Gleaves Ct. 0.21 26.8 B 31.3 A 30.0 B ---- ---- ---- ---- ---- ---- ---- ---- ---- ---- ---- ---- 29.3 B 27.4 B 31.5 A 33.2 A
Gleaves Ct. to Curtis Dr. 0.32 32.7 A 34.9 A 36.9 A ---- ---- ---- ---- ---- ---- ---- ---- ---- ---- ---- ---- 32.5 A 33.1 A 34.3 A 34.3 A
Curtis Dr. to McNeil Ave. 0.37 32.9 A 31.1 A 29.6 B 31.7 A 33.1 A 33.6 A ---- ---- ---- ---- ---- ---- ---- ---- ---- ---- ---- ---- 32.2 A 31.6 A 31.3 A 30.9 A 28.5 B 31.0 A 33.1 A 33.5 A
McNeil Ave. to Holliday Ave. 0.09 31.7 A 32.4 A 36.0 A ---- ---- ---- ---- ---- ---- ---- ---- ---- ---- ---- ---- 31.8 A 33.7 A 30.0 B 31.8 A
Holliday Ave. to Bunnell Rd. 0.16 31.4 A 31.5 A 32.0 A 32.1 A 31.0 A 32.6 A ---- ---- ---- ---- ---- ---- ---- ---- ---- ---- ---- ---- 17.5 D 20.8 C 24.6 B 27.3 B 21.3 C 23.8 C 34.3 A 33.3 A
Bunnell Rd. to Cub Lake Dr. 0.25 32.2 A 33.3 A 31.2 A ---- ---- ---- ---- ---- ---- ---- ---- ---- ---- ---- ---- 26.8 B 26.8 B 31.9 A 31.2 A
Cub Lake Dr. to Bear Lake Cir. 0.12 29.2 B 28.8 B 31.3 A ---- ---- ---- ---- ---- ---- ---- ---- ---- ---- ---- ---- 23.2 C 24.0 C 31.3 A 24.0 C
Bear Lake Cir. to Don Mar St. 0.21 27.7 B 32.7 A 36.4 A ---- ---- ---- ---- ---- ---- ---- ---- ---- ---- ---- ---- 22.9 C 24.2 B 30.7 A 25.2 B
Don Mar St. to SR 414 0.35 17.2 D 23.5 C 17.3 D 24.2 B 23.1 C 28.3 B ---- ---- ---- ---- ---- ---- ---- ---- ---- ---- ---- ---- 14.4 D 19.4 C 21.0 C 23.4 C 14.1 D 21.5 C 12.7 E 19.0 C
Average 27.2 B 27.9 B 30.9 A 23.5 C 26.7 B 25.1 B 25.0 B
Year 2013
Rdwy Segment Rdwy Section
Average Speed Average Speed
Year 2013
Rdwy Segment Rdwy Section
Average Speed Average Speed
TABLE C37.1aYear 2014 Seminole County Travel Time & Delay Study
Bear Lake Road - Northbound Direction Historical Summary
Year 2014 Seminole County Travel Time & Delay Study
Bear Lake Road - Southbound Direction Historical Summary
Average Speed Average Speed Average Speed Average Speed Average Speed Average SpeedAverage Speed Average Speed Average Speed Average Speed Average Speed
Year 2006 Year 2007 Year 2008 Year 2009 Year 2010 Year 2014Year 2005
Average Speed Average Speed Average Speed Average Speed Average Speed Average Speed Average Speed Average SpeedAverage Speed Average Speed Average Speed Average Speed Average Speed Average Speed
Year 2011
Rdwy Segment Rdwy Section
Average Speed Average Speed
Year 2011
Rdwy Segment Rdwy Section
Average Speed Average Speed
Year 2012
Rdwy Segment Rdwy Section
Average Speed Average Speed
Year 2012
Rdwy Segment Rdwy Section
Average Speed Average Speed
D-44 Bear Lake Road
Roadway Distance
Segments (mile) (mph) LOS (mph) LOS (mph) LOS (mph) LOS (mph) LOS (mph) LOS (mph) LOS (mph) LOS (mph) LOS (mph) LOS (mph) LOS (mph) LOS (mph) LOS (mph) LOS (mph) LOS (mph) LOS (mph) LOS (mph) LOS (mph) LOS (mph) LOS
AM PEAK HOUR
Bear Lake Rd. to Eden Park Rd. 0.50 ---- ---- ---- ---- ---- ---- ---- ---- ---- ---- ---- ---- ---- ---- ---- ---- ---- ---- ---- ---- ---- ---- ---- ---- 25.0 B 25.0 B 25.2 B 25.2 B 24.8 B 24.8 B 26.5 B 26.5 B
Eden Park Rd. to Country Club Pkwy. 0.38 ---- ---- ---- ---- ---- ---- ---- ---- ---- ---- ---- ---- ---- ---- ---- ---- ---- ---- ---- ---- ---- ---- ---- ---- 33.5 A 34.0 A 35.1 A 34.0 A
Country Club Pkwy. to Pearl Lake Cswy. 0.19 ---- ---- ---- ---- ---- ---- ---- ---- ---- ---- ---- ---- ---- ---- ---- ---- ---- ---- ---- ---- ---- ---- ---- ---- 21.1 C 20.7 C 20.0 C 14.1 D
Pearl Lake Cswy. to Sunshine Ln. 0.15 ---- ---- ---- ---- ---- ---- ---- ---- ---- ---- ---- ---- ---- ---- ---- ---- ---- ---- ---- ---- ---- ---- ---- ---- 27.3 B 31.0 A 32.1 A 26.5 B
Sunshine Ln. to W. Town Pkwy. 0.20 ---- ---- ---- ---- ---- ---- ---- ---- ---- ---- ---- ---- ---- ---- ---- ---- ---- ---- ---- ---- ---- ---- ---- ---- 21.8 C 26.3 B 25.5 B 27.9 B 24.0 C 27.6 B 24.5 B 23.9 C
Average 25.8 B 26.9 B 26.5 B 24.8 B
PM PEAK HOUR
Bear Lake Rd. to Eden Park Rd. 0.50 ---- ---- ---- ---- ---- ---- ---- ---- ---- ---- ---- ---- ---- ---- ---- ---- ---- ---- ---- ---- ---- ---- ---- ---- 25.9 B 25.9 B 25.2 B 25.2 B 23.4 C 23.4 C 23.8 C 23.8 C
Eden Park Rd. to Country Club Pkwy. 0.38 ---- ---- ---- ---- ---- ---- ---- ---- ---- ---- ---- ---- ---- ---- ---- ---- ---- ---- ---- ---- ---- ---- ---- ---- 32.1 A 31.7 A 35.6 A 33.5 A
Country Club Pkwy. to Pearl Lake Cswy. 0.19 ---- ---- ---- ---- ---- ---- ---- ---- ---- ---- ---- ---- ---- ---- ---- ---- ---- ---- ---- ---- ---- ---- ---- ---- 21.5 C 23.7 C 20.4 C 17.8 D
Pearl Lake Cswy. to Sunshine Ln. 0.15 ---- ---- ---- ---- ---- ---- ---- ---- ---- ---- ---- ---- ---- ---- ---- ---- ---- ---- ---- ---- ---- ---- ---- ---- 19.1 C 21.4 C 18.4 C 19.6 C
Sunshine Ln. to W. Town Pkwy. 0.20 ---- ---- ---- ---- ---- ---- ---- ---- ---- ---- ---- ---- ---- ---- ---- ---- ---- ---- ---- ---- ---- ---- ---- ---- 21.8 C 24.4 B 24.0 C 26.0 B 24.5 B 25.3 B 17.6 D 22.4 C
Average 24.9 B 25.7 B 24.6 B 22.9 C
Roadway Distance
Segments (mile) (mph) LOS (mph) LOS (mph) LOS (mph) LOS (mph) LOS (mph) LOS (mph) LOS (mph) LOS (mph) LOS (mph) LOS (mph) LOS (mph) LOS (mph) LOS (mph) LOS (mph) LOS (mph) LOS (mph) LOS (mph) LOS (mph) LOS (mph) LOS
AM PEAK HOUR
W. Town Pkwy. to Sunshine Ln. 0.20 ---- ---- ---- ---- ---- ---- ---- ---- ---- ---- ---- ---- ---- ---- ---- ---- ---- ---- ---- ---- ---- ---- ---- ---- 22.2 C 29.3 B 30.0 B 28.6 B
Sunshine Ln. to Pearl Lake Cswy. 0.15 ---- ---- ---- ---- ---- ---- ---- ---- ---- ---- ---- ---- ---- ---- ---- ---- ---- ---- ---- ---- ---- ---- ---- ---- 21.4 C 25.7 B 20.9 C 17.3 D
Pearl Lake Cswy. to Country Club Pkwy. 0.19 ---- ---- ---- ---- ---- ---- ---- ---- ---- ---- ---- ---- ---- ---- ---- ---- ---- ---- ---- ---- ---- ---- ---- ---- 27.1 B 29.2 B 34.5 A 28.5 B
Country Club Pkwy. to Eden Park Rd. 0.38 ---- ---- ---- ---- ---- ---- ---- ---- ---- ---- ---- ---- ---- ---- ---- ---- ---- ---- ---- ---- ---- ---- ---- ---- 25.3 B 24.2 B 23.5 C 26.0 B 24.8 B 26.5 B 25.3 B 24.6 B
Eden Park Rd. to Bear Lake Rd. 0.50 ---- ---- ---- ---- ---- ---- ---- ---- ---- ---- ---- ---- ---- ---- ---- ---- ---- ---- ---- ---- ---- ---- ---- ---- 26.3 B 26.3 B 29.4 B 29.4 B 29.4 B 29.4 B 30.0 B 30.0 B
Average 24.9 B 27.1 B 27.5 B 26.3 B
PM PEAK HOUR
W. Town Pkwy. to Sunshine Ln. 0.20 ---- ---- ---- ---- ---- ---- ---- ---- ---- ---- ---- ---- ---- ---- ---- ---- ---- ---- ---- ---- ---- ---- ---- ---- 24.0 C 23.1 C 20.7 C 24.5 B
Sunshine Ln. to Pearl Lake Cswy. 0.15 ---- ---- ---- ---- ---- ---- ---- ---- ---- ---- ---- ---- ---- ---- ---- ---- ---- ---- ---- ---- ---- ---- ---- ---- 24.3 B 17.0 D 17.6 D 17.0 D
Pearl Lake Cswy. to Country Club Pkwy. 0.19 ---- ---- ---- ---- ---- ---- ---- ---- ---- ---- ---- ---- ---- ---- ---- ---- ---- ---- ---- ---- ---- ---- ---- ---- 31.7 A 25.9 B 31.7 A 29.2 B
Country Club Pkwy. to Eden Park Rd. 0.38 ---- ---- ---- ---- ---- ---- ---- ---- ---- ---- ---- ---- ---- ---- ---- ---- ---- ---- ---- ---- ---- ---- ---- ---- 24.3 B 25.4 B 23.0 C 22.3 C 22.1 C 22.3 C 32.6 A 26.2 B
Eden Park Rd. to Bear Lake Rd. 0.50 ---- ---- ---- ---- ---- ---- ---- ---- ---- ---- ---- ---- ---- ---- ---- ---- ---- ---- ---- ---- ---- ---- ---- ---- 22.1 C 22.1 C 26.5 B 26.5 B 29.4 B 29.4 B 24.4 B 24.4 B
Average 24.1 B 23.6 C 24.3 B 25.5 B
Year 2013
Rdwy Segment Rdwy Section
Average Speed Average Speed
Year 2013
Rdwy Segment Rdwy Section
Average Speed Average Speed
TABLE C38.1aYear 2014 Seminole County Travel Time & Delay Study
Bunnell Road - Eastbound Direction Historical Summary
Year 2014 Seminole County Travel Time & Delay Study
Bunnell Road - Westbound Direction Historical Summary
Average Speed Average Speed Average Speed Average Speed Average Speed Average SpeedAverage Speed Average Speed Average Speed Average Speed Average Speed
Year 2006 Year 2007 Year 2008 Year 2009 Year 2010 Year 2014Year 2005
Average Speed Average Speed Average Speed Average Speed Average Speed Average Speed Average Speed Average SpeedAverage Speed Average Speed Average Speed Average Speed Average Speed Average Speed
Year 2011
Rdwy Segment Rdwy Section
Average Speed Average Speed
Year 2011
Rdwy Segment Rdwy Section
Average Speed Average Speed
Year 2012
Rdwy Segment Rdwy Section
Average Speed Average Speed
Year 2012
Rdwy Segment Rdwy Section
Average Speed Average Speed
D-45 Bunnell Road
Roadway Distance
Segments (mile) (mph) LOS (mph) LOS (mph) LOS (mph) LOS (mph) LOS (mph) LOS (mph) LOS (mph) LOS (mph) LOS (mph) LOS (mph) LOS (mph) LOS (mph) LOS (mph) LOS (mph) LOS (mph) LOS (mph) LOS (mph) LOS (mph) LOS (mph) LOS
AM PEAK HOUR
CR 46A to Markham Rd. 0.43 ---- ---- ---- ---- ---- ---- ---- ---- ---- ---- ---- ---- ---- ---- ---- ---- ---- ---- ---- ---- ---- ---- ---- ---- 37.4 A 37.4 A 36.3 A 36.3 A 36.9 A 36.9 A 36.9 A 36.9 A
Markham Rd. to Wilson Rd. 0.56 ---- ---- ---- ---- ---- ---- ---- ---- ---- ---- ---- ---- ---- ---- ---- ---- ---- ---- ---- ---- ---- ---- ---- ---- 39.5 A 36.9 A 40.0 A 36.9 A
Wilson Rd. to Wayside Dr. 0.51 ---- ---- ---- ---- ---- ---- ---- ---- ---- ---- ---- ---- ---- ---- ---- ---- ---- ---- ---- ---- ---- ---- ---- ---- 30.3 B 32.2 B 36.4 A 30.9 B
Wayside Dr. to SR 46 0.25 ---- ---- ---- ---- ---- ---- ---- ---- ---- ---- ---- ---- ---- ---- ---- ---- ---- ---- ---- ---- ---- ---- ---- ---- 10.4 F 24.0 C 9.3 F 22.8 C 11.7 F 26.8 C 9.5 F 22.8 C
SR 46 to Oregon St. 2.10 ---- ---- ---- ---- ---- ---- ---- ---- ---- ---- ---- ---- ---- ---- ---- ---- ---- ---- ---- ---- ---- ---- ---- ---- 33.3 A 33.3 A 32.3 A 32.3 A 35.5 A 35.5 A 32.1 A 32.1 A
Oregon St. to I-4 0.89 ---- ---- ---- ---- ---- ---- ---- ---- ---- ---- ---- ---- ---- ---- ---- ---- ---- ---- ---- ---- ---- ---- ---- ---- 34.5 A 34.5 A 34.2 A 34.2 A 34.7 A 34.7 A 31.0 A 31.0 A
I-4 to CR 15 0.16 ---- ---- ---- ---- ---- ---- ---- ---- ---- ---- ---- ---- ---- ---- ---- ---- ---- ---- ---- ---- ---- ---- ---- ---- 10.3 E 10.3 E 30.0 B 30.0 B 15.0 D 15.0 D 27.4 B 27.4 B
Average 28.7 B 29.5 B 31.3 B 28.9 B
PM PEAK HOUR
CR 46A to Markham Rd. 0.43 ---- ---- ---- ---- ---- ---- ---- ---- ---- ---- ---- ---- ---- ---- ---- ---- ---- ---- ---- ---- ---- ---- ---- ---- 36.3 A 36.3 A 36.9 A 36.9 A 37.4 A 37.4 A 37.4 A 37.4 A
Markham Rd. to Wilson Rd. 0.56 ---- ---- ---- ---- ---- ---- ---- ---- ---- ---- ---- ---- ---- ---- ---- ---- ---- ---- ---- ---- ---- ---- ---- ---- 39.1 A 40.0 A 40.0 A 38.2 A
Wilson Rd. to Wayside Dr. 0.51 ---- ---- ---- ---- ---- ---- ---- ---- ---- ---- ---- ---- ---- ---- ---- ---- ---- ---- ---- ---- ---- ---- ---- ---- 39.2 A 39.2 A 39.7 A 38.7 A
Wayside Dr. to SR 46 0.25 ---- ---- ---- ---- ---- ---- ---- ---- ---- ---- ---- ---- ---- ---- ---- ---- ---- ---- ---- ---- ---- ---- ---- ---- 12.6 F 28.0 C 16.9 E 31.6 B 11.5 F 27.1 C 8.2 F 22.7 C
SR 46 to Oregon St. 2.10 ---- ---- ---- ---- ---- ---- ---- ---- ---- ---- ---- ---- ---- ---- ---- ---- ---- ---- ---- ---- ---- ---- ---- ---- 33.4 A 33.4 A 35.1 A 35.1 A 35.4 A 35.4 A 32.6 A 32.6 A
Oregon St. to I-4 0.89 ---- ---- ---- ---- ---- ---- ---- ---- ---- ---- ---- ---- ---- ---- ---- ---- ---- ---- ---- ---- ---- ---- ---- ---- 34.2 A 34.2 A 34.7 A 34.7 A 35.1 A 35.1 A 33.2 A 33.2 A
I-4 to CR 15 0.16 ---- ---- ---- ---- ---- ---- ---- ---- ---- ---- ---- ---- ---- ---- ---- ---- ---- ---- ---- ---- ---- ---- ---- ---- 13.7 E 13.7 E 25.3 B 25.3 B 15.5 D 15.5 D 28.2 B 28.2 B
Average 30.7 B 33.7 B 31.6 B 29.4 B
Roadway Distance
Segments (mile) (mph) LOS (mph) LOS (mph) LOS (mph) LOS (mph) LOS (mph) LOS (mph) LOS (mph) LOS (mph) LOS (mph) LOS (mph) LOS (mph) LOS (mph) LOS (mph) LOS (mph) LOS (mph) LOS (mph) LOS (mph) LOS (mph) LOS (mph) LOS
AM PEAK HOUR
CR 15 to I-4 0.16 ---- ---- ---- ---- ---- ---- ---- ---- ---- ---- ---- ---- ---- ---- ---- ---- ---- ---- ---- ---- ---- ---- ---- ---- 32.0 A 32.0 A 32.0 A 32.0 A 30.0 B 30.0 B 32.0 A 32.0 A
I-4 to Oregon St. 0.89 ---- ---- ---- ---- ---- ---- ---- ---- ---- ---- ---- ---- ---- ---- ---- ---- ---- ---- ---- ---- ---- ---- ---- ---- 34.5 A 34.5 A 34.7 A 34.7 A 34.9 A 34.9 A 33.4 A 33.4 A
Oregon St. to SR 46 2.10 ---- ---- ---- ---- ---- ---- ---- ---- ---- ---- ---- ---- ---- ---- ---- ---- ---- ---- ---- ---- ---- ---- ---- ---- 31.1 A 31.1 A 29.6 B 29.6 B 27.6 B 27.6 B 29.4 B 29.4 B
SR 46 to Wayside Dr. 0.25 ---- ---- ---- ---- ---- ---- ---- ---- ---- ---- ---- ---- ---- ---- ---- ---- ---- ---- ---- ---- ---- ---- ---- ---- 35.7 A 33.3 B 36.6 A 31.9 B
Wayside Dr. to Wilson Rd. 0.51 ---- ---- ---- ---- ---- ---- ---- ---- ---- ---- ---- ---- ---- ---- ---- ---- ---- ---- ---- ---- ---- ---- ---- ---- 29.1 B 27.1 C 31.5 B 32.6 B
Wilson Rd. to Markham Rd. 0.56 ---- ---- ---- ---- ---- ---- ---- ---- ---- ---- ---- ---- ---- ---- ---- ---- ---- ---- ---- ---- ---- ---- ---- ---- 38.6 A 33.8 B 37.3 A 31.9 B 39.5 A 35.5 A 36.9 A 34.1 B
Markham Rd. to CR 46A 0.43 ---- ---- ---- ---- ---- ---- ---- ---- ---- ---- ---- ---- ---- ---- ---- ---- ---- ---- ---- ---- ---- ---- ---- ---- 22.2 C 22.2 C 20.6 D 20.6 D 22.8 C 22.8 C 11.7 F 11.7 F
Average 31.3 B 29.9 B 30.1 B 27.4 C
PM PEAK HOUR
CR 15 to I-4 0.16 ---- ---- ---- ---- ---- ---- ---- ---- ---- ---- ---- ---- ---- ---- ---- ---- ---- ---- ---- ---- ---- ---- ---- ---- 31.0 A 31.0 A 32.0 A 32.0 A 29.1 B 29.1 B 32.0 A 32.0 A
I-4 to Oregon St. 0.89 ---- ---- ---- ---- ---- ---- ---- ---- ---- ---- ---- ---- ---- ---- ---- ---- ---- ---- ---- ---- ---- ---- ---- ---- 34.5 A 34.5 A 33.6 A 33.6 A 35.1 A 35.1 A 33.6 A 33.6 A
Oregon St. to SR 46 2.10 ---- ---- ---- ---- ---- ---- ---- ---- ---- ---- ---- ---- ---- ---- ---- ---- ---- ---- ---- ---- ---- ---- ---- ---- 24.5 B 24.5 B 29.5 B 29.5 B 28.1 B 28.1 B 26.3 B 26.3 B
SR 46 to Wayside Dr. 0.25 ---- ---- ---- ---- ---- ---- ---- ---- ---- ---- ---- ---- ---- ---- ---- ---- ---- ---- ---- ---- ---- ---- ---- ---- 36.6 A 35.7 A 36.6 A 35.7 A
Wayside Dr. to Wilson Rd. 0.51 ---- ---- ---- ---- ---- ---- ---- ---- ---- ---- ---- ---- ---- ---- ---- ---- ---- ---- ---- ---- ---- ---- ---- ---- 39.2 A 39.7 A 40.8 A 38.7 A
Wilson Rd. to Markham Rd. 0.56 ---- ---- ---- ---- ---- ---- ---- ---- ---- ---- ---- ---- ---- ---- ---- ---- ---- ---- ---- ---- ---- ---- ---- ---- 38.6 A 38.4 A 39.5 A 38.8 A 40.0 A 39.6 A 38.2 A 37.9 A
Markham Rd. to CR 46A 0.43 ---- ---- ---- ---- ---- ---- ---- ---- ---- ---- ---- ---- ---- ---- ---- ---- ---- ---- ---- ---- ---- ---- ---- ---- 31.5 B 31.5 B 27.4 C 27.4 C 27.7 C 27.7 C 30.4 B 30.4 B
Average 29.7 B 32.2 B 31.7 B 30.6 B
Year 2013
Rdwy Segment Rdwy Section
Average Speed Average Speed
Year 2013
Rdwy Segment Rdwy Section
Average Speed Average Speed
TABLE C39.1aYear 2014 Seminole County Travel Time & Delay Study
Year 2014 Seminole County Travel Time & Delay Study
CR 431 - Southbound Direction Historical Summary
Average Speed Average Speed Average Speed Average Speed Average Speed Average SpeedAverage Speed Average Speed Average Speed Average Speed Average Speed
Year 2006 Year 2007 Year 2008 Year 2009 Year 2010 Year 2014Year 2005
Average Speed Average Speed Average Speed Average Speed Average Speed Average Speed Average Speed Average SpeedAverage Speed Average Speed Average Speed Average Speed Average Speed Average Speed
Year 2011
Rdwy Segment Rdwy Section
Average Speed Average Speed
Year 2011
Rdwy Segment Rdwy Section
Average Speed Average Speed
Year 2012
Rdwy Segment Rdwy Section
Average Speed Average Speed
Year 2012
Rdwy Segment Rdwy Section
Average Speed Average Speed
D-46 CR 431
Roadway Distance
Segments (mile) (mph) LOS (mph) LOS (mph) LOS (mph) LOS (mph) LOS (mph) LOS (mph) LOS (mph) LOS (mph) LOS (mph) LOS (mph) LOS (mph) LOS (mph) LOS (mph) LOS (mph) LOS (mph) LOS (mph) LOS (mph) LOS (mph) LOS (mph) LOS
AM PEAK HOUR
Howell Branch Rd. to Dodd Rd. 1.93 ---- ---- ---- ---- ---- ---- ---- ---- ---- ---- ---- ---- ---- ---- ---- ---- ---- ---- ---- ---- ---- ---- ---- ---- 27.3 B 28.2 B 30.7 A 27.4 B
Dodd Rd. to Tuskawilla Rd. 0.77 ---- ---- ---- ---- ---- ---- ---- ---- ---- ---- ---- ---- ---- ---- ---- ---- ---- ---- ---- ---- ---- ---- ---- ---- 20.4 C 24.9 B 23.9 C 26.9 B 18.0 C 25.6 B 20.3 C 24.9 B
Average 23.2 C 26.9 B 25.6 B 24.9 B
PM PEAK HOUR
Howell Branch Rd. to Dodd Rd. 1.93 ---- ---- ---- ---- ---- ---- ---- ---- ---- ---- ---- ---- ---- ---- ---- ---- ---- ---- ---- ---- ---- ---- ---- ---- 29.6 B 27.3 B 28.8 B 26.6 B
Dodd Rd. to Tuskawilla Rd. 0.77 ---- ---- ---- ---- ---- ---- ---- ---- ---- ---- ---- ---- ---- ---- ---- ---- ---- ---- ---- ---- ---- ---- ---- ---- 20.7 C 26.4 B 22.1 C 25.6 B 22.1 C 26.5 B 20.8 C 24.6 B
Average 26.4 B 25.6 B 26.5 B 24.6 B
Roadway Distance
Segments (mile) (mph) LOS (mph) LOS (mph) LOS (mph) LOS (mph) LOS (mph) LOS (mph) LOS (mph) LOS (mph) LOS (mph) LOS (mph) LOS (mph) LOS (mph) LOS (mph) LOS (mph) LOS (mph) LOS (mph) LOS (mph) LOS (mph) LOS (mph) LOS
AM PEAK HOUR
Tuskawilla Rd. to Dodd Rd. 0.77 ---- ---- ---- ---- ---- ---- ---- ---- ---- ---- ---- ---- ---- ---- ---- ---- ---- ---- ---- ---- ---- ---- ---- ---- 23.2 C 26.2 B 21.0 C 28.7 B
Dodd Rd. to Howell Branch Rd. 1.93 ---- ---- ---- ---- ---- ---- ---- ---- ---- ---- ---- ---- ---- ---- ---- ---- ---- ---- ---- ---- ---- ---- ---- ---- 25.9 B 25.1 B 27.1 B 26.9 B 27.4 B 25.2 B 27.2 B 27.6 B
Average 25.1 B 26.9 B 25.2 B 27.6 B
PM PEAK HOUR
Tuskawilla Rd. to Dodd Rd. 0.77 ---- ---- ---- ---- ---- ---- ---- ---- ---- ---- ---- ---- ---- ---- ---- ---- ---- ---- ---- ---- ---- ---- ---- ---- 24.6 B 23.0 C 22.3 C 22.2 C
Dodd Rd. to Howell Branch Rd. 1.93 ---- ---- ---- ---- ---- ---- ---- ---- ---- ---- ---- ---- ---- ---- ---- ---- ---- ---- ---- ---- ---- ---- ---- ---- 25.7 B 25.4 B 25.3 B 24.6 B 26.0 B 24.8 B 28.7 B 26.5 B
Average 25.4 B 24.6 B 24.8 B 26.5 B
Year 2013
Rdwy Segment Rdwy Section
Average Speed Average Speed
Year 2013
Rdwy Segment Rdwy Section
Average Speed Average Speed
TABLE C40.1aYear 2014 Seminole County Travel Time & Delay Study
Dike Road - Eastbound Direction Historical Summary
Year 2014 Seminole County Travel Time & Delay Study
Dike Road - Westbound Direction Historical Summary
Average Speed Average Speed Average Speed Average Speed Average Speed Average SpeedAverage Speed Average Speed Average Speed Average Speed Average Speed
Year 2006 Year 2007 Year 2008 Year 2009 Year 2010 Year 2014Year 2005
Average Speed Average Speed Average Speed Average Speed Average Speed Average Speed Average Speed Average SpeedAverage Speed Average Speed Average Speed Average Speed Average Speed Average Speed
Year 2011
Rdwy Segment Rdwy Section
Average Speed Average Speed
Year 2011
Rdwy Segment Rdwy Section
Average Speed Average Speed
Year 2012
Rdwy Segment Rdwy Section
Average Speed Average Speed
Year 2012
Rdwy Segment Rdwy Section
Average Speed Average Speed
D-47 Dike Road
Roadway Distance
Segments (mile) (mph) LOS (mph) LOS (mph) LOS (mph) LOS (mph) LOS (mph) LOS (mph) LOS (mph) LOS (mph) LOS (mph) LOS (mph) LOS (mph) LOS (mph) LOS (mph) LOS (mph) LOS (mph) LOS (mph) LOS (mph) LOS (mph) LOS (mph) LOS
AM PEAK HOUR
SR 414 to Cub Lake Dr. 0.62 ---- ---- ---- ---- ---- ---- ---- ---- ---- ---- ---- ---- ---- ---- ---- ---- ---- ---- ---- ---- ---- ---- ---- ---- 35.1 A 35.1 A 37.2 A 37.2 A 38.7 A 38.7 A 37.2 A 37.2 A
Cub Lake Dr. to Bunnell Rd. 0.25 ---- ---- ---- ---- ---- ---- ---- ---- ---- ---- ---- ---- ---- ---- ---- ---- ---- ---- ---- ---- ---- ---- ---- ---- 22.1 C 22.1 C 19.0 D 19.0 D 22.7 C 22.7 C 30.6 B 30.6 B
Average 29.7 B 29.2 B 32.2 B 35.0 A
PM PEAK HOUR
SR 414 to Cub Lake Dr. 0.62 ---- ---- ---- ---- ---- ---- ---- ---- ---- ---- ---- ---- ---- ---- ---- ---- ---- ---- ---- ---- ---- ---- ---- ---- 26.6 C 26.6 C A 36.8 A C 38.7 A 38.7 A 37.6 A 37.6 A
Cub Lake Dr. to Bunnell Rd. 0.25 ---- ---- ---- ---- ---- ---- ---- ---- ---- ---- ---- ---- ---- ---- ---- ---- ---- ---- ---- ---- ---- ---- ---- ---- 24.2 C 24.2 C C 25.9 C C 27.8 C 27.8 C 23.8 C 23.8 C
Average 31.3 B 32.8 B 34.8 B 32.2 B
Roadway Distance
Segments (mile) (mph) LOS (mph) LOS (mph) LOS (mph) LOS (mph) LOS (mph) LOS (mph) LOS (mph) LOS (mph) LOS (mph) LOS (mph) LOS (mph) LOS (mph) LOS (mph) LOS (mph) LOS (mph) LOS (mph) LOS (mph) LOS (mph) LOS (mph) LOS
AM PEAK HOUR
Bunnell Rd. to Cub Lake Dr. 0.25 ---- ---- ---- ---- ---- ---- ---- ---- ---- ---- ---- ---- ---- ---- ---- ---- ---- ---- ---- ---- ---- ---- ---- ---- 34.1 B 34.1 B 36.6 A 36.6 A 36.6 A 36.6 A 34.9 B 34.9 B
Cub Lake Dr. to SR 414 0.62 ---- ---- ---- ---- ---- ---- ---- ---- ---- ---- ---- ---- ---- ---- ---- ---- ---- ---- ---- ---- ---- ---- ---- ---- 12.4 F 12.4 F 18.9 D 18.9 D 15.6 E 15.6 E 15.1 E 15.1 E
Average 15.1 E 21.9 D 18.7 D 18.0 D
PM PEAK HOUR
Bunnell Rd. to Cub Lake Dr. 0.25 ---- ---- ---- ---- ---- ---- ---- ---- ---- ---- ---- ---- ---- ---- ---- ---- ---- ---- ---- ---- ---- ---- ---- ---- 35.7 A 35.7 A 35.7 A 35.7 A 35.7 A 35.7 A 34.9 B 34.9 B
Cub Lake Dr. to SR 414 0.62 ---- ---- ---- ---- ---- ---- ---- ---- ---- ---- ---- ---- ---- ---- ---- ---- ---- ---- ---- ---- ---- ---- ---- ---- 15.4 E 15.4 E 17.4 D 17.4 D 18.0 D 18.0 D 13.1 E 13.1 E
Average 17.6 D 20.4 D 21.0 D 16.0 E
Year 2013
Rdwy Segment Rdwy Section
Average Speed Average Speed
Year 2013
Rdwy Segment Rdwy Section
Average Speed Average Speed
TABLE C41.1aYear 2014 Seminole County Travel Time & Delay Study
Eden Park Road - Northbound Direction Historical Summary
Year 2014 Seminole County Travel Time & Delay Study
Eden Park Road - Southbound Direction Historical Summary
Average Speed Average Speed Average Speed Average Speed Average Speed Average SpeedAverage Speed Average Speed Average Speed Average Speed Average Speed
Year 2006 Year 2007 Year 2008 Year 2009 Year 2010 Year 2014Year 2005
Average Speed Average Speed Average Speed Average Speed Average Speed Average Speed Average Speed Average SpeedAverage Speed Average Speed Average Speed Average Speed Average Speed Average Speed
Year 2011
Rdwy Segment Rdwy Section
Average Speed Average Speed
Year 2011
Rdwy Segment Rdwy Section
Average Speed Average Speed
Year 2012
Rdwy Segment Rdwy Section
Average Speed Average Speed
Year 2012
Rdwy Segment Rdwy Section
Average Speed Average Speed
D-48 Eden Park Road
Roadway Distance
Segments (mile) (mph) LOS (mph) LOS (mph) LOS (mph) LOS (mph) LOS (mph) LOS (mph) LOS (mph) LOS (mph) LOS (mph) LOS (mph) LOS (mph) LOS (mph) LOS (mph) LOS (mph) LOS (mph) LOS (mph) LOS (mph) LOS (mph) LOS (mph) LOS
AM PEAK HOUR
Markham Woods Rd. to Sunshine Tree Blvd. 0.21 ---- ---- ---- ---- ---- ---- ---- ---- ---- ---- ---- ---- ---- ---- ---- ---- ---- ---- ---- ---- ---- ---- ---- ---- 30.7 A 30.0 B 34.1 A 30.0 B
Sunshine Tree Blvd. to I-4 0.14 ---- ---- ---- ---- ---- ---- ---- ---- ---- ---- ---- ---- ---- ---- ---- ---- ---- ---- ---- ---- ---- ---- ---- ---- 32.3 A 31.1 A 35.0 A 32.3 A
I-4 to Foxridge Run Rd. 0.18 ---- ---- ---- ---- ---- ---- ---- ---- ---- ---- ---- ---- ---- ---- ---- ---- ---- ---- ---- ---- ---- ---- ---- ---- 31.8 A 33.7 A 36.0 A 34.8 A
Foxridge Run Rd. to Tollgate Trail 0.15 ---- ---- ---- ---- ---- ---- ---- ---- ---- ---- ---- ---- ---- ---- ---- ---- ---- ---- ---- ---- ---- ---- ---- ---- 28.1 B 30.7 A 32.1 A 31.6 A 34.6 A 34.9 A 33.3 A 32.4 A
Tollgate Trail to Woodlands Elementary 0.09 ---- ---- ---- ---- ---- ---- ---- ---- ---- ---- ---- ---- ---- ---- ---- ---- ---- ---- ---- ---- ---- ---- ---- ---- 20.8 C 18.6 C 21.6 C 36.0 A
Woodlands Elementary to Marcy Blvd. 0.14 ---- ---- ---- ---- ---- ---- ---- ---- ---- ---- ---- ---- ---- ---- ---- ---- ---- ---- ---- ---- ---- ---- ---- ---- 24.7 B 24.7 B 29.0 B 21.5 C
Marcy Blvd. to Myrtle Lake Hills Rd. 0.09 ---- ---- ---- ---- ---- ---- ---- ---- ---- ---- ---- ---- ---- ---- ---- ---- ---- ---- ---- ---- ---- ---- ---- ---- 28.4 B 28.4 B 30.0 B 24.5 B
Myrtle Lake Hills Rd. to Rangeline Rd. 0.34 ---- ---- ---- ---- ---- ---- ---- ---- ---- ---- ---- ---- ---- ---- ---- ---- ---- ---- ---- ---- ---- ---- ---- ---- 25.8 B 25.1 B 24.9 B 24.1 B 20.4 C 23.0 C 15.6 D 19.1 C
Range Line Rd. to Lake Emma Road 0.24 ---- ---- ---- ---- ---- ---- ---- ---- ---- ---- ---- ---- ---- ---- ---- ---- ---- ---- ---- ---- ---- ---- ---- ---- 28.8 B 28.8 B 23.6 C 23.6 C 33.5 A 33.5 A 20.3 C 20.3 C
Lake Emma Road to Hearthstone Lane 0.17 ---- ---- ---- ---- ---- ---- ---- ---- ---- ---- ---- ---- ---- ---- ---- ---- ---- ---- ---- ---- ---- ---- ---- ---- 34.0 A 31.9 A 35.2 A 32.9 A
Hearthstone Lane to Lazy Acres Lane 0.47 ---- ---- ---- ---- ---- ---- ---- ---- ---- ---- ---- ---- ---- ---- ---- ---- ---- ---- ---- ---- ---- ---- ---- ---- 29.7 B 28.8 B 32.4 A 29.7 B
Lazy Acres Lane to CR 427 0.43 ---- ---- ---- ---- ---- ---- ---- ---- ---- ---- ---- ---- ---- ---- ---- ---- ---- ---- ---- ---- ---- ---- ---- ---- 17.6 C 23.6 B 12.3 D 18.9 C 29.0 A 31.3 A 14.0 C 20.7 B
Average 25.9 B 22.9 C 29.6 B 22.3 C
PM PEAK HOUR
Markham Woods Rd. to Sunshine Tree Blvd. 0.21 ---- ---- ---- ---- ---- ---- ---- ---- ---- ---- ---- ---- ---- ---- ---- ---- ---- ---- ---- ---- ---- ---- ---- ---- 30.7 A 32.3 A 34.1 A 32.3 A
Sunshine Tree Blvd. to I-4 0.14 ---- ---- ---- ---- ---- ---- ---- ---- ---- ---- ---- ---- ---- ---- ---- ---- ---- ---- ---- ---- ---- ---- ---- ---- 31.1 A 35.0 A 33.6 A 33.6 A
I-4 to Foxridge Run Rd. 0.18 ---- ---- ---- ---- ---- ---- ---- ---- ---- ---- ---- ---- ---- ---- ---- ---- ---- ---- ---- ---- ---- ---- ---- ---- 33.7 A 40.0 A 34.8 A 36.0 A
Foxridge Run Rd. to Tollgate Trail 0.15 ---- ---- ---- ---- ---- ---- ---- ---- ---- ---- ---- ---- ---- ---- ---- ---- ---- ---- ---- ---- ---- ---- ---- ---- 33.3 A 32.1 A 39.1 A 36.1 A 34.6 A 34.3 A 33.3 A 33.7 A
Tollgate Trail to Woodlands Elementary 0.09 ---- ---- ---- ---- ---- ---- ---- ---- ---- ---- ---- ---- ---- ---- ---- ---- ---- ---- ---- ---- ---- ---- ---- ---- 21.6 C 41.5 A 27.0 B 24.5 B
Woodlands Elementary to Marcy Blvd. 0.14 ---- ---- ---- ---- ---- ---- ---- ---- ---- ---- ---- ---- ---- ---- ---- ---- ---- ---- ---- ---- ---- ---- ---- ---- 31.1 A 35.0 A 32.3 A 24.7 B
Marcy Blvd. to Myrtle Lake Hills Rd. 0.09 ---- ---- ---- ---- ---- ---- ---- ---- ---- ---- ---- ---- ---- ---- ---- ---- ---- ---- ---- ---- ---- ---- ---- ---- 33.7 A 38.6 A 36.0 A 30.0 B
Myrtle Lake Hills Rd. to Rangeline Rd. 0.34 ---- ---- ---- ---- ---- ---- ---- ---- ---- ---- ---- ---- ---- ---- ---- ---- ---- ---- ---- ---- ---- ---- ---- ---- 20.2 C 23.4 C 22.2 C 27.7 B 16.3 D 21.3 C 16.9 D 20.3 C
Range Line Rd. to Lake Emma Road 0.24 ---- ---- ---- ---- ---- ---- ---- ---- ---- ---- ---- ---- ---- ---- ---- ---- ---- ---- ---- ---- ---- ---- ---- ---- 25.7 B 25.7 B 22.9 C 22.9 C 23.6 C 23.6 C 24.8 B 24.8 B
Lake Emma Road to Hearthstone Lane 0.17 ---- ---- ---- ---- ---- ---- ---- ---- ---- ---- ---- ---- ---- ---- ---- ---- ---- ---- ---- ---- ---- ---- ---- ---- 34.0 A 39.2 A 34.0 A 32.9 A
Hearthstone Lane to Lazy Acres Lane 0.47 ---- ---- ---- ---- ---- ---- ---- ---- ---- ---- ---- ---- ---- ---- ---- ---- ---- ---- ---- ---- ---- ---- ---- ---- 31.3 A 35.2 A 31.0 A 29.4 B
Lazy Acres Lane to CR 427 0.43 ---- ---- ---- ---- ---- ---- ---- ---- ---- ---- ---- ---- ---- ---- ---- ---- ---- ---- ---- ---- ---- ---- ---- ---- 16.1 C 22.9 B 18.3 C 26.0 A 25.8 A 29.0 A 21.9 B 26.2 A
Average 25.2 B 28.1 B 27.1 B 25.7 B
Roadway Distance
Segments (mile) (mph) LOS (mph) LOS (mph) LOS (mph) LOS (mph) LOS (mph) LOS (mph) LOS (mph) LOS (mph) LOS (mph) LOS (mph) LOS (mph) LOS (mph) LOS (mph) LOS (mph) LOS (mph) LOS (mph) LOS (mph) LOS (mph) LOS (mph) LOS
AM PEAK HOUR
CR 427 to Lazy Acres Lane 0.43 ---- ---- ---- ---- ---- ---- ---- ---- ---- ---- ---- ---- ---- ---- ---- ---- ---- ---- ---- ---- ---- ---- ---- ---- 26.6 A 28.0 A 30.0 A 26.1 A
Lazy Acres Lane to Hearthstone Lane 0.47 ---- ---- ---- ---- ---- ---- ---- ---- ---- ---- ---- ---- ---- ---- ---- ---- ---- ---- ---- ---- ---- ---- ---- ---- 29.4 B 30.0 B 31.3 A 30.3 A
Hearthstone Lane to Lake Emma Road 0.17 ---- ---- ---- ---- ---- ---- ---- ---- ---- ---- ---- ---- ---- ---- ---- ---- ---- ---- ---- ---- ---- ---- ---- ---- 12.7 E 23.5 C 10.6 E 22.8 C 15.9 D 26.7 B 18.2 C 25.9 B
Lake Emma Road to Rangeline Road 0.24 ---- ---- ---- ---- ---- ---- ---- ---- ---- ---- ---- ---- ---- ---- ---- ---- ---- ---- ---- ---- ---- ---- ---- ---- 29.4 B 29.4 B 18.0 D 18.0 D 22.2 C 22.2 C 28.2 B 28.2 B
Range Line Road to Myrtle Lake Hills Rd. 0.34 ---- ---- ---- ---- ---- ---- ---- ---- ---- ---- ---- ---- ---- ---- ---- ---- ---- ---- ---- ---- ---- ---- ---- ---- 31.4 A 31.4 A 32.9 A 27.6 B
Myrtle Lake Hills Rd. to Marcy Blvd. 0.09 ---- ---- ---- ---- ---- ---- ---- ---- ---- ---- ---- ---- ---- ---- ---- ---- ---- ---- ---- ---- ---- ---- ---- ---- 19.3 C 28.4 B 28.4 B 14.6 D
Marcy Blvd. to Woodlands Elementary 0.14 ---- ---- ---- ---- ---- ---- ---- ---- ---- ---- ---- ---- ---- ---- ---- ---- ---- ---- ---- ---- ---- ---- ---- ---- 16.2 D 16.2 D 13.8 E 17.1 D
Woodlands Elementary to Tollgate Trail 0.09 ---- ---- ---- ---- ---- ---- ---- ---- ---- ---- ---- ---- ---- ---- ---- ---- ---- ---- ---- ---- ---- ---- ---- ---- 28.4 B 24.1 B 31.8 A 25.9 B 31.8 A 24.9 B 28.4 B 22.1 C
Tollgate Trail to Foxridge Run Rd. 0.15 ---- ---- ---- ---- ---- ---- ---- ---- ---- ---- ---- ---- ---- ---- ---- ---- ---- ---- ---- ---- ---- ---- ---- ---- 33.3 A 32.1 A 34.6 A 32.1 A
Foxridge Run Rd. to I-4 0.18 ---- ---- ---- ---- ---- ---- ---- ---- ---- ---- ---- ---- ---- ---- ---- ---- ---- ---- ---- ---- ---- ---- ---- ---- 33.7 A 33.7 A 36.0 A 33.7 A
I-4 to Sunshine Tree Blvd. 0.14 ---- ---- ---- ---- ---- ---- ---- ---- ---- ---- ---- ---- ---- ---- ---- ---- ---- ---- ---- ---- ---- ---- ---- ---- 32.3 A 26.2 B 33.6 A 31.1 A
Sunshine Tree Blvd.to Markham Woods Rd. 0.21 ---- ---- ---- ---- ---- ---- ---- ---- ---- ---- ---- ---- ---- ---- ---- ---- ---- ---- ---- ---- ---- ---- ---- ---- 15.2 D 24.3 B 11.8 E 20.5 C 28.6 B 32.6 A 18.0 D 26.0 B
Average 24.3 B 22.3 C 27.0 B 25.0 B
PM PEAK HOUR
CR 427 to Lazy Acres Lane 0.43 ---- ---- ---- ---- ---- ---- ---- ---- ---- ---- ---- ---- ---- ---- ---- ---- ---- ---- ---- ---- ---- ---- ---- ---- 27.7 A 33.9 A 29.3 A 29.0 A
Lazy Acres Lane to Hearthstone Lane 0.47 ---- ---- ---- ---- ---- ---- ---- ---- ---- ---- ---- ---- ---- ---- ---- ---- ---- ---- ---- ---- ---- ---- ---- ---- 33.2 A 36.2 A 31.0 A 30.7 A
Hearthstone Lane to Lake Emma Road 0.17 ---- ---- ---- ---- ---- ---- ---- ---- ---- ---- ---- ---- ---- ---- ---- ---- ---- ---- ---- ---- ---- ---- ---- ---- 10.1 E 23.0 C 14.4 D 28.5 B 14.0 E 25.5 B 12.0 E 24.1 B
Lake Emma Road to Rangeline Road 0.24 ---- ---- ---- ---- ---- ---- ---- ---- ---- ---- ---- ---- ---- ---- ---- ---- ---- ---- ---- ---- ---- ---- ---- ---- 21.8 C 21.8 C 26.7 B 26.7 B 19.2 C 19.2 C 22.9 C 22.9 C
Range Line Road to Myrtle Lake Hills Rd. 0.34 ---- ---- ---- ---- ---- ---- ---- ---- ---- ---- ---- ---- ---- ---- ---- ---- ---- ---- ---- ---- ---- ---- ---- ---- 31.9 A 35.2 A 31.9 A 31.9 A
Myrtle Lake Hills Rd. to Marcy Blvd. 0.09 ---- ---- ---- ---- ---- ---- ---- ---- ---- ---- ---- ---- ---- ---- ---- ---- ---- ---- ---- ---- ---- ---- ---- ---- 33.7 A 38.6 A 31.8 A 28.4 B
Marcy Blvd. to Woodlands Elementary 0.14 ---- ---- ---- ---- ---- ---- ---- ---- ---- ---- ---- ---- ---- ---- ---- ---- ---- ---- ---- ---- ---- ---- ---- ---- 28.0 B 28.0 B 30.0 B 29.0 B
Woodlands Elementary to Tollgate Trail 0.09 ---- ---- ---- ---- ---- ---- ---- ---- ---- ---- ---- ---- ---- ---- ---- ---- ---- ---- ---- ---- ---- ---- ---- ---- 31.8 A 31.2 A 38.6 A 34.1 A 36.0 A 31.9 A 36.0 A 31.2 A
Tollgate Trail to Foxridge Run Rd. 0.15 ---- ---- ---- ---- ---- ---- ---- ---- ---- ---- ---- ---- ---- ---- ---- ---- ---- ---- ---- ---- ---- ---- ---- ---- 34.6 A 34.6 A 34.6 A 34.6 A
Foxridge Run Rd. to I-4 0.18 ---- ---- ---- ---- ---- ---- ---- ---- ---- ---- ---- ---- ---- ---- ---- ---- ---- ---- ---- ---- ---- ---- ---- ---- 34.8 A 38.6 A 33.7 A 33.7 A
I-4 to Sunshine Tree Blvd. 0.14 ---- ---- ---- ---- ---- ---- ---- ---- ---- ---- ---- ---- ---- ---- ---- ---- ---- ---- ---- ---- ---- ---- ---- ---- 32.3 A 36.5 A 31.1 A 32.3 A
Sunshine Tree Blvd.to Markham Woods Rd. 0.21 ---- ---- ---- ---- ---- ---- ---- ---- ---- ---- ---- ---- ---- ---- ---- ---- ---- ---- ---- ---- ---- ---- ---- ---- 14.3 D 23.9 C 20.0 C 29.1 B 13.5 E 22.9 C 22.5 C 29.1 B
Average 24.7 B 29.7 B 25.3 B 26.7 B
Year 2013
Rdwy Segment Rdwy Section
Average Speed Average Speed
Year 2013
Rdwy Segment Rdwy Section
Average Speed Average Speed
TABLE C42.1a
Year 2014 Seminole County Travel Time & Delay StudyEE Williamson Road/Longwood Hills Road - Eastbound Direction Historical Summary
TABLE C42.1bYear 2014 Seminole County Travel Time & Delay Study
EE Williamson Road/Longwood Hills Road - Westbound Direction Historical Summary
Average Speed Average Speed Average Speed Average Speed Average Speed Average SpeedAverage Speed Average Speed Average Speed Average Speed Average Speed
Year 2006 Year 2007 Year 2008 Year 2009 Year 2010 Year 2014Year 2005
Average Speed Average Speed Average Speed Average Speed Average Speed Average Speed Average Speed Average SpeedAverage Speed Average Speed Average Speed Average Speed Average Speed Average Speed
Year 2011
Rdwy Segment Rdwy Section
Average Speed Average Speed
Year 2011
Rdwy Segment Rdwy Section
Average Speed Average Speed
Year 2012
Rdwy Segment Rdwy Section
Average Speed Average Speed
Year 2012
Rdwy Segment Rdwy Section
Average Speed Average Speed
D-49 EE Williamson Road/Longwood Hills Road
Roadway Distance
Segments (mile) (mph) LOS (mph) LOS (mph) LOS (mph) LOS (mph) LOS (mph) LOS (mph) LOS (mph) LOS (mph) LOS (mph) LOS (mph) LOS (mph) LOS (mph) LOS (mph) LOS (mph) LOS (mph) LOS (mph) LOS (mph) LOS (mph) LOS (mph) LOS
AM PEAK HOUR
Lake Emma Rd. to Lake Park Dr. 1.07 ---- ---- ---- ---- ---- ---- ---- ---- ---- ---- ---- ---- ---- ---- ---- ---- ---- ---- ---- ---- ---- ---- ---- ---- 28.0 B 28.0 B 25.7 B 25.7 B 27.9 B 27.9 B 26.4 B 26.4 B
Lake Park Dr. to Longwood Lake Mary Rd. 0.48 ---- ---- ---- ---- ---- ---- ---- ---- ---- ---- ---- ---- ---- ---- ---- ---- ---- ---- ---- ---- ---- ---- ---- ---- 17.6 D 17.6 D 26.4 B 26.4 B 25.9 B 25.9 B 21.3 C 21.3 C
Average 23.7 C 25.9 B 27.3 B 24.6 B
PM PEAK HOUR
Lake Emma Rd. to Lake Park Dr. 1.07 ---- ---- ---- ---- ---- ---- ---- ---- ---- ---- ---- ---- ---- ---- ---- ---- ---- ---- ---- ---- ---- ---- ---- ---- 29.0 B 29.0 B 28.0 B 28.0 B 29.0 B 29.0 B 25.9 B 25.9 B
Lake Park Dr. to Longwood Lake Mary Rd. 0.48 ---- ---- ---- ---- ---- ---- ---- ---- ---- ---- ---- ---- ---- ---- ---- ---- ---- ---- ---- ---- ---- ---- ---- ---- 25.7 B 25.7 B 25.9 B 25.9 B 27.2 B 27.2 B 24.4 B 24.4 B
Average 27.9 B 27.4 B 28.4 B 25.4 B
Roadway Distance
Segments (mile) (mph) LOS (mph) LOS (mph) LOS (mph) LOS (mph) LOS (mph) LOS (mph) LOS (mph) LOS (mph) LOS (mph) LOS (mph) LOS (mph) LOS (mph) LOS (mph) LOS (mph) LOS (mph) LOS (mph) LOS (mph) LOS (mph) LOS (mph) LOS
AM PEAK HOUR
Longwood Lake Mary Rd. to Lake Park Dr. 0.48 ---- ---- ---- ---- ---- ---- ---- ---- ---- ---- ---- ---- ---- ---- ---- ---- ---- ---- ---- ---- ---- ---- ---- ---- 22.9 C 22.9 C 22.9 C 22.9 C 25.3 B 25.3 B 21.0 C 21.0 C
Lake Park Dr. to Lake Emma Rd. 1.07 ---- ---- ---- ---- ---- ---- ---- ---- ---- ---- ---- ---- ---- ---- ---- ---- ---- ---- ---- ---- ---- ---- ---- ---- 28.5 B 28.5 B 23.0 C 23.0 C 26.7 B 26.7 B 25.9 B 25.9 B
Average 26.5 B 23.0 C 26.3 B 24.2 B
PM PEAK HOUR
Longwood Lake Mary Rd. to Lake Park Dr. 0.48 ---- ---- ---- ---- ---- ---- ---- ---- ---- ---- ---- ---- ---- ---- ---- ---- ---- ---- ---- ---- ---- ---- ---- ---- 24.0 C 24.0 C 25.7 B 25.7 B 26.2 B 26.2 B 21.2 C 21.2 C
Lake Park Dr. to Lake Emma Rd. 1.07 ---- ---- ---- ---- ---- ---- ---- ---- ---- ---- ---- ---- ---- ---- ---- ---- ---- ---- ---- ---- ---- ---- ---- ---- 22.2 C 22.2 C 23.3 C 23.3 C 29.0 B 29.0 B 21.9 C 21.9 C
Average 22.7 C 24.0 C 28.1 B 21.7 C
Year 2013
Rdwy Segment Rdwy Section
Average Speed Average Speed
Year 2013
Rdwy Segment Rdwy Section
Average Speed Average Speed
TABLE C43.1a
Year 2014 Seminole County Travel Time & Delay StudyGreenway Boulevard - Eastbound Direction Historical Summary
Year 2014 Seminole County Travel Time & Delay Study
Greenway Boulevard - Westbound Direction Historical Summary
Average Speed Average Speed Average Speed Average Speed Average Speed Average SpeedAverage Speed Average Speed Average Speed Average Speed Average Speed
Year 2006 Year 2007 Year 2008 Year 2009 Year 2010 Year 2014Year 2005
Average Speed Average Speed Average Speed Average Speed Average Speed Average Speed Average Speed Average SpeedAverage Speed Average Speed Average Speed Average Speed Average Speed Average Speed
Year 2011
Rdwy Segment Rdwy Section
Average Speed Average Speed
Year 2011
Rdwy Segment Rdwy Section
Average Speed Average Speed
Year 2012
Rdwy Segment Rdwy Section
Average Speed Average Speed
Year 2012
Rdwy Segment Rdwy Section
Average Speed Average Speed
D-50 Greenway Boulevard
Roadway Distance
Segments (mile) (mph) LOS (mph) LOS (mph) LOS (mph) LOS (mph) LOS (mph) LOS (mph) LOS (mph) LOS (mph) LOS (mph) LOS (mph) LOS (mph) LOS (mph) LOS (mph) LOS (mph) LOS (mph) LOS (mph) LOS (mph) LOS (mph) LOS (mph) LOS
AM PEAK HOUR
Lake Emma Rd. to Lake Way Rd. 1.03 ---- ---- ---- ---- ---- ---- ---- ---- ---- ---- ---- ---- ---- ---- ---- ---- ---- ---- ---- ---- ---- ---- ---- ---- 27.5 B 27.5 B 30.4 A 30.4 A 31.5 A 31.5 A 30.4 A 30.4 A
Lake Way Rd. to Sun Dr. 0.42 ---- ---- ---- ---- ---- ---- ---- ---- ---- ---- ---- ---- ---- ---- ---- ---- ---- ---- ---- ---- ---- ---- ---- ---- 31.1 A 34.5 A 32.7 A 32.7 A
Sun Dr. to Lake Mary Blvd. 0.24 ---- ---- ---- ---- ---- ---- ---- ---- ---- ---- ---- ---- ---- ---- ---- ---- ---- ---- ---- ---- ---- ---- ---- ---- 11.5 E 19.2 C 11.3 E 19.8 C 8.8 F 16.4 D 13.3 E 21.4 C
Average 23.5 C 25.2 B 23.2 C 26.1 B
PM PEAK HOUR
Lake Emma Rd. to Lake Way Rd. 1.03 ---- ---- ---- ---- ---- ---- ---- ---- ---- ---- ---- ---- ---- ---- ---- ---- ---- ---- ---- ---- ---- ---- ---- ---- 30.6 A 30.6 A 28.6 B 28.6 B 30.3 A 30.3 A 30.1 A 30.1 A
Lake Way Rd. to Sun Dr. 0.42 ---- ---- ---- ---- ---- ---- ---- ---- ---- ---- ---- ---- ---- ---- ---- ---- ---- ---- ---- ---- ---- ---- ---- ---- 29.0 B 35.5 A 34.1 A 34.1 A
Sun Dr. to Lake Mary Blvd. 0.24 ---- ---- ---- ---- ---- ---- ---- ---- ---- ---- ---- ---- ---- ---- ---- ---- ---- ---- ---- ---- ---- ---- ---- ---- 14.8 D 21.5 C 8.5 F 16.5 D 12.3 E 20.7 C 7.3 F 14.6 D
Average 26.3 B 22.2 C 25.7 B 21.3 C
Roadway Distance
Segments (mile) (mph) LOS (mph) LOS (mph) LOS (mph) LOS (mph) LOS (mph) LOS (mph) LOS (mph) LOS (mph) LOS (mph) LOS (mph) LOS (mph) LOS (mph) LOS (mph) LOS (mph) LOS (mph) LOS (mph) LOS (mph) LOS (mph) LOS (mph) LOS
AM PEAK HOUR
Lake Mary Blvd. to Sun Dr. 0.24 ---- ---- ---- ---- ---- ---- ---- ---- ---- ---- ---- ---- ---- ---- ---- ---- ---- ---- ---- ---- ---- ---- ---- ---- 20.0 C 36.0 A 30.0 B 31.3 A
Sun Dr. to Lake Way Rd. 0.42 ---- ---- ---- ---- ---- ---- ---- ---- ---- ---- ---- ---- ---- ---- ---- ---- ---- ---- ---- ---- ---- ---- ---- ---- 26.0 B 23.4 C 33.2 A 34.1 A 34.5 A 32.7 A 32.3 A 31.9 A
Lake Way Rd. to Lake Emma Rd. 1.03 ---- ---- ---- ---- ---- ---- ---- ---- ---- ---- ---- ---- ---- ---- ---- ---- ---- ---- ---- ---- ---- ---- ---- ---- 23.8 C 23.8 C 24.8 B 24.8 B 24.5 B 24.5 B 23.0 C 23.0 C
Average 23.6 C 27.8 B 27.2 B 25.8 B
PM PEAK HOUR
Lake Mary Blvd. to Sun Dr. 0.24 ---- ---- ---- ---- ---- ---- ---- ---- ---- ---- ---- ---- ---- ---- ---- ---- ---- ---- ---- ---- ---- ---- ---- ---- 16.6 D 23.6 C 28.2 B 26.7 B
Sun Dr. to Lake Way Rd. 0.42 ---- ---- ---- ---- ---- ---- ---- ---- ---- ---- ---- ---- ---- ---- ---- ---- ---- ---- ---- ---- ---- ---- ---- ---- 35.0 A 24.9 B 31.1 A 27.9 B 32.3 A 30.7 A 29.3 B 28.3 B
Lake Way Rd. to Lake Emma Rd. 1.03 ---- ---- ---- ---- ---- ---- ---- ---- ---- ---- ---- ---- ---- ---- ---- ---- ---- ---- ---- ---- ---- ---- ---- ---- 22.9 C 22.9 C 20.3 C 20.3 C 27.6 B 27.6 B 19.2 C 19.2 C
Average 23.6 C 22.7 C 28.7 B 21.9 C
Year 2013
Rdwy Segment Rdwy Section
Average Speed Average Speed
Year 2013
Rdwy Segment Rdwy Section
Average Speed Average Speed
TABLE C44.1a
Year 2014 Seminole County Travel Time & Delay StudyGreenwood Boulevard - Eastbound Direction Historical Summary
Year 2014 Seminole County Travel Time & Delay Study
Greenwood Boulevard - Westbound Direction Historical Summary
Average Speed Average Speed Average Speed Average Speed Average Speed Average SpeedAverage Speed Average Speed Average Speed Average Speed Average Speed
Year 2006 Year 2007 Year 2008 Year 2009 Year 2010 Year 2014Year 2005
Average Speed Average Speed Average Speed Average Speed Average Speed Average Speed Average Speed Average SpeedAverage Speed Average Speed Average Speed Average Speed Average Speed Average Speed
Year 2011
Rdwy Segment Rdwy Section
Average Speed Average Speed
Year 2011
Rdwy Segment Rdwy Section
Average Speed Average Speed
Year 2012
Rdwy Segment Rdwy Section
Average Speed Average Speed
Year 2012
Rdwy Segment Rdwy Section
Average Speed Average Speed
D-51 Greenwood Boulevard
Roadway Distance
Segments (mile) (mph) LOS (mph) LOS (mph) LOS (mph) LOS (mph) LOS (mph) LOS (mph) LOS (mph) LOS (mph) LOS (mph) LOS (mph) LOS (mph) LOS (mph) LOS (mph) LOS (mph) LOS (mph) LOS (mph) LOS (mph) LOS (mph) LOS (mph) LOS
AM PEAK HOUR
SR 434 to Wekiva Springs Rd. 0.58 ---- ---- ---- ---- ---- ---- ---- ---- ---- ---- ---- ---- ---- ---- ---- ---- ---- ---- ---- ---- ---- ---- ---- ---- 18.4 C 18.4 C 17.4 C 17.4 C 15.4 C 15.4 C 17.1 C 17.1 C
Average 18.4 C 17.4 C 15.4 C 17.1 C
PM PEAK HOUR
SR 434 to Wekiva Springs Rd. 0.58 ---- ---- ---- ---- ---- ---- ---- ---- ---- ---- ---- ---- ---- ---- ---- ---- ---- ---- ---- ---- ---- ---- ---- ---- 13.7 C 13.7 C 10.4 D 10.4 D 10.2 D 10.2 D 17.9 C 17.9 C
Average 13.7 C 10.4 D 10.2 D 17.9 C
Roadway Distance
Segments (mile) (mph) LOS (mph) LOS (mph) LOS (mph) LOS (mph) LOS (mph) LOS (mph) LOS (mph) LOS (mph) LOS (mph) LOS (mph) LOS (mph) LOS (mph) LOS (mph) LOS (mph) LOS (mph) LOS (mph) LOS (mph) LOS (mph) LOS (mph) LOS
AM PEAK HOUR
Wekiva Springs Rd. to SR 434 0.58 ---- ---- ---- ---- ---- ---- ---- ---- ---- ---- ---- ---- ---- ---- ---- ---- ---- ---- ---- ---- ---- ---- ---- ---- 14.4 C 14.4 C 20.8 B 20.8 B 15.5 C 15.5 C 16.2 C 16.2 C
Average 14.4 C 20.8 B 15.5 C 16.2 C
PM PEAK HOUR
Wekiva Springs Rd. to SR 434 0.58 ---- ---- ---- ---- ---- ---- ---- ---- ---- ---- ---- ---- ---- ---- ---- ---- ---- ---- ---- ---- ---- ---- ---- ---- 17.0 C 17.0 C 20.2 B 20.2 B 15.3 C 15.3 C 14.9 C 14.9 C
Average 17.0 C 20.2 B 15.3 C 14.9 C
Year 2013
Rdwy Segment Rdwy Section
Average Speed Average Speed
Year 2013
Rdwy Segment Rdwy Section
Average Speed Average Speed
TABLE C45.1a
Year 2014 Seminole County Travel Time & Delay StudyE. Lake Brantley Drive - Northbound Direction Historical Summary
Year 2014 Seminole County Travel Time & Delay Study
E. Lake Brantley Drive - Southbound Direction Historical Summary
Average Speed Average Speed Average Speed Average Speed Average Speed Average SpeedAverage Speed Average Speed Average Speed Average Speed Average Speed
Year 2006 Year 2007 Year 2008 Year 2009 Year 2010 Year 2014Year 2005
Average Speed Average Speed Average Speed Average Speed Average Speed Average Speed Average Speed Average SpeedAverage Speed Average Speed Average Speed Average Speed Average Speed Average Speed
Year 2011
Rdwy Segment Rdwy Section
Average Speed Average Speed
Year 2011
Rdwy Segment Rdwy Section
Average Speed Average Speed
Year 2012
Rdwy Segment Rdwy Section
Average Speed Average Speed
Year 2012
Rdwy Segment Rdwy Section
Average Speed Average Speed
D-52 E Lake Brantley Drive
Roadway Distance
Segments (mile) (mph) LOS (mph) LOS (mph) LOS (mph) LOS (mph) LOS (mph) LOS (mph) LOS (mph) LOS (mph) LOS (mph) LOS (mph) LOS (mph) LOS (mph) LOS (mph) LOS (mph) LOS (mph) LOS (mph) LOS (mph) LOS (mph) LOS (mph) LOS
AM PEAK HOUR
SR 436 to Citrus Rd./Ohio Ave. 0.66 ---- ---- ---- ---- ---- ---- ---- ---- ---- ---- ---- ---- ---- ---- ---- ---- ---- ---- ---- ---- ---- ---- ---- ---- 32.5 A 31.2 A 34.4 A
Citrus Rd./Ohio Ave. to Sand Lake Rd. 0.25 ---- ---- ---- ---- ---- ---- ---- ---- ---- ---- ---- ---- ---- ---- ---- ---- ---- ---- ---- ---- ---- ---- ---- ---- 26.2 B 26.2 B 11.5 E 21.7 C 16.0 D 24.7 B 17.9 D 27.4 B
Average 26.2 B 21.7 C 24.7 B 27.4 B
PM PEAK HOUR
SR 436 to Citrus Rd./Ohio Ave. 0.66 ---- ---- ---- ---- ---- ---- ---- ---- ---- ---- ---- ---- ---- ---- ---- ---- ---- ---- ---- ---- ---- ---- ---- ---- 32.2 A 33.3 A 34.4 A
Citrus Rd./Ohio Ave. to Sand Lake Rd. 0.25 ---- ---- ---- ---- ---- ---- ---- ---- ---- ---- ---- ---- ---- ---- ---- ---- ---- ---- ---- ---- ---- ---- ---- ---- 23.3 C 23.3 C 16.0 D 25.2 B 17.0 D 26.4 B 17.9 D 27.4 B
Average 23.3 C 25.2 B 26.4 B 27.4 B
Note: *From the year 2012, additional control point has been added at Citrus Rd./Ohio Ave.
Roadway Distance
Segments (mile) (mph) LOS (mph) LOS (mph) LOS (mph) LOS (mph) LOS (mph) LOS (mph) LOS (mph) LOS (mph) LOS (mph) LOS (mph) LOS (mph) LOS (mph) LOS (mph) LOS (mph) LOS (mph) LOS (mph) LOS (mph) LOS (mph) LOS (mph) LOS
AM PEAK HOUR
Sand Lake Rd to Citrus Rd./Ohio Ave. 0.25 ---- ---- ---- ---- ---- ---- ---- ---- ---- ---- ---- ---- ---- ---- ---- ---- ---- ---- ---- ---- ---- ---- ---- ---- 31.2 A 29.4 B 32.6 A
Citrus Rd./Ohio Ave. to SR 436 0.66 ---- ---- ---- ---- ---- ---- ---- ---- ---- ---- ---- ---- ---- ---- ---- ---- ---- ---- ---- ---- ---- ---- ---- ---- 22.6 C 22.6 C 16.1 D 18.6 C 20.5 C 22.4 C 18.9 C 21.3 C
Average 22.6 C 18.6 C 22.4 C 21.3 C
PM PEAK HOUR
Sand Lake Rd to Citrus Rd./Ohio Ave. 0.25 ---- ---- ---- ---- ---- ---- ---- ---- ---- ---- ---- ---- ---- ---- ---- ---- ---- ---- ---- ---- ---- ---- ---- ---- 31.9 A 31.2 A 31.2 A
Citrus Rd./Ohio Ave. to SR 436 0.66 ---- ---- ---- ---- ---- ---- ---- ---- ---- ---- ---- ---- ---- ---- ---- ---- ---- ---- ---- ---- ---- ---- ---- ---- 15.6 D 15.6 D 12.6 E 15.1 D 18.3 C 20.7 C 18.9 C 21.2 C
Average 15.6 D 15.1 D 20.7 C 21.2 C
Note: *From the year 2012, additional control point has been added at Citrus Rd./Ohio Ave.
Year 2013
Rdwy Segment Rdwy Section
Average Speed Average Speed
Year 2013
Rdwy Segment Rdwy Section
Average Speed Average Speed
TABLE C46.1a
Year 2014 Seminole County Travel Time & Delay StudyW. Lake Brantley Road - Northbound Direction Historical Summary
Year 2014 Seminole County Travel Time & Delay Study
W. Lake Brantley Road - Southbound Direction Historical Summary
Average Speed Average Speed Average Speed Average Speed Average Speed Average SpeedAverage Speed Average Speed Average Speed Average Speed Average Speed
Year 2006 Year 2007 Year 2008 Year 2009 Year 2010 Year 2014Year 2005
Average Speed Average Speed Average Speed Average Speed Average Speed Average Speed Average Speed Average SpeedAverage Speed Average Speed Average Speed Average Speed Average Speed Average Speed
Year 2011
Rdwy Segment Rdwy Section
Average Speed Average Speed
Year 2011
Rdwy Segment Rdwy Section
Average Speed Average Speed
Year 2012
Rdwy Segment Rdwy Section
Average Speed Average Speed
Year 2012
Rdwy Segment Rdwy Section
Average Speed Average Speed
D-53 W Lake Brantley Road
Roadway Distance
Segments (mile) (mph) LOS (mph) LOS (mph) LOS (mph) LOS (mph) LOS (mph) LOS (mph) LOS (mph) LOS (mph) LOS (mph) LOS (mph) LOS (mph) LOS (mph) LOS (mph) LOS (mph) LOS (mph) LOS (mph) LOS (mph) LOS (mph) LOS (mph) LOS
AM PEAK HOUR
US 17/92 to Oxford Rd. 0.53 ---- ---- ---- ---- ---- ---- ---- ---- ---- ---- ---- ---- ---- ---- ---- ---- ---- ---- ---- ---- ---- ---- ---- ---- 17.9 C 17.9 C 20.5 B 20.5 B 18.4 C 18.4 C 22.1 B 22.1 B
Average 17.9 C 20.5 B 18.4 C 22.1 B
PM PEAK HOUR
US 17/92 to Oxford Rd. 0.53 ---- ---- ---- ---- ---- ---- ---- ---- ---- ---- ---- ---- ---- ---- ---- ---- ---- ---- ---- ---- ---- ---- ---- ---- 23.4 B 23.4 B 21.1 B 21.1 B 22.6 B 22.6 B 20.1 B 20.1 B
Average 23.4 B 21.1 B 22.6 B 20.1 B
Roadway Distance
Segments (mile) (mph) LOS (mph) LOS (mph) LOS (mph) LOS (mph) LOS (mph) LOS (mph) LOS (mph) LOS (mph) LOS (mph) LOS (mph) LOS (mph) LOS (mph) LOS (mph) LOS (mph) LOS (mph) LOS (mph) LOS (mph) LOS (mph) LOS (mph) LOS
AM PEAK HOUR
Oxford Rd. to US 17/92 0.53 ---- ---- ---- ---- ---- ---- ---- ---- ---- ---- ---- ---- ---- ---- ---- ---- ---- ---- ---- ---- ---- ---- ---- ---- 11.2 D 11.2 D 10.8 D 10.8 D 11.3 D 11.3 D 14.3 C 14.3 C
Average 11.2 D 10.8 D 11.3 D 14.3 C
PM PEAK HOUR
Oxford Rd. to US 17/92 0.53 ---- ---- ---- ---- ---- ---- ---- ---- ---- ---- ---- ---- ---- ---- ---- ---- ---- ---- ---- ---- ---- ---- ---- ---- 17.5 C 17.5 C 10.9 D 10.9 D 13.3 C 13.3 C 10.2 D 10.2 D
Average 17.5 C 10.9 D 13.3 C 10.2 D
Year 2013
Rdwy Segment Rdwy Section
Average Speed Average Speed
Year 2013
Rdwy Segment Rdwy Section
Average Speed Average Speed
TABLE C47.1a
Year 2014 Seminole County Travel Time & Delay StudyLake of the Woods Boulevard - Eastbound Direction Historical Summary
Year 2014 Seminole County Travel Time & Delay Study
Lake of the Woods Boulevard - Westbound Direction Historical Summary
Average Speed Average Speed Average Speed Average Speed Average Speed Average SpeedAverage Speed Average Speed Average Speed Average Speed Average Speed
Year 2006 Year 2007 Year 2008 Year 2009 Year 2010 Year 2014Year 2005
Average Speed Average Speed Average Speed Average Speed Average Speed Average Speed Average Speed Average SpeedAverage Speed Average Speed Average Speed Average Speed Average Speed Average Speed
Year 2011
Rdwy Segment Rdwy Section
Average Speed Average Speed
Year 2011
Rdwy Segment Rdwy Section
Average Speed Average Speed
Year 2012
Rdwy Segment Rdwy Section
Average Speed Average Speed
Year 2012
Rdwy Segment Rdwy Section
Average Speed Average Speed
D-54 Lake of the Woods Boulevard
Roadway Distance
Segments (mile) (mph) LOS (mph) LOS (mph) LOS (mph) LOS (mph) LOS (mph) LOS (mph) LOS (mph) LOS (mph) LOS (mph) LOS (mph) LOS (mph) LOS (mph) LOS (mph) LOS (mph) LOS (mph) LOS (mph) LOS (mph) LOS (mph) LOS (mph) LOS
AM PEAK HOUR
Greenway Blvd. to Lake Way Rd. 0.78 ---- ---- ---- ---- ---- ---- ---- ---- ---- ---- ---- ---- ---- ---- ---- ---- ---- ---- ---- ---- ---- ---- ---- ---- 29.1 A 29.1 A 26.3 A 26.3 A 26.4 A 26.4 A 24.5 B 24.5 B
Average 29.1 A 26.3 A 26.4 A 24.5 B
PM PEAK HOUR
Greenway Blvd. to Lake Way Rd. 0.78 ---- ---- ---- ---- ---- ---- ---- ---- ---- ---- ---- ---- ---- ---- ---- ---- ---- ---- ---- ---- ---- ---- ---- ---- 31.6 A 31.6 A 25.6 A 25.6 A 26.1 A 26.1 A 25.7 A 25.7 A
Average 31.6 A 25.6 A 26.1 A 25.7 A
Roadway Distance
Segments (mile) (mph) LOS (mph) LOS (mph) LOS (mph) LOS (mph) LOS (mph) LOS (mph) LOS (mph) LOS (mph) LOS (mph) LOS (mph) LOS (mph) LOS (mph) LOS (mph) LOS (mph) LOS (mph) LOS (mph) LOS (mph) LOS (mph) LOS (mph) LOS
AM PEAK HOUR
Lake Way Rd. to Greenway Blvd. 0.78 ---- ---- ---- ---- ---- ---- ---- ---- ---- ---- ---- ---- ---- ---- ---- ---- ---- ---- ---- ---- ---- ---- ---- ---- 25.4 A 25.4 A 22.7 B 22.7 B 23.4 B 23.4 B 19.1 B 19.1 B
Average 25.4 A 22.7 B 23.4 B 19.1 B
PM PEAK HOUR
Lake Way Rd. to Greenway Blvd. 0.78 ---- ---- ---- ---- ---- ---- ---- ---- ---- ---- ---- ---- ---- ---- ---- ---- ---- ---- ---- ---- ---- ---- ---- ---- 25.4 A 25.4 A 21.6 B 21.6 B 21.7 B 21.7 B 22.2 B 22.2 B
Average 25.4 A 21.6 B 21.7 B 22.2 B
Year 2013
Rdwy Segment Rdwy Section
Average Speed Average Speed
Year 2013
Rdwy Segment Rdwy Section
Average Speed Average SpeedAverage Speed Average Speed Average Speed Average Speed Average Speed Average SpeedAverage Speed Average Speed Average Speed Average Speed Average Speed Average SpeedAverage Speed Average Speed
Year 2006 Year 2007 Year 2008 Year 2009 Year 2010 Year 2014Year 2005
Average Speed Average Speed Average Speed
TABLE C48.1b
Year 2014 Seminole County Travel Time & Delay Study
Lake Park Drive - Southbound Direction Historical Summary
Average Speed Average Speed Average Speed Average Speed Average Speed Average SpeedAverage Speed Average Speed Average Speed Average Speed Average Speed
Year 2014 Seminole County Travel Time & Delay StudyLake Park Drive - Northbound Direction Historical Summary
Year 2005 Year 2006
Rdwy Segment
Year 2007 Year 2008 Year 2009 Year 2010 Year 2014Year 2011
Rdwy Segment Rdwy Section
Average Speed Average Speed
Year 2011
Rdwy Segment Rdwy Section
Average Speed Average Speed
Year 2012
Rdwy Segment Rdwy Section
Average Speed Average Speed
Year 2012
Rdwy Segment Rdwy Section
Average Speed Average Speed
D-55 Lake Park Drive
Roadway Distance
Segments (mile) (mph) LOS (mph) LOS (mph) LOS (mph) LOS (mph) LOS (mph) LOS (mph) LOS (mph) LOS (mph) LOS (mph) LOS (mph) LOS (mph) LOS (mph) LOS (mph) LOS (mph) LOS (mph) LOS (mph) LOS (mph) LOS (mph) LOS (mph) LOS
AM PEAK HOUR
Greenwood Blvd. to Lake Park Dr. 0.36 ---- ---- ---- ---- ---- ---- ---- ---- ---- ---- ---- ---- ---- ---- ---- ---- ---- ---- ---- ---- ---- ---- ---- ---- 20.8 B 25.1 A 20.8 B 23.7 B
Lake Park Dr. to Longwood Lake Mary Rd. 0.30 ---- ---- ---- ---- ---- ---- ---- ---- ---- ---- ---- ---- ---- ---- ---- ---- ---- ---- ---- ---- ---- ---- ---- ---- 14.6 C 17.4 C 20.7 B 22.9 B 17.0 C 18.9 C 20.7 B 22.2 B
Average 17.4 C 22.9 B 18.9 C 22.2 B
PM PEAK HOUR
Greenwood Blvd. to Lake Park Dr. 0.36 ---- ---- ---- ---- ---- ---- ---- ---- ---- ---- ---- ---- ---- ---- ---- ---- ---- ---- ---- ---- ---- ---- ---- ---- 27.7 A 25.7 A 22.0 B 18.2 C
Lake Park Dr. to Longwood Lake Mary Rd. 0.30 ---- ---- ---- ---- ---- ---- ---- ---- ---- ---- ---- ---- ---- ---- ---- ---- ---- ---- ---- ---- ---- ---- ---- ---- 16.2 C 21.0 B 14.4 C 18.9 C 16.1 C 18.9 C 15.3 C 16.7 C
Average 21.0 B 18.9 C 18.9 C 16.7 C
Roadway Distance
Segments (mile) (mph) LOS (mph) LOS (mph) LOS (mph) LOS (mph) LOS (mph) LOS (mph) LOS (mph) LOS (mph) LOS (mph) LOS (mph) LOS (mph) LOS (mph) LOS (mph) LOS (mph) LOS (mph) LOS (mph) LOS (mph) LOS (mph) LOS (mph) LOS
AM PEAK HOUR
Longwood Lake Mary Rd. to Lake Park Dr. 0.30 ---- ---- ---- ---- ---- ---- ---- ---- ---- ---- ---- ---- ---- ---- ---- ---- ---- ---- ---- ---- ---- ---- ---- ---- 21.7 B 23.7 B 23.7 B 21.7 B
Lake Park Dr. to Greenwood Blvd. 0.36 ---- ---- ---- ---- ---- ---- ---- ---- ---- ---- ---- ---- ---- ---- ---- ---- ---- ---- ---- ---- ---- ---- ---- ---- 23.0 B 22.4 B 18.5 C 20.5 B 18.3 C 20.4 B 21.8 B 21.8 B
Average 22.4 B 20.5 B 20.4 B 21.8 B
PM PEAK HOUR
Longwood Lake Mary Rd. to Lake Park Dr. 0.30 ---- ---- ---- ---- ---- ---- ---- ---- ---- ---- ---- ---- ---- ---- ---- ---- ---- ---- ---- ---- ---- ---- ---- ---- 21.2 B 20.9 B 19.8 B 20.2 B
Lake Park Dr. to Greenwood Blvd. 0.36 ---- ---- ---- ---- ---- ---- ---- ---- ---- ---- ---- ---- ---- ---- ---- ---- ---- ---- ---- ---- ---- ---- ---- ---- 19.1 B 20.0 B 17.1 C 18.7 C 13.3 C 15.7 C 13.8 C 16.2 C
Average 20.0 B 18.7 C 15.7 C 16.2 C
Year 2013
Rdwy Segment Rdwy Section
Average Speed Average Speed
Year 2013
Rdwy Segment Rdwy Section
Average Speed Average SpeedAverage Speed Average Speed Average Speed Average Speed Average Speed Average SpeedAverage Speed Average Speed Average Speed Average Speed Average Speed Average SpeedAverage Speed Average Speed
Year 2006 Year 2007 Year 2008 Year 2009 Year 2010 Year 2014Year 2005
Average Speed Average Speed Average Speed
TABLE C49.1b
Year 2014 Seminole County Travel Time & Delay Study
Lake Way Road - Westbound Direction Historical Summary
Average Speed Average Speed Average Speed Average Speed Average Speed Average SpeedAverage Speed Average Speed Average Speed Average Speed Average Speed
Year 2014 Seminole County Travel Time & Delay StudyLake Way Road - Eastbound Direction Historical Summary
Year 2005 Year 2006
Rdwy Segment
Year 2007 Year 2008 Year 2009 Year 2010 Year 2014Year 2011
Rdwy Segment Rdwy Section
Average Speed Average Speed
Year 2011
Rdwy Segment Rdwy Section
Average Speed Average Speed
Year 2012
Rdwy Segment Rdwy Section
Average Speed Average Speed
Year 2012
Rdwy Segment Rdwy Section
Average Speed Average Speed
D-56 Lake Way Road
Roadway Distance
Segments (mile) (mph) LOS (mph) LOS (mph) LOS (mph) LOS (mph) LOS (mph) LOS (mph) LOS (mph) LOS (mph) LOS (mph) LOS (mph) LOS (mph) LOS (mph) LOS (mph) LOS (mph) LOS (mph) LOS (mph) LOS (mph) LOS (mph) LOS (mph) LOS
AM PEAK HOUR
Markham Rd. to Via Hermosa St.* 0.56 ---- ---- ---- ---- ---- ---- ---- ---- ---- ---- ---- ---- ---- ---- ---- ---- ---- ---- ---- ---- ---- ---- ---- ---- 35.0 B 35.0 B 36.1 A 36.1 A 37.8 A 37.8 A
Via Hermosa St. to Steeplechase Cir. S* 0.55 ---- ---- ---- ---- ---- ---- ---- ---- ---- ---- ---- ---- ---- ---- ---- ---- ---- ---- ---- ---- ---- ---- ---- ---- 39.8 A 39.8 A 38.4 A 38.4 A 39.3 A 39.3 A
Steeplechase Cir. S to SR 46 0.41 ---- ---- ---- ---- ---- ---- ---- ---- ---- ---- ---- ---- ---- ---- ---- ---- ---- ---- ---- ---- ---- ---- ---- ---- 27.4 C 27.4 C 27.0 C 27.0 C 14.4 E 14.4 E 15.7 E 15.7 E
Average 27.4 C 33.8 B 26.1 C 27.6 C
PM PEAK HOUR
Markham Rd. to Via Hermosa St.* 0.56 ---- ---- ---- ---- ---- ---- ---- ---- ---- ---- ---- ---- ---- ---- ---- ---- ---- ---- ---- ---- ---- ---- ---- ---- 37.8 A 37.8 A 36.1 A 36.1 A 37.8 A 37.8 A
Via Hermosa St. to Steeplechase Cir. S* 0.55 ---- ---- ---- ---- ---- ---- ---- ---- ---- ---- ---- ---- ---- ---- ---- ---- ---- ---- ---- ---- ---- ---- ---- ---- 41.2 A 41.2 A 39.8 A 39.8 A 39.3 A 39.3 A
Steeplechase Cir. S to SR 46 0.41 ---- ---- ---- ---- ---- ---- ---- ---- ---- ---- ---- ---- ---- ---- ---- ---- ---- ---- ---- ---- ---- ---- ---- ---- 31.8 B 31.8 B 37.8 A 37.8 A 19.2 D 19.2 D 17.1 D 17.1 D
Average 31.8 B 39.0 A 30.0 B 28.8 B
Note: *From the year 2012, additional control points have been added at Via Hermosa St and Steeplechase Cir. S.
Roadway Distance
Segments (mile) (mph) LOS (mph) LOS (mph) LOS (mph) LOS (mph) LOS (mph) LOS (mph) LOS (mph) LOS (mph) LOS (mph) LOS (mph) LOS (mph) LOS (mph) LOS (mph) LOS (mph) LOS (mph) LOS (mph) LOS (mph) LOS (mph) LOS (mph) LOS
AM PEAK HOUR
SR 46 to Steeplechase Cir. S* 0.41 ---- ---- ---- ---- ---- ---- ---- ---- ---- ---- ---- ---- ---- ---- ---- ---- ---- ---- ---- ---- ---- ---- ---- ---- 38.4 A 38.4 A 36.2 A 36.2 A 37.8 A 37.8 A
Steeplechase Cir. S to Via Hermosa St.* 0.55 ---- ---- ---- ---- ---- ---- ---- ---- ---- ---- ---- ---- ---- ---- ---- ---- ---- ---- ---- ---- ---- ---- ---- ---- 41.8 A 41.8 A 39.8 A 39.8 A 39.3 A 39.3 A
Via Hermosa St. to Markham Rd. 0.56 ---- ---- ---- ---- ---- ---- ---- ---- ---- ---- ---- ---- ---- ---- ---- ---- ---- ---- ---- ---- ---- ---- ---- ---- 35.3 A 35.3 A 35.0 B 35.0 B 34.6 B 34.6 B 33.6 B 33.6 B
Average 35.3 A 38.2 A 36.8 A 36.6 A
PM PEAK HOUR
SR 46 to Steeplechase Cir. S* 0.41 ---- ---- ---- ---- ---- ---- ---- ---- ---- ---- ---- ---- ---- ---- ---- ---- ---- ---- ---- ---- ---- ---- ---- ---- 33.2 B 33.2 B 37.3 A 37.3 A 37.8 A 37.8 A
Steeplechase Cir. S to Via Hermosa St.* 0.55 ---- ---- ---- ---- ---- ---- ---- ---- ---- ---- ---- ---- ---- ---- ---- ---- ---- ---- ---- ---- ---- ---- ---- ---- 41.2 A 41.2 A 40.2 A 40.2 A 38.8 A 38.8 A
Via Hermosa St. to Markham Rd. 0.56 ---- ---- ---- ---- ---- ---- ---- ---- ---- ---- ---- ---- ---- ---- ---- ---- ---- ---- ---- ---- ---- ---- ---- ---- 35.4 A 35.4 A 35.7 A 35.7 A 36.1 A 36.1 A 33.3 B 33.3 B
Average 35.4 A 36.8 A 37.8 A 36.3 A
Note: *From the year 2012, additional control points have been added at Via Hermosa St and Steeplechase Cir. S.
Year 2013
Rdwy Segment Rdwy Section
Average Speed Average Speed
Year 2013
Rdwy Segment Rdwy Section
Average Speed Average SpeedAverage Speed Average Speed Average Speed Average Speed Average Speed Average SpeedAverage Speed Average Speed Average Speed Average Speed Average Speed Average SpeedAverage Speed Average Speed
Year 2006 Year 2007 Year 2008 Year 2009 Year 2010 Year 2014Year 2005
Average Speed Average Speed Average Speed
TABLE C50.1b
Year 2014 Seminole County Travel Time & Delay Study
Longwood Markham Road - Southbound Direction Historical Summary
Average Speed Average Speed Average Speed Average Speed Average Speed Average SpeedAverage Speed Average Speed Average Speed Average Speed Average Speed
Year 2014 Seminole County Travel Time & Delay StudyLongwood Markham Road - Northbound Direction Historical Summary
Year 2005 Year 2006
Rdwy Segment
Year 2007 Year 2008 Year 2009 Year 2010 Year 2014Year 2011
Rdwy Segment Rdwy Section
Average Speed Average Speed
Year 2011
Rdwy Segment Rdwy Section
Average Speed Average Speed
Year 2012
Rdwy Segment Rdwy Section
Average Speed Average Speed
Year 2012
Rdwy Segment Rdwy Section
Average Speed Average Speed
D-57 Longwood Markham Road
Roadway Distance
Segments (mile) (mph) LOS (mph) LOS (mph) LOS (mph) LOS (mph) LOS (mph) LOS (mph) LOS (mph) LOS (mph) LOS (mph) LOS (mph) LOS (mph) LOS (mph) LOS (mph) LOS (mph) LOS (mph) LOS (mph) LOS (mph) LOS (mph) LOS (mph) LOS
AM PEAK HOUR
Longwood Markham Rd. to Lake Markham Rd. 0.88 ---- ---- ---- ---- ---- ---- ---- ---- ---- ---- ---- ---- ---- ---- ---- ---- ---- ---- ---- ---- ---- ---- ---- ---- 36.9 A 36.9 A 38.5 A 38.5 A 40.3 A 40.3 A 37.2 A 37.2 A
Lake Markham Rd. to Markham Woods Rd. 0.37 ---- ---- ---- ---- ---- ---- ---- ---- ---- ---- ---- ---- ---- ---- ---- ---- ---- ---- ---- ---- ---- ---- ---- ---- 38.9 A 38.9 A 41.1 A 41.1 A 41.9 A 41.9 A 39.6 A 39.6 A
Markham Woods Rd. to CR 431 1.38 ---- ---- ---- ---- ---- ---- ---- ---- ---- ---- ---- ---- ---- ---- ---- ---- ---- ---- ---- ---- ---- ---- ---- ---- 32.9 B 32.9 B 33.7 B 33.7 B 36.8 A 36.8 A 33.9 B 33.9 B
Average 34.8 A 36.1 A 38.6 A 35.7 A
PM PEAK HOUR
Longwood Markham Rd. to Lake Markham Rd. 0.88 ---- ---- ---- ---- ---- ---- ---- ---- ---- ---- ---- ---- ---- ---- ---- ---- ---- ---- ---- ---- ---- ---- ---- ---- 36.9 A 36.9 A 38.5 A 38.5 A 39.4 A 39.4 A 37.2 A 37.2 A
Lake Markham Rd. to Markham Woods Rd. 0.37 ---- ---- ---- ---- ---- ---- ---- ---- ---- ---- ---- ---- ---- ---- ---- ---- ---- ---- ---- ---- ---- ---- ---- ---- 38.9 A 38.9 A 39.6 A 39.6 A 41.1 A 41.1 A 38.9 A 38.9 A
Markham Woods Rd. to CR 431 1.38 ---- ---- ---- ---- ---- ---- ---- ---- ---- ---- ---- ---- ---- ---- ---- ---- ---- ---- ---- ---- ---- ---- ---- ---- 36.5 A 36.5 A 30.6 B 30.6 B 35.1 A 35.1 A 26.0 C 26.0 C
Average 36.8 A 34.0 A 37.2 A 30.5 A
Roadway Distance
Segments (mile) (mph) LOS (mph) LOS (mph) LOS (mph) LOS (mph) LOS (mph) LOS (mph) LOS (mph) LOS (mph) LOS (mph) LOS (mph) LOS (mph) LOS (mph) LOS (mph) LOS (mph) LOS (mph) LOS (mph) LOS (mph) LOS (mph) LOS (mph) LOS
AM PEAK HOUR
CR 431 to Markham Woods Rd. 1.38 ---- ---- ---- ---- ---- ---- ---- ---- ---- ---- ---- ---- ---- ---- ---- ---- ---- ---- ---- ---- ---- ---- ---- ---- 34.9 B 34.9 B 37.1 A 37.1 A 38.7 A 38.7 A 36.0 A 36.0 A
Markham Woods Rd. to Lake Markham Rd. 0.37 ---- ---- ---- ---- ---- ---- ---- ---- ---- ---- ---- ---- ---- ---- ---- ---- ---- ---- ---- ---- ---- ---- ---- ---- 39.6 A 39.6 A 39.6 A 39.6 A 41.9 A 41.9 A 38.9 A 38.9 A
Lake Markham Rd. to Longwood Markham Rd. 0.88 ---- ---- ---- ---- ---- ---- ---- ---- ---- ---- ---- ---- ---- ---- ---- ---- ---- ---- ---- ---- ---- ---- ---- ---- 37.7 A 37.7 A 33.6 B 33.6 B 36.9 A 36.9 A 36.4 A 36.4 A
Average 36.3 A 36.2 A 38.5 A 36.5 A
PM PEAK HOUR
CR 431 to Markham Woods Rd. 1.38 ---- ---- ---- ---- ---- ---- ---- ---- ---- ---- ---- ---- ---- ---- ---- ---- ---- ---- ---- ---- ---- ---- ---- ---- 36.6 A 36.6 A 38.7 A 38.7 A 39.4 A 39.4 A 37.0 A 37.0 A
Markham Woods Rd. to Lake Markham Rd. 0.37 ---- ---- ---- ---- ---- ---- ---- ---- ---- ---- ---- ---- ---- ---- ---- ---- ---- ---- ---- ---- ---- ---- ---- ---- 38.3 A 38.3 A 40.4 A 40.4 A 41.9 A 41.9 A 39.6 A 39.6 A
Lake Markham Rd. to Longwood Markham Rd. 0.88 ---- ---- ---- ---- ---- ---- ---- ---- ---- ---- ---- ---- ---- ---- ---- ---- ---- ---- ---- ---- ---- ---- ---- ---- 37.7 A 37.7 A 37.4 A 37.4 A 37.4 A 37.4 A 36.7 A 36.7 A
Average 37.1 A 38.5 A 39.1 A 37.2 A
Year 2013
Rdwy Segment Rdwy Section
Average Speed Average Speed
Year 2013
Rdwy Segment Rdwy Section
Average Speed Average SpeedAverage Speed Average Speed Average Speed Average Speed Average Speed Average SpeedAverage Speed Average Speed Average Speed Average Speed Average Speed Average SpeedAverage Speed Average Speed
Year 2006 Year 2007 Year 2008 Year 2009 Year 2010 Year 2014Year 2005
Average Speed Average Speed Average Speed
TABLE C51.1b
Year 2014 Seminole County Travel Time & Delay Study
Markham Road - Westbound Direction Historical Summary
Average Speed Average Speed Average Speed Average Speed Average Speed Average SpeedAverage Speed Average Speed Average Speed Average Speed Average Speed
Year 2014 Seminole County Travel Time & Delay StudyMarkham Road - Eastbound Direction Historical Summary
Year 2005 Year 2006
Rdwy Segment
Year 2007 Year 2008 Year 2009 Year 2010 Year 2014Year 2011
Rdwy Segment Rdwy Section
Average Speed Average Speed
Year 2011
Rdwy Segment Rdwy Section
Average Speed Average Speed
Year 2012
Rdwy Segment Rdwy Section
Average Speed Average Speed
Year 2012
Rdwy Segment Rdwy Section
Average Speed Average Speed
D-58 Markham Road
Roadway Distance
Segments (mile) (mph) LOS (mph) LOS (mph) LOS (mph) LOS (mph) LOS (mph) LOS (mph) LOS (mph) LOS (mph) LOS (mph) LOS (mph) LOS (mph) LOS (mph) LOS (mph) LOS (mph) LOS (mph) LOS (mph) LOS (mph) LOS (mph) LOS (mph) LOS
AM PEAK HOUR
CR 15 to Palmetto St. 0.26 ---- ---- ---- ---- ---- ---- ---- ---- ---- ---- ---- ---- ---- ---- ---- ---- ---- ---- ---- ---- ---- ---- ---- ---- 22.9 B 22.9 B 24.0 B 13.6 C
Palmetto St. to Wilbur Ave. 0.12 ---- ---- ---- ---- ---- ---- ---- ---- ---- ---- ---- ---- ---- ---- ---- ---- ---- ---- ---- ---- ---- ---- ---- ---- 30.0 A 24.8 B 28.8 A 24.5 B 30.0 A 25.6 A 30.0 A 16.4 C
Wilbur Ave. to Pedigo Pt. 0.61 ---- ---- ---- ---- ---- ---- ---- ---- ---- ---- ---- ---- ---- ---- ---- ---- ---- ---- ---- ---- ---- ---- ---- ---- 40.7 A 40.2 A 42.1 A 41.1 A
Pedigo Pt. to Casa Verde Blvd. 0.99 ---- ---- ---- ---- ---- ---- ---- ---- ---- ---- ---- ---- ---- ---- ---- ---- ---- ---- ---- ---- ---- ---- ---- ---- 41.0 A 40.8 A 37.1 A 38.2 A 36.7 A 38.6 A 37.4 A 38.7 A
Casa Verde Blvd. to Airport Blvd. 0.24 ---- ---- ---- ---- ---- ---- ---- ---- ---- ---- ---- ---- ---- ---- ---- ---- ---- ---- ---- ---- ---- ---- ---- ---- 14.1 D 13.5 E 13.8 E 14.4 D
Airport Blvd. to CR 46A 0.54 ---- ---- ---- ---- ---- ---- ---- ---- ---- ---- ---- ---- ---- ---- ---- ---- ---- ---- ---- ---- ---- ---- ---- ---- 16.7 D 15.8 D 17.4 D 16.0 D 19.9 C 17.5 D 21.2 C 18.5 C
CR 46A to Country Club Rd. 0.16 ---- ---- ---- ---- ---- ---- ---- ---- ---- ---- ---- ---- ---- ---- ---- ---- ---- ---- ---- ---- ---- ---- ---- ---- 20.9 C 20.9 C 23.4 C 23.4 C 20.0 C 20.0 C 20.0 C 20.0 C
Average 26.2 B 25.8 B 26.8 B 25.5 B
PM PEAK HOUR
CR 15 to Palmetto St. 0.26 ---- ---- ---- ---- ---- ---- ---- ---- ---- ---- ---- ---- ---- ---- ---- ---- ---- ---- ---- ---- ---- ---- ---- ---- 23.6 B 22.6 B 24.8 B 24.4 B
Palmetto St. to Wilbur Ave. 0.12 ---- ---- ---- ---- ---- ---- ---- ---- ---- ---- ---- ---- ---- ---- ---- ---- ---- ---- ---- ---- ---- ---- ---- ---- 28.8 A 25.1 A 27.7 A 24.0 B 30.0 A 26.2 A 32.7 A 26.5 A
Wilbur Ave. to Pedigo Pt. 0.61 ---- ---- ---- ---- ---- ---- ---- ---- ---- ---- ---- ---- ---- ---- ---- ---- ---- ---- ---- ---- ---- ---- ---- ---- 41.6 A 43.6 A 43.1 A 42.1 A
Pedigo Pt. to Casa Verde Blvd. 0.99 ---- ---- ---- ---- ---- ---- ---- ---- ---- ---- ---- ---- ---- ---- ---- ---- ---- ---- ---- ---- ---- ---- ---- ---- 42.7 A 42.3 A 42.7 A 43.0 A 37.6 A 39.5 A 41.0 A 41.4 A
Casa Verde Blvd. to Airport Blvd. 0.24 ---- ---- ---- ---- ---- ---- ---- ---- ---- ---- ---- ---- ---- ---- ---- ---- ---- ---- ---- ---- ---- ---- ---- ---- 11.4 E 10.3 E 15.3 D 13.1 E
Airport Blvd. to CR 46A 0.54 ---- ---- ---- ---- ---- ---- ---- ---- ---- ---- ---- ---- ---- ---- ---- ---- ---- ---- ---- ---- ---- ---- ---- ---- 24.9 B 18.3 C 18.2 C 14.7 D 11.8 E 12.7 E 18.1 C 16.2 D
CR 46A to Country Club Rd. 0.16 ---- ---- ---- ---- ---- ---- ---- ---- ---- ---- ---- ---- ---- ---- ---- ---- ---- ---- ---- ---- ---- ---- ---- ---- 21.3 C 21.3 C 20.9 C 20.9 C 20.0 C 20.0 C 20.9 C 20.9 C
Average 28.3 B 25.7 B 23.5 C 26.8 B
Roadway Distance
Segments (mile) (mph) LOS (mph) LOS (mph) LOS (mph) LOS (mph) LOS (mph) LOS (mph) LOS (mph) LOS (mph) LOS (mph) LOS (mph) LOS (mph) LOS (mph) LOS (mph) LOS (mph) LOS (mph) LOS (mph) LOS (mph) LOS (mph) LOS (mph) LOS
AM PEAK HOUR
Country Club Rd. to CR 46A 0.16 ---- ---- ---- ---- ---- ---- ---- ---- ---- ---- ---- ---- ---- ---- ---- ---- ---- ---- ---- ---- ---- ---- ---- ---- 10.5 E 10.5 E 16.3 D 16.3 D 6.5 F 6.5 F 9.1 F 9.1 F
CR 46A to Airport Blvd. 0.54 ---- ---- ---- ---- ---- ---- ---- ---- ---- ---- ---- ---- ---- ---- ---- ---- ---- ---- ---- ---- ---- ---- ---- ---- 17.5 D 20.9 C 20.1 C 21.0 C
Airport Blvd. to Casa Verde Blvd. 0.24 ---- ---- ---- ---- ---- ---- ---- ---- ---- ---- ---- ---- ---- ---- ---- ---- ---- ---- ---- ---- ---- ---- ---- ---- 30.0 B 20.1 C 35.1 A 23.9 C 33.5 A 22.9 C 35.1 A 24.0 C
Casa Verde Blvd. to Pedigo Pt. 0.99 ---- ---- ---- ---- ---- ---- ---- ---- ---- ---- ---- ---- ---- ---- ---- ---- ---- ---- ---- ---- ---- ---- ---- ---- 36.2 A 42.4 A 42.7 A 40.4 A
Pedigo Pt. to Wilbur Ave. 0.61 ---- ---- ---- ---- ---- ---- ---- ---- ---- ---- ---- ---- ---- ---- ---- ---- ---- ---- ---- ---- ---- ---- ---- ---- 37.7 A 36.8 A 40.2 A 41.6 A 41.6 A 42.3 A 39.8 A 40.2 A
Wilbur Ave. to Palmetto St. 0.12 ---- ---- ---- ---- ---- ---- ---- ---- ---- ---- ---- ---- ---- ---- ---- ---- ---- ---- ---- ---- ---- ---- ---- ---- 21.8 B 26.7 A 25.7 A 25.7 A
Palmetto St. to CR 15 0.26 ---- ---- ---- ---- ---- ---- ---- ---- ---- ---- ---- ---- ---- ---- ---- ---- ---- ---- ---- ---- ---- ---- ---- ---- 12.1 D 14.1 C 14.2 C 16.6 C 16.2 C 18.4 C 10.2 D 12.6 D
Average 23.5 C 28.1 B 24.9 B 24.3 B
PM PEAK HOUR
Country Club Rd. to CR 46A 0.16 ---- ---- ---- ---- ---- ---- ---- ---- ---- ---- ---- ---- ---- ---- ---- ---- ---- ---- ---- ---- ---- ---- ---- ---- 9.9 F 9.9 F 16.8 D 16.8 D 6.7 F 6.7 F 5.3 F 5.3 F
CR 46A to Airport Blvd. 0.54 ---- ---- ---- ---- ---- ---- ---- ---- ---- ---- ---- ---- ---- ---- ---- ---- ---- ---- ---- ---- ---- ---- ---- ---- 17.0 D 21.5 C 18.4 C 19.1 C
Airport Blvd. to Casa Verde Blvd. 0.24 ---- ---- ---- ---- ---- ---- ---- ---- ---- ---- ---- ---- ---- ---- ---- ---- ---- ---- ---- ---- ---- ---- ---- ---- 32.7 A 19.9 C 35.1 A 24.4 B 34.3 A 21.5 C 36.9 A 22.4 C
Casa Verde Blvd. to Pedigo Pt. 0.99 ---- ---- ---- ---- ---- ---- ---- ---- ---- ---- ---- ---- ---- ---- ---- ---- ---- ---- ---- ---- ---- ---- ---- ---- 39.9 A 42.4 A 41.8 A 42.7 A
Pedigo Pt. to Wilbur Ave. 0.61 ---- ---- ---- ---- ---- ---- ---- ---- ---- ---- ---- ---- ---- ---- ---- ---- ---- ---- ---- ---- ---- ---- ---- ---- 39.4 A 39.7 A 41.1 A 41.9 A 40.7 A 41.4 A 42.6 A 42.7 A
Wilbur Ave. to Palmetto St. 0.12 ---- ---- ---- ---- ---- ---- ---- ---- ---- ---- ---- ---- ---- ---- ---- ---- ---- ---- ---- ---- ---- ---- ---- ---- 25.7 A 27.7 A 24.8 B 28.8 A
Palmetto St. to CR 15 0.26 ---- ---- ---- ---- ---- ---- ---- ---- ---- ---- ---- ---- ---- ---- ---- ---- ---- ---- ---- ---- ---- ---- ---- ---- 14.2 C 16.5 C 11.2 D 13.8 C 12.1 D 14.4 C 8.0 E 10.4 D
Average 24.6 B 27.2 B 23.3 C 21.0 C
Year 2013
Rdwy Segment Rdwy Section
Average Speed Average Speed
Year 2013
Rdwy Segment Rdwy Section
Average Speed Average SpeedAverage Speed Average Speed Average Speed Average Speed Average Speed Average SpeedAverage Speed Average Speed Average Speed Average Speed Average Speed Average SpeedAverage Speed Average Speed
Year 2006 Year 2007 Year 2008 Year 2009 Year 2010 Year 2014Year 2005
Average Speed Average Speed Average Speed
TABLE C52.1b
Year 2014 Seminole County Travel Time & Delay Study
Old Lake Mary Road - Southbound Direction Historical Summary
Average Speed Average Speed Average Speed Average Speed Average Speed Average SpeedAverage Speed Average Speed Average Speed Average Speed Average Speed
Year 2014 Seminole County Travel Time & Delay StudyOld Lake Mary Road - Northbound Direction Historical Summary
Year 2005 Year 2006
Rdwy Segment
Year 2007 Year 2008 Year 2009 Year 2010 Year 2014Year 2011
Rdwy Segment Rdwy Section
Average Speed Average Speed
Year 2011
Rdwy Segment Rdwy Section
Average Speed Average Speed
Year 2012
Rdwy Segment Rdwy Section
Average Speed Average Speed
Year 2012
Rdwy Segment Rdwy Section
Average Speed Average Speed
D-59 Old Lake Mary Road
Roadway Distance
Segments (mile) (mph) LOS (mph) LOS (mph) LOS (mph) LOS (mph) LOS (mph) LOS (mph) LOS (mph) LOS (mph) LOS (mph) LOS (mph) LOS (mph) LOS (mph) LOS (mph) LOS (mph) LOS (mph) LOS (mph) LOS (mph) LOS (mph) LOS (mph) LOS
AM PEAK HOUR
McCulloch Rd. to Lockwood Blvd. 1.39 ---- ---- ---- ---- ---- ---- ---- ---- ---- ---- ---- ---- ---- ---- ---- ---- ---- ---- ---- ---- ---- ---- ---- ---- 32.0 A 32.0 A 30.0 B 30.0 B 32.8 A 32.8 A 32.0 A 32.0 A
Average 32.0 A 30.0 B 32.8 A 32.0 A
PM PEAK HOUR
McCulloch Rd. to Lockwood Blvd. 1.39 ---- ---- ---- ---- ---- ---- ---- ---- ---- ---- ---- ---- ---- ---- ---- ---- ---- ---- ---- ---- ---- ---- ---- ---- 29.8 B 29.8 B 31.0 A 31.0 A 30.8 A 30.8 A 31.5 A 31.5 A
Average 29.8 B 31.0 A 30.8 A 31.5 A
Roadway Distance
Segments (mile) (mph) LOS (mph) LOS (mph) LOS (mph) LOS (mph) LOS (mph) LOS (mph) LOS (mph) LOS (mph) LOS (mph) LOS (mph) LOS (mph) LOS (mph) LOS (mph) LOS (mph) LOS (mph) LOS (mph) LOS (mph) LOS (mph) LOS (mph) LOS
AM PEAK HOUR
Lockwood Blvd. to McCulloch Rd. 1.39 ---- ---- ---- ---- ---- ---- ---- ---- ---- ---- ---- ---- ---- ---- ---- ---- ---- ---- ---- ---- ---- ---- ---- ---- 29.7 B 29.7 B 28.3 B 28.3 B 25.1 B 25.1 B 25.7 B 25.7 B
Average 29.7 B 28.3 B 25.1 B 25.7 B
PM PEAK HOUR
Lockwood Blvd. to McCulloch Rd. 1.39 ---- ---- ---- ---- ---- ---- ---- ---- ---- ---- ---- ---- ---- ---- ---- ---- ---- ---- ---- ---- ---- ---- ---- ---- 27.6 B 27.6 B 26.6 B 26.6 B 25.0 B 25.0 B 27.3 B 27.3 B
Average 27.6 B 26.6 B 25.0 B 27.3 B
Year 2013
Rdwy Segment Rdwy Section
Average Speed Average Speed
Year 2013
Rdwy Segment Rdwy Section
Average Speed Average SpeedAverage Speed Average Speed Average Speed Average Speed Average Speed Average SpeedAverage Speed Average Speed Average Speed Average Speed Average Speed Average SpeedAverage Speed Average Speed
Year 2006 Year 2007 Year 2008 Year 2009 Year 2010 Year 2014Year 2005
Average Speed Average Speed Average Speed
TABLE C53.1b
Year 2014 Seminole County Travel Time & Delay Study
Old Lockwood Road - Southbound Direction Historical Summary
Average Speed Average Speed Average Speed Average Speed Average Speed Average SpeedAverage Speed Average Speed Average Speed Average Speed Average Speed
Year 2014 Seminole County Travel Time & Delay StudyOld Lockwood Road - Northbound Direction Historical Summary
Year 2005 Year 2006
Rdwy Segment
Year 2007 Year 2008 Year 2009 Year 2010 Year 2014Year 2011
Rdwy Segment Rdwy Section
Average Speed Average Speed
Year 2011
Rdwy Segment Rdwy Section
Average Speed Average Speed
Year 2012
Rdwy Segment Rdwy Section
Average Speed Average Speed
Year 2012
Rdwy Segment Rdwy Section
Average Speed Average Speed
D-60 Old Lockwood Road
Roadway Distance
Segments (mile) (mph) LOS (mph) LOS (mph) LOS (mph) LOS (mph) LOS (mph) LOS (mph) LOS (mph) LOS (mph) LOS (mph) LOS (mph) LOS (mph) LOS (mph) LOS (mph) LOS (mph) LOS (mph) LOS (mph) LOS (mph) LOS (mph) LOS (mph) LOS
AM PEAK HOUR
SR 434 to Laurel St. 0.25 ---- ---- ---- ---- ---- ---- ---- ---- ---- ---- ---- ---- ---- ---- ---- ---- ---- ---- ---- ---- ---- ---- ---- ---- 26.3 B 22.4 C 30.0 B 27.8 A 27.8 A
Laurel St. to W. Town Pkwy.* 0.23 ---- ---- ---- ---- ---- ---- ---- ---- ---- ---- ---- ---- ---- ---- ---- ---- ---- ---- ---- ---- ---- ---- ---- ---- ---- ---- ---- ---- ---- ---- ---- ---- ---- ---- ---- ---- 31.4 A 31.4 A
W. Town Pkwy. to SR 436* 0.13 ---- ---- ---- ---- ---- ---- ---- ---- ---- ---- ---- ---- ---- ---- ---- ---- ---- ---- ---- ---- ---- ---- ---- ---- 21.0 C 22.9 C 23.7 C 23.2 C 20.6 C 23.6 C 11.6 D 11.6 D
Average 22.9 C 23.2 C 23.6 C 22.2 C
PM PEAK HOUR
SR 434 to Laurel St. 0.25 ---- ---- ---- ---- ---- ---- ---- ---- ---- ---- ---- ---- ---- ---- ---- ---- ---- ---- ---- ---- ---- ---- ---- ---- 20.0 C 28.8 B 23.4 C 21.7 B 21.7 B
Laurel St. to W. Town Pkwy.* 0.23 ---- ---- ---- ---- ---- ---- ---- ---- ---- ---- ---- ---- ---- ---- ---- ---- ---- ---- ---- ---- ---- ---- ---- ---- ---- ---- ---- ---- ---- ---- ---- ---- ---- ---- ---- ---- 30.0 A 30.0 A
W. Town Pkwy. to SR 436* 0.13 ---- ---- ---- ---- ---- ---- ---- ---- ---- ---- ---- ---- ---- ---- ---- ---- ---- ---- ---- ---- ---- ---- ---- ---- 17.7 D 18.6 C 22.7 C 24.9 B 20.4 C 21.5 C 17.0 C 17.0 C
Average 18.6 C 24.9 B 21.5 C 22.7 C
Roadway Distance
Segments (mile) (mph) LOS (mph) LOS (mph) LOS (mph) LOS (mph) LOS (mph) LOS (mph) LOS (mph) LOS (mph) LOS (mph) LOS (mph) LOS (mph) LOS (mph) LOS (mph) LOS (mph) LOS (mph) LOS (mph) LOS (mph) LOS (mph) LOS (mph) LOS
AM PEAK HOUR
SR 436 to W. Town Pkwy.* 0.25 ---- ---- ---- ---- ---- ---- ---- ---- ---- ---- ---- ---- ---- ---- ---- ---- ---- ---- ---- ---- ---- ---- ---- ---- 25.7 B 24.8 B 26.7 B 22.3 B 22.3 B
W. Town Pkwy. to Laurel St.* 0.23 ---- ---- ---- ---- ---- ---- ---- ---- ---- ---- ---- ---- ---- ---- ---- ---- ---- ---- ---- ---- ---- ---- ---- ---- ---- ---- ---- ---- ---- ---- ---- ---- ---- ---- ---- ---- 27.1 A 27.1 A
Laurel St. to SR 434 0.13 ---- ---- ---- ---- ---- ---- ---- ---- ---- ---- ---- ---- ---- ---- ---- ---- ---- ---- ---- ---- ---- ---- ---- ---- 8.1 F 13.6 E 10.9 E 16.3 D 6.0 F 11.1 E 8.4 E 8.4 E
Average 13.6 E 16.3 D 11.1 E 13.9 E
PM PEAK HOUR
SR 436 to W. Town Pkwy.* 0.25 ---- ---- ---- ---- ---- ---- ---- ---- ---- ---- ---- ---- ---- ---- ---- ---- ---- ---- ---- ---- ---- ---- ---- ---- 20.2 C 23.7 C 24.5 B 24.4 B 24.4 B
W. Town Pkwy. to Laurel St.* 0.23 ---- ---- ---- ---- ---- ---- ---- ---- ---- ---- ---- ---- ---- ---- ---- ---- ---- ---- ---- ---- ---- ---- ---- ---- ---- ---- ---- ---- ---- ---- ---- ---- ---- ---- ---- ---- 22.3 B 22.3 B
Laurel St. to SR 434 0.13 ---- ---- ---- ---- ---- ---- ---- ---- ---- ---- ---- ---- ---- ---- ---- ---- ---- ---- ---- ---- ---- ---- ---- ---- 8.5 F 12.9 E 10.3 E 15.5 D 8.1 F 13.4 E 10.3 D 10.3 D
Average 12.9 E 15.5 D 13.4 E 15.2 D
Note: *From the year 2014, additional control point has been added at W Town Pkwy.
Year 2013
Rdwy Segment Rdwy Section
Average Speed Average Speed
Year 2013
Rdwy Segment Rdwy Section
Average Speed Average SpeedAverage Speed Average Speed Average Speed Average Speed Average Speed Average SpeedAverage Speed Average Speed Average Speed Average Speed Average Speed Average SpeedAverage Speed Average Speed
Year 2006 Year 2007 Year 2008 Year 2009 Year 2010 Year 2014Year 2005
Average Speed Average Speed Average Speed
TABLE C54.1b
Year 2014 Seminole County Travel Time & Delay Study
Orange Avenue - Westbound Direction Historical Summary
Average Speed Average Speed Average Speed Average Speed Average Speed Average SpeedAverage Speed Average Speed Average Speed Average Speed Average Speed
Year 2014 Seminole County Travel Time & Delay StudyOrange Avenue - Eastbound Direction Historical Summary
Year 2005 Year 2006
Rdwy Segment
Year 2007 Year 2008 Year 2009 Year 2010 Year 2014Year 2011
Rdwy Segment Rdwy Section
Average Speed Average Speed
Year 2011
Rdwy Segment Rdwy Section
Average Speed Average Speed
Year 2012
Rdwy Segment Rdwy Section
Average Speed Average Speed
Year 2012
Rdwy Segment Rdwy Section
Average Speed Average Speed
D-61 Orange Avenue
Roadway Distance
Segments (mile) (mph) LOS (mph) LOS (mph) LOS (mph) LOS (mph) LOS (mph) LOS (mph) LOS (mph) LOS (mph) LOS (mph) LOS (mph) LOS (mph) LOS (mph) LOS (mph) LOS (mph) LOS (mph) LOS (mph) LOS (mph) LOS (mph) LOS (mph) LOS
AM PEAK HOUR
Wymore Rd. to Mt. Vernon Pkwy. 0.75 ---- ---- ---- ---- ---- ---- ---- ---- ---- ---- ---- ---- ---- ---- ---- ---- ---- ---- ---- ---- ---- ---- ---- ---- 23.1 B 25.9 A 25.6 A 24.5 B
Mt. Vernon Pkwy. to Maitland Ave. 0.74 ---- ---- ---- ---- ---- ---- ---- ---- ---- ---- ---- ---- ---- ---- ---- ---- ---- ---- ---- ---- ---- ---- ---- ---- 17.4 C 19.9 B 18.6 C 21.6 B 15.3 C 19.1 B 21.6 B 22.9 B
Average 19.9 B 21.6 B 19.1 B 22.9 B
PM PEAK HOUR
Wymore Rd. to Mt. Vernon Pkwy. 0.75 ---- ---- ---- ---- ---- ---- ---- ---- ---- ---- ---- ---- ---- ---- ---- ---- ---- ---- ---- ---- ---- ---- ---- ---- 24.3 B 24.9 B 27.1 A 21.2 B
Mt. Vernon Pkwy. to Maitland Ave. 0.74 ---- ---- ---- ---- ---- ---- ---- ---- ---- ---- ---- ---- ---- ---- ---- ---- ---- ---- ---- ---- ---- ---- ---- ---- 21.3 B 22.7 B 19.6 B 22.0 B 19.4 B 22.6 B 25.1 A 23.0 B
Average 22.7 B 22.0 B 22.6 B 23.0 B
Roadway Distance
Segments (mile) (mph) LOS (mph) LOS (mph) LOS (mph) LOS (mph) LOS (mph) LOS (mph) LOS (mph) LOS (mph) LOS (mph) LOS (mph) LOS (mph) LOS (mph) LOS (mph) LOS (mph) LOS (mph) LOS (mph) LOS (mph) LOS (mph) LOS (mph) LOS
AM PEAK HOUR
Maitland Ave. to Mt. Vernon Pkwy. 0.74 ---- ---- ---- ---- ---- ---- ---- ---- ---- ---- ---- ---- ---- ---- ---- ---- ---- ---- ---- ---- ---- ---- ---- ---- 23.6 B 24.7 B 24.5 B 21.7 B
Mt. Vernon Pkwy. to Wymore Rd. 0.75 ---- ---- ---- ---- ---- ---- ---- ---- ---- ---- ---- ---- ---- ---- ---- ---- ---- ---- ---- ---- ---- ---- ---- ---- 17.7 C 20.2 B 20.4 B 22.3 B 22.7 B 23.6 B 19.5 B 20.5 B
Average 20.2 B 22.3 B 23.6 B 20.5 B
PM PEAK HOUR
Maitland Ave. to Mt. Vernon Pkwy. 0.74 ---- ---- ---- ---- ---- ---- ---- ---- ---- ---- ---- ---- ---- ---- ---- ---- ---- ---- ---- ---- ---- ---- ---- ---- 25.2 A 24.7 B 27.1 A 25.5 A
Mt. Vernon Pkwy. to Wymore Rd. 0.75 ---- ---- ---- ---- ---- ---- ---- ---- ---- ---- ---- ---- ---- ---- ---- ---- ---- ---- ---- ---- ---- ---- ---- ---- 19.8 B 22.2 B 20.6 B 22.5 B 22.7 B 24.7 B 19.8 B 22.3 B
Average 22.2 B 22.5 B 24.7 B 22.3 B
Year 2013
Rdwy Segment Rdwy Section
Average Speed Average Speed
Year 2013
Rdwy Segment Rdwy Section
Average Speed Average SpeedAverage Speed Average Speed Average Speed Average Speed Average Speed Average SpeedAverage Speed Average Speed Average Speed Average Speed Average Speed Average SpeedAverage Speed Average Speed
Year 2006 Year 2007 Year 2008 Year 2009 Year 2010 Year 2014Year 2005
Average Speed Average Speed Average Speed
TABLE C55.1b
Year 2014 Seminole County Travel Time & Delay Study
Oranole Road - Westbound Direction Historical Summary
Average Speed Average Speed Average Speed Average Speed Average Speed Average SpeedAverage Speed Average Speed Average Speed Average Speed Average Speed
Year 2014 Seminole County Travel Time & Delay StudyOranole Road - Eastbound Direction Historical Summary
Year 2005 Year 2006
Rdwy Segment
Year 2007 Year 2008 Year 2009 Year 2010 Year 2014Year 2011
Rdwy Segment Rdwy Section
Average Speed Average Speed
Year 2011
Rdwy Segment Rdwy Section
Average Speed Average Speed
Year 2012
Rdwy Segment Rdwy Section
Average Speed Average Speed
Year 2012
Rdwy Segment Rdwy Section
Average Speed Average Speed
D-62 Oranole Road
Roadway Distance
Segments (mile) (mph) LOS (mph) LOS (mph) LOS (mph) LOS (mph) LOS (mph) LOS (mph) LOS (mph) LOS (mph) LOS (mph) LOS (mph) LOS (mph) LOS (mph) LOS (mph) LOS (mph) LOS (mph) LOS (mph) LOS (mph) LOS (mph) LOS (mph) LOS
AM PEAK HOUR
Derbyshire Rd. to Lake of the Woods Blvd. 0.73 ---- ---- ---- ---- ---- ---- ---- ---- ---- ---- ---- ---- ---- ---- ---- ---- ---- ---- ---- ---- ---- ---- ---- ---- 19.3 B 19.3 B 18.3 C 18.3 C 18.7 C 18.7 C 17.5 C 17.5 C
Lake of the Woods Blvd. to Fernwood Blvd. 0.40 ---- ---- ---- ---- ---- ---- ---- ---- ---- ---- ---- ---- ---- ---- ---- ---- ---- ---- ---- ---- ---- ---- ---- ---- 21.6 B 21.6 B 21.8 B 21.8 B 20.2 B 20.2 B 20.9 B 20.9 B
Fernwood Blvd. to SR 436 0.23 ---- ---- ---- ---- ---- ---- ---- ---- ---- ---- ---- ---- ---- ---- ---- ---- ---- ---- ---- ---- ---- ---- ---- ---- 7.9 E 7.9 E 8.8 E 8.8 E 7.7 E 7.7 E 9.0 D 9.0 D
SR 436 to Sunset Dr. 0.46 ---- ---- ---- ---- ---- ---- ---- ---- ---- ---- ---- ---- ---- ---- ---- ---- ---- ---- ---- ---- ---- ---- ---- ---- 25.3 A 25.3 A 27.6 A 27.6 A ---- ---- ---- ---- ---- ---- ---- ----
Average 17.6 C 18.0 C 15.3 C 15.8 C
PM PEAK HOUR
Derbyshire Rd. to Lake of the Woods Blvd. 0.73 ---- ---- ---- ---- ---- ---- ---- ---- ---- ---- ---- ---- ---- ---- ---- ---- ---- ---- ---- ---- ---- ---- ---- ---- 20.1 B 20.1 B 20.2 B 20.2 B 21.7 B 21.7 B 18.4 C 18.4 C
Lake of the Woods Blvd. to Fernwood Blvd. 0.40 ---- ---- ---- ---- ---- ---- ---- ---- ---- ---- ---- ---- ---- ---- ---- ---- ---- ---- ---- ---- ---- ---- ---- ---- 22.9 B 22.9 B 22.2 B 22.2 B 21.6 B 21.6 B 19.0 B 19.0 B
Fernwood Blvd. to SR 436 0.23 ---- ---- ---- ---- ---- ---- ---- ---- ---- ---- ---- ---- ---- ---- ---- ---- ---- ---- ---- ---- ---- ---- ---- ---- 6.0 F 6.0 F 7.8 F 7.8 F 7.8 E 7.8 E 7.8 E 7.8 E
SR 436 to Sunset Dr. 0.46 ---- ---- ---- ---- ---- ---- ---- ---- ---- ---- ---- ---- ---- ---- ---- ---- ---- ---- ---- ---- ---- ---- ---- ---- 26.3 A 26.3 A 19.2 B 19.2 B ---- ---- ---- ---- ---- ---- ---- ----
Average 16.6 C 16.9 C 16.7 C 15.1 C
Roadway Distance
Segments (mile) (mph) LOS (mph) LOS (mph) LOS (mph) LOS (mph) LOS (mph) LOS (mph) LOS (mph) LOS (mph) LOS (mph) LOS (mph) LOS (mph) LOS (mph) LOS (mph) LOS (mph) LOS (mph) LOS (mph) LOS (mph) LOS (mph) LOS (mph) LOS
AM PEAK HOUR
Sunshine Dr. to SR 436 0.46 ---- ---- ---- ---- ---- ---- ---- ---- ---- ---- ---- ---- ---- ---- ---- ---- ---- ---- ---- ---- ---- ---- ---- ---- 11.0 D 11.0 D 11.5 D 11.5 D ---- ---- ---- ---- ---- ---- ---- ----
SR 436 to Fernwood Blvd. 0.23 ---- ---- ---- ---- ---- ---- ---- ---- ---- ---- ---- ---- ---- ---- ---- ---- ---- ---- ---- ---- ---- ---- ---- ---- 18.6 C 18.6 C 20.9 B 20.9 B 19.7 B 19.7 B 20.3 B 20.3 B
Fernwood Blvd. to Lake of the Woods Blvd. 0.40 ---- ---- ---- ---- ---- ---- ---- ---- ---- ---- ---- ---- ---- ---- ---- ---- ---- ---- ---- ---- ---- ---- ---- ---- 16.7 C 16.7 C 16.7 C 16.7 C 14.2 C 14.2 C 17.0 C 17.0 C
Lake of the Woods Blvd. to Derbyshire Rd. 0.73 ---- ---- ---- ---- ---- ---- ---- ---- ---- ---- ---- ---- ---- ---- ---- ---- ---- ---- ---- ---- ---- ---- ---- ---- 22.2 B 22.2 B 23.2 B 23.2 B 22.9 B 22.9 B 21.8 B 21.8 B
Average 16.4 C 17.1 C 19.0 C 19.9 B
PM PEAK HOUR
Sunshine Dr. to SR 436 0.46 ---- ---- ---- ---- ---- ---- ---- ---- ---- ---- ---- ---- ---- ---- ---- ---- ---- ---- ---- ---- ---- ---- ---- ---- 8.3 E 8.3 E 11.0 D 11.0 D ---- ---- ---- ---- ---- ---- ---- ----
SR 436 to Fernwood Blvd. 0.23 ---- ---- ---- ---- ---- ---- ---- ---- ---- ---- ---- ---- ---- ---- ---- ---- ---- ---- ---- ---- ---- ---- ---- ---- 20.3 B 20.3 B 14.4 C 14.4 C 20.3 B 20.3 B 15.9 C 15.9 C
Fernwood Blvd. to Lake of the Woods Blvd. 0.40 ---- ---- ---- ---- ---- ---- ---- ---- ---- ---- ---- ---- ---- ---- ---- ---- ---- ---- ---- ---- ---- ---- ---- ---- 23.3 B 23.3 B 23.1 B 23.1 B 19.0 B 19.0 B 17.9 C 17.9 C
Lake of the Woods Blvd. to Derbyshire Rd. 0.73 ---- ---- ---- ---- ---- ---- ---- ---- ---- ---- ---- ---- ---- ---- ---- ---- ---- ---- ---- ---- ---- ---- ---- ---- 24.1 B 24.1 B 23.9 B 23.9 B 23.1 B 23.1 B 19.6 B 19.6 B
Average 16.0 C 17.2 C 21.2 B 18.3 C
Year 2013
Rdwy Segment Rdwy Section
Average Speed Average Speed
Year 2013
Rdwy Segment Rdwy Section
Average Speed Average SpeedAverage Speed Average Speed Average Speed Average Speed Average Speed Average SpeedAverage Speed Average Speed Average Speed Average Speed Average Speed Average SpeedAverage Speed Average Speed
Year 2006 Year 2007 Year 2008 Year 2009 Year 2010 Year 2014Year 2005
Average Speed Average Speed Average Speed
TABLE C56.1b
Year 2014 Seminole County Travel Time & Delay Study
Oxford Road - Southbound Direction Historical Summary
Average Speed Average Speed Average Speed Average Speed Average Speed Average SpeedAverage Speed Average Speed Average Speed Average Speed Average Speed
Year 2014 Seminole County Travel Time & Delay StudyOxford Road - Northbound Direction Historical Summary
Year 2005 Year 2006
Rdwy Segment
Year 2007 Year 2008 Year 2009 Year 2010 Year 2014Year 2011
Rdwy Segment Rdwy Section
Average Speed Average Speed
Year 2011
Rdwy Segment Rdwy Section
Average Speed Average Speed
Year 2012
Rdwy Segment Rdwy Section
Average Speed Average Speed
Year 2012
Rdwy Segment Rdwy Section
Average Speed Average Speed
D-63 Oxford Road
Roadway Distance
Segments (mile) (mph) LOS (mph) LOS (mph) LOS (mph) LOS (mph) LOS (mph) LOS (mph) LOS (mph) LOS (mph) LOS (mph) LOS (mph) LOS (mph) LOS (mph) LOS (mph) LOS (mph) LOS (mph) LOS (mph) LOS (mph) LOS (mph) LOS (mph) LOS
AM PEAK HOUR
Bunnell Rd. to N/S Pearl Lake Cswy. 0.46 ---- ---- ---- ---- ---- ---- ---- ---- ---- ---- ---- ---- ---- ---- ---- ---- ---- ---- ---- ---- ---- ---- ---- ---- 27.6 A 27.6 A 25.6 A 25.6 A 28.7 A 28.7 A 27.1 A 27.1 A
N/S Pearl Lake Cswy. to SR 436 0.33 ---- ---- ---- ---- ---- ---- ---- ---- ---- ---- ---- ---- ---- ---- ---- ---- ---- ---- ---- ---- ---- ---- ---- ---- 9.9 D 9.9 D 9.9 D 9.9 D 13.2 C 13.2 C 14.1 C 14.1 C
Average 15.7 C 15.3 C 19.3 B 19.6 B
PM PEAK HOUR
Bunnell Rd. to N/S Pearl Lake Cswy. 0.46 ---- ---- ---- ---- ---- ---- ---- ---- ---- ---- ---- ---- ---- ---- ---- ---- ---- ---- ---- ---- ---- ---- ---- ---- 28.7 A 28.7 A 28.7 A 28.7 A 29.4 A 29.4 A 27.6 A 27.6 A
N/S Pearl Lake Cswy. to SR 436 0.33 ---- ---- ---- ---- ---- ---- ---- ---- ---- ---- ---- ---- ---- ---- ---- ---- ---- ---- ---- ---- ---- ---- ---- ---- 9.3 D 9.3 D 7.6 E 7.6 E 14.2 C 14.2 C 12.8 D 12.8 D
Average 15.3 C 13.3 C 20.3 B 18.6 C
Roadway Distance
Segments (mile) (mph) LOS (mph) LOS (mph) LOS (mph) LOS (mph) LOS (mph) LOS (mph) LOS (mph) LOS (mph) LOS (mph) LOS (mph) LOS (mph) LOS (mph) LOS (mph) LOS (mph) LOS (mph) LOS (mph) LOS (mph) LOS (mph) LOS (mph) LOS
AM PEAK HOUR
SR 436 to N/S Pearl Lake Cswy. 0.33 ---- ---- ---- ---- ---- ---- ---- ---- ---- ---- ---- ---- ---- ---- ---- ---- ---- ---- ---- ---- ---- ---- ---- ---- 27.9 A 27.9 A 28.7 A 28.7 A 29.6 A 29.6 A 30.9 A 30.9 A
N/S Pearl Lake Cswy. To Bunnell Rd. 0.46 ---- ---- ---- ---- ---- ---- ---- ---- ---- ---- ---- ---- ---- ---- ---- ---- ---- ---- ---- ---- ---- ---- ---- ---- 22.8 B 22.8 B 23.2 B 23.2 B 23.0 B 23.0 B 23.2 B 23.2 B
Average 24.7 B 25.2 A 25.3 A 25.9 A
PM PEAK HOUR
SR 436 to N/S Pearl Lake Cswy. 0.33 ---- ---- ---- ---- ---- ---- ---- ---- ---- ---- ---- ---- ---- ---- ---- ---- ---- ---- ---- ---- ---- ---- ---- ---- 28.7 A 28.7 A 29.1 A 29.1 A 33.0 A 33.0 A 30.0 A 30.0 A
N/S Pearl Lake Cswy. To Bunnell Rd. 0.46 ---- ---- ---- ---- ---- ---- ---- ---- ---- ---- ---- ---- ---- ---- ---- ---- ---- ---- ---- ---- ---- ---- ---- ---- 19.2 B 19.2 B 17.2 C 17.2 C 24.2 B 24.2 B 16.8 C 16.8 C
Average 22.3 B 20.8 B 27.2 A 20.6 B
Year 2013
Rdwy Segment Rdwy Section
Average Speed Average Speed
Year 2013
Rdwy Segment Rdwy Section
Average Speed Average SpeedAverage Speed Average Speed Average Speed Average Speed Average Speed Average SpeedAverage Speed Average Speed Average Speed Average Speed Average Speed Average SpeedAverage Speed Average Speed
Year 2006 Year 2007 Year 2008 Year 2009 Year 2010 Year 2014Year 2005
Average Speed Average Speed Average Speed
TABLE C57.1b
Year 2014 Seminole County Travel Time & Delay Study
Pearl Lake Causeway - Southbound Direction Historical Summary
Average Speed Average Speed Average Speed Average Speed Average Speed Average SpeedAverage Speed Average Speed Average Speed Average Speed Average Speed
Year 2014 Seminole County Travel Time & Delay StudyPearl Lake Causeway - Northbound Direction Historical Summary
Year 2005 Year 2006
Rdwy Segment
Year 2007 Year 2008 Year 2009 Year 2010 Year 2014Year 2011
Rdwy Segment Rdwy Section
Average Speed Average Speed
Year 2011
Rdwy Segment Rdwy Section
Average Speed Average Speed
Year 2012
Rdwy Segment Rdwy Section
Average Speed Average Speed
Year 2012
Rdwy Segment Rdwy Section
Average Speed Average Speed
D-64 Pearl Lake Causeway
Roadway Distance
Segments (mile) (mph) LOS (mph) LOS (mph) LOS (mph) LOS (mph) LOS (mph) LOS (mph) LOS (mph) LOS (mph) LOS (mph) LOS (mph) LOS (mph) LOS (mph) LOS (mph) LOS (mph) LOS (mph) LOS (mph) LOS (mph) LOS (mph) LOS (mph) LOS
AM PEAK HOUR
SR 434 to Devonshire Blvd. 0.47 ---- ---- ---- ---- ---- ---- ---- ---- ---- ---- ---- ---- ---- ---- ---- ---- ---- ---- ---- ---- ---- ---- ---- ---- 24.1 B 26.6 A 25.9 A 26.9 A
Devonshire Blvd. to Church Ave. 0.28 ---- ---- ---- ---- ---- ---- ---- ---- ---- ---- ---- ---- ---- ---- ---- ---- ---- ---- ---- ---- ---- ---- ---- ---- 21.8 B 22.1 B 22.4 B 24.0 B
Church Ave. to Loch Lomond Ave. 0.15 ---- ---- ---- ---- ---- ---- ---- ---- ---- ---- ---- ---- ---- ---- ---- ---- ---- ---- ---- ---- ---- ---- ---- ---- 16.7 C 19.1 B 17.0 C 16.7 C
Loch Lomond Ave. to EE Williamson Rd. 0.15 ---- ---- ---- ---- ---- ---- ---- ---- ---- ---- ---- ---- ---- ---- ---- ---- ---- ---- ---- ---- ---- ---- ---- ---- 12.2 D 19.6 B 12.0 D 20.7 B 15.5 C 21.4 B 10.2 D 19.9 B
Average 19.6 B 20.7 B 21.4 B 19.9 B
PM PEAK HOUR
SR 434 to Devonshire Blvd. 0.47 ---- ---- ---- ---- ---- ---- ---- ---- ---- ---- ---- ---- ---- ---- ---- ---- ---- ---- ---- ---- ---- ---- ---- ---- 25.0 B 25.6 A 25.6 A 22.6 B
Devonshire Blvd. to Church Ave. 0.28 ---- ---- ---- ---- ---- ---- ---- ---- ---- ---- ---- ---- ---- ---- ---- ---- ---- ---- ---- ---- ---- ---- ---- ---- 20.7 B 24.7 B 21.8 B 22.1 B
Church Ave. to Loch Lomond Ave. 0.15 ---- ---- ---- ---- ---- ---- ---- ---- ---- ---- ---- ---- ---- ---- ---- ---- ---- ---- ---- ---- ---- ---- ---- ---- 15.8 C 15.8 C 15.3 C 12.7 D
Loch Lomond Ave. to EE Williamson Rd. 0.15 ---- ---- ---- ---- ---- ---- ---- ---- ---- ---- ---- ---- ---- ---- ---- ---- ---- ---- ---- ---- ---- ---- ---- ---- 15.8 C 20.5 B 9.8 D 19.3 B 18.0 C 21.3 B 9.4 D 17.1 C
Average 20.5 B 19.3 B 21.3 B 17.1 C
Roadway Distance
Segments (mile) (mph) LOS (mph) LOS (mph) LOS (mph) LOS (mph) LOS (mph) LOS (mph) LOS (mph) LOS (mph) LOS (mph) LOS (mph) LOS (mph) LOS (mph) LOS (mph) LOS (mph) LOS (mph) LOS (mph) LOS (mph) LOS (mph) LOS (mph) LOS
AM PEAK HOUR
EE Williamson Rd. to Loch Lomond Ave. 0.15 ---- ---- ---- ---- ---- ---- ---- ---- ---- ---- ---- ---- ---- ---- ---- ---- ---- ---- ---- ---- ---- ---- ---- ---- 15.0 C 14.3 C 10.2 D 14.1 C
Loch Lomond Ave. to Church Ave. 0.15 ---- ---- ---- ---- ---- ---- ---- ---- ---- ---- ---- ---- ---- ---- ---- ---- ---- ---- ---- ---- ---- ---- ---- ---- 17.0 C 17.0 C 16.7 C 18.7 C
Church Ave. to Devonshire Blvd. 0.28 ---- ---- ---- ---- ---- ---- ---- ---- ---- ---- ---- ---- ---- ---- ---- ---- ---- ---- ---- ---- ---- ---- ---- ---- 20.2 B 22.4 B 22.4 B 24.3 B
Devonshire Blvd. to SR 434 0.47 ---- ---- ---- ---- ---- ---- ---- ---- ---- ---- ---- ---- ---- ---- ---- ---- ---- ---- ---- ---- ---- ---- ---- ---- 12.2 D 14.7 C 13.1 C 15.5 C 26.6 A 19.5 B 13.6 C 16.2 C
Average 14.7 C 15.5 C 19.5 B 16.2 C
PM PEAK HOUR
EE Williamson Rd. to Loch Lomond Ave. 0.15 ---- ---- ---- ---- ---- ---- ---- ---- ---- ---- ---- ---- ---- ---- ---- ---- ---- ---- ---- ---- ---- ---- ---- ---- 17.3 C 17.3 C 13.8 C 13.8 C
Loch Lomond Ave. to Church Ave. 0.15 ---- ---- ---- ---- ---- ---- ---- ---- ---- ---- ---- ---- ---- ---- ---- ---- ---- ---- ---- ---- ---- ---- ---- ---- 18.4 C 18.0 C 17.0 C 17.3 C
Church Ave. to Devonshire Blvd. 0.28 ---- ---- ---- ---- ---- ---- ---- ---- ---- ---- ---- ---- ---- ---- ---- ---- ---- ---- ---- ---- ---- ---- ---- ---- 21.8 B 23.7 B 23.7 B 21.0 B
Devonshire Blvd. to SR 434 0.47 ---- ---- ---- ---- ---- ---- ---- ---- ---- ---- ---- ---- ---- ---- ---- ---- ---- ---- ---- ---- ---- ---- ---- ---- 8.1 E 11.9 D 15.0 C 17.5 C 13.1 C 15.6 C 10.2 D 13.3 C
Average 11.9 D 17.5 C 15.6 C 13.3 C
Year 2013
Rdwy Segment Rdwy Section
Average Speed Average Speed
Year 2013
Rdwy Segment Rdwy Section
Average Speed Average SpeedAverage Speed Average Speed Average Speed Average Speed Average Speed Average SpeedAverage Speed Average Speed Average Speed Average Speed Average Speed Average SpeedAverage Speed Average Speed
Year 2006 Year 2007 Year 2008 Year 2009 Year 2010 Year 2014Year 2005
Average Speed Average Speed Average Speed
TABLE C58.1b
Year 2014 Seminole County Travel Time & Delay Study
Rangeline Road - Southbound Direction Historical Summary
Average Speed Average Speed Average Speed Average Speed Average Speed Average SpeedAverage Speed Average Speed Average Speed Average Speed Average Speed
Year 2014 Seminole County Travel Time & Delay StudyRangeline Road - Northbound Direction Historical Summary
Year 2005 Year 2006
Rdwy Segment
Year 2007 Year 2008 Year 2009 Year 2010 Year 2014Year 2011
Rdwy Segment Rdwy Section
Average Speed Average Speed
Year 2011
Rdwy Segment Rdwy Section
Average Speed Average Speed
Year 2012
Rdwy Segment Rdwy Section
Average Speed Average Speed
Year 2012
Rdwy Segment Rdwy Section
Average Speed Average Speed
D-65 Rangeline Road
Roadway Distance
Segments (mile) (mph) LOS (mph) LOS (mph) LOS (mph) LOS (mph) LOS (mph) LOS (mph) LOS (mph) LOS (mph) LOS (mph) LOS (mph) LOS (mph) LOS (mph) LOS (mph) LOS (mph) LOS (mph) LOS (mph) LOS (mph) LOS (mph) LOS (mph) LOS
AM PEAK HOUR
North St. to SR 434 0.58 ---- ---- ---- ---- ---- ---- ---- ---- ---- ---- ---- ---- ---- ---- ---- ---- ---- ---- ---- ---- ---- ---- ---- ---- 14.3 C 14.3 C 17.8 C 17.8 C 11.5 D 11.5 D 16.3 C 16.3 C
Average 14.3 C 17.8 C 11.5 D 16.3 C
PM PEAK HOUR
North St. to SR 434 0.58 ---- ---- ---- ---- ---- ---- ---- ---- ---- ---- ---- ---- ---- ---- ---- ---- ---- ---- ---- ---- ---- ---- ---- ---- 21.6 B 21.6 B 24.0 B 24.0 B 23.4 B 23.4 B 10.3 D 10.3 D
Average 21.6 B 24.0 B 23.4 B 10.3 D
Roadway Distance
Segments (mile) (mph) LOS (mph) LOS (mph) LOS (mph) LOS (mph) LOS (mph) LOS (mph) LOS (mph) LOS (mph) LOS (mph) LOS (mph) LOS (mph) LOS (mph) LOS (mph) LOS (mph) LOS (mph) LOS (mph) LOS (mph) LOS (mph) LOS (mph) LOS
AM PEAK HOUR
SR 434 to North St. 0.58 ---- ---- ---- ---- ---- ---- ---- ---- ---- ---- ---- ---- ---- ---- ---- ---- ---- ---- ---- ---- ---- ---- ---- ---- 26.6 A 26.6 A 27.4 A 27.4 A 25.4 A 25.4 A 26.8 A 26.8 A
Average 26.6 A 27.4 A 25.4 A 26.8 A
PM PEAK HOUR
SR 434 to North St. 0.58 ---- ---- ---- ---- ---- ---- ---- ---- ---- ---- ---- ---- ---- ---- ---- ---- ---- ---- ---- ---- ---- ---- ---- ---- 27.6 A 27.6 A 27.2 A 27.2 A 25.4 A 25.4 A 27.0 A 27.0 A
Average 27.6 A 27.2 A 25.4 A 27.0 A
Year 2013
Rdwy Segment Rdwy Section
Average Speed Average Speed
Year 2013
Rdwy Segment Rdwy Section
Average Speed Average SpeedAverage Speed Average Speed Average Speed Average Speed Average Speed Average SpeedAverage Speed Average Speed Average Speed Average Speed Average Speed Average SpeedAverage Speed Average Speed
Year 2006 Year 2007 Year 2008 Year 2009 Year 2010 Year 2014Year 2005
Average Speed Average Speed Average Speed
TABLE C59.1b
Year 2014 Seminole County Travel Time & Delay Study
Raymond Avenue - Southbound Direction Historical Summary
Average Speed Average Speed Average Speed Average Speed Average Speed Average SpeedAverage Speed Average Speed Average Speed Average Speed Average Speed
Year 2014 Seminole County Travel Time & Delay StudyRaymond Avenue - Northbound Direction Historical Summary
Year 2005 Year 2006
Rdwy Segment
Year 2007 Year 2008 Year 2009 Year 2010 Year 2014Year 2011
Rdwy Segment Rdwy Section
Average Speed Average Speed
Year 2011
Rdwy Segment Rdwy Section
Average Speed Average Speed
Year 2012
Rdwy Segment Rdwy Section
Average Speed Average Speed
Year 2012
Rdwy Segment Rdwy Section
Average Speed Average Speed
D-66 Raymond Avenue
Roadway Distance
Segments (mile) (mph) LOS (mph) LOS (mph) LOS (mph) LOS (mph) LOS (mph) LOS (mph) LOS (mph) LOS (mph) LOS (mph) LOS (mph) LOS (mph) LOS (mph) LOS (mph) LOS (mph) LOS (mph) LOS (mph) LOS (mph) LOS (mph) LOS (mph) LOS
AM PEAK HOUR
Red Bug Lake Rd. to Summer Club Dr.* 0.31 ---- ---- ---- ---- ---- ---- ---- ---- ---- ---- ---- ---- ---- ---- ---- ---- ---- ---- ---- ---- ---- ---- ---- ---- 38.0 A 35.1 A 27.8 C
Summer Club Dr to SR 426 0.58 ---- ---- ---- ---- ---- ---- ---- ---- ---- ---- ---- ---- ---- ---- ---- ---- ---- ---- ---- ---- ---- ---- ---- ---- 28.1 B 28.1 B 27.8 C 30.7 B 22.2 C 25.4 C 10.4 F 13.3 E
Average 28.1 B 30.7 B 25.4 C 13.3 E
PM PEAK HOUR
Red Bug Lake Rd. to Summer Club Dr.* 0.31 ---- ---- ---- ---- ---- ---- ---- ---- ---- ---- ---- ---- ---- ---- ---- ---- ---- ---- ---- ---- ---- ---- ---- ---- 38.0 A 29.5 B 30.5 B
Summer Club Dr to SR 426 0.58 ---- ---- ---- ---- ---- ---- ---- ---- ---- ---- ---- ---- ---- ---- ---- ---- ---- ---- ---- ---- ---- ---- ---- ---- 36.1 A 36.1 A 31.1 B 33.2 B 27.0 C 27.8 C 16.5 E 19.6 D
Average 36.1 A 33.2 B 27.8 C 19.6 D
Note: *From the year 2012, additional control point has been added at Summer Club Dr.
Roadway Distance
Segments (mile) (mph) LOS (mph) LOS (mph) LOS (mph) LOS (mph) LOS (mph) LOS (mph) LOS (mph) LOS (mph) LOS (mph) LOS (mph) LOS (mph) LOS (mph) LOS (mph) LOS (mph) LOS (mph) LOS (mph) LOS (mph) LOS (mph) LOS (mph) LOS
AM PEAK HOUR
SR 426 to Summer Club Dr.* 0.58 ---- ---- ---- ---- ---- ---- ---- ---- ---- ---- ---- ---- ---- ---- ---- ---- ---- ---- ---- ---- ---- ---- ---- ---- 31.4 B 27.0 C 24.9 C
Summer Club Dr. to Red Bug Lake Rd. 0.31 ---- ---- ---- ---- ---- ---- ---- ---- ---- ---- ---- ---- ---- ---- ---- ---- ---- ---- ---- ---- ---- ---- ---- ---- 23.8 C 23.8 C 7.9 F 15.4 E 35.8 A 29.5 B 9.9 F 16.3 E
Average 23.8 C 15.4 E 29.5 B 16.3 E
PM PEAK HOUR
SR 426 to Summer Club Dr.* 0.58 ---- ---- ---- ---- ---- ---- ---- ---- ---- ---- ---- ---- ---- ---- ---- ---- ---- ---- ---- ---- ---- ---- ---- ---- 39.5 A 40.0 A 33.5 B
Summer Club Dr. to Red Bug Lake Rd. 0.31 ---- ---- ---- ---- ---- ---- ---- ---- ---- ---- ---- ---- ---- ---- ---- ---- ---- ---- ---- ---- ---- ---- ---- ---- 32.4 B 32.4 B 12.1 F 22.1 C 36.5 A 38.7 A 15.4 E 23.7 C
Average 32.4 B 22.1 C 38.7 A 23.7 C
Note: *From the year 2012, additional control point has been added at Summer Club Dr.
Year 2013
Rdwy Segment Rdwy Section
Average Speed Average Speed
Year 2013
Rdwy Segment Rdwy Section
Average Speed Average SpeedAverage Speed Average Speed Average Speed Average Speed Average Speed Average SpeedAverage Speed Average Speed Average Speed Average Speed Average Speed Average SpeedAverage Speed Average Speed
Year 2006 Year 2007 Year 2008 Year 2009 Year 2010 Year 2014Year 2005
Average Speed Average Speed Average Speed
TABLE C60.1b
Year 2014 Seminole County Travel Time & Delay Study
Slavia Road - Westbound Direction Historical Summary
Average Speed Average Speed Average Speed Average Speed Average Speed Average SpeedAverage Speed Average Speed Average Speed Average Speed Average Speed
Year 2014 Seminole County Travel Time & Delay StudySlavia Road - Eastbound Direction Historical Summary
Year 2005 Year 2006
Rdwy Segment
Year 2007 Year 2008 Year 2009 Year 2010 Year 2014Year 2011
Rdwy Segment Rdwy Section
Average Speed Average Speed
Year 2011
Rdwy Segment Rdwy Section
Average Speed Average Speed
Year 2012
Rdwy Segment Rdwy Section
Average Speed Average Speed
Year 2012
Rdwy Segment Rdwy Section
Average Speed Average Speed
D-67 Slavia Road
Roadway Distance
Segments (mile) (mph) LOS (mph) LOS (mph) LOS (mph) LOS (mph) LOS (mph) LOS (mph) LOS (mph) LOS (mph) LOS (mph) LOS (mph) LOS (mph) LOS (mph) LOS (mph) LOS (mph) LOS (mph) LOS (mph) LOS (mph) LOS (mph) LOS (mph) LOS
AM PEAK HOUR
Citrus Ave. to Timber Dr. 0.29 ---- ---- ---- ---- ---- ---- ---- ---- ---- ---- ---- ---- ---- ---- ---- ---- ---- ---- ---- ---- ---- ---- ---- ---- 18.1 C 16.3 C 18.7 C 17.4 C
Timber Dr. to Betty St. 0.02 ---- ---- ---- ---- ---- ---- ---- ---- ---- ---- ---- ---- ---- ---- ---- ---- ---- ---- ---- ---- ---- ---- ---- ---- 15.0 C 17.1 C 17.1 C 17.1 C
Betty St. to Howell Branch Rd. 0.64 ---- ---- ---- ---- ---- ---- ---- ---- ---- ---- ---- ---- ---- ---- ---- ---- ---- ---- ---- ---- ---- ---- ---- ---- 16.3 C 16.8 C 14.4 C 15.0 C 14.9 C 16.0 C 16.6 C 16.9 C
Average 16.8 C 15.0 C 16.0 C 16.9 C
PM PEAK HOUR
Citrus Ave. to Timber Dr. 0.29 ---- ---- ---- ---- ---- ---- ---- ---- ---- ---- ---- ---- ---- ---- ---- ---- ---- ---- ---- ---- ---- ---- ---- ---- 17.8 C 17.4 C 20.0 B 18.5 C
Timber Dr. to Betty St. 0.02 ---- ---- ---- ---- ---- ---- ---- ---- ---- ---- ---- ---- ---- ---- ---- ---- ---- ---- ---- ---- ---- ---- ---- ---- 15.0 C 17.1 C 20.0 B 17.1 C
Betty St. to Howell Branch Rd. 0.64 ---- ---- ---- ---- ---- ---- ---- ---- ---- ---- ---- ---- ---- ---- ---- ---- ---- ---- ---- ---- ---- ---- ---- ---- 16.1 C 16.6 C 17.5 C 17.5 C 18.7 C 19.1 B 14.2 C 15.3 C
Average 16.6 C 17.5 C 19.1 B 15.3 C
Roadway Distance
Segments (mile) (mph) LOS (mph) LOS (mph) LOS (mph) LOS (mph) LOS (mph) LOS (mph) LOS (mph) LOS (mph) LOS (mph) LOS (mph) LOS (mph) LOS (mph) LOS (mph) LOS (mph) LOS (mph) LOS (mph) LOS (mph) LOS (mph) LOS (mph) LOS
AM PEAK HOUR
Howell Branch Rd. to Betty St. 0.64 ---- ---- ---- ---- ---- ---- ---- ---- ---- ---- ---- ---- ---- ---- ---- ---- ---- ---- ---- ---- ---- ---- ---- ---- 19.9 B 19.6 B 20.5 B 19.0 B
Betty St. to Timber Dr. 0.02 ---- ---- ---- ---- ---- ---- ---- ---- ---- ---- ---- ---- ---- ---- ---- ---- ---- ---- ---- ---- ---- ---- ---- ---- 17.1 C 17.1 C 17.1 C 20.0 B
Timber Dr. to Citrus Ave. 0.29 ---- ---- ---- ---- ---- ---- ---- ---- ---- ---- ---- ---- ---- ---- ---- ---- ---- ---- ---- ---- ---- ---- ---- ---- 19.6 B 19.7 B 18.7 C 19.3 B 18.7 C 19.9 B 18.3 C 18.8 C
Average 19.7 B 19.3 B 19.9 B 18.8 C
PM PEAK HOUR
Howell Branch Rd. to Betty St. 0.64 ---- ---- ---- ---- ---- ---- ---- ---- ---- ---- ---- ---- ---- ---- ---- ---- ---- ---- ---- ---- ---- ---- ---- ---- 22.3 B 21.7 B 21.7 B 19.6 B
Betty St. to Timber Dr. 0.02 ---- ---- ---- ---- ---- ---- ---- ---- ---- ---- ---- ---- ---- ---- ---- ---- ---- ---- ---- ---- ---- ---- ---- ---- 17.1 C 20.0 B 17.1 C 20.0 B
Timber Dr. to Citrus Ave. 0.29 ---- ---- ---- ---- ---- ---- ---- ---- ---- ---- ---- ---- ---- ---- ---- ---- ---- ---- ---- ---- ---- ---- ---- ---- 18.9 C 21.0 B 18.3 C 20.5 B 20.5 B 21.2 B 19.3 B 19.5 B
Average 21.0 B 20.5 B 21.2 B 19.5 B
Year 2013
Rdwy Segment Rdwy Section
Average Speed Average Speed
Year 2013
Rdwy Segment Rdwy Section
Average Speed Average SpeedAverage Speed Average Speed Average Speed Average Speed Average Speed Average SpeedAverage Speed Average Speed Average Speed Average Speed Average Speed Average SpeedAverage Speed Average Speed
Year 2006 Year 2007 Year 2008 Year 2009 Year 2010 Year 2014Year 2005
Average Speed Average Speed Average Speed
TABLE C61.1b
Year 2014 Seminole County Travel Time & Delay Study
Tangerine Avenue - Southbound Direction Historical Summary
Average Speed Average Speed Average Speed Average Speed Average Speed Average SpeedAverage Speed Average Speed Average Speed Average Speed Average Speed
Year 2014 Seminole County Travel Time & Delay StudyTangerine Avenue - Northbound Direction Historical Summary
Year 2005 Year 2006
Rdwy Segment
Year 2007 Year 2008 Year 2009 Year 2010 Year 2014Year 2011
Rdwy Segment Rdwy Section
Average Speed Average Speed
Year 2011
Rdwy Segment Rdwy Section
Average Speed Average Speed
Year 2012
Rdwy Segment Rdwy Section
Average Speed Average Speed
Year 2012
Rdwy Segment Rdwy Section
Average Speed Average Speed
D-68 Tangerine Avenue
Roadway Distance
Segments (mile) (mph) LOS (mph) LOS (mph) LOS (mph) LOS (mph) LOS (mph) LOS (mph) LOS (mph) LOS (mph) LOS (mph) LOS (mph) LOS (mph) LOS (mph) LOS (mph) LOS (mph) LOS (mph) LOS (mph) LOS (mph) LOS (mph) LOS (mph) LOS
AM PEAK HOUR
Rinehart Rd. to S. Mall Entrance 0.42 ---- ---- ---- ---- ---- ---- ---- ---- ---- ---- ---- ---- ---- ---- ---- ---- ---- ---- ---- ---- ---- ---- ---- ---- 22.3 C 29.0 B 28.0 B 30.7 A
S. Mall Entrance to St. Johns Pkwy. 0.53 ---- ---- ---- ---- ---- ---- ---- ---- ---- ---- ---- ---- ---- ---- ---- ---- ---- ---- ---- ---- ---- ---- ---- ---- 30.9 A 33.8 A 32.1 A 33.5 A
St. Johns Pkwy. To N. Mall Entrance 0.13 ---- ---- ---- ---- ---- ---- ---- ---- ---- ---- ---- ---- ---- ---- ---- ---- ---- ---- ---- ---- ---- ---- ---- ---- 28.9 B 33.9 A 26.9 B 30.0 B
N. Mall Entrance to SR 46 0.27 ---- ---- ---- ---- ---- ---- ---- ---- ---- ---- ---- ---- ---- ---- ---- ---- ---- ---- ---- ---- ---- ---- ---- ---- 11.6 E 21.1 C 11.3 E 23.3 C 11.9 E 22.9 C 10.7 E 22.8 C
Average 21.1 C 23.3 C 22.9 C 22.8 C
PM PEAK HOUR
Rinehart Rd. to S. Mall Entrance 0.42 ---- ---- ---- ---- ---- ---- ---- ---- ---- ---- ---- ---- ---- ---- ---- ---- ---- ---- ---- ---- ---- ---- ---- ---- 22.1 C 24.0 C 21.5 C 21.2 C
S. Mall Entrance to St. Johns Pkwy. 0.53 ---- ---- ---- ---- ---- ---- ---- ---- ---- ---- ---- ---- ---- ---- ---- ---- ---- ---- ---- ---- ---- ---- ---- ---- 26.9 B 24.5 B 26.7 B 33.1 A
St. Johns Pkwy. To N. Mall Entrance 0.13 ---- ---- ---- ---- ---- ---- ---- ---- ---- ---- ---- ---- ---- ---- ---- ---- ---- ---- ---- ---- ---- ---- ---- ---- 17.3 D 14.2 D 18.1 C 27.9 B
N. Mall Entrance to SR 46 0.27 ---- ---- ---- ---- ---- ---- ---- ---- ---- ---- ---- ---- ---- ---- ---- ---- ---- ---- ---- ---- ---- ---- ---- ---- 10.6 E 18.8 C 9.4 F 17.5 D 11.2 E 19.1 C 12.4 E 21.7 C
Average 18.8 C 17.5 D 19.1 C 21.7 C
Roadway Distance
Segments (mile) (mph) LOS (mph) LOS (mph) LOS (mph) LOS (mph) LOS (mph) LOS (mph) LOS (mph) LOS (mph) LOS (mph) LOS (mph) LOS (mph) LOS (mph) LOS (mph) LOS (mph) LOS (mph) LOS (mph) LOS (mph) LOS (mph) LOS (mph) LOS
AM PEAK HOUR
SR 46 to N. Mall Entrance 0.27 ---- ---- ---- ---- ---- ---- ---- ---- ---- ---- ---- ---- ---- ---- ---- ---- ---- ---- ---- ---- ---- ---- ---- ---- 22.2 A 24.5 B 23.1 C 26.1 B
N. Mall Entrance to St. Johns Pkwy. 0.13 ---- ---- ---- ---- ---- ---- ---- ---- ---- ---- ---- ---- ---- ---- ---- ---- ---- ---- ---- ---- ---- ---- ---- ---- 26.9 A 31.2 A 26.0 B 25.2 B
St. Johns Pkwy. to S. Mall Entrance. 0.53 ---- ---- ---- ---- ---- ---- ---- ---- ---- ---- ---- ---- ---- ---- ---- ---- ---- ---- ---- ---- ---- ---- ---- ---- 26.9 A 29.2 B 32.8 A 30.9 A
S. Mall Entrance. to Rinehart Rd. 0.42 ---- ---- ---- ---- ---- ---- ---- ---- ---- ---- ---- ---- ---- ---- ---- ---- ---- ---- ---- ---- ---- ---- ---- ---- 19.8 A 23.3 A 26.8 B 27.6 B 17.6 D 23.8 C 21.5 C 25.9 B
Average 23.3 C 27.6 B 23.8 C 25.9 B
PM PEAK HOUR
SR 46 to N. Mall Entrance 0.27 ---- ---- ---- ---- ---- ---- ---- ---- ---- ---- ---- ---- ---- ---- ---- ---- ---- ---- ---- ---- ---- ---- ---- ---- 20.5 A 16.5 D 22.2 C 23.8 C
N. Mall Entrance to St. Johns Pkwy. 0.13 ---- ---- ---- ---- ---- ---- ---- ---- ---- ---- ---- ---- ---- ---- ---- ---- ---- ---- ---- ---- ---- ---- ---- ---- 14.7 A 15.0 D 15.9 D 18.1 C
St. Johns Pkwy. to S. Mall Entrance. 0.53 ---- ---- ---- ---- ---- ---- ---- ---- ---- ---- ---- ---- ---- ---- ---- ---- ---- ---- ---- ---- ---- ---- ---- ---- 26.7 A 24.1 B 30.3 A 21.8 C
S. Mall Entrance. to Rinehart Rd. 0.42 ---- ---- ---- ---- ---- ---- ---- ---- ---- ---- ---- ---- ---- ---- ---- ---- ---- ---- ---- ---- ---- ---- ---- ---- 17.3 A 20.4 A 17.5 D 19.0 C 13.2 E 19.4 C 13.3 E 18.1 C
Average 20.4 C 19.0 C 19.4 C 18.1 C
Year 2013
Rdwy Segment Rdwy Section
Average Speed Average Speed
Year 2013
Rdwy Segment Rdwy Section
Average Speed Average SpeedAverage Speed Average Speed Average Speed Average Speed Average Speed Average SpeedAverage Speed Average Speed Average Speed Average Speed Average Speed Average SpeedAverage Speed Average Speed
Year 2006 Year 2007 Year 2008 Year 2009 Year 2010 Year 2014Year 2005
Average Speed Average Speed Average Speed
TABLE C62.1b
Year 2014 Seminole County Travel Time & Delay Study
Towne Center Boulevard - Southbound Direction Historical Summary
Average Speed Average Speed Average Speed Average Speed Average Speed Average SpeedAverage Speed Average Speed Average Speed Average Speed Average Speed
Year 2014 Seminole County Travel Time & Delay StudyTowne Center Boulevard - Northbound Direction Historical Summary
Year 2005 Year 2006
Rdwy Segment
Year 2007 Year 2008 Year 2009 Year 2010 Year 2014Year 2011
Rdwy Segment Rdwy Section
Average Speed Average Speed
Year 2011
Rdwy Segment Rdwy Section
Average Speed Average Speed
Year 2012
Rdwy Segment Rdwy Section
Average Speed Average Speed
Year 2012
Rdwy Segment Rdwy Section
Average Speed Average Speed
D-69 Towne Center Boulevard
Roadway Distance
Segments (mile) (mph) LOS (mph) LOS (mph) LOS (mph) LOS (mph) LOS (mph) LOS (mph) LOS (mph) LOS (mph) LOS (mph) LOS (mph) LOS (mph) LOS (mph) LOS (mph) LOS (mph) LOS (mph) LOS (mph) LOS (mph) LOS (mph) LOS (mph) LOS
AM PEAK HOUR
Bunnell Rd. to Shopping Plaza 0.11 ---- ---- ---- ---- ---- ---- ---- ---- ---- ---- ---- ---- ---- ---- ---- ---- ---- ---- ---- ---- ---- ---- ---- ---- 22.8 B 22.8 B 18.9 C 20.6 B
Shopping Plaza to SR 434 0.12 ---- ---- ---- ---- ---- ---- ---- ---- ---- ---- ---- ---- ---- ---- ---- ---- ---- ---- ---- ---- ---- ---- ---- ---- 4.7 F 7.6 E 7.9 F 11.5 D 5.0 F 7.7 E 4.3 F 6.9 F
SR 434 to Laurel St. 0.26 ---- ---- ---- ---- ---- ---- ---- ---- ---- ---- ---- ---- ---- ---- ---- ---- ---- ---- ---- ---- ---- ---- ---- ---- 22.9 B 22.9 B 27.9 A 27.9 A 28.9 A 28.9 A 22.9 B
Bunnell Rd. to Shopping Plaza 0.11 ---- ---- ---- ---- ---- ---- ---- ---- ---- ---- ---- ---- ---- ---- ---- ---- ---- ---- ---- ---- ---- ---- ---- ---- 11.0 D 19.4 B 12.0 D 20.0 B
Shopping Plaza to SR 434 0.12 ---- ---- ---- ---- ---- ---- ---- ---- ---- ---- ---- ---- ---- ---- ---- ---- ---- ---- ---- ---- ---- ---- ---- ---- 6.2 F 7.8 E 7.5 F 10.6 D 4.9 F 6.9 F 6.0 F 9.0 E
SR 434 to Laurel St. 0.26 ---- ---- ---- ---- ---- ---- ---- ---- ---- ---- ---- ---- ---- ---- ---- ---- ---- ---- ---- ---- ---- ---- ---- ---- 20.5 B 20.5 B 23.3 B 23.3 B 30.0 A 30.0 A 22.0 B
Segments (mile) (mph) LOS (mph) LOS (mph) LOS (mph) LOS (mph) LOS (mph) LOS (mph) LOS (mph) LOS (mph) LOS (mph) LOS (mph) LOS (mph) LOS (mph) LOS (mph) LOS (mph) LOS (mph) LOS (mph) LOS (mph) LOS (mph) LOS (mph) LOS
Laurel St. to SR 434 0.26 ---- ---- ---- ---- ---- ---- ---- ---- ---- ---- ---- ---- ---- ---- ---- ---- ---- ---- ---- ---- ---- ---- ---- ---- 7.0 E 7.0 E 7.1 E 7.1 E 8.7 E 8.7 E 9.2 D 14.8 C
SR 434 to Shopping Plaza 0.12 ---- ---- ---- ---- ---- ---- ---- ---- ---- ---- ---- ---- ---- ---- ---- ---- ---- ---- ---- ---- ---- ---- ---- ---- 14.7 C 26.7 A 19.5 B 18.0 C
Shopping Plaza to Bunnell Rd. 0.11 ---- ---- ---- ---- ---- ---- ---- ---- ---- ---- ---- ---- ---- ---- ---- ---- ---- ---- ---- ---- ---- ---- ---- ---- 20.6 B 17.0 C 25.4 A 26.0 A 22.8 B 20.9 B 34.7 A 23.4 B
Laurel St. to SR 434 0.26 ---- ---- ---- ---- ---- ---- ---- ---- ---- ---- ---- ---- ---- ---- ---- ---- ---- ---- ---- ---- ---- ---- ---- ---- 6.5 F 6.5 F 11.1 D 11.1 D 9.1 D 9.1 D 7.6 E 12.6 D
SR 434 to Shopping Plaza 0.12 ---- ---- ---- ---- ---- ---- ---- ---- ---- ---- ---- ---- ---- ---- ---- ---- ---- ---- ---- ---- ---- ---- ---- ---- 17.1 C 25.7 A 18.9 C 13.6 C
Shopping Plaza to Bunnell Rd. 0.11 ---- ---- ---- ---- ---- ---- ---- ---- ---- ---- ---- ---- ---- ---- ---- ---- ---- ---- ---- ---- ---- ---- ---- ---- 16.1 C 16.6 C 23.6 B 24.6 B 17.4 C 18.2 C 33.0 A 18.9 C
Average 9.1 D 15.0 C 11.9 D 13.9 C
Note: *From the year 2014, additional control point has been added at Orange Ave.
Year 2013
Rdwy Segment Rdwy Section
Average Speed Average Speed
Year 2013
Rdwy Segment Rdwy Section
Average Speed Average SpeedAverage Speed Average Speed Average Speed Average Speed Average Speed Average SpeedAverage Speed Average Speed Average Speed Average Speed Average Speed Average SpeedAverage Speed Average Speed
Year 2006 Year 2007 Year 2008 Year 2009 Year 2010 Year 2014Year 2005
Average Speed Average Speed Average Speed
TABLE C63.1b
Year 2014 Seminole County Travel Time & Delay Study
W. Town Parkway - Westbound Direction Historical Summary
Average Speed Average Speed Average Speed Average Speed Average Speed Average SpeedAverage Speed Average Speed Average Speed Average Speed Average Speed
Year 2014 Seminole County Travel Time & Delay StudyW. Town Parkway - Eastbound Direction Historical Summary
Year 2005 Year 2006
Rdwy Segment
Year 2007 Year 2008 Year 2009 Year 2010 Year 2014Year 2011
Rdwy Segment Rdwy Section
Average Speed Average Speed
Year 2011
Rdwy Segment Rdwy Section
Average Speed Average Speed
Year 2012
Rdwy Segment Rdwy Section
Average Speed Average Speed
Year 2012
Rdwy Segment Rdwy Section
Average Speed Average Speed
D-70 W Town Parkway
Roadway Distance
Segments (mile) (mph) LOS (mph) LOS (mph) LOS (mph) LOS (mph) LOS (mph) LOS (mph) LOS (mph) LOS (mph) LOS (mph) LOS (mph) LOS (mph) LOS (mph) LOS (mph) LOS (mph) LOS (mph) LOS (mph) LOS (mph) LOS (mph) LOS (mph) LOS
AM PEAK HOUR
Red Bug Lake Rd. to Wilshire Dr. 0.35 ---- ---- ---- ---- ---- ---- ---- ---- ---- ---- ---- ---- ---- ---- ---- ---- ---- ---- ---- ---- ---- ---- ---- ---- 19.6 B 21.9 B 21.2 B 22.8 B
Wilshire Dr. to Queens Mirror Cir. 0.71 ---- ---- ---- ---- ---- ---- ---- ---- ---- ---- ---- ---- ---- ---- ---- ---- ---- ---- ---- ---- ---- ---- ---- ---- 28.4 A 29.6 A 29.6 A 29.4 A
Queens Mirror Cir. to Crystal Bowl Cir. 0.28 ---- ---- ---- ---- ---- ---- ---- ---- ---- ---- ---- ---- ---- ---- ---- ---- ---- ---- ---- ---- ---- ---- ---- ---- 14.0 C 15.1 C 9.3 D 10.2 D
Crystal Bowl Cir. to Seminola Blvd. 0.77 ---- ---- ---- ---- ---- ---- ---- ---- ---- ---- ---- ---- ---- ---- ---- ---- ---- ---- ---- ---- ---- ---- ---- ---- 19.7 B 20.7 B 19.1 B 21.3 B 18.9 C 19.0 C 17.2 C 18.9 C
Seminola Blvd. to SR 434 1.68 ---- ---- ---- ---- ---- ---- ---- ---- ---- ---- ---- ---- ---- ---- ---- ---- ---- ---- ---- ---- ---- ---- ---- ---- 22.5 B 22.5 B 23.7 B 23.7 B 21.5 B 21.5 B
Average 21.5 B 21.3 B 20.8 B 19.9 B
PM PEAK HOUR
Red Bug Lake Rd. to Wilshire Dr. 0.35 ---- ---- ---- ---- ---- ---- ---- ---- ---- ---- ---- ---- ---- ---- ---- ---- ---- ---- ---- ---- ---- ---- ---- ---- 23.6 B 23.1 B 22.3 B 22.1 B
Wilshire Dr. to Queens Mirror Cir. 0.71 ---- ---- ---- ---- ---- ---- ---- ---- ---- ---- ---- ---- ---- ---- ---- ---- ---- ---- ---- ---- ---- ---- ---- ---- 22.4 B 30.2 A 22.4 B 27.8 A
Queens Mirror Cir. to Crystal Bowl Cir. 0.28 ---- ---- ---- ---- ---- ---- ---- ---- ---- ---- ---- ---- ---- ---- ---- ---- ---- ---- ---- ---- ---- ---- ---- ---- 17.7 C 18.5 C 15.8 C 17.3 C
Crystal Bowl Cir. to Seminola Blvd. 0.77 ---- ---- ---- ---- ---- ---- ---- ---- ---- ---- ---- ---- ---- ---- ---- ---- ---- ---- ---- ---- ---- ---- ---- ---- 22.8 B 21.9 B 17.8 C 21.8 B 18.9 C 20.0 B 20.2 B 22.1 B
Seminola Blvd. to SR 434 1.68 ---- ---- ---- ---- ---- ---- ---- ---- ---- ---- ---- ---- ---- ---- ---- ---- ---- ---- ---- ---- ---- ---- ---- ---- 21.4 B 21.4 B 24.1 B 24.1 B 20.0 B 20.0 B
Average 21.7 B 21.8 B 21.6 B 21.1 B
Roadway Distance
Segments (mile) (mph) LOS (mph) LOS (mph) LOS (mph) LOS (mph) LOS (mph) LOS (mph) LOS (mph) LOS (mph) LOS (mph) LOS (mph) LOS (mph) LOS (mph) LOS (mph) LOS (mph) LOS (mph) LOS (mph) LOS (mph) LOS (mph) LOS (mph) LOS
AM PEAK HOUR
SR 434 to Seminola Blvd. 1.68 ---- ---- ---- ---- ---- ---- ---- ---- ---- ---- ---- ---- ---- ---- ---- ---- ---- ---- ---- ---- ---- ---- ---- ---- 19.5 B 19.5 B 20.0 B 20.0 B 17.3 C 17.3 C
Red Bug Lake Rd. to Wilshire Dr. 0.35 ---- ---- ---- ---- ---- ---- ---- ---- ---- ---- ---- ---- ---- ---- ---- ---- ---- ---- ---- ---- ---- ---- ---- ---- 25.7 A 28.0 A 24.8 B 26.2 A
Wilshire Dr. to Queens Mirror Cir. 0.71 ---- ---- ---- ---- ---- ---- ---- ---- ---- ---- ---- ---- ---- ---- ---- ---- ---- ---- ---- ---- ---- ---- ---- ---- 18.9 C 16.2 C 17.9 C 15.7 C
Queens Mirror Cir. to Crystal Bowl Cir. 0.28 ---- ---- ---- ---- ---- ---- ---- ---- ---- ---- ---- ---- ---- ---- ---- ---- ---- ---- ---- ---- ---- ---- ---- ---- 26.1 A 25.7 A 26.8 A 27.0 A
Crystal Bowl Cir. to Seminola Blvd. 0.77 ---- ---- ---- ---- ---- ---- ---- ---- ---- ---- ---- ---- ---- ---- ---- ---- ---- ---- ---- ---- ---- ---- ---- ---- 8.2 E 18.4 C 8.7 E 18.7 C 6.8 E 16.9 C 13.6 C 21.3 B
Average 18.9 C 18.7 C 18.2 C 19.3 B
PM PEAK HOUR
SR 434 to Seminola Blvd. 1.68 ---- ---- ---- ---- ---- ---- ---- ---- ---- ---- ---- ---- ---- ---- ---- ---- ---- ---- ---- ---- ---- ---- ---- ---- 20.4 B 20.4 B 19.1 B 19.1 B 19.8 B 19.8 B
Red Bug Lake Rd. to Wilshire Dr. 0.35 ---- ---- ---- ---- ---- ---- ---- ---- ---- ---- ---- ---- ---- ---- ---- ---- ---- ---- ---- ---- ---- ---- ---- ---- 27.8 A 28.5 A 29.6 A 28.0 A
Wilshire Dr. to Queens Mirror Cir. 0.71 ---- ---- ---- ---- ---- ---- ---- ---- ---- ---- ---- ---- ---- ---- ---- ---- ---- ---- ---- ---- ---- ---- ---- ---- 27.5 A 21.8 B 26.2 A 24.3 B
Queens Mirror Cir. to Crystal Bowl Cir. 0.28 ---- ---- ---- ---- ---- ---- ---- ---- ---- ---- ---- ---- ---- ---- ---- ---- ---- ---- ---- ---- ---- ---- ---- ---- 26.6 A 25.2 A 25.7 A 28.2 A
Crystal Bowl Cir. to Seminola Blvd. 0.77 ---- ---- ---- ---- ---- ---- ---- ---- ---- ---- ---- ---- ---- ---- ---- ---- ---- ---- ---- ---- ---- ---- ---- ---- 6.9 E 18.3 C 7.4 E 18.3 C 7.4 E 19.0 C 10.6 D 21.7 B
Average 19.2 B 18.3 C 19.0 B 20.8 B
Rdwy Segment Rdwy Section
Average Speed Average Speed
Year 2013
Rdwy Segment Rdwy Section
Average Speed Average SpeedAverage Speed Average Speed Average Speed Average Speed Average Speed Average SpeedAverage Speed Average Speed Average Speed Average Speed Average Speed Average Speed Average SpeedAverage SpeedAverage Speed Average Speed
Segments (mile) (mph) LOS (mph) LOS (mph) LOS (mph) LOS (mph) LOS (mph) LOS (mph) LOS (mph) LOS (mph) LOS (mph) LOS (mph) LOS (mph) LOS (mph) LOS (mph) LOS (mph) LOS (mph) LOS (mph) LOS (mph) LOS (mph) LOS (mph) LOS
AM PEAK HOUR
Spartan Dr. to Birchwood Dr. 0.12 ---- ---- ---- ---- ---- ---- ---- ---- ---- ---- ---- ---- ---- ---- ---- ---- ---- ---- ---- ---- ---- ---- ---- ---- ---- ---- ---- ---- ---- ---- ---- ---- 18.5 C 18.5 C 18.0 C 18.0 C
Kewannee Tr. to SR 436 0.84 ---- ---- ---- ---- ---- ---- ---- ---- ---- ---- ---- ---- ---- ---- ---- ---- ---- ---- ---- ---- ---- ---- ---- ---- ---- ---- ---- ---- ---- ---- ---- ---- 15.5 C 19.0 C 20.0 B 19.4 B
Average 19.0 C 19.4 B
Roadway Distance
Segments (mile) (mph) LOS (mph) LOS (mph) LOS (mph) LOS (mph) LOS (mph) LOS (mph) LOS (mph) LOS (mph) LOS (mph) LOS (mph) LOS (mph) LOS (mph) LOS (mph) LOS (mph) LOS (mph) LOS (mph) LOS (mph) LOS (mph) LOS (mph) LOS
AM PEAK HOUR
SR 436 to Kewanee Tr. 0.84 ---- ---- ---- ---- ---- ---- ---- ---- ---- ---- ---- ---- ---- ---- ---- ---- ---- ---- ---- ---- ---- ---- ---- ---- ---- ---- ---- ---- ---- ---- ---- ---- 23.8 B 21.4 B
Year 2014 Seminole County Travel Time & Delay Study
Derbyshire Road - Westbound Direction Historical Summary
Average Speed Average Speed Average Speed Average Speed Average Speed Average SpeedAverage Speed Average Speed Average Speed Average Speed Average Speed Average SpeedAverage Speed Average Speed Average Speed Average Speed Average Speed Average Speed Average Speed
Year 2012 Year 2014Year 2006 Year 2007 Year 2008 Year 2009 Year 2010 Year 2011Year 2005 Year 2013
Average Speed Average SpeedAverage Speed Average Speed Average Speed Average Speed Average Speed Average SpeedAverage Speed Average Speed Average Speed Average Speed Average Speed Average Speed
D-72 Derbyshire Road
APPENDIX E
Summary of Concurrency Database Showing Roadway
Sections Operating at LOS E and LOS F
Year 2014 Concurrency Database : Roadway Sections Operating at LOS E and LOS F
SegmentID SegmentKey Roadway FromRoadway ToRoadway LOS_EB_NB_AM_14 LOS_EB_NB_PM_14 LOS_WB_SB_AM_14 LOS_WB_SB_PM_142934 PSP90 PALM SPRINGS DR E CENTRAL PKWY E ALTAMONTE DR (SR 436) C C E E2935 RBL05 RED BUG LAKE RD SR 436 EAGLE CIR A A E E2945 RNH40 RINEHART RD ANDERSON LN W LAKE MARY BLVD B A D E2950 S2605 ALOMA AVE OLD HOWELL BRANCH RD HOWELL BRANCH RD D E A A2958 S2690 W BROADWAY ST N LAKE JESSUP AVE N CENTRAL AVE (SR 434) F F D C2961 S3410 N SR 434 WEST TOWN PKWY W SR 436 D E C C2964 S3425 W SR 434 WEKIVA SPRINGS RD / MONTGOMERY RD DOUGLAS AVE E C B B2965 S3430 W SR 434 DOUGLAS AVE I‐4 EAST RAMP E D C C2966 S3435 W SR 434 I‐4 EAST RAMP RAYMOND AVE B D F F2967 S3440 W SR 434 RAYMOND AVE PALM SPRINGS DR C D C F2976 S3485 S CENTRAL AVE BROADWAY ST (W SR 426 / CR 416) MITCHELL HAMMOCK RD E E D E2980 S3610 E SR 436 S HUNT CLUB BLVD BEAR LAKE RD A A B F2983 S3625 W SR 436 MONTGOMERY RD DOUGLAS AVE / WYMORE RD E E A B2984 S3630 E ALTAMONTE DR DOUGLAS AVE / WYMORE RD I‐4 EAST RAMP B F B D2985 S3635 E ALTAMONTE DR I‐4 EAST RAMP NORTHLAKE BLVD C E F F2986 S3640 E ALTAMONTE DR NORTHLAKE BLVD PALM SPRINGS DR D E D F2987 S3645 E ALTAMONTE DR PALM SPRINGS DR MAITLAND AVE C B E B2990 S3670 SR 436 S US HWY 17‐92 RED BUG LAKE RD C E D C2991 S3680 SR 436 RED BUG LAKE RD LAKE HOWELL RD C D E F2992 S3690 SR 436 LAKE HOWELL RD HOWELL BRANCH RD E F A D2993 S3695 SR 436 HOWELL BRANCH RD ORANGE COUNTY LINE B B E D3001 S4660 E 25TH ST US HWY 17‐92 (S FRENCH AVE) SANFORD AVE (CR 425) E E C E3004 S4675 E SR 46 BEARDALL AVE SR 415 E B A A3019 U1705 S US HWY 17‐92 LAKE OF THE WOODS BLVD E ALTAMONTE DR (SR 436) E F C B3020 U1710 S US HWY 17‐92 E ALTAMONTE DR (SR 436) TRIPLET LAKE DR B B E D3033 U1795 NW US HWY 17‐92 MONROE RD (CR 15) VOLUSIA CO LINE A A F F3041 WYM50 WYMORE RD S WESTMONTE DR W SR 436 F F A A3043 NOR60 NORTH ST RAILROAD TRACK S RONALD REAGAN BLVD (CR 427) E D B B3044 SLK20 SAND LAKE RD W LAKE BRANTLEY RD N SR 434 E D B C3045 DUG05 COMMERCE PARK DR W SR 434 MARKHAM WOODS RD F F C C3046 MRW95 DOUGLAS AVE W SR 434 OLD DOUGLAS AVE F F C C3052 LKW50 LOCKWOOD BLVD E MITCHELL HAMMOCK RD CR 419 F F D F3056 OXD50 OXFORD RD FERNWOOD BLVD SR 436 D E B C3057 SLV10 SLAVIA RD RED BUG LAKE RD W SR 426 E D E C2807 C1500 MONROE RD NW US HWY 17‐92 ORANGE BLVD (CR 431) C C C F2828 C2720 S RONALD REAGAN BLVD NORTH ST DOG TRACK RD C F E D2829 C2730 S RONALD REAGAN BLVD DOG TRACK RD SR 434 D F B A2833 C2770 N RONALD REAGAN BLVD S COUNTRY CLUB RD (CR 15) N US HWY 17‐92 E C B A2834 C2780 N RONALD REAGAN BLVD N US HWY 17‐92 E COUNTY HOME RD A A D E2836 C3110 ORANGE BLVD CR 46A MARKHAM RD A A F B2850 C4650 CR 46A RINEHART RD I‐4 F D B B2851 C4660 CR 46A I‐4 INTERNATIONAL PKWY F E F F2852 C4670 CR 46A INTERNATIONAL PKWY ORANGE BLVD (CR 431) F F D D2854 CHP50 W CHAPMAN RD WESTMINSTER TER ALAFAYA TRL (SR 434) E D B A2858 DEN00 DEAN RD W SR 426 W MCCULLOCH RD (ORANGE CO LINE) C E B B2865 DOG10 DOG TRACK RD S RONALD REAGAN BLVD (CR 427) S US HWY 17‐92 D E B A2868 DUG90 DOUGLAS AVE W CENTRAL PKWY W SR 436 D D E D2870 EDN10 EDEN PARK AVE BUNNELL RD MAITLAND BLVD (SR 414) (ORANGE CO LINE) A B D E2879 HBR00 HOWELL BRANCH RD ORANGE CO LINE LAKE HOWELL RD D F A A2894 LKE05 LAKE EMMA RD W LAKE MARY BLVD LAKE MARY CENTRE (FLAGG LN) F F C A2895 LKE20 LAKE EMMA RD LAKE MARY CENTRE (FLAGG LN) GREENWOOD BLVD D E B D
Year 2014 Concurrency Database : Roadway Sections Operating at LOS E and LOS F
SegmentID SegmentKey Roadway FromRoadway ToRoadway LOS_EB_NB_AM_14 LOS_EB_NB_PM_14 LOS_WB_SB_AM_14 LOS_WB_SB_PM_142899 LKH10 LAKE HOWELL RD SR 436 TUSCARORA TRL B E B B2900 LKH50 LAKE HOWELL RD TUSCARORA TRL HOWELL BRANCH RD D E D D2903 LKM10 W LAKE MARY BLVD I‐4 LAKE EMMA RD F F C A2904 LKM15 W LAKE MARY BLVD LAKE EMMA RD RINEHART RD D E D D2907 LKM40 W LAKE MARY BLVD N COUNTRY CLUB RD (CR 15) SIR LAWRENCE DR A A D E2909 LKM60 W LAKE MARY BLVD HIDDEN LAKE DR N US HWY 17‐92 F E A C2911 LKM75 E LAKE MARY BLVD SR 417 S SANFORD AVE (CR 425) D D D E
APPENDIX F
Data Collection Equipment Specifications
QStarz Travel Recorder X Data Collection Equipment (Source: Qstarz International Co., Ltd.)
- Adopt MTK chipset with high sensitivity -158dBm and 51-Channel tracking - Lower power consumption up to 32hrs for travel recording - Stand-Alone travel recorder to log over 100,000 records - Easily switch Travel Recorder to LOG mode or NAV mode (Navigation + Log) - Provide Qstarz setup tool with friendly UI to download data from Travel Recorder - Support Multi-mode setting to record data Vehicle, Bicycle, Jog) - Support button push manually to memorize your location immediately - Draw your navigation path immediately on Google Earth as default - Active NMEA protocol VTG / GLL manually via Qstarz setup tool. - Backup your travel record as CSV / NMEA / Google Earth file format. - Fast Position Fix ,Cold start 36s, Warm start 33s,Hot start 1s - WAAS+EGNOS support - Auto On-Off function for smart power control - Personal/Portable Navigation (PDA, Smartphone, PC, etc.)
General Accuracy (none DGPS)
GPS Chip MTK GPS Module Position
Frequency L1, 1575.42MHz Without aid: 3.0m 2D-RMS<3m CEP(50%) without SA(horizontal)DGPS (WAAS, EGNOS, MSAS): 2.5m