IMF staff regularly produces papers covering multilateral issues and cross-country analyses. The following document has been released and is included in this package: The Staff Report on the 2014 Spillover Report, prepared by IMF staff and completed on
June 25, 2014 for the Executive Board’s consideration on July 7, 2014.
The Executive Board met in an informal session, and no decisions were taken at this meeting.
The publication policy for staff reports and other documents allows for the deletion of market-sensitive information.
Copies of this report are available to the public from
International Monetary Fund Publication Services PO Box 92780 Washington, D.C. 20090
EXECUTIVE SUMMARY Global spillovers have entered a new phase. With crisis-related spillovers and risks fading, changing growth patterns are the main source of spillovers in the global economy at this juncture. Two key trends are highly relevant here. First, signs of self-sustaining recovery in some advanced economies indicate that the unwinding of exceptional monetary accommodation will proceed and lead to a tightening of global financial conditions in the coming years. An uneven recovery, though, suggests normalization will proceed at different times in different countries, with possible spillover implications. Second, growth in emerging markets is slowing on a broad basis since its precrisis peak and can carry noticeable spillover effects at the global level.
Recovery and normalization of monetary policies in key advanced economies will have global spillovers. Led by the United States and the United Kingdom, higher benchmark interest rates will imply higher interest rates globally. The nature of spillovers related to prospective unwinding, however, will depend on the main underlying drivers of higher yields—for example, stronger growth versus unexpected monetary tightening. Policy and communication challenges stemming from normalization are more complex now than in past tightening cycles, given an unconventional starting point with policy rates near zero and large central bank balance sheets. Effects on spillover-recipient countries will depend on the extent of their vulnerabilities as well as on the smoothness of the normalization process. As accommodation is removed, spillover implications for financial sector reform will also become more apparent going forward.
Slower growth in emerging markets can have sizable spillovers on the rest of the world through diverse channels. A gradual, synchronized, and protracted slowdown will likely weigh on global growth through trade as well as finance. With rising cross-border bank claims on emerging markets, a protracted slowdown could also lead to noticeable capital losses for banks in advanced economies exposed to these borrowers. In commodity markets, slower growth could translate into lower commodity prices, which would play a stabilizing role at the global level, but have far-reaching distributional consequences on advanced, emerging and developing economies through changing terms of trade. Given stronger regional integration—including through foreign direct investment and remittances, a slowdown can be a significant source of local spillovers on neighbors through added channels.
Key spillover risks can intersect and interact with each other. With regard to monetary spillovers, much will depend on how well the normalization process can be managed in major advanced economies and on policy frameworks in recipient economies. Likewise, spillovers from emerging market economies will depend on the depth and nature of their slowdowns. The two risks can be interrelated because markets may reassess growth prospects in emerging markets amid renewed bouts of financial turbulence and capital outflows. A downside scenario of sharply tighter financial conditions alongside a further weakening of emerging market growth would be damaging for the global economy—lowering output by about 2 percent.
Spillover risks warrant stronger policy action at both the national and global levels. Stronger actions at the national level in both source and recipient countries of spillovers would align with better outcomes at the global level. With incentive problems and tradeoffs, however, stronger national actions alone may not be sufficient to address spillover consequences, and collaboration takes on renewed importance in mitigating or insuring against potential downside risks and providing support for more vulnerable economies, if certain key risks were to materialize.
June 25, 2014
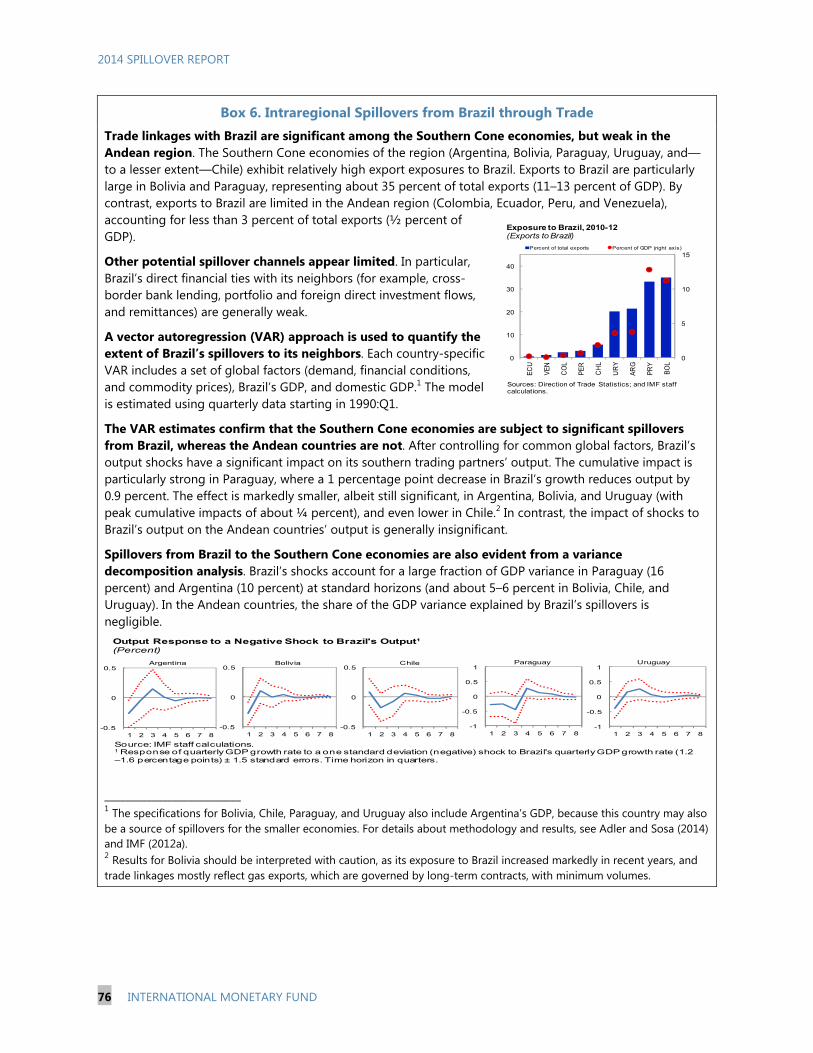
2014 SPILLOVER REPORT
2 INTERNATIONAL MONETARY FUND
Approved By Hamid Faruqee
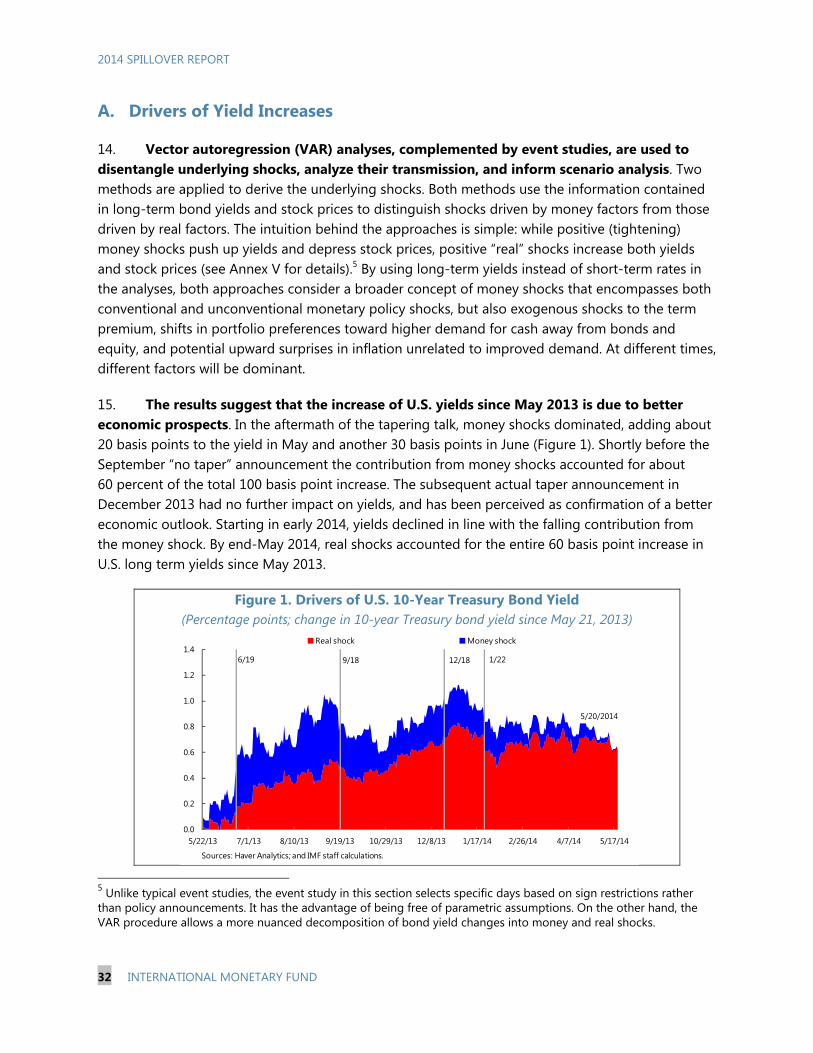
Prepared by an interdepartmental taskforce comprising as principals: Hamid Faruqee, Ayhan Kose (Co-Chair) and Emil Stavrev (all RES), James Morsink and Ratna Sahay (MCM), Vikram Haksar and Papa N’Diaye (SPR), Steven Barnett, Stephan Danninger, and Isabelle Mateos y Lago (all APD), Petya Koeva Brooks and Krishna Srinivasan (EUR), Julio Escolano (FAD), Roberto Cardarelli and Nigel Chalk (WHD), and coordinated by Hamid Faruqee (Taskforce Chair). Analysis was provided by the interdepartmental spillover teams as follows: Overview chapter led by Hamid Faruqee, Ayhan Kose, and Emil Stavrev, including Rabah Arezki, Ben Hunt, Mika Kortelainen, Akito Matsumoto, Dirk Muir, Susanna Mursula, and Juan Francisco Yepez Albornoz (all RES), Plamen Kostadinov Iossifov (EUR), Nicolas Blancher, Allison Holland and Ceyla Pazarbasioglu (MCM), Francis Vitek and Kevin Wiseman (SPR); Emerging market chapter led by Rabah Arezki and Sweta Saxena, including Eugenio Cerutti, Ben Hunt, Dirk Muir, Carolina Osorio Buitron, Marina Vladimirovna Rousset, Inyoung Song, and Hongyan Zhao (all RES), Srobona Mitra (MCM), Waikei Raphael Lam and Wojciech Maliszewski (APD), Luis Cubeddu, Alexander Culiuc, Ceyda Oner, Marijn Willem Otte, Michele Ruta, Silvia Sgherri, and Evridiki Tsounta (all SPR), Valerie Cerra, Herman Kamil, Pablo Hernan Morra, Sebastian Sosa, and Fabian Valencia (all WHD), Alberto Behar, Padamja Khandelwal, Malika Pant (MCD), Jesus Gonzalez-Garcia and Juan Trevino (AFR); Monetary policy chapter led by Esteban Vesperoni and Sebastian Weber, including Chanpheng Fizzarotti, Ava Yeabin Hong, Ben Hunt, Mika Kortelainen, Dirk Muir, and Susanna Mursula (all RES), Jorge Canales Kriljenko (AFR), Joong Shik Kang (APD), Ali Jawad Al-Eyd, Pelin Berkmen, Jiaqian Chen, Alasdair Scott, and Tao Wu (all EUR), Christina Kolerus and Constant Aime Lonkeng Ngouana (FAD), Padamja Khandelwal, Pedro Rodriguez, and Natalia Tamirisa (all MCD), Tommaso Mancini Griffoli and Prachi Mishra (MCM), Papa N’Diaye, Silvia Sgherri, and Francis Vitek (all SPR), Troy Matheson, Andre Meier, and Jarkko Turunen (all WHD).
CONTENTS
EXECUTIVE SUMMARY ___________________________________________________________________________ 1 GLOSSARY _________________________________________________________________________________________ 6 CHAPTER 1. CHANGING TIDES AND GLOBAL SPILLOVERS ____________________________________ 7 A. Global Baseline and Spillovers __________________________________________________________________ 7 B. Global Spillover Risks ____________________________________________________________________________ 9 C. Spillovers from Advanced Economies _________________________________________________________ 10 D. Spillovers from Emerging Market Economies _________________________________________________ 16 E. Downside Scenario ____________________________________________________________________________ 20
2014 SPILLOVER REPORT
INTERNATIONAL MONETARY FUND 3
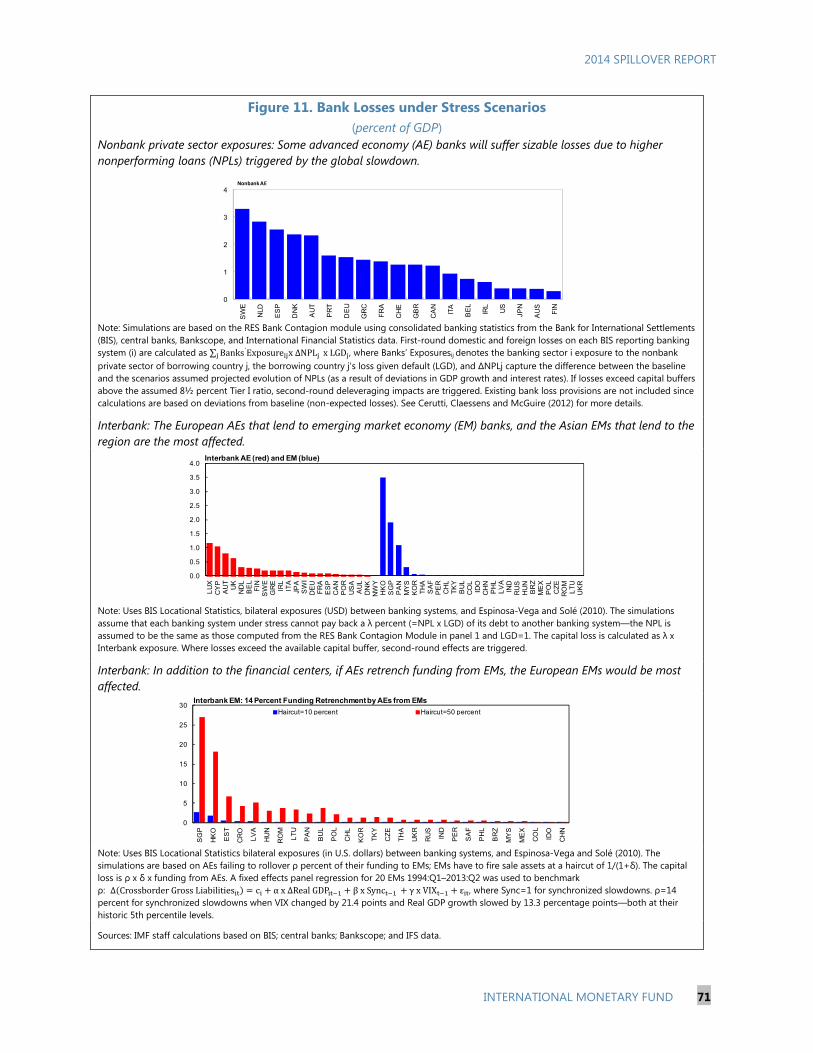
F. Policies and Collaboration _____________________________________________________________________ 23 BOXES 1. Risks and Spillovers from Low Inflation in Japan and the Euro Area ___________________________ 12 2. Spillovers from Financial Regulatory Reforms in Major Advanced Economies ________________ 14 3. Spillovers from Geopolitical Tensions in Russia and Ukraine __________________________________ 18 4. What Goes Around Comes Around: Spillbacks from Emerging to Advanced Economies ______ 26 FIGURES 1. Changing Growth Dynamics and Tightening Financial Conditions ______________________________ 8 2. Global Downside Scenario _____________________________________________________________________ 21 3. Simulated Output Effect in 2015 _______________________________________________________________ 23
CHAPTER 2. SPILLOVERS FROM UNWINDING MONETARY SUPPORT IN ADVANCED ECONOMIES _____________________________________________________________________________________ 27 INTRODUCTION ________________________________________________________________________________ 27 RECENT DEVELOPMENTS AND STYLIZED FACTS _____________________________________________ 28 A. The Taper Episode: Lessons Going Forward ___________________________________________________ 28 B. Spillovers ______________________________________________________________________________________ 30 SHOCKS, TRANSMISSION CHANNELS, AND SPILLOVERS ____________________________________ 31 A. Drivers of Yield Increases ______________________________________________________________________ 32 B. Spillover from Yield Increases _________________________________________________________________ 33 C. The Role of Local Transmitters ________________________________________________________________ 36 SCENARIO ANALYSIS AND POLICY IMPLICATIONS __________________________________________ 40 A. Scenario Analysis ______________________________________________________________________________ 40 B. Main Policy Findings___________________________________________________________________________ 52 C. Concluding Remarks __________________________________________________________________________ 54 BOXES 1. The Effect of Global Financial Conditions on Sub-Saharan Africa Frontier Markets ___________ 39 2. Monetary Normalization Scenarios: G40 Model Simulation Results ___________________________ 43 3. Normalization of Monetary Policy in the United States _______________________________________ 45 4. Public Debt Dynamics and Fiscal Stress in Emerging Market Economies ______________________ 50 5. Spillovers from Portfolio Rebalancing in Japan ________________________________________________ 52
FIGURES 1. Drivers of U.S. 10-year Treasury Bond Yield ___________________________________________________ 32
2014 SPILLOVER REPORT
4 INTERNATIONAL MONETARY FUND
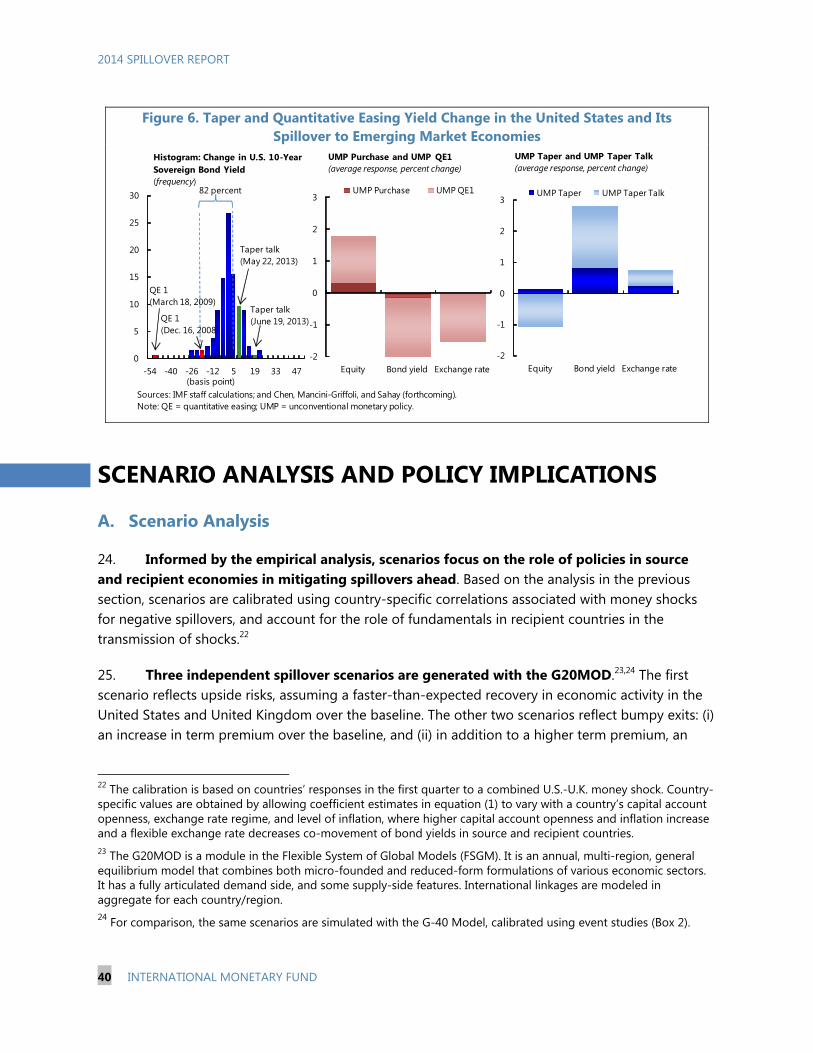
2. Drivers of S4 10-year Bond Yields _____________________________________________________________ 33 3. Spillovers to Emerging Market Economies from S4 Shocks ___________________________________ 35 4. Effect of Fundamentals on Emerging Market Bond Yields, Two-day Change __________________ 37 5. Average Response of Emerging Market Economies to S4 Money Shocks _____________________ 38 6. Taper and Quantitative Easing Yield Change in the United States and Its Spillover to Emerging Markets __________________________________________________________________________________________ 40 7. Scenario 1: Faster US and UK Recovery ________________________________________________________ 46 8. Scenario 2: Term Premium Shock and Misperceptions ________________________________________ 47 9. Restricted Policy Response ____________________________________________________________________ 49 10. Financial Stress in Emerging Market Economies over Tightening Cycles _____________________ 51
CHAPTER 3. SPILLOVERS FROM A POTENTIAL REVERSAL OF FORTUNE IN EMERGING MARKET ECONOMIES __________________________________________________________________________ 55 INTRODUCTION ________________________________________________________________________________ 55 PROPERTIES OF THE SLOWDOWN _____________________________________________________________ 57 GROWTH SPILLOVERS: ESTIMATES OF OVERALL IMPACT ___________________________________ 60 CHANNELS OF SPILLOVERS ____________________________________________________________________ 61 A. Spillovers through Trade ______________________________________________________________________ 61 B. Spillovers through Commodity Prices _________________________________________________________ 61 C. Spillovers through the Global Financial System _______________________________________________ 67 SPILLOVERS THROUGH “NEIGHBORHOOD” EFFECTS ________________________________________ 73 RISKS AND POLICIES ___________________________________________________________________________ 79 A. Scenario Analysis ______________________________________________________________________________ 79 B. Risks and Policy _______________________________________________________________________________ 80 BOXES 1. Fiscal Implications of Oil Price Declines for Middle East Oil Exporters _________________________ 64 2. Estimating Effects of a Slowdown in Emerging Market Economies on Sub-Saharan Africa ____ 65 3. Hedging the Impact of Oil Prices on Public Finances: The Case of Mexico ____________________ 66 4. Saudi Arabia’s Role in Stabilizing the Global Oil Market _______________________________________ 68 5. Intraregional Spillovers from China ____________________________________________________________ 75 6. Intraregional Spillovers from Brazil through Trade ____________________________________________ 76 7. Potential Spillovers from Venezuela’s Regional Cooperation Agreements ____________________ 77 8. Potential Spillovers from Remittances from the Cooperation Council for the Arab States of the Gulf (GCC) and Russia ____________________________________________________________________________ 78
2014 SPILLOVER REPORT
INTERNATIONAL MONETARY FUND 5
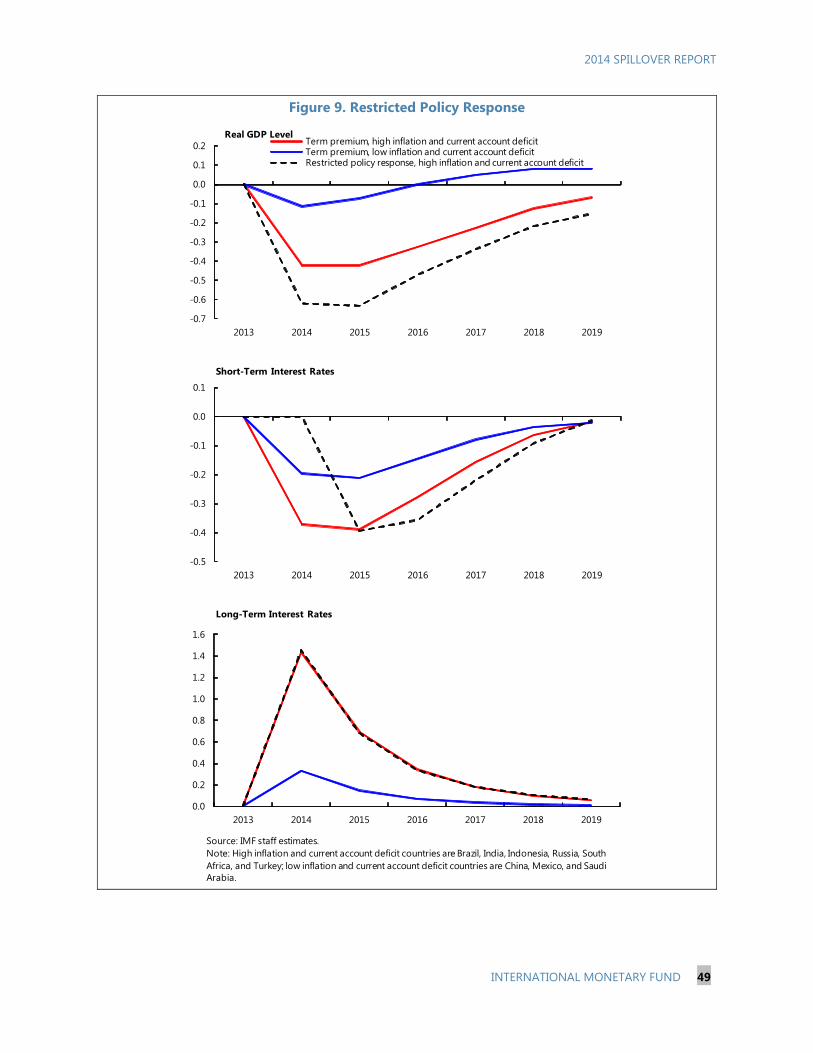
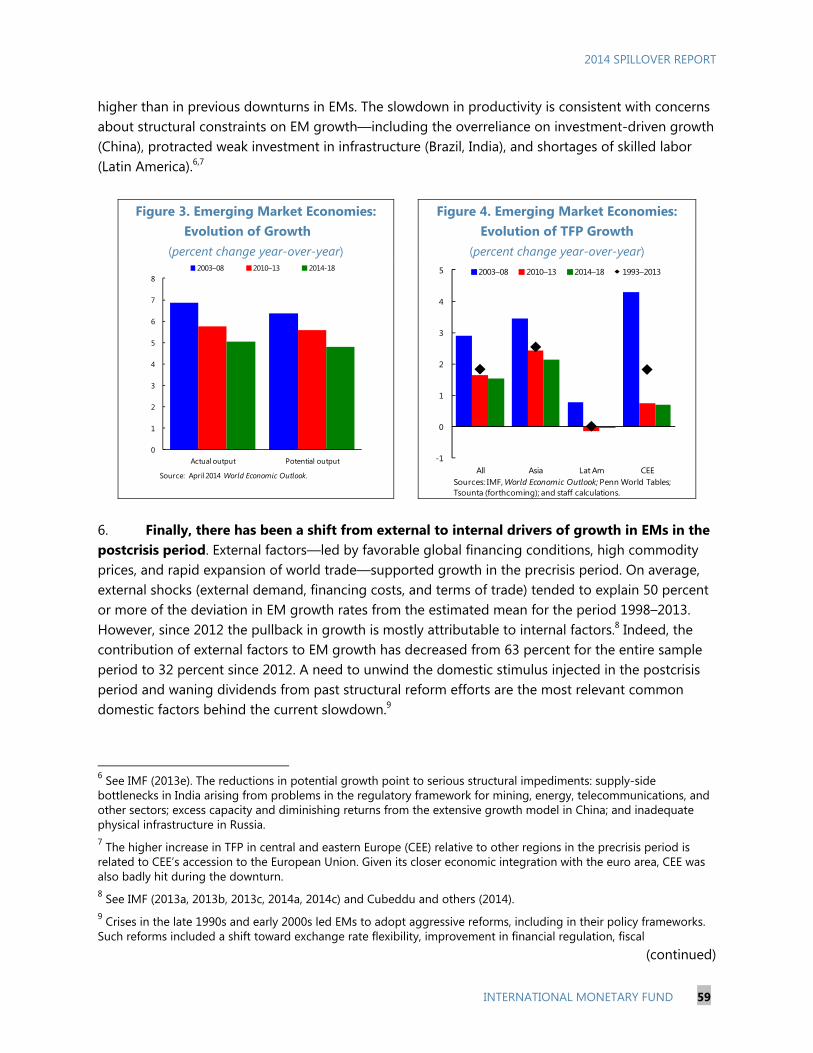
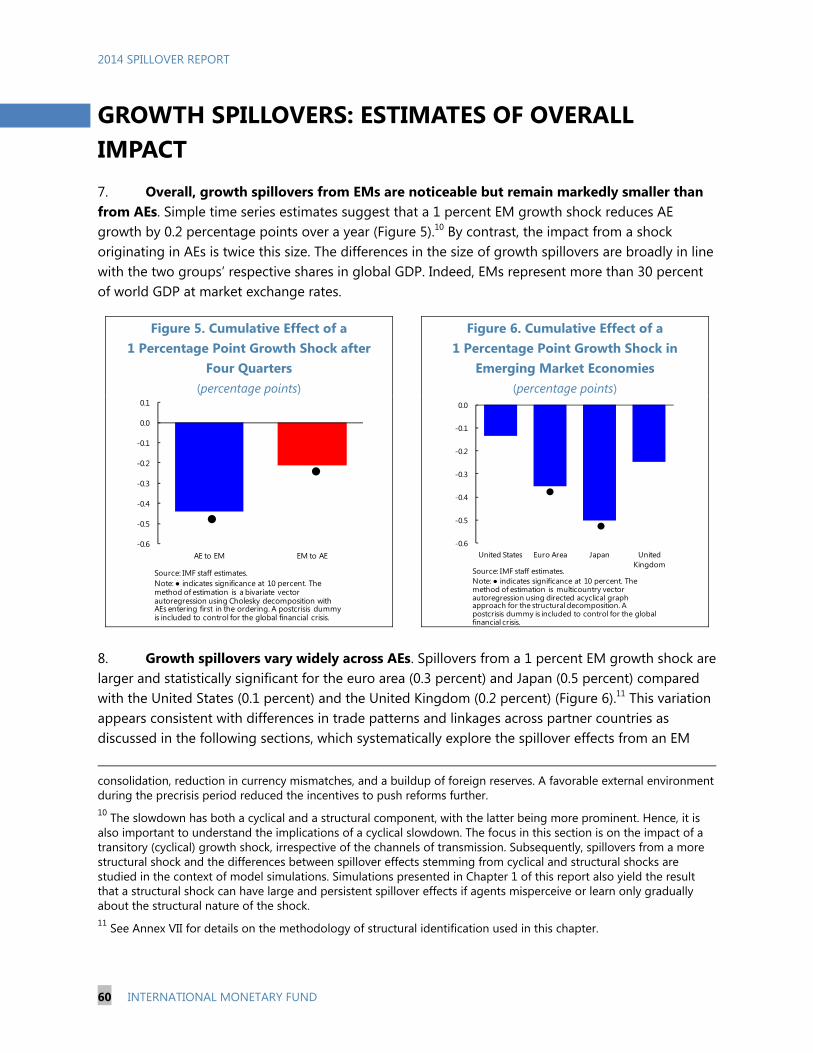
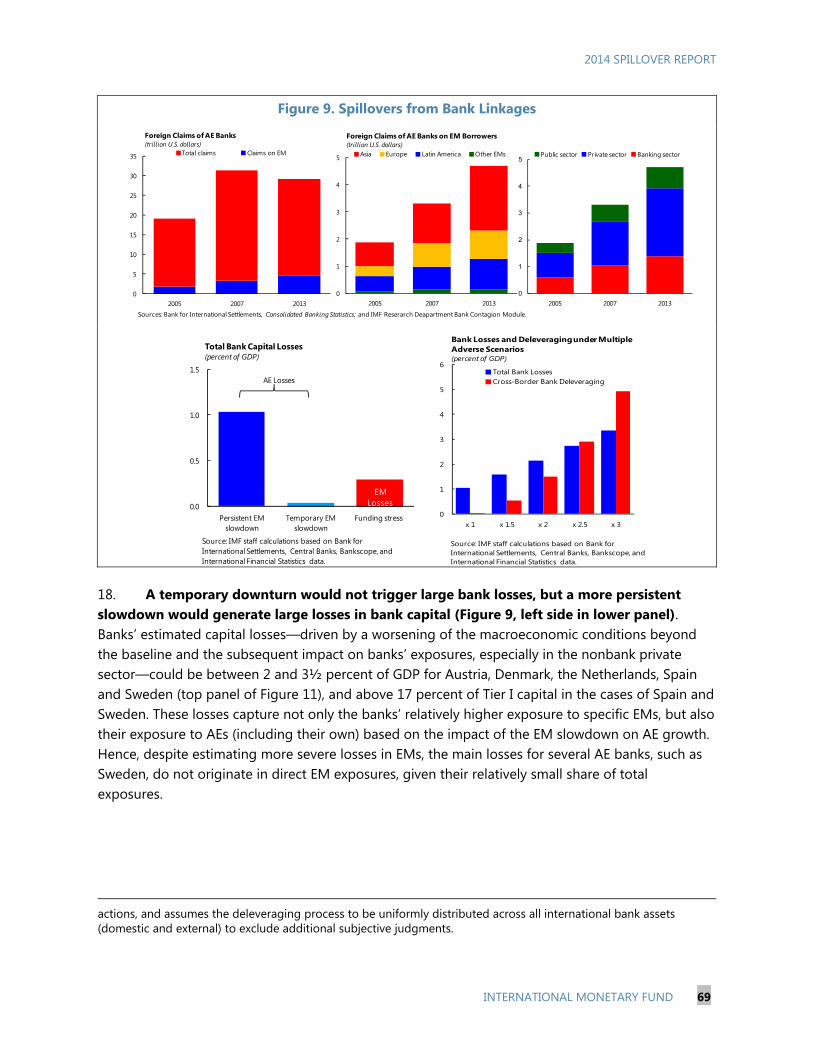
FIGURES 1. Emerging Market Economies: Growing Role in the World Economy __________________________ 56 2. Properties of the Slowdown in Emerging Market Economies __________________________________ 58 3. Emerging Market Economies: Evolution of Growth ____________________________________________ 59 4. Emerging Market Economies: Evolution of TFP Growth _______________________________________ 59 5. Cumulative Effect of a 1 Percentage-Point Growth Shock after Four Quarters ________________ 60 6. Cumulative Effect of a 1 Percentage-Point Growth Shock in Emerging Market Economies ___ 60 7. Spillovers through Trade and Commodity Prices ______________________________________________ 62 8. Change in Trade Balance ______________________________________________________________________ 63 9. Spillovers from Bank Linkages _________________________________________________________________ 69 10. Spillovers through the Banking Channel: The Mechanics ____________________________________ 70 11. Bank Losses under Stress Scenarios __________________________________________________________ 71 12. AEs: 2012 FDI and Portfolio Equity Position in EMs __________________________________________ 73 13. AEs: 2012 Portfolio Debt Position in EMs ____________________________________________________ 73 14. Stock Market Index Performance _____________________________________________________________ 73 15. EMs Intraregional Trade ______________________________________________________________________ 74 16. External Financing from Venezuela ___________________________________________________________ 74 17. Remittances from BRIS, by Destination_______________________________________________________ 74 18. Emerging Market Economies Spillover Scenarios ____________________________________________ 80
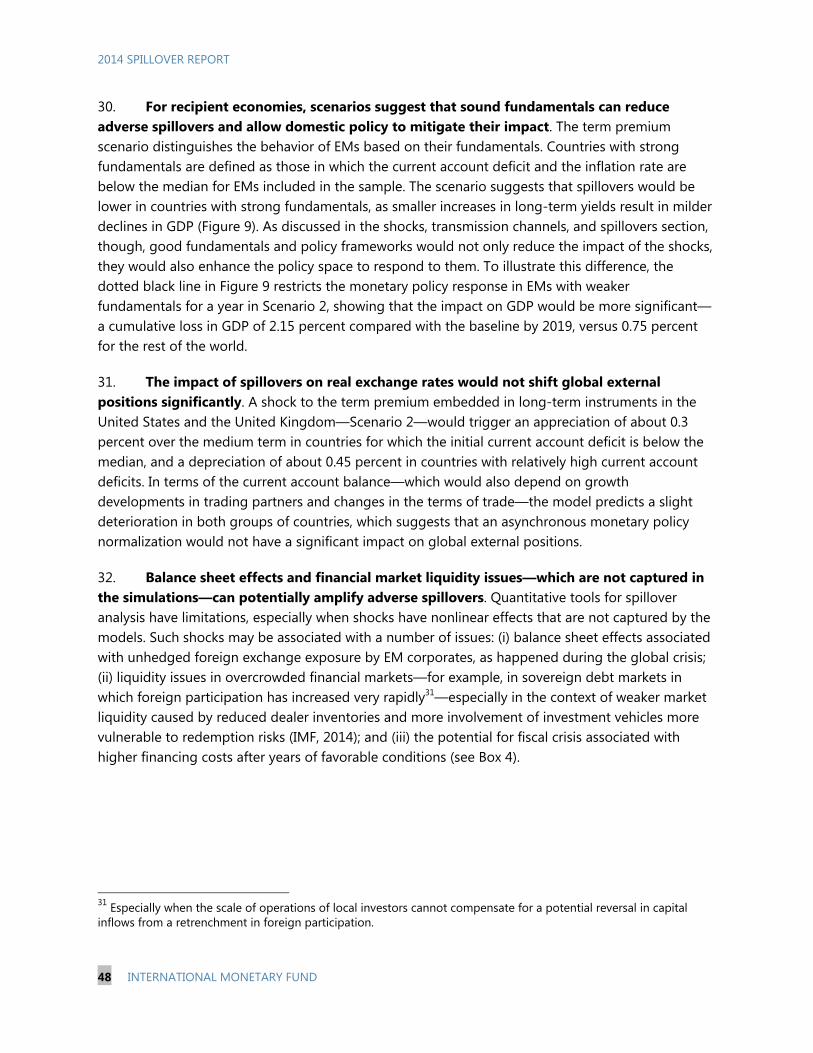
ANNEXES
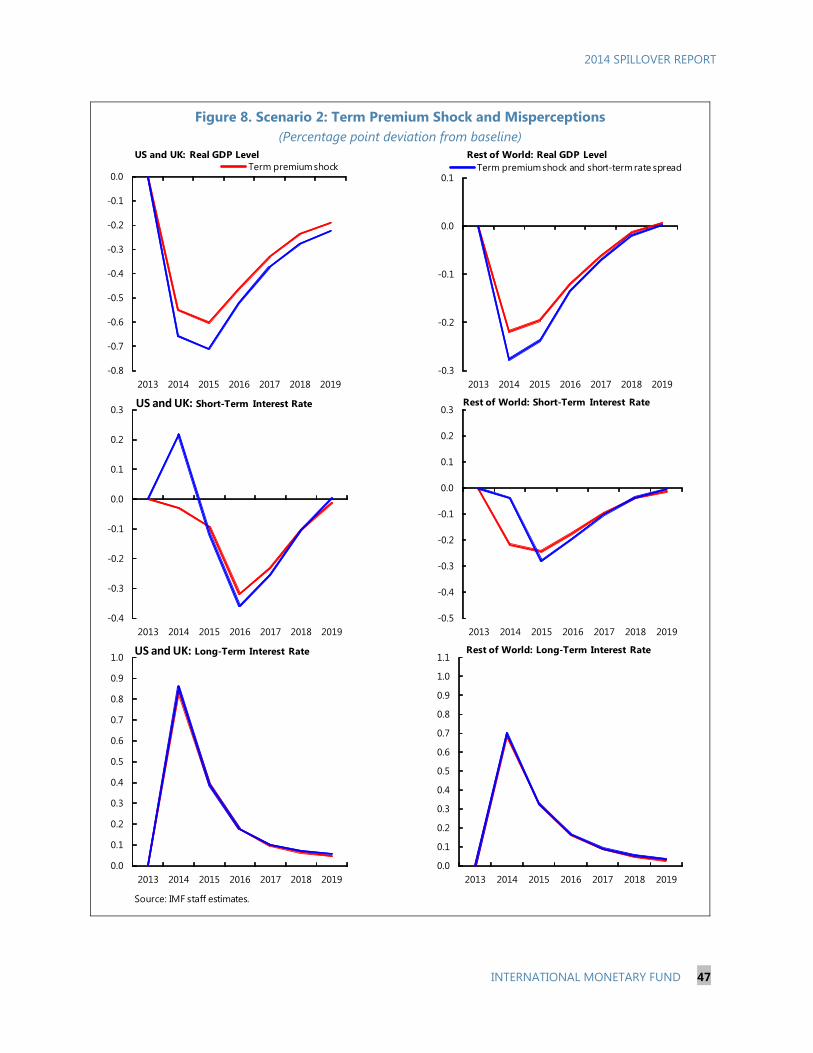
Chapter 1 I. Framework for Global Downside Scenario _____________________________________________________ 82
Chapter 2 II. Spillovers ______________________________________________________________________________________ 85 III. Forward Guidance in Key Advanced Economies ______________________________________________ 86 IV. Spillovers and Fundamentals _________________________________________________________________ 88 V. Decomposing Long-term Rates with a Vector Autoregression Using Sign Restrictions _______ 89 VI. Money, Activity, and Risk-On/Off Drivers of U.S. Yields and their Spillovers __________________ 91
Chapter 3 VII. Alternative Structural Decomposition ________________________________________________________ 94 VIII. Gross Trade versus Value-Added Trade Flows _______________________________________________ 95 IX. Global Vector Autoregression Model _________________________________________________________ 96 X. Emerging Market Economy Spillover through Oil Prices Using the FAVAR Model ____________ 97 REFERENCES Chapter 1 ________________________________________________________________________________________ 99 Chapter 2 ________________________________________________________________________________________ 99 Chapter 3 _______________________________________________________________________________________ 102
2014 SPILLOVER REPORT
6 INTERNATIONAL MONETARY FUND
Glossary
AEs advanced economies BRICS Brazil, Russia, India, China, and South Africa CCPs central counterparties CESEE Central, Eastern, and Southeastern European CPI consumer price index DAG directed acyclic graphs DV domestic value EMs emerging markets ETFs exchange-traded funds EUROMOD Euro Area Model FAVARs factor augmented VARs FDI foreign direct investment FSGM Flexible System of Global Models FV foreign value GCC Cooperation Council of the Arab States of the Gulf GDP gross domestic product GPM Global Projection Model GVAR global vector autoregression LHS left hand side LICs low-income countries LOLR lender of last resort OECD Organisation for Economic Co-operation and Development RHS right hand side RoW rest of the world S4 Systemic 4: Euro Area, Japan, United Kingdom, and United States SEFs swap execution facilities SME small and medium-sized enterprises UMP unconventional monetary policy VAR vector autoregression WEO World Economic Outlook ZLB zero lower bound
2014 SPILLOVER REPORT
INTERNATIONAL MONETARY FUND 7
CHAPTER 1. CHANGING TIDES AND GLOBAL SPILLOVERS Changing growth patterns are currently a leading source of spillovers in the global economy. Two key trends set the stage for likely and potential spillovers. First, global financial conditions will likely continue to tighten and interest rates will rise as key advanced economies begin to normalize their exceptional monetary policies alongside self-sustaining recoveries. Led by the United States, normalization will carry far-reaching spillovers depending on how the recovery evolves and how well an asynchronous policy exit can be managed given the challenges involved. Lessons from the taper episode a year ago indicate that spillovers are different across partner countries and depend on interactions with local fundamentals and policy frameworks. As monetary accommodation is removed, the spillover implications from financial sector reform will also become more apparent. Second, many emerging market economies are growing more slowly, on a durable basis, from their high point. This carries important external effects through global trade and finance, and influences other emerging and developing economies through “neighborhood” effects. These two trends—tighter global financial conditions and slower emerging market growth—pose downside risks depending on how they unfold going forward. Source and recipient countries will face challenges in mitigating or managing spillover effects. Tradeoffs suggest some gains from collaboration at the global level.
A. Global Baseline and Spillovers
1. The world economy has entered a new phase with respect to spillovers as tail risks associated with the global financial crisis have faded.1 At this juncture, changing tides in the global economy are the main source of external shocks. Specifically, global activity is expected to regain strength in the rest of 2014, but the underlying sources of growth have been changing.2 Advanced economies accounted for much of the pickup in growth over the past year, with some signs of a self-sustaining recovery. As the recovery gains a firmer footing in some advanced economies, unwinding of exceptional monetary support in these economies will proceed, with implications for global financial conditions. Meanwhile, growth in emerging markets increased only modestly during the past year, and many are experiencing broad-based slowdowns in growth from their precrisis peaks. These two key trends in the baselines for advanced and emerging market economies have, through spillovers, influenced global developments and set the scene for the emergence of new spillovers.
2. Normalization of monetary policies is expected in some major advanced economies as growth recovers. Notwithstanding weaker growth outturns recently, self-sustaining recoveries are generally becoming more apparent in the United States and the United Kingdom. Accordingly,
1 See the 2011, 2012, and 2013 Spillover Reports (IMF, 2011, 2012a, 2013) for analysis of crisis-related spillovers. 2 See the April 2014 World Economic Outlook (IMF, 2014e).
2014 SPILLOVER REPORT
8 INTERNATIONAL MONETARY FUND
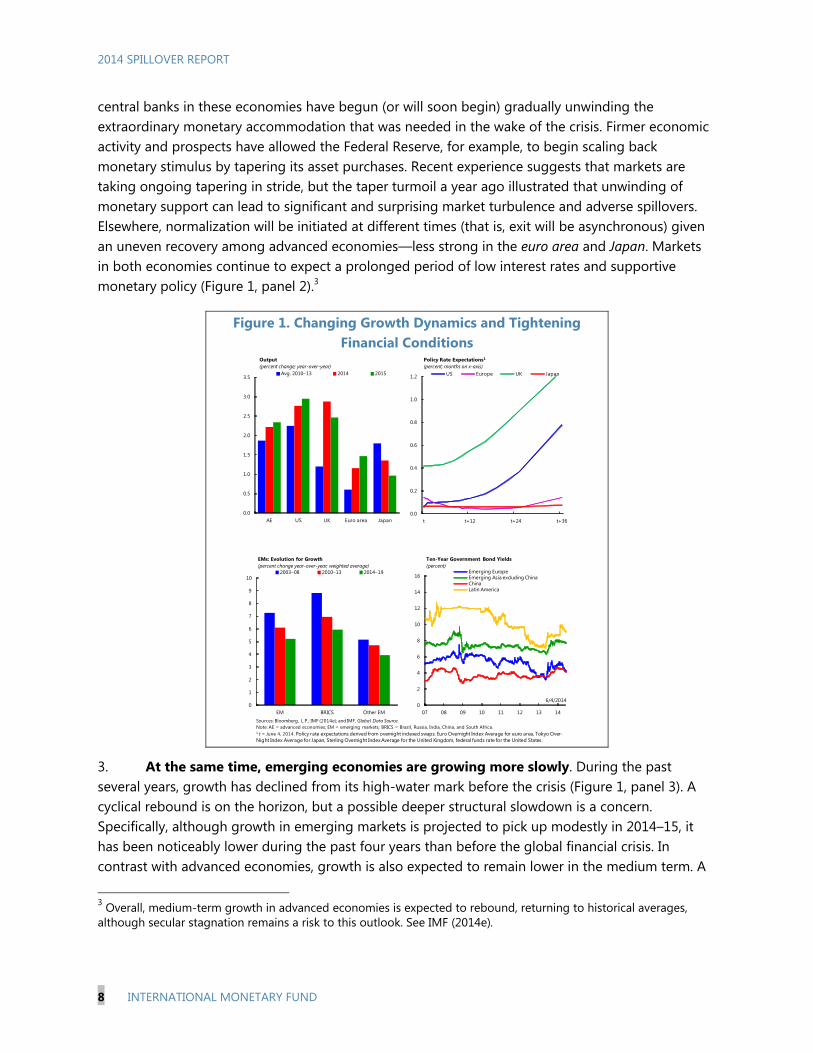
central banks in these economies have begun (or will soon begin) gradually unwinding the extraordinary monetary accommodation that was needed in the wake of the crisis. Firmer economic activity and prospects have allowed the Federal Reserve, for example, to begin scaling back monetary stimulus by tapering its asset purchases. Recent experience suggests that markets are taking ongoing tapering in stride, but the taper turmoil a year ago illustrated that unwinding of monetary support can lead to significant and surprising market turbulence and adverse spillovers. Elsewhere, normalization will be initiated at different times (that is, exit will be asynchronous) given an uneven recovery among advanced economies—less strong in the euro area and Japan. Markets in both economies continue to expect a prolonged period of low interest rates and supportive monetary policy (Figure 1, panel 2).3
Figure 1. Changing Growth Dynamics and Tightening Financial Conditions
3. At the same time, emerging economies are growing more slowly. During the past several years, growth has declined from its high-water mark before the crisis (Figure 1, panel 3). A cyclical rebound is on the horizon, but a possible deeper structural slowdown is a concern. Specifically, although growth in emerging markets is projected to pick up modestly in 2014–15, it has been noticeably lower during the past four years than before the global financial crisis. In contrast with advanced economies, growth is also expected to remain lower in the medium term. A
3 Overall, medium-term growth in advanced economies is expected to rebound, returning to historical averages, although secular stagnation remains a risk to this outlook. See IMF (2014e).
0.0
0.5
1.0
1.5
2.0
2.5
3.0
3.5
AE US UK Euro area Japan
Avg. 2010–13 2014 2015
Output(percent change; year-over-year)
0.0
0.2
0.4
0.6
0.8
1.0
1.2
t t+12 t+24 t+36
US Europe UK Japan
Policy Rate Expectations1
(percent; months on x-axis)
0
1
2
3
4
5
6
7
8
9
10
EM BRICS Other EM
2003–08 2010–13 2014–19
EMs: Evolution for Growth(percent change year-over-year; weighted average)
0
2
4
6
8
10
12
14
16
07 08 09 10 11 12 13 14
Emerging EuropeEmerging Asia excluding ChinaChinaLatin America
Ten-Year Government Bond Yields(percent)
6/4/2014
Sources: Bloomberg, L.P.; IMF (2014e); and IMF, Global Data Source. Note: AE = advanced economies; EM = emerging markets; BRICS = Brazil, Russia, India, China, and South Africa.1 t = June 4, 2014. Policy rate expectations derived from overnight indexed swaps: Euro Overnight Index Average for euro area, Tokyo Over-Night Index Average for Japan, Sterling Overnight Index Average for the United Kingdom, federal funds rate for the United States.
2014 SPILLOVER REPORT
INTERNATIONAL MONETARY FUND 9
synchronized and protracted slowdown in emerging market economies can itself be a source of significant spillovers to the rest of the world—particularly to neighboring emerging and developing partner countries—given their larger share of the global economy following an extended period of rapid growth.
B. Global Spillover Risks
4. Different spillovers can potentially flow from these global trends. First, the nature of spillovers from monetary normalization will depend on the main underlying drivers of higher interest rates going forward. Higher interest rates and tighter financial conditions well ahead of stronger growth would be a concern in terms of external effects. Second, spillovers from weaker growth in emerging market economies will depend on the depth and nature of their slowdowns. A deeper slowdown may have sizable spillover implications for partner countries—notably neighbors. These two sets of spillovers can occur together and interact. Markets can reassess emerging market growth prospects amid tighter financial conditions, market turbulence, currency depreciation, and capital flow reversals. These reassessments in markets can generate further stress and lead to possibly large spillovers or spillbacks if emerging market turmoil were to deepen against a backdrop of sharply tighter financial conditions and growth disappointments.
5. Downside risks attached to these two spillovers remain relevant going forward and argue for policy collaboration. Recent market developments point toward a return to very low implied volatility in interest and exchange rates, lower risk premiums, and rising asset prices (some at all-time highs). These indicators are reminiscent of conditions and risk taking ahead of previous bouts of market turbulence and the sharp repricing of assets last summer during the taper episode. Additionally, the precise nature of a synchronized slowdown in emerging markets remains uncertain and will only become evident over time. These two central issues and other spillovers from advanced and emerging market economies are described in the next two sections, followed by a downside scenario that quantifies the global impact if key spillover risks were to materialize. Policymakers will need to strengthen national and global policies, including scope for collaboration, to avoid risks to the extent possible and rebuild policy space to respond to these key risks and trends.
90
100
110
120
130
140
150
80
85
90
95
100
105
110
115
120
Jan-13 May-13 Sep-13 Jan-14 May-14
Equities - MSCI EMBI (RHS)
Emerging Market Assets(index; January 1, 2013=100)
6/4/2014
Taper talk Non-taperTaper
40
50
60
70
80
90
100
110
120
130
6
7
8
9
10
11
12
13
Jan-13 May-13 Sep-13 Jan-14 May-14
Basis
poi
nts
Perc
ent
EM foreign exchange volatilityU.S. interest rate volatility, Move index (RHS)
Implied Volatility
6/4/2014
Taper talk
Non-taper
Taper
Source: Bloomberg, L.P.Note: EM = emerging markets; EMBI = JP Morgan Emerging Markets Bond Index; RHS = right-hand scale. TheMove index is a weighted-average index of the normalized implied volatility on 1-month Treasury options (weights on 1-month options for 2-, 5-, 10-, and 30-year instruments are 0.2, 0.2, 0.4, and 0.2, respectively).
2014 SPILLOVER REPORT
10 INTERNATIONAL MONETARY FUND
C. Spillovers from Advanced Economies
6. Monetary normalization in key advanced economies carries important global spillover implications. The WEO baseline envisages relatively smooth normalization in the United States and the United Kingdom, led by higher economic growth, with generally beneficial spillovers. The nature of spillovers and risks from the unwinding will ultimately depend on three central elements.
For source countries, what mainly drives benchmark interest rates higher will shape spillovers. Analysis suggests there is an important distinction between “real” and “money” shocks. Real shocks associated with higher interest rates—reflecting stronger than expected growth in major advanced economies or a greater preference for riskier assets—tend to produce smaller increases in emerging market yields. Correspondingly, output tends to rise (not fall) in partners through stronger trade or capital flows alongside stronger growth or risk taking in source countries. Conversely, money shocks associated with rising yields—reflecting unexpected tightening in financing conditions including through changes in the monetary policy stance in source countries—tend to generate larger increases in long-term yields in emerging markets and weigh on activity. IMF staff analysis of the U.S. taper episode last summer suggests an adverse money shock of between 40 and 60 basis points with a noticeable spillover impact on emerging market yields.4
For major central banks, how well the normalization process can be managed is critical and is a source of risk. Policy and communication challenges with normalization are more complex now given an unconventional starting point. Specifically, achieving a smooth unwinding can be difficult for central banks when starting from low interest rates and large balance sheets that strongly influence market risk taking and search for yield. Market turbulence with the taper episode, for example, was unusually high given one-sided market perceptions and positioning amid historically low long rates, term premiums and implied volatility. This unintended consequence with respect to possible excessive risk taking adds complexity to future central bank decision making because tension can arise between central bank mandates and financial stability concerns.5
For recipient economies, fundamentals and policies matter and can mitigate or amplify the transmission of external shocks. Spillover effects were different across economies during the taper episode. Domestic policy frameworks and good fundamentals can act as effective buffers and enhance policy space to respond to adverse spillovers. Emerging economies with lower inflation, smaller external or fiscal deficits, and deeper financial markets tended to experience smaller increases in local interest rates.
4 The spillover impact on emerging market yields (after 12 months) from a money shock is estimated to be approximately 35–40 percent of the yield increase in source countries. For a real shock, the rise in emerging market yields is estimated to be about 15–20 percent of the increase in advanced economy yields. See Chapter 2. 5 See the April 2014 Global Financial Stability Report (IMF, 2014b).
2014 SPILLOVER REPORT
INTERNATIONAL MONETARY FUND 11
7. Very low inflation given policy rates at the zero bound in advanced economies has spillover implications. With an uneven and fragile recovery, inflation is projected to be lower than previously expected in many advanced economies. If inflation stays below central bank targets for an extended period, inflation expectations are likely to drift down. Box 1 examines the risks of prolonged and very low inflation in some advanced economies from a spillover perspective. Overall, the euro area and Japan under these circumstances are more vulnerable to inward spillovers than they are to being a major source of outward spillovers beyond their immediate neighbors. Given policy constraints at the zero lower bound, adverse external shocks, if not counteracted by unconventional measures, cause more damage and could push the domestic economy into deflation—which would worsen private and public debt dynamics. Outside the euro area, low euro-area-wide inflation is dampening core inflation in economies in the region that peg to the euro.6
8. Asynchronous exit from monetary accommodation in advanced economies can generate spillover effects through exchange rates. With normalization likely to proceed at different times in different advanced economies, this can have wider implications for interest and exchange rate movements. More-synchronized tightening cycles in the past were characterized by higher global interest rates and risk aversion, as well as modestly higher stress in sovereign bond and stock markets in emerging market economies. A less-synchronized tightening cycle this time—with the possible introduction of further unconventional easing in the euro area and the continuation of quantitative and qualitative easing in Japan—would partly counteract the impact of higher interest rates from normalization elsewhere. Stronger growth and higher inflation in Japan and the euro area would likely carry positive spillovers, on balance, for partners. However, asynchronous adjustment may result in larger swings in exchange rates of major currencies that could cause problems for some economies with balance sheet vulnerabilities and foreign exchange exposures.
9. Finally, global regulatory reform—needed to build a safer financial system after the crisis—can impart unintended spillovers. As monetary accommodation is gradually removed, a more accurate picture of the impact of recent regulatory reform and its coherence will emerge. The crisis prompted greater international cooperation and much-needed regulatory reform, and more changes are still to come. In light of legacy effects and new rules, the provision of financial services is changing in key respects, specifically bank business models, market liquidity, and credit availability. Issues include whether certain activities are being excessively penalized, whether reduced profitability will affect certain types of financing, and whether new entrants (for example, nonbank financial institutions) will create new risks. Further work is needed to assess future spillover implications (see Box 2).7
6 See the 2014 Euro Area Article IV Staff Report (IMF, 2014a). 7 The IMF staff is examining spillover implications of regulatory reform with respect to a range of financial services, including long-term infrastructure and finance to small and medium-sized enterprises; hedging of financial risks faced by economic agents; repo operations and securitization; and increased nonbank activities, analyses of which are planned for forthcoming issues of the Global Financial Stability Report and other outlets.
2014 SPILLOVER REPORT
12 INTERNATIONAL MONETARY FUND
-0.15
-0.10
-0.05
0.00
0.05
0.10
0.15
2014 2015 2014 2015 2014 2015
Scenario I Scenario II Scenario III
China India Indonesia Korea Germany US UK
Japan: Model Impact on GDP Growth in Neighboring Economies(percent)
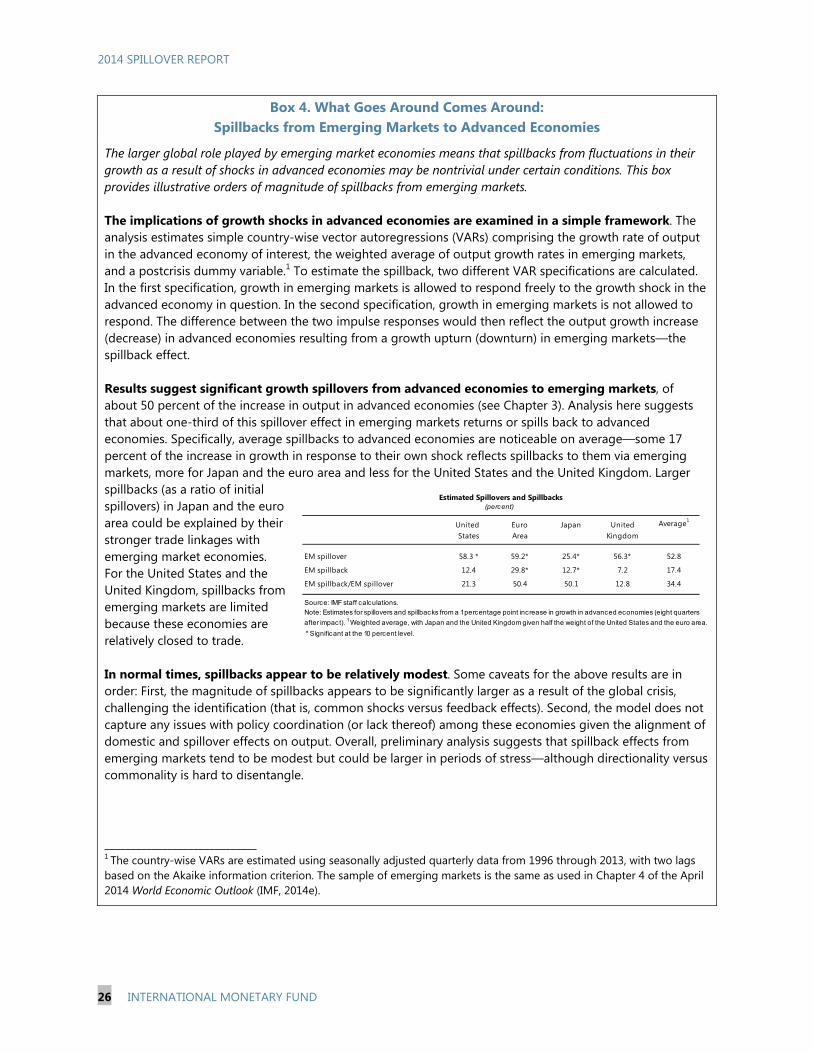
Box 1. Risks and Spillovers from Low Inflation in Japan and the Euro Area This box explores potential risks associated with low inflation in Japan and the euro area and considers possible macroeconomic spillovers. The analysis suggests that although low inflation poses vulnerability risks, outward spillovers are likely to be modest, with close trading partners affected most. However, a negative impact on financial conditions outside of Japan or the euro area, if realized, could considerably increase spillover consequences.
Inflation Forecasts and Confidence Ranges. The IMF’s Global Projection Model forecast for headline consumer price index inflation suggests that the risks of deflation in Japan are quite low for 2014 and 2015. In part, this forecast reflects the implemented and planned increases in the value-added tax and assumes that the Bank of Japan’s new inflation target is credible given the new overall policy strategy. In the euro area, inflation is highly likely to remain well below target in 2014 and 2015, with deflation risks being appreciable, in part reflecting continued financial fragmentation, structural gaps, and balance sheet repair.
Inflation Risks in Japan and Spillovers. If new policies in Japan aimed at strengthening growth and stabilizing inflation at 2 percent are successful, higher growth would lead to positive spillovers. However, the materialization of downside risks could result in sizable negative spillovers if it undermines confidence that new policies can deliver the increased demand essential for raising inflation and inflation expectations in 2014 and beyond. Decreases in confidence could be triggered by various factors, including a continued lack of wage growth, weak exports and investment, or external risks that trigger safe-haven yen appreciation. The scenario here focuses on wage growth. Disappointing wage increases could lead to a decline in real wages caused by higher inflation and the two-step hike in the consumption tax rate. This real wage decline could result in a deeper and more protracted drop in consumption.
Simulations using the IMF’s Flexible System of Global Models show that a decline of nominal wage growth relative to the baseline by roughly 3 percentage points in both 2014 and 2015 in Japan that does not dampen consumer and investor confidence would have relatively mild implications for domestic inflation and growth (which falls by 0.4 point on impact) and small spillovers elsewhere (Japan Scenario I). If this outcome is accompanied by declining investor sentiment and yen appreciation1 (that is, a reversal of 2013 developments), growth and inflation effects in Japan could be more substantial—for example, real GDP growth would fall by 2.9 percent, although the spillover effect would still be small (or even positive for some) given yen appreciation (Japan Scenario II). However, adverse spillovers could be much larger if interest rates were to increase in Japan because of fiscal sustainability concerns.2
-3
-2
-1
0
1
2
3
4
5
6
07 09 12 14Source: IMF staff estimates.Note: CPI = consumer price index
Japan: March 2014 CPI Inflation Forecast(up to 90% confidence bands)
-3
-2
-1
0
1
2
3
4
5
07 09 12 14
Euro Area: March 2014 CPI Inflation Forecast(up to 90% confidence bands)
Source: IMF staff estimates.Note: CPI = consumer price index
2014 SPILLOVER REPORT
INTERNATIONAL MONETARY FUND 13
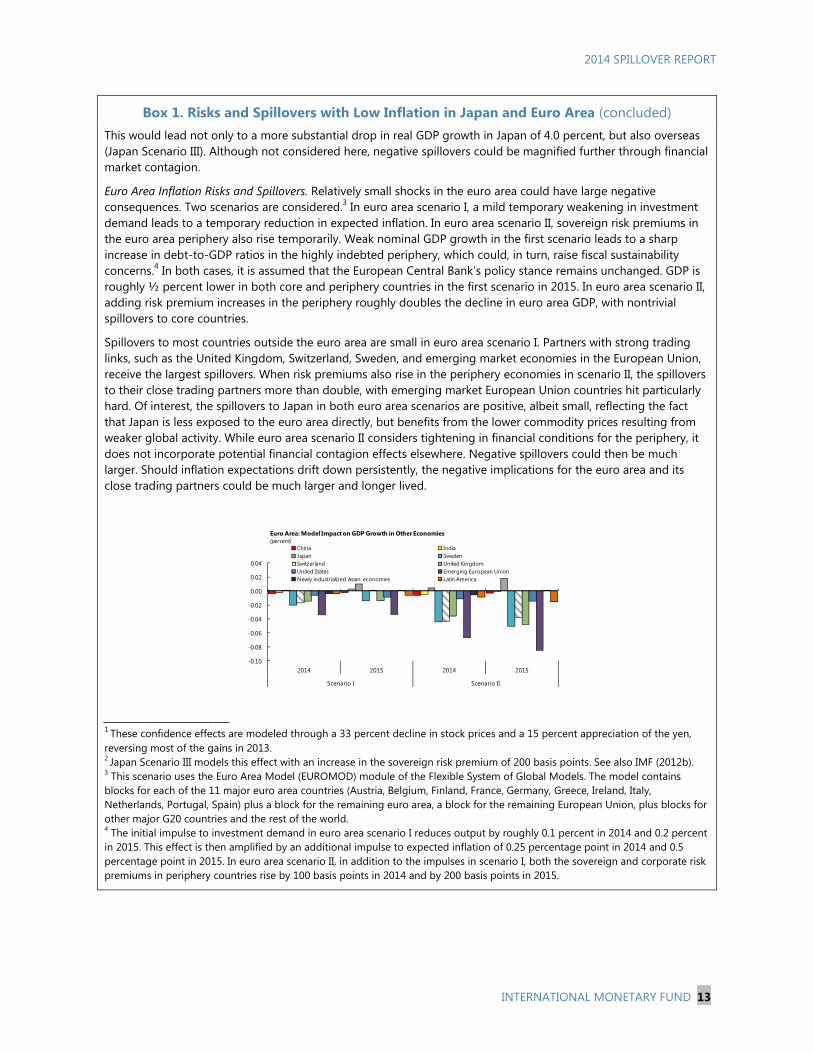
Box 1. Risks and Spillovers with Low Inflation in Japan and Euro Area (concluded) This would lead not only to a more substantial drop in real GDP growth in Japan of 4.0 percent, but also overseas (Japan Scenario III). Although not considered here, negative spillovers could be magnified further through financial market contagion.
Euro Area Inflation Risks and Spillovers. Relatively small shocks in the euro area could have large negative consequences. Two scenarios are considered.3 In euro area scenario I, a mild temporary weakening in investment demand leads to a temporary reduction in expected inflation. In euro area scenario II, sovereign risk premiums in the euro area periphery also rise temporarily. Weak nominal GDP growth in the first scenario leads to a sharp increase in debt-to-GDP ratios in the highly indebted periphery, which could, in turn, raise fiscal sustainability concerns.4 In both cases, it is assumed that the European Central Bank’s policy stance remains unchanged. GDP is roughly ½ percent lower in both core and periphery countries in the first scenario in 2015. In euro area scenario II, adding risk premium increases in the periphery roughly doubles the decline in euro area GDP, with nontrivial spillovers to core countries.
Spillovers to most countries outside the euro area are small in euro area scenario I. Partners with strong trading links, such as the United Kingdom, Switzerland, Sweden, and emerging market economies in the European Union, receive the largest spillovers. When risk premiums also rise in the periphery economies in scenario II, the spillovers to their close trading partners more than double, with emerging market European Union countries hit particularly hard. Of interest, the spillovers to Japan in both euro area scenarios are positive, albeit small, reflecting the fact that Japan is less exposed to the euro area directly, but benefits from the lower commodity prices resulting from weaker global activity. While euro area scenario II considers tightening in financial conditions for the periphery, it does not incorporate potential financial contagion effects elsewhere. Negative spillovers could then be much larger. Should inflation expectations drift down persistently, the negative implications for the euro area and its close trading partners could be much larger and longer lived.
________________________ 1 These confidence effects are modeled through a 33 percent decline in stock prices and a 15 percent appreciation of the yen, reversing most of the gains in 2013. 2 Japan Scenario III models this effect with an increase in the sovereign risk premium of 200 basis points. See also IMF (2012b). 3 This scenario uses the Euro Area Model (EUROMOD) module of the Flexible System of Global Models. The model contains blocks for each of the 11 major euro area countries (Austria, Belgium, Finland, France, Germany, Greece, Ireland, Italy, Netherlands, Portugal, Spain) plus a block for the remaining euro area, a block for the remaining European Union, plus blocks for other major G20 countries and the rest of the world. 4 The initial impulse to investment demand in euro area scenario I reduces output by roughly 0.1 percent in 2014 and 0.2 percent in 2015. This effect is then amplified by an additional impulse to expected inflation of 0.25 percentage point in 2014 and 0.5 percentage point in 2015. In euro area scenario II, in addition to the impulses in scenario I, both the sovereign and corporate risk premiums in periphery countries rise by 100 basis points in 2014 and by 200 basis points in 2015.
-0.10
-0.08
-0.06
-0.04
-0.02
0.00
0.02
0.04
2014 2015 2014 2015
Scenario I Scenario II
China IndiaJapan SwedenSwitzerland United KingdomUnited States Emerging European UnionNewly industrialized Asian economies Latin America
Euro Area: Model Impact on GDP Growth in Other Economies(percent)
2014 SPILLOVER REPORT
14 INTERNATIONAL MONETARY FUND
Box 2. Spillovers from Financial Regulatory Reforms in Major Advanced Economies The crisis provided the impetus for a major overhaul of the financial regulatory system and prompted greater international cooperation. This response (formulated at the London and Pittsburgh G20 summits) was an acknowledgment that costs from the crisis were imposed partly as a result of systemic weaknesses in regulatory architecture and a failure of supervisors to rein in excessive risk taking. The broad thrust of global regulatory changes targets higher capital and liquidity buffers. However, these are minimum standards, and authorities may decide to impose more stringent national rules taking into account country-specific circumstances. Consensus on an enhanced set of global regulatory standards has been reached in many areas, and is still being sought in a few others. Monitoring changes in the provision of financial services is important to mitigate risks that regulations may have adverse spillovers. Liquidity conditions, credit availability, and the role of nonbank financial entities are likely to be affected from now on. Some changes will be cyclical and transitory and others more durable, leading to structural transformations in global financial intermediation. Policymakers need to ensure that regulation is appropriately calibrated, meets intended objectives, and does not impose undue domestic or cross-border costs and lead to fragmentation—indeed, event studies point to significant differences in initial market responses to regulatory announcements across banks in the United States and Europe since the crisis. Changes in bank business models
Substantial changes have been observed since the crisis in the business focus of global systemically important banks (G-SIBs). Key drivers for this change in focus include legacy balance sheet issues, cyclical conditions, and regulatory changes implemented both globally and nationally. Business lines that are more capital intensive or require high transaction volumes have been cut back sharply. Since 2008, many Asian G-SIBs have increased their core business reach as others deleveraged and sharply downsized their trading activities and securities holdings. As monetary normalization proceeds, an assessment needs to be made of whether new regulatory rules may be excessively punitive for certain activities. Current liquidity conditions and other factors have limited the need for G-SIBs to cut activities rapidly. In the future, strategic decisions may lead to further balance sheet adjustments, including reduced product offerings or limited access to finance in certain markets and regions. Implications for market liquidity
The reduced role of global banks as market makers and greater balkanization may affect liquidity in some markets. Most U.S. and European G-SIBs and dealer banks have reduced their market-making commitments, in part because of new prudential and conduct regulations, including Basel III capital and liquidity requirements, disincentives to proprietary trading, and the introduction of centralized trading. Markets likely to be affected include the following: Corporate bond markets—Dealer banks have sharply reduced their corporate bond inventories, which is
affecting secondary market liquidity and may lead to more volatility during times of stress. Higher capital charges may also result in reduced market access for smaller corporations and irregular issuers.
Derivatives markets—As a result of the new requirements, banks are less willing to provide long-tenure swaps. The U.S. rules on swap execution facilities for the trading and clearing of standard derivatives and
2014 SPILLOVER REPORT
INTERNATIONAL MONETARY FUND 15
Box 2. Spillovers from Financial Regulatory Reforms in Major Advanced Economies (concluded)
associated disclosure requirements may mean that non-U.S. entities would be less willing to engage with U.S. banks. The recent launch of European Market Infrastructure Regulation (EMIR) in Europe has mitigated some problems, but issues remain for other advanced economies and emerging markets.
Funding and collateral markets—A reduction in low-margin repo books of banks, mainly driven by the leverage ratio, may reduce liquidity in funding and sovereign bond markets.
Implications for bank lending
Reduced profitability or more limited funding and hedging options may affect bank lending in some sectors and regions. Signs of bank withdrawal are apparent in the following:
Corporate lending—Reportedly, many "noncore" corporate clients are being screened out as G-SIBs reduce their global reach because of stricter prudential and conduct regulation, particularly in the United States. Banks in general are imposing more onerous lending terms (collateral requirements and shorter terms), especially on small and medium-sized enterprises.
Trade finance—Some European banks have exited related business lines (such as commodity finance), but Asian banks are increasing their market share. Spillovers may be more material in frontier markets; larger countries benefit from greater access to alternative financing sources.
Infrastructure and project finance—Banks are required to hold higher capital and liquidity buffers against maturity mismatches and "illiquid" assets. Banks may not be best suited to hold such long-term exposures in the first place. Financial innovation may allow them to transfer these risks in the future, but the availability of credit may be reduced during the transition.
Macroeconomic and financial stability considerations
Global financial intermediation is experiencing substantial changes and is becoming safer. G-SIBs have reduced their balance sheet vulnerabilities and are implementing more focused business strategies. Trading activities are better regulated and have been shifted to organized platforms, allowing for more transparency. As a result, both interconnectedness and leverage in the system are much lower than before the crisis. The entry of nonbank financial institutions may bring about diversification benefits. However, it remains to be assessed whether new participants will predominantly be entities that are natural sources of long-term capital (such as insurers and pension funds) or intermediaries that may be subject to liquidity pressures to a much greater extent than are banks (such as, for example, investment funds or exchange-traded funds, which do not have guaranteed access to lender-of-last-resort support). New sources of risk will require close monitoring and policy action. Some risks are difficult to discern at this point. Activities that have economic and stability benefits may now be accompanied by a greater transfer of risk to end users or to unsafe financial institutions. Concentration risks may also have increased in the system (such as in central counterparties), increasing the need for proper resolution frameworks. These challenges will require policy flexibility and proactive measures, taking into account the dynamic impact of regulatory and other changes on the provision of financial services, to support local capital market development or other activities adversely affected by new regulations.
2014 SPILLOVER REPORT
16 INTERNATIONAL MONETARY FUND
D. Spillovers from Emerging Market Economies
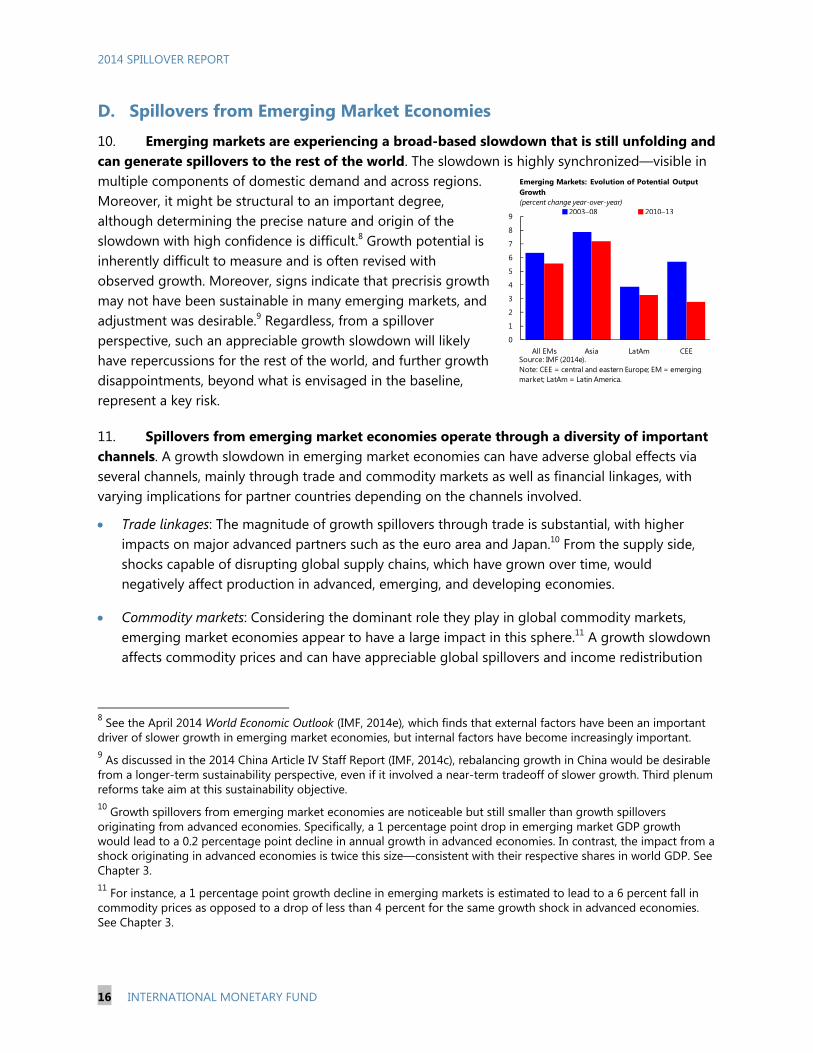
10. Emerging markets are experiencing a broad-based slowdown that is still unfolding and can generate spillovers to the rest of the world. The slowdown is highly synchronized—visible in multiple components of domestic demand and across regions. Moreover, it might be structural to an important degree, although determining the precise nature and origin of the slowdown with high confidence is difficult.8 Growth potential is inherently difficult to measure and is often revised with observed growth. Moreover, signs indicate that precrisis growth may not have been sustainable in many emerging markets, and adjustment was desirable.9 Regardless, from a spillover perspective, such an appreciable growth slowdown will likely have repercussions for the rest of the world, and further growth disappointments, beyond what is envisaged in the baseline, represent a key risk.
11. Spillovers from emerging market economies operate through a diversity of important channels. A growth slowdown in emerging market economies can have adverse global effects via several channels, mainly through trade and commodity markets as well as financial linkages, with varying implications for partner countries depending on the channels involved.
Trade linkages: The magnitude of growth spillovers through trade is substantial, with higher impacts on major advanced partners such as the euro area and Japan.10 From the supply side, shocks capable of disrupting global supply chains, which have grown over time, would negatively affect production in advanced, emerging, and developing economies.
Commodity markets: Considering the dominant role they play in global commodity markets, emerging market economies appear to have a large impact in this sphere.11 A growth slowdown affects commodity prices and can have appreciable global spillovers and income redistribution
8 See the April 2014 World Economic Outlook (IMF, 2014e), which finds that external factors have been an important driver of slower growth in emerging market economies, but internal factors have become increasingly important. 9 As discussed in the 2014 China Article IV Staff Report (IMF, 2014c), rebalancing growth in China would be desirable from a longer-term sustainability perspective, even if it involved a near-term tradeoff of slower growth. Third plenum reforms take aim at this sustainability objective. 10 Growth spillovers from emerging market economies are noticeable but still smaller than growth spillovers originating from advanced economies. Specifically, a 1 percentage point drop in emerging market GDP growth would lead to a 0.2 percentage point decline in annual growth in advanced economies. In contrast, the impact from a shock originating in advanced economies is twice this size—consistent with their respective shares in world GDP. See Chapter 3. 11 For instance, a 1 percentage point growth decline in emerging markets is estimated to lead to a 6 percent fall in commodity prices as opposed to a drop of less than 4 percent for the same growth shock in advanced economies. See Chapter 3.
0
1
2
3
4
5
6
7
8
9
All EMs Asia LatAm CEE
2003–08 2010–13
Emerging Markets: Evolution of Potential Output Growth(percent change year-over-year)
Source: IMF (2014e).Note: CEE = central and eastern Europe; EM = emerging market; LatAm = Latin America.
2014 SPILLOVER REPORT
INTERNATIONAL MONETARY FUND 17
effects for commodity exporters and importers through the terms of trade.12 Lower commodity prices, though, would act as a stabilizer for overall global growth because they would lead to lower input costs.
Financial linkages. Financial spillovers are likely to be more important now than before the crisis. Bank exposures of advanced economies are growing—shares of cross-border claims on emerging markets, for example, doubled during the past eight years. Spillovers through other financial markets can also be significant, directly or indirectly, including through some valuation and wealth effects in advanced economies or through higher global risk aversion if emerging market assets were to experience a sell-off alongside growth disappointments.
12. “Neighborhood effects” or local spillovers from emerging market economies are important. During the past decade, regional trade and financial flows (especially in Asia) have become much larger. Thus, shocks originating in major emerging markets may affect their immediate neighbors through localized spillovers. Transmission channels are diverse and differ across regions, reflecting varying degrees of trade, transfers, cross-border financing, and remittances. Growth spillovers from four economies—Brazil, China, Russia, and Venezuela—would have sizable effects on activity in their neighbors through these linkages.13
13. Other emerging market risks are also pertinent at this juncture. Geopolitical tensions in Russia and Ukraine could be a significant source of spillovers. As a result of recent turmoil,14 growth in both Russia and Ukraine is expected to be lower, with broader adverse spillovers to the Commonwealth of Independent States region (see Box 3). Activity in other parts of the world could be affected if further turmoil leads to a renewed bout of increased risk aversion in global financial markets, or if trade and finance were disrupted by an intensification of sanctions and countersanctions. In particular, greater spillovers could emerge from major disruptions in production or transportation of natural gas or crude oil, or, to a lesser extent, corn and wheat.
12 The capacity to cope with large terms of trade shocks depends on available buffers and institutional arrangements. Some countries and regions, for example, may be able to withstand large oil price shocks through stabilization funds and programs to mitigate the price impact (for example, Cooperation Council of the Arab States of the Gulf countries and Mexico). Others may be more seriously affected. See Chapter 3. 13 See Chapter 3 for analysis and discussion. 14 Russia sold foreign exchange reserves between end-December 2013 and end-April 2014. Since January, private capital outflows have been substantial, although the ruble remained broadly unchanged vis-à-vis the U.S. dollar.
2014 SPILLOVER REPORT
18 INTERNATIONAL MONETARY FUND
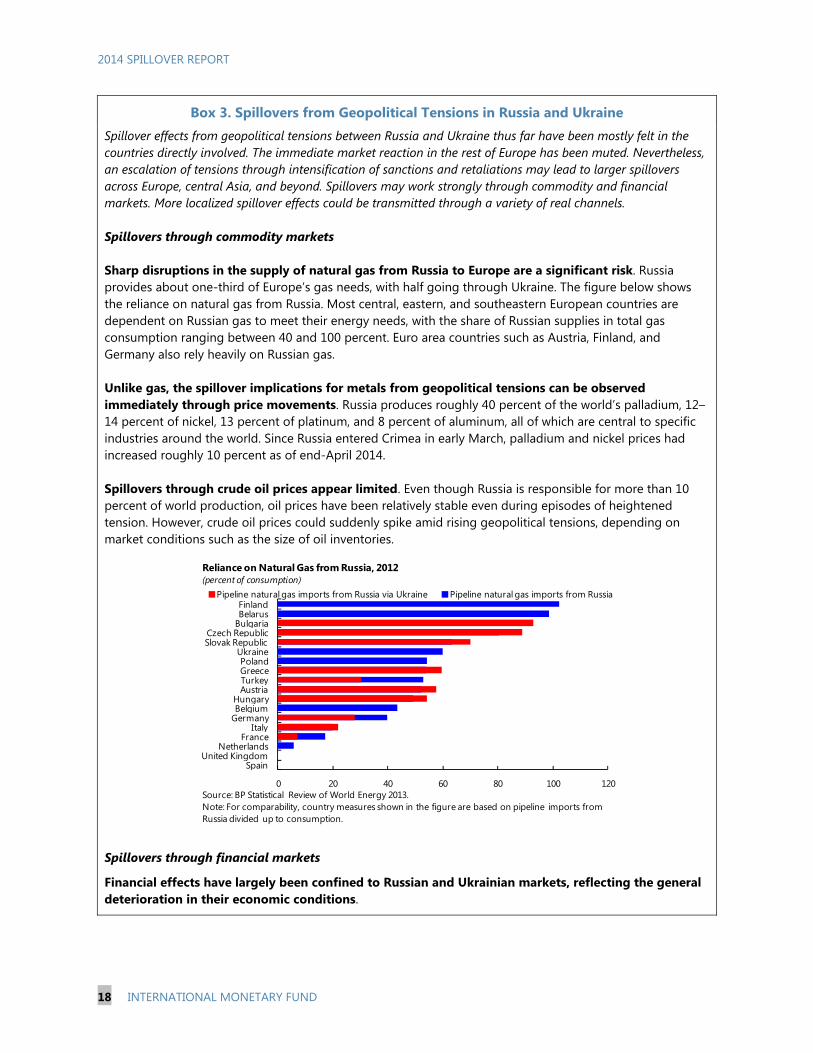
Box 3. Spillovers from Geopolitical Tensions in Russia and Ukraine Spillover effects from geopolitical tensions between Russia and Ukraine thus far have been mostly felt in the countries directly involved. The immediate market reaction in the rest of Europe has been muted. Nevertheless, an escalation of tensions through intensification of sanctions and retaliations may lead to larger spillovers across Europe, central Asia, and beyond. Spillovers may work strongly through commodity and financial markets. More localized spillover effects could be transmitted through a variety of real channels. Spillovers through commodity markets Sharp disruptions in the supply of natural gas from Russia to Europe are a significant risk. Russia provides about one-third of Europe’s gas needs, with half going through Ukraine. The figure below shows the reliance on natural gas from Russia. Most central, eastern, and southeastern European countries are dependent on Russian gas to meet their energy needs, with the share of Russian supplies in total gas consumption ranging between 40 and 100 percent. Euro area countries such as Austria, Finland, and Germany also rely heavily on Russian gas. Unlike gas, the spillover implications for metals from geopolitical tensions can be observed immediately through price movements. Russia produces roughly 40 percent of the world’s palladium, 12–14 percent of nickel, 13 percent of platinum, and 8 percent of aluminum, all of which are central to specific industries around the world. Since Russia entered Crimea in early March, palladium and nickel prices had increased roughly 10 percent as of end-April 2014. Spillovers through crude oil prices appear limited. Even though Russia is responsible for more than 10 percent of world production, oil prices have been relatively stable even during episodes of heightened tension. However, crude oil prices could suddenly spike amid rising geopolitical tensions, depending on market conditions such as the size of oil inventories.
Spillovers through financial markets
Financial effects have largely been confined to Russian and Ukrainian markets, reflecting the general deterioration in their economic conditions.
0 20 40 60 80 100 120
SpainUnited Kingdom
NetherlandsFrance
ItalyGermanyBelgiumHungary
AustriaTurkeyGreecePoland
UkraineSlovak RepublicCzech Republic
BulgariaBelarusFinland
Pipeline natural gas imports from Russia via Ukraine Pipeline natural gas imports from Russia
Reliance on Natural Gas from Russia, 2012(percent of consumption)
Source: BP Statistical Review of World Energy 2013.Note: For comparability, country measures shown in the figure are based on pipeline imports from Russia divided up to consumption.
2014 SPILLOVER REPORT
INTERNATIONAL MONETARY FUND 19
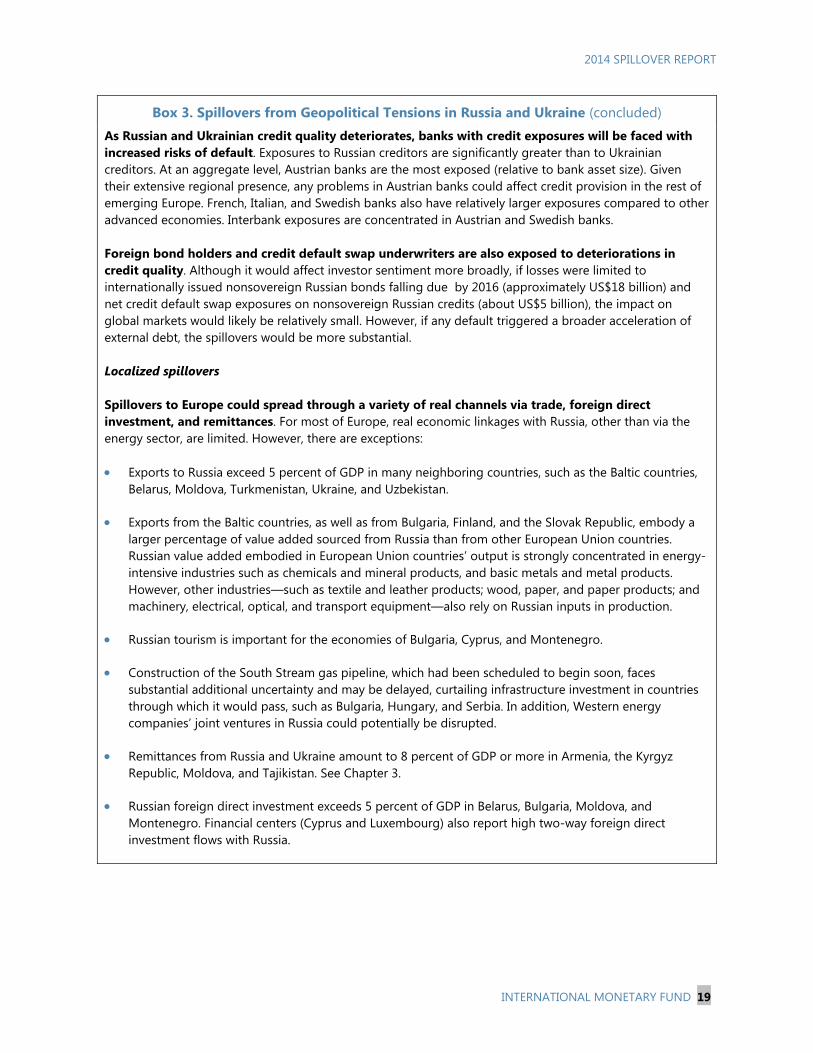
Box 3. Spillovers from Geopolitical Tensions in Russia and Ukraine (concluded) As Russian and Ukrainian credit quality deteriorates, banks with credit exposures will be faced with increased risks of default. Exposures to Russian creditors are significantly greater than to Ukrainian creditors. At an aggregate level, Austrian banks are the most exposed (relative to bank asset size). Given their extensive regional presence, any problems in Austrian banks could affect credit provision in the rest of emerging Europe. French, Italian, and Swedish banks also have relatively larger exposures compared to other advanced economies. Interbank exposures are concentrated in Austrian and Swedish banks. Foreign bond holders and credit default swap underwriters are also exposed to deteriorations in credit quality. Although it would affect investor sentiment more broadly, if losses were limited to internationally issued nonsovereign Russian bonds falling due by 2016 (approximately US$18 billion) and net credit default swap exposures on nonsovereign Russian credits (about US$5 billion), the impact on global markets would likely be relatively small. However, if any default triggered a broader acceleration of external debt, the spillovers would be more substantial. Localized spillovers Spillovers to Europe could spread through a variety of real channels via trade, foreign direct investment, and remittances. For most of Europe, real economic linkages with Russia, other than via the energy sector, are limited. However, there are exceptions: Exports to Russia exceed 5 percent of GDP in many neighboring countries, such as the Baltic countries,
Belarus, Moldova, Turkmenistan, Ukraine, and Uzbekistan.
Exports from the Baltic countries, as well as from Bulgaria, Finland, and the Slovak Republic, embody a larger percentage of value added sourced from Russia than from other European Union countries. Russian value added embodied in European Union countries’ output is strongly concentrated in energy-intensive industries such as chemicals and mineral products, and basic metals and metal products. However, other industries—such as textile and leather products; wood, paper, and paper products; and machinery, electrical, optical, and transport equipment—also rely on Russian inputs in production.
Russian tourism is important for the economies of Bulgaria, Cyprus, and Montenegro.
Construction of the South Stream gas pipeline, which had been scheduled to begin soon, faces substantial additional uncertainty and may be delayed, curtailing infrastructure investment in countries through which it would pass, such as Bulgaria, Hungary, and Serbia. In addition, Western energy companies’ joint ventures in Russia could potentially be disrupted.
Remittances from Russia and Ukraine amount to 8 percent of GDP or more in Armenia, the Kyrgyz Republic, Moldova, and Tajikistan. See Chapter 3.
Russian foreign direct investment exceeds 5 percent of GDP in Belarus, Bulgaria, Moldova, and Montenegro. Financial centers (Cyprus and Luxembourg) also report high two-way foreign direct investment flows with Russia.
2014 SPILLOVER REPORT
20 INTERNATIONAL MONETARY FUND
E. Downside Scenario
14. Although the balance of global risks has improved since the last Spillover Report, important downside risks remain—especially for emerging market economies. As discussed, spillover risks from advanced and emerging market economies remain relevant, can occur together, and can interact going forward. This section provides some quantification of the global effects from key spillovers if downside risks materialized.
15. Downside risks explored here center on a sharp tightening of global financial conditions alongside weaker growth in emerging market economies. A central downside scenario combines two main risk layers relative to the World Economic Outlook (WEO) baseline—modeled using two different model frameworks:15
The first risk layer is a sooner than expected tightening of financial conditions caused by normalization in major advanced economies. To illustrate possible spillovers and risks associated with unexpected monetary tightening, long-term interest rates in the United States and the United Kingdom are assumed to rise by 100 basis points largely through higher term premiums. The trigger could be market or policy led due to, say, financial stability concerns. This asynchronous tightening is transmitted in a differentiated manner to other economies consistent with past evidence for this type of shock. Short-term interest rates increase initially (albeit modestly) as agents anticipate that central banks will hike rates sooner than expected. However, U.S. and U.K. monetary authorities are assumed to move quickly to address market misperceptions, resulting in only a modest (25 basis point) increase for the year.16
The second risk layer is a deeper than expected structural slowdown in emerging markets. An autonomous slowdown of ½ percentage point relative to baseline growth in emerging market economies during the next three years is analyzed, representing a further growth disappointment.17 The unanticipated slowdown is presumed to be structural. That is, it is initially perceived to be cyclical, but as more growth surprises materialize, agents gradually come to realize its structural nature. The initial impulses (lower expected return to capital) are calibrated so that growth slows over this horizon across emerging market economies. For more vulnerable economies in this group (for example, those with high inflation or large current account deficits), limited policy space prevents monetary easing in the first year.
15 The downside scenario is modeled using the IMF’s Flexible System of Global Models and G40—a macroeconometric model. In the former, interest rate shocks are calibrated based on the empirics in Chapter 2 while changes in equity prices and exchange rates respond endogenously based on the model’s structure and stock-flow dynamics. In the G40 Model, asset market price changes are calibrated based on past episodes using event studies (see Annex I). Thus, the two frameworks provide somewhat different approaches to modeling downside risks. 16 It is also assumed that the temporary tightening in short-term market interest rates is transmitted to short-term market rates in other countries according to estimated historical correlations. A different scenario involves earlier than expected tightening led by policy rate hikes, which would have different effects (e.g., yield curve implications). 17 As a point of reference, serial downward revisions to end-point projections for medium-term growth for emerging market economies in WEO forecasts were about ½ percentage point on average between the April 2010 and April 2014 projections (2 percentage points cumulatively).
2014 SPILLOVER REPORT
INTERNATIONAL MONETARY FUND 21
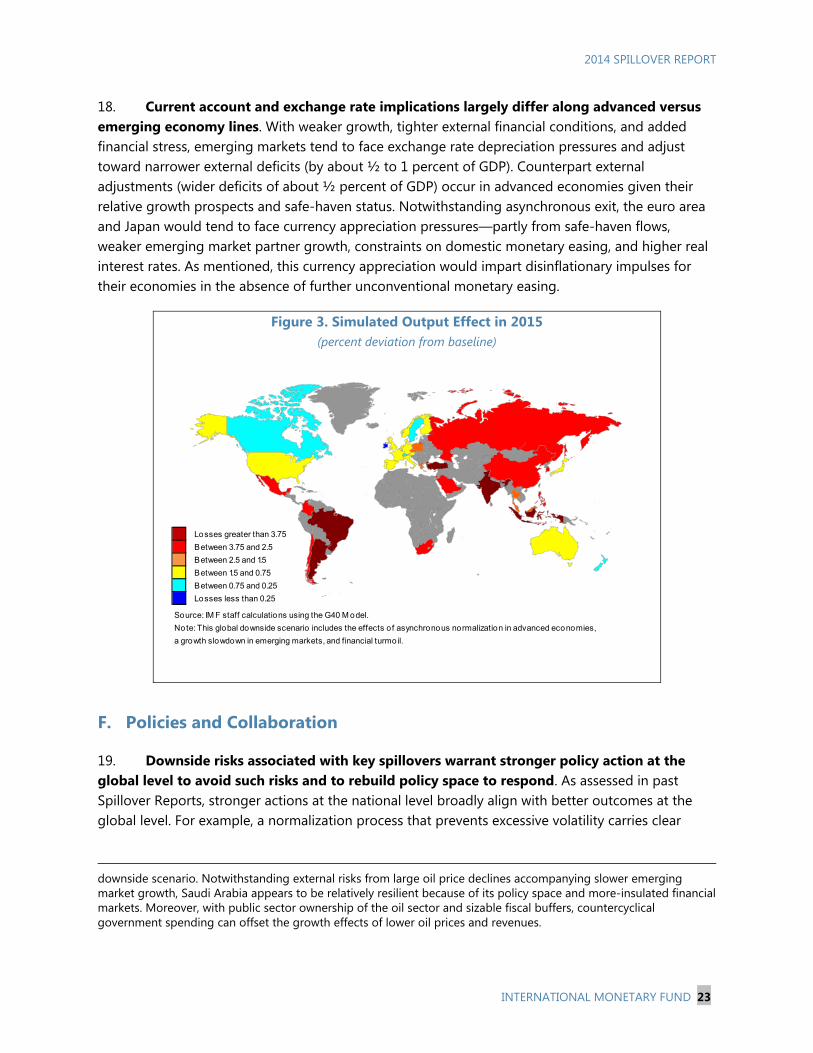
16. Downside risks could also include more intense financial pressures on emerging markets (and elsewhere). Financial turbulence could deepen as emerging market economies’ growth outcomes disappoint. Moreover, risks can be interrelated because markets can reassess growth prospects in the context of less favorable external financing conditions, further intensifying market pressure. Thus, as a third layer, an additional 50 basis point increase in more vulnerable emerging market long-term rates is considered, with equity prices falling endogenously owing to the higher cost of capital and weaker growth.18 See Figure 2 for the incremental effects of these shocks on growth in the Flexible System of Global Models. For comparison, a second approach uses IMF staff’s G40 Model, which calibrates the reactions of key asset market prices based on historical patterns rather than on internal model dynamics.19 See the heat map in Figure 3 for a summary of the output effects from this approach. The two approaches using different models and calibration methods yield broadly similar assessments of the downside scenario, which are summarized below.
Figure 2. Global Downside Scenario (percent deviation in output from baseline; effects are cumulative)
17. The interaction between sharply tightening financial conditions and a structural slowdown in emerging market economies would be damaging for the global economy. At the global level, GDP falls at the trough by roughly 1½−2 percent in the downside depending on the
18 In this report, “vulnerable” economies generally refer to those economies that have typically shown a relatively high degree of sensitivity in their financial or economic variables during past episodes of market stress. 19 Event studies suggest that past emerging market sell-offs associated with disappointing growth performance (controlling for weaker news in advanced economies) are associated with safe-haven flows and lower bond yields in advanced economies and correlated price declines across equity markets. See Annex I.
-1.4
-1.2
-1.0
-0.8
-0.6
-0.4
-0.2
0.0
0.2
13 14 15 16 17 18 19
Euro Area and Japan
-1.4
-1.2
-1.0
-0.8
-0.6
-0.4
-0.2
0.0
0.2
13 14 15 16 17 18 19
Normalization shock in the US and UK Further EM slowdown Additional tightening in EMs
The United States and the United Kingdom
Sources: IMF staff estimates; and IMF, Flexible System of Global Models.
Note: EM = emerging market.
-4.0
-3.5
-3.0
-2.5
-2.0
-1.5
-1.0
-0.5
0.0
13 14 15 16 17 18 19
Vulnerable Emerging Markets
-4.0
-3.5
-3.0
-2.5
-2.0
-1.5
-1.0
-0.5
0.0
13 14 15 16 17 18 19
Other Emerging Markets
2014 SPILLOVER REPORT
22 INTERNATIONAL MONETARY FUND
model framework. Although lower commodity prices act as a stabilizer, adverse effects through trade and financial channels lead to lower activity at the global level. Across country groupings, the implications of the downside would differ along the following key lines:
Advanced economies unwinding monetary support are primarily affected by tightening financial conditions. In the United States and the United Kingdom, tightening financial conditions can forestall future risks but dampen domestic demand (“own” effect).20 External deficits tend to widen, however, given currency appreciation and appreciably weaker growth in emerging market partner countries. Inward spillover effects from a slowdown in external demand are relatively modest. Safe-haven capital inflows and lower commodity prices act as important stabilizers. Consequently, output declines are relatively small—around 1 percent at the trough. However, outward spillovers from tightening financial conditions can be large for more vulnerable emerging markets on a cumulative basis.
More vulnerable advanced economies are affected appreciably by spillovers. With the zero interest rate floor and disinflation, effects are magnified (in particular for the euro area) in the absence of further unconventional easing. Disinflationary pressures intensify through lower commodity prices and weaker external demand. Higher real interest rates reinforce these pressures. Specifically, slowing growth in emerging market economies has a large impact given trade exposures in Japan and the euro area. In the euro area, for example, output falls by about 1½ percent while inflation falls about 1 percentage point at the trough (relative to the baseline).
Vulnerable emerging market economies face amplified spillovers and policy constraints that hurt them more deeply. These economies are both a source of and destination for spillovers in the scenario. The sharpest decline in output is in the first year when the global economy is hit by both tighter financial conditions due to faster U.S. and U.K. normalization as well as an autonomous slowing of emerging economy partner growth. Tightening financial conditions account for roughly half of the initial output decline given constraints on policy to respond caused by lack of space and credibility. Over time, larger output losses (about 3–4 percent relative to the baseline in some cases) largely reflect a durable productivity slowdown, weaker trade in emerging market partners, and lower commodity prices (for exporters).21
20 The 2014 U.K. Article IV Staff Report (IMF, 2014d) analyzes the possible impact of a sharp interest rate increase or “snapback” on leveraged shadow banks, which could affect the global dealer banks at the center of world repo markets, and could, eventually, trigger external deleveraging by global systemically important banks. 21 For Saudi Arabia, medium-term growth projections have been relatively stable compared with noticeable markdowns seen for many other emerging market economies. For comparison purposes, the same growth slowdown is assumed uniformly across emerging market economies to better illustrate relative spillover implications in the
(continued)
-10
-8
-6
-4
-2
0
Spillover-source
advanced economies
(US and UK)
Spillover-recipient
advanced economies (Japan and euro area)
Other spillover-recipient
advanced economies
Vulnerable emerging markets
Remaining emerging markets
Own impactEmerging market spilloversAdvanced economy spillovers
Source: IMF staff estimates.
Spillover Effects in Downside(cumulative contribution to real GDP by 2016; percent deviation from baseline)
2014 SPILLOVER REPORT
INTERNATIONAL MONETARY FUND 23
18. Current account and exchange rate implications largely differ along advanced versus emerging economy lines. With weaker growth, tighter external financial conditions, and added financial stress, emerging markets tend to face exchange rate depreciation pressures and adjust toward narrower external deficits (by about ½ to 1 percent of GDP). Counterpart external adjustments (wider deficits of about ½ percent of GDP) occur in advanced economies given their relative growth prospects and safe-haven status. Notwithstanding asynchronous exit, the euro area and Japan would tend to face currency appreciation pressures—partly from safe-haven flows, weaker emerging market partner growth, constraints on domestic monetary easing, and higher real interest rates. As mentioned, this currency appreciation would impart disinflationary impulses for their economies in the absence of further unconventional monetary easing.
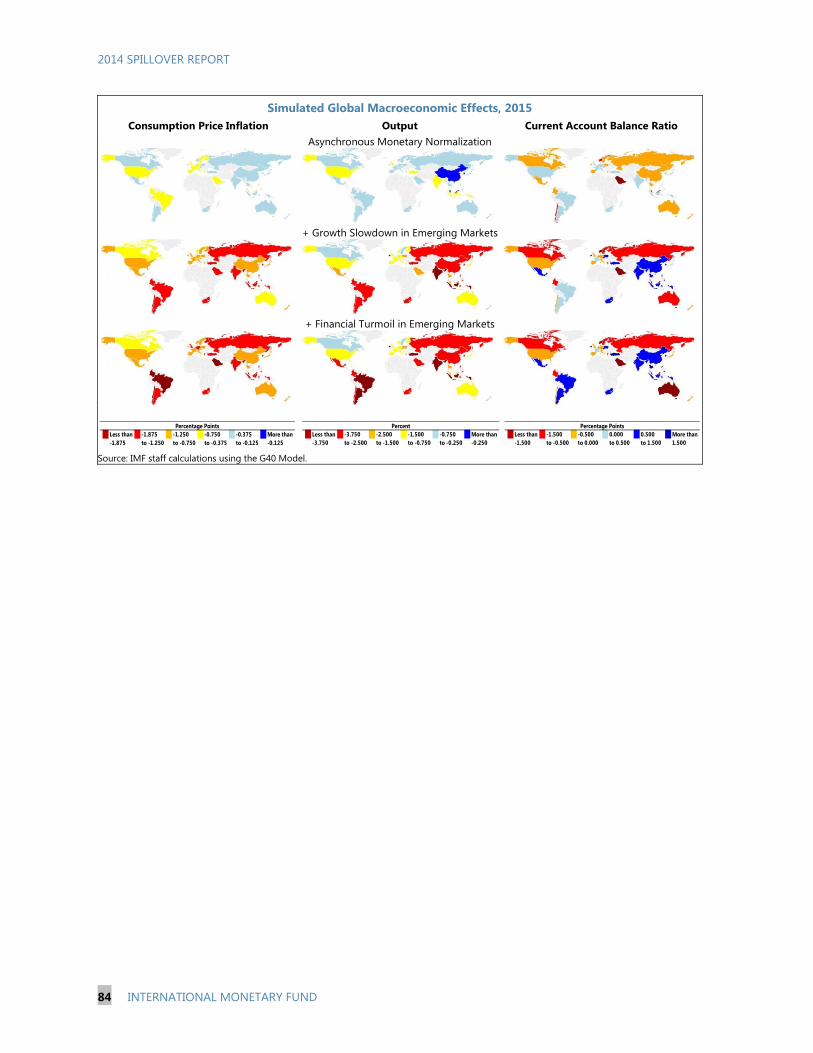
Figure 3. Simulated Output Effect in 2015(percent deviation from baseline)
F. Policies and Collaboration
19. Downside risks associated with key spillovers warrant stronger policy action at the global level to avoid such risks and to rebuild policy space to respond. As assessed in past Spillover Reports, stronger actions at the national level broadly align with better outcomes at the global level. For example, a normalization process that prevents excessive volatility carries clear
downside scenario. Notwithstanding external risks from large oil price declines accompanying slower emerging market growth, Saudi Arabia appears to be relatively resilient because of its policy space and more-insulated financial markets. Moreover, with public sector ownership of the oil sector and sizable fiscal buffers, countercyclical government spending can offset the growth effects of lower oil prices and revenues.
Losses greater than 3.75
Between 3.75 and 2.5
Between 2.5 and 1.5
Between 1.5 and 0.75
Between 0.75 and 0.25
Losses less than 0.25
Source: IM F staff calculations using the G40 M odel.
Note: This global downside scenario includes the effects of asynchronous normalization in advanced economies,
a growth slowdown in emerging markets, and financial turmoil.
2014 SPILLOVER REPORT
24 INTERNATIONAL MONETARY FUND
internal and external benefits (“own” and spillover effects have the same sign). Contours of stronger policy actions differ across economies:
In advanced economies undertaking normalization, well-calibrated communication by central banks has become more critical given multiple objectives and instruments, as well as prevailing uncertainties about growth, inflation, and monetary transmission. To prevent undue market turbulence, a challenge will be to provide clear guidance on policy intentions without encouraging excessive risk taking in markets. To this end, central banks should communicate how monetary policy strategies may change, contingent on developments, and on their views about possible tradeoffs between their mandates and financial stability concerns in a timely manner to avoid one-sided market positioning, high leverage buildups, and excessive credit risks, all of which will require close monitoring.
In more vulnerable advanced economies, susceptibility to adverse spillover effects given low inflation and the zero bound may call for further actions from a risk-management perspective and to raise inflation back to target. The European Central Bank’s recent policy actions signal its determination to address below-target inflation, but if inflation remains stubbornly low, it should consider further unconventional measures.22 Preliminary IMF staff analysis suggests implementing such measures would support growth and inflation through currency depreciation with broadly positive spillovers.23 Monetary accommodation in the euro area should be complemented by further actions to address financial fragmentation, structural gaps, and bank balance sheet repair.
In more vulnerable emerging market economies, strengthening policy frameworks and fundamentals is desirable from a domestic perspective and can mitigate adverse external spillovers, though rebuilding buffers will take time. Stronger fiscal positions would mitigate global shocks, including in some cases by reducing current account deficits. To safeguard stability, capital buffers may need to be built in some economies, especially in banking systems that rely heavily on external funding or that have high corporate vulnerabilities. If high market turbulence were to reemerge, countries would then have some recourse. Many should allow the exchange rate to act as a buffer against external shocks. Where reserves are adequate, intervention can be used to avoid excessive exchange rate volatility and to prevent financial disruption. Macro-prudential and capital flow measures can be stabilizing (although they cannot act as a substitute for needed macro policy adjustment).24
22 Possible courses of further unconventional monetary policy action for the European Central Bank are discussed in the forthcoming Euro Area Article IV Staff Report (IMF, 2014a). 23 Preliminary scenario analysis of unconventional monetary easing in the euro area and Japan suggests dampening of domestic output declines through lower long rates and currency depreciation relative to the downside scenario. These actions would help forestall stronger disinflationary pressures and avoid nonlinear effects from policy constraints at the interest rate floor. Stronger domestic activity generates positive spillovers, on balance, for partner countries, notwithstanding currency depreciation. Larger exchange rate changes may affect some emerging market economies with certain balance sheet exposures (for example, high U.S. dollar liabilities). 24 See Mishra and others (2014).
2014 SPILLOVER REPORT
INTERNATIONAL MONETARY FUND 25
In emerging market economies more generally, renewed attention to structural reform priorities will be important to lift constraints on medium-term growth potential. National priorities differ, but common threads include (1) addressing infrastructure needs, particularly in electricity and transportation (Brazil, India, Indonesia, and Russia); (2) improving education and addressing skills shortages (Russia, South Africa, and Turkey); and (3) enhancing competition and improving the business climate (Brazil, China, Russia, and South Africa).
20. Coordination problems, however, can arise between countries. If stability concerns become apparent, advanced economies may understandably need to signal monetary tightening or take action to tighten sooner than warranted by growth or inflation to prevent larger disruptions later. From a spillover perspective, taking such action would be beneficial because it would safeguard financial stability in systemic economies in the medium term. However, it may exacerbate or accelerate financial problems elsewhere in the near term—notably, in more vulnerable emerging market economies if external financial conditions tighten severely. From an incentive standpoint, the downside scenario indicates that major advanced economies that might impart large outward spillovers are not necessarily those exposed to large inward spillovers. Moreover, possible “spillbacks” (feedback effects) appear modest, at least initially, for some advanced economies (see Box 4). Thus, national-level incentives suggest individual policies will gravitate toward a decided lack of coordination under these circumstances. But inaction with respect to mitigating spillovers can leave key risks unchecked. The possibility that financial turmoil could deepen and widen across emerging markets can generate larger harmful effects later, particularly through correlated equity price declines associated with market sell-offs (see Annex I).
21. Policy collaboration would be beneficial. In light of these considerations, collaboration takes on renewed importance if sharply tighter external financing conditions and slower growth were to conspire to create deeper stress in more vulnerable emerging market economies. Scope for multilateral action would involve insuring against key downside risks or providing support for economies more affected by market or liquidity strains, including through the use of IMF resources. Such multilateral action would be welfare enhancing to the extent that advanced economies could flexibly move toward normalization as needed to safeguard stability, while emerging market economies could insure against risks of deeper and wider financial stress generated by adverse spillovers. Building a shared understanding of these possible spillover repercussions and potential gains from collaboration to mitigate such global risks can help overcome coordination problems.
2014 SPILLOVER REPORT
26 INTERNATIONAL MONETARY FUND
Box 4. What Goes Around Comes Around: Spillbacks from Emerging Markets to Advanced Economies
The larger global role played by emerging market economies means that spillbacks from fluctuations in their growth as a result of shocks in advanced economies may be nontrivial under certain conditions. This box provides illustrative orders of magnitude of spillbacks from emerging markets. The implications of growth shocks in advanced economies are examined in a simple framework. The analysis estimates simple country-wise vector autoregressions (VARs) comprising the growth rate of output in the advanced economy of interest, the weighted average of output growth rates in emerging markets, and a postcrisis dummy variable.1 To estimate the spillback, two different VAR specifications are calculated. In the first specification, growth in emerging markets is allowed to respond freely to the growth shock in the advanced economy in question. In the second specification, growth in emerging markets is not allowed to respond. The difference between the two impulse responses would then reflect the output growth increase (decrease) in advanced economies resulting from a growth upturn (downturn) in emerging markets—the spillback effect. Results suggest significant growth spillovers from advanced economies to emerging markets, of about 50 percent of the increase in output in advanced economies (see Chapter 3). Analysis here suggests that about one-third of this spillover effect in emerging markets returns or spills back to advanced economies. Specifically, average spillbacks to advanced economies are noticeable on average—some 17 percent of the increase in growth in response to their own shock reflects spillbacks to them via emerging markets, more for Japan and the euro area and less for the United States and the United Kingdom. Larger spillbacks (as a ratio of initial spillovers) in Japan and the euro area could be explained by their stronger trade linkages with emerging market economies. For the United States and the United Kingdom, spillbacks from emerging markets are limited because these economies are relatively closed to trade. In normal times, spillbacks appear to be relatively modest. Some caveats for the above results are in order: First, the magnitude of spillbacks appears to be significantly larger as a result of the global crisis, challenging the identification (that is, common shocks versus feedback effects). Second, the model does not capture any issues with policy coordination (or lack thereof) among these economies given the alignment of domestic and spillover effects on output. Overall, preliminary analysis suggests that spillback effects from emerging markets tend to be modest but could be larger in periods of stress—although directionality versus commonality is hard to disentangle.
_____________________________ 1 The country-wise VARs are estimated using seasonally adjusted quarterly data from 1996 through 2013, with two lags based on the Akaike information criterion. The sample of emerging markets is the same as used in Chapter 4 of the April 2014 World Economic Outlook (IMF, 2014e).
United Euro Japan United Average1
States Area Kingdom
EM spillover 58.3 * 59.2* 25.4* 56.3* 52.8
EM spillback 12.4 29.8* 12.7* 7.2 17.4
EM spillback/EM spillover 21.3 50.4 50.1 12.8 34.4
Source: IMF staff calculations.
Note: Estimates for spillovers and spillbacks from a 1 percentage point increase in growth in advanced economies (eight quarters
after impact). 1 Weighted average, with Japan and the United Kingdom given half the weight of the United States and the euro area.
* Significant at the 10 percent level.
Estimated Spillovers and Spillbacks(percent)
2014 SPILLOVER REPORT
INTERNATIONAL MONETARY FUND 27
CHAPTER 2. SPILLOVERS FROM UNWINDING MONETARY SUPPORT IN ADVANCED ECONOMIES As economic prospects in key advanced economies improve, financial conditions will tighten going forward. However, global financial spillovers during the taper episode—which started with the announcement in May 2013 of possible tapering of U.S. Federal Reserve purchases—hinted at potential challenges associated with unwinding monetary support. Financial stability issues, high uncertainty about cyclical positions, and more complex central bank objectives will make communicating and interpreting policy intentions more difficult as the unwinding proceeds. In addition, the recent decline in market volatility and the low term premium may trigger adjustments in asset prices, as happened in the summer of 2013. For source countries, outward spillovers will depend on whether financial conditions are primarily driven by stronger growth, financial stability concerns, or uncertainty about the exit path, and whether they are amplified by market misperceptions of policy intentions. From a recipient’s perspective, spillovers will differ among countries—reflecting interactions between domestic fundamentals and policies with the external shock. Maintaining sound policy frameworks and fundamentals will thus be critical to buffer the impact of the shocks and keep policy space to respond to them—for example, through monetary policy or foreign exchange interventions—as long as macroeconomic fundamentals and the reserve position allow such responses. Finally, an asynchronous exit—with the United States and the United Kingdom moving toward exit while other advanced economies maintain or expand accommodation—may reduce the magnitude of the shock in financial markets more than would occur in a synchronous exit. However, an asynchronous exit may raise issues for some emerging market economies with certain balance sheet vulnerabilities.
INTRODUCTION 1. Given prospects for tightening financial conditions as economic activity strengthens in some key advanced economies (AEs), this chapter analyzes potential spillovers. With global financial conditions poised to tighten further as the recovery in the United States and the United Kingdom firms up, this chapter examines potential spillovers from monetary policy normalization going forward. Spillovers will depend both on how well the process can be managed by major central banks and on the policy frameworks and fundamentals in recipient economies. Last year, the U.S. tapering announcement triggered a sharp re-pricing of risk and was followed by unusually high market volatility. Yields and their volatility increased significantly in other AEs, while emerging market economies (EMs) were hard hit, as local bond yields increased, equity prices declined, and currencies depreciated. Looking forward, the recent decline in market volatility, and the still low term premium compared with historical levels, may trigger sudden adjustments in asset prices and market volatility—akin to the global financial distress experienced last summer—with associated spillovers.
2. The analysis disentangles underlying drivers of financial conditions to better understand the nature of spillovers and policy implications. Using different identification
2014 SPILLOVER REPORT
28 INTERNATIONAL MONETARY FUND
approaches to separate shocks to financial conditions and to explore the role of fundamentals in their transmission, this chapter offers new insights on the underlying factors driving spillovers. This is important from both surveillance and policy perspectives, and helps explain what developments are critical in driving the shocks, which countries are vulnerable, and what policies can help mitigate adverse spillovers.
3. The analysis in the chapter suggests that (i) spillovers from better growth prospects in AEs are positive for global growth; (ii) the unwinding of monetary support could result in adverse spillovers if not driven by higher growth, which may be triggered and/or amplified by communication challenges; (iii) sound fundamentals and policy frameworks in recipient countries can mitigate spillovers; and (iv) the asynchronous nature of the expected normalization could curb stress in asset markets in emerging and frontier markets, but it may be problematic for some economies with certain balance sheet vulnerabilities.
RECENT DEVELOPMENTS AND STYLIZED FACTS A. The Taper Episode: Lessons Going Forward
4. Unconventional monetary policy (UMP) in AEs has supported demand after the global crisis, but term premium compression raises financial stability concerns. UMP helped restore market functioning, strengthened financial intermediation, and reduced long-term interest rates—effectively flattening the yield curve and supporting growth.1 Following the global financial crisis, the introduction of asset purchase programs in major central banks expanded their balance sheets and prompted a sharp fall in the term premium embedded in long-term yields. In the case of the United States, the term premium fell to negative territory in 2011, in contrast with a mild fall during the easing cycle in the 1990s and even an increase during the early 2000s. The prolonged period of low interest rates created incentives to search for yield—increasing leverage, and taking excessive credit and duration risk—bringing financial stability issues to the forefront during the spring of 2013.
5. The May 2013 announcement of possible tapering of U.S. Federal Reserve purchases revealed potential challenges to the forthcoming normalization of monetary policy. The
1 The Federal Reserve implemented its Large-Scale Asset Purchase (LSAP) Program in 2008. The Bank of England launched its Asset Purchase Program in 2009, and the Bank of Japan implemented its program in 2010, then increased its size in 2013. The European Central Bank has conducted asset purchases since 2010, but the amounts have been negligible, and purchases have been largely sterilized. See IMF (2013a, 2013b, 2013c), Filardo and Hofmann (2014), and Rogers, Scotti, and Wright (2013).
-2
0
2
4
6
8
10
90 92 94 96 98 00 02 04 06 08 10 12
Term premium 10-yr bond yield
6/4/2014
Sources: Bloomberg, L.P.; and IMF staff calculations.1Based on Kim and Wright, 2005 decomposition.
Decomposition of Long-Term Yields1
(percentage points)
-1.0
-0.5
0.0
0.5
1.0
1.5
2.0
2.5
1990–1993 2001–2004 2007–2013
Initial End
Term Premium During Easing Cycles in the UnitedStates1
(percent)
2014 SPILLOVER REPORT
INTERNATIONAL MONETARY FUND 29
announcement triggered significant volatility amid a re-pricing of risk and capital flow reversals in some EMs, with the term premium in 10-year instruments increasing by about 100 basis points in the United States during the summer, and by a similar amount around the world. This volatility was likely associated with an unanticipated policy turning point amid one-sided market positioning in which expectations about future interest rates—and implied volatility in option prices—were falling rapidly. The event also raised uncertainty about the Fed road map going forward, both in terms of agents’ expectations about the path of monetary tightening and the Fed purchases.
6. In this context, compared with previous monetary cycles, the global crisis and the introduction of UMP bring about two important policy lessons:
A key lesson is that central banks’ policy objectives have become more complex, making communications more challenging. The global crisis revealed that, in the years preceding it, significant financial imbalances developed under stable output gaps and prices. This has raised concerns that price stability—the overriding monetary policy objective—is not a sufficient condition for macroeconomic stability, and that there may be tensions between central banks’ mandates and financial stability objectives.2 The potential conflict in central bank’s objectives—amplified by the need to manage multiple policy instruments—adds complexity to communication going forward. This is compounded by uncertainty about economic slack, inflation pressures, and monetary transmission mechanisms.
Another lesson is that due to more complex objectives, markets may misperceive central banks’ policy intentions. During the summer of 2013, adjustments in long-term yields associated with a re-pricing of risk took place together with an increase in future short-term rates, suggesting that market players struggled to read the Fed’s policy intentions. In fact, the correlation between expected short-term rates and the term premium on 10-year U.S. Treasury instruments increased sharply after the introduction of UMP. The correction in short-term rates after the September “no-taper” announcement suggests that market participants got a better understanding of the Fed’s policy intentions by the fall.
2 See Bayoumi and others (2014). This is related to central banks’ challenges in terms of exit. At any point, higher interest rates may have a negative impact on activity, while low term premiums or delayed monetary tightening may contribute to the building of financial imbalances that could affect economic activity down the road.
40
50
60
70
80
90
100
110
120
130
2010 2011 2012 2013
Implied U.S. interest rate volatility (MOVE index)
Implied Volatility(basis points)
6/4/2014
5/22/2013 9/18/2013
Source: Bloomberg, L.P.
0.0
0.2
0.4
0.6
0.8
1.0
1.2
1.4
0.0
0.5
1.0
1.5
2.0
2.5
3.0
3.5
Jan-13 May-13 Sep-13 Jan-14 May-14
10-year treasury bond 3-month eurodollar futures June 2015 (RHS)
10-Year Treasury and Short-Term Rates1
(percent)
Sources: Bloomberg, L.P. ; and Kim and Wright.1Based on Kim and Wright, 2005 decomposition for 10-year instrument.
6/4/2014
2014 SPILLOVER REPORT
30 INTERNATIONAL MONETARY FUND
7. Going forward, the recent decline in market volatility and the still low term premium point to potential risks. The evolution of implied volatility in options on Treasury bonds suggests that the spike triggered by the taper episode has gradually faded. In fact, volatility has currently reached levels seen in early 2013. At the same time, even after last year’s adjustment, long-term interest rates—and the term premium—still look relatively low compared with historical levels. While low rates and volatility are part of UMP’s intention to raise growth, over a long period these may contribute to a rapid build-up of leveraged positions and credit risk, which may eventually trigger an increase in market volatility in case there is a sudden adjustment of expectations. Potential adjustments in the term premium—as happened last year—are particularly relevant in the context of the expected rise in policy interest rates away from the zero lower bound as economic prospects improve in AEs.
B. Spillovers
8. The taper episode had an impact on financial markets in AEs. Forward money market rates in Europe rose rapidly, and the forward Euro Over-Night Index Average (EONIA) curve steepened at the announcement of tapering (Annex II). The introduction of forward guidance in the United Kingdom and the euro area reduced volatility and flattened the curve during the summer of 2013 (Annex III), but spreads continued to rise through September. The “no taper” announcement reduced pressures in European money markets. Spillovers were apparent in sovereign yields as well; an event study shows that yields increased after May and fell in September (see Annex II). Finally, the volatility in U.K. and euro area long-term yields presented the same dynamics over the summer of 2013.
9. In EMs, the adjustment following the taper episode represented, to some extent, a reversal of previous trends. By April 2013, long-term yields in a number of EMs were compressed, reaching historically low levels. Following the taper announcement, larger rebounds in yields took place in markets that experienced larger compression before, suggesting that this was in part associated with the search for yield in response to low interest rates in AEs (see Annex II). The evidence on inflows and outflows from EM bond funds also suggests that the reversal of capital flows after the tapering announcement was in part associated with previous inflows (see Annex II).
10. Strong fundamentals and sound policy frameworks reduced the impact of spillovers and increased the policy space to respond to them, including exchange rate intervention. In some economies, relatively strong balance sheets and low exchange rate pass-through to inflation allowed for exchange rate flexibility to mitigate spillovers. On the other hand, the evidence since May 2013 suggests that countries with higher current account deficits and inflation rates have experienced a stronger increase in yields and larger exchange rate depreciations (Annex IV).3 These countries have hiked policy interest rates more aggressively amid pressures in foreign exchange 3 However, it is not clear that the role of fundamentals is symmetric under easy global conditions. It has also been noted that market liquidity is important, especially following the initial shock (Eichengreen and Gupta, 2014). This would raise the risk of contagion for markets that appear to have good fundamentals.
2014 SPILLOVER REPORT
INTERNATIONAL MONETARY FUND 31
markets (see Annex IV). In terms of policy responses, the experience during the taper episode suggests foreign exchange intervention can buffer spillovers. Preliminary IMF staff analysis based on a sample of 49 EMs finds that intervention has been most effective when inflation is low, the currency is not overvalued, and international reserves are assessed as adequate.4
11. A key lesson from the taper episode is that the source of tightening financial conditions and the transmission channels are critical for understanding spillovers. The adjustment in financial conditions triggered by last year’s tapering announcement was followed by unusually acute volatility in financial markets. Historically, tightening monetary conditions due to better economic prospects has not been coupled with such uncertainty and large re-pricing of risk. This suggests that understanding potential spillovers from the unwinding of UMP calls for differentiating between shocks to financial conditions from real developments—that is, growth prospects or risk appetite—and shocks from monetary developments. The role played by fundamentals in the transmission of shocks to recipient economies also deserves attention. Both issues are analyzed in the following section.
SHOCKS, TRANSMISSION CHANNELS, AND SPILLOVERS 12. While monetary policy normalization should be a healthy global development as growth firms up in key AEs, there could be adverse spillovers. Global yields will rise with monetary normalization proceeding as the economic outlook improves. While this tends to tighten financial conditions across the globe, the accompanying growth impetus should potentially offset the negative spillovers through higher external demand. However, the experience in mid-2013 has revealed challenges for exiting from an extended period of monetary stimulus. Further uncertainty about the spillovers from the exit stems from the asynchronous nature of the exit across key AEs, as still-large output gaps are not projected to normalize any time soon.
13. Spillovers are a combination of the underlying shocks in source economies and local conditions in destination economies. Several authors have stressed the relevance of domestic policy frameworks and fundamentals for buffering or amplifying external shocks, including conventional monetary shocks (Broda and Tille, 2003; di Giovanni and Shambaugh, 2008; Towbin and Weber, 2013; Georgiadis, forthcoming). However, spillovers from unconventional monetary policy may be different because of their direct impact on term premia (Fratzscher, Lo Duca, and Straub, 2013; Lo Duca, Nicoletti, and Martinez, 2014; OECD, 2014).
4 The methodology follows Adler and Tovar (2011). A first-stage regression estimates the central bank’s intervention policy reaction function, and a second-stage regression measures the impact of intervention on the exchange rate.
2014 SPILLOVER REPORT
32 INTERNATIONAL MONETARY FUND
A. Drivers of Yield Increases
14. Vector autoregression (VAR) analyses, complemented by event studies, are used to disentangle underlying shocks, analyze their transmission, and inform scenario analysis. Two methods are applied to derive the underlying shocks. Both methods use the information contained in long-term bond yields and stock prices to distinguish shocks driven by money factors from those driven by real factors. The intuition behind the approaches is simple: while positive (tightening) money shocks push up yields and depress stock prices, positive “real” shocks increase both yields and stock prices (see Annex V for details).5 By using long-term yields instead of short-term rates in the analyses, both approaches consider a broader concept of money shocks that encompasses both conventional and unconventional monetary policy shocks, but also exogenous shocks to the term premium, shifts in portfolio preferences toward higher demand for cash away from bonds and equity, and potential upward surprises in inflation unrelated to improved demand. At different times, different factors will be dominant.
15. The results suggest that the increase of U.S. yields since May 2013 is due to better economic prospects. In the aftermath of the tapering talk, money shocks dominated, adding about 20 basis points to the yield in May and another 30 basis points in June (Figure 1). Shortly before the September “no taper” announcement the contribution from money shocks accounted for about 60 percent of the total 100 basis point increase. The subsequent actual taper announcement in December 2013 had no further impact on yields, and has been perceived as confirmation of a better economic outlook. Starting in early 2014, yields declined in line with the falling contribution from the money shock. By end-May 2014, real shocks accounted for the entire 60 basis point increase in U.S. long term yields since May 2013.
Figure 1. Drivers of U.S. 10-Year Treasury Bond Yield (Percentage points; change in 10-year Treasury bond yield since May 21, 2013)
5 Unlike typical event studies, the event study in this section selects specific days based on sign restrictions rather than policy announcements. It has the advantage of being free of parametric assumptions. On the other hand, the VAR procedure allows a more nuanced decomposition of bond yield changes into money and real shocks.
Sources: Haver Analytics; and IMF staff calculations.
2014 SPILLOVER REPORT
INTERNATIONAL MONETARY FUND 33
16. In Japan and the euro area, country-specific factors counter-balance upward pressure on yields from common global money and real shocks in line with asynchronous exit. Extracting the common components from money and real shocks of the individual systemic four (S4) countries (the euro area, Japan, the United Kingdom, and the United States), allows for a decomposition of their respective yield increases into idiosyncratic and common money and real factors. This decomposition reveals that for the United States, the United Kingdom, and the euro area, common factors have put similar upward pressure on yields, while the corresponding pressure on Japanese yields from common factors has been less than a third, also reflecting the much lower yield level in Japan (Figure 2). The asynchronous exit is reflected in the substantial negative idiosyncratic contribution to yields in Japan and the euro area, while the respective idiosyncratic factors in the United States and the United Kingdom are positive.
Figure 2. Drivers of S4 10-Year Bond Yields (Shock decomposition; percent)
B. Spillover from Yield Increases
17. Spillover implications of S4 real and money shocks are analyzed using VARs. To estimate the impact of real and money shocks on several key variables in the destination economies,
1.4
1.6
1.8
2.0
2.2
2.4
2.6
2.8
3.0
3.2
-0.6
-0.4
-0.2
0.0
0.2
0.4
0.6
0.8
1.0
1.2
1.4
May-13 Jul-13 Sep-13 Nov-13 Jan-14
Idiosyncratic contribution10-year bond (RHS)
2/28
United Kingdom
1.3
1.5
1.7
1.9
2.1
2.3
2.5
2.7
2.9
3.1
-0.6
-0.4
-0.2
0.0
0.2
0.4
0.6
0.8
1.0
1.2
May-13 Jul-13 Sep-13 Nov-13 Jan-14
Global money shock contributionGlobal real shock contribution
2/28
United States
0.3
0.5
0.7
0.9
1.1
1.3
1.5
1.7
1.9
2.1
-0.6
-0.4
-0.2
0.0
0.2
0.4
0.6
0.8
1.0
1.2
May-13 Jul-13 Sep-13 Nov-13 Jan-14
2/28
Japan
2.0
2.2
2.4
2.6
2.8
3.0
3.2
3.4
3.6
3.8
-0.6
-0.4
-0.2
0.0
0.2
0.4
0.6
0.8
1.0
1.2
May-13 Jul-13 Sep-13 Nov-13 Jan-14
2/28
Euro Area
Sources: Bloomberg L.P.; and Haver Analytics.Note: S4 = systemic four (euro area, Japan, United Kingdom, United States).
2014 SPILLOVER REPORT
34 INTERNATIONAL MONETARY FUND
the dynamic interaction between the dependent variables ( ,i tY ) and external shocks ( tX ) is modeled using a panel VAR, estimated with monthly data. Specifically:
, , , , , ,1 0
L L
l D li t i t i t l i t i t l i t
l l
Y A Y B X . (1)
The dependent variables include the local long-term sovereign bond yields, the nominal effective exchange rate, and industrial production.6 The external shocks are the S4 money or real shock.7 For the baseline case, coefficients are held constant across countries and time such that ,
l li tA A and
,l li tB B . The unbalanced panel consists of small AEs, which are not part of the S4, and EMs
spanning the period from January 2001 to December 2013.8
18. The VAR results show that money and real shocks have very different spillover implications (Figure 3). Money shocks cause a significant co-movement in long-term bond yields.9 As capital flows out of emerging economies, currencies depreciate, stock prices fall, and industrial production declines.10 The real shock implies a much lower co-movement of yields.11 Mild capital inflows push the exchange rate of EMs up, supporting higher stock market prices and industrial production.12 Hence, the real shock has an overall benign spillover on EMs while the money shock has adverse spillovers on EMs.13
6 Two alternative specifications are used in which industrial production is replaced with the stock price index or the sum of equity and bond net-capital-inflow to GDP ratio. Data are taken from IMF, International Financial Statistics, Bloomberg L.P., and EPFR Global. 7 The shocks are based on sign-restricted VARs and common factor analysis, as described in Annex V. To convert the shocks, which are identified at daily frequency to monthly frequency, the sum is taken over the shocks in the respective month. Using monthly data for the initial shock identification estimation yields comparable results. 8 The effective sample varies depending on the specification. 9 The average yield increases in the first quarter in EMs are close to 70 basis points for a 100 basis point initial shock, and declines to an average yield increase in the first 12 months of about 35 basis points. 10 The standard deviation of (annualized) growth in industrial production in the sample is about four to six times larger than the average standard deviation in EM output growth. Thus, the approximate implied output response would be ½ to ¾ percent. 11 Average yields increase little after three months for a 100 basis point initial shock, and start rising slowly to an average yield increase in the first 12 months of about 15 basis points. 12 Annex VI provides a further decomposition of the real shock, showing that it can be understood as a combination of growth and risk-on shocks. Growth shocks increase yields and reduce stock market prices in recipient countries, as capital flows from recipient to source countries, depreciating the former’s exchange rates. The depreciation together with the higher growth in recipient countries pushes up external demand, mildly boosting industrial production. Risk-on shock reduces yields in recipient countries, as capital flows from source to recipient countries, appreciating the latter’s exchange rates, and increasing stock market prices and industrial production. Hence, the overall effect—the real shock—is a combination of the two shocks, unambiguously increasing industrial production in recipient countries. The effect on stock prices, exchange rates, and capital flows is an empirical question. 13 This result is true for all countries in the sample when we allow responses to vary with country characteristics (see Section C). While some EMs benefit significantly less from real shocks than others, the response of output is positive for all countries.
2014 SPILLOVER REPORT
INTERNATIONAL MONETARY FUND 35
Figure 3. Spillovers to Emerging Market Economies from S4 Shocks1 (Average responses in the first 12 months to initial 100 basis point shock)
19. The event study analysis suggests spillovers from money shocks that are comparable to the ones found by the VAR. Average spillovers from U.S. money shocks, identified using the complementary money shock measure from event studies, are similar.14 The average spillover to EMs from a rise in U.S. yields by 100 basis points is about 70 basis points, in line with the average correlation in the first three months for the response to the VAR shock for EMs. The corresponding fall in stock markets in the event study is somewhat below the response after three months in the
14 Events assigned through sign restrictions using a centered two-day window show that positive money shocks are associated with rising long-term bond yields and falling equity prices in the United States, while the dollar appreciates in nominal effective terms, and vice versa for negative money shocks. The estimates indicate large, moderate, and small long-term bond yield increases, equity price reductions, and currency depreciations with respect to the dollar for internationally financially integrated EMs, other AEs, and other EMs, respectively.
Source: IMF staff calculations.Note: NEER = nominal effective exchange rate; S4 = systemic four (euro area, Japan, United Kingdom, United States).1Responses to both shocks are significant over several months following the shock.
0
5
10
15
20
25
30
35
40Money
Bond Yield(basis points)
-1.5
-1.0
-0.5
0.0
0.5
1.0
1.5
2.0Real
NEER(percent change; += appreciation)
-4
-3
-2
-1
0
1
2
3
4
5
6 Industrial Production(percent change)
-15
-10
-5
0
5
10
15
20 Stock Price Index(percent change)
2014 SPILLOVER REPORT
36 INTERNATIONAL MONETARY FUND
VAR, suggesting some delayed amplification effects. Regarding the exchange rate, event studies suggest instead a higher response than the VAR, likely reflecting overshooting in the short run.15 Spillover estimates for the money shock in the context of this VAR analysis and event study are within the range of estimates based on earlier studies looking at spillovers to EMs from conventional monetary policy shocks.16
C. The Role of Local Transmitters
20. The average response across EMs masks potential variation across countries, as policies can act as shock absorbers or amplifiers. Both policy frameworks and fundamentals can trigger different responses in the recipient countries. For instance, countries with tightly and effectively managed capital controls should not experience the same pressure on domestic bond yields or exchange rates in response to a global money shock, since limits on capital flows restrict the responsiveness of domestic financing conditions.
21. Both panel-interactive VAR and event studies are used to gauge the role of domestic fundamentals in transmitting the global money shock to the economy. Cross-country variation is accounted for by extending the regression framework in equation (1) and allowing country responses to depend on fundamentals, formally reflected by , ,
l li t i tA A F and , ,
l li t i tB B F , where
,i tF are time-varying country fundamentals.17 While the panel VAR results contrast the response at various horizons of the variables of interest at a monthly frequency, the event study results contrast the impact for a symmetric two-day window.18
22. Empirical results suggest that key fundamentals can dampen the response to external money shocks.19 Event study results, based on U.S. monetary events, reveal that in EMs with relatively strong fundamentals, yields have generally reacted less to spillovers (Figure 4).20 Higher reserves, lower inflation, a higher current account balance, deeper financial markets, and stronger
15 When accounting for the flexibility of the exchange rate regime, the two approaches yield more comparable results. 16 Mackowiak (2007) finds larger average responses for short-term rates, the exchange rate, and output for EMs, and cross-country variation in line with openness, exchange rate regime, and proximity to the United States. Georgiadis (forthcoming) finds output responses ranging between 0 and –1.5 percent for individual countries, averaging roughly –0.5 percent, in response to a 100 basis point conventional money shock in the United States. Kim (2001) finds a smaller impact on the other G7 members of roughly –0.4 percent. 17 For the event study, no lagged dependent variables are included in the estimation ( , 0l
i tA and L=0). 18 In both cases, we consider one fundamental at a time, for the baseline regression. 19 Based on yet another identification scheme, Georgiadis (forthcoming) similarly finds several fundamentals to matter for the transmission of money shocks. See also Eichengreen and Gupta (2014). 20 Events include Federal Open Market Committee Meetings and releases of the minutes from January 2013 to January 2014 associated with statistically significant yield increases and stock market declines in the United States (Mishra and others, forthcoming).
2014 SPILLOVER REPORT
INTERNATIONAL MONETARY FUND 37
underlying growth all help mitigate adverse spillovers from tighter global financial conditions.21 VAR results corroborate these findings (Figure 5). Such country characteristics can also account for the narrowing of frontier market spreads to EMs prior to the rise in AE long-term yields that started in 2013 and their relative performance thereafter (Box 1). Furthermore, VAR results suggest that countries with floating exchange rate regimes, by allowing their currencies to adjust, buffer the global money shock, and long-term yields move by less. The more limited impact on domestic financial conditions and depreciated exchange rates boost net exports and mitigate the negative impact on industrial production. Money shocks have larger effects on yields in countries with more open capital accounts, while yields move by less in countries with closed capital accounts, which mitigates somewhat the impact on output.
Figure 4. Effect of Fundamentals on Emerging Market Bond Yields, Two-Day Change (Percentage point change for one standard deviation difference from the mean, annualized)
23. The largest spillovers to EMs have occurred during turning points in source economies. The taper talk events had large spillovers to EMs, with significant movements in equities, yields, and exchange rates (Chen, Mancini-Griffoli, and Sahay, forthcoming). Event study results show that the purchase phase (QE1) had broadly comparable spillovers, although the bond yield response in EMs appears to have been stronger for the taper events than for QE1 (Figure 6). Both events have been turning points for policies, with relatively significant impact on yields in the source country.
21 See also Chen, Mancini-Griffoli, and Sahay (forthcoming). Other studies have shown that countries with stronger fiscal positions, also by reducing external deficits, are less vulnerable to external shocks (Jaramillo and Weber, 2013).
-3
-2
-1
0
1
Reserves/GDP Inflation Current account/GDP Credit/GDP Marketcapitalization/GDP
GDPgrowth
1-year aheadconsensus
Macro-prudential
Change in yields
Sources: IMF staff calculations; and Mishra and others (forthcoming).
2014 SPILLOVER REPORT
38 INTERNATIONAL MONETARY FUND
Figure 5. Average Response of Emerging Market Economies to S4 Money Shocks
Source: IMF staff calculations.Note: CA = current account; IP = industrial production; KA = capital account; NEER = nominal effective exchange rate; S4 = systemic four (euro area, Japan, United Kingdom, United States). For each variable, a "low" value refers to the 20th percentile and a "high" value to the 80th percentile value of the respective fundamental's distribution in the sample.
Exchange rate flexibility Inflation CA balance KA openness
IP(p
erce
nt)
2014 SPILLOVER REPORT
INTERNATIONAL MONETARY FUND 39
Box 1. The Effect of Global Financial Conditions on Sub-Saharan Africa Frontier Markets Sub-Saharan Africa (SSA) frontier markets have benefited from easy global financial conditions over the last five years through increased capital inflows, as investors expanded their portfolios in search for yield. Five frontier economies in SSA issued international sovereign bonds for the first time (Namibia in 2011; Nigeria in 2011; Zambia in October 2012; Rwanda in April 2013; and Tanzania in May 2013). Foreign investors also increased participation in SSA’s domestic currency bond markets. Similar to emerging market economies (EMs), SSA frontier markets have experienced a reversal of capital flows since May 2013. Sovereign spreads of frontier markets, after an initial compression in 2012, have on average moved in line with those of EMs, but have been systematically larger. The correlation of average daily spreads of frontier and emerging markets is about 0.90, and the average difference is about 200 basis points between March 2012 and March 2014. Since May 2013, sovereign yields have increased by about 100 basis points, mainly reflecting an increase in the 10-year U.S. yield. Higher fiscal deficits and relatively lower international reserves contribute to the difference between SSA sovereign spreads and those in other EMs. The relative ranking of sovereign spreads in SSA matches closely with that of the fiscal deficits in 2013. This apparent pricing of the fiscal deficit in sovereign spreads is consistent with the sharp increase in sovereign spreads in Ghana and Zambia during 2013. The large deterioration in the fiscal deficit in Zambia between 2012 and 2013 and the high deficit in Ghana explain the relative higher increase in the yields of those two countries. 1
The corresponding foreign exchange market pressure has led to currency depreciation, reserve losses, or both, depending on prevailing exchange rate arrangements. The strongest pressure was felt in Ghana, the frontier SSA country with the highest fiscal deficit. Ghana’s currency depreciated by over 20 percent from mid-May 2013 to end-January 2014 and reserves fell by about 10 percent. On the other hand, in Nigeria, the pressure was felt mostly on reserves. ____________________________ 1 Controlling for common time effects, panel data regressions of sovereign spreads on fiscal deficits and international
reserves for up to 22 countries— including emerging, SSA frontier, and other markets with available annual data over 2006-13—support the relevance of fiscal positions for the pricing of spreads.
200
300
400
500
600
700
Jan-12 Jan-13 Jan-14
Emerging marketsSub-Saharan Africa frontier markets
Emerging and Frontier Market Spreads(basis points)
Source: Bloomberg, L.P.
3/19/2014
0
2
4
6
8
10
12
0
100
200
300
400
500
600
700
GHA ZMB TZA SEN RWA NGA
Spreads (LHS)Fiscal Deficits (RHS; percent of GDP)
Sources: Bloomberg L.P.; and IMF, World Economic Outlook.Note: GHA = Ghana; LHS = left-hand scale; NGA = Nigeria; RHS = right-hand scale; RWA = Rwanda; SEN = Senegal; TZA =Tanzania; ZMB = Zambia.
Sub-Saharan Africa: Sovereign Spreads and Fiscal Deficits, 2013(basis points)
2014 SPILLOVER REPORT
40 INTERNATIONAL MONETARY FUND
SCENARIO ANALYSIS AND POLICY IMPLICATIONS
A. Scenario Analysis
24. Informed by the empirical analysis, scenarios focus on the role of policies in source and recipient economies in mitigating spillovers ahead. Based on the analysis in the previous section, scenarios are calibrated using country-specific correlations associated with money shocks for negative spillovers, and account for the role of fundamentals in recipient countries in the transmission of shocks.22
25. Three independent spillover scenarios are generated with the G20MOD.23,24 The first scenario reflects upside risks, assuming a faster-than-expected recovery in economic activity in the United States and United Kingdom over the baseline. The other two scenarios reflect bumpy exits: (i) an increase in term premium over the baseline, and (ii) in addition to a higher term premium, an
22 The calibration is based on countries’ responses in the first quarter to a combined U.S.-U.K. money shock. Country-specific values are obtained by allowing coefficient estimates in equation (1) to vary with a country’s capital account openness, exchange rate regime, and level of inflation, where higher capital account openness and inflation increase and a flexible exchange rate decreases co-movement of bond yields in source and recipient countries. 23 The G20MOD is a module in the Flexible System of Global Models (FSGM). It is an annual, multi-region, general equilibrium model that combines both micro-founded and reduced-form formulations of various economic sectors. It has a fully articulated demand side, and some supply-side features. International linkages are modeled in aggregate for each country/region. 24 For comparison, the same scenarios are simulated with the G-40 Model, calibrated using event studies (Box 2).
Figure 6. Taper and Quantitative Easing Yield Change in the United States and Its Spillover to Emerging Market Economies
Sources: IMF staff calculations; and Chen, Mancini-Griffoli, and Sahay (forthcoming).Note: QE = quantitative easing; UMP = unconventional monetary policy.
0
5
10
15
20
25
30
-54 -40 -26 -12 5 19 33 47(basis point)
Histogram: Change in U.S. 10-Year Sovereign Bond Yield(frequency)
Taper talk (May 22, 2013)
Taper talk(June 19, 2013)QE 1
(Dec. 16, 2008)
QE 1(March 18, 2009)
82 percent
-2
-1
0
1
2
3
Equity Bond yield Exchange rate
UMP Taper UMP Taper Talk
UMP Taper and UMP Taper Talk(average response, percent change)
-2
-1
0
1
2
3
Equity Bond yield Exchange rate
UMP Purchase UMP QE1
UMP Purchase and UMP QE1(average response, percent change)
2014 SPILLOVER REPORT
INTERNATIONAL MONETARY FUND 41
increase in market interest rates triggered by misperceptions about future policy (see Box 3 for monetary policy normalization issues in the United States). In these asynchronous exit scenarios, the money shocks take place in the United States and the United Kingdom. The euro area, which is in a different cyclical position, uses the space it has for conventional monetary policy and implements UMP that reduce the term premium in long-term instruments, partially counteracting higher yields from the money shock.25 Finally, Japan continues to implement quantitative and qualitative easing, as envisaged in the baseline.
26. Scenario 1: A stronger than expected recovery in the United States and United Kingdom would benefit global growth. In this scenario, monetary tightening results from an endogenous 100 basis point policy rate increase in response to a stronger-than-expected recovery in growth in the United States and United Kingdom. The scenario also assumes that a faster recovery in these countries prompts an increase in risk appetite that reduces money market rate spreads in EMs, especially during the initial years. The policy response in recipient countries depends on the initial impact of the increase in external demand and the initial conditions in the economy. In particular, it is assumed that there is no tightening in monetary policy in response to stronger external demand in countries with negative output gaps. Long-term interest rates are only affected by the expectations channel—that is, there is no change in the term premium—which makes the impact small. The scenario suggests that GDP in the rest of the world —that is, excluding the United States and United Kingdom—will remain above the baseline until 2017 (Figure 7). Cumulative GDP in the rest of the world will be almost 1.6 percent higher than in the baseline by 2019. While all countries in the sample would experience a positive demand shock, the scenario suggests that countries with the strongest trade linkages with the United States and United Kingdom would benefit the most.26
27. Scenario 2: A bumpy exit as the term premium converges more rapidly to the medium-term baseline due to financial stability concerns. As shown in the recent developments and stylized facts section, the term premium in 10-year U.S. Treasury instruments is still low compared with historical levels, which creates uncertainty about the path of the term premium in the future. In this scenario, adjustments in the term premium are triggered by policy statements that lead to a change in market perceptions of central banks’ concerns about financial stability.27,28 These
25 The calibration is based on countries’ responses in the first quarter to a euro area money shock, derived as described in the shocks, transmission channels, and spillovers section. Country-specific values are obtained by allowing coefficient estimates in equation (1) to vary with the country characteristics described in footnote 22. Exchange rate flexibility, though, is assessed against the euro in this case. 26 This is consistent with the findings for the real shock in the shocks, transmission channels, and spillovers section, which shows a positive response of industrial production in all countries when allowing responses to vary with country characteristics. 27 In general, adjustments in the term premium could be related to increasing central bank concerns about financial stability, uncertainty about the path for normalization of monetary policy, or changing perceptions about the AEs’ recovery. Following Cagnon and others (2010), IMF (2013d) shows that the U.S. term premium depends on macroeconomic fundamentals, financial market volatility, and market expectations about the Fed’s balance sheet.
2014 SPILLOVER REPORT
42 INTERNATIONAL MONETARY FUND
concerns may be related to market positioning suggesting excessive risk-taking, as occurred before the taper episode. This is particularly relevant now, as similar one-sided positions have been taking place again during recent months—see the recent developments and stylized facts section—in a context in which the lift-off from the zero lower bound is likely more imminent than a year ago amid still-low term premiums.29
28. The increase in the term premium would have a negative impact on the cost of finance for households, firms, and the public sector, with a resulting negative impact on output. To illustrate possible spillovers, the scenario assumes an increase in the term premium of 100 basis points, which directly feeds into long-term government bond yields in the United States and United Kingdom as well as into the long-term rates faced by households and firms. The euro area implements UMP that reduces the term premium in long-term bonds in countries in the area by 25 basis points. Overall, this will trigger a 70 basis point increase in long-term yields in the rest of the world—the impact on long-term bond yields in individual countries will depend on identified empirical correlations described above—even if countries counteract part of the tightening by adjusting their monetary policy stance as a response to the negative impact of global financial conditions on growth (Figure 8, red line).30 At the peak—2015—the deviation in GDP compared with the baseline would reach a combined negative 0.6 percent in the United States and the United Kingdom and a negative 0.2 percent in the rest of the world. Overall, the cumulative loss in GDP by 2019 in the rest of the world would be about 0.6 percent relative to the baseline.
29. Scenario 3: In addition to the higher term premium, miscommunication or misperception of policy intentions may trigger larger spillover effects. In this scenario, market participants misperceive central banks’ concerns about financial stability and assume that the more hawkish stance is also associated with a reassessment of the economy’s cyclical position. This drives short-term market interest rates up for a quarter—even in the context of stable policy rates—after which misperceptions are corrected. This scenario is illustrated in Figure 8 (blue line), which shows that there is an additional cost—albeit small, at about 0.15 percent by 2019, given the short time span of the misperception—in the rest of the world.
28 Notice that the adjustment could be triggered by changing perceptions without actual policy changes. In particular, financial stability concerns may or may not lead central banks to increase policy rates faster than expected. Adding a faster adjustment of the policy rate would yield spillovers that are consistent with this scenario. 29 Alternatively, even in the absence of financial stability concerns, the term premium adjustment could also be associated, for example, with central bank announcements about balance sheet management, should these indicate a draining of excess reserves. This decision could be driven by political economy issues as central banks enter a normal economic environment holding a higher-than-usual stock of sovereign paper and remunerating excess reserves on a regular basis. 30 The increase in long-term yields is associated with the much stronger impact of the portfolio rebalancing channels despite the adjustment through the expectations channel due to lower policy rates.
2014 SPILLOVER REPORT
INTERNATIONAL MONETARY FUND 43
Box 2. Monetary Normalization Scenarios: G40 Model Simulation Results This box analyzes the global macroeconomic effects of an asynchronous normalization of the stance of monetary policy in the systemic advanced economies (AEs). Effects of monetary tightening in the United Kingdom and United States are considered, while conventional monetary policy in the euro area and Japan is held unchanged. This analysis is based on a pair of scenarios simulated with the G40 Model, a structural macroeconometric model of the world economy disaggregated into 40 national economies documented in Vitek (forthcoming).
A conventional asynchronous monetary normalization induced by private domestic demand expansion is associated with moderate to small output gains worldwide. The analysis considers a 100 basis point nominal policy interest rate increase in the United Kingdom and United States induced by sequences of consumption and investment demand shocks, which raise private consumption 0.25 times as much as private investment and are phased in gradually from 2014:Q3 through 2016:Q4 and then phased out gradually through 2019:Q4. Private domestic demand expansion is assumed to be associated with higher global risk appetite, represented by equity-risk-premium-induced equity price increases of 7.5 percent in the United Kingdom and United States, of 5 percent in other AEs and in emerging market economies (EMs) that are financially integrated internationally, and of 2.5 percent in other EMs, consistent with event study evidence for falls in the Chicago Board Options Exchange Market Volatility Index (VIX). Under this scenario, moderate increases in inflation and output in the United Kingdom and United States are associated with small increases in the rest of the world, as these systemic AEs experience net capital inflows and currency appreciation. Specifically, output rises by 0.8 percent in the United Kingdom and United States, and by 0.2 percent in the rest of the world, by 2015.
Event study analysis indicates that money shocks in the United States have large and recurrent effects on global financial markets. Events are assigned through sign restrictions using a centered two-day window. The data set consists of daily observations on long-term government bond yields, equity price indexes, and nominal bilateral exchange rates for the economies under consideration from January 2003 through March 2014. On event dates associated with positive money shocks, long-term bond yields rise and equity prices fall in the United States, while the dollar appreciates in nominal effective terms, and vice versa for negative money shocks. Estimates are pooled across structurally similar economies, and normalized such that the long-term bond yield in the United States rises by 100 basis points. These estimates indicate large, moderate, and small long-term bond yield increases, equity price reductions, and currency depreciations with respect to the dollar for internationally financially integrated EMs, other AEs, and other EMs, respectively.
-10.0
-7.5
-5.0
-2.5
0.0
2.5
5.0
7.5
10.0
-1.00
-0.75
-0.50
-0.25
0.00
0.25
0.50
0.75
1.00
2014 2015 2016 2017 2018 2019
Per
cent
Per
cent
age
Poi
nts
Monetary and Financial Sectors
-10.0
-7.5
-5.0
-2.5
0.0
2.5
5.0
7.5
10.0
-1.00
-0.75
-0.50
-0.25
0.00
0.25
0.50
0.75
1.00
2014 2015 2016 2017 2018 2019
Per
cent
Per
cent
age
Poi
nts
Monetary and Financial Sectors
-10.0
-7.5
-5.0
-2.5
0.0
2.5
5.0
7.5
10.0
-1.00
-0.75
-0.50
-0.25
0.00
0.25
0.50
0.75
1.00
2014 2015 2016 2017 2018 2019
Per
cent
Per
cent
age
Poi
nts
Monetary and Financial Sectors
-10.0
-7.5
-5.0
-2.5
0.0
2.5
5.0
7.5
10.0
-1.00
-0.75
-0.50
-0.25
0.00
0.25
0.50
0.75
1.00
2014 2015 2016 2017 2018 2019
Per
cent
Per
cent
age
Poi
nts
Monetary and Financial Sectors
-2.0
-1.5
-1.0
-0.5
0.0
0.5
1.0
1.5
2.0
-2.0
-1.5
-1.0
-0.5
0.0
0.5
1.0
1.5
2.0
2014 2015 2016 2017 2018 2019
Per
cent
age
Poi
nts
Per
cent
Real and External Sectors
-2.0
-1.5
-1.0
-0.5
0.0
0.5
1.0
1.5
2.0
-2.0
-1.5
-1.0
-0.5
0.0
0.5
1.0
1.5
2.0
2014 2015 2016 2017 2018 2019
Per
cent
age
Poi
nts
Per
cent
Real and External Sectors
-2.0
-1.5
-1.0
-0.5
0.0
0.5
1.0
1.5
2.0
-2.0
-1.5
-1.0
-0.5
0.0
0.5
1.0
1.5
2.0
2014 2015 2016 2017 2018 2019
Per
cent
age
Poi
nts
Per
cent
Real and External Sectors
-2.0
-1.5
-1.0
-0.5
0.0
0.5
1.0
1.5
2.0
-2.0
-1.5
-1.0
-0.5
0.0
0.5
1.0
1.5
2.0
2014 2015 2016 2017 2018 2019
Per
cent
age
Poi
nts
Per
cent
Real and External Sectors
2014 SPILLOVER REPORT
44 INTERNATIONAL MONETARY FUND
Box 2. Monetary Normalization Scenarios: G40 Model Simulation Results (concluded)
Event Study Estimation Results
Note: LCU/USD = local currency unit to U.S. dollar.
An asynchronous monetary normalization generates large-to-moderate output losses worldwide. Financial stability concerns are assumed to prompt transitory 50 basis point increases in the money market interest rate spread in the United Kingdom and United States, together with persistent 100 basis point increases in the long-term bond yield, and persistent 10 percent reductions in equity prices in 2014:Q3. In the rest of the world, money market interest rate spreads widen, long-term bond yields rise, equity prices fall, and currencies depreciate with respect to the pound or dollar to widely varying degrees across economies, depending on their structural characteristics and initial conditions, consistent with the event study and vector autoregressive evidence. In particular, we differentiate across EMs depending on whether they are internationally financially integrated, and whether they currently have high consumption price inflation or low current account balances. These global money, bond, stock, and foreign exchange market adjustments are driven by sequences of credit, duration, equity, and currency risk premium shocks, respectively. Finally, we assume that the nominal policy interest rate remains at the zero lower bound in the United Kingdom and United States through 2015:Q2, while the euro area responds with unconventional monetary easing that reduces long-term bond yields by 25 basis points. Under this scenario, by 2015 output falls by 1.2 percent in the United Kingdom and United States, by 0.7 percent in other AEs, by 1 percent in vulnerable EMs, and by 0.3 percent in other EMs.
Box 3. Normalization of Monetary Policy in the United States Normalization has two main components: first, ending asset purchases and reducing the size of the balance sheet; and second, increasing policy interest rates from the zero lower bound (ZLB).
Balance sheet. Following further measured reductions, asset purchases are likely to end later this year. The June 2011 Federal Open Market Committee (FOMC) exit principles foresee a reduction in the size of the U.S. Federal Reserve’s balance sheet as part of the normalization process. These principles and the subsequent communication by the FOMC that the Fed will not sell mortgage-backed securities during the normalization process suggest an end to reinvestment and a decline in the balance sheet soon after asset purchases end.1 Thereafter, reflecting their relatively long average maturity, asset holdings will decline only gradually and are expected to normalize in the early 2020s.2 Policy interest rates. The path of policy interest rates is determined by the Fed’s forward guidance, which is consistent with lift-off from the ZLB around mid-2015 and a more gradual tightening pace than under normal conditions. The median of FOMC members’ projections for the policy rate (“dots”) is broadly consistent with market expectations. Uncertainties. Taken together, downward pressure on term premiums from sizable asset holdings and the measured pace of policy interest rates hikes suggest a gradual increase in long-term interest rates.3 However, owing to the unprecedented nature of the exit from unconventional monetary policies, the normalization process is unlikely to be smooth, but rather will be characterized by volatility. Several uncertain factors can result in deviations from the baseline:
Normalization is data dependent. Changes in the economic outlook can cause the Fed to slow down or accelerate the process. Furthermore, uncertainty about the structure of the economy and appropriate policy responses in the aftermath of the financial crisis is unusually high. The Fed and market participants continue to re-assess factors such as the “neutral” real interest rate, the true degree of slack in the labor market and potential financial stability risks stemming from more than five years of exceptionally low interest rates.4
As an illustration of the uncertainties related to the future path of policy interest rates, the median of the FOMC members’ “dots” are broadly in line with a Taylor (1999) rule that gives more weight to activity. In comparison, a lower neutral real rate or incorporating broader measures of labor market slack would argue for even more patience in tightening policy, whereas higher inflation (for example, from less labor market slack) or financial stability considerations could cause the Fed to tighten policy more aggressively. Faster-than-expected tightening would contribute to an increase in long-term rates through both higher expected future policy rates and term premia. Furthermore, in the context of unusually low market uncertainty about policy rates one to two years ahead, a sudden readjustment of expectations could lead to significant market volatility.
_______________________ 1 June 2011 FOMC minutes and Bernanke (2013). 2 Based on Carpenter and others (2013) and responses to the March 2014 New York Federal Reserve Primary Dealers survey. The calculations assume that asset holdings normalize along an upward trend given by pre-crisis growth in currency in circulation. 3 Estimates based on portfolio balance effects (see Chung and others, 2012) suggest that a baseline downward impact on the term premium in 2014:Q2 is about 65–80 basis points and declines only very gradually over time. 4 While the ongoing tapering process has increased clarity about the evolution of the Fed’s balance sheet, there is also some uncertainty about when the balance sheet will begin to decline and whether the Fed would conduct asset sales to normalize it faster than expected or the Fed decide to maintain a larger balance sheet over the longer term.
-202468
101214161820
09 11 14 16 19 21
Projected Excess Asset Holdings(excess as share of GDP)
Sources: IMF, World Economic Outlook; and IMF staff estimates.
2022:Q4
0
1
2
3
4
5
14 15 16 17 18 19
Median FOMC "dot"Eurodollar 75thPrimary dealers medianPrimary dealers 25thPrimary dealers 75th
Market Expectations of Future Path for Policy Rates(percent)
Sources: IMF, World Economic Outlook; and IMF staff estimates.
-4-3-2-101234567
00 02 04 06 08 10 12 14 16 18
Taylor (1999) rule with time-varying RRTaylor (1999) rule with higher-inflationTaylor (1999) ruleActual FFRMedian FOMC "dot"
Policy Rate Uncertainty
Source: IMF staff calculations based on WEO projections. Note: Taylor (1999) rule is based on English, Lopez-Salido,and Tetlow (2013). Time varying real rate (RR) is estimated to be about -0.5 percent in 2013 and increases to a longer -term equilibrium value of 1.5 percent. Higher-inflation scenario assumes that the output gap closes earlier (in 2016) and inflation temporarily exceeds 2 percent in 2017-2018. FFR = Federal funds rate; FOMC = Federal Open Market Committee.
19
2014 SPILLOVER REPORT
46 INTERNATIONAL MONETARY FUND
Figure 7. Scenario 1: Faster US and UK Recovery (Percentage point deviation from baseline)
Source: IMF staff estimates.
0.0
0.2
0.4
0.6
0.8
1.0
1.2
1.4
1.6
1.8
2013 2014 2015 2016 2017 2018 2019
US and UK: Real GDP Level
0.0
0.1
0.2
0.3
0.4
0.5
0.6
0.7
2013 2014 2015 2016 2017 2018 2019
Rest of World: Real GDP Level
-0.2
0.0
0.2
0.4
0.6
0.8
1.0
1.2
2013 2014 2015 2016 2017 2018 2019
US and UK: Short-Term Interest Rate
-0.2
-0.1
0.0
0.1
0.2
0.3
2013 2014 2015 2016 2017 2018 2019
Rest of World: Short-Term Interest Rate
-0.1
0.0
0.1
0.2
0.3
2013 2014 2015 2016 2017 2018 2019
US and UK: Long-Term Interest Rate
-0.01
0.00
0.01
0.02
0.03
0.04
0.05
2013 2014 2015 2016 2017 2018 2019
Rest of World: Long-Term Interest Rate
2014 SPILLOVER REPORT
INTERNATIONAL MONETARY FUND 47
Figure 8. Scenario 2: Term Premium Shock and Misperceptions (Percentage point deviation from baseline)
Source: IMF staff estimates.
-0.8
-0.7
-0.6
-0.5
-0.4
-0.3
-0.2
-0.1
0.0
2013 2014 2015 2016 2017 2018 2019
Term premium shockUS and UK: Real GDP Level
-0.3
-0.2
-0.1
0.0
0.1
2013 2014 2015 2016 2017 2018 2019
Term premium shock and short-term rate spreadRest of World: Real GDP Level
-0.4
-0.3
-0.2
-0.1
0.0
0.1
0.2
0.3
2013 2014 2015 2016 2017 2018 2019
US and UK: Short-Term Interest Rate
-0.5
-0.4
-0.3
-0.2
-0.1
0.0
0.1
0.2
0.3
2013 2014 2015 2016 2017 2018 2019
Rest of World: Short-Term Interest Rate
0.0
0.1
0.2
0.3
0.4
0.5
0.6
0.7
0.8
0.9
1.0
2013 2014 2015 2016 2017 2018 2019
US and UK: Long-Term Interest Rate
0.0
0.1
0.2
0.3
0.4
0.5
0.6
0.7
0.8
0.9
1.0
1.1
2013 2014 2015 2016 2017 2018 2019
Rest of World: Long-Term Interest Rate
2014 SPILLOVER REPORT
48 INTERNATIONAL MONETARY FUND
30. For recipient economies, scenarios suggest that sound fundamentals can reduce adverse spillovers and allow domestic policy to mitigate their impact. The term premium scenario distinguishes the behavior of EMs based on their fundamentals. Countries with strong fundamentals are defined as those in which the current account deficit and the inflation rate are below the median for EMs included in the sample. The scenario suggests that spillovers would be lower in countries with strong fundamentals, as smaller increases in long-term yields result in milder declines in GDP (Figure 9). As discussed in the shocks, transmission channels, and spillovers section, though, good fundamentals and policy frameworks would not only reduce the impact of the shocks, they would also enhance the policy space to respond to them. To illustrate this difference, the dotted black line in Figure 9 restricts the monetary policy response in EMs with weaker fundamentals for a year in Scenario 2, showing that the impact on GDP would be more significant—a cumulative loss in GDP of 2.15 percent compared with the baseline by 2019, versus 0.75 percent for the rest of the world.
31. The impact of spillovers on real exchange rates would not shift global external positions significantly. A shock to the term premium embedded in long-term instruments in the United States and the United Kingdom—Scenario 2—would trigger an appreciation of about 0.3 percent over the medium term in countries for which the initial current account deficit is below the median, and a depreciation of about 0.45 percent in countries with relatively high current account deficits. In terms of the current account balance—which would also depend on growth developments in trading partners and changes in the terms of trade—the model predicts a slight deterioration in both groups of countries, which suggests that an asynchronous monetary policy normalization would not have a significant impact on global external positions.
32. Balance sheet effects and financial market liquidity issues—which are not captured in the simulations—can potentially amplify adverse spillovers. Quantitative tools for spillover analysis have limitations, especially when shocks have nonlinear effects that are not captured by the models. Such shocks may be associated with a number of issues: (i) balance sheet effects associated with unhedged foreign exchange exposure by EM corporates, as happened during the global crisis; (ii) liquidity issues in overcrowded financial markets—for example, in sovereign debt markets in which foreign participation has increased very rapidly31—especially in the context of weaker market liquidity caused by reduced dealer inventories and more involvement of investment vehicles more vulnerable to redemption risks (IMF, 2014); and (iii) the potential for fiscal crisis associated with higher financing costs after years of favorable conditions (see Box 4).
31 Especially when the scale of operations of local investors cannot compensate for a potential reversal in capital inflows from a retrenchment in foreign participation.
2014 SPILLOVER REPORT
INTERNATIONAL MONETARY FUND 49
Figure 9. Restricted Policy Response
Source: IMF staff estimates.Note: High inflation and current account deficit countries are Brazil, India, Indonesia, Russia, South Africa, and Turkey; low inflation and current account deficit countries are China, Mexico, and Saudi Arabia.
-0.7
-0.6
-0.5
-0.4
-0.3
-0.2
-0.1
0.0
0.1
0.2
2013 2014 2015 2016 2017 2018 2019
Term premium, high inflation and current account deficitTerm premium, low inflation and current account deficitRestricted policy response, high inflation and current account deficit
Real GDP Level
-0.5
-0.4
-0.3
-0.2
-0.1
0.0
0.1
2013 2014 2015 2016 2017 2018 2019
Short-Term Interest Rates
0.0
0.2
0.4
0.6
0.8
1.0
1.2
1.4
1.6
2013 2014 2015 2016 2017 2018 2019
Long-Term Interest Rates
2014 SPILLOVER REPORT
50 INTERNATIONAL MONETARY FUND
Box 4. Public Debt Dynamics and Fiscal Stress in Emerging Market Economies Tightening global financial conditions can worsen public debt dynamics in emerging market economies (EMs) through an increasing interest-rate-growth differential (IRGD). Historical evidence also suggests that U.S. monetary tightening increases the likelihood of disruptive fiscal stress in EMs.
Long-term U.S. bond yields can have a significant impact on IRGDs in EMs, with Latin America and Europe facing the largest increase in the debt burden. Estimations based on a panel of 30 EMs over 1993–2013 suggest that a 100 basis point increase in U.S. long-term bond yields increases IRGDs by 80 basis points in EMs as a whole. This impact varies markedly with prevailing global risk aversion as measured by the VIX. The estimated sensitivity in a scenario of high risk aversion suggests that a permanent increase of 100 basis points in U.S. yields would increase public debt by up to 4 percent of GDP in Latin America and Europe by 2018. Asia and the Middle East would be affected to a lesser extent. Average EMs' debt paths, however, would decline in the medium term due to still favorable EM IRGDs.
The frequency of sovereign debt crises has historically increased in EMs during U.S. tightening cycles that were accompanied by rising term spreads. Estimations based on a Poisson count model of the number of sovereign debt crises across 22 EMs between 1955 and 2010 suggest that the frequency of sovereign debt crises increases at the early stages of the U.S. monetary tightening cycle at times in which the term spread also rises.2 The timing may be related to a switch of expectations about the future course of policy in the early stages of a tightening cycle. Overall, notwithstanding these results, the impact could be more benign this time around, as expectations may adapt more gradually due to enhanced monetary policy transparency and a slow tightening. ____________________ 1 Countries are grouped by regions: Asia (China, India, Indonesia, Malaysia, Philippines, Thailand), Latin America (Argentina, Brazil, Chile, Colombia, Mexico, Peru), Europe (Bulgaria, Hungary, Latvia, Lithuania, Poland, Romania, Russia, Turkey, Ukraine), and the Middle East (Egypt, Jordan, Morocco, Pakistan, Saudi Arabia). 2 Eichengreen and Rose (1998) find that high interest rates in AEs are strongly associated with the onset of banking crises in developing countries, suggesting that financial stress could be a possible spillover channel to fiscal stress in EMs.
-5
0
5
10
15
20
55 60 65 70 75 80 85 90 95 00 05 10
Number of debt crises Fed funds rate Term spread
Monetary Policy and the Frequency of Sovereign Debt Crises in EMs
Sources: Haver Analytics.; and IMF staff calculations based on Reinhart and Rogoff (2011).Note: EM = emerging market.
Permanent Unit Increase in U.S. Long-Term Bond Yields(percent of GDP)
Source: IMF staff estimates.
Note: VIX = Chicago Board Options Exchange Market Volatility Index.
0
1
2
3
4
5
2013 2014 2015 2016 2017 2018
Average VIXAsia: Public Debt
0
1
2
3
4
5
2013 2014 2015 2016 2017 2018
95th percentile VIXLatin America: Public Debt
0
1
2
3
4
5
2013 2014 2015 2016 2017 2018
Europe: Public Debt
0
1
2
3
4
5
2013 2014 2015 2016 2017 2018
Middle East: Public Debt
2014 SPILLOVER REPORT
INTERNATIONAL MONETARY FUND 51
33. An asynchronous exit may reduce the shock in financial markets more than a synchronous exit, but it may raise issues for some EMs with certain balance sheet vulnerabilities. In EMs, financial conditions have usually changed as the monetary stance in AEs turned—either because of a rise in global rates or an increase in global risk aversion—with stress indices increasing in bond, stock, and exchange rate markets. Asset prices in EMs have been particularly sensitive to monetary tightening in the United States. However, during periods in which global monetary tightening became more synchronized across major AEs, stress conditions worsened even further—albeit not strongly—particularly in sovereign bond and equity markets. Hence, the fact that some countries may be in a different cyclical position than the United States or United Kingdom may dampen spillovers to some EMs (Figure 10). For example, current quantitative and qualitative easing in Japan and UMPs in Europe will likely counteract the impact of financial tightening in the other AEs (see Box 5 for the case of Japan), reducing stress in EM financial markets. On the other hand, a more asynchronous exit will likely trigger larger adjustments among exchange rates in AEs, which may exacerbate balance sheet effects in some EMs from unhedged foreign exchange exposure by corporates, in case of currency mismatches.
Figure 10. Financial Stress in Emerging Market Economies over Tightening Cycles (Index)
Exchange Market Pressure Sovereign Bond Spreads Stock Market Returns
Sources: IMF, Global Data Source; and IMF staff calculations.Note: VIX = Chicago Board Options Exchange Market Volatility Index.
2014 SPILLOVER REPORT
52 INTERNATIONAL MONETARY FUND
Box 5. Spillovers from Portfolio Rebalancing in Japan The different monetary policy stance between the Bank of Japan (BoJ) and other major central banks would increase the incentives to rebalance portfolios toward foreign assets by Japanese investors. While the vast majority of these flows—which IMF staff estimate could reach US$260 billion—are expected to go to advanced economies (AEs), emerging markets (EMs) would benefit directly given their smaller capital markets, and indirectly through less tight financial conditions in AEs. Portfolio rebalancing toward risky assets by Japanese financial institutions has progressed slowly since the introduction of quantitative and qualitative monetary easing in April 2013. Over the last year, the BoJ purchased about 7½ percent of outstanding Japanese government bonds (JGBs), primarily from banks. However, despite large increases in domestic lending, banks have accumulated significant excess reserves, and insurance companies and private pension funds have been slow to adjust their portfolios. The Government Pension Investment Fund (GPIF), with over 25 percent of GDP in assets under management, still holds more than 7 percent of total JGBs (55 percent of its assets). There has been no noticeable pick-up in portfolio outflows and outward foreign direct investment, and bank lending has continued to grow at a similar pace as in the past.
Diverging monetary policy stances between the BoJ and other major central banks will increase incentives for portfolio rebalancing going forward. Despite rising credit demand, continued JGB purchases by the BoJ will suppress income from security holdings and shrinking net interest margins. Hence, widening interest rate differentials as well as rising inflation will make it more attractive for financial institutions to expand overseas. Planned changes in the benchmark portfolio allocation at the GPIF would also increase holdings of higher-yielding assets, including foreign securities. Additional capital outflows from domestic financial institutions in Japan could reach about US$260 billion in coming years. IMF staff calculations are based on an illustrative scenario and factor in continued credit growth, behavioral changes due to increasing pressure on bank profits from low interest rates, governance reforms at the GPIF, and rising interest rate differentials. Flows to EMs would help ease financing conditions given the relatively smaller capital markets in recipient countries. The estimated potential size of additional capital flows to EM Asia is more than half of their peak reserve loss during 2013. Additional benefits could arise indirectly from less tightening conditions in AEs due to the additional inflows.
B. Main Policy Findings
34. The analysis in this chapter offers insights that are relevant for surveillance and policy. Several policy issues are raised by the experience following the taper episode, the empirical analysis on the role of underlying shocks and their interaction with fundamentals, and the scenario analysis.
35. Appropriate policy responses will vary, as spillovers will depend on the underlying drivers of tighter financial conditions. Growth-driven shocks trigger a modest increase in long-
0
10
20
30
40
50
60
70
Reserve loss Potential to EM Asia
Indonesia Malaysia Philippines ThailandVietnam Singapore India
Potential Capital Flows to EM Asia(in US $billion)
Source: IMF staff calculations. 1Reserve loss April to August (Indonesia, Malaysia, Philippines, Thailand, India), to July (Vietnam), and to May (Singapore) in 2013.2GPIF reduces domestic bond holdings further to 45 percent of total assets while increasing domestic stock and foreign assets equally; insurance companies reduce their JGB purchases to two-thirds of current pace to increase foreign investment; other investors including investment trusts accelerate the pace of foreign investment by about 50 percent. Banks’ domestic lending would increase at the pace of recent peak in 2008, while their overseas lending would be as much as in 2011. Banks buy foreign assets amountingto half of additional reserves.
21
2014 SPILLOVER REPORT
INTERNATIONAL MONETARY FUND 53
term yields, nominal exchange rate appreciations, and higher stock market prices and industrial production in EMs. On the other hand, money shocks trigger a large increase in yields, nominal exchange rate depreciations, and falling stock prices and industrial production. Getting the diagnosis right is critical to choosing the best course of policy action.
36. In source economies, evolving central bank objectives, uncertainty about cyclical positions, and large balance sheets place a premium on communication. Market participants face a challenging signal extraction problem to identify policy intentions, which may prompt deviations from a smooth normalization path, as illustrated during the taper episode last summer. Monetary policy should strive to move gradually to avoid large swings in asset prices. In this connection:
Central banks’ communications should focus on policy trade-offs rather than targets and/or timing. Explaining how monetary policy may change is more important than giving paths. Communications should shift focus from explaining potential triggers of interest rate adjustments towards conveying views about policy trade-offs to address cyclical issues and/or financial stability concerns.
The role of financial stability considerations in central bank decisions should be explained, including how these decisions relate to the official bank mandate. Explaining central banks’ assessment of leverage build-up, credit risks, and trends in the term premium would help prevent extreme market positioning and avoid bold policy moves. This is particularly relevant at times when interest rate derivatives reflect low levels of uncertainty.
Central banks should describe their expected trends in balance sheets under different circumstances. Informing markets about potential situations in which a deviation from a known outlook would trigger actions should help reduce extreme market positioning.
37. In recipient economies:
Sound policy frameworks and fundamentals can mitigate spillovers. Understanding the role played by policy credibility and sound fundamentals in the transmission of shocks will inform policymaking about potential ramifications of the initial shocks to other economies, and the policy space to respond to them, especially in terms of monetary policy.
Countries should strike the right balance between letting the exchange rate act as a buffer and intervening. The exchange rate is a key shock absorber in EMs, and countries could benefit from avoiding early foreign exchange interventions if not warranted by prospects of a disorderly adjustment. Having said that, where rapid capital flows lead to financial market disruption and sound macroeconomic policies fail to stabilize tensions, exchange market interventions, provided that international reserves are adequate, can be used to smooth excessive volatility or prevent financial disruption.
2014 SPILLOVER REPORT
54 INTERNATIONAL MONETARY FUND
C. Concluding Remarks
38. A smooth normalization of monetary policies can be achieved, but monetary shocks can have negative spillovers that could be amplified by miscommunication. A faster recovery in key AEs would have a positive impact on global growth. This would foster confidence and help countries accommodate the policy mix to changing domestic cyclical conditions. Hence, while some volatility may ensue due to the new challenges posed by UMP, normalization of monetary policy in AEs could be achieved smoothly. On the other hand, financial stability issues or policy uncertainty could prompt a bumpy exit and negative global spillovers. Moreover, markets’ misperceptions of central banks’ policy intentions could add additional costs due to overshooting in the adjustment of financial conditions.
39. Countries can buffer spillovers by maintaining sound policy frameworks and fundamentals, especially if credibility increases monetary policy space. Spillovers from money shocks in AEs have typically been milder in economies with sound policy frameworks and fundamentals. This is likely due not only to a less significant initial shock, but also to policy space associated with credibility, which helps countries articulate their policy response. Spillovers could be amplified significantly if lack of credibility hinders the country’s ability to respond to the shock, especially in terms of monetary policy. Also, the asynchronous nature of the exit may reduce the magnitude of the shock more in financial markets compared with a synchronous exit, but it may also raise issues associated with currency mismatches in balance sheets.
2014 SPILLOVER REPORT
INTERNATIONAL MONETARY FUND 55
CHAPTER 3. SPILLOVERS FROM A POTENTIAL REVERSAL OF FORTUNE IN EMERGING MARKET ECONOMIES From their high point before the crisis, emerging market economies are slowing down on a broad basis. This chapter explores what defines the slowdown and the diversity of relevant spillovers that may arise for advanced economies, other emerging market economies, and low-income countries. The defining features of the slowdown have been its gradual, protracted, and synchronized nature. Against a backdrop of weaker potential growth and productivity performance, the slowdown may be structural to an important degree. Growth spillovers from emerging economies can be noticeable for the global economy. Spillovers transmit mostly through trade linkages, but they also can have sizable effects through financial linkages, including through banks. Given the major role of emerging market economies in commodity markets, lower growth in those economies would likely lead to lower commodity prices—which act as a stabilizer at the global level, but with distributional implications through the terms of trade at the country level. Moreover, localized spillovers originating from large emerging market economies can be significant, with the channels of transmission depending on neighborhood-specific linkages. Risks and spillovers from slowing emerging economies will depend on the extent to which structural factors are at play and whether policy efforts can improve growth.
INTRODUCTION 1. Emerging market economies (EMs) are experiencing a broad-based and protracted slowdown that could result in important cross-border spillovers.1 Growth is markedly lower in these economies than it was prior to the global financial crisis and is expected to remain lower over the medium term, with risks tilted to the downside. Given the significant and rising contribution of EMs to the global economy over the past few decades (Figure 1), their recent slowdown could have far-reaching implications for the rest of the world, especially in the context of an uneven and fragile recovery in advanced economies (AEs). Moreover, with tighter global financial conditions going forward, as some major AEs begin unwinding monetary accommodation, downside risks remain important, and withstanding such a slowdown could be a challenge given existing vulnerabilities in some EMs (including macroeconomic imbalances, corporate indebtedness, and other exposures). 1 This chapter covers 25 economies, including 20 emerging market economies, which account for about 36 percent of global GDP in purchasing-power-parity (PPP) terms (Argentina, Brazil, Chile, China, Colombia, Hungary, India, Indonesia, Malaysia, Mexico, Peru, the Philippines, Poland, Russia, Saudi Arabia, South Africa, Thailand, Turkey Uruguay, and Venezuela) as well as 4 newly industrialized Asian economies (Hong Kong SAR, Korea, Singapore, and Taiwan Province of China) and the Czech Republic.
2014 SPILLOVER REPORT
56 INTERNATIONAL MONETARY FUND
Figure 1. Emerging Market Economies: Growing Role in the World
Economy
2. This chapter explores the magnitude, channels, and policy implications of spillovers from a synchronized slowdown in EMs. Although spillovers from AEs have been extensively documented, only a limited number of studies have focused on spillovers from EMs (mostly on China and through trade linkages). The chapter examines a diversity of relevant spillover channels through which shocks in EMs transmit more widely. It adopts a broad perspective by focusing on EMs as a group while taking into account their heterogeneity including through accounting for the differences in the nature of their linkages to their neighborhoods and to the global economy. From a recipient’s perspective, the chapter analyzes the spillovers from slower growth in EMs to AEs and low-income countries (LICs) as well as within EMs.
3. Specifically, using a variety of approaches, including econometric models, case studies, and model simulations, the chapter answers the following questions:
What defines the EM slowdown?
How large are growth spillovers given EMs’ increased role in the global economy?
What are the spillovers through trade in light of changing global patterns of trade and supply chains?
How large are the spillovers through commodity markets, considering EMs’ significant role in these markets?
How large are the financial spillovers stemming from the EM slowdown in light of emerging economies’ growing integration in global financial markets?
What are the possibly localized spillovers from a slowdown in large EMs?
What are the major attendant risks and policy implications?
-3
-2
-1
0
1
2
3
4
5
6
00 01 02 03 04 05 06 07 08 09 10 11 12 13
Emerging Advanced Rest of world
Contributions to Global Growth(percent)
0
10
20
30
40
50
60
70
80
90
100
00 01 02 03 04 05 06 07 08 09 10 11 12 13
Contributions to World GDP(percent of global GDP in PPP)
Source: April 2014 World Economic Outlook.
2014 SPILLOVER REPORT
INTERNATIONAL MONETARY FUND 57
The next section documents the properties of the slowdown that EMs have been experiencing and attempts to provide some tentative answers as to what is driving it.
PROPERTIES OF THE SLOWDOWN 4. From their precrisis high, EMs are slowing down in a synchronized and protracted manner, which appears to be structural to a significant degree. The slowdown can be characterized as:
Gradual. The slowdown has extended over a period of time. Growth has gradually declined over the postcrisis period and is expected to remain below its historical average (Figure 2, top panel).2 The progressive nature of the slowdown is also observed across multiple demand components (most notably in investment—driven by China, India, and Brazil) and across regions.
Synchronized. The slowdown is broad based. Growth rates are lower than the precrisis average in more than 70 percent of EMs since 2012 (red bars in Figure 2, bottom panel). This unweighted metric indicates that slower growth extends beyond developments in large EMs.
Protracted. The slowdown seems durable. Growth is expected to remain lower over the medium term. Projections have been revised downward continuously since 2009, with growth now expected to remain below the 2010 level by about 3 percentage points (Figure 2, middle panel). Repeated downward revisions of medium-term growth forecasts are unique to the current downturn when compared with earlier episodes of crises and suggest that it could, therefore, have an important structural component.3
5. More modest growth prospects are associated with weaker potential growth and productivity estimates—also indicating a role for structural factors. Evidently, potential growth has slowed alongside actual growth, and it is expected to remain below the precrisis average (Figure 3). Growth accounting reveals that the slowdown does not appear to be driven by factor accumulation (physical or human capital), and that total factor productivity (TFP) has been playing an important role (Figure 4).4,5 Moreover, the contribution of TFP to the current slowdown is
2 The picture remains qualitatively similar if 2011–13 is regarded as the postcrisis growth period, given that 2010 was a rebound year for many EMs. Precrisis growth was above its historical average, which could suggest that previous growth rates were unsustainable and that some correction was warranted. 3 Simple averages and PPP-GDP weighted sums of growth forecasts for the EM group show similar pictures, suggesting that the progressivity and magnitude of the slowdown are not driven only by large economies, like China. 4 While there is some endogeneity between productivity and factors of production, the slowdown was largely driven by a decline in the efficiency with which factors of production are used, not by factor accumulation itself. Poor infrastructure would hinder the productivity of private capital accumulation, and lack of improvement in skills prevents employees from becoming more productive. 5 Human capital data obtained from Tsounta (forthcoming).
2014 SPILLOVER REPORT
58 INTERNATIONAL MONETARY FUND
Figure 2. Properties of the Slowdown in Emerging Market Economies
0
2
4
6
8
10
12
GDP Investment Consumption Industrial production
2003–08 2010–13 2014–18 1993–2013
Sources: April 2014 World Economic Outlook; and Consensus Economics. Note: CEE = central and eastern Europe (Czech Republic, Hungary, Poland, Russia, and Turkey); LatAm = Latin America and the Caribbean.
EMs: Evolution of Growth (percent change year-over-year)
0
1
2
3
4
5
6
7
8
9
All Asia Lat Am CEE
-5
-4
-3
-2
-1
0
1
10 11 12 13 14 15 16 17 18 19
Oct-10 Oct-11 Oct-12 Oct-13 Apr-14
All EMs
Growth Forecasts in EMs(percentage change in GDP growth relative to growth in 2010)
-5
-4
-3
-2
-1
0
1
10 11 12 13 14 15 16 17 18 19
Latin America
Source: IMF, World Economic Outlook.
-5
-4
-3
-2
-1
0
1
10 11 12 13 14 15 16 17 18 19
CEE
-5
-4
-3
-2
-1
0
1
10 11 12 13 14 15 16 17 18 19
AsiaAsia
0
10
20
30
40
50
60
70
80
90
100
90 91 92 93 94 95 96 97 98 99 00 01 02 03 04 05 06 07 08 09 10 11 12 13 14Sources: April 2014 World Economic Outlook; and IMF staff calculations.Note: Red bars denote more than 70 percent of sample countries. For years 1990–2002, below the average of 1994–1996 real GDP growth, thereafter below the 2003–2007 average. 1/ Encompasses the dot-com bubble, 9/11 attacks, and crises in Argentina, Brazil, and Turkey.
Asian Crisis
Early 2000s Recession 1/
Global Financial
Crisis
Current Slowdown
Synchronized EM Slowdown(percent of EM countries with real GDP growth slowdowns)
2014 SPILLOVER REPORT
INTERNATIONAL MONETARY FUND 59
higher than in previous downturns in EMs. The slowdown in productivity is consistent with concerns about structural constraints on EM growth—including the overreliance on investment-driven growth (China), protracted weak investment in infrastructure (Brazil, India), and shortages of skilled labor (Latin America).6,7
Figure 3. Emerging Market Economies: Evolution of Growth
(percent change year-over-year)
Figure 4. Emerging Market Economies: Evolution of TFP Growth
(percent change year-over-year)
6. Finally, there has been a shift from external to internal drivers of growth in EMs in the postcrisis period. External factors—led by favorable global financing conditions, high commodity prices, and rapid expansion of world trade—supported growth in the precrisis period. On average, external shocks (external demand, financing costs, and terms of trade) tended to explain 50 percent or more of the deviation in EM growth rates from the estimated mean for the period 1998–2013. However, since 2012 the pullback in growth is mostly attributable to internal factors.8 Indeed, the contribution of external factors to EM growth has decreased from 63 percent for the entire sample period to 32 percent since 2012. A need to unwind the domestic stimulus injected in the postcrisis period and waning dividends from past structural reform efforts are the most relevant common domestic factors behind the current slowdown.9
6 See IMF (2013e). The reductions in potential growth point to serious structural impediments: supply-side bottlenecks in India arising from problems in the regulatory framework for mining, energy, telecommunications, and other sectors; excess capacity and diminishing returns from the extensive growth model in China; and inadequate physical infrastructure in Russia. 7 The higher increase in TFP in central and eastern Europe (CEE) relative to other regions in the precrisis period is related to CEE’s accession to the European Union. Given its closer economic integration with the euro area, CEE was also badly hit during the downturn. 8 See IMF (2013a, 2013b, 2013c, 2014a, 2014c) and Cubeddu and others (2014). 9 Crises in the late 1990s and early 2000s led EMs to adopt aggressive reforms, including in their policy frameworks. Such reforms included a shift toward exchange rate flexibility, improvement in financial regulation, fiscal
(continued)
0
1
2
3
4
5
6
7
8
Actual output Potential output
2003–08 2010–13 2014-18
Source: April 2014 World Economic Outlook.
-1
0
1
2
3
4
5
All Asia Lat Am CEE
2003–08 2010–13 2014–18 1993–2013
Sources: IMF, World Economic Outlook; Penn World Tables; Tsounta (forthcoming); and staff calculations.
2014 SPILLOVER REPORT
60 INTERNATIONAL MONETARY FUND
GROWTH SPILLOVERS: ESTIMATES OF OVERALL IMPACT 7. Overall, growth spillovers from EMs are noticeable but remain markedly smaller than from AEs. Simple time series estimates suggest that a 1 percent EM growth shock reduces AE growth by 0.2 percentage points over a year (Figure 5).10 By contrast, the impact from a shock originating in AEs is twice this size. The differences in the size of growth spillovers are broadly in line with the two groups’ respective shares in global GDP. Indeed, EMs represent more than 30 percent of world GDP at market exchange rates.
Figure 5. Cumulative Effect of a 1 Percentage Point Growth Shock after
Four Quarters (percentage points)
Figure 6. Cumulative Effect of a 1 Percentage Point Growth Shock in
Emerging Market Economies (percentage points)
8. Growth spillovers vary widely across AEs. Spillovers from a 1 percent EM growth shock are larger and statistically significant for the euro area (0.3 percent) and Japan (0.5 percent) compared with the United States (0.1 percent) and the United Kingdom (0.2 percent) (Figure 6).11 This variation appears consistent with differences in trade patterns and linkages across partner countries as discussed in the following sections, which systematically explore the spillover effects from an EM
consolidation, reduction in currency mismatches, and a buildup of foreign reserves. A favorable external environment during the precrisis period reduced the incentives to push reforms further. 10 The slowdown has both a cyclical and a structural component, with the latter being more prominent. Hence, it is also important to understand the implications of a cyclical slowdown. The focus in this section is on the impact of a transitory (cyclical) growth shock, irrespective of the channels of transmission. Subsequently, spillovers from a more structural shock and the differences between spillover effects stemming from cyclical and structural shocks are studied in the context of model simulations. Simulations presented in Chapter 1 of this report also yield the result that a structural shock can have large and persistent spillover effects if agents misperceive or learn only gradually about the structural nature of the shock. 11 See Annex VII for details on the methodology of structural identification used in this chapter.
-0.6
-0.5
-0.4
-0.3
-0.2
-0.1
0.0
0.1
AE to EM EM to AE
Source: IMF staff estimates.Note: ● indicates significance at 10 percent. The method of estimation is a bivariate vector autoregression using Cholesky decomposition with AEs entering first in the ordering. A postcrisis dummy is included to control for the global financial crisis.
●
●-0.6
-0.5
-0.4
-0.3
-0.2
-0.1
0.0
United States Euro Area Japan United Kingdom
Source: IMF staff estimates.Note: ● indicates significance at 10 percent. The method of estimation is multicountry vector autoregression using directed acyclical graph approach for the structural decomposition. A postcrisis dummy is included to control for the global financial crisis.
●
●
2014 SPILLOVER REPORT
INTERNATIONAL MONETARY FUND 61
slowdown through various channels of transmission, namely, trade, commodity prices, and financial flows.
CHANNELS OF SPILLOVERS A. Spillovers through Trade
9. Global trade integration has deepened, reflecting increased specialization and vertical integration in the context of global supply chains.12 Based on value-added trade flows that accurately reveal which countries account for the final demand for exports, the share of EMs in world exports rose from about 20 percent in 1995 to 35 percent by 2011 (Figure 7). Over the same period, trade links have strengthened between advanced and emerging market economies: AEs supply 65 percent of EM imports (Figure 7, left side in top panel) and 40 percent of AE imports now are sourced from EMs (Figure 7, right side in top panel). Shocks originating in EMs that are capable of disrupting global supply chains, which have grown over time, could negatively affect advanced, emerging and developing economies.
10. Growth spillovers through trade are significant. On average, a 1 percentage point decline in EM growth over a year results in a decline in overall AE growth by 0.25 percentage point (Figure 7, left side in middle panel).13 As before, Japan and the euro area experience a larger impact (0.3 percent) compared with the United Kingdom and the United States (about 0.2 percent).14 These differences reflect markedly stronger trade linkages with EMs for these AE partners.
11. A slowdown in China has a larger impact on AEs than on EMs outside its region. On average, a slowdown in China has a significant impact on growth in AEs (around 0.15 percent), with varying impact across AEs (Figure 7, right side in middle panel). Japan is most affected due to intensive trade links via global supply chains. The overall impact on other EMs appears to be smaller on average.15 However, commodity-exporting EMs may be affected strongly by an EM slowdown through terms of trade effects discussed in the following subsection.
B. Spillovers through Commodity Prices
12. Slower growth in EMs can have a significant impact on commodity prices in light of their substantial role in global commodity markets. EMs now account for the bulk of commodity
12 With the rise of global supply chains, gross trade flows are no longer able to accurately capture trade linkages. See Annex VIII for a detailed discussion on gross versus valued-added trade. 13 See Annex IX for technical details on global vector autoregression (GVAR) models used to estimate the EM spillover effects through trade. 14 The relatively high spillover effect from EMs to Japan could possibly be explained by the domestic banking crisis and the increase in the consumption tax rate between 1997 and 1998. 15 Regional spillovers from China to its EM neighbors appear to be larger (see Box 5 for a discussion of intraregional spillovers from China).
2014 SPILLOVER REPORT
62 INTERNATIONAL MONETARY FUND
0
10
20
30
40
50
60
70
80
90
100
2000 2012
AEs EMs 1/
Sources: International Energy Agency, BP Statistical Review of World Energy June 2013; USDA; World Bureau of Metal Statistics; IMF Primary Commodity Price System; and staff calculations. 1/ Does not include EMs or low-income countries outside the 25-country sample.
Metals FoodEnergy
Consumption Share(percent of global consumption in value terms)
0
10
20
30
40
50
60
70
80
90
100
2000 20120
10
20
30
40
50
60
70
80
90
100
2000 2012
-7
-6
-5
-4
-3
-2
-1
0
AE growth EM growth
Sources: IMF, Primary Commodity Price System; and IMF staff estimates.Note: Results are significant at 10 percent. The method of estimation is vector autoregression using Cholesky decomposition with AE entering first in the ordering. The IMF commodity price index includes energy, metal and food price inflation deflated by US consumer price index and weighted by their respective shares in global trade.
Cumulative Effect of a 1 Percentage Point Decline in Growth on Commodity Prices(percentage points)
Figure 7. Spillovers through Trade and Commodity Prices
-0.35
-0.30
-0.25
-0.20
-0.15
-0.10
-0.05
0.00
AE United States
Euro Area Japan United Kingdom
Source: IMF staff estimates.Note: Results are significant at 10 percent. The method of estimation is global vector autoregression using exports plus import value-added weights. Generalized impulse responses are used.
Cumulative Effect of a 1 Percentage Point Decline (percentage points)
In EM Growth In China's Growth
-0.35
-0.30
-0.25
-0.20
-0.15
-0.10
-0.05
0.00
AE United States
Euro Area
Japan United Kingdom
Other EM
0
10
20
30
40
50
60
70
80
90
100
95 97 99 01 03 05 07 09 11
From EM From AEShares of EM Imports
Sources: World Input Output Tables; and IMF staff calculations.
Evolution of Trade Patterns in Advanced and Emerging Markets(percent)
0
10
20
30
40
50
60
70
80
90
100
95 97 99 01 03 05 07 09 11
Shares of AE Imports
2014 SPILLOVER REPORT
INTERNATIONAL MONETARY FUND 63
consumption, with the shares ranging from 45 percent for energy to 70 percent for metals (Figure 7, left side in lower panel). Hence, an EM growth shock has a larger impact on commodity prices compared with an AE growth shock. Overall, a 1 percentage point growth decline in EMs leads to a fall in commodity prices of about 6 percent as opposed to less than 4 percent for a shock in AEs (Figure 7, right side in lower panel). Results for individual commodities point to larger spillovers to energy and metal prices (around 9 percent) as opposed to food prices (4 percent).16
13. Lower commodity prices would have distributional implications among advanced, emerging, and low-income countries. Distributional effects would reflect changes in the terms of trade. The first-round effects on trade balances following a decline in energy (9 percent), metal (9 percent) and food (4 percent) prices, consistent with 1 percent lower EM growth, depict winners and losers depending on the commodity exporter and importer status (Figure 8). For instance, Saudi Arabia’s trade balance could be reduced by about 4 percent of GDP while trade balances for commodity-importing advanced, emerging, and developing economies could increase by up to 2 percent. The capacity to cope with these large movements in the terms of trade depends on the available policy buffers and institutional arrangements. In the Middle East and North Africa, the Cooperation Council for the Arab States of the Gulf (GCC) countries can withstand an oil price shock while non-GCC oil exporters would experience larger fiscal deficits (see Box 1). In sub-Saharan Africa, a large and protracted decline in commodity prices could deteriorate current account balances by 2 percentage points on average (see Box 2).17 Although Mexico’s public finances are highly dependent on hydrocarbon-related revenues, Mexico has the necessary stabilization funds and programs to mitigate the impact of a fall in oil prices (see Box 3).
Figure 8. Change in Trade Balance (percentage points)
16 The results are obtained using a simple vector autoregression (VAR) model. Richer models such as factor augmented VARs (FAVARs) are used in addition to sign restrictions to identify specific oil-demand as opposed to oil-supply shocks where production data are available at a monthly frequency (see Annex X). This approach yields quantitatively similar results confirming the prominence of EMs in driving oil prices. 17 For a detailed discussion on the linkages between major EMs and low-income countries, see IMF (2011).
Source: IMF staff calculations.
Between -7 and -4Between -4 and -1Between -1 and 0Between 0 and 2
2014 SPILLOVER REPORT
64 INTERNATIONAL MONETARY FUND
Box 1. Fiscal Implications of Oil Price Declines for Middle East Oil Exporters Middle East and North Africa (MENA) oil exporters are expected to record a fiscal surplus of 2½ percent of GDP in 2014, supported by an oil price of $104 per barrel.1 However, there is considerable variation across countries. The fiscal break-even oil price—that is, the oil price needed to balance the budget—is below $85 and reflects the strong positions of Kuwait, Saudi Arabia, Qatar, and the United Arab Emirates (UAE). The remaining countries require an oil price exceeding $100 to balance the budget. Countries that are not members of the Cooperation Council for the Arab States of the Gulf (GCC) are expected to incur an aggregate fiscal deficit of 3½ percent of GDP this year. Most countries have become more reliant on high oil prices. Oil receipts account for three-quarters of government revenues. The rise in the oil price since the mid-2000s, the global financial crisis, domestic social pressures, and regional tensions prompted MENA oil exporters to raise public wage bills and other government spending, while non-GCC countries have also endured impediments to oil exports. In many cases, the fiscal breakeven price has doubled since 2008. Over the medium term, oil prices are projected to fall while expenditures are expected to rise, resulting in falling fiscal surpluses. Lower oil prices are the main mechanism through which global shocks would affect this group of countries. Lower investment in the G20 EMs (¶24) would reduce the oil price by an estimated $3.50 and $9 in 2014 and
2018, respectively. Assuming no policy response, this would worsen the fiscal balance by about 1 and 5 percent in 2014 and 2018, respectively. Kuwait and the UAE would escape fiscal deficits, and, together with Saudi Arabia and Qatar, have the reserves to conduct countercyclical fiscal policy to support aggregate demand if necessary. The non-GCC oil exporters would endure worse deficits and have limited fiscal space.
A long-lived oil price shock would have more serious consequences. A $25 fall in the price in 2015 relative to the baseline, to which options markets attach a 7 percent chance, would induce an aggregate deficit of 4 percent of GDP. Were this shock to persist, the aggregate deficit would be 6½ percent in 2018 and only Kuwait would run a surplus. These calculations assume no policy response, but such a shock could induce a slowdown in government spending, which would negatively affect a non-oil economy that is highly reliant on the public sector, and carries risks for financial systems in some countries. These shocks would be propagated to neighboring oil importing countries and South Asia via lower remittances (see box 7).
Fiscal consolidation would increase resilience to shocks. The non-GCC countries in particular need to build fiscal buffers to be able to smooth out shocks. This could be achieved by containing hard-to-reverse current expenditures and by pursing non-oil revenue sources like a value added tax.
_________________________ 1 The MENA oil exporters include the Cooperation Council for the Arab States of the Gulf (GCC) countries (Bahrain, Kuwait, Oman, Qatar, Saudi Arabia, and the United Arab Emirates) and the non-GCC countries (Algeria, Iran, Iraq, Libya, and Yemen).
ALG
BHRIRN
IRQ
KWT
LBY
OMN
QAT SAUUAE
YMN
020406080
100120140160180200220
-10 0 10 20 30 40 50 60 70 80 90 100 110 120 130
Fis
cal b
reak
even
pri
ce, 2
014
Change in fiscal breakeven price, 2008-14
Fiscal Breakeven Price, (U.S. dollars per barrel)1
Change in WEO oil price, 2008-14: $7
WEO oil price, 2014: $104
Sources: National authorities; and IMF staff calculations.1Yemen breakeven, 2013, change from 2009-13.
-8
-6
-4
-2
0
2
4
6
2013 2014 2015 2016 2017 2018
BaselineOil prices $25 below baseline from 2015EM G20 Slowdown
Sources: National authorities; and IMF staff calculations.Note: MENAP (Middle East, North Africa, Pakistan and Afghanistan).
Fiscal Balances Are Falling and Vulnerable to Oil Prices(MENAP oil exporters; percent of GDP)
2014 SPILLOVER REPORT
INTERNATIONAL MONETARY FUND 65
Box 2. Estimating Effects of a Slowdown in Emerging Market Economies on Sub-Saharan Africa
This box looks at the potential effects on sub-Saharan Africa from a growth downturn in emerging market economies (EMs) resulting in significantly reduced growth and lower global commodity prices. A much more adverse economic environment in EMs could affect sub-Saharan Africa through higher financing costs and reduced trade, as well as lower investment (both direct and portfolio) and donor support.
The downturn scenario is developed for the 11 largest economies in sub-Saharan Africa, which collectively account for more than 80 percent of the region’s output.1 The analysis looks at the impact on the region’s real GDP growth, inflation, and fiscal and external balances. The shock consists of a 10 percent decline in private investment in Brazil, Russia, India, China and South Africa (BRICS), which constitute the main source of demand for commodities from the region. The shock is concentrated in the first year, gradually dissipating over the following three years.2
The effect is estimated to be sharp but relatively short lived relative to the baseline (see Box figure). Regional GDP growth would fall 0.5 percentage points, with inflation easing modestly, partly from the softening of world prices. Fiscal balances would deteriorate about 2 percentage points of GDP. The current account deficit would moderate some 0.9 percentage points of GDP, mainly reflecting mainly lower FDI-related imports but also lower commodity prices at the global level. Oil exporters would be hit hardest, but also best positioned to weather the shock in most cases as they have been able to accumulate policy buffers. These results are illustrative and should be taken with caution. First, the assumptions may not reflect a worst-case scenario in which economic activity in EMs deteriorates significantly for a protracted period. Second, the view of the region-wide impact hides significant differences across countries, including the effects on fiscal policy space. Finally, country-specific structural shortcomings and risks may be exacerbated under more adverse global conditions.
_________________________ 1 Angola, Cameroon, Côte d’Ivoire, Ethiopia, Ghana, Kenya, Nigeria, Senegal, South Africa, Tanzania, and Uganda. 2 For details about baseline assumptions and scenario see Chapter 1 of IMF (2013f).
Sources: IMF, World Economic Outlook database; and IMF staff estimates.
5.5
6.0
6.5
7.0
7.5
2013 2014 2015 2016 2017 2018
Perc
ent
Real GDP growth
6.0
6.5
7.0
7.5
8.0
8.5
9.0
2013 2014 2015 2016 2017 2018
Perc
ent
Inflation
-5
-4
-3
-2
-1
0
2013 2014 2015 2016 2017 2018
Perc
ent o
f GD
P
Fiscal balance
-5
-4
-3
-2
-1
0
2013 2014 2015 2016 2017 2018
Perc
ent o
f GD
P
Current account balance
Baseline Emerging Markets slowdown
2014 SPILLOVER REPORT
66 INTERNATIONAL MONETARY FUND
Box 3. Hedging the Impact of Oil Prices on Public Finances: The Case of Mexico
Mexico’s public finances are highly dependent on hydrocarbon-related revenues, yet these revenues are not a major source of balance of payments vulnerability. Hydrocarbon-related revenues (both from exports and domestic sales of oil and natural gas) represent about a third of total federal revenues. But because Mexico imports fuels, the net effect on hydrocarbon-related revenues of an oil-price decrease depends also on the change in the price of crude oil relative to the international price of gasoline. Furthermore, subsidies on domestic fuel prices decline in the context of lower imported fuel prices, thus reducing the fiscal net effect of a decline in international oil prices. For 2014, it is estimated here that a US$10 decline in international oil prices could worsen the primary fiscal balance by 0.2 percent of GDP, before any offsetting fiscal measures. Despite being a fiscal vulnerability, fluctuations in world oil prices are not a major source of balance of payments risk. Oil exports represent only 13 percent of total exports, and after netting out oil-derivative imports, the hydrocarbon trade surplus is about 1 percent of GDP. To insure against these fiscal risks, Mexico has several stabilization funds and a program to hedge the risk of a fall in world oil prices. The stabilization funds are quite complex and act mainly as a buffer for unexpected declines in oil and non-oil tax revenues. Moreover, at 0.3 percent of GDP in 2013, after peaking at 1.7 percent in 2008, the funds are too small to offer sufficient self-insurance. In addition, each year Mexico purchases Asian put options to hedge the price of its oil throughout the year and not only at a particular expiration date, using Maya oil (one of the three types of Mexican crude that compose the Mexican oil mix) as the underlying asset.1 The program proved particularly useful after the collapse of oil prices at the onset of the global financial crisis. To safeguard the 2009 budget, the authorities hedged about 70 percent of PEMEX (the state-owned Mexican oil company) gross exports of crude oil at the budgeted price of US$70 per barrel for the Mexican oil mix (compared with an actual average price of US$57 dollars for 2009). The size of this operation was chosen to effectively hedge all of PEMEX net export revenues (IMF, 2009, Box 2). While the oil price hedges have been useful, a key policy priority is to reduce the government’s excessive reliance on oil revenues. Mexico’s hedge program can be a lesson for other emerging markets. But costs and risks need to be managed properly. Designing a program of this sort requires making decisions on the instrument, underlying asset, strike price, selection of the counterparty, and appropriate collateral policy. For instance, Mexico uses Maya oil as an underlying asset, which is more relevant for its fiscal accounts but for which there is no liquid futures market. Using options to insure only against large negative shocks, like in Mexico, can be more cost-effective than attempting to smooth all shocks. Strengthening the stabilization funds can help deal with smoothing shocks. Over the long term, however, reducing the dependency on oil-derived fiscal revenues is desirable in order to build a natural hedge. Toward this end, Mexico has recently passed a comprehensive fiscal reform that aims to boost non-oil tax revenues, which will contribute to making its public finances less vulnerable to fluctuations in world oil prices. __________________________ 1 The payoff of an Asian put option is determined by the difference between the strike price and the average price of the underlying asset over a predetermined period. More details about Mexico’s hedging program can be found in Duclaud and Garcia (2012).
2014 SPILLOVER REPORT
INTERNATIONAL MONETARY FUND 67
14. Globally, lower commodity prices could somewhat cushion the impact on growth. At the global level, lower commodity prices would act as a stabilizer, given lower input costs. Model simulations suggest that world GDP growth would be about 0.3 percentage points higher than without the commodity price declines following a 1 percent growth shock in EMs.18 In addition, Saudi Arabia, as the largest oil exporter, could play an important stabilizing role in the global oil market due to its large spare capacity to respond to supply disturbances. However, with the “shale revolution” taking place in the United States, the role of Saudi Arabia in meeting demand increases and supply shortfalls in other countries has diminished over the past two years (see Box 4).
C. Spillovers through the Global Financial System
15. Financial linkages between advanced and emerging market economies have grown rapidly over the past decade, leading to two-way spillovers. Bank linkages and cross-border holding of securities have grown. For example, in early 2014, financial markets experienced considerable volatility and a wider sell-off in risky assets due to a confluence of factors, with EM assets (equities and currencies, in particular) suffering significant losses alongside declines in U.S. equity prices. This high comovement of financial markets also highlights the risk of contagion during periods of financial stress.
16. Banking linkages have grown over time with higher cross-border credit exposures. In AE banks, exposures to EMs grew from 10 percent in 2005 to 20 percent of total foreign claims in 2013 (Figure 9, left side in top panel). At the aggregate level, these bank claims are concentrated on Asian borrowers (Figure 9, middle of top panel) and on the EM nonbank private sector (Figure 9, right side in top panel).
17. Banking spillovers are analyzed through two stress scenarios: a temporary downturn and a persistent slowdown. These scenarios are linked to other scenarios presented in the rest of the chapter. The temporary slowdown, based on 2014 cyclical shocks, assumes an average fall in GDP growth below the baseline of about 0.2 and 0.6 percentage points for advanced and emerging economies, respectively. The persistent slowdown scenario, based on a structural TFP shock in EMs over the period 2014–19, assumes a similar shock per year over the medium term. To analyze the magnitude of cross-border spillovers associated with the output losses from these slowdowns and associated higher nonperforming loans (NPLs) (Figure 10, top panel), a stylized bank-contagion model is used (Figure 10, bottom panel).19 In the model, when losses bring down capital buffers
18 The simulation results are based on the G20MOD module of the Flexible System of Global Models (FSGM), a forward-looking semistructural global model consisting of 24 regions, developed at the IMF. 19 Results from Cerutti and others (2010) and Buncic and Melecky (2013) are used to estimate the increase in NPLs (in percent of loans) resulting from EM and AE growth slowdowns. Simulations to calculate capital losses that would arise from nonbank borrowers’ inability to repay cross-border loans from AE banks are calculated based on the RES Bank Contagion Model (see Cerutti, Claessens and McGuire (2012) for more details). In the model, following Cerutti (2013), foreign claims exposures are adjusted in order to exclude the share of foreign subsidiaries’ assets funded with local customer deposits. A similar network model, Espinosa-Vega and Solé (2010), is used to run a similar simulation in the EM and AE cross-border interbank lending market. See also footnote in Figure 11.
Sources: BP Statistical Review of World Energy 2013; IEA; and IMF staff calculations.
Saudi Arabia's Role in the Global Oil Market
Cumulative Production
(1990–2012)
Average Spare Capacity (2013)
Reserves (2012)
0
5
10
15
20
25
mil
lio
n b
arr
els
pe
r d
ay
Saudi ArabiaOther OPECSources: JODI database, Bloomberg and IMF staff calculations.
Monthly Crude Oil Production, 1990 - Feb 2014
First Gulf War
Venezuelan Strike and Second Gulf War
Libyan Unrest- 2011
Libyan Unrest-2013 to Feb 2014
US Recessionearly 2000
Global Financial Crisis 2008
Box 4. Saudi Arabia’s Role in Stabilizing the Global Oil Market Saudi Arabia is a central player in the global oil market given its large reserves, high production levels, and significant spare production capacity. Saudi Arabia accounts for over 16 percent of global proven reserves and most importantly for the global economy, it has been able to scale up production quickly because of its high spare capacity of over 2.7 million barrels a day, which accounts for over half of the global spare capacity. Saudi Arabia has responded to supply shocks in other countries by adjusting its own output to help stabilize the global oil market. For example, during the first Gulf war (1990–91), the Venezuelan strike and the second Gulf war (2002–03) and the Libyan crisis (2010–11), Saudi Arabia increased its production to ensure that demand for oil was met in the face of declining supply from other sources. Similarly, on several occasions during periods of weak or declining global oil demand, such as the U.S. recession in the early 2000s and the global financial crisis (2008–2010), Saudi Arabia has scaled back its own production in response to excess supply in the market. Over the past two years, Saudi Arabia raised its production in the first half of 2012 as sanctions on Iran were tightened, but then scaled back production in the second half of 2012 as output in the United States, Libya, and Iraq increased. It then increased production again in the second half of 2013 as Libyan production fell. However, since late 2012, the rapid increase in U.S. oil production has meant that Saudi Arabia has played a more limited role in meeting supply shortfalls elsewhere than it did during 2011. Bottom line: Saudi Arabia is the only country with significant spare production capacity and hence it plays a key stabilizing role in the global oil market. This contributes positively to global economic stability and growth. However, since late 2012, the rapid increase in U.S. oil production has meant that Saudi Arabia has to increase its supply by less to meet shortfalls elsewhere than it did during 2011.
below a threshold of 8½ percent of Tier 1 capital, banks would start to deleverage.20 Banks would start recalling claims, and this retrenchment would affect both AE and EM borrowers.21
20 Most EMs are able to meet the Basel III minimum Tier 1 capital requirement of 6 percent. However, when conservation buffers are included, India and Hungary appear to fall short while Chile, Russia, and South Africa are at the margin (IMF, 2014d). 21 This analysis has certain data limitations and makes simplifying assumptions. Bank losses and deleveraging needs are calculated at the national banking system level of BIS reporting countries, since bank level data on bilateral exposures are not available. In addition, the analysis ignores bank recapitalizations as well as other remedial policy
Cumulative change in crude oil supply and demand since 4Q10
1/ A negative value suggests an increase in global demand and vice versa.
Source: IEA, Bloomberg and IMF staff calculations.
2014 SPILLOVER REPORT
INTERNATIONAL MONETARY FUND 69
0
5
10
15
20
25
30
35
2005 2007 2013
Total claims Claims on EM
Foreign Claims of AE Banks(trillion U.S. dollars)
Sources: Bank for International Settlements, Consolidated Banking Statistics; and IMF Reserarch Deapartment Bank Contagion Module.
0
1
2
3
4
5
2005 2007 2013
Asia Europe Latin America Other EMs
Foreign Claims of AE Banks on EM Borrowers(trillion U.S. dollars)
0
1
2
3
4
5
2005 2007 2013
Public sector Private sector Banking sector
0.0
0.5
1.0
1.5
Persistent EM slowdown
Temporary EM slowdown
Funding stress
Total Bank Capital Losses (percent of GDP)
Source: IMF staff calculations based on Bank for International Settlements, Central Banks, Bankscope, and International Financial Statistics data.
EMLosses
AE Losses
0
1
2
3
4
5
6
x 1 x 1.5 x 2 x 2.5 x 3
Total Bank LossesCross-Border Bank Deleveraging
Bank Losses and Deleveraging under MultipleAdverse Scenarios(percent of GDP)
Source: IMF staff calculations based on Bank for International Settlements, Central Banks, Bankscope, and International Financial Statistics data.
Figure 9. Spillovers from Bank Linkages
18. A temporary downturn would not trigger large bank losses, but a more persistent slowdown would generate large losses in bank capital (Figure 9, left side in lower panel). Banks’ estimated capital losses—driven by a worsening of the macroeconomic conditions beyond the baseline and the subsequent impact on banks’ exposures, especially in the nonbank private sector—could be between 2 and 3½ percent of GDP for Austria, Denmark, the Netherlands, Spain and Sweden (top panel of Figure 11), and above 17 percent of Tier I capital in the cases of Spain and Sweden. These losses capture not only the banks’ relatively higher exposure to specific EMs, but also their exposure to AEs (including their own) based on the impact of the EM slowdown on AE growth. Hence, despite estimating more severe losses in EMs, the main losses for several AE banks, such as Sweden, do not originate in direct EM exposures, given their relatively small share of total exposures.
actions, and assumes the deleveraging process to be uniformly distributed across all international bank assets (domestic and external) to exclude additional subjective judgments.
2014 SPILLOVER REPORT
70 INTERNATIONAL MONETARY FUND
Figure 10. Spillovers through the Banking Channel: The Mechanics
19. Risks to AEs through the banking channel could increase with the severity of the EM slowdown. The more severe and protracted the EM slowdown, the larger would be the bank losses, with the deleveraging impact being highly nonlinear. Once bank losses are large enough that they exhaust capital buffers, banks would start the deleveraging process, which could trigger fire sales and further deleveraging (through adverse feedback loops). The existing capital buffers would be just enough to offset the losses triggered by the increase in NPLs across sectors in the adverse scenario (i.e. there is no deleveraging in Figure 9, right side in lower panel). Nevertheless, capital buffers would be exhausted in some banking sectors even with a small further increase in the size of bank losses, triggering increasing levels of bank deleveraging. The outcomes are nonlinear, with a doubling and tripling of the severe scenario slowdown triggering large levels of cross-border bank deleveraging. This potential cross-border deleveraging could have an impact on EM borrowers in Eastern Europe and Latin America, countries that have ties with the Austrian, Spanish, and Swedish banking sectors.
Loan Losses due to Increase in NPLs (percent of loans)
Source: IMF staff calculations.
More than 5Between 2 and 5Between 1 and 2Between 0.5 and 1Less than 0.5
Mechanics of the Banking Channel
EMs default
rate
Banks' adjusted foreign claims
Funding shockto borrowers
Borrowers' firesales
AE and EMcapital buffers
If buffers exhausted,
partial deleveraging
PersistentEM Slowdown+ Higher Risk
Premium
Note: The red squares/boxes also denote the transmission channel of the EM funding shock (Figure 11, third panel). Stemming from an extreme slowdown in EM growth and large increase in the VIX, AEs could pull back funding from EMs that triggers fire sales in EMs and further lowering of their capital buffers.
2014 SPILLOVER REPORT
INTERNATIONAL MONETARY FUND 71
Figure 11. Bank Losses under Stress Scenarios (percent of GDP)
Nonbank private sector exposures: Some advanced economy (AE) banks will suffer sizable losses due to higher nonperforming loans (NPLs) triggered by the global slowdown.
Note: Simulations are based on the RES Bank Contagion module using consolidated banking statistics from the Bank for International Settlements (BIS), central banks, Bankscope, and International Financial Statistics data. First-round domestic and foreign losses on each BIS reporting banking system (i) are calculated as ∑ Banks′Exposure x∆NPL xLGD , where Banks’ Exposuresij denotes the banking sector i exposure to the nonbank private sector of borrowing country j, the borrowing country j's loss given default (LGD), and ∆NPLj capture the difference between the baseline and the scenarios assumed projected evolution of NPLs (as a result of deviations in GDP growth and interest rates). If losses exceed capital buffers above the assumed 8½ percent Tier I ratio, second-round deleveraging impacts are triggered. Existing bank loss provisions are not included since calculations are based on deviations from baseline (non-expected losses). See Cerutti, Claessens and McGuire (2012) for more details.
Interbank: The European AEs that lend to emerging market economy (EM) banks, and the Asian EMs that lend to the region are the most affected.
Note: Uses BIS Locational Statistics, bilateral exposures (USD) between banking systems, and Espinosa-Vega and Solé (2010). The simulations assume that each banking system under stress cannot pay back a λ percent (=NPL x LGD) of its debt to another banking system—the NPL is assumed to be the same as those computed from the RES Bank Contagion Module in panel 1 and LGD=1. The capital loss is calculated as λ x Interbank exposure. Where losses exceed the available capital buffer, second-round effects are triggered.
Interbank: In addition to the financial centers, if AEs retrench funding from EMs, the European EMs would be most affected.
Note: Uses BIS Locational Statistics bilateral exposures (in U.S. dollars) between banking systems, and Espinosa-Vega and Solé (2010). The simulations are based on AEs failing to rollover ρ percent of their funding to EMs; EMs have to fire sale assets at a haircut of 1/(1+δ). The capital loss is ρ x δ x funding from AEs. A fixed effects panel regression for 20 EMs 1994:Q1–2013:Q2 was used to benchmark ρ: ∆ CrossborderGrossLiabilities c αx∆RealGDP βxSync γxVIX ε , where Sync=1 for synchronized slowdowns. ρ=14 percent for synchronized slowdowns when VIX changed by 21.4 points and Real GDP growth slowed by 13.3 percentage points—both at their historic 5th percentile levels.
Sources: IMF staff calculations based on BIS; central banks; Bankscope; and IFS data.
0
1
2
3
4
SW
E
NLD
ES
P
DN
K
AU
T
PR
T
DE
U
GR
C
FR
A
CH
E
GB
R
CA
N
ITA
BE
L
IRL
US
JPN
AU
S
FIN
Nonbank AE
0.0
0.5
1.0
1.5
2.0
2.5
3.0
3.5
4.0
LU
XC
YP
AU
TU
KN
DL
BE
LF
INS
WE
GR
EIR
LIT
AJP
AS
WI
DE
UF
RA
ES
PC
AN
PO
RU
SA
AU
LD
NK
NW
YH
KO
SG
PP
AN
MY
SK
OR
TH
AS
AF
PE
RC
HL
TK
YB
UL
CO
LID
OC
HN
PH
LL
VA
IND
RU
SH
UN
BR
ZM
EX
PO
LC
ZE
RO
ML
TU
UK
R
Interbank AE (red) and EM (blue)
0
5
10
15
20
25
30
SG
P
HK
O
ES
T
CR
O
LV
A
HU
N
RO
M
LT
U
PA
N
BU
L
PO
L
CH
L
KO
R
TK
Y
CZ
E
TH
A
UK
R
RU
S
IND
PE
R
SA
F
PH
L
BR
Z
MY
S
ME
X
CO
L
IDO
CH
N
Haircut=10 percent Haircut=50 percent
Interbank EM: 14 Percent Funding Retrenchment by AEs from EMs
2014 SPILLOVER REPORT
72 INTERNATIONAL MONETARY FUND
20. Bank losses in EMs through the cross-border interbank channel are mostly limited, except for the financial centers. Almost three-quarters of cross-border interbank funding of the EM banking system is provided by AE banks. Hence, the retrenchment by AEs from EM banks, which has been evident in past episodes of financial turmoil, could create additional capital losses for EMs of about 0.3 percent of GDP. These losses, however, could be quite significant for Asian financial centers like Hong Kong SAR (2 percent of GDP) and Singapore (3 percent of GDP), but close to ½ percent of GDP for Estonia and Latvia (middle and lower panel of Figure 11). These losses would increase nonlinearly with the assumed size of the haircut for asset fire sales (Figure 11, bottom panel).
21. Financial spillovers from a slowdown in EMs could also take place through cross-border holdings of securities.
Advanced economies’ EM-equity holdings. A slowdown in EMs can lead to substantial spillovers through asset markets. Spillover channels could include equity cross-holdings, equity performance of companies with EM exposures, and general market sentiment effects. AEs with large exposures to EM assets, such as the United States, Japan, and the euro area, could be susceptible to significant valuation and wealth effects resulting from a sharp fall in asset prices and currencies in these economies (see Annex I to the Overview Chapter for the impact of negative EM news on financial markets). For example, AEs’ direct holdings of foreign direct investment (FDI) and portfolio equity in EMs is close to 15 percent of GDP (Figure 12), compared with only 4 percent of GDP for portfolio debt (Figure 13). Similarly, AE firms with EM exposures could experience lower sales and revenues from EMs due to a slowdown, which would adversely affect their stock valuation (Figure 14). Finally, more severe financial turbulence in EMs could sour investors’ risk sentiment more generally and result in much larger corrections in global financial markets (for example, correlated asset price declines).
Advanced economies’ EM-debt holdings. At the same time, advanced economies hold emerging market debt, which represents about 7 percent of their overall external debt holdings. International bond issuance by EM corporations has risen sharply since 2011(Turner, 2014). Given that a high share (20 percent) of emerging European and Asian foreign currency debt outstanding is maturing in 2014, a deterioration in the economic conditions in EMs could put the repayment of this debt at risk, especially if corporate health deteriorates (IMF, 2014d).22
Emerging market economies’ AE debt holdings. Since EMs hold AE portfolio debt instruments, AEs could be vulnerable to a sudden reduction in demand from EMs for these instruments. For instance, China is the second-largest exporter of capital in the world, after the United States, and China’s central bank is the largest purchaser of U.S. financial assets (IMF, 2013d). An EM shock
22 Recently, slower growth prospects have put pressures on corporate profitability, resulting in a steady deterioration in earnings relative to debt-service ratio. The proportion of weak firms—those with interest coverage ratio below 1—has increased significantly in Latin America, followed by Asia and by Europe, the Middle East and Africa (EMEA) (IMF, 2014c). To the extent that investments are channeled through financial centers, the balance of payments data do not truly reflect risks posed by EM exposure to AEs (Turner, 2014; OECD, 2014).
2014 SPILLOVER REPORT
INTERNATIONAL MONETARY FUND 73
0
5
10
15
20
25
30
35
JPN US EU-12 CAN AUS NZL AE 4/
Direct holdings 1/
Estimated holdings including through OFCs 2/
Percent of GDP 3/
Sources: IMF, Coordinated Direct Investment Survey, Coordinated Portfolio Investment Survey, World Economic Outlook; and staff calculations.1/ Position in EMs: 25 EM country sample.2/ Overseas Financial Centers (OFCs) include The Bahamas, Bermuda, British Virgin Islands, Cayman Islands, Guernsey, Isle of Man, Jersey, Netherlands Antilles; and nonspecified countries.3/ Midpoint of direct and estimated holdings.4/ Australia, Canada, Japan, New Zealand, United States; and EU-12, which includes Belgium, Denmark, France, Germany, Greece, Ireland, Italy, Luxembourg, the Netherlands, Portugal, Spain, and United Kingdom.
Figure 12. AEs: 2012 FDI and Portfolio Equity Position in EMs
(percent of total FDI and portfolio equity abroad, U.S. dollars)
Figure 13. AEs: 2012 Portfolio Debt Position in EMs
(percent of total portfolio debt abroad, U.S. dollars)
Figure 14. Stock Market Index Performance
(U.S. dollar terms, March 2007 = 100)
that could slow the pace of reserve accumulation in China or cause a sell-off of its reserves to defend its currency could raise long-term yields in AEs. Some of these adverse effects could be offset by a greater safe-haven flow of capital back to AEs. A similar rise in AE long-term yields could occur if China rebalances its portfolio away from the United States to EM treasury securities (IMF, 2011). However, the effect on AE yields could be offset by increased demand from US institutional investors, as was witnessed during the 2011–13 slowdown in China’s purchases of U.S. Treasuries.
SPILLOVERS THROUGH "NEIGHBORHOOD" EFFECTS 22. A slowdown in individual EMs could affect neighboring countries given strong regional links. Over the past decade, there has been a dramatic increase in the degree of regional integration, especially in Asia.23 Intraregional trade represents an increasingly larger share of global trade. Cross-border financing flows among EMs in certain regions have expanded progressively since the early 2000s. As regional linkages strengthen, the exposure of countries to shocks originating in the biggest economies in the region rises. This underlines the significance of localized spillover effects from a deceleration in large EMs. This section briefly discusses growth spillovers from four major EMs—China, Brazil, Russia, and Venezuela—as they have strong regional linkages through trade, cross-border financing and remittances.24
23 See Kose and Prasad (2010); CGFS (2014); Lane and Milesi-Ferretti (2007); and Milesi-Ferretti, Strobbe, and Tamirisa (2010). 24 Regional spillovers from India and South Africa appear to be limited. India doesn’t have strong regional links, except with Nepal (see IMF, 2014a, 2014b). By contrast, South Africa and its neighbors are tightly integrated through currency and customs unions. However, there have been only small outward regional spillovers from South Africa since the mid-1990s after controlling for global growth (see Kabundi and Loots, 2007; IMF, 2012; Canales-Kriljenko, Gwenhamo, and Thomas, 2013; and Basdevant and others, 2014). Explanations for these findings include the fact that
(continued)
0
2
4
6
8
10
12
14
16
18
20
US EU-12 AUS CAN JPN NZL AE 4/
Direct holdings 1/
Estimated holdings including through OFCs 2/
Percent of GDP 3/
Sources: IMF, Coordinated Portfolio Investment Survey, World Economic Outlook; and staff calculations.1/ Position in EMs: 25 EM country sample.2/ Overseas Financial Centers (OFCs) include The Bahamas, Bermuda, British Virgin Islands, Cayman Islands, Guernsey, Isle of Man, Jersey, Netherlands Antilles; and nonspecified countries.3/ Midpoint of direct and estimated holdings.4/ Australia, Canada, Japan, New Zealand, United States; and EU-12, which includes Belgium, Denmark, France, Germany, Greece, Ireland, Italy, Luxembourg, the Netherlands, Portugal, Spain, and United Kingdom.
40
50
60
70
80
90
100
110
120
130
140
150
07 08 09 10 11 12 13 14
STOXX Global 1800 EM Exposed 1/S&P 500
Source: Bloomberg, L.P.1/ STOXX Global 1800 EM Exposed index represents those companies within the STOXX Global 1800 Index that derive a substantial part of their revenues from emerging market countries.
6/9/2014
2014 SPILLOVER REPORT
74 INTERNATIONAL MONETARY FUND
0
1
2
3
4
5
6
7
GTM
HN
DLC
ASU
REC
UBR
BCR
IPA
NAR
GU
RYBO
LPR
YSL
VVC
TD
MA
DO
MKN
AAT
GJA
MBL
ZH
TIG
RDG
UY
NIC
1/
Sources: Country authorities; Petróleos de Venezuela, S.A; and IMF staff estimates.1/ Includes 1.5 percent of GDP foreign direct investment.
Country average = 1.6
China. Integration in Asia has been faster than in other regions, with China playing a pivotal role in the expansion of both trade and financial linkages through FDI (Figure 15). A slowdown in China would have important growth spillovers in emerging Asia through the trade channel, whereas Asian low income-countries would be affected via a reduction in FDI (see Box 5).
Brazil. In South America, regional trade agreements have contributed to strengthening trade linkages between the Southern Cone countries and Brazil. Given its size, Brazil has become a large consumer of goods produced by its neighbors. These countries are, therefore, vulnerable to a slowdown in Brazil (see Box 6).
Venezuela. Many countries in Central America and the Caribbean import oil from Venezuela under favorable financing conditions through various energy cooperation agreements. Some countries have become highly dependent on these arrangements (Figure 16) and, as a consequence, are exposed to shocks originating in Venezuela that could lead to the cancellation or tightening of the conditions of these agreements (see Box 7).
Russia. Russia is the largest contributor of remittances in its region (Figure 17). This contrasts with the patterns observed in other regions, where only one or two countries benefit from the remittances of the biggest economy in their neighborhood.25 Consequently, a slowdown in Russia would have important and widespread regional effects through a sharp decline in remittances (see Box 8).
Figure 15. EMs Intra-regional Trade
(percent of total exports, 2010–2012 average)
Figure 16. External Financing from Venezuela
(percent of GDP, 2012)
Figure 17. Remittances from BRIS, by Destination (percent of total, 2012)
South Africa and the rest of the continent might have decoupled in the mid-1990s, as South Africa reintegrated with the global economy, while growth in the rest of the continent accelerated due to a combination of domestic and external factors. Similarly, the fact that regional markets and supply chains in Africa are fragmented—reflecting barriers to the movement of capital and labor such as poor infrastructure—could also play a role. 25 Note that a significant amount of remittances from Brazil goes to countries outside the region.
0
5
10
15
20
25
30
35
40
45
50
Exports from Asia
Exports from Southern Cone 1/
Exports from CEE+CIS
Exports from Africa
Sources: IMF, Direction of Trade Statistics; and staff calculations.1/ Argentina, Chile, Paraguay, and Uruguay.
to other Asia
to Brazil
to other Southern
Cone
to other CEE + CIS to other
Africa
to Russia to SouthAfrica
to China
0
10
20
30
40
50
60
70
80
90
100
Russia South Africa India BrazilSources: World Bank, Migration and Remittances database; and IMF staff calculations.
Portugal
Spain
Japan
Lebanon
Italy
Other
Ukraine
Tajikistan
Kyrgyz Republic
Azerbaijan
Armenia
Other
Bangladesh
Pakistan
Nepal
Sri Lanka
Lesotho
Mozambique
Swaziland
Botswana
2014 SPILLOVER REPORT
INTERNATIONAL MONETARY FUND 75
Box 5. Intraregional Spillovers from China China’s trade links with the rest of Asia have grown significantly over time. During the 1990s regional integration in Asia was faster than in other regions, owing largely to China’s role in the regional supply chain as an “assembly hub.” IMF staff estimates suggest that by end-2000s, China accounted for about 50 percent of intraregional trade flows of imported inputs, doubling its share since 1995. China has also become a larger consumer of final goods produced in other parts of Asia. Similarly, trade linkages between China and the Asian middle- and low-income countries have also grown, driven in part by the sevenfold increase of trade flows between China and the Pacific Island countries since the early 2000s (Sheridan, Tumbarello, and Wu, 2012).
Financial integration of China with the rest of Asia is also growing, with the main channel being foreign direct investment (FDI). The share of intraregional FDI in Asia has increased by about 15 percentage points since 1990, a third of which is accounted for by China. This partly reflects the expansion of Chinese FDI to middle- and low-income countries in Asia, where the largest recipients are Mongolia, Myanmar, Cambodia and Vietnam (Dabla-Norris, Espinoza, and Jahan, 2012).
Given deeper regional integration, spillovers from China can be significant. A 1 percentage point decline in China’s growth may lower GDP growth in the median Asian economy by about 0.3 percentage point after a year, compared with an estimated impact of around 0.1 percentage point for the median non-Asian economy (Duval and others, 2014).
However, spillovers across countries differ, due to the heterogeneous nature of their linkages with China. Since investment has been the largest contributor to Chinese growth, a sharp investment deceleration in China would affect major commodity exporters with less diversified economies, such as Indonesia. Economies that lie within the Asian regional supply chain—Korea Taiwan Province of China, and Malaysia—would also be adversely affected by this type of shock (Ahuja and Nabar, 2012). 1
Other spillover channels include tourism arrivals and FDI, which have surged in several Asian countries, including Fiji and Vanuatu, and concessional loans—a prominent benefactor of which is Tonga, where loan disbursements from China amount to 6 percent of GDP.
Policy implications. Policy responses include strengthening individual economies’ resilience to shocks by quickly rebuilding buffers to avoid procyclical monetary and fiscal responses. Broad financial safety nets can also play a role. For low-income countries, policy responses also include structural reforms to attract FDI. Finally, public investment in infrastructure, health, and education will attract private investment, including in the tourism sector. _______________________ 1 Estimates for growth spillovers from China to the region in Duval and others (2014) are consistent with the regional growth spillover estimates implied by Ahuja and Nabar (2012).
-1
-0.8
-0.6
-0.4
-0.2
0
IDN PHL THA KOR MYS TWN
Effect on Median Asian Economy
Growth Effect of 1 percentage point decline in Chinese Investment (percentage points)
Source: Ahuja and Nabar (2012).
0
5
10
15
20
25
IND
SG
P
THA
MY
S
IDN
PH
L
HK
G
JPN
KO
R
TWN
1995
Latest
Value Added Exported to China for Final Demand(percent of total value added exported for final demand)
Sources: Organisation for Economic Co-operation and Development, World Trade Organization; and IMF staff calculations.
0
10
20
30
VNM KHM MMR MNG
2002 2012
Stock of Inward FDI from China(percent of total stock of inward FDI)
Sources: United Nations Conference on Trade and Development; and IMF staff calculations.
2014 SPILLOVER REPORT
76 INTERNATIONAL MONETARY FUND
Box 6. Intraregional Spillovers from Brazil through Trade Trade linkages with Brazil are significant among the Southern Cone economies, but weak in the Andean region. The Southern Cone economies of the region (Argentina, Bolivia, Paraguay, Uruguay, and—to a lesser extent—Chile) exhibit relatively high export exposures to Brazil. Exports to Brazil are particularly large in Bolivia and Paraguay, representing about 35 percent of total exports (11–13 percent of GDP). By contrast, exports to Brazil are limited in the Andean region (Colombia, Ecuador, Peru, and Venezuela), accounting for less than 3 percent of total exports (½ percent of GDP).
Other potential spillover channels appear limited. In particular, Brazil’s direct financial ties with its neighbors (for example, cross-border bank lending, portfolio and foreign direct investment flows, and remittances) are generally weak.
A vector autoregression (VAR) approach is used to quantify the extent of Brazil’s spillovers to its neighbors. Each country-specific VAR includes a set of global factors (demand, financial conditions, and commodity prices), Brazil’s GDP, and domestic GDP.1 The model is estimated using quarterly data starting in 1990:Q1.
The VAR estimates confirm that the Southern Cone economies are subject to significant spillovers from Brazil, whereas the Andean countries are not. After controlling for common global factors, Brazil’s output shocks have a significant impact on its southern trading partners’ output. The cumulative impact is particularly strong in Paraguay, where a 1 percentage point decrease in Brazil’s growth reduces output by 0.9 percent. The effect is markedly smaller, albeit still significant, in Argentina, Bolivia, and Uruguay (with peak cumulative impacts of about ¼ percent), and even lower in Chile.2 In contrast, the impact of shocks to Brazil’s output on the Andean countries’ output is generally insignificant.
Spillovers from Brazil to the Southern Cone economies are also evident from a variance decomposition analysis. Brazil’s shocks account for a large fraction of GDP variance in Paraguay (16 percent) and Argentina (10 percent) at standard horizons (and about 5–6 percent in Bolivia, Chile, and Uruguay). In the Andean countries, the share of the GDP variance explained by Brazil’s spillovers is negligible.
__________________________ 1 The specifications for Bolivia, Chile, Paraguay, and Uruguay also include Argentina’s GDP, because this country may also be a source of spillovers for the smaller economies. For details about methodology and results, see Adler and Sosa (2014) and IMF (2012a). 2 Results for Bolivia should be interpreted with caution, as its exposure to Brazil increased markedly in recent years, and trade linkages mostly reflect gas exports, which are governed by long-term contracts, with minimum volumes.
1 2 3 4 5 6 7 8-1
-0.5
0
0.5
1
1 2 3 4 5 6 7 8-0.5
0
0.5Argentina
1 2 3 4 5 6 7 8-1
-0.5
0
0.5
1Paraguay Uruguay
1 2 3 4 5 6 7 8-0.5
0
0.5Chile
1 2 3 4 5 6 7 8-0.5
0
0.5Bolivia
Source: IMF staff calculations.1 Response of quarterly GDP growth rate to a one standard deviation (negative) shock to Brazil's quarterly GDP growth rate (1.2–1.6 percentage points) ± 1.5 standard errors. Time horizon in quarters.
Output Response to a Negative Shock to Brazil's Output¹ (Percent)
Sources: Direction of Trade Statistics; and IMF staff calculations.
Exposure to Brazil, 2010-12(Exports to Brazil)
0
5
10
15
0
10
20
30
40
EC
U
VE
N
CO
L
PE
R
CH
L
UR
Y
AR
G
PR
Y
BO
L
Percent of total exports Percent of GDP (right axis)
2014 SPILLOVER REPORT
INTERNATIONAL MONETARY FUND 77
Box 7. Potential Spillovers from Venezuela’s Regional Cooperation Agreements In recent years, Venezuela has provided financial support to countries in Latin America and the Caribbean through various energy cooperation agreements. Under the agreements, Venezuela sells oil at market prices, but gives generous financing conditions to beneficiary countries, including long-term loans at low interest rates, and sometimes the possibility to repay in kind. The volume of oil sold to the region under various agreements (San Jose, Caracas, Integral Cooperation, and PetroCaribe) has stabilized at around 250,000 barrels per day (bpd) after 2009, with values rising to about US$10 billion in 2012.
These arrangements represent a relatively small share of the Venezuelan oil sector, but nonetheless the authorities could decide to reduce this support if the country’s external liquidity constraints become binding. The financing element of these agreements accounts for only about 5 percent of Venezuela’s export revenue (US$4.9 billion) and its accumulated claims on beneficiary countries stood at only about 2.7 percent of Venezuelan GDP (US$10 billion) at end-2012. Nonetheless, given external liquidity constraints, including a continued reduction in international reserves, the authorities could choose to reduce or eliminate these schemes or switch to less generous financing conditions. The authorities publicly avow to continue these agreements, but eight countries have already reported some reductions in PetroCaribe financing in 2013.
Some countries are highly dependent on financing from these arrangements. Beneficiary countries receive financing from Venezuela equivalent to 1.5 percent of GDP per year on average, but in some cases, as much as 3 to 7 percent. Consequently, some Caribbean countries have debt to Venezuela of about 10 percent of GDP (15 percent and 19 percent of GDP for Haiti and Nicaragua, respectively). In the event of an interruption of the agreements or an abrupt change in their conditions, a number of countries could face significant balance of payments gaps and macroeconomic difficulties. These countries would face a difficult choice between adjusting and finding alternative sources of external financing, including from the IMF. Countries with a large balance of payments gap and no access to international markets would likely seek concessional financing.
Given these vulnerabilities, some beneficiary countries have been making contingency plans. For example, Guyana has been saving a substantial part of the PetroCaribe financing to be used as a “sinking fund” and actively reducing its debt with PetroCaribe. Jamaica plans to build larger international reserves over the medium term as a partial buffer for its balance of payments risks. Belize plans to use PetroCaribe financing to further strengthen its external buffers. In Haiti, the authorities are strengthening fiscal and monetary policies to preserve buffers in the form of government deposits with the banking system and international reserves.
0
1
2
3
4
5
6
7G
TMH
ND
LCA
SU
RE
CU
BR
BC
RI
PA
NA
RG
UR
YB
OL
PR
YS
LVV
CT
DM
AD
OM
KN
AA
TGJA
MB
LZ HTI
GR
DG
UY
NIC
1/
External Financing Provided by Venezuela to Beneficiary Countries (percent of GDP, 2012)
Sources: Country authorities; Petróleos de Venezuela, S.A; and IMF staff estimates.1/ Includes 1.5 percent of GDP foreign direct investment
Country average = 1. 6
2014 SPILLOVER REPORT
78 INTERNATIONAL MONETARY FUND
0
5
10
15
20
25
North Africa Middle East CCA
Russia GCCEurope Other MENAOther
Remittance InflowsBy remitting country, percent of GDP, 2012
Sources: World Bank; and IMF staff calculations .
Box 8. Potential Spillovers from Remittances from the Cooperation Council for the Arab States of the Gulf (GCC) and Russia
Remittances play an important role in the oil importing economies of the Middle East and Central Asia and their sources are concentrated. They are countercyclical with respect to activity in the recipient country, which can help smooth domestic business cycle fluctuations. For example, remittance inflows contribute to aggregate demand and tax revenues and are a source of foreign exchange. Remittance receipts are significant in the Middle East (9 percent of GDP), North Africa (6 percent), and the Caucasus and Central Asia (CCA) (21 percent).1 Their share of GDP is one-half in Tajikistan, one-third in the Kyrgyz Republic, and one-fifth in Lebanon. Remittance inflows can be more stable than exports and finance, but their origins are relatively concentrated for the region. The CCA receives almost three quarters of its remittances from Russia, the Middle East gets over half from the GCC2 and other Middle Eastern neighbors, and Europe is responsible for more than three-quarters of remittances from North Africa.
Remittance inflows are vulnerable to downturns in host countries:
For instance, a 1 percentage point fall in GDP in Russia would directly reduce remittances received by the CCA by an estimated 1.5 percent (equivalent to 0.3 percent of GDP). The same shock to GCC GDP would reduce Middle East remittances by an estimated ¾ percent. Because these shocks would affect GDP in other remitting countries, the overall impact on remittances would be larger.3
An investment slowdown in the G20 EMs (¶23) would affect GDP in a number of countries. CCA remittances would fall by an estimated 1¼ percent, mostly because of the direct impact of the investment slowdown in Russia. Spillovers from the G20 EMs to the GCC and Europe would cause remittance inflows to fall in the Middle East and North Africa.
Resilience to shocks associated with remittances needs to be enhanced. The CCA countries need to rebuild the fiscal and external reserves they used during the global financial crisis. The global downturn and political transitions in the Arab world have compounded structural problems and run buffers down to critical levels in many countries in the Middle East and North Africa. Support from the international community would provide the opportunity for these countries to address fiscal sustainability, preserve macroeconomic stability and increase external competitiveness in a difficult political environment. ________________________ 1 Based on data availability and remittance patterns, the oil importers in this analysis are the Middle East (Djibouti, Egypt, Jordan, Lebanon, and Syria), North Africa (Tunisia and Morocco), and the CCA (Armenia, Georgia, Kyrgyz Republic, and Tajikistan). 2 Migrant workers in the GCC also remit substantial sums to South Asia, second only to remittances from the United States. 3 The remittances response will depend on a number of factors including the sectors most affected in the remitting country. For example, a number of CCA migrants work in Russia’s construction sector.
-1.2
-1.0
-0.8
-0.6
-0.4
-0.2
0.0
North Africa Middle East CCA
Russia GCCEurope Other
Remittance Impact of Emerging Market SlowdownFirst year, percent
Sources: Abdih, Y, A. Barajas, R. Chami and C. Ebeke, 2012, “Remittances Channel and Fiscal Impact in the Middle East, North Africa, and Central Asia,” IMF Working Paper 12/104; and IMF staff calculations.
North Africa Middle East CCA
Europe 1 3/4 1/4 1/4
GCC 0 3/4 0
Russia 0 0 1 1/2
Elasticity of Remittances with Respect to Source GDP
Source of GDP shock
Fall in remittances inflows, percent
Sources: Abdih, Y, A. Barajas, R. Chami and C. Ebeke, 2012, “Remittances Channel and Fiscal Impact in the Middle East, North Africa, and Central Asia,” IMF Working Paper 12/104; and IMF staff calculations.
2014 SPILLOVER REPORT
INTERNATIONAL MONETARY FUND 79
RISKS AND POLICIES
A. Scenario Analysis
23. A cyclical and anticipated EM slowdown can yield larger spillovers than if the slowdown were more structural and unanticipated.
Structural versus cyclical: In the short run, a structural slowdown would have smaller spillover effects in comparison with a cyclical slowdown. In the context of a purely cyclical slowdown, monetary policy easing leads to a depreciation of EM currencies, amplifying the decline in their imports, and thereby magnifying spillover effects for partner countries. By contrast, if the slowdown is understood to be structural, monetary policy does not ease materially and EM exchange rates appreciate mildly,26 leading to a more subdued decline in EM imports, and hence dampening spillover effects to AEs. However, a structural slowdown in EMs would have a more long-lasting negative impact in the medium term, which is more pronounced on more open AEs.
Anticipated versus unanticipated: Anticipated shocks would yield bigger spillovers. If the shock is anticipated, EM households and firms immediately adjust their consumption and investment behaviors in response to an immediate fall in permanent income and the expected future return to capital, respectively. The relatively faster adjustment in domestic demand translates into an immediate fall in imports, delivering a larger external shock to AEs.
24. A misperceived structural slowdown produces larger spillovers than an unanticipated structural one. Informed by the analysis in previous sections, scenarios focus on the nature of the EM slowdown. Three downturn scenarios are generated by the G20 model: an unanticipated cyclical, an unanticipated structural and a structural downturn that is initially perceived to be cyclical but turns out to be structural (Figure 18). The last scenario captures the continuous downward revisions in medium-term forecasts. In each scenario, growth falls by about 0.5 percentage point each year for the first three years; thereafter the cyclical shock dies out and growth reverses back to the baseline, while it continues to fall in the case of a structural shock. Depending on the shock scenario, a 1.5 percentage point slowdown in EMs by the end of three years would generate a fall in oil prices of between 2.3 and 4.7 percent and a fall in AE growth between 0.1 and 0.4 percentage point. The impact is much larger on the global economy (between 0.6 and 0.8 percentage point) and particularly on LICs (between 0.4 and 0.6 percentage point), which are highly dependent on commodity exports. These spillovers work mainly through the trade channel, although effects are amplified by constraints on AE monetary policy space.27
26 Exchange rate dynamics in this case are driven primarily by long-run external stability, which implies an appreciation. With permanently lower output, EMs need to sell fewer goods to the rest of the world to maintain external balance. Consequently, the exchange rate appreciates to raise the relative price of EM exports and reduce foreign demand. 27 This result is in line with the OECD (2014).
25. In light of the relatively large and multifaceted spillovers from EMs, policy preparedness and international collaboration are needed.
At the international level, collaboration between AEs and EMs would be desirable in order to manage both spillovers and risks of “spillbacks.” While the EM slowdown is largely structural, it has a cyclical component, which means that certain external factors, such as tighter global financing conditions and stronger growth in AEs, can still play a role in affecting EM growth, which would, in turn, affect the magnitude of spillovers back to AEs. These “spillback” concerns point to the importance of policy dialogue between advanced and emerging market economies to address potential adverse impacts.
AEs should be prepared to act nimbly if growth in EMs continues to decelerate. Given the noticeable spillovers through trade and finance, as well as the still fragile recovery in AEs, policymakers should closely monitor growth in EMs and be prepared to take action to mitigate potential effects from the EM slowdown.
Source: IMF staff estimates.1/ Real Competitiveness Index: (+ = appreciation).
Global Oil Price
-0.6
-0.4
-0.2
0.0
0.2
0.4
0.6
13 14 15 16 17 18 19-0.4
-0.3
-0.2
-0.1
0.0
0.1
0.2
0.3
0.4
0.5
0.6
13 14 15 16 17 18 19
2014 SPILLOVER REPORT
INTERNATIONAL MONETARY FUND 81
EMs should implement structural reforms to boost productivity and medium-term growth:28 Reform priorities will depend on country-specific circumstances. Policymakers will need to identify reform priorities to remove supply bottlenecks, boost productivity, and move their economies up in the value chain of economic activity. For countries at lower income levels, the largest gains would come from reforms that prepare the economy to move up the value chain and develop new sectors, whereas at higher income levels, the gains would come from more innovation and technological development. Reforms are also required to reorient the sources of growth—away from consumption in some cases (Brazil and Turkey) and away from investment in other cases (China).29 Other reforms include addressing infrastructure needs, including by enhancing the efficiency of public investment, particularly in electricity and transportation (India, Brazil, Russia, and Indonesia);30 improving education and addressing skill shortages (Russia, India, Turkey, Latin America); and enhancing competition and/or improving the business climate (China, Russia, Brazil).31
At the regional level, policy buffers should be rebuilt to avoid procyclical monetary and fiscal responses. Strengthening policy frameworks (for instance, by allowing exchange rates to respond to changing economic conditions) and fundamentals (through structural reforms) should be a priority. In regions where trade is the main channel of spillover, countries have few options other than diversifying their trade base and building buffers. By contrast, if growth spillovers are mostly transmitted through financial links, disturbances in the originating country can be addressed by seeking alternative modes of financing. In times of disruptive outflows, when macroeconomic policy is limited, capital flow management measures can be useful. In countries where banks rely heavily on external funding, especially where corporate vulnerabilities are high, capital buffers should be increased.
28 For more details on growth prospects and challenges for EMs, see Cubeddu and others (2014). 29 IMF staff estimates suggest that successful implementation of reforms under the Third Plenum Reform Blueprint could increase global growth by 0.2 percentage point over the medium term, although growth may slow in the near term, reflecting the near-term cost of reforms. 30 See IMF (2014e). 31 With support from the international community, such policy reforms would help address fiscal sustainability, preserve macroeconomic stability, and increase external competitiveness in a difficult political environment.
2014 SPILLOVER REPORT
82 INTERNATIONAL MONETARY FUND
Annex I. Framework for Global Downside Scenario
This annex provides further analysis of the global macroeconomic effects of downside risks associated with key spillovers. A framework to examine the global downside scenario in Chapter 1is developed using the G40 Model—a structural macroeconometric model of the world economy, disaggregated into 40 national economies.1 The analysis features the same risk layers described in the text—an asynchronous normalization of the monetary policy stance in some major advanced economies (AEs), together with a synchronous growth slowdown in emerging market economies (EMs)—but calibrated differently from the Flexible System of Global Models (FSGM). Additional financial turmoil in EMs, for example, is also considered but based on an event-study approach described in this annex. Under asynchronous exit, monetary tightening originates in the United Kingdom and the United States. Money shocks in these two countries trigger transitory 50 basis point increases in domestic money market interest rate spreads, together with more persistent 100 basis point increases in the long-term bond yield and 10 percent reductions in the equity price index, in 2014:Q3. The spillovers are calibrated based on event studies described in Box 7 in Chapter 2 rather than based on the vector autoregression (VAR) analysis in that chapter used for the FSGM.2 In the rest of the world, money market interest rate spreads widen, long-term bond yields rise, equity price indexes fall, and currencies depreciate with respect to the pound and the dollar to widely varying degrees across economies depending on their structural characteristics and initial conditions. Abroad-based growth slowdown in EMs is also considered, reflecting autonomous private domestic demand contractions. In all EMs, the scenario assumes temporary but very persistent autonomous private domestic demand contractions. In particular, private consumption declines autonomously by 3 percent over three years while private investment falls by 12 percent. These private consumption and investment demand reductions are phased in gradually over the period from 2014:Q3 through 2016:Q4 and then phased out through 2019:Q4. Wider slowdowns in EMs are associated with financial market sell-offs and flight to quality. An event study with sign restrictions, using a centered two-day window, suggests a flight to safe haven bonds and differential re-pricing of risk in response to negative emerging market news. On candidate event dates, long-term bond yields rise and equity prices fall in many EMs, while long-term bond yields fall in many safe havens. On identified event dates, news analysis rules out
1See Vitek (forthcoming). Within this framework, each economy is represented by interconnected real, external, monetary, fiscal, and financial sectors. Spillovers are transmitted via trade, financial, and commodity price linkages. Financial linkages are both direct, through cross-border debt and equity portfolio holdings, and indirect via international co-movements in asset risk premia. 2The scenario also assumes that the nominal policy interest rate remains at the zero lower bound in the United Kingdom and the United States through 2015:Q2, and in the euro area and Japan through 2019:Q4.
2014 SPILLOVER REPORT
INTERNATIONAL MONETARY FUND 83
developments in AEs as the driver of these financial market adjustments. The results suggest that a 50 basis point increase in long-term bond yields in vulnerable EMs is approximately associated with a 10 basis point rise in other EMs, together with a 15 basis point reduction in safe havens and a 10 basis point decline in other AEs (see Figure below). Meanwhile, equity prices typically fall by approximately 7½ percent in EMs and by 5 percent in AEs. Finally, vulnerable emerging market currencies depreciate by approximately 3 percent with respect to those of safe havens, while other emerging market currencies depreciate by about 2 percent, and advanced economy currencies depreciate by about 0.5 percent.
Estimated Financial Market Impact of Negative Emerging Market News
Downside risks for growth would include financial pressures, if the risk were to intensify. Based on these event study results, the scenario further assumes long-term bond yields rise in EMs, particularly in those with higher vulnerabilities, while those yields fall in AEs.3 Furthermore, equity prices are assumed to fall worldwide. Finally, currencies of vulnerable EMs depreciate the most. The resulting private domestic demand contractions are associated with financial turmoil in all EMs, but concentrated in those more vulnerable to financial crises, as capital flows to AEs. Under the global downside scenario, large output losses in vulnerable EMs are associated with moderate output losses in the rest of the world. By 2015, output falls 4.2 percent in vulnerable EMs, 2.8 percent in other EMs, 1.3 percent in safe havens, and 0.9 percent in other AEs. Correspondingly, world output declines by 1.9 percent. This is associated with lower energy and nonenergy commodity prices (by 20.3 and 11.6 percent, respectively), which cushion the overall impact. Short-run output losses translate into lower inflation, including in the euro area and Japan, where inflation is already very low. In particular, inflation falls by 1.2 percentage points in the euro area and Japan, in part reflecting euro and yen appreciation in effective terms.
3For the scenario, emerging markets with higher inflation, higher external or fiscal deficits, or other key imbalances include Argentina, Brazil, India, Indonesia, Russia, South Africa, and Turkey; other emerging markets are Chile, China, Colombia, the Czech Republic, Israel, Korea, Malaysia, Mexico, the Philippines, Poland, Saudi Arabia, and Thailand; safe havens are Germany, Japan, Switzerland, the United Kingdom, and the United States; and other advanced economies are Australia, Austria, Belgium, Canada, Denmark, Finland, France, Greece, Ireland, Italy, the Netherlands, New Zealand, Norway, Portugal, Spain, and Sweden.
-25
0
25
50
75
Vulnerable emerging markets
Other emerging markets
Safe havens Other advanced economies
Basi
s po
ints
Long-Term Bond Yield
Source: IMF staff estimates.Note: LCU/USD = local currency unit/U.S. dollar.
-10.0
-7.5
-5.0
-2.5
0.0
Vulnerable emerging markets
Other emerging markets
Safe havens Other advanced economies
Perc
ent
Equity Price Index
-2.5
0.0
2.5
5.0
Vulnerable emerging markets
Other emerging markets
Safe havens Other advanced
economies
LCU
/USD
, per
cent
Nominal Bilateral Exchange Rate
2014 SPILLOVER REPORT
84 INTERNATIONAL MONETARY FUND
Simulated Global Macroeconomic Effects, 2015 Consumption Price Inflation Output Current Account Balance Ratio
Asynchronous Monetary Normalization
+ Growth Slowdown in Emerging Markets
+ Financial Turmoil in Emerging Markets
Source: IMF staff calculations using the G40 Model.
Less than -1.875 -1.250 -0.750 -0.375 More than-1.875 to -1.250 to -0.750 to -0.375 to -0.125 -0.125
Percentage PointsLess than -3.750 -2.500 -1.500 -0.750 More than-3.750 to -2.500 to -1.500 to -0.750 to -0.250 -0.250
PercentLess than -1.500 -0.500 0.000 0.500 More than-1.500 to -0.500 to 0.000 to 0.500 to 1.500 1.500
Percentage Points
2014 SPILLOVER REPORT
INTERNATIONAL MONETARY FUND 85
Annex II. Spillovers
0.00
0.05
0.10
0.15
0.20
0.25
0.30
Jan-13 May-13 Sep-13 Jan-14 May-14
EONIA swap curve (2yr - 1yr)
EONIA Swap Curve "Steepness" 1/(percent)
Source: Bloomberg, L.P.Note: ECB = European Central Bank; EONIA = Euro overnight interest average; FG = forward guidance.1/ The EONIA curve shows the spread between 2-year and 1-year tenors.
Taper talk
ECBFG
Taperpostponed
ECBcut
6/4/2014
40
50
60
70
80
90
100
110
120
130
08 09 10 11 12 13 14
Emerging markets 1/
10-Year Government Bond Yields(index; Dec. 31, 2009)
6/4/2014
Source: Bloomberg, L.P.1/ Countries include BRA, CHN, CZE, HUN, IND, IDN, KOR, MEX, PHL, POL, ZAF, and THA.
0.0
0.1
0.2
0.3
Aug-12 Feb-13 Aug-13 Feb-14
Euro area United Kingdom
Volatility(three-month rolling standard deviation of long-term
6/4/2014
Taper talk Taper postponed
Source: Bloomberg, L.P.
BRA
CHN CZE
EA
HUN
IND
IDN
ISRJPN
KOR
MEXPAK
PHLPOLRUS
ZAF
THA
TUR
GBR
-1
0
1
2
3
4
5
0 1 2 3 4 5
10-Year Government Bond Yields(percentage point difference)
Fed Actions: 10-Year Sovereign Yields 1/(one day change; basis points)
Source: Bloomberg, L.P.1/ For the United States, the basis points change relative to the close of the previous day (e.g., May 22 vs. May 21).
2014 SPILLOVER REPORT
86 INTERNATIONAL MONETARY FUND
Annex III. Forward Guidance in Key Advanced Economies
Key advanced economy (AE) central banks have introduced forward guidance, although the timing, motivations, and objectives have varied.1 After reaching the zero lower bound, the U.S. Federal Reserve made use of forward guidance to further lower longer-term interest rates, moving from “qualitative,” to “time-dependent,” then to “state-dependent” forward guidance.2 The European Central Bank (ECB) introduced qualitative forward guidance in July 2013 in response to unwarranted tightening in euro area financial conditions driven by domestic and external factors. The Bank of England formally implemented a form of “state-contingent” forward guidance in August 2013 to reduce uncertainty and provide transparency around its intended interest rate path. U.S. forward guidance has helped reduce expected short-term rates and volatility, but communications challenges from the use of multiple instruments have emerged (Jaumotte and Weber, forthcoming). Time-dependent forward guidance kept expected short-term rates low, and their sensitivity to economic news declined. However, the May/June 2013 announcement of possible tapering—and the abrupt changes in market perceptions and positioning—resulted in heightened market volatility.
Introduction of forward guidance in the euro area and the United Kingdom appears to have helped contain volatility. The ECB’s forward guidance has clarified its reaction function, reducing volatility in money
markets. On announcement, forward guidance flattened the Euro OverNight Index Average
1For the United States see also Swanson and Williams (2013) and Raskin (2013). For cross-country experience with forward guidance, see Kool and Thornton (2012) and Filardo and Hofmann (2014). 2Under “qualitative” forward guidance, the Fed used language such as “we will keep interest rates low for an extended period of time.” Starting mid-2011, the Fed switched to “time-dependent” guidance specifying the horizon over which it would keep rates low. In December 2012, the Fed moved to “state-contingent” guidance, with action conditional on the state of the economy.
0.0
0.1
0.2
0.3
0.4
one-year ahead two-year aheadHorizon
Average sensitivity before qualitative FGSensitivity after qualitative FGSensitivity after time-dependent FGSensitivity after June 2013 FOMC meeting
Sensitivity to News(coefficient estimates, Fed funds futures)
Source: IMF staff calculations. Note: FG = forward guidance; FOMC = federal open market committee.
-200
-150
-100
-50
0
50
100
150
0.0
0.5
1.0
1.5
2.0
2.5
3.0
3.5
4.0
Aug-08 Aug-10 Aug-12
Expected two-year ahead Fed funds rate Citi News Index (RHS)
(EONIA) curve and partially reversed the initial impact of the May 2013 taper episode on sovereign yields (Figure 1). Volatility of money market rates was dampened—although three-year long-term refinancing operation facilities and a deposit rate at zero had already contributed to this—but the rates increased above previous levels, undermining the impact of forward guidance. The Fed’s decision not to taper in September 2013 provided substantial relief to both money market rates and euro area sovereign yields, suggesting that, despite forward guidance, external factors still have an impact on the ECB’s intended stance of monetary policy. The ECB’s forward guidance was strengthened with a policy rate cut in November 2013, further flattening the EONIA curve.
Although co-movement with U.S. interest rates has been very strong, U.K. forward guidance has likely decreased uncertainty about future rates. U.K. forward guidance was intended to increase transparency about the Monetary Policy Committee’s reaction function and reduce uncertainty about future rates. The introduction of forward guidance has not prevented U.K. yields from co-moving closely with U.S. rates (even at shorter maturities), and U.K. yields even increased immediately after the introduction of forward guidance, as did the unconditional correlation with U.S. rates. That said, after the introduction of forward guidance, uncertainty about future rates fell to levels below those seen in early 2013. Hence, measured against its stated objective, forward guidance appears to have been moderately successful.
While central banks have moderated their emphasis on forward guidance, looking ahead, several factors argue for its continued use. The significant co-movements of interest rates across the three currency zones suggest spillovers or a common factor that affects yields in both countries. Forward guidance has helped better guide expectations about future rates, allowing some delinking of expected short-term rates across the three currencies. It may hence remain a useful tool for reducing volatility and supporting an individual exit pace in line with the respective currencies’ output and inflation developments. However, forward guidance needs to be well placed in the context of other policy tools to manage market expectations.
2014 SPILLOVER REPORT
88 INTERNATIONAL MONETARY FUND
Annex IV. Spillovers and Fundamentals
BRA
CHNCZEEA
HUN
IND
IDN
ISR
JPNKOR
MEX
PAK
PHL POL
RUS
ZAFTHA
TUR
GBR
-2
0
2
4
6
8
10
12
-1 0 1 2 3 4 5
10-Year Bond Yield vs. CPI Inflation(percentage point change; "+" denotes decline)
May 22, 2013, to Jan. 31, 2014
CPI i
nfla
tion
(end
-201
2) BRA
CHN
CZE
EAHUN
IND
IDN
ISR
JPN
KOR
MEXPAK
PHL
POL
RUS
ZAF
THA
TURGBR
-6
-4
-2
0
2
4
6
8
-1 0 1 2 3 4 5
10-Year Bond Yield vs. CA Deficit(percentage point change)
May 22, 2013, to Jan. 31, 2014
CA d
efic
it (p
erce
nt o
f GD
P; e
nd-2
012)
BRA
CHN
CZE
EA
HUN
IND
IDN
ISRJPN
KOR
MEX
PAK
PHL
POL
RUS
ZAF
THA
TURGBR
-6
-4
-2
0
2
4
6
8
-20 -10 0 10 20 30
Exchange Rate vs. CA Deficit(percent change; "+" denotes depreciation)
May 22, 2013, to Jan. 31, 2014
CA d
efic
it (p
erce
nt o
f GD
P; e
nd-2
012)
BRA
CHNCZEEA
HUN
IND
IDN
ISRJPN
KOR
MEX
PAK
PHLPOL
RUS
ZAF
THA
TUR
GBR
-2
0
2
4
6
8
10
12
-20 -10 0 10 20 30
Exchange Rate vs. CPI Inflation(percent change; "+" denotes depreciation)
May 22, 2013, to Jan. 31, 2014
CPI i
nfla
tion
(end
-201
2)
Sources: Bloomberg, L.P.; IMF, Financial Soundness Indicators; IMF, Global Data Source.Note: CA = current account; CPI = consumer price index; FX = foreign exchange.
BRA
CHNCZE
EGYHUN
IND
IDN
ISRKOR
LBN
MEX
PAK PHL
POL
ZAF
THA
TUR
-3
-2
-1
0
1
2
3
4
5
6
-3 -2 -1 0 1 2
Policy Rate vs. Output Gap(percent)
Change in output gap, 2013
Chan
ge in
pol
icy
rate
bet
wee
nAp
r. 13
and
Jan.
14
BRA
CHICZE
EGY
HUN
IND
IND
ISR
KOR MEX
PAK
PHI
POL
ZAF
THA
TUR
-3
-2
-1
0
1
2
3
4
5
6
-1.0 -0.5 0.0 0.5 1.0Chan
ge in
pol
icy
rate
afte
r tap
erin
g (p
erce
nt)
Posttapering change in exchange market pressure index
FX Market and Monetary Policy
2014 SPILLOVER REPORT
INTERNATIONAL MONETARY FUND 89
Annex V. Decomposing Long-term Rates with a Vector Autoregression Using Sign Restrictions1
To disentangle the effects of “money” and “real” shocks (i.e., other factors such as positive economic news or increased risk appetite in response to better news) a simple structural vector autoregression (VAR) using long-term bond yields (R) and (log) stock prices (S) for the S4 economies is estimated using daily data:2
, , , , , , , (1)
, , , , , , , , (2) where the reduced form residuals ,
/ in the above equations are a combination of structural shocks REAL and MONEY. Specifically:
, , , , , (3)
, , , , , (4) with , ~ 0,1 and , ~ 0,1 . The parameters , , , , , and , are identified using contemporaneous sign restrictions, assuming that positive economic news cause both long-term yields and equity prices to rise, while a money shock causes long-term yields to rise and equity prices to fall. Specifically:3
R S REAL + + MONEY + -
Next, we assume that the real and money shocks estimated for each country can be decomposed into two parts: common and country-specific shocks, where common shocks are assumed to be common to all countries and country-specific shocks are orthogonal to the global shocks. Common real and money shocks are reflected by the first principal component of the shocks estimated above (equations 3 and 4). Specifically,
, , (5) where country i’s real shock is driven by common real shocks and country-specific real shocks , . Likewise, country i’s money shocks are driven by common money shocks
and country-specific money shocks , :
1The approach is based on Matheson and Stavrev (forthcoming). 2 The S4 economies are the United States, the United Kingdom, the euro area and Japan. 3 Among the models accepted, we choose the model closest to the median.
2014 SPILLOVER REPORT
90 INTERNATIONAL MONETARY FUND
, , . (6) A complementary measure based on event studies is constructed (see Box 2 in the main text of chapter 2).4 A positive (negative) money shock event is defined as a day on which U.S. yields rise (fall), stock prices fall (rise), and the exchange rate appreciates (depreciates). The correlation of global yields derived from the two approaches potentially differs, as event studies attribute the entire change in the U.S. long-term yields on selected days to the money shock, while the sign-restricted VAR using the information on stock prices decomposes the change in yields to money and real shocks. However, the average implied correlation between money shocks in the United States and yields in emerging market economies for the event study and the sign-VAR are broadly comparable. Various robustness checks confirmed the baseline results. These test included (i) changing the sample period for the estimation, (ii) estimating an alternative model, including the long-term rate, the price level, and industrial production using monthly data, and (iii) adding the exchange rate to identify risk-on and growth shocks (see Annex VI). The qualitative implications for the relative contribution of money and real shocks remained unaltered (Table 1).
Table 1.Shock Contribution to U.S. Yield Variation
Assumption Real Money
Sample 2012-2013 0.69 0.31
Sample 2009-2013 0.70 0.30
Sample 2004-2013 0.69 0.31
Sample 1998-2008 0.62 0.38
IP, CPI, Yield model 0.62 0.38
Source: IMF staff estimates.
4 Further robustness tests are described in Annex VI.
2014 SPILLOVER REPORT
INTERNATIONAL MONETARY FUND 91
Annex VI. Money, Activity, and Risk-On/Off Drivers of U.S. Yields and their Spillovers1
As a robustness check, extending the approach described in Annex V, the “real” shock driving U.S. yields can be decomposed into positive economic news about U.S. activity (GROWTH) and a component reflecting increased risk appetite (RISK). This is done by expanding the vector autoregression (VAR) to include the exchange rate ( , ) in addition to bond yields ( , ) and the stock market index ( , ). Specifically:
, , , , , , , , , (A.1)
, , , , , , , , , (A.2)
, , , , , , , , , (A.3) As in the two-variable case described in Annex V, the reduced form shocks ( ,
/ / ) are a linear combination of the three structural shocks, , ~ 0,1 , , ~ 0,1 and
, ~ 0,1 . As in the two-variable case, the contemporaneous sign restriction to identify the shocks is that positive economic news causes both long-term yields and equity prices to rise, while money shocks cause long-term yields to rise and equity prices to fall. In both cases, the U.S. dollar should appreciate against other currencies, as money flows to the United States reacting either to improved news there or the interest rate differential. The risk shock is identified using the exchange rate. As risk appetite in the United States increases, there will be a portfolio rebalancing from bonds to stocks, causing bond yields and stock prices to rise. At the same time, U.S. investors will start to invest a larger fraction of their assets abroad, causing the U.S. dollar to depreciate. Hence, the sign restrictions on the three variables are:1
R S E GROWTH + + + RISK + + - MONEY + - +
The results from the three-way decomposition suggest that the spillovers from the money shock are qualitatively and quantitatively similar to the results using the two-way decomposition (see figure below). Regarding the response to growth and risk shocks, results confirm that the real shock from the two-way decomposition is a combination of “growth” and “risk” shocks from the three-way decomposition: growth shocks cause yields in emerging market economies (EMs) to rise, the exchange rate to depreciate, and stock prices to fall as capital flows from other countries to the United States in response to the improved U.S. economic outlook. Accompanying higher external
1The approach is based on Matheson and Stavrev (forthcoming).
2014 SPILLOVER REPORT
92 INTERNATIONAL MONETARY FUND
demand and improved competitiveness causes net exports to rise. This outweighs the negative effect from tighter domestic financial conditions for economic activity reflected in slightly higher industrial production. Risk-on shocks lead to capital inflows in EMs, which drive up the exchange rate, support equity prices, and depress, though negligibly, domestic bond yields (the risk-on shock potentially causes a rebalancing from bonds to stocks by domestic investors, creating upward pressure on domestic yields, while the inflow of foreign money creates downward pressure). The higher equity return and neutral financing conditions recognize that an improved external environment supports industrial production in EMs. Hence, both U.S. risk-on and growth shocks cause activity in EMs to rise, although the channels of transmission (net exports versus capital inflows) are different.
2014 SPILLOVER REPORT
INTERNATIONAL MONETARY FUND 93
Spillover to Emerging Market Economies from Money Shock
The most commonly used method of structural decomposition is the so-called Cholesky decomposition. It consists of imposing a set of restrictions to allow the identification of a system. The main pitfall in using Cholesky decomposition in the study of cross-border spillovers is that it imposes a set of rather ad hoc assumptions on the causal structure within the system, yielding a recursive causal structure that may not reflect the more complex causal structure observed in the data. As an alternative, the directed acyclic graphs (DAG) technique (see Pearl, 2000; Sprites, Glymour and Scheines, 2000) is used in this chapter in order to adopt a more flexible and realistic causal structure that accounts for third-country effects.
The various steps of the algorithm used in the DAG are as follows:
1. Start with a “graph” C where each variable is by an edge. 2. Set n = 0. Test nth order conditional correlation between every pair. If the pair of variables is conditionally uncorrelated, eliminate the edge. 3. Set n =n+1 and repeat step 2 for all conditioning. Call this graph F. 4. Consider pair that is not connected directly but indirectly. Orient X—Z—Y as X Z ← Y, if and only if X and Y are dependent when conditioned on every subset of variables, including Z. Call this graph F’. 5. Repeat until no more edges in F’ can be oriented. If X Z and Z—Y and X and Y are not directly connected then orient ZY. If there is a directed path between X and Y, and if there is undirected edge between X and Y, orient X Y.
The resulting causal structure is then used in our vector autoregression framework to impose restrictions and conduct impulse responses to document the spillover effects from a slowdown in emerging market economies.
2014 SPILLOVER REPORT
INTERNATIONAL MONETARY FUND 95
Annex VIII. Gross Trade versus Value-Added Trade Flows
With the rise of global supply chains, the difference between gross trade and value-added trade became important. Bilateral gross trade data do not accurately reflect the actual final consumption of value-added output between exporting and importing parties. Increasingly, intermediate inputs are traded across borders, which leads to double counting. When a country is involved in a global value chain, a large portion of its imports are typically not absorbed domestically but instead is re-exported. Exports may thus contain a large part of other countries’ value-added exports. The data used in this chapter are from the World Input-Output Database (Timmer, 2012), which provides yearly world input-output tables for 40 countries and the rest of the world from 1995 to 2011. Of the countries included, 25 are advanced economies and 12 are emerging market economies. Those countries account for about 90 percent of world GDP. For each country the database features detailed industry output. Following the methodology of Koopman, Wang, and Wei (2014), gross exports were decomposed into nine categories. Categories represent domestic value (DV) in direct final good exports, DV in intermediate exports absorbed by direct importers, DV in intermediates re-exported to third countries, DV in intermediates that returns to the home country via final imports, DV in intermediates that returns to the home country via intermediate imports, and double-counted intermediate exports produced in the home country. Other categories represent foreign value (FV) in final goods exports, FV in intermediate goods exports, and double-counted intermediate exports produced abroad. Thus, bilateral value-added exports and imports can be identified by their final destination.
2014 SPILLOVER REPORT
96 INTERNATIONAL MONETARY FUND
Annex IX. Global Vector Autoregression Model
The global vector autoregression (GVAR) model was developed by Pesaran, Schuermann, and Weiner (2004) and further by Dées and others (2007). The structure of a GVAR model is described below. First, for each country, the conventional VAR model is extended with the addition of a set of foreign variables. These variables are constructed as weighted averages of the same variables of all the country’s trading partners. Suppose there are 1 countries (or regions) in the global economy, indexed by 0, 1, … , , where country 0 serves as the numeraire country. The individual country
∗ , model is: Φ , , Λ , ∗
∗ ∑ , with 0. Vector is a number of country-specific macroeconomic variables, over time 1, 2, … , , and across the 1 countries. Global factors are denoted by vector . Then, all individual countries’ ∗ models are collected and estimated as a single VAR model. The dynamic properties of the model are used to analyze how shocks are propagated across countries. Let ′, ∗′ ′, , , Φ , , Λ , , , ; then the individual ∗ model can be rewritten as:
, , . Let max , , … , , , , … , and construct , from , , by augmenting the or additional terms in powers of L by zeros. Also,
. Then the stacked model is
, , where , , , , , … , , ′, , , … , ′. The GVAR model is used to estimate the spillovers from emerging countries and China to advanced countries through trade linkage. GVAR toolbox data and the World Input-Output Database are combined in the analysis. It covered 21 countries, among which seven are emerging countries and 14 are advanced countries. The variables are real GDP, inflation, the real exchange rate, and the oil price. Quarterly data are used from 1979:Q2 to 2009:Q4. The main contribution here is to use bilateral value-added trade data as opposed to gross trade data to calculate trade weights.
2014 SPILLOVER REPORT
INTERNATIONAL MONETARY FUND 97
Annex X. Emerging Market Economy Spillover through Oil Prices Using the FAVAR Model
The FAVAR model used in this chapter and developed by Aasveit, Bjornland, and Thosrud (2013) is a generalization of the model introduced by Bernanke, Boivin, and Eliasz (2005): , (1) where ∆ , , ,∆ ]’ is a 4 x 1 vector containing the first differences of the logarithm of global oil production, an unobserved developed economy activity factor, an unobserved emerging market economy activity factor, and the first difference of the logarithm of the real price of oil. B(L) is a conformable lag polynomial of order p, and is a4 x 1 vector of reduced form residuals. These can be decomposed as Ω . , where are standard normally distributed structural shocks, and Ω ′ is the covariance of the reduced form residuals. Accordingly, is a 4 x 4 matrix describing how the structural shocks relate to the reduced form errors. Equation (1) is a standard vector autoregression (VAR), augmented with two unobservable factors. The unobserved factors are identified and estimated by employing the principal component method. First, two factors are estimated based on all the activity variables in the sample. These factors are then rotated to identify them as developed and emerging activity factors, respectively. This is done by enforcing that the developed activity factor loads with one on U.S. GDP growth, and zero on oil production, emerging activity, and the real price of oil. Similarly, the emerging activity factor is identified by enforcing that the emerging activity factor loads with one on Chinese GDP growth, and zero on oil production, developed activity, and the real price of oil. Four structural shocks are identified: oil supply shocks, developed demand shocks, emerging demand shocks, and oil-specific demand shocks:
, . , . , . (2) To identify the vector of structural shocks, a combination of zero and sign restrictions is used on the
matrix. In particular, in the short run a vertical supply curve in the oil market is assumed. Thus, oil production does not respond to disturbances to the price of oil or to the activity factors on impact. Moreover, activity growth (in both developed and emerging markets) reacts with a lag to unexpected changes to the real price of oil. These restrictions are the same as in Kilian (2009). Sign restrictions are enforced to separately identify developed and emerging market demand shocks. Spillovers between the two regions are restricted to be positive for at least two quarters, while the effect of developed (emerging) demand shocks are restricted to be stronger on the developed (emerging) factor than on the emerging (developed) factor. The effect of oil supply shocks on the activity factors and on the real price of oil is left unrestricted. Likewise, the effect of developed and emerging market demand shocks on the real price of oil is left unrestricted.
2014 SPILLOVER REPORT
98 INTERNATIONAL MONETARY FUND
The estimation and identification procedure for the factors follows Bai and Ng (2013), while the implementation of the zero and sign restrictions closely follows Rubio-Ramirez, Waggoner, and Zha (2010). The VAR, augmented with the factors, is estimated using maximum likelihood on the sample 1992:Q1–2009:Q4. The lag length is set to 4. To construct uncertainty bands around the impulse response functions, a residual bootstrap, which accounts for the fact that the factors also have to be estimated, is employed. The panel data containing activity variables consists of activity variables from 33 economies. Of these, 22 are advanced (Australia, Belgium, Canada, Denmark, Finland, France, Germany, Hong Kong SAR, Korea, Italy, Japan, Luxembourg, the Netherlands, New Zealand, Norway, Singapore, Spain, Sweden, Switzerland, Taiwan Province of China, the United Kingdom, and the United States), and 11 are emerging (Argentina, Brazil, Chile, China, India, Indonesia, Malaysia, Mexico, Peru, South Africa, and Thailand). In the data, economic activity is imprecisely measured. For this reason, two measures of economic activity are collected for each country, GDP growth, and growth in industrial production, and are used when extracting the unobservable activity factors. Most of the series are collected from Thomson Reuters Ecowin. All GDP series are at constant prices, while most of the industrial production series are for the manufacturing industry. To measure oil production and the real price of oil, world crude oil production (in millions of barrels per day) and U.S. real refiners’ acquisition cost for imported crude oil are used, respectively. The nominal oil price has been deflated using the U.S. consumer price index. These are the same variables used in Kilian (2009) and many other papers.
2014 SPILLOVER REPORT
INTERNATIONAL MONETARY FUND 99
References
Chapter 1
British Petroleum (BP), 2013, Statistical Review of World Energy 2013 (London).
International Monetary Fund (IMF), 2011, Consolidated Spillover Report: Implications from the Analysis of the Systemic 5 (Washington), available at www.imf.org/external/np/pp/eng/2011/071111.pdf.
——, 2012a, 2012 Spillover Report (Washington), available at www.imf.org/external/np/pp/eng/2012/070912.pdf.
——, 2012b, “Outward Spillovers from a Sharp Rise in Government Bond Yields,” Background Paper 16 in 2012 Spillover Report: Background Papers (Washington), available at www.imf.org/external/np/pp/eng/2012/071012.pdf.
——, 2013, 2013 Spillover Report (Washington), available at www.imf.org/external/np/pp/eng/2013/070213.pdf.
——, 2014a, forthcoming, Euro Area Policies: 2014 Article IV Consultation, IMF Staff Country Report (Washington).
——, 2014b, Global Financial Stability Report: Moving from Liquidity- to Growth-Driven Markets (Washington, April), available at www.imf.org/External/Pubs/FT/GFSR/2014/01/index.htm.
——, 2014c, forthcoming, People’s Republic of China: 2014 Article IV Consultation, IMF Staff Country Report (Washington).
——, 2014d, forthcoming, United Kingdom: 2014 Article IV Consultation, IMF Staff Country Report (Washington).
——, 2014e, World Economic Outlook: Recovery Strengthens, Remains Uneven (Washington, April), available at http://www.imf.org/external/pubs/ft/weo/2014/01/pdf/text.pdf.
Mishra, Prachi, Kenji Moriyama, Papa N’Diaye, and Lam Nguyen, forthcoming, “Impact of Fed Tapering Announcements on Emerging Markets,” IMF Working Paper.
Vitek, F., forthcoming, “Policy and Spillover Analysis in the World Economy: A Panel Dynamic Stochastic General Equilibrium Approach,” IMF Working Paper (Washington: International Monetary Fund).
Chapter 2
Adler, G. and C. Tovar, 2011, “Foreign Exchange Intervention: A Shield against Appreciation Winds?” IMF Working Paper 11/165 (Washington: International Monetary Fund).
Bayoumi, Tamim, Giovanni Dell'Ariccia, Karl Friedrich Habermeier, Tommaso Mancini Griffoli, and Fabian Valencia, 2014a, “Monetary Policy in the New Normal,” IMF Staff Discussion Note 14/3 (Washington: International Monetary Fund).
Bernanke, Ben, 2013, transcript of Chairman Bernanke’s press conference.
2014 SPILLOVER REPORT
100 INTERNATIONAL MONETARY FUND
Broda, Christian, and Cedric Tille, 2003, “Coping with Terms-of-Trade Shocks in Developing Countries,” Federal Reserve Bank of New York, Current Issues in Economics and Finance, Vol. 9 (November).
Cagnon, Joseph, Mathew Raskin, Julie Remache, and Brian Sack, 2010, “Large-Scale Asset Purchases by the Federal Reserve: Did They Work?” Staff Report No. 441, Federal Reserve Bank of New York
Carpenter, Seth, Jane Ihrig, Elizabeth Klee, Daniel Quinn, and Alexander Boote, 2013, “The Federal Reserve’s Balance Sheet and Earnings: A Primer and Projections,” FEDS.
Chen, Jiaqian, Tommaso Mancini-Griffoli, and Ratna Sahay, forthcoming, “Spillovers from US Monetary Policy on Emerging Market Economies: Different this Time?” IMF Working Paper (Washington: International Monetary Fund).
Chung, Hess, Jean-Philippe Laforte, David Reifschneider and John C. Williams, 2011, "Estimating the Macroeconomic Effects of the Fed’s Asset Purchases," FRBSF Economic Letter, Federal Reserve Bank of San Francisco.
di Giovanni, Julian, and Jay Shambaugh, 2008, “The Impact of Foreign Interest Rates on the Economy: The Role of the Exchange Rate Regime,” Journal of International Economics, Vol. 74, No. 2, pp. 341–61.
Eichengreen, B., and Poonam Gupta, 2014, “Tapering Talk: the Impact of Expectations of Reduced Federal Reserve Security Purchases on Emerging Markets,” Policy Research Working Paper 6754 (Washington: World Bank).
Eichengreen, B., and A.K. Rose, 1998, “Staying Afloat When the Wind Shifts: External Factors and Emerging-Market Banking Crises,” NBER Working Paper 6310 (Cambridge, Massachusetts: National Bureau of Economic Research).
English, W., David Lopez-Salido, and Robert J. Tetlow, 2013, “The Federal Reserve’s Framework for Monetary Policy – Recent Changes and New Questions,” Finance and Economics Discussion Series 2013–76, Board of Governors of the Federal Reserve System (Washington).
Filardo, Andrew, and Boris Hofmann, 2014, “Forward Guidance at the Zero Lower Bound,” BIS Quarterly Review, Bank for International Settlements, March.
Fratzscher, Marcel, Marco Lo Duca, and Roland Straub, 2013, “On the International Spillovers of US Quantitative Easing,” ECB Working Paper 1557 (Frankfurt: European Central Bank).
Georgiadis, Giorgio, forthcoming, “Determinants of Global Spillovers from US Monetary Policy,” ECB Working Paper (Frankfurt: European Central Bank).
International Monetary Fund (IMF), 2013a, United States: 2013 Article IV Consultation (Washington).
_____, 2013b, “Global Impact and Challenges of Unconventional Monetary Policies,” IMF Policy Paper, September (Washington). http://www.imf.org/external/np/pp/eng/2013/090313.pdf
2014 SPILLOVER REPORT
INTERNATIONAL MONETARY FUND 101
_____,2013c, “Unconventional Monetary Policies—Recent Experience and Prospects,” April 18 (Washington). http://www.imf.org/external/np/pp/eng/2013/041813a.pdf.
_____, 2014, Global Financial Stability Report (April, Washington).
Jaramillo, L., and A. Weber, 2013, “Bond Yields in Emerging Economies: It Matters What State You Are In,” Emerging Markets Review, Vol. 17, pp. 169–85.
Jaumotte, F., and S. Weber, forthcoming, "Experience with Forward Guidance in the United States," IMF Working Paper (Washington: International Monetary Fund).
Kim, Don H. and Jonathan H. Wright, 2005, "An Arbitrage-free Three-factor Term Structure Model and the Recent Behavior of Long-term Yields and Distant-horizon Forward Rates," Finance and Economics Discussion Series 2005-33, Board of Governors of the Federal Reserve System (U.S.).
Kim, Soyoung, 2001,” International Transmission of U.S. Monetary Policy Shocks: Evidence from VAR's,” Journal of Monetary Economics, Vol. 48, No 2, pp. 339–72.
Kool, Clemens J.M., and Daniel L. Thornton, 2012, “How Effective Is Central Bank Forward Guidance?” Working Paper 2012–063, Federal Reserve Bank of St. Louis.
Lo Duca, Marco, Giulio Nicoletti, and Ariadna Vidal Martinez, 2014,”Global Corporate Bond Issuance: What Role for US Quantitative Easing?” ECB Working Paper 1649 (Frankfurt: European Central Bank).
Maćkowiak, Bartosz, 2007, “External Shocks, U.S. Monetary Policy and Macroeconomic Fluctuations in Emerging Markets,” Journal of Monetary Economics, Vol. 54, No. 8, pp. 2512–520.
Matheson,T., and E. Stavrev, forthcoming, “News and Monetary Shocks at a High Frequency: A Simple Approach,” IMF Working Paper (Washington: International Monetary Fund).
Mishra, Prachi, Kenji Moriyama, Papa N’Diaye, and Lam Nguyen, forthcoming, “Impact of Fed Tapering Announcements on Emerging Markets,” IMF Working Paper.
Organization for Economic Cooperation and Development (OECD), 2014 “Spillover Effects from Exiting Highly Expansionary Monetary Policies,” OECD Economics Department Working Paper 1116 (Paris: OECD).
Raskin, Matthew D., 2013, “The Effects of the Federal Reserve's Date-Based Forward Guidance,” Finance and Economics Discussion Series 2013–37, Federal Reserve Board, Washington.
Reinhart, Carmen and Kenneth Rogoff, 2011,"A Decade of Debt," CEPR Discussion Papers 8310, C.E.P.R. Discussion Papers.
Rogers, John, C. Scotti, and J. Wright, 2013, “Evaluating Asset-Market Effects of Unconventional Monetary Policy: A Cross-Country Comparison,” International Finance Division, Federal Reserve Board, Washington.
Swanson, Eric T., and John C. Williams, 2013,“Measuring the Effect of the Zero Lower Bound on Medium- and Longer-term Interest Rates,” Working Paper Series 2012–02, Federal Reserve Bank of San Francisco.
2014 SPILLOVER REPORT
102 INTERNATIONAL MONETARY FUND
Taylor, John B., 1999,"Monetary Policy Rules," NBER Books, National Bureau of Economic Research, Inc.
Towbin, Pascal and Sebastian Weber, 2013, “Limits of Floating Exchange Rates: The Role of Foreign Currency Debt and Import Structure,” Journal of Development Economics, Vol. 101(C), pp. 179–94.
Vitek, F., forthcoming, “Policy and Spillover Analysis in the World Economy: A Panel Dynamic Stochastic General Equilibrium Approach,” IMF Working Paper (Washington: International Monetary Fund).
Chapter 3
Aasveit, K. A., H. C. Bjørnland, and Leif Anders Thorsrud, 2013, “What Drives Oil Prices? Emerging versus Developed Economies,” Norges Bank Working Paper 2012/11
Abdih, Y., A. Barajas, R. Chami, and C. Ebeke, 2012, “Remittances Channel and Fiscal Impact in the Middle East, North Africa, and Central Asia,” IMF Working Paper 12/104 (Washington: International Monetary Fund).
Adler, Gustavo, and Sebastián Sosa, 2014, “Intraregional Spillovers in South America: Is Brazil Systemic after All?” The World Economy, Vol. 37, Issue 3, pp. 456–80.
Ahuja, A., and Nabar, Malhar, 2012, “Investment-led Growth in China: Global Spillovers,” IMF Working Paper No. 12/267 (Washington: International Monetary Fund).
Bai, J., and S. Ng, 2013, “Principal Components Estimation and Identification of Static Factors,” Journal of Econometrics, Vol. 176, No. 1, pp. 18–29.
Basdevant, O., A. Jonelis, B. Mircheva, and S. Slavov, 2014, “The Mystery of Missing Real Spillovers in Southern Africa: Some Facts and Possible Explanations,” Working Paper 14/3 (Washington: International Monetary Fund).
Bernanke, B., J. Boivin, and P. S. Eliasz, 2005, “Measuring the Effects of Monetary Policy: A Factor-augmented Vector Autoregressive (FAVAR) Approach,” Quarterly Journal of Economics, Vol. 120, No. 1, pp. 387–422.
Buncic, D., and M. Melecky, 2013, “Macroprudential Stress Testing of Credit Risk: A Practical Approach for Policy Makers,” Journal of Financial Stability, Vol. 9, No. 3, pp. 347–70.
Canales-Kriljenko, J., F. Gwenhamo, and S. Thomas, 2013, “Inward and Outward Spillovers in the SACU Area,” IMF Working Paper 13/31 (Washington: International Monetary Fund).
Cerutti, E., A. Ilyina, Y. Makarova, and C. Schmieder, 2010, “Bankers without Borders? Implications of Ring-Fencing for European Cross-Border Banks,” IMF Working Paper 10/247 (Washington: International Monetary Fund).
_____, Stijn Claessens, and Patrick McGuire, 2012, “Systemic Risk in Global Banking: What Available Data Can Tell Us and What More Data Are Needed,” NBER Working Paper 18531 (Cambridge, Massachusetts: National Bureau of Economic Research).
2014 SPILLOVER REPORT
INTERNATIONAL MONETARY FUND 103
_____, 2013, “Banks’ Foreign Credit Exposures and Borrowers’ Rollover Risks Measurement, Evolution and Determinants,” IMF Working Paper 13/9 (Washington: International Monetary Fund).
Committee on the Global Financial System (CGFS), 2014, “EME Banking Systems and Regional Financial Integration,” CGFS Working Paper No. 51 (Basel: Bank for International Settlements).
Cubeddu, L., A. Culiuc, G. Fayad, Y. Gao, K. Kochhar, A. Kyobe, C. Oner, R. Perrelli, S. Sanya, E. Tsounta, and Z. Zhang, 2014, “Emerging Markets in Transition: Growth Prospects and Challenges,” Staff Discussion Note 14/6 (Washington: International Monetary Fund).
Dabla-Norris, Era, Raphael Espinoza, and Sarwat Jahan, 2012, “Spillovers to Low-Income Countries: Importance of Systemic Emerging Markets,” IMF Working Paper No. 12/49 (Washington: International Monetary Fund).
Dées S., F.D. Mauro, M.H. Pesaran, and L.V. Smith, 2007, “Exploring the International Linkages of the Euro Area: A Global VAR Analysis,” Journal of Applied Econometrics, Vol. 22, pp. 1–38.
Duclaud, Javier, and Gerardo Garcia, 2012, “Mexico’s Oil Price-Hedging Program,” in Commodity Price Volatility and Inclusive Growth in Low-Income Countries, ed. by Rabah Arezki, Catherine A Pattillo, Marc Quintyn, and Min Zhu (Washington: International Monetary Fund).
Duval, Romain, Kevin C. Cheng, Kum Hwa Oh, Richa Saraf, and Dulani Seneviratne, 2014, “Trade Integration and Business Cycle Synchronization: A Reappraisal with Focus on Asia,” IMF Working Paper No. 14/52 (Washington: International Monetary Fund).
Espinosa-Vega, Marco A., and Juan Solé, 2010, “Cross-Border Financial Surveillance: A Network Perspective,” IMF Working Paper 10/105 (Washington: International Monetary Fund).
International Monetary Fund (IMF), 2009, Mexico: 2008 Article IV Consultation, IMF Country Report No. 09/53 (Washington).
_____, 2011, People’s Republic of China: Spillover Report for the 2011 Article IV Consultation and Selected Issues, IMF Country Report No. 11/193 (Washington).
_____, 2012a, Regional Economic Outlook: Western Hemisphere, April (Washington).
_____, 2012b, “Nigeria and South Africa: Spillovers to the Rest of Sub-Saharan Africa,” in Regional Economic Outlook: Sub-Saharan Africa (Washington).
_____, 2013a, India: 2013 Article IV Consultation, IMF Country Report No. 13/27 (Washington).
_____, 2013b, South Africa: 2013 Article IV Consultation, IMF Country Report No. 13/303 (Washington).
_____, 2013c, Turkey: 2013 Article IV Consultation, IMF Country Report No. 13/363 (Washington).
_____, 2013d, Global Stability Report, April (Washington).
_____, 2013e, World Economic Outlook, October (Washington).
2014 SPILLOVER REPORT
104 INTERNATIONAL MONETARY FUND
_____, 2013f, World Economic Outlook, April (Washington).
_____, 2014a, India: 2014 Article IV Consultation, IMF Country Report No. 14/57 (Washington).
_____, 2014b, India Selected Issues, Country Report No. 14/58 (Washington).
_____, 2014c, World Economic Outlook, April (Washington).
_____, 2014d, Global Stability Report, April (Washington).
_____, 2014e, Fiscal Monitor, April (Washington).
Kabundi, A., and E. Loots, 2007, “Co-movement between South Africa and the Southern African Development Community: An Empirical Analysis,” Economic Modeling, Vol. 24, pp. 737–748.
Kilian, L., 2009, “Not All Oil Price Shocks Are Alike: Disentangling Demand and Supply Shocks in the Crude Oil Market,” American Economic Review, Vol. 99, No. 3, pp. 1053–069.
Koopman, R., Z. Wang, and S. Wei, 2014, “Tracing Value-added and Double Counting in Gross Exports,” American Economic Review, Vol. 104, No. 2, pp. 459–94.
Kose, Ayhan, and Eswar Prasad, 2010, Emerging Markets: Resilience and Growth amid Global Turmoil (Washington: Brookings Institution Press).
Lane, Philip, and Gian-Maria Milesi-Ferretti, 2007, “The External Wealth of Nations Mark II,” Journal of International Economics, Vol. 73, No. 2, pp. 223–50.
Milesi-Ferretti, Gian-Maria, Francesco Strobbe, and Natalia Tamirisa, 2010, “Bilateral Financial Linkages and Global Imbalances: A View on the Eve of the Financial Crisis,” IMF Working Paper 10/257 (Washington: International Monetary Fund).
Organization for Economic Cooperation and Development (OECD), 2014, Assessing Vulnerabilities of Emerging Economies and Possible Spillovers to High-Income Countries (Paris: OECD).
Pearl, J., 2000, Causality, Oxford University Press.
Pesaran, M.H., T. Schuermann, and S.M. Weiner, 2004, “Modeling Regional Interdependencies Using a Global Error-correcting Macroeconometric Model,” Journal of Business and Economic Statistics, Vol. 22, pp. 129–62.
Rubio-Ramirez, J. F., D. F. Waggoner, and T. Zha, 2010, “Structural Vector Auto Regressions: Theory of Identification and Algorithms for Inference,” Review of Economic Studies, Vol. 77, No. 2, pp. 665–96.
Sheridan, Niamh, Patrizia Tumbarello, and Yiqun Wu, 2012, “Global and Regional Spillovers to Pacific Island Countries,” IMF Working Paper No. 12/154 (Washington: International Monetary Fund).
Sprites P., C. Glymour, and R. Scheines, 2000, “Causation, Prediction, and Search,” 2nd Edition, MIT Press.
2014 SPILLOVER REPORT
INTERNATIONAL MONETARY FUND 105
Timmer, M.P. (ed), 2012, “The World Input-Output Database (WIOD): Contents, Sources and Methods,” WIOD Working Paper No. 10 http://www.wiod.org/publications/papers/wiod10.pdf.
Tsounta, Evridiki, forthcoming, “Slowdown in Emerging Markets: A Sign of a Bumpy Road Ahead?” IMF Working Paper, (Washington: International Monetary Fund).
Turner, Philip, 2014, “The Global Long-term Interest Rate, Financial Risks and Policy Choices in EMEs,” BIS Working Paper No. 441 (Basel: Bank for International Settlements).