OPERATING ANALYST NOTES Contents I: Overview 1 II: Recommendations 4 III: 2014 Service Overview and Plan 5 IV: 2014 Recommended Total Operating Budget 12 V: Issues for Discussion 25 Appendices: 1) 2013 Performance 32 2) Recommended Budget by Expense Category 34 3) Summary of 2014 Service Changes 38 4) Summary of 2014 New & Enhanced Service Changes 39 5) Inflows/Outflows to / from Reserves & Reserve Funds 40 6) 2014 User Fee Rate Changes 41 Toronto Water 2014 OPERATING BUDGET OVERVIEW What We Do Toronto Water, the largest supplier of municipal drinking water and wastewater treatment in Canada and fifth largest in North America, delivers water treatment and distribution, and wastewater collection and treatment services on demand to 3.4 million residents and businesses in Toronto, and portions of York Region and Peel Region, 24 hours a day, 7 days a week, 365 days a year. 2014 Budget Highlights The total cost to deliver this service to Toronto residents in 2014 is $403.163 million as shown below. $ % Gross Expenditures 394,632.9 403,163.0 8,530.1 2.2% Revenue Excluding Sale of Water 39,707.2 42,232.0 2,524.8 6.4% Net Expenditure 354,925.7 360,931.0 6,005.3 1.7% Sale of Water Revenue 874,293.0 958,102.8 83,809.8 9.6% Sale of Water Revenue - Region of York 26,797.0 21,550.7 (5,246.2) -19.6% Total Sale of Water Revenue 901,090.0 979,653.6 78,563.6 8.7% Capital Contribution 546,164.3 618,722.6 72,558.3 13.3% (In $000s) Approved 2013 Budget Recommended 2014 Budget Change Contacts Stephen Conforti Manager, Financial Planning Tel: (416) 397-0958 Email: [email protected]Maria Djergovic Senior Financial Planning Analyst Tel: (416) 397-4558 Email: mdjergo @toronto.ca
Transcript
OPERATING ANALYST NOTES
Contents
I: Overview 1
II: Recommendations 4
III: 2014 Service Overview and Plan 5
IV: 2014 Recommended Total Operating Budget 12
V: Issues for Discussion 25
Appendices:
1) 2013 Performance 32
2) Recommended Budget by Expense Category 34
3) Summary of 2014 Service Changes 38
4) Summary of 2014 New & Enhanced Service Changes 39
5) Inflows/Outflows to / from Reserves & Reserve Funds 40
6) 2014 User Fee Rate Changes 41
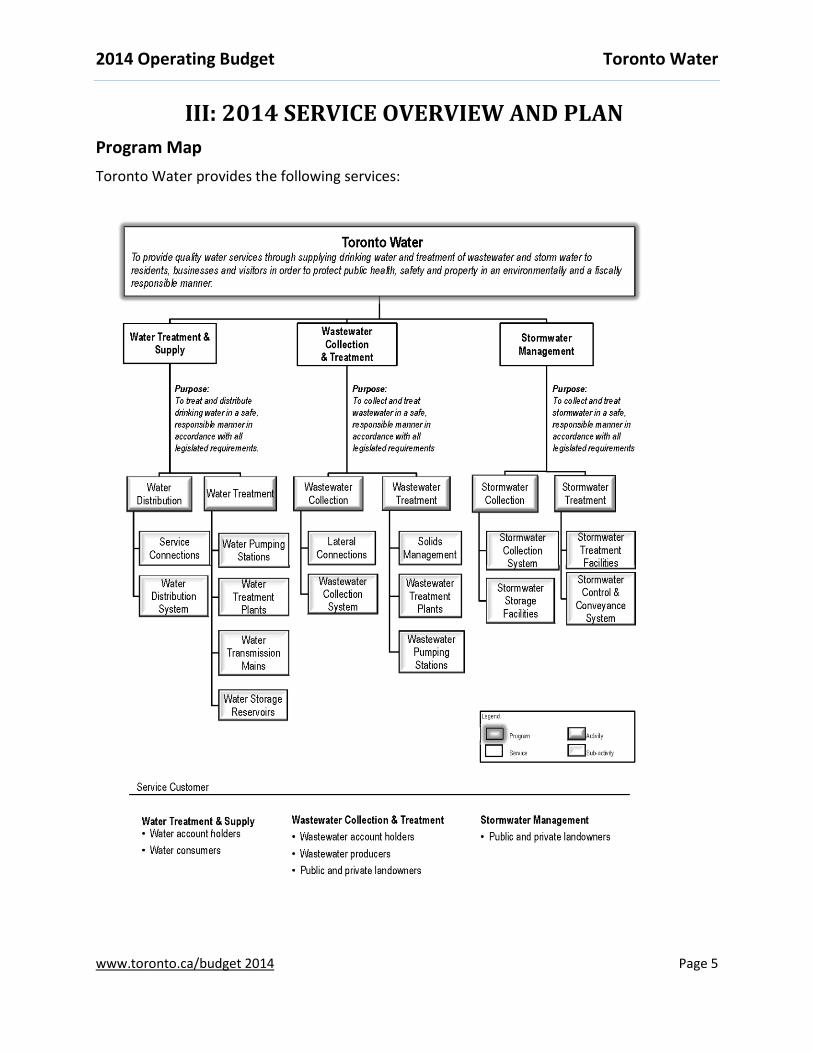
Toronto Water 2014 OPERATING BUDGET OVERVIEW What We Do Toronto Water, the largest supplier of municipal drinking water and wastewater treatment in Canada and fifth largest in North America, delivers water treatment and distribution, and wastewater collection and treatment services on demand to 3.4 million residents and businesses in Toronto, and portions of York Region and Peel Region, 24 hours a day, 7 days a week, 365 days a year.
2014 Budget Highlights The total cost to deliver this service to Toronto residents in 2014 is $403.163 million as shown below.
$ %Gross Expenditures 394,632.9 403,163.0 8,530.1 2.2%Revenue Excluding Sale of Water
39,707.2 42,232.0 2,524.8 6.4%
Net Expenditure 354,925.7 360,931.0 6,005.3 1.7%Sale of Water Revenue 874,293.0 958,102.8 83,809.8 9.6%Sale of Water Revenue - Region of York
26,797.0 21,550.7 (5,246.2) -19.6%
Total Sale of Water Revenue 901,090.0 979,653.6 78,563.6 8.7%Capital Contribution 546,164.3 618,722.6 72,558.3 13.3%
(In $000s) Approved
2013 BudgetRecommended
2014 Budget
Change
Through on-going operational efficiencies, Toronto Water was able to partially offset initial gross pressure of $18.580 million to $6.005 million net, reflecting a 1.7% net increase prior to increased sale of water revenues arising from the 9% water rate increase.
Treatment, transmission, storage, and distribution of over 1 billion litres of potable water daily is delivered to all industrial, commercial, institutional, and household water users in the City of Toronto, amounting to 470,200 connections.
Over 1.5 billion litres of wastewater is collected and treated per day, from residents and businesses in Toronto and a portion of Peel Region.
City wide stormwater management in order to protect private property and the environment.
Trends
Base water consumption (October to April) has declined by 2.1% annually on average since 2007. 2013 projected consumption of 334 million cubic meters is significantly lower than the 374 million cubic meters consumed in 2005.
2014 represents the last year of the planned 9% rate increase (over 9 years), introduced in 2006 to address capital infrastructure needs.
Our Service Deliverables for 2014
The 2014 Recommended Operating Budget of $403.163 million gross will ensure delivery of water and wastewater services for 3.4 million residents and business in Toronto by providing:
Treatment and supply of 454 billion litres of water (includes York Region);
Collection and treatment of 425 billion litres of wastewater;
Replacement of 5,000 sub-standard water services (approximately 3,900 of which are lead);
Response to and clearing of 10,000 blocked sewer connections;
Declining water consumption resulting in lower revenues from water rates needed to support capital requirements.
Executive Committee considered a report entitled, "Future Options and Public Attitudes for Paying for Water, Wastewater and Stormwater Infrastructure and Services" to aid in developing a financing strategy to support Toronto Water.
Continuously increasing costs from Legislative requirements and compliance with Provincial and Federal regulations; and operating impacts of completed capital projects.
The 2014 Recommended Budget includes funding to meet all regulations as well as to support and maintain completed capital projects.
OurPriorityActions
Continuous service delivery improvement.
On‐going optimization at treatment plants and pumping stations to minimize energy costs, while meeting required legislative standards.
Focusing on planning and training to ensure availability of future workforce for the Division.
II: RECOMMENDATIONS Recommendations The City Manager and Chief Financial Officer recommend that:
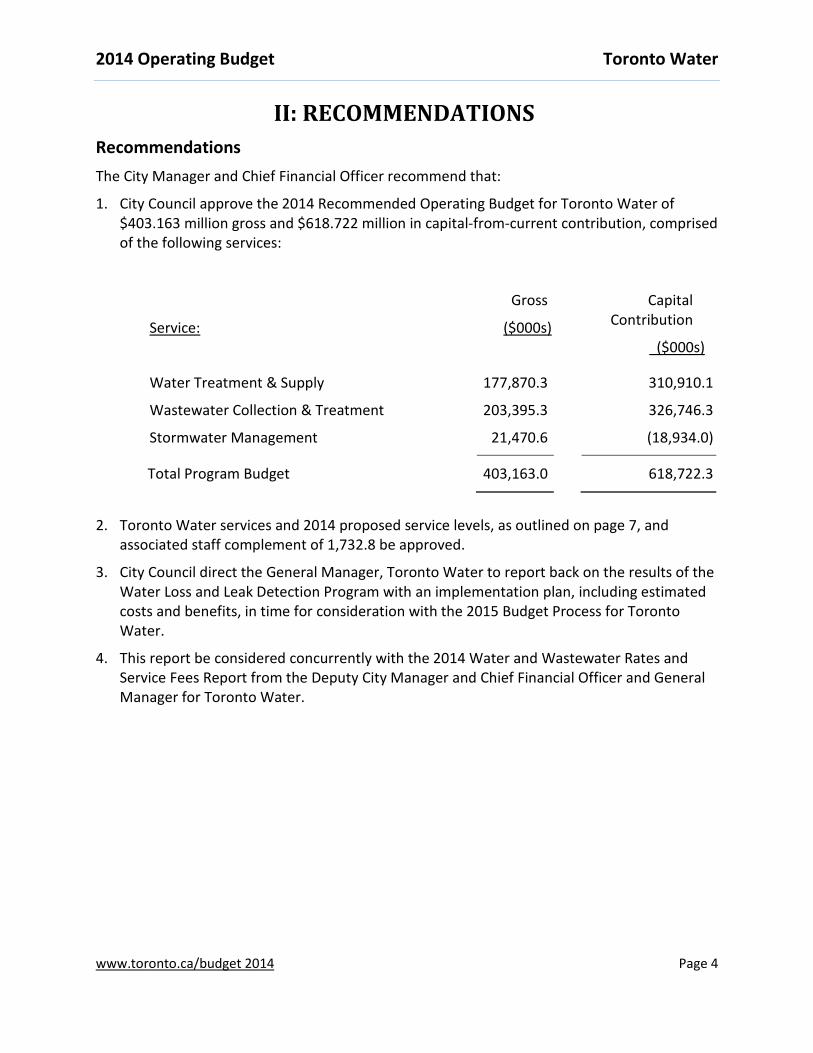
1. City Council approve the 2014 Recommended Operating Budget for Toronto Water of $403.163 million gross and $618.722 million in capital-from-current contribution, comprised of the following services:
2. Toronto Water services and 2014 proposed service levels, as outlined on page 7, and associated staff complement of 1,732.8 be approved.
3. City Council direct the General Manager, Toronto Water to report back on the results of the Water Loss and Leak Detection Program with an implementation plan, including estimated costs and benefits, in time for consideration with the 2015 Budget Process for Toronto Water.
4. This report be considered concurrently with the 2014 Water and Wastewater Rates and Service Fees Report from the Deputy City Manager and Chief Financial Officer and General Manager for Toronto Water.
2014 Service Deliverables: The 2014 Recommended Operating Budget of $403.163 million gross will ensure delivery of Water and Wastewater services for 3.4 million residents and business in Toronto by providing:
Treatment and supply of 454 billion litres of water (including York Region);
Collection and treatment of 425 billion litres of wastewater;
Replacement of 5,000 sub-standard water services (approximately 3,900 of which are lead);
Response to and clearing of 10,000 blocked sewer connections;
Cleaning of over 122,000 catch basins; and
Repair of approximately 1,500 broken watermains.
Service Profile: Water Treatment and Supply
What we do: Treat and distribute drinking water in a safe, responsible manner in accordance with all
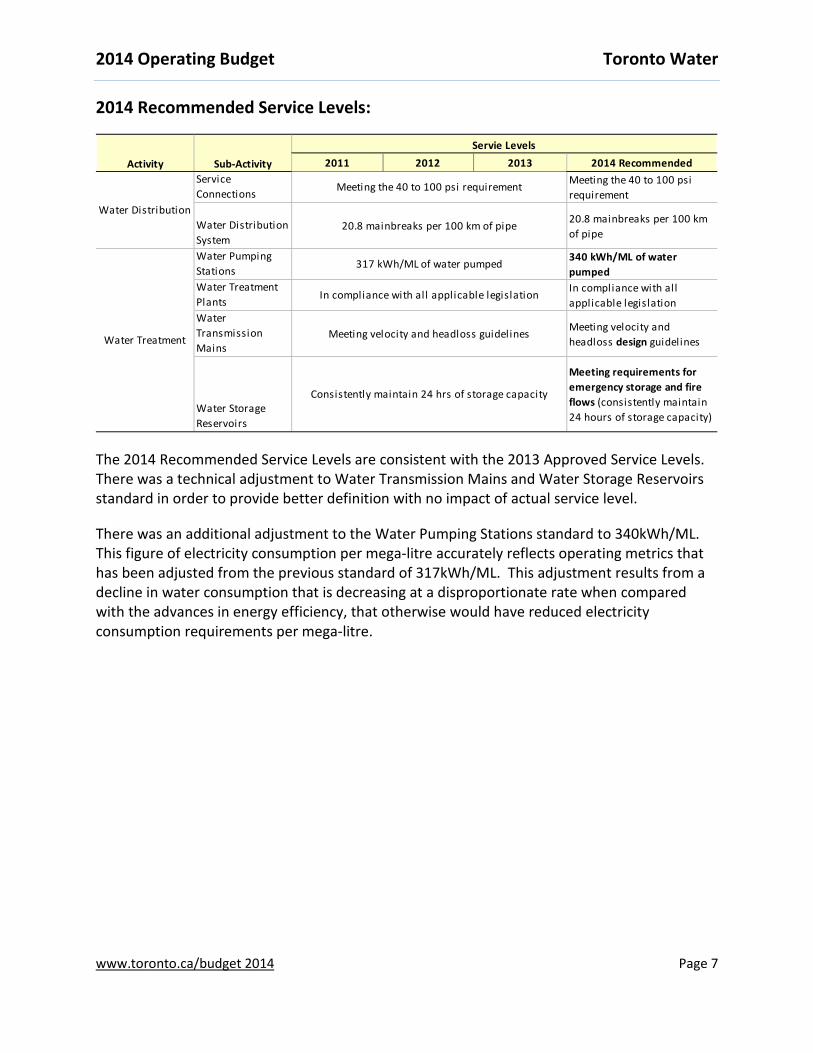
Meeting requirements for emergency storage and fire flows (consistently maintain 24 hours of storage capacity)
Meeting the 40 to 100 psi requirement
20.8 mainbreaks per 100 km of pipe
In compliance with all applicable legislation
Meeting velocity and headloss guidelines
Consistently maintain 24 hrs of storage capacity
Water Distribution
Water Treatment
Servie Levels
Activity Sub-Activity
317 kWh/ML of water pumped
The 2014 Recommended Service Levels are consistent with the 2013 Approved Service Levels. There was a technical adjustment to Water Transmission Mains and Water Storage Reservoirs standard in order to provide better definition with no impact of actual service level.
There was an additional adjustment to the Water Pumping Stations standard to 340kWh/ML. This figure of electricity consumption per mega-litre accurately reflects operating metrics that has been adjusted from the previous standard of 317kWh/ML. This adjustment results from a decline in water consumption that is decreasing at a disproportionate rate when compared with the advances in energy efficiency, that otherwise would have reduced electricity consumption requirements per mega-litre.
Operating Cost for the Distribution/Transmission of Drinking Water per km of Water Distribution Pipe
Actual 2009 Actual 2010 Actual 2011 Actual 2012Operating Cost for the Distribution/Transmission of Drinking Water per km of Water Distribution Pipe $24,722.11 $23,160.32 $18,410.19 $13,905.03
$0
$5,000
$10,000
$15,000
$20,000
$25,000
$30,000
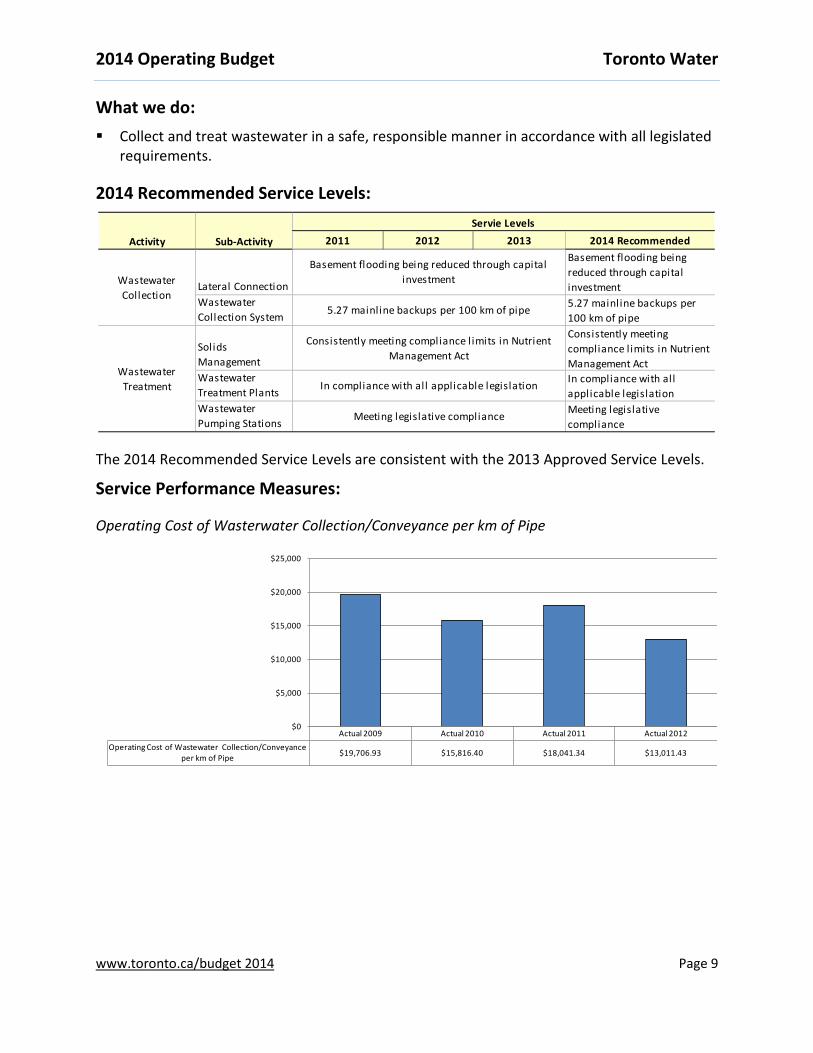
Service Profile: Wastewater Collection and Treatment
The 2014 Recommended Operating Budget for Toronto Water of $403.163 million gross and $1.022 billion in revenue, resulting in $618.722 million in capital-from-current contribution, reflects an increase of 2.2% over the 2013 Approved Budget gross expenditures of $394.633 million and an increase of 13.3% over the 2013 Approved Capital Contribution of $546.164 million and is comprised of the following services:
Water Treatment and Supply service of $178.172 million gross reflects a year over year increase of $2.832 million or 1.6% over the 2013 Approved Budget gross expenditures. $489.082 million in revenue is generated from this service, resulting in $310.910 million in capital-from-current contribution, an increase of $31.376 million or 11.2% over the 2013 Approved Capital Contribution.
Base pressures are mostly attributable to inflationary increases in salaries and benefits ($1.285 million); inflationary increases for materials and supplies and contracted services ($2.711 million); and increases in operating costs resulting from completed capital projects ($2.338 million).
These pressures were partially offset by savings from a line by line review ($0.530 million) and optimisation of water treatment processes ($1.294 million).
The 2014 Recommended Operating Budget for the Water Treatment and Supply service includes funding for a new Water Loss and Leak Detection Program ($0.301 million) and revenues from a new reporting fee associated with the Backflow Prevention Program ($0.040 million).
Future year incremental costs are attributable increases in salary and benefits of $1.739 million in 2015 and $0.161 million in 2016, corrosion control costs and costs of materials and supplies for water treatment plants of $2.462 million in 2015 and $4.122 million in 2016, contributions to fleet reserve of $0.250 million in 2015, and legislative requirement costs under Bill 8 of $0.252 million in 2015.
Wastewater Collection and Treatment service with $230.471 million in gross expenditures reflects an increase over the 2013 Approved Budget of $5.230 million or 2.7%. This service generates $530.217 million in revenue, resulting in $326.746 million in capital-from-current contribution, an increase of $41.303 million 14.5% over the 2013 Approved Capital Contribution.
Key cost drivers for this service include Inflationary pressures related to salaries and benefits ($1.370 million), Inflationary non-salary cost increases for materials and supplies and contracted services ($2.988 million), Higher operating costs as a result of completed capital projects ($2.281million) and impacts from recent Federal wastewater systems effluent regulations ($1.300 million).
The above pressures were partially offset by line by line review savings ($0.841 million) and optimisation of wastewater treatment processes ($2.557 million).
This service includes funding allocated for the recommended new Water Loss and Leak Detection Program ($0.075 million) and revenues from the recommended new reporting fee associated with the Backflow Prevention Program ($0.066 million).
Future year incremental costs are attributable to increases in salary and benefits of $1.829 million in 2015 and $0.182 million in 2016, corrosion control costs and costs of materials and supplies for wastewater treatment plants of $2.715 million in 2015 and $4.450 million in 2016, contributions to fleet reserve of $0.225 million in 2015, and legislative requirement related costs under Bill 8 of $0.128 million in 2015.
Stormwater Management service with a 2014 Recommended Budget of $21.521 million gross reflects an increase of $0.398 million or 1.9% over the 2013 Approved Budget. Stormwater Management service does not generate any capital-from current contribution as its revenues are not sufficient to cover gross expenditures for this service. $18.934 million in Water Treatment & Supply and Wastewater Collection & Treatment revenues that would otherwise be directed to capital-from-current contributions are required to support the Stormwater Management service operating requirements.
Base pressures for this service are mostly attributable to inflationary increases in salaries and benefits of $0.280 million and various non-salary costs of $0.075 million.
The 2014 Recommended Operating Budget for the Stormwater Management service includes funding allocated for the recommended new Water Loss and Leak Detection Program ($0.050 million) and revenues from the recommended new reporting fee associated with the Backflow Prevention Program ($0.044 million).
Future year incremental costs are attributable to increases in salary and benefits of $0.353 million in 2015 and $0.053 million in 2016, costs increases for materials and supplies of $0.070 million in 2015 and $0.364 million in 2016 and operating impact of completed capital projects of $0.100 million in 2015.
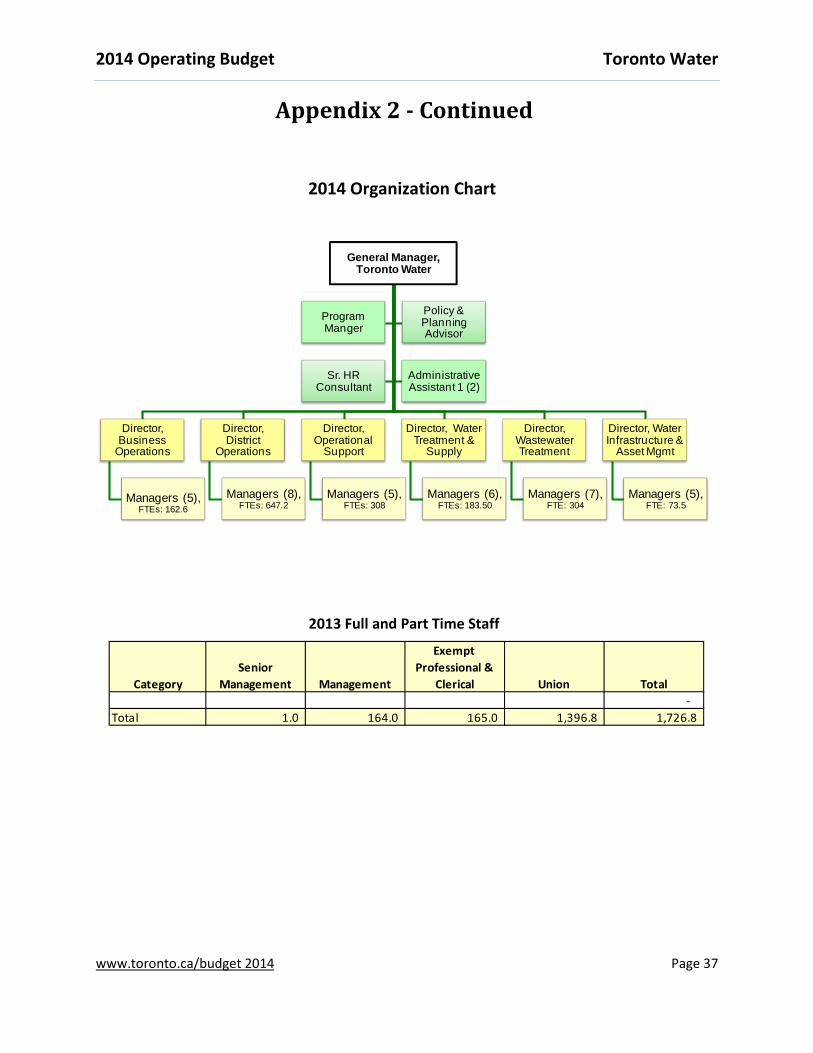
2014 Recommended Total Staff Complement
Changes2014
Budget2015 Plan
2016 Plan
Opening Complement 1,724.8 1,732.8 1,737.8 In-year Adjustments 2.0 Adjusted Staff Complement 1,726.8 1,732.8 1,737.8 Recommended Change in Staff Complement - Temporary Complement - capital project delivery 6.0 - Operating impacts of completed capital projects 5.0 5.0 (23.0) - Service Change Adjustments (11.0) - New / Enhanced 6.0 Total 1,732.8 1,737.8 1,714.8 % Change over prior year 0.3% -1.3%
In 2013, 2 permanent positions were added to the staff complement as a result of organizational restructuring implemented by Engineering and Construction Services. These 2 positions were reclassified from capital to operating positions, due to the fact that they support capital planning functions, rather than direct delivery.
The 2014 recommended staff changes include:
An additional 5 permanent positions for ongoing maintenance of upgraded facilities and processes resulting from previously approved completed capital projects.
Another 15 permanent positions are needed to address increased operational requirements due to linear infrastructure growth (2 permanent positions deferred from 2013), workforce development program (3 permanent positions), process control systems (3 permanent positions), environmental, health and safety and customer service improvement/sustainment, and backflow prevention programs (5 permanent, 3 temporary positions).
The above addition of positions was fully offset by deleting 26 vacant positions arising from operational efficiencies, resulting in no increase in the 2013 Approved Staff Complement.
To ensure efficiency and reliability of new assets coming on at Humber Creek Wastewater Treatment Plant line in 2015 Toronto Water will require 4 new permanent positions. Another permanent position is needed for the Basement Flooding Relief in both 2015 and 2016.
There will be a reduction of 24 positions in 2016 due to the implementation of the Automated Meter Reading system, which commenced in 2010.
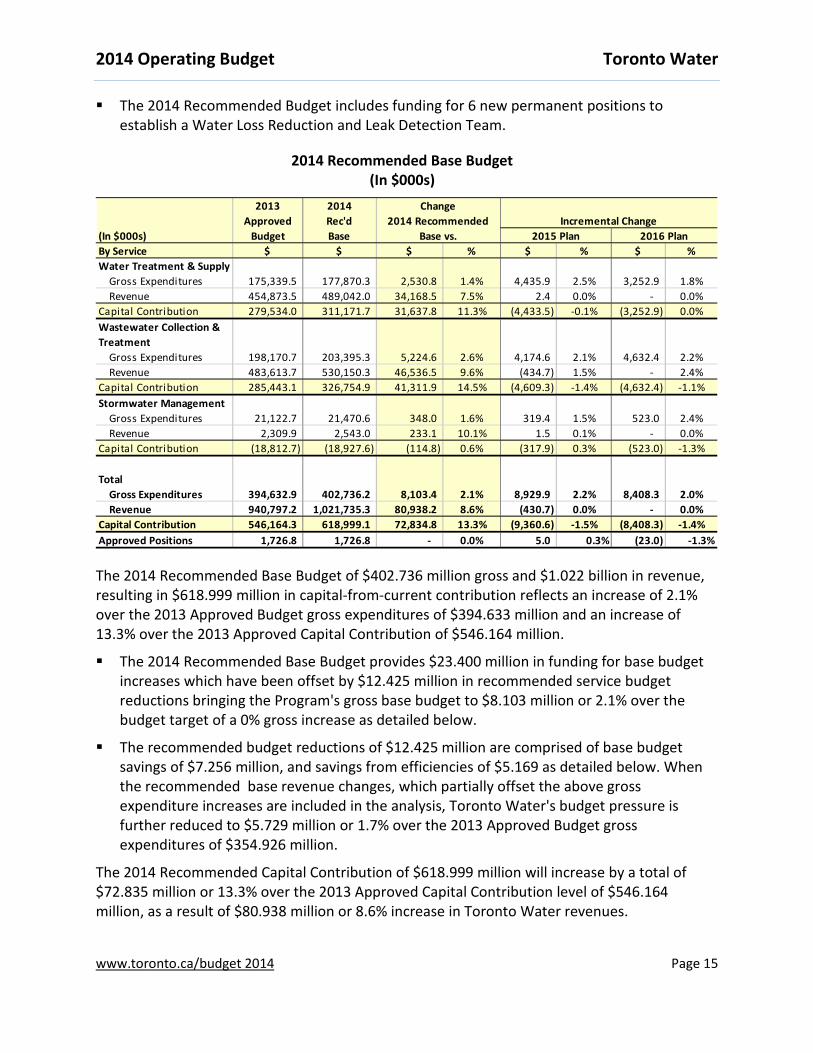
The 2014 Recommended Base Budget of $402.736 million gross and $1.022 billion in revenue, resulting in $618.999 million in capital-from-current contribution reflects an increase of 2.1% over the 2013 Approved Budget gross expenditures of $394.633 million and an increase of 13.3% over the 2013 Approved Capital Contribution of $546.164 million.
The 2014 Recommended Base Budget provides $23.400 million in funding for base budget increases which have been offset by $12.425 million in recommended service budget reductions bringing the Program's gross base budget to $8.103 million or 2.1% over the budget target of a 0% gross increase as detailed below.
The recommended budget reductions of $12.425 million are comprised of base budget savings of $7.256 million, and savings from efficiencies of $5.169 as detailed below. When the recommended base revenue changes, which partially offset the above gross expenditure increases are included in the analysis, Toronto Water's budget pressure is further reduced to $5.729 million or 1.7% over the 2013 Approved Budget gross expenditures of $354.926 million.
The 2014 Recommended Capital Contribution of $618.999 million will increase by a total of $72.835 million or 13.3% over the 2013 Approved Capital Contribution level of $546.164 million, as a result of $80.938 million or 8.6% increase in Toronto Water revenues.
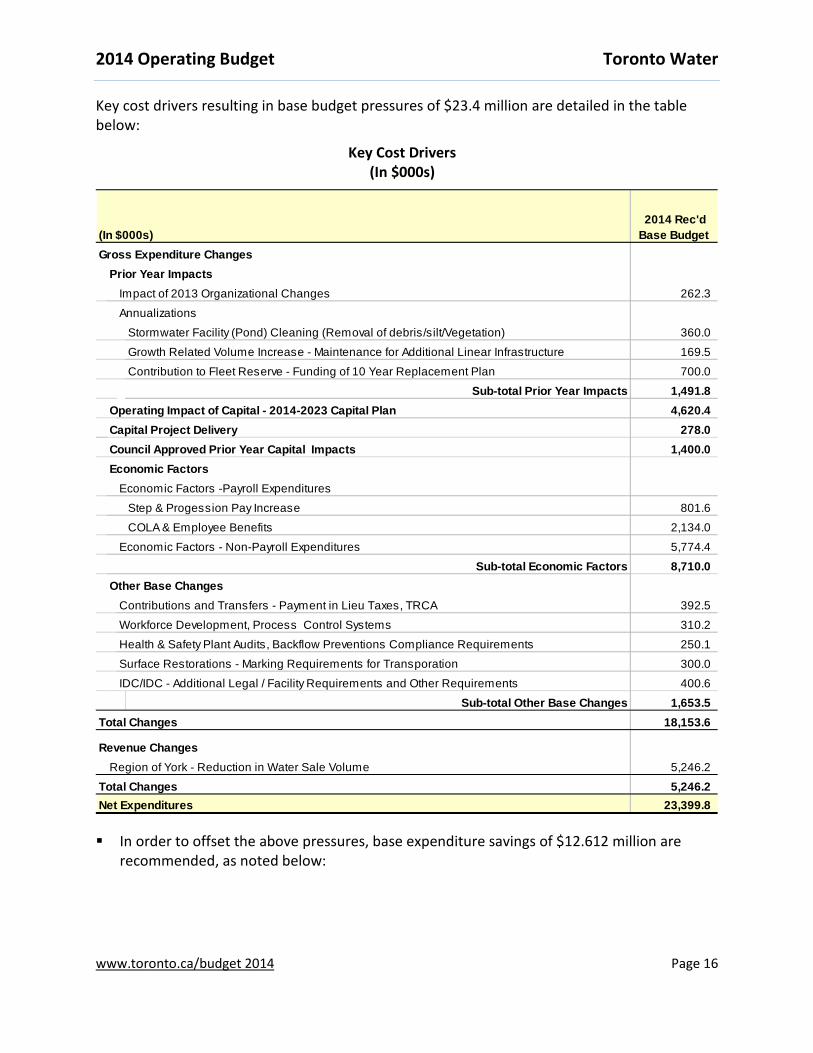
Key cost drivers resulting in base budget pressures of $23.4 million are detailed in the table below:
Key Cost Drivers (In $000s)
Prior Year ImpactsImpact of 2013 Organizational Changes 262.3
Annualizations
Stormwater Facility (Pond) Cleaning (Removal of debris/silt/Vegetation) 360.0
Growth Related Volume Increase - Maintenance for Additional Linear Infrastructure 169.5
Contribution to Fleet Reserve - Funding of 10 Year Replacement Plan 700.0
Sub-total Prior Year Impacts 1,491.8 Operating Impact of Capital - 2014-2023 Capital Plan 4,620.4 Capital Project Delivery 278.0 Council Approved Prior Year Capital Impacts 1,400.0 Economic Factors
Total Changes (30.0) (10,284.6) 12,424.8 3.1% 1,514.1 0.0 930.2 (23.0)
2014 Recommended Service Changes
2015 2016
Net Incremental Impact
Position Change Gross Exp.
Capital Contribution
% Change over 2014
Budget
The 2014 recommended service changes consist of base expenditure and revenue changes of $7.256 million and service efficiency savings of $5.169 million. In total, the Program has achieved reductions of $12.425 million net bringing the 2014 Recommended Base Budget to $8.103 million or 2.1% over the 2013 Approved Budget of $394.636 million.
Approval of these 2014 service changes on the 2015 and 2016 Operating Budget will result on incremental base budget savings of $1.514 million and $0.930 million respectively.
The 2014 recommended service changes and 2015 and 2016 incremental impacts are discussed below:
Base Expenditure Changes: (Savings of $5.115 million gross, $6.496 million net)
Operating Impact of Capital Projects
In 2013, the water meter reading function was transferred from Revenue Services to Toronto Water and integrated with the business operations in the Water Meter Program (WMP) as part of the long term sustainment for the capital investment for automated meters. In 2014, which represents the first year of transitioning to a permanent Water Meter sustainment team, through conversion of the exiting 2 temporary positions to permanent (Manager, Water Meter Program and Support Assistant B), and an addition of 2 permanent positions (System Integrator and Application and Tech Support Assistant), Toronto Water will establish the sustainment team. The addition of required positions will be offset by the deletion of 9 Inspector Water Revenue temporary positions.
Toronto Water has also recognized the loss of a capital recovery of $0.210 million, resulting from a change to 2 positions previously funded from capital budget were converted to operating positions, as they provide general planning support rather than delivery of specific capital projects.
A combined impact of these base changes is a deletion of 7 positions and net savings of $0.187 million.
Expenditure Reductions Based on Actual Experience
$4.288 million in net expenditure reductions is recommended, based on a detailed review and realignment of Toronto Water's operating expenses and revenues based on actual experience, resulting in savings in salaries and benefits ($2.178), energy and utilities ($0.752 million) and various materials and supplies ($1.357 million).
Water and Waste Water Treatment Volume Adjustments
Each year Toronto Water completes a detailed analysis of the estimated water production and wastewater to be treated. This analysis is also used to calculate the estimated chemical and energy requirements needed at the various water treatment facilities for the upcoming year.
In 2014, Toronto Water is estimating lower costs of chemicals associated with a lower water production ($1.220 million). However, Toronto Water has resumed the operation of the cake and pellet haulage management from the biosolids process resulting in additional costs ($0.780 million) which are partially offset by lower disposal cost at Green Lane Landfill.
The combined impact of these changes will result in variable cost savings associated with water production and wastewater treatment in 2014, estimated at $0.440 million.
Customer Service Improvements: Repurposing of Staff Positions and Realignment of Budget
Toronto Water identified opportunities for repurposing of positions that will achieve better support of the key guiding principles included in its 2010-2020 Strategic Plan by:
Improving the performance results of the equipment reliability program.
Establishing succession planning for managers and key positions (reclassification of existing supervisors).
Providing a greater degree of operational flexibility by creation of Electronic Instrumentation Control Technician and an Industrial Mechanic Millwright positions.
Creating a policy position to support customer service delivery pertaining to Water Infrastructure Management Environmental Assessment studies, stakeholder consultations and other related activities.
Repurposing of students to better align with the requirements of Toronto Water.
The repurposing of positions will result in savings of $0.187 million.
Customer Service Improvements: Industrial Waste Agreements
The volume of industrial waste agreements has been continuously increasing since 2012 due to increase in numbers of inspections. For example, in 2012 alone, Toronto Water added a net of 31 new industrial waste agreements for facilities that exceeded the wastewater sanitary concentration.
For 2014, Toronto Water is estimating revenue of $11.331 million. This represents an estimated increase of $1.591 million or 16%. Addition of 3 positions at cost of $0.197 million is needed in support of billing and inspection requirements, resulting in a net revenue impact of $1.395 million.
Base Revenue Changes: (Revenue of $0.759 million)
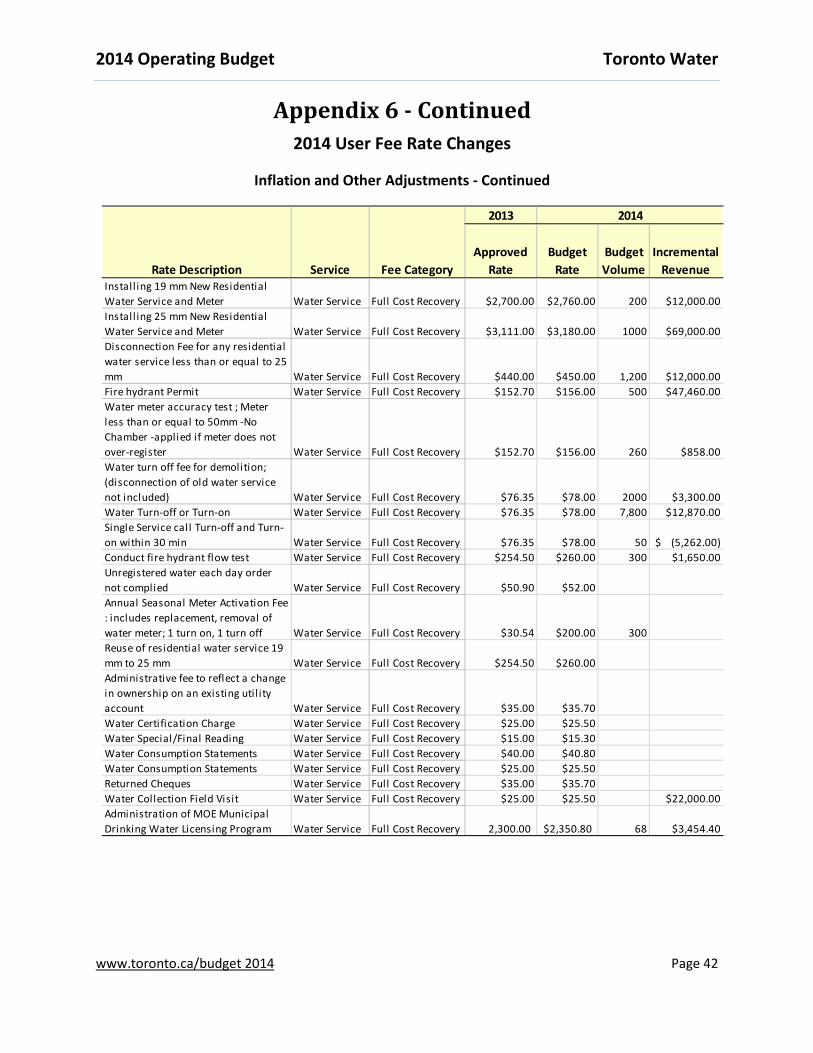
Increase to Existing User Fees
In accordance with Council's approved User Fee Policy inflationary factors that reflect service specific cost increases are applied in order to recover the full costs. As a result, the 2014 Recommended Operating Budget includes additional revenues of $0.296 million.
The overall factor for Toronto Water 2014 Budget was estimated at 2.21% for water and waste water service fees including labour cost increase, energy, utilities, materials and contracted services. The 2.21% increase was applied to most fees except for those that are part of individual contracts which increase reflects the actual contract costs, and 6 fees charged by Revenue Services for which an overall factor of 2% applicable to Revenue Services Division was used, as described below:
The following increases will be effective January 1, 2014:
16 water service fees (Appendix C – Schedule 2, Water Service, Reference Numbers: 1, 2, 5, 11, 12, 13, 15, 15.1, 17, 21, 25, 32 and 40) are increased based on 2.21% inflationary factor and actual contract increases.
8 wastewater service fees (Appendix C – Schedule 3, Wastewater Service, Reference Numbers: 4, 5, 6, 15, 16, 17, 18 and 19) are increased based on 2.21% inflationary factor and actual contract increases.
6 Revenue Services fees (Appendix C – Schedule 2, Water Service, Reference Numbers 33 to 39) are increased based on 2% inflationary factor.
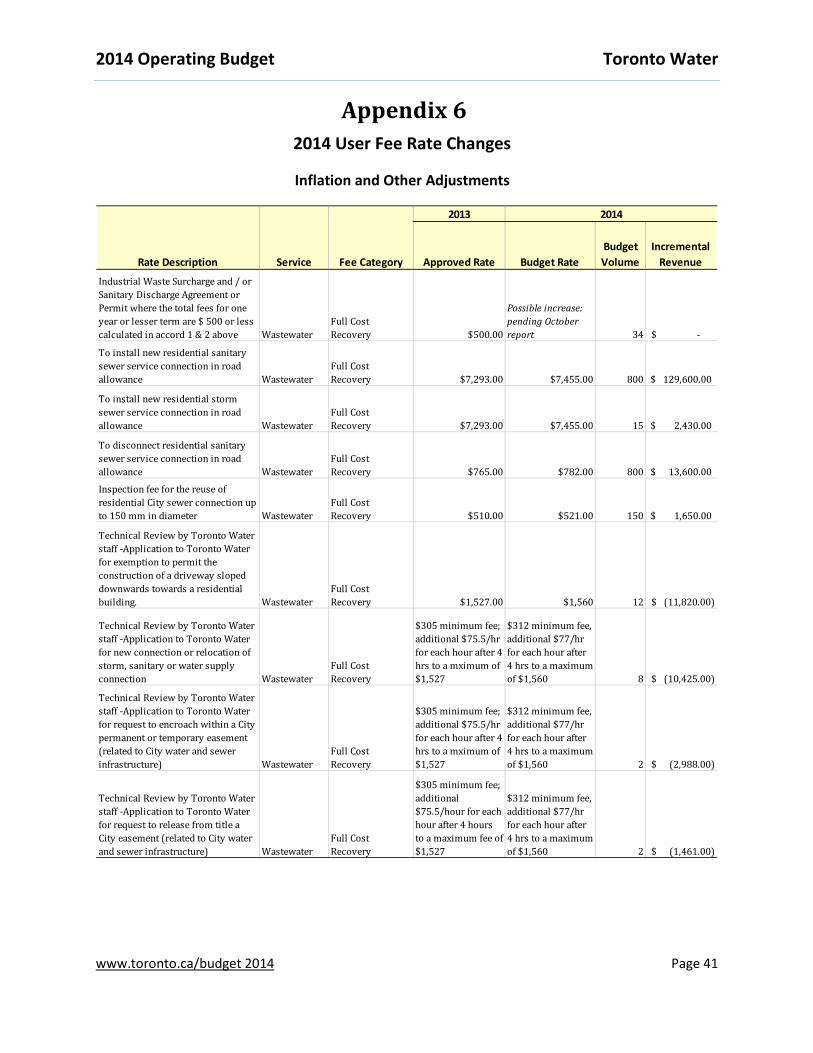
Proposed changes are summarized in Appendix 6 of these Analyst Notes and the 2014 Water and Wastewater Rate Report from the Deputy City Manager and Chief Financial Officer and General Manager for Toronto Water. This report also provides a comparison with the existing user fee rates.
Revenue from Transferred Fees
Following a restructuring of Engineering Construction Services (ECS), the staff group conducting reviews under the Transfer of Review Program was reassigned to Toronto Water. As a result, jurisdictional responsibility for the following fees (Appendix C – Schedule 1, Technical Services) has been transferred from Engineering and Construction Services (former Technical Services) to Toronto Water (Appendix D, Schedule 3):
Ref. No. 19 : Record Search for sewer use by-law compliance violation - $50.0 per property
Ref. No. 21: To review new sewer engineering designs - $1,100.0
Ref. No. 22: Review of applications for establishing or alteration of City of Toronto Drinking Water system - $2,300.0
Ref. No. 23: To Review application for sewer and watermain design - $800
Ref No 8 in MOE Fee Schedule: The review of storm and sanitary pump station, forcemains, and sanitary sewage detention chambers or oversized sewers - $1,800.0 plus $200.0 administration fee = $2,000.0
Ref No 2 in MOE Fee Schedule: The review of facilities for attenuating stormwater runoff peak flow rate or volume or for managing stormwater runoff quality such as underground chambers, oversized sewers, and oil, grit and silt separators - $2,000.0 plus $200 administration fee = $2,200.0
It is anticipated that additional revenues of $0.278 million will be generated from the above fees, transferred to Toronto Water.
Proposed changes are summarized in Appendix 6 of these Analyst Notes and in the 2014 Water and Wastewater Rates and Service Fees Report from the Deputy City Manager and Chief Financial Officer and General Manager for Toronto Water.
Other revenues of $0.185 million include inflationary adjustments to the Deep Lake Water Cooling revenue that Toronto Water receives from Enwave based on the current agreement ($0.150 million), revenues from sale of scrap metal ($0.030 million) and development application review fees ($0.005 million).
Service Efficiencies: ($5.169 million gross, savings of $5.169 million net)
District Operations: Restoration Services
Pilot projects, conducted from August 2012 to May 2013, showed that contracting out of temporary asphalt and permanent soft surface (sod) restoration results in a lower overall cost per location, better quality of work and response time, as well as specialised landscaping restoration.
By contracting out surface repairs after excavations Toronto Water will realize savings of $0.357 million. Contracting out will also improve delivery aspects of this service. As a result 6 permanent vacant positions and 7 temporary vacant positions will be deleted in 2014.
District Operations: Locates
In 2012 and 2013, Toronto Water also conducted a pilot project on contracting out the function of physically locating, marking and mapping underground water infrastructure prior to excavating. It was determined that costs per locate were lower and that specialized contractors were able to respond to calls within 5 days instead of a three week period tipical response time for Toronto Water's crews.
By contracting out this function, Toronto Water will achieve savings of $0.264 million. Additional benefits in terms of improved quality of assessments and minimal delays in residential restoration/renovation projects are anticipated. This will also ensure that the City is able to meet requirements under Bill 8 (Ontario One Call). As a result of this change 13 permanent vacant positions will be deleted.
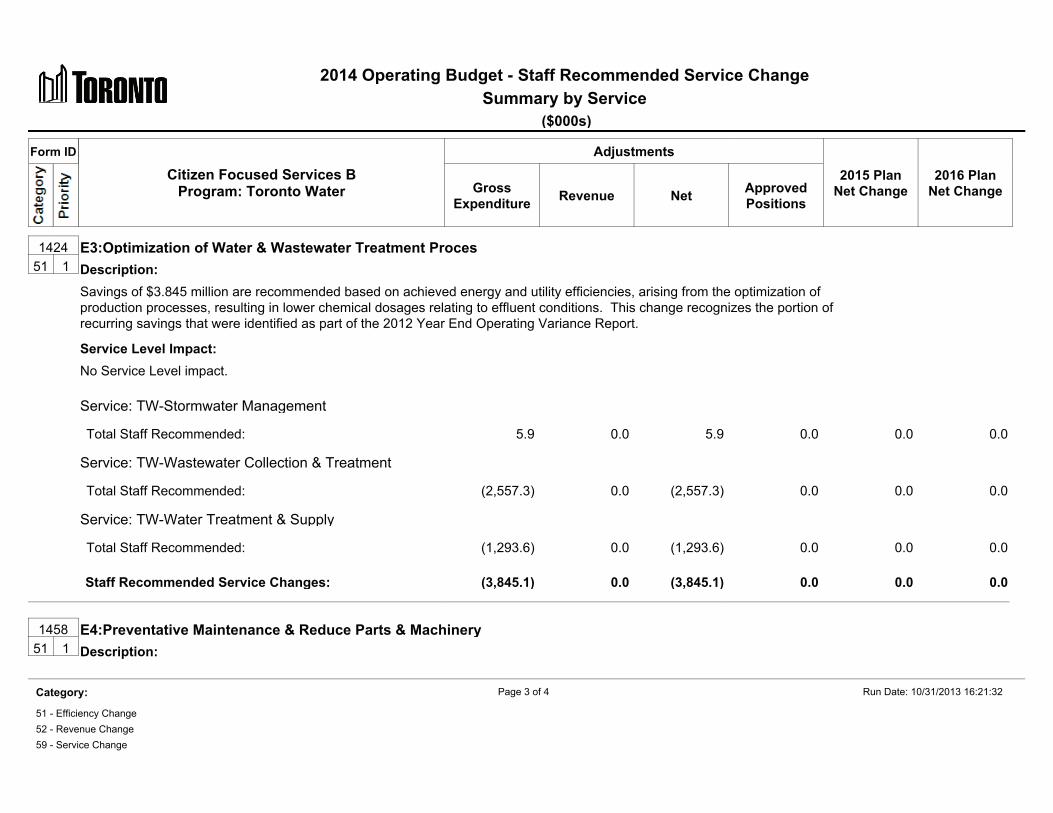
Optimization of Water and Waste Water Processes
Savings of $3.845 million are recommended based on achieved energy and utility efficiencies, arising from the optimization of production processes, resulting in lower chemical dosages relating to effluent conditions. This change recognizes the portion of recurring savings that were identified as part of the 2012 Year End Operating Variance Report.
Preventative Maintenance and Reduction in Parts and Machinery
Toronto Water achieved savings of $0.704 million associated with lower parts and machinery requirements in treatment facilities due to improved preventative maintenance programs and other continuous improvement initiatives. These savings were also identified as part of the 2012 Year End Operating Variance Report.
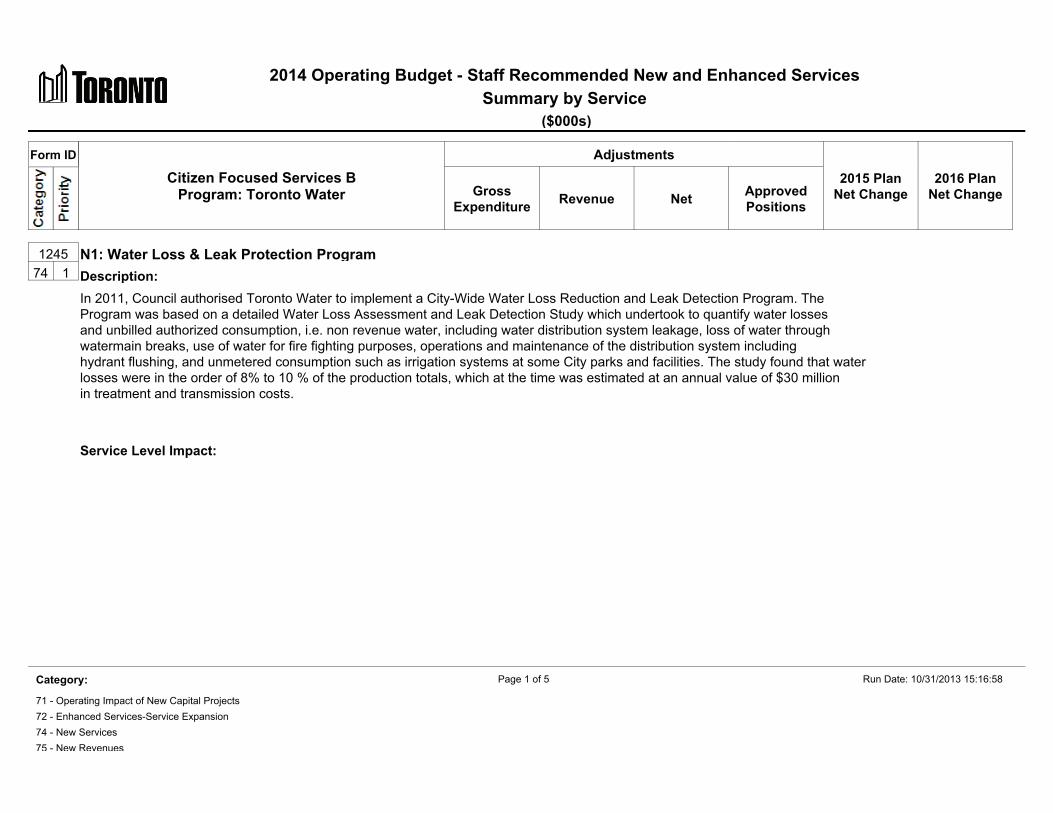
Recommended Enhanced Service Priorities Water Loss & Leak Detection Program ($0.427 million gross)
In 2011, Council authorized Toronto Water to implement a City-Wide Water Loss Reduction and Leak Detection Program. This Program was based on a detailed Water Loss Assessment and Leak Detection Study which undertook to quantify water losses and unbilled authorized consumption, i.e. non revenue water, including water distribution system leakage, loss of water through watermain breaks, use of water for fire fighting purposes, operations and maintenance of the distribution system including hydrant flushing, and unmetered consumption such as irrigation systems at some City parks and facilities. The study found that water losses were in the order of 8% to 10 % of production totals, which at the time was estimated at an annual value of $30 million in treatment and transmission costs.
It was estimated that implementation of a comprehensive water loss reduction and leak detection program could reduce a leakage by $15.8 million in treatment and transmission costs. For successful implementation of the Program, a dedicated team consisting of 6 permanent members was recommended. The implementation of this program was to be initiated in 2011 and that analysis be updated on an annual basis, to help gauge progress made in reducing leakage. The information would be reported through Toronto Water’s annual capital budget submissions. Due to budgetary pressures in 2012/2013, this Program was never initiated.
The 2014 Recommended Budget includes funding $0.427 million to establish a Water Loss Reduction and Leak Detection Team. This team will consist of a Project Lead, an Engineering Technician Technologist, 2 Water Maintenance Workers 1 and 2 Water Maintenance Workers 2. It will conduct further research by various pressure zones to determine opportunities for savings and confirm viability of any initial saving estimates. Estimated savings of $0.150 million in 2015 and $0.120 million in 2016 are anticipated to partially offset the cost of the team.
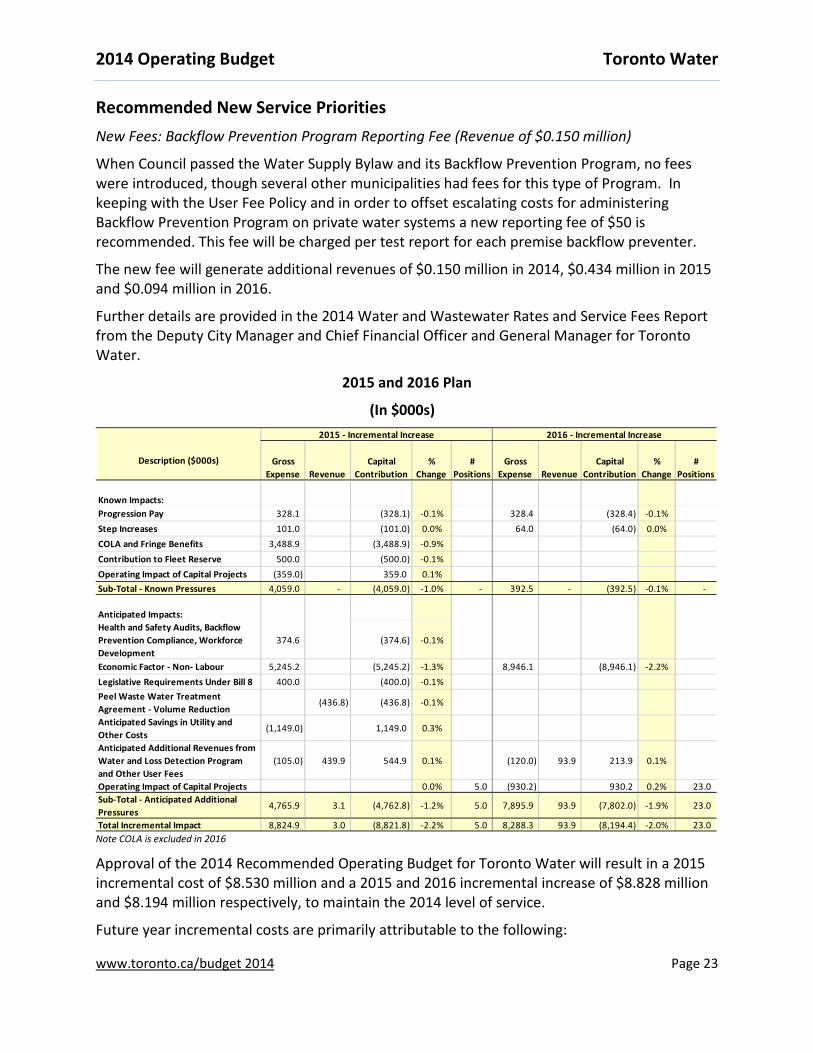
Recommended New Service Priorities New Fees: Backflow Prevention Program Reporting Fee (Revenue of $0.150 million)
When Council passed the Water Supply Bylaw and its Backflow Prevention Program, no fees were introduced, though several other municipalities had fees for this type of Program. In keeping with the User Fee Policy and in order to offset escalating costs for administering Backflow Prevention Program on private water systems a new reporting fee of $50 is recommended. This fee will be charged per test report for each premise backflow preventer.
The new fee will generate additional revenues of $0.150 million in 2014, $0.434 million in 2015 and $0.094 million in 2016.
Further details are provided in the 2014 Water and Wastewater Rates and Service Fees Report from the Deputy City Manager and Chief Financial Officer and General Manager for Toronto Water.
2015 and 2016 Plan
(In $000s)
Description ($000s) Gross Expense Revenue
Capital Contribution
% Change
# Positions
Gross Expense Revenue
Capital Contribution
% Change
# Positions
Known Impacts:Progression Pay 328.1 (328.1) -0.1% 328.4 (328.4) -0.1%Step Increases 101.0 (101.0) 0.0% 64.0 (64.0) 0.0%COLA and Fringe Benefits 3,488.9 (3,488.9) -0.9%Contribution to Fleet Reserve 500.0 (500.0) -0.1%Operating Impact of Capital Projects (359.0) 359.0 0.1%Sub-Total - Known Pressures 4,059.0 - (4,059.0) -1.0% - 392.5 - (392.5) -0.1% -
Anticipated Impacts:Health and Safety Audits, Backflow Prevention Compliance, Workforce Development
374.6 (374.6) -0.1%
Economic Factor - Non- Labour 5,245.2 (5,245.2) -1.3% 8,946.1 (8,946.1) -2.2%Legislative Requirements Under Bill 8 400.0 (400.0) -0.1%Peel Waste Water Treatment Agreement - Volume Reduction
(436.8) (436.8) -0.1%
Anticipated Savings in Utility and Other Costs
(1,149.0) 1,149.0 0.3%
Anticipated Additional Revenues from Water and Loss Detection Program and Other User Fees
(105.0) 439.9 544.9 0.1% (120.0) 93.9 213.9 0.1%
Operating Impact of Capital Projects 0.0% 5.0 (930.2) 930.2 0.2% 23.0 Sub-Total - Anticipated Additional Pressures
Approval of the 2014 Recommended Operating Budget for Toronto Water will result in a 2015 incremental cost of $8.530 million and a 2015 and 2016 incremental increase of $8.828 million and $8.194 million respectively, to maintain the 2014 level of service.
Future year incremental costs are primarily attributable to the following:
Step and progression pay increases of $0.429 million in 2015 and $0.393 million in 2016.
Salary increases for unionized and non-unionized employees $3.489 in 2015.
Increase in fleet reserve contribution of $0.500 million based on an updated vechicle replacement schedule in 2015.
2015 increased maintenance costs, arising from the completion of capital projects of $0.230 million will be partially offset by savings from the Humber Treatment Plant Co-Generation facility, resulting in a net operating cost reduction of $0.359 million.
An overal incremental impact of known pressures is estimated at $4.059 million in 2015 and $0.393 million in 2016.
Anticipated Impacts
Additional costs related to health and safety audits, backflow prevention compliance and workforce development program of $0.375 million in 2015.
2015additional costs related to legislative requirements under Bill 8 of $0.400 million.
Further decline in revenues from the treatment of wastewater originating from Region of Peel of $0.437 million, due to lower volumes anticipated in 2015.
Non-labour related inflationary pressures for materials and supplies, contracted services and other costs of $5.245 million in 2015 and $8.946 million in 2016.
Anticipated cost increases will be partially offset by anticipated savings in utility and other costs of $1.149 million, and net savings of $0.545 million from new/enhanced priorities implemented in 2014 resulting in a net increase of $4.763 million, or 1.2% over the 2014 Recommended Budget.
Anticipated cost increases will be partially offset by savings of $0.930 million in 2016 from the Automated Meter Reader Program currently under implementation, based on operational efficiencies and improved revenues due to more accurate readings and net savings of $0.545 million in 2015 and $0.214 million in 2016 from new/enhanced priorities recommended for 2014, these savings will be confirmed based on further analysis in 2015.
An overal incremental impact of anticipated pressures in estimated at $4.763 million in 2015 and $7.802 million in 2016..
V: ISSUES FOR DISCUSSION 2014 Issues 2014 Operating Budget Funding
Toronto Water is fully self-sustaining and does not rely on the municipal property tax levy for funding. Operating and capital investments are funded from revenues generated by water and sewage rates established each year by Council and included in the City’s By-law (Municipal Code, Chapter 849: Water and Sewage Services). Other sources of funding include revenue from the sale of water to York Region; industrial waste surcharges; private water agreements; service charges; and, sundry revenue.
Funding from water and wastewater surcharges provides financing for both the 2014 Operating Budget and the capital program set out in the 2014 Capital Budget and 2015-2023 Capital Plan, while maintaining relatively healthy Water and Wastewater Capital Reserve balances. It is important however, to note that this funding does not address any other unbudgeted pressures as outlined in the "Future Options and Public Attitudes for Paying for Water, Wastewater and Stormwater Infrastructure and Services" report from the Deputy City Manager and Chief Financial Officer and the General Manager, Toronto Water that was considered by the Executive Committee on October 30, 2013.
Incremental rate revenues from the 2014 Recommended Water and Wastewater Rate increase of 9% and other sources of funding will generate an additional $81.088 million (net of projected consumption decline in 2014). The increase in the 2014 Operating Budget gross expenditures of $8.530 million will decrease the 2014 Capital Contribution by the same amount, resulting in a net incremental revenue of $72.558 million that will be used to fund Toronto Water’s Capital Budget in 2014.
The following Chart shows the recommended rate increase impact on average residential, as well as commercial and industrial customers, based on their average consumption.
Chart 1 – 2014 Water Rate Impact
Additional details are available in the accompanying 2014 Water and Wastewater Rates and Service Fees report.
In addition to the water and waste water surcharges, Toronto Water receives revenues from various user fees. The approval of new user fees will be obtained concurrently with the 2014-2023 Capital Plan and 2014 Operating Budget, based on the recommendations presented in accompanying 2014 Water and Wastewater Rates and Service Fees report. The following section provides a brief description of estimated revenues. A breakdown of user fee changes is presented in Appendix6.
Increase to Existing User Fees
In accordance with Council's approved User Fee Policy inflationary factors that reflect service specific cost increases are applied in order to recover the full costs. As a result, the 2014 Recommended Operating Budget includes additional revenues of $0.296 million. Increases to the existing user fees are effective January 1, 2014. Inflationary increases to existing user fees are automatically applied.
Revenue from Transferred Fees
As a result of internal restructuring in the City of Toronto, the staff group conducting the review under the Transfer of Review Program was reassigned from Engineering and Construction Services (former Technical Services) to Toronto Water, effective February 6, 2013. Additional revenues of $0.278 million are anticipated from transferred fees and included in the 2014 Recommended Operating Budget.
Revenue from New Fees
Effective September 1, 2014, a new reporting fee supporting the cost of administering backflow prevention devices is recommended with an estimated revenue of $0.150 million included in the 2014 Recommended Operating Budget.
Effective July 1, 2014 two new fees associated with water consumers who do not allow access to their properties for the purpose of installing a new automated water meter and related meter reading equipment under the water meter program are recommended with more detail in the staff report "Update on the Water Meter Program" presented to Public Works and Infrastructure Committee meeting on October 21st.
Although implementation of the proposed changes to the City's fees and charges as described in this report could potentially result in an estimated increase in revenue of up to $10 million, it is expected that these fees will serve as an effective incentive to allow access for the purposes of having a new meter installed as required under Chapter 851, rather than generate additional revenues. In addition, any increase in revenue is intended to recover the City's costs in providing special meter reading services.
As a result, potential revenues from these additional fees are not included in the 2014 Recommended Operating Budget. Toronto Water will report on the actual revenues and corresponding costs as part of the corporate variance reporting in 2014.
Effective January 1, 2014, a new fee is recommended to recover the cost of lost or damaged automated reading transmitter. At this point, no data is available that would allow to estimate associated costs and revenues. Any financial impacts will be reported through corporate variance reporting in 2014.
Future Year Issues
Recent Regulations
The water and waste water industry continues to experience increased legislative and regulatory reform impacting both, operating and capital budgets. Key provincial regulations include:
Bill 195 (Safe Drinking Water Act) which expanded on existing policy and practice for water testing for the protection of human health and the prevention of drinking water health hazards. Regulations passed under the Act require municipalities to publish annual reports describing the operation of the water system and the results of testing required to ensure that residents are provided with safe drinking water.
Bill 43 (Clean Water Act) which provides protection for municipal drinking water supplies through developing collaborative; locally driven; science-based protection plans by municipalities; conservation authorities; and, the public.
The most recent federal regulations were enacted on July 18, 2012 under the Fisheries Act are the first federal regulations that specifically address municipal wastewater treatment plant effluents. The new federal Regulations impose operational, administrative, and financial burdens on the City due to additional regulatory requirements beyond those already imposed by the Ontario Ministry of the Environment (MOE).
With respect to wastewater treatment plants, the new federal Regulations impose:
Strict limits for final effluent quality, which were not previously regulated by the MOE, related to un-ionized ammonia, acute lethality testing, and total residual chlorine.
Methods for testing effluent quality.
Flow monitoring.
Record keeping.
Reporting.
The regulations also contain requirements for annual reporting of combined sewer overflow (CSO) discharges within the City.
Toronto Water has developed an action plan to address the new federal Fisheries Act Wastewater Systems Effluent Regulations by January 2015. The following describes resulting financial impact:
Increase in annual operating costs estimated at $1.3 million included in the 2014 Recommended Operating Budget:
Additional hydro costs to eliminate the effects of ammonia toxicity in the Ashbridges Bay Wastewater Treatment Plant effluent ($1.0 million per year).
Increased cost associated with the requisite wastewater treatment plant monitoring and reporting requirements to Toronto Water’s annual Operating Budget ($0.2 million per year).
Increased costs associated with the requisite combined sewer overflow reporting requirements ($0.1 million per year).
Capital Costs already included in Toronto Water's 2013-2022 Recommended Capital Budget and Plan:
Design and construction of a new effluent disinfection system at the Ashbridges Bay Wastewater Treatment Plant estimated at $205.4 million.
Development of a hydrologic/hydraulic computer simulation model to provide for the annual reporting of combined sewer overflow discharges within the City’s combined sewer system estimated at $0.400 million.
Increased requirements and frequent changes in legislation represent a significant challenge for Toronto Water in terms of planning and allocating appropriate staff resources to maintain legislative compliance.
Other Operating Cost Pressures
One of the main challenges facing Toronto Water in future years will be the management of the continuously increasing costs from both, internal and external sources. Personnel costs and inflationary pressures related to costs for materials and supplies, electricity, chemicals and parts, as well as machinery and services are ongoing.
For example, in 2014 alone, operating impacts of previously completed capital projects amount to $4.620 million, while salary and non-salary inflationary increases approximate $8.710 million. Further increases of $8.734 million and $8.946 million are anticipated for 2015 and 2016 respectively.
Impact of Lower Water Consumption Forecasts on Water and Wastewater Rate Revenues
Beginning in 2006 Toronto Water implemented a planned multi-year Water and Wastewater annual rate increase of 9% for 9 years, with the final 9% rate increase planned for the year 2014.
The annual multi-year rate increase strategy was planned to generate revenues required to fund Toronto Water's operations and its capital program, balancing infrastructure renewal needs for state of good repair with new service improvement projects requiring funding to increase system capacity to keep pace with population growth, while ensuring the delivery of water supply and wastewater treatment within an increasingly stringent regulatory framework.
Despite the increase in population, the additional revenues to be generated by an annual 9% rate increase have been reduced by the steady decline in water consumption predominantly attributed to water efficiency measures and economic factors as shown in Chart 2 below.
Chart 2 – Toronto Retail Water Consumption
424
375
407
374 353
200
250
300
350
400
450
1980 1985 1990 1995 2000 2005 2010
Population and Water Consumption
Retail Consumption, million m3 Population, 10,000s
2013 Projected -3342014 Projected - 331
2.289M2.524M 2.611M
2.82M
2.215M
334
Over the last 7 years there was a decline in base water consumption (October to April) of
2.1% annually on average. Summer consumption also shows a reduction over the same period of 1.7% annually. Toronto's water consumption projected to 2013 year-end is estimated at 334 million cubic meters which represents a substantial drop from 374 million cubic metres in 2005.
In 2012, as a result of lowered consumption forecasts, projecting a $686.8 million reduction in revenues over the 10-year planning period, Toronto Water's 2012 – 2021 Capital Plan was reduced by $1.132 billion.
A further decline of 1% (compared to 2012 actuals) in water consumption is projected for 2014. While this does indicate that the decline in water consumption is beginning to level off, it does continue to further lower revenues available to fund the capital program.
Additional detail on historical and forecasted water consumption and production, as well as its impact on the Toronto Water Capital Reserve is available in the accompanying 2014 Water and Wastewater Rates and Service Fees report.
Resulting Capital Program Funding Pressures
While Toronto Water’s Capital Program continues to be 100% self sustaining, largely through water revenues (with no debenture financing and no impact on the municipal property tax levy), declining water consumption trends have placed significant pressure on the long term capital program as outlined above.
Concurrently with deferring $1.132 billion in capital work in the 2012-2021 Capital Plan, there is an estimated $717 million in project funding required to address unbudgeted projects, while at the same time, public pressure is increasing to reinstate funding that was deferred for programs such as basement flooding protection and combined sewer overflow control projects, resulting in a number of competing priorities and significant funding pressures for Toronto Water.
A report from the Deputy City Manager and Chief Financial Officer and the General Manager, Toronto Water, titled "Future Options and Public Attitudes for Paying for Water, Wastewater and Stormwater Infrastructure and Services" was considered by the Executive Committee on October 30, 2013. It is recommended that the Deputy City Manager and Chief Financial Officer, and General Manager Toronto Water report back to the Executive Committee, as part of Toronto Water's 2015 Capital Submission, with a recommended financing strategy to support Toronto Water's long term Capital Plan along with a detailed implementation plan.
Service Efficiency Study Implementation – Status Update At its meeting of September 26, 2011 Council approved the report entitled, EX10.1 Core
Service Review – Final Report to Executive Committee, and requested the City Manager to review the remaining efficiency related opportunities as set out in Appendix E– KPMG Opportunities Related to Service Efficiencies, to determine whether and in what manner implementation is appropriate through the 2012, 2013 and 2014 Operating Budget
Item #113 in Appendix E directed Toronto Water to continue implementing the final elements of Works Best Practices Program (WBPP) and District Services Improvement Program (DSIP) restructuring to ensure additional efficiencies are obtained.
The 2012 and 2013 Operating Budget for Toronto Water included efficiency savings of $1.951 million and $0.254 million respectively, that can be achieved without impacting service levels following the implementation of the final elements of the WBPP and DSIP. In 2014, Toronto Water continues to identify savings from the final implementation of the WBPP and DSIP and the 2014 Recommended Operating Budget includes further savings of $0.187 million resulting from repurposing of staff positions to improve customer services.
Issues Referred to the 2014 Operating Budget Process Standing Committee Service Level Review Impacts
At its meeting on September 2013, the Public Works and Infrastructure Committee referred the following motion to the Budget Committee, the City Manager and the Deputy City Manager and Chief Financial Officer for consideration as part of the 2014 Budget process:
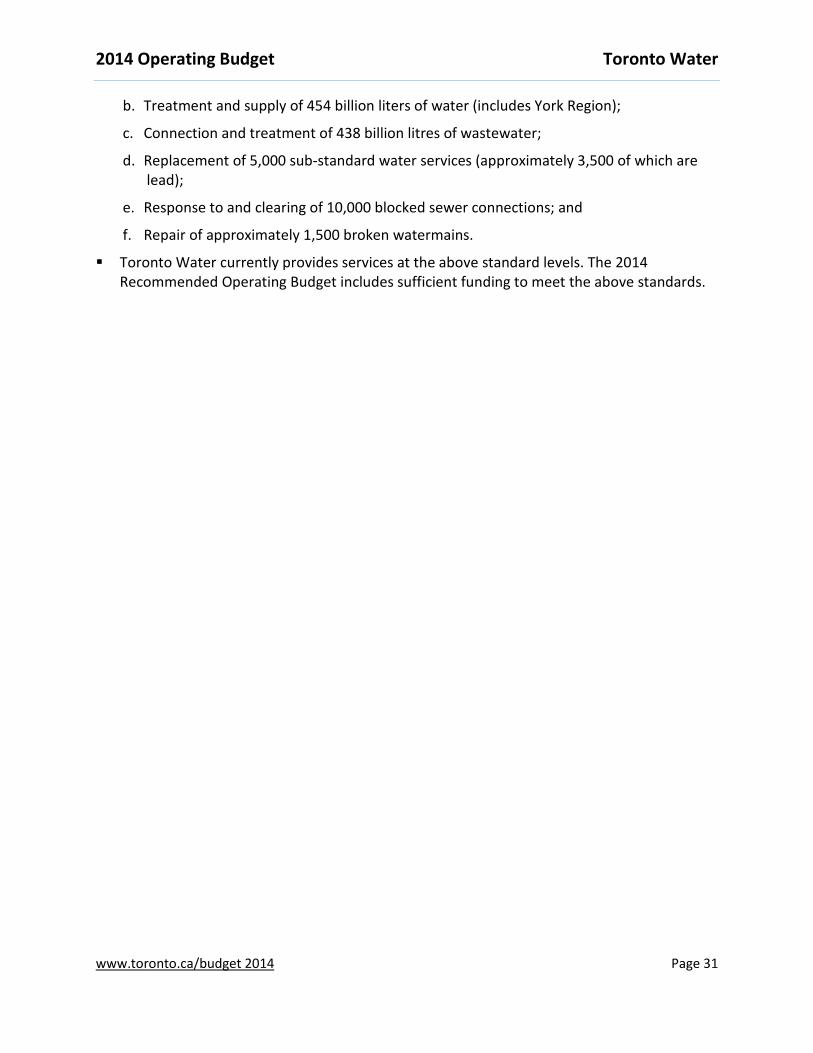
City Council direct that the following service standards be included in the 2014 Service Standards for Toronto Water, and direct the Deputy City Manager and Chief Financial Officer to include the necessary resources in the 2014 recommended budget:
a. 2 year cycle of catch basin cleaning for local streets and 1 year for arterial roads;
b. Treatment and supply of 454 billion liters of water (includes York Region);
c. Connection and treatment of 438 billion litres of wastewater;
d. Replacement of 5,000 sub-standard water services (approximately 3,500 of which are lead);
e. Response to and clearing of 10,000 blocked sewer connections; and
f. Repair of approximately 1,500 broken watermains.
Toronto Water currently provides services at the above standard levels. The 2014 Recommended Operating Budget includes sufficient funding to meet the above standards.
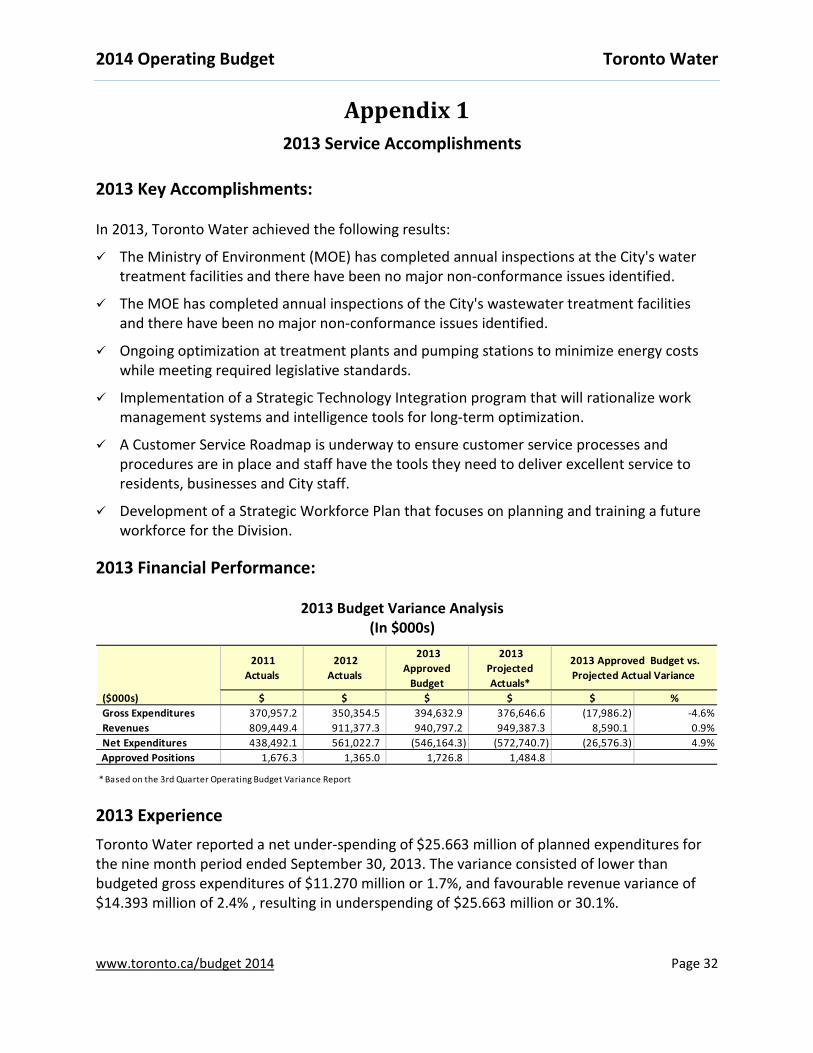
In 2013, Toronto Water achieved the following results:
The Ministry of Environment (MOE) has completed annual inspections at the City's water treatment facilities and there have been no major non-conformance issues identified.
The MOE has completed annual inspections of the City's wastewater treatment facilities and there have been no major non-conformance issues identified.
Ongoing optimization at treatment plants and pumping stations to minimize energy costs while meeting required legislative standards.
Implementation of a Strategic Technology Integration program that will rationalize work management systems and intelligence tools for long-term optimization.
A Customer Service Roadmap is underway to ensure customer service processes and procedures are in place and staff have the tools they need to deliver excellent service to residents, businesses and City staff.
Development of a Strategic Workforce Plan that focuses on planning and training a future workforce for the Division.
2013 Approved Budget vs. Projected Actual Variance
* Based on the 3rd Quarter Operating Budget Variance Report
2013 Experience Toronto Water reported a net under-spending of $25.663 million of planned expenditures for the nine month period ended September 30, 2013. The variance consisted of lower than budgeted gross expenditures of $11.270 million or 1.7%, and favourable revenue variance of $14.393 million of 2.4% , resulting in underspending of $25.663 million or 30.1%.
Lower that budgeted gross expenditures were mainly due to $8.124 million in salary and benefit savings arising from vacancies that have not been filled, and $1.646 million in lower costs of chemicals.
A reported favourable revenue variance of $14.393 million was predominantly related to a lower drop in residential consumptions than originally forecasted (1% decrease compared to budgeted decrease of 3.3%), resulting in $11.228 million higher revenues; higher revenue from of industrial waste and private water agreements of $1.206 million due to higher volume; and higher than expected recoveries from new water and wastewater service connections of $5.236 million. The overachieved revenues were partially offset by lower consumption from the Region of York of $3.277 million.
Toronto Water is projecting a year-end net variance of $26.576 million or 1.9% under the 2013 Approved Net Operating Budget. Expenditure savings of $17.986 are projected, primarily due to savings in salaries and benefits ($12.119 million), water treatment and production efficiencies ($3.000 million), and lower costs of chemicals ($2.400 million).
Revenues are forecasted to be 0.9% or $8.590 million higher than expected due to higher than expected volumes for the sale of water (5.522 million, higher number of waste agreements ($1.968 million); and additional recoveries such as hydro rebate incentives ($1.100 million).
The contribution to capital is projected to be $26.576 million or 5.0% above plan, due to a combination of the above factors, resulting in gross expenditure savings and higher revenues than originally anticipated.
Impact of 2013 Operating Variance on the 2014 Recommended Budget Savings of $6.726 million from optimization efficiencies ($3.845 million), preventative
maintenance ($0.704 million) and salaries and benefits ($2.178 million) are included in the 2014 Recommended Operating Budget
As decline of water consumption in 2013 was not as high as anticipated, a decline of 1.5% previously forecasted for 2014 and 2015 (2013 Water and Wastewater Rate Model) was revised to 1% (compared to 2012 actuals) and taken into account in developing the current and future year consumption projections in the 2014 Water and Wastewater Rate Model.
Salaries and benefits are the largest expenditure category and account for 41% of the total expenditures (excluding capital contributions), followed by materials and supplies at 24%, services and rents at 12%, and interdivisional charges at 16%. The remaining 7% represents all other costs, including equipment and contribution to reserve funds.
Revenues are derived mostly from the sale of water and waste water surcharges which constitute 94% of the total, with the remaining 6% of revenues comes from a variety of sources such as industrial waste surcharges, private water agreements, and service charges.
Over the last three years (2011-2013), Toronto Water's salary and benefit costs have increased by 2.3%. Salary and benefit costs account for $163.318 million or 41% of the 2014 Recommended Operating Budget.
Salary and benefit costs have historically increased with contractually obligated wage increases, increased benefit costs and step and progression pay increases.
These expenses continue to impact the Program's budget in 2014 requiring additional funding of $2.009 million or a 1.3% increase from 2014 budgeted salaries and benefits, mainly for step and progression pay and increases arising from negotiated settlements with unionized employees and approved inflationary adjustments for non unionized staff.
The increases in salary and benefit costs in 2014 of $2.935 million were partially offset through savings realized from a detailed review of salaries and benefits based on actual expenses ($2.178 million).
The remaining net increase in salaries and benefits for 2014 is mostly attributable to the addition of 6 new positions required to establish the Water Loss and Leak Detection Team ($0.502 million).
Toronto Water projects significant savings in salaries and benefits in 2013, due to a large number of vacant positions. Under-spending of salary and benefit budget assisted Toronto Water in mitigating the impact of lower water consumption experienced in previous years. Through its work force development program, Toronto Water continues to address issues of unfilled positions and reduce any adverse impact on its operational requirements.
Inflationary increases in materials, chemicals and utility costs are continuing to result in significant increases in material and supplies expenses. These costs, which represent $94.631 million or 24.0% of Toronto Water's gross expenditures, less capital contributions, increased by 4.5% since 2011 and are budgeted to further increase by 0.1% or $0.078 million in 2014.
2014 inflationary increases in materials and supplies of $4.637 million are predominately driven by anticipated increases in electricity and other utility costs of $3.436 million, materials and supplies such as chlorine and various other chemicals of $1.201 million, and contracted services of $1.083 million.
Federal wastewater regulation requirements resulting in an additional cost of $1.0 million for materials and supplies.
Previously completed capital projects resulted in increased operating costs of $3.449 million for additional corrosion and odour control materials and supplies, mostly for water treatment plants, the FJ Horgan treatment plant in particular.
Inflationary increases in material and supplies have been almost fully offset by process efficiency savings and line by line expenditure reductions.
Costs of various professional services and rents decreased by 5.3% over the 2011-2013 period, mostly as a result of budget reductions implemented in 2012. The 2014 Recommended Operating Budget of $48.844 million is $5.745 million or 13.3% higher than the 2012 Approved Budget primarily due to:
Higher costs associated with the operation of the cake and pellet haulage management from the biosolids process ($1.680 million), federal wastewater regulation requirements ($0.300 million), and environmental health and safety audits ($0.300 million), storm water facilities cleaning ($0.360 million) and other base pressures.
An increase in the Contribution to Reserves of $0.700 million or 9.2% is due to an increase in fleet requirements, based on a recently updated vehicle replacement schedule.
Decreases to City-wide Interdivisional Charges (IDCs) of $1.003 million are mostly due to lower disposal cost at Green Lane Landfill.
Over the past several years, as a result of reduced water consumption levels, Toronto Water's actual annual revenues have not increased in direct proportion with the 9% approved annual rate increase.
Actual revenues, excluding transfers from the Capital Budget, have increased by 7.4% in 2010, 5.9% in 2011, 8.3% in 2012, and 5.0% is projected in 2013. An overall revenue increase of 8.6% is projected for 2014.
The 2014 Water and Wastewater 8.6% service rate increase is anticipated to generate the following additional revenue:
$83.810 million from the sale of water within the City of Toronto, representing a revenue increase of 9.6%. It should be noted that although water consumption continued to decline in 2013, that decline was not as large was anticipated. Therefore, although water consumption in 2014 was projected at 1% below 2012 actuals, the forecasted decline for 2014 resulted in water revenues that are slightly higher than 2013 approved sale of water revenues. This revenue increase is also partially attributable to additional water revenues resulting from conversions to automated meter readers;
$0.574 million increase in user fees due to inflationary increases to existing user fees ($0.296 million) and revenues from user fees transferred from Engineering and Construction Services ($0.278 million);
Increased revenues from the industrial waste surcharge program ($1.395 million); and
$0.180 million from other revenues such as sales of water to Enwave.
The above increase in revenues was partially offset by reduced revenues from the sale of water to the Region of York of $5.246 million, representing a 24% decrease from the 2013 approved sale of water revenues to the Region of York.
Approval of the 2014 Recommended Operating Budget for Toronto Water will result in an increase of 6 permanent positions in order to establish the Water Loss and Leak Detection Team. The total staff complement will increase from 1,726.8 to 1,732.8.
312,924.4 931,646.7 1,550,369.0 2,169,091.3 Other program / Agency Net Withdrawals & ContributionsBalance at Year-End 312,924.4 931,646.7 1,550,369.0 2,169,091.3
Total Reserve / Reserve Fund Draws / Contributions
Industrial Waste Surcharge and / or Sanitary Discharge Agreement or Permit where the total fees for one year or lesser term are $ 500 or less calculated in accord 1 & 2 above Wastewater
Full Cost Recovery $500.00
Possible increase: pending October report 34 -$
To install new residential sanitary sewer service connection in road allowance Wastewater
Full Cost Recovery $7,293.00 $7,455.00 800 129,600.00$
To install new residential storm sewer service connection in road allowance Wastewater
Full Cost Recovery $7,293.00 $7,455.00 15 2,430.00$
To disconnect residential sanitary sewer service connection in road allowance Wastewater
Full Cost Recovery $765.00 $782.00 800 13,600.00$
Inspection fee for the reuse of residential City sewer connection up to 150 mm in diameter Wastewater
Full Cost Recovery $510.00 $521.00 150 1,650.00$
Technical Review by Toronto Water staff -Application to Toronto Water for exemption to permit the construction of a driveway sloped downwards towards a residential building. Wastewater
Full Cost Recovery $1,527.00 $1,560 12 (11,820.00)$
Technical Review by Toronto Water staff -Application to Toronto Water for new connection or relocation of storm, sanitary or water supply connection Wastewater
Full Cost Recovery
$305 minimum fee; additional $75.5/hr for each hour after 4 hrs to a mximum of $1,527
$312 minimum fee, additional $77/hr for each hour after 4 hrs to a maximum of $1,560 8 (10,425.00)$
Technical Review by Toronto Water staff -Application to Toronto Water for request to encroach within a City permanent or temporary easement (related to City water and sewer infrastructure) Wastewater
Full Cost Recovery
$305 minimum fee; additional $75.5/hr for each hour after 4 hrs to a mximum of $1,527
$312 minimum fee, additional $77/hr for each hour after 4 hrs to a maximum of $1,560 2 (2,988.00)$
Technical Review by Toronto Water staff -Application to Toronto Water for request to release from title a City easement (related to City water and sewer infrastructure) Wastewater
Full Cost Recovery
$305 minimum fee; additional $75.5/hour for each hour after 4 hours to a maximum fee of $1,527
$312 minimum fee, additional $77/hr for each hour after 4 hrs to a maximum of $1,560 2 (1,461.00)$
Install ing 19 mm New Residential Water Service and Meter Water Service Full Cost Recovery $2,700.00 $2,760.00 200 $12,000.00Install ing 25 mm New Residential Water Service and Meter Water Service Full Cost Recovery $3,111.00 $3,180.00 1000 $69,000.00Disconnection Fee for any residential water service less than or equal to 25 mm Water Service Full Cost Recovery $440.00 $450.00 1,200 $12,000.00Fire hydrant Permit Water Service Full Cost Recovery $152.70 $156.00 500 $47,460.00Water meter accuracy test ; Meter less than or equal to 50mm -No Chamber -applied if meter does not over-register Water Service Full Cost Recovery $152.70 $156.00 260 $858.00Water turn off fee for demolition; (disconnection of old water service not included) Water Service Full Cost Recovery $76.35 $78.00 2000 $3,300.00Water Turn-off or Turn-on Water Service Full Cost Recovery $76.35 $78.00 7,800 $12,870.00Single Service call Turn-off and Turn-on within 30 min Water Service Full Cost Recovery $76.35 $78.00 50 (5,262.00)$ Conduct fire hydrant flow test Water Service Full Cost Recovery $254.50 $260.00 300 $1,650.00Unregistered water each day order not complied Water Service Full Cost Recovery $50.90 $52.00Annual Seasonal Meter Activation Fee : includes replacement, removal of water meter; 1 turn on, 1 turn off Water Service Full Cost Recovery $30.54 $200.00 300Reuse of residential water service 19 mm to 25 mm Water Service Full Cost Recovery $254.50 $260.00Administrative fee to reflect a change in ownership on an existing util ity account Water Service Full Cost Recovery $35.00 $35.70 Water Certification Charge Water Service Full Cost Recovery $25.00 $25.50 Water Special/Final Reading Water Service Full Cost Recovery $15.00 $15.30 Water Consumption Statements Water Service Full Cost Recovery $40.00 $40.80Water Consumption Statements Water Service Full Cost Recovery $25.00 $25.50Returned Cheques Water Service Full Cost Recovery $35.00 $35.70Water Collection Field Visit Water Service Full Cost Recovery $25.00 $25.50 $22,000.00Administration of MOE Municipal Drinking Water Licensing Program Water Service Full Cost Recovery 2,300.00 $2,350.80 68 $3,454.40
Manual water meter reading fee for customers with meters not allowing access to their property to install a new automatic meter Water Service Full Cost Recovery $80.00
12,000 accounts – 3 times a year
$2.9M ($1.5M in 2014)
Flat rate legacy fee for residential flat rate customers not allowing installation of automatic meters on their property Water Service Full Cost Recovery $1,020.00
7,000 flat rate accounts
$7.1M ($3.5M in 2014)
Automated Meter Reading Water Service Full Cost Recovery
$75 per each lost or damaged meter reading transmitter 500 $ 37,500.00
Reporting fee for processing and other administration for the water supply backflow prevention program Water Service Full Cost Recovery
$50 per test report for each premise backflow preventer
11275 (3,000 in 2014)
$56,3750 ($150,000 in 2014)
2014
Rate Description Service Fee Category
Recommended User Fee Transfers
Rate Description Fee Category
2013 Approved
Rate
2014 Budget
Rate Transfer from Transfer ToRecord Search for sewer use by-law compliance violation Full Cost Recovery $50.00 $50.00
Engineering & Construction Services Toronto Water
To review new sewer engineering designs Full Cost Recovery $1,100.00 $1,100.00
Engineering & Construction Services Toronto Water
Review of applications for establishing or alteration of City of Toronto Drinking Water system Full Cost Recovery $2,300.00 $2,300.00
Engineering & Construction Services Toronto Water
To Review application for sewer and watermain design Full Cost Recovery $800.00 $800.00
Engineering & Construction Services Toronto Water
The review of storm and sanitary pump station, forcemains, and sanitary sewage detention chambers or oversized sewers Full Cost Recovery $2,000.00 $2,000.00
Engineering & Construction Services Toronto Water
The review of facil ities for attenuating stormwater runoff peak flow rate or volume or for managing stormwater runoff quality such as underground chambers, oversized sewers, and oil, grit and silt separators Full Cost Recovery $2,200.00 $2,200.00