25
Slide 1 Copyright © 2015 Edward D. Jones & Co., L.P. All rights reserved. www.edwardjones.com Member SIPC Edward Jones Advisory Solutions ® Market Commentary
| Date post: | 14-Jul-2015 |
| Category: |
Economy & Finance |
| Upload: | allen-parker-cfp- |
| View: | 308 times |
| Download: | 5 times |

Slide 1
Copyright © 2015 Edward D. Jones & Co., L.P. All rights reserved.
www.edwardjones.com Member SIPC
Edward Jones Advisory Solutions® Market Commentary

Key Steps to Financial Success
EXP 30 APR 2015 MKD-6687N-A Slide 2
®

Asset allocation Investment selection Rebalancing
Value Proposition
Slide 3 EXP 30 APR 2015 MKD-6687N-A

Investor Returns vs. Benchmarks over 20 Years
Source: "Quantitative Analysis of Investor Behavior, 2014,” DALBAR, Inc. Annualized return for the past 20 years ending 12/31/2013. The Equity benchmark is represented by the S&P 500. The Fixed Income Benchmark is represented by the Barclays Aggregate Bond Index. Returns do not subtract commissions or fees. This study was conducted by an independent third party, DALBAR, Inc. A research firm specializing in financial services, DALBAR is not associated with Edward Jones. Individuals cannot invest directly in any index. Past performance is no guarantee of future results.
Slide 4 EXP 30 APR 2015 MKD-6687N-A
Performance Drivers
Asset allocation
Style allocation
Fund selection
Slide 5 EXP 30 APR 2015 MKD-6687N-A

Slide 6
Market Summary
Diversification didn't work as advertised during 2014
– Large Cap U.S. Stocks outperformed most other asset classes, with the exception of Real Estate (REITs)
– International stocks dramatically underperformed
– Small Cap and Mid Cap U.S. stocks also underperformed
– Commodities and Emerging Markets both had negative returns
– 2014 felt a lot like 2011 all over again
– All Asset Allocation mutual funds struggled against this performance headwind
EXP 30 APR 2015 MKD-6687N-A

Diversification does not guarantee a profit or protect against losses.
Diversified Portfolios Underperformed U.S.-centric
Source: Morningstar Direct, Edward Jones calculations. Past performance does not guarantee future results. An index is not managed and is unavailable for direct investment. Performance does not include payment of any expenses, fees or sales charges, which would lower the performance results. Returns include dividend reinvestments. The prices of small-cap stocks are generally more volatile than those of large company stocks. There are special risks inherent with international investing, including currency fluctuations and political, social and economic risks. U.S. Large Cap stocks represented by the S&P 500. International stocks are represented by the MSCI EAFE. The globally diversified moderate allocation comprises the following indexes and weights: S&P 500 (31%), Barclays Aggregate Bond (25%), MSCI EAFE (21%), Russell Mid Cap (7%), Barclays Global Aggregate ex-USD (4%), Barclays High Yield 2% Issuer Cap (4%), Russell 2000 (4%), Barclays U.S. Treasury Bill 1-3 Month (2%), and MSCI ACWI Ex USA SMID (2%).
Less Diversified More Diversified
EXP 30 APR 2015 MKD-6687N-A

Then Why Diversify? Because Leaders Rotate
Slide 8 EXP 30 APR 2015 MKD-6687N-A
2010 2011 2012 2013 2014 Q4 2014 10 Yr. Return 10 Yr. Volatility
REITs28.5%
REITs8.7%
Emerging Mkts18.2%
Small Cap Stocks38.8%
REITs30.4%
REITs14.3%
Emerging Mkts8.4%
REITs25.9%
Small Cap Stocks26.9%
U.S. Bonds7.8%
REITs17.8%
S&P 50032.4%
S&P 50013.7%
Small Cap Stocks9.7%
REITs8.3%
Emerging Mkts23.7%
Emerging Mkts18.9%
High Yield5.0%
Intl. Stocks17.3%
Intl. Stocks22.8%
Balanced Toward Growth
7.9%
S&P 5004.9%
Small Cap Stocks7.8%
Small Cap Stocks19.8%
Commodities16.8%
S&P 5002.1%
Small Cap Stocks16.4%
Balanced Toward Growth17.9%
U.S. Bonds 6.0%
Balanced Toward Growth
2.5%
High Yield7.7%
Intl. Stocks18.2%
S&P 50015.1%
Balanced Toward Growth
2.0%
S&P 50016.0%
High Yield7.4%
Small Cap Stocks4.9%
U.S. Bonds 1.8%
S&P 5007.7%
Commodities18.2%
High Yield14.9%
Cash0.07%
High Yield15.8%
REITs2.5%
High Yield2.5%
Cash0.0%
Balanced Toward Growth
6.4%
S&P 50014.7%
Balanced Toward Growth11.4%
Small Cap Stocks-4.2%
Balanced Toward Growth12.2%
Cash0.0%
Cash0.0%
High Yield-1.0%
U.S. Bonds4.7%
High Yield10.3%
Intl. Stocks7.8%
Intl. Stocks-12.1%
U.S. Bonds4.2%
U.S. Bonds -2.0%
Emerging Mkts-2.2%
Intl. Stocks-3.6%
Intl. Stocks4.4%
Balanced Toward Growth10.0%
U.S. Bonds6.5%
Commodities -13.3%
Cash 0.1%
Emerging Mkts-2.6%
Intl. Stocks-4.9%
Emerging Mkts-4.5%
Cash1.5%
U.S. Bonds3.2%
Cash0.1%
Emerging Mkts-18.4%
Commodities-1.1%
Commodities-9.5%
Commodities -17.0%
Commodities -12.1%
Commodities -1.9%
Cash0.6%

Then Why Diversify? Because Leaders Rotate
Slide 9 EXP 30 APR 2015 MKD-6687N-A
2002 2003 2004 2005 2006 2007 2008 2009
Commodities 25.9%
Emerging Mkts 55.8%
REITs 31.5%
Emerging Mkts 34.0%
REITs35.9%
Emerging Mkts39.4%
U.S. Bonds5.2%
Emerging Mkts78.5%
U.S. Bonds 10.3%
Small Cap Stocks 47.3%
Emerging Mkts 25.6%
Commodities 21.4%
Emerging Mkts32.2%
Commodities16.2%
Cash1.8%
High Yield58.8%
REITs 3.6%
Intl. Stocks 38.6%
Intl. Stocks 20.3%
Intl. Stocks 13.5%
Intl. Stocks26.3%
Intl. Stocks11.2%
Balanced Toward Growth-25.2%
Intl. Stocks31.8%
Cash 1.7%
REITs 36.7%
Small Cap Stocks 18.4%
REITs 12.1%
Small Cap Stocks18.5%
Balanced Toward Growth
7.1%
High Yield-25.9%
REITs28.6%
High Yield-0.2%
High Yield28.8%
High Yield11.1%
Balanced Toward Growth
5.5%
S&P 50015.8%
U.S. Bonds7.0%
Small Cap Stocks-33.8%
Small Cap Stocks27.2%
Emerging Mkts -6.2%
S&P 500 28.7%
S&P 500 10.9%
S&P 500 4.9%
Balanced Toward Growth13.3%
S&P 5005.5%
Commodities-35.7%
S&P 50026.5%
Balanced Toward Growth -10.3%
Commodities 23.9%
Balanced Toward Growth 10.1%
Small Cap Stocks 4.6%
High Yield10.8%
Cash4.8%
S&P 500-37.0%
Balanced Toward Growth 20.3%
Intl. Stocks -15.9%
Balanced Toward Growth 21.2%
Commodities 9.2%
Cash 3.0%
Cash4.8%
High Yield2.3%
REITs-38.0%
Commodities18.9%
Small Cap Stocks -20.5%
U.S. Bonds 4.1%
U.S. Bonds 4.3%
High Yield2.8%
U.S. Bonds4.3%
Small Cap Stocks-1.6%
Intl. Stocks-43.1%
U.S. Bonds5.9%
S&P 500 -22.1%
Cash 1.0%
Cash 1.2%
U.S. Bonds 2.4%
Commodities2.1%
REITs-16.8%
Emerging Mkts-53.3%
Cash0.2%

Then Why Diversify? Because Leaders Rotate Returns and Volatility of Key Indices through Q4 2014 Ranked in Order of Performance (Best to Worst)
Slide 10
The S&P 500 Stocks are represented by the S&P 500 Index, which is widely regarded as the best single gauge of the performance of the large cap U.S. equity universe.
U.S. Bonds are represented by the Barclays Aggregate Bond Index, which measures the performance of U.S. investment-grade, fixed-rate taxable bonds.
Small Cap Stocks are represented by the Russell 2000 Index, which measures the performance of the small-cap segment of the U.S. equity universe.
High Yield is represented by the Barclays U.S. High Yield 2% Issuer Cap Index, which measures the performance of the U.S. high yield bond market.
International Stocks are represented by the MSCI EAFE Index, which measures the performance of developed international equity markets excluding the U.S. and Canada
Commodities are represented by the Dow Jones-UBS Commodities Index, which measures the performance of commodities traded on U.S. exchanges.
Emerging Market Stocks are represented by the MSCI Emerging Markets Index, which measures the performance of emerging international equity markets.
Cash is represented by the Barclays Capital 1-3 Month Treasury Bill Index (formerly Lehman Brothers Short Treasury 1-3 Months Index), which is used as a general measure for money market instruments
Balanced Toward Growth is represented by a 49% S&P 500, 16% MSCI EAFE, and 35% BarCap Aggregate Bond blended benchmark
REITs are represented by the MSCI U.S. Reit Index, which measures the performance of U.S. equity Real Estate Investment Trusts (REITs).
Source: Morningstar Direct. Past performance does not guarantee future results. An index is not managed and is unavailable for direct investment. Performance does not include payment of any expenses, fees or sales charges, which would lower the performance results. Returns include dividend reinvestment. The prices of small-cap stocks are generally more volatile than large company stocks. There are special risks inherent in International investing, including currency fluctuations and political, social and economic risks.
EXP 30 APR 2015 MKD-6687N-A

S&P 500 delivered third year of double-digit gains
Slide 11
Market Summary
Source: Morningstar Direct, Edward Jones estimates.
Q4 2014
2014: Up 13.7%
EXP 30 APR 2015 MKD-6687N-A

As the economic recovery continues to propel U.S. stocks.
Slide 12
Market Summary
Source: Morningstar Direct, Edward Jones estimates. EXP 30 APR 2015 MKD-6687N-A

Diversification didn't work in 2014 as International stocks lagged…
Slide 13
Market Summary
Source: Morningstar Direct, Edward Jones estimates. EXP 30 APR 2015 MKD-6687N-A

With International underperforming the U.S. by 19% in 2014…
Slide 14
Market Summary
Source: Morningstar Direct, Edward Jones estimates.
International Underperforming
International Outperforming
EXP 30 APR 2015 MKD-6687N-A

And Small Cap underperforming Large by 9% in 2014.
EXP 30 APR 2015 MKD-6687N-A Slide 15
Market Summary
Source: Morningstar Direct, Edward Jones estimates.
Small Cap Outperforming
Small Cap Underperforming

Slide 16
Economic and Market Summary
Performance Driver Detail Review for 2014
– Asset Allocation Effect: Negative – Magnitude: Significant – Driven primarily by weakness in small-cap, mid-cap, and international
stocks relative to strong performance of U.S. large-cap stocks
– Style Allocation Effect: Negative – Magnitude: Moderate – Driven by growth stocks outperforming value stocks globally
– Fund Selection Effect: Negative
– Magnitude: Varies by model – Advisory Solutions Program List Investments typically performed well.
However, indexes and passive investment strategies outperformed most active money managers in several key asset classes.
EXP 30 APR 2015 MKD-6687N-A

Slide 17 Diversification does not guarantee a profit or protect against loss..
Diversification and Asset Allocation
Asset Classes 0%
U.S. large-cap Stocks
49% U.S. Bonds
35%
Int'l large-cap Stocks
16%
Balanced toward Growth Simple Allocation
U.S. large-cap Stocks
27%
U.S. mid-cap 5%
U.S. small-cap 4%
Real Estate 3% Natural
Resources 3%
Cash 2%
U.S. Investment
Grade Bonds 25%
U.S. High Yield 4%
Int'l Bonds 4%
Int'l large-cap 13%
Emerging Markets
3% Int'l large-cap
overweight 7%
Balanced toward Growth Granular Allocation
EXP 30 APR 2015 MKD-6687N-A

Slide 18 Diversification does not guarantee a profit or protect against loss..
Diversification and Asset Allocation
Asset Classes 0%
U.S. large-cap Stocks
49% U.S. Bonds
35%
Int'l large-cap Stocks
16%
Balanced toward Growth Simple Allocation
U.S. large-cap Stocks
27%
U.S. mid-cap 5%
U.S. small-cap 4%
Real Estate 3% Natural
Resources 3%
Cash 2%
U.S. Investment
Grade Bonds 25%
U.S. High Yield 4%
Int'l Bonds 4%
Int'l large-cap 13%
Emerging Markets
3%
Int'l large-cap overweight
7%
Balanced toward Growth Granular Allocation
EXP 30 APR 2015 MKD-6687N-A

Slide 19
Diversification does not guarantee a profit or protect against losses. Diversification does not guarantee a profit or protect against loss.
2014 Asset Allocation Effect: Negative
13.7%
-4.9%
6.0%
30.4%
13.2%
9.1% 7.5%
4.9%2.5%
-2.2%
-17.0%-20%
-10%
0%
10%
20%
30%
40%
Large Cap(S&P 500)
InternationalStocks
(MSCI EAFE)
US Bonds(Barlays Agg)
Real Estate(REITs)
Mid CapStocks
MunicipalBonds
CorporateBonds
Small CapStocks
High YieldBonds
EmergingMarkets
Commodities
2014 Granular vs. Simple Asset Allocation
Source: Morningstar Direct
Simple Blend Portfolio, up 7.9%: Mix of 49% S&P 500, 16% MSCI EAFE, 35% BarCap Aggregate
EXP 30 APR 2015 MKD-6687N-A
Slide 20
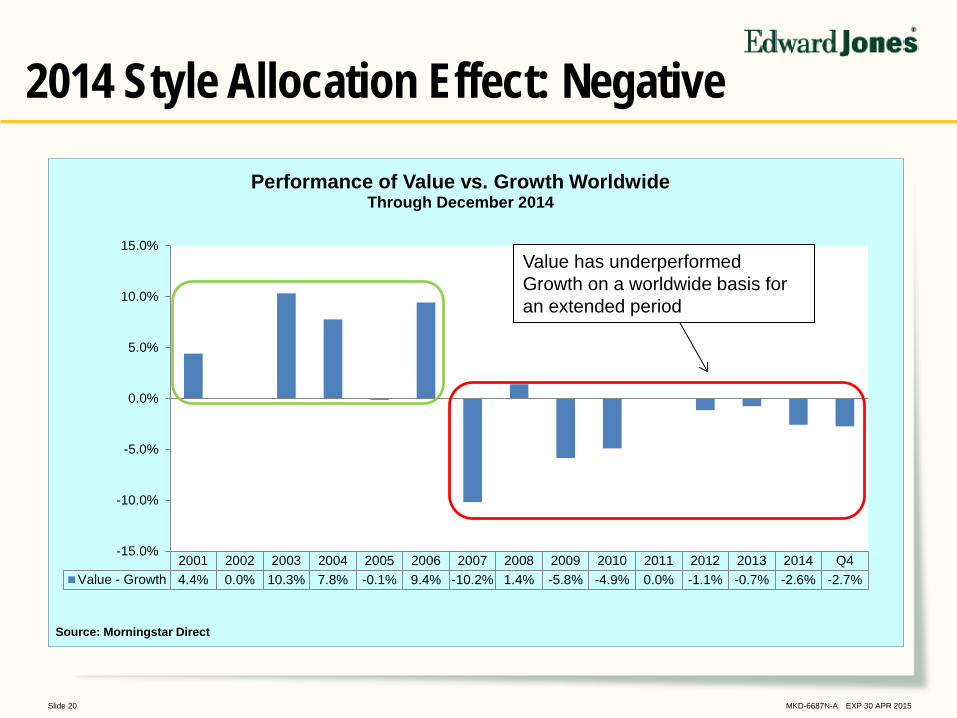
2014 Style Allocation Effect: Negative
2001 2002 2003 2004 2005 2006 2007 2008 2009 2010 2011 2012 2013 2014 Q4Value - Growth 4.4% 0.0% 10.3% 7.8% -0.1% 9.4% -10.2% 1.4% -5.8% -4.9% 0.0% -1.1% -0.7% -2.6% -2.7%
-15.0%
-10.0%
-5.0%
0.0%
5.0%
10.0%
15.0%
Performance of Value vs. Growth WorldwideThrough December 2014
Source: Morningstar Direct
Value has underperformed Growth on a worldwide basis for an extended period
EXP 30 APR 2015 MKD-6687N-A

EXP 30 APR 2015 MKD-6687N-A Slide 21
2014 Fund Selection Effect: Negative
Outperformance proved elusive for most active managers in 2014

Slide 22 EXP 30 APR 2015 MKD-6687N-A

Edward Jones Advisory Solutions®
Edward Jones is a dually registered broker-dealer and investment adviser. Edward Jones Advisory Solutions® is an asset allocation program that provides research models and customized portfolios. Depending on a client's minimum investment, a client can select Fund Models, which invest in mutual funds and exchange-traded funds (ETFs), or UMA Models, which also include separately managed allocations (SMAs). Please review the applicable Edward Jones Advisory Solutions Brochure for more information.
Many of the investments in Advisory Solutions, including money market funds, are offered by prospectus. You should consider the investment objective, risks, and charges and expenses carefully before investing. The prospectus contains this and other information. Your Edward Jones financial advisor can provide a prospectus, which you should read carefully before investing. Money market funds are not insured or guaranteed by the Federal Deposit Insurance Corporation (FDIC) or any other government agency. Although the fund seeks to preserve your investment at $1 per share, it is possible to lose money by investing in the fund. Diversification does not guarantee a profit or protect against loss. Edward Jones, its employees and financial advisors cannot provide tax or legal advice. Please consult your attorney or qualified tax advisor regarding your situation.
Copyright © 2015 Edward D. Jones & Co., L.P. All rights reserved. Slide 23 EXP 30 APR 2015 MKD-6687N-A

Please Complete Your Evaluation Now
Slide 24 EXP 30 APR 2015 MKD-6687N-A

Thank You
Copyright © 2015 Edward D. Jones & Co., L.P. All rights reserved. Slide 25 EXP 30 APR 2015 MKD-6687N-A


