197
NCI Adult Consumer Survey Final Report 2015-16 NCI History and Activities | 1 Adult Consumer Survey 2015-16 Final Report Part II (revised June 2017)

NCI Adult Consumer Survey Final Report 2015-16
NCI History and Activities | 1
Adult Consumer Survey
2015-16 Final Report Part II (revised June 2017)

NCI Adult Consumer Survey Final Report 2015-16
NCI History and Activities | 2
Table of Contents
Table of Contents ............................................................................................................................................................. 2 I. NCI History and Activities....................................................................................................................................... 3 Overview of National Core Indicators ............................................................................................................................... 4 State Participation......................................................................................................................................................... 5
Figure 1. NCI State Participation ...................................................................................................................... 5
The Core Indicators ....................................................................................................................................................... 5 How NCI Data Are Used ................................................................................................................................................ 7
Caution and Limitations ................................................................................................................................... 7
II. Methodology ....................................................................................................................................................... 10 Administration ............................................................................................................................................................... 11 Proxy Respondents ..................................................................................................................................................... 11 Surveyor Training ........................................................................................................................................................ 12 Criteria for Exclusion of Responses ............................................................................................................................. 12
Responses for Section II ................................................................................................................................. 13
Sampling ...................................................................................................................................................................... 13 III. Data Analysis ....................................................................................................................................................... 16 Data Management and Analysis ..................................................................................................................................... 17 Outcome Adjustment .................................................................................................................................................. 17 Scale Development ..................................................................................................................................................... 18 Significance Testing ..................................................................................................................................................... 18 IV. Appendices .......................................................................................................................................................... 20 Appendix A ..................................................................................................................................................................... 21 Survey Changes 2014-15 to 2015-16 .......................................................................................................................... 21 Appendix B ..................................................................................................................................................................... 36 Rules for Recoding and Combining Variables to Compute Core Indicators ................................................................ 36 Appendix C Sampling Procedures ................................................................................................................................... 69 Appendix D .................................................................................................................................................................... 92 Un-collapsed and unadjusted data by state ............................................................................................................... 92 Choice and Decision-Making (unadjusted and un-collapsed) ..................................................................................... 93 Work (un-collapsed) .................................................................................................................................................. 102 Self-Directed Supports (un-collapsed) ...................................................................................................................... 111 Community Inclusion, Participation and Leisure (un-collapsed) .............................................................................. 118 Relationships (un-collapsed) ..................................................................................................................................... 135 Satisfaction (un-collapsed) ........................................................................................................................................ 143 Service Coordination (un-collapsed) ......................................................................................................................... 151 Access (un-collapsed) ................................................................................................................................................ 159 Health (un-collapsed) ................................................................................................................................................ 164 Medications (un-collapsed) ...................................................................................................................................... 174 Wellness (un-collapsed) ............................................................................................................................................ 181 Respect and Rights (un-collapsed) ............................................................................................................................ 184 Safety (un-collapsed) ................................................................................................................................................ 196

NCI Adult Consumer Survey Final Report 2015-16
NCI History and Activities | 3
I. NCI History and Activities
This section briefly describes the history of the National Core Indicators and NCI Surveys

NCI Adult Consumer Survey Final Report 2015-16
NCI History and Activities | 4
Overview of National Core Indicators
In December 1996, the National Association of State Directors of Developmental Disabilities Services
(NASDDDS), in collaboration with the Human Services Research Institute (HSRI), launched the Core Indicators
Project (CIP). The aim of the project was to support state developmental disabilities operating agencies in the
development and implementation of performance and outcome indicators—and related data collection
strategies—so that they could measure service delivery system performance. This effort, now called National
Core Indicators (NCI), strives to provide states with valid and reliable tools to help improve system
performance and better serve people with intellectual and developmental disabilities and their families.
Moreover, NASDDDS’ active sponsorship of NCI facilitates pooled knowledge, expertise, and resources among
the states.
In 1997, 15 states convened to discuss the scope and content of a potential performance measurement
framework. Directors and staff from these 15 states worked to identify the major domains and sub-domains of
performance, indicators, measures, and data sources. The original 61 indicators, developed through a
consensus process, were intended to provide a system-level “snapshot” of how well each state was
performing. The states were guided by a set of criteria that was designed to select indicators that were:
1. Measurable;
2. Related to issues the states had some ability to influence; and
3. Important to all individuals they served, regardless of level of disability or residential setting.
During this initial phase, data collection protocols were developed and field-tested, including a face-to-face
Adult Consumer Survey (for individuals age 18 and older who were receiving services) and a mail-out Adult
Family Survey (for families who have an adult family member living at home). Seven states volunteered to
pilot test the indicators. Eight additional states served on the Steering Committee.
Since the initial field test, NCI has expanded its scope to include outcomes of services for children with
intellectual and developmental disabilities and their families. In addition, NCI continues to develop and refine
the indicators and expand state participation. For more information about NCI states, technical reports, and
other resources, please visit http://www.nationalcoreindicators.org.

NCI Adult Consumer Survey Final Report 2015-16
NCI History and Activities | 5
State Participation
During the 2015-16 data collection cycle, 45 states, the District of Columbia, and 22 sub-state entities
participated in NCI. State participation is entirely voluntary, and the participating states are shown in the chart
below. Not all NCI member-states participate in all surveys in each year.
Figure 1. NCI State Participation
The Core Indicators
The Core Indicators are the standard measures used across states to assess the outcomes of services provided
to individuals and families. Indicators address key areas of concern, including employment, respect/rights,
service planning, community inclusion, choice, and health and safety. An example of a Core Indicator would
be, “The proportion of people who have a paid job in the community.” To see the entire list of Core Indicators,
please visit http://www.nationalcoreindicators.org/indicators.
Each survey instrument is designed to measure certain Core Indicators. While most indicators correspond to a
single survey question, a few refer to clusters of related questions. For example, the indicator that measures
Community Inclusion (the proportion of people who regularly participate in everyday integrated activities in
their communities) is measured by several survey questions that ask about several separate community
activities.

NCI Adult Consumer Survey Final Report 2015-16
NCI History and Activities | 6
The current set of performance indicators includes approximately 100 consumer, family, system, and health
and safety outcomes—outcomes that are important to understanding the overall health of public
developmental disabilities agencies. Indicators are organized across five broad domains: Individual Outcomes;
Health, Welfare and Rights; Staff Stability and Competency; Family Outcomes; and System Performance. Each
domain is broken down into sub-domains (see Figure 2). Four data sources are used to assess outcomes: the
Adult Consumer Survey, three Family Surveys; NCI also produces a Staff Stability Survey (e.g., staff turnover).
The indicators have remained generally consistent over the last several years and thus can be used to analyze
system-level trends over time. However, the NCI program is a dynamic effort that allows for measures to be
added, dropped, or changed to reflect current and future priorities of participating states, so year-to-year
comparisons should be made with caution.
The data collection tools used to gather indicator data are regularly refined and tested to ensure they remain
valid, reliable, and applicable to current issues within the field. Details on the design and testing of this tool
are provided in the next section of this report.
Figure 2 Adult Consumer Survey Indicators: Domains and Sub-Domains
Domain Sub-Domain Concern Statement
Individual Outcomes
Work People have support to find and maintain community integrated employment.
Community Inclusion, Participation and Leisure
People have support to participate in everyday community activities and do things they like to do.
Choice and Decision-Making
People make choices about their lives and are actively engaged in planning their services and supports.
Self-direction People have authority and are supported to direct and manage their own services.
Relationships People have friends and relationships.
Satisfaction People are satisfied with the services and supports they receive.
Health, Welfare, and Rights
Safety People feel safe and free from fear.
Health People secure needed health services.
Medications Medications are managed effectively and appropriately.
Wellness People are supported to maintain healthy habits.
Respect/Rights People receive the same respect and protections as others in the community.
System Performance
Service Coordination Service are accessible, responsive, and support the person's participation in service planning.
Access to Supports People have access to quality supports.
NCI Adult Consumer Survey Final Report 2015-16
NCI History and Activities | 7
How NCI Data Are Used
The Core Indicators provide information for quality management and are intended to be used in conjunction
with other state data sources, such as risk management information, regional level performance data, results
of provider monitoring processes, and administrative information gathered at the individual service
coordination level. States typically use the indicator data to inform strategic planning, produce legislative
reports, and prioritize quality improvement initiatives. Some states use NCI as a data source for supplemental
performance measures in their home and community-based services (HCBS) waiver quality management
systems and include the information in support of evidentiary reports to the Centers for Medicare & Medicaid
Services (CMS). Many states share the indicator data with stakeholder groups such as Quality Councils and use
the stakeholder feedback to help set priorities and establish policy direction. It is also important to note that
states do not use the information to sanction service providers, nor do they use the results to remediate
individual issues (unless specifically requested by the participant or required by law as in the case of suspected
abuse, neglect, or mistreatment).
Caution and Limitations
This report does not provide benchmarks for acceptable or unacceptable levels of performance. Rather, it is
up to each state to decide whether its score or percentage is an acceptable performance level. States that fall
into the “below average” tier on any scale or indicator are not necessarily underperforming; instead, this
placement indicates only that the state’s scale score or indicator percentage is significantly lower than the
average of all states—where “significantly” means “not due to chance.” The results tables throughout this
report displays states’ scores relative to one another and show which states tend to have similar results.
Notably, the difference between a “below average” state and the average across the other states may be very
small, and it is up to public managers, policy-makers, and other stakeholders to decide whether a state’s result
relative to the NCI Average suggests that changes or further investigation are necessary.
Moreover, the NCI Average should not be interpreted as defining “acceptable” levels of performance or
satisfaction. Instead, it represents a multi-state “norm” that describes average levels of performance or
satisfaction across the participating states. In some instances, there are few significant differences among the
states; this denotes that most states are performing similarly. Instances in which several states’ results are
especially high (statistically significantly above the average level) indicate the levels of performance or
satisfaction achieved in those states might define a level of performance that may serve as a guidepost for
other states.
Data from previous years are not presented in this report. Comparisons of results from year to year should be
made with caution: even slight changes in wording or response options of certain questions may affect
comparability of results from one year to the next; the mix of participating states differs slightly each year and

NCI Adult Consumer Survey Final Report 2015-16
NCI History and Activities | 8
may affect the NCI Averages; and states draw new samples each year rather than following the same group of
individuals.

NCI Adult Consumer Survey Final Report 2015-16
Methodology | 9

NCI Adult Consumer Survey Final Report 2015-16
Methodology | 10
II. Methodology
This section describes the protocol for administering the Adult Consumer Survey,
including sampling criteria, administration guidelines, and surveying procedures.

NCI Adult Consumer Survey Final Report 2015-16
Methodology | 11
Administration
A key principle of NCI is the importance of gathering information directly from service recipients. The
indicators are meant to apply to all individuals receiving services from the state developmental disability
agency, regardless of disability type, and NCI administration protocols dictate that every person selected into
the sample be given an opportunity to respond (no one is prescreened or predetermined to be unable to
respond). Moreover, survey questions should not be marked “not applicable” on the basis of a person’s level
of ability.
Information for the Adult Consumer Survey Sections I and II are collected via a direct conversation with the
person receiving services. Additionally, background information is primarily collected from the individual’s
record. Section I questions, which pertain to personal experiences and require subjective responses, may only
be answered by the individual receiving services. Section II of the survey—which consists of objective
questions on the individual’s involvement in the community, their choices, respect and rights, and their access
to services—allows for the use of “proxy” or other respondents who know the individual well (such as a family
member or friend).
Proxy Respondents
Studies have found that the greatest discrepancies between individual and proxy responses occur when the
information being collected is subjective (i.e., related to how a person feels; proxies would be aware of the
correct answers only if the individual had previously expressed his or her feelings)1. Questions relating to
observable behaviors tend to have higher levels of agreement between individual and proxy. By excluding
proxies, a large percentage of individuals (many of whom may be unable to respond) would be unrepresented
in the data. Thus, the NCI project determined at the outset that proxy respondents would be used, though
only for specific questions and only in situations where the individual him/herself either could not effectively
communicate with the surveyor or chose to have a proxy respondent.
As mentioned, the use of proxy respondents for the NCI tool is limited to questions in Section II, which relates
to observable and/or measurable items: Community Inclusion, Choices, some questions related to
Respect/Rights, and Access to Needed Services. State records are also used to report objective data on an
individual’s health status and exam history as well as employment status; this information is collected in the
Background Section of the survey.
1 Magaziner, Jay, Sheryl Zimmerman, Ann L. Gruber-Baldini, J. Richard Hebel, and Kathleen M. Fox. "Proxy Reporting in Five Areas of
Functional Status Comparison with Self-Reports and Observations of Performance." American Journal of Epidemiology 146.5 (1997): 418-28.

NCI Adult Consumer Survey Final Report 2015-16
Methodology | 12
There are also ways to reduce discrepancies that may arise. First, it is important to make the questions as
accessible as possible to increase participation by all individuals. NCI attempts to make the language in the
Adult Consumer Survey as easy to understand as possible and the survey tool includes suggested rephrasing
for questions to facilitate comprehension. Secondly, it is important to establish a set of standards for proxy
respondents. NCI aims to increase the reliability of proxy responses by allowing only those people who know
the individual well (family, friends, staff, etc.) to serve as proxy respondents. To avoid conflict, service
coordinators are not allowed to respond as proxies. Further, if both the individual and a proxy respondent
answer a question, the individual’s answer is recorded so long as his/her answer is deemed reliable by the
surveyor. Surveyors also keep track of who responds to each question—the individual or the proxy—and the
proxy’s relationship to the individual.
Surveyor Training
States employ a variety of individuals to conduct the face-to-face meetings for the NCI Adult Consumer
Survey. To avoid conflict, surveys cannot be administered by the individual’s service provider, relative,
personal case manager, staff member, or other close contact. Given this constraint, states may use university
students, state staff, private contractors, employees of advocacy organizations, and individuals with
disabilities and their families to conduct the surveys.
Standardized training for surveyors is provided by HSRI and NASDDDS staff via on-site surveyor training to new
states and states with a significant change in surveyor staffing as well as through refresher trainings (via
webinar) for states that have previously participated. Trainings consist of a detailed review of the survey tool
and an overview of general surveying techniques. Trainers are given a packet of standardized materials to be
used at the on-site training sessions. In each state, one or more ‘Lead Trainers’ who are familiar with NCI
survey administration may train additional surveyors using standard guidebook and materials developed by
HSRI staff.
An additional session reviews the process for entering survey data in the Online Data Entry Survey Application
(ODESA).
States are responsible for monitoring the fidelity of the survey administration and accomplish this through
methods including survey shadowing (surveyors paired and review scoring after the session, supervisor
observes one or more sessions), and meetings of surveyors to review questions that emerge as surveyors
complete their first few surveys.
Criteria for Exclusion of Responses
All individuals selected in the survey sample are given an opportunity to participate in a face-to-face meeting.
There are no prescreening procedures. Exclusion of responses occurs at the time of data analysis by HSRI,
based on the criteria described as follows. There is no threshold of questions that a respondent must answer

NCI Adult Consumer Survey Final Report 2015-16
Methodology | 13
for the survey to be considered complete. The total number of surveys used for analysis in 2015-16 was
17,682.
Surveys were excluded from analysis for Section I if:
1) The surveyor indicated that the individual receiving supports did not respond consistently to questions
in Section I.
2) All answers to the Section I questions were either missing or marked as ‘N/A’ or ‘Don’t Know’.
Surveys were excluded from analysis for Section II if:
1) The individual receiving supports was marked as the respondent to all questions in Section II but
Section I was deemed invalid (for one of the reasons above).
2) No questions were answered in Section II.
Responses for Section I
Only individuals receiving services may answer questions in Section I. As shown in Figure 3, among the entire
2015-16 sample the valid response rate to Section I was 70%; valid responses by state ranged from 50% to
91%.
Responses for Section II
Section II allows for multiple respondents who know the individual well (e.g., family, friend, support worker) to
provide answers. If an individual’s responses were excluded from Section I in the final analysis, responses from
Section II were also excluded if the individual was the only respondent to Section II. For 2015-16, the valid
response rate (proxies included) to Section II was 98%.
Sampling
Each state is instructed to attempt to complete surveys with a random sample of individuals age 18 and over
who are receiving at least one publicly funded service in addition to case management. A sample size of 400
guarantees valid comparisons to be made across states with a 95% confidence level and a margin of error of
+/- 5%, no matter how large the service population size. A 95% confidence level and a margin of error of +/-5%
is mandatory for each state’s sample to be included in this report. For states with smaller served populations,
this total sample may be less than 400 to reach the 95% confidence level and 5% margin of error. Most states
sample more than 400 individuals to account for refusals and surveys that may be deemed invalid. Figure 3
presents the number of surveys completed by state. A more detailed description of each state’s sampling
strategy can be found in Appendix C.

NCI Adult Consumer Survey Final Report 2015-16
Methodology | 14
Why do we ask states to collect 400 surveys?
When NCI asks states to pull a representative sample of 400 surveys, the aim is to compile a dataset that
can provide a high level of statistical accuracy. The goal is to create a dataset that can be used to make
accurate inferences about the entire population of people using public services in each state. To do this,
we ask each participating state to pull a sample that reaches the 95% confidence level/5% margin of error
threshold; for most states, this sample size is 400.
A sample size that reaches the 95% confidence level/5% margin of error threshold means that if you
sampled that number of people from the same population several times, 95% of your responses would
fall within 5% above or below the actual percentages. So using this sample size, we can assume relative
accuracy. The larger the sample size, the smaller the margin of error and the greater the accuracy.
Statistical accuracy is largely a function of sample size. The larger the sample size, the greater the
statistical accuracy of results (lower margin of error). However, gains in statistical accuracy are not
proportional to increases in sample size. There are diminishing returns. For example, for a large total
population, if the sample size increases by 100, and then by another 100, and then by another 100, the
statistical accuracy might increase by 5%, then by 3%, then by 1%.
As a result, the 400 sample size gives a statistical accuracy of ±5% and is considered the most “cost
effective” sample size for large scale surveys. Meaning, you could sample more people but the increase in
statistical accuracy that those “extra” people would provide is minimal, and not worth the money.
To play around with this, we recommend you check out http://www.raosoft.com/samplesize.html. NCI
requires a margin of error at most 5% and a 95% confidence level for the Adult Consumer Survey sample. As
you increase the population size (in our case, this represents the service population), you’ll see that the
recommended sample size does not increase proportionally.
http://answersresearch.com/wp-content/uploads/2015/06/Answers-Research-Magic-400-062315.pdf

NCI Adult Consumer Survey Final Report 2015-16
Methodology | 15
Figure 3. Valid Surveys and Response Rates by State: 2015-16
State % Valid Answers to Section I
% Valid Answers to Section II
Number of Valid Surveys Completed
% of Total Sample Size (N)
AL 84% 96% 399 2%
AR 61% 98% 397 2%
AZ 91% 100% 476 3%
CO 75% 100% 411 2%
CT 78% 98% 348 2%
DC 50% 99% 401 2%
DE 67% 91% 436 2%
FL 62% 99% 1,457 8%
GA 69% 99% 473 3%
HI 51% 99% 401 2%
IL 68% 98% 400 2%
IN 72% 99% 830 5%
KS 74% 97% 400 2%
KY 67% 100% 456 3%
LA 67% 99% 439 2%
MA 77% 99% 422 2%
ME 75% 98% 402 2%
MI 68% 100% 435 2%
MN 60% 96% 428 2%
MO 70% 100% 400 2%
MS 81% 97% 414 2%
NC 56% 99% 823 5%
NV 88% 100% 403 2%
NY 65% 99% 497 3%
OH 66% 100% 623 4%
OK 54% 100% 400 2%
PA 70% 98% 701 4%
RI 72% 97% 506 3%
SD 81% 96% 366 2%
TN 77% 99% 447 3%
UT 61% 98% 407 2%
VA 63% 100% 818 5%
VT 90% 100% 326 2%
WA 69% 99% 406 2%
WI 75% 99% 413 2%
WY 78% 99% 321 2%
Total Average: 70% Average: 98% Total: 17,682 100%
NCI Adult Consumer Survey Final Report 2015-16
Data Analysis | 16
III. Data Analysis
This section explains the statistical methods used to analyze the Adult Consumer Survey
data. It includes an explanation of how certain outcomes are “adjusted” for the purposes
of making comparisons across states. This section also discusses scale construction and
significance testing of results.

NCI Adult Consumer Survey Final Report 2015-16
Data Analysis | 17
Data Management and Analysis
HSRI coordinates the NCI data management and analysis. States enter data into the Online Data Entry Survey
Application (ODESA) system2; HSRI staff subsequently download the data into a data file. This data file is then
“cleaned” (reviewed for completeness and compliance with standard NCI formats) and invalid responses are
eliminated. Files from individual states are then merged into a single file. The merged file from 2015-16 was
used for all analyses in this report. NCI uses SPSS software for data analysis.
Below is a summary of the statistical procedures used to analyze the Adult Consumer Survey data.
Outcome Adjustment
Outcome adjustment or “risk adjustment” is a statistical process used to control for differences in the
individual characteristics of people who completed the NCI Survey across states. This procedure allows for
more legitimate state comparisons by effectively “leveling the playing field.” This analysis helps account for
the fact that states have different eligibility definitions for services and may have samples with different
characteristics. Only those indicators that are likely to be affected by individual characteristics were adjusted
(e.g., indicators in the Choice and Decision-Making sub-domain). For example, a person who is older and has
more cognitive limitations may be less likely to choose where they live. On the other hand, such characteristics
should not affect whether a person has friends or staff who are respectful.
The indicators are risk-adjusted using the following characteristics: age, level of intellectual disability, level of
mobility, and whether any behavioral supports are needed to prevent self-injury, disruptive, or destructive
behavior. Risk adjustment was only done on items in the Choice and Decision-Making sub-domain for this
report. In prior years, Community Inclusion items were also risk-adjusted; however, due to the change in types
of questions asked, those items are no longer adjusted. In this report, results for indicators that were adjusted
are labeled as such, and unadjusted results for these indicators are presented in Appendix D.
Outcome adjustment for the indicators in the Choice and Decision-Making sub-domain was performed using
logistic regression. This statistical analysis produces a predicted value that one would expect to observe given
the individual’s characteristics. The state’s average observed rate (i.e., the state average prior to risk
adjustment) was adjusted by the average predicted rate to produce the risk-adjusted rate. As a result of this
procedure, state differences in adjusted values reflect true state differences rather than differences due to the
demographic or characteristic makeup of state service populations.
2 Beginning in 2013-14, all states are required to enter NCI data into ODESA.

NCI Adult Consumer Survey Final Report 2015-16
Data Analysis | 18
Scale Development
Scales are used to combine responses from multiple similar questions into one variable. In this way, we can
measure an overarching concept rather than specific elements of the concept. For the Adult Consumer
Survey, scales are used for the Choice and Decision-Making sub-domain and for Community Inclusion. To
create a scale, statistical tests are required to ensure that the multiple items share common properties. Scales
were created using factor analysis.
The Choice and Decision-Making sub-domain was divided into two scales: Life Decisions and Everyday Choices.
These scales were created by averaging the items within those categories3 for each individual. Higher scale
scores represent higher levels of choice. These scales were also risk-adjusted.
The Community Inclusion scale was created by averaging the individual’s responses to four of the questions
relating to whether people went out in the community for particular activities. Higher scale scores represent
higher level of community participation as indicated by taking part in these activities in the community. The
Community Inclusion scale was not risk-adjusted.
Collapsing Data
For many of the indicators in this report, only “yes” responses are analyzed and reported for state to state
comparisons and significance testing. However, there are several indicators for which the “yes” response was
collapsed with the middle response (for example, a “sometimes” response, or a “some input” response) to
form the “yes” indicator category, which was then analyzed and subsequently reported. For example, for
choice indicators, responses “person chose” and “person had some input” were collapsed into one “yes,
person chose” category. For those indicators, the two responses were considered to be equally indicative of a
positive outcome. Appendix B contains the collapsing and recoding rules for all indicators and risk adjustment
variables.
Significance Testing
In this report, for all non-adjusted items, each state’s indicator score was compared to the NCI Average (the
average across all NCI states estimates) for that indicator. These comparisons were conducted using t-tests.
The t-test analyses determined whether each state’s percentage was:
1. Significantly higher than the other states’ average (NCI Average, average of averages);
2. Within the average range (i.e., not statistically different from the NCI Average); or
3. Significantly lower than the other states’ average.
3 Indicators used for scales are listed in the corresponding sections.

NCI Adult Consumer Survey Final Report 2015-16
Data Analysis | 19
A conservative cut-off point of p < 0.005 was used to determine significant differences. The placement of each state into one of these three groups is indicated in tables for each outcome.
Please Note: Statistical significance is influenced by the size of the state’s sample. Therefore, it is possible that
a state with a lower percentage but a larger sample will be classified as significantly above average while a
state with a somewhat higher percentage but a smaller sample will not.

NCI Adult Consumer Survey Final Report 2015-16
Appendices | 20
IV. Appendices
NCI Adult Consumer Survey Final Report 2015-16
Appendices | 21
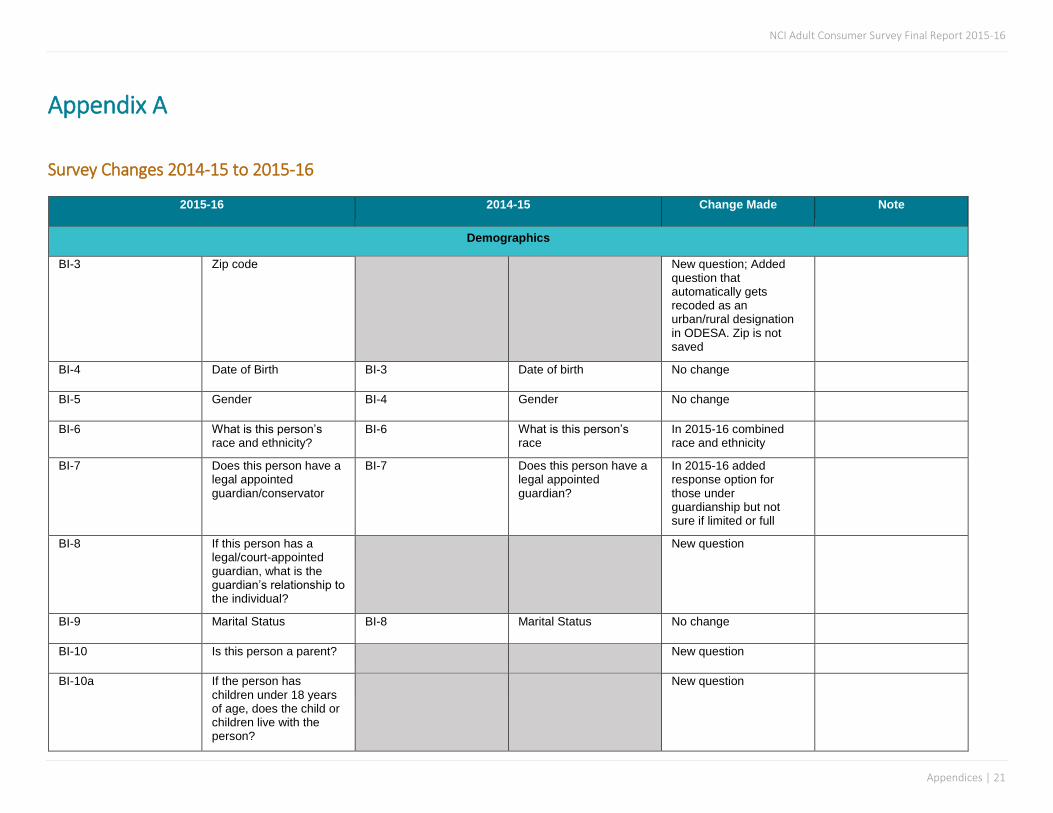
Appendix A
Survey Changes 2014-15 to 2015-16
2015-16 2014-15 Change Made Note
Demographics
BI-3 Zip code New question; Added question that automatically gets recoded as an urban/rural designation in ODESA. Zip is not saved
BI-4 Date of Birth BI-3 Date of birth No change
BI-5 Gender BI-4 Gender No change
BI-6 What is this person’s race and ethnicity?
BI-6 What is this person’s race
In 2015-16 combined race and ethnicity
BI-7 Does this person have a legal appointed guardian/conservator
BI-7 Does this person have a legal appointed guardian?
In 2015-16 added response option for those under guardianship but not sure if limited or full
BI-8 If this person has a legal/court-appointed guardian, what is the guardian’s relationship to the individual?
New question
BI-9 Marital Status BI-8 Marital Status No change
BI-10 Is this person a parent? New question
BI-10a If the person has children under 18 years of age, does the child or children live with the person?
New question

NCI Adult Consumer Survey Final Report 2015-16
Appendices | 22
2015-16 2014-15 Change Made Note
BI-11 Is this person diagnosed with an intellectual disability (ID)?
BI-9 Is this person diagnosed with an intellectual disability (ID)?
No change
BI-11a If yes, what level of ID? BI-9a If yes, what level of ID? No change
BI-12 What other conditions are noted in this person’s record?
BI-10 What other disabilities are noted in this person’s record?
Changed word in question from “disabilities” to “conditions”
BI-12a What health conditions are noted in this person’s record?
BI-10a What health conditions are noted in this person’s record?
No change
BI-13 What is this person’s primary language?
BI-11 What is this person’s primary language?
No change
BI-14 What is this person’s preferred means of communication?
BI-14 What is this person’s primary means of expression?
In 2015-16, used “preferred means of communication” as opposed to “primary means of expression”
BI-15 How would you describe this person’s mobility?
BI-13 How would you describe this person’s mobility?
No change
BI-16 Does this person have a primary care doctor or primary care practitioner?
BI-15 Does this person have a primary care doctor or primary care doctor?
In 15-16 used term “practitioner” instead of “doctor”
BI-17 When was his/her last complete annual physical exam?
BI-16 When was his/her last complete annual physical exam?
No change
BI-18 When was his/her last dentist exam?
BI-17 When was his/her last dentist visit?
2015-16: “exam”
BI-19 When was the last time this person had an eye exam/vision screening?
BI-18 When was the last time this person had an eye exam/vision screening?
No change
BI-20 When was the last time this person had a hearing test?
BI-19 When was the last time this person had a hearing test?
No change

NCI Adult Consumer Survey Final Report 2015-16
Appendices | 23
2015-16 2014-15 Change Made Note
BI-21 During the past 12 months, has this person had a flu vaccination?
BI-20 During the past 12 months has this person had a flu vaccination?
No change
BI-22 How much does this person weigh?
BI-22 How much does this person weigh?
No change
BI-23 How tall is this person? BI-23 How tall is this person? No change
BI-24 Does this person use nicotine or tobacco products (e.g., cigarettes, e-cigarettes, chewing tobacco, etc.)?
BI-25 Does this person smoke or chew tobacco?
The question was made more specific.
BI-25 If female, when was her last pap test screening?
BI-26 If female, when was her last pap test screening?
No change
BI-26 If female, when was her last mammogram?
BI-27 If female, when was her last mammogram?
No change
BI-27 When was the last time this person had a screening for colorectal cancer?
BI-28 When was the last time this person had a screening for colorectal cancer?
No change
BI-28 If this person has a seizure disorder, how often do seizures occur?
BI-30 If this person has seizures, how often do they occur?
Slight wording change
BI-29 Does this person currently take medications to treat mood disorders, anxiety and/or psychotic disorders?
BI-31 Does this person currently take medications to treat mood disorders, anxiety and/or psychotic disorders?
No change
BI-29a If yes, how many medications to treat mood disorders, anxiety and/or psychotic disorders does this person take?
BI-31a If yes, how many medications to treat mood disorders, anxiety and/or psychotic disorders does this person take?
No change
BI-30 Does this person currently take medications for behavioral challenges?
BI-31b Does this person currently take medications for behavioral challenges?
No change

NCI Adult Consumer Survey Final Report 2015-16
Appendices | 24
2015-16 2014-15 Change Made Note
BI-30a If yes, how many medications to treat behavioral challenges does this person take?
BI-31c If yes, how many medications to treat behavioral challenges does this person take?
No change
BI-31 Does this person have a behavior plan?
BI-31d Does this person have a behavior plan?
No change
BI-32 How long has this person lived in his/her current home?
BI-33 How long has this person lived in his/her current home?
No change
BI-33 How would you characterize the place where this person lives?
BI-34 How would you characterize the place where this person lives?
Response options changed
BI-33a Is this person’s residence owned or controlled by a provider agency?
New question
BI-34 If this person lives in an Intermediate Care Facility for persons with ID/DD, a specialized institutional facility, or a group home, is it publicly or privately operated?
BI-34a If this person lives in an Intermediate Care Facility for persons with ID/DD, a specialized institutional facility or a group home, is it publicly or privately operated?
No change
BI-35 Is this person named on the lease?
New question
BI-36 Does this person own his or her own home?
New question
BI-37 Has this person ever lived longer than a year in an institutional setting such as a nursing home or ICF?
New question
BI-38 What amount of paid support does this person receive at home?
BI-36 What amount of paid support does this person receive at home?
No change
BI-39-BI-43
Employment matrix
BI-37-BI-40 Added BI-40: Paid small-group job in a community-based setting
This allowed people to report being involved in individual and group jobs separately.
NCI Adult Consumer Survey Final Report 2015-16
Appendices | 25
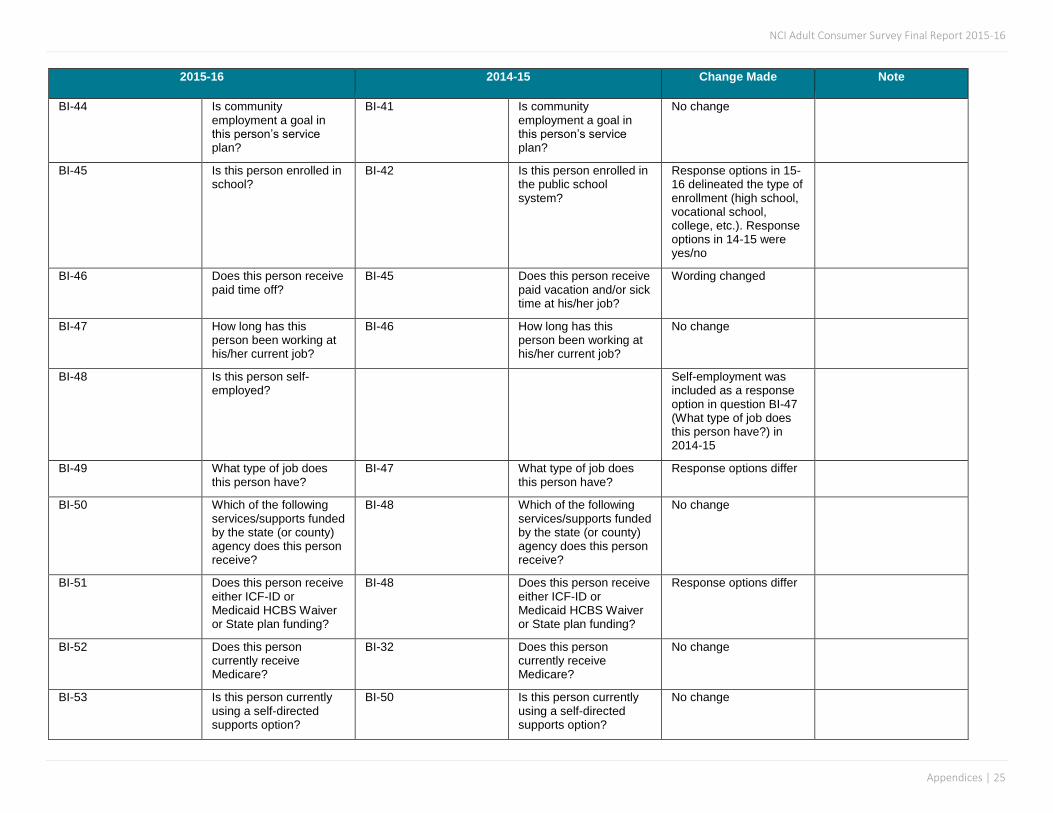
2015-16 2014-15 Change Made Note
BI-44 Is community employment a goal in this person’s service plan?
BI-41 Is community employment a goal in this person’s service plan?
No change
BI-45 Is this person enrolled in school?
BI-42 Is this person enrolled in the public school system?
Response options in 15-16 delineated the type of enrollment (high school, vocational school, college, etc.). Response options in 14-15 were yes/no
BI-46 Does this person receive paid time off?
BI-45 Does this person receive paid vacation and/or sick time at his/her job?
Wording changed
BI-47 How long has this person been working at his/her current job?
BI-46 How long has this person been working at his/her current job?
No change
BI-48 Is this person self-employed?
Self-employment was included as a response option in question BI-47 (What type of job does this person have?) in 2014-15
BI-49 What type of job does this person have?
BI-47 What type of job does this person have?
Response options differ
BI-50 Which of the following services/supports funded by the state (or county) agency does this person receive?
BI-48 Which of the following services/supports funded by the state (or county) agency does this person receive?
No change
BI-51 Does this person receive either ICF-ID or Medicaid HCBS Waiver or State plan funding?
BI-48 Does this person receive either ICF-ID or Medicaid HCBS Waiver or State plan funding?
Response options differ
BI-52 Does this person currently receive Medicare?
BI-32 Does this person currently receive Medicare?
No change
BI-53 Is this person currently using a self-directed supports option?
BI-50 Is this person currently using a self-directed supports option?
No change

NCI Adult Consumer Survey Final Report 2015-16
Appendices | 26
2015-16 2014-15 Change Made Note
BI-54 If yes, who employs this person’s support workers?
BI-51 If yes, who employs this person’s support workers?
No change
BI-55-BI-57-Behavioral support needs
BI-52-BI-54-Behavioral support needs
No change
Questions not included in the 2015-16 ACS (that were included in the 2014-15 survey)
Ethnicity
Overall health moved to Section II
Pneumonia Vaccine
Physical activity questions moved to Section II
How often does this person require medical care?
Who owns or leases where this person lives?
Funding for employment/day supports
Did this person work 10 out of the last 12 months in a community job?
2015-16 2014-15 Change Made Note
Home
Q1-6 Home 9-14 Home Moved to beginning
Easier to understand, will typically begin with more positive response
1 Do you like your home or where you live?
9 Do you like your home or where you live?
No change
2 If In-between or No: What don’t you like about where you live?
New question
3 Would you like to live somewhere else?
10 Would you like to live somewhere else?
No change
4 Do people let you know before they come into your home?
12 Do people let you know before they come into your home?
No change
5 Do people let you know before coming into your bedroom?
13 Do people let you know before coming into your bedroom?
No change

NCI Adult Consumer Survey Final Report 2015-16
Appendices | 27
2015-16 2014-15 Change Made Note
6 Do you have a place to be alone in your home?
14 Do you have enough privacy at home?
Modified
Easier to understand language
Comparisons to previous years’ data should be made with caution.
Deleted or Replaced Questions - Home
11. Do you ever talk with your neighbors?
Employment
Q7-13 Employment/Day 1-8 Employment/Day Moved to second sub-section
Helps ease into questions
7 Do you have a paid job in the community?
1 Do you have a paid job in the community?
No change
8 If No, ask: Would you like to have a job in the community?
2 If No, ask: Would you like to have a job in the community?
No change
9 Do you like working there?
3 Do you like working there?
No change
10 Would you like to work somewhere else?
4 Would you like to work somewhere else?
No change
11 Do you go to a program or workshop (program or center where other people with disabilities work)?
5 Do you go to a day program or do some other regularly scheduled activity during the day?
Modified
Specific to non-inclusive day activity (later ask about classes/other activities)
Parallel comparisons cannot be made from previous years' data.
11a Would you like to go more or less to the workshop (program or center)
New question
Replaces former Q6. Helps determine level of satisfaction with activity and whether there are enough/too many hours devoted
12 Do you take classes, training, or do something to help you get a job or a better job?
New question

NCI Adult Consumer Survey Final Report 2015-16
Appendices | 28
2015-16 2014-15 Change Made Note
13 Do you volunteer? 8 Do you do any volunteer work?
Modified
Deleted ‘work’ per state/interviewer suggestion
Deleted or Rephrased Questions- Employment
6. Do you like going there/doing this activity?
7. Would you like to go somewhere else or do something else during the day?
Safety
14 Are there any places where you feel afraid or scared?
Replaces former Q15-17. Question and response options changed to include more settings where people feel unsafe (e.g., during transport)
Comparisons to previous years’ data should be made with caution.
15 If you ever feel afraid, is there someone you can talk to?
18 If you ever feel afraid, is there someone you can talk to?
No change
Deleted or Rephrased Questions - Safety
15. Are you ever afraid or scared when you are at home?
16. Are you ever afraid or scared when you are out in your neighborhood?
17. Are you ever afraid or scared at work or at your day program/other activity?
Relationships
16 Do you have friends you like to talk to or do things with?
19 Do you have friends you like to talk to or do things with?
No change
17 Do you want more help to make or keep in contact with your friends?
New Question
Gets at whether people have support to make/maintain relationships
18 Can you see your friends when you want to see them?
21 Can you see your friends when you want to see them?
No change

NCI Adult Consumer Survey Final Report 2015-16
Appendices | 29
2015-16 2014-15 Change Made Note
19 If no, why can’t you see your friends when you want to?
New Question
Help states determine whether there are actionable issues (e.g., staff, transportation)
20 Do you have other ways of communicating with your friends when you cannot see them?
New Question
Captures if people can keep in contact via technology
21 Can you go on a date if you want to?
22 Can you go on a date if you want to?
No change
22 Do you ever feel lonely? 23 Do you ever feel lonely? No change
23 Can you see or communicate with your family when you want to?
24 Do you have family that you see?
Modified
Captures if people can keep in contact via technology; in particular, communication with family if the person does not live in the family home
Comparisons to previous years’ data should be made with caution.
Deleted or Rephrased Questions - Relationships
20. Do you have a best friend, or someone you are really close to?
25. Can you see your family when you want to?
26. Can you help other people if you want to?
Community Participation
Q24, 24a, 25 Community Participation and Leisure
New Question
Builds on Community Inclusion (Section II); asks more subjective if people do what they want and when m and if people have enough to do
24 Are you able to go out and do the things you like to do?
New Question

NCI Adult Consumer Survey Final Report 2015-16
Appendices | 30
2015-16 2014-15 Change Made Note
24a Do you get to do the things you like to do as much as you like?
New Question
25 When you are at home, do you have enough things you like to do? (Do you have things to do so you are not bored at home?)
New Question
Rights and Privacy
26 Do people read your mail or email without asking you first?
64 Do people read your mail or email without asking you first?
Moved to Section I
Determined that only individuals should answer
Comparisons to previous years’ data should be made with caution – specifically by looking only at surveys with a valid Section I and only answers given by the individual.
27 Can you be alone with friends or visitors at your home?
65 Can you be alone with friends or visitors at your home, or does someone have to be with you?
Moved to Section I
Determined that only individuals should answer
Comparisons to previous years’ data should be made with caution – specifically by looking only at surveys with a valid Section I and only answers given by the individual.
27a Are there rules about having friends or visitors in your home?
New question
Gets at whether people can see friends but with rules/restrictions
28 Can you use the phone and Internet when you want to?
66 Can you use the phone and Internet when you want to?
Moved to Section I
Determined that only individuals should answer
Comparisons to previous years’ data should be made with caution – specifically by looking only at surveys with a valid Section I and only answers given by the individual.

NCI Adult Consumer Survey Final Report 2015-16
Appendices | 31
2015-16 2014-15 Change Made Note
Satisfaction
29 Have you met your case manager/service coordinator?
27 Have you met your case manager/service coordinator?
No change
30 Does your case manager/service coordinator ask you what you want?
30 Does your case manager/service coordinator ask you what you want?
No change
31 Do you have a service plan?
28 Do you have a service plan?
No change
32 Did you take part in the last service planning meeting?
29 Did you help make your service plan?
Modified
Better reflects whether people take an active role in service planning
Comparisons to previous years’ data should be made with caution.
33 At the service planning meeting, did you know what was being talked about?
New question
Determines whether preferred language was used and easy to understand terms.
34 Did the service planning meeting include the people you wanted to be there?
New question
Determines whether person has the people/advocates desired as part of meeting
35 Were you able to choose the services that you get as part of your service plan?
New question
Determines whether people are able to determine the services they want/need
36 Are you able to contact your case manager/service coordinator when you want to?
32 If you call and leave a message, does your case manager/service coordinator take a long time to call you back, or does s/he call back right away?
Modified
Easier to understand; more inclusive of various means to communicate (e.g., email)
Comparisons to previous years’ data should be made with caution.

NCI Adult Consumer Survey Final Report 2015-16
Appendices | 32
2015-16 2014-15 Change Made Note
37 Do you have staff who help you?
33 Do you have staff who help you?
No change
38 Do your staff treat you with respect?
34 Do your staff treat you with respect?
No change
39 Do your staff come and leave when they are supposed to?
35 Do your staff come when they are supposed to?
Modified
Added “and leave”
40 Do you have a way to get places you need to go (like work, appointments, etc.)?
New question
Better gets at whether there is always transportation – specific to places person needs to go
41 Are you able to get places when you want to do something outside your home, like going out to see friends, for entertainment, or to do something fun?
38 When you want to go somewhere, do you always have a way to get there?
Modified
Better gets at whether there is always transportation – specific to places person wants to go
Comparisons to previous years’ data should be made with caution.
42 Are services and supports helping you to live a good life?
New question
Deleted or Rephrased Questions - Satisfaction
Q31. If you ask for something, does your case manager/service coordinator help you get what you need?
Community Inclusion
Q44-50 Community Inclusion Q48-53 Community Inclusion Modified (all)
Now asks how many times a person went out, response options include frequency; still asks who the person typically goes with
49 Do you participate in community groups or other activities in your community?
New question
Helps get at whether people are integrated in their community

NCI Adult Consumer Survey Final Report 2015-16
Appendices | 33
2015-16 2014-15 Change Made Note
Deleted or Rephrased Questions - Community Inclusion
53. In the past month, did you go out for exercise?
Choice and Decision-Making
Q51-59 Choice and Decision-Making
Q55-62 Choice and Decision-Making
No changes
Rights
60 Do you have a key to your home?
New question Crosswalks to new HCBS Regulation.
61 Can you lock your bedroom if you want to?
New question Crosswalks to new HCBS Regulation.
62 Have you ever participated in a self-advocacy group meeting, conference, or event?
67 Have you ever participated in a self-advocacy group meeting, conference, or event?
No change
63 Have you voted? New question
Helps get at citizenship and rights
Access
64 Do you need any of these additional services?
68b If additional services are needed, please note type of service or support below
Modified
Combines former Q68 and Q68b
Comparisons to previous years’ data should be made with caution.
65 Do you feel your staff have the right training to meet your needs?
69 Do you feel your staff have the right training to meet your needs?
No change
Deleted and Replaced Questions - Access
68. Do you get the services you need?
Health and Wellness
66 Overall, how would you describe your health?
70 Overall, how would you describe your health?
No change

NCI Adult Consumer Survey Final Report 2015-16
Appendices | 34
2015-16 2014-15 Change Made Note
67 Do you exercise or do physical activity?
BI-24-24B Moved from Background Information section.
Data are not typically found in records, will get more accurate information from individuals/proxies
Comparisons to previous years’ data should be made with caution.
Self-Directing Module
Q68-73 Self-direction Q39-44 Self-direction Moved to Section II open to anyone directing services (not just on a self-directing waiver)
Allows for more respondents to these questions; questions are only asked if the person responding takes part in directing services
Comparisons to previous years’ data should be made with caution – in particular, data compared to previous years should note that these data include any person using a self-directed option and questions are only asked to those who take part in directing services.
68 Do you participate in decisions about how to use your supports budget, hiring staff, or managing the services you get?
New question
This question will determine if the section should be asked – if no, don’t know, or the person answering is staff, questions will not be asked
69 Who makes decisions about how your budget for services is used?
New question
Determines all people who help make decisions including person, family, someone else
70 Do you hire and manage your staff?
New question
Main tenet of self-direction

NCI Adult Consumer Survey Final Report 2015-16
Appendices | 35
2015-16 2014-15 Change Made Note
71 Can you make changes to your budget/services if you need to?
41 Can you make changes to your budget/services if you want to?
No change
72 Do you have enough help deciding how to use your budget/services?
42 Do you want more help deciding how to use your budget/services, or do you have enough help?
Modified
Clearer question
Comparisons to previous years’ data should be made with caution.
73 Do you get information about how much money is left in your budget/services?
43 Do you get information about how much money is left in your budget/services?
No change
73a If yes, is the information easy to understand?
44 If yes, is the information easy to understand?
No change
Deleted and Replaced Questions - Self-Direction
39. Does someone talk with you about your budget and the services you can get?
40. Is there someone who helps you decide how to use your budget/services?

NCI Adult Consumer Survey Final Report 2015-16
Appendices | 36
Appendix B
Rules for Recoding and Combining Variables to Compute Core Indicators
Sub-Domain Table label Updated for 15-16 Variable name used in calculation
How its filtered Tested for significance?
Demographics Urban/Rural New for 15-16 BIZIP Don’t Know shown
Age (Variable used for risk adjustment)
AGE
Age Category New for 15-16 Age_categ Categorical variable created for the following categories:
• 18 thru 22
• 23 thru 34
• 35 thru 54
• 55 thru 74
• 75 and above.
• Unknown
Gender GENDER
Marital Status MARSTAT Don’t Know shown
Person is a parent New for 15-16 PARENT15_1 PARENT15_2
Don’t Know shown

NCI Adult Consumer Survey Final Report 2015-16
Appendices | 37
PARENT15_3 PARENT15_99
Race
Race and ethnicity combined into one variable for 15-16
RACE
Categorical variable created using variables:
RACE151 RACE152 RACE153 RACE154 RACE155 RACE156 RACE157 RACE1599
“Two or more races” variable created by identifying the cases that have at least two races reported
Don’t Know shown
Type of Residence Categories changed for 15-16
TYPEHOME15 Don’t Know shown
Length of residence RESIDLEN08 Don’t Know shown
Persons residence owned or controlled by provider agency
New in 15-16 CONTPROV15 Don’t Know shown
Person named on lease New in 15-16 LEASE15 Don’t Know shown
Person owns his or her own home
New in 15-16 OWNHOME15 Don’t Know shown

NCI Adult Consumer Survey Final Report 2015-16
Appendices | 38
Diagnosis of ID DIAGMR Don’t Know shown
Level of ID (Variable used for risk adjustment)
LEVELMR08 Unknown and unspecified shown; filtered for those with a diagnosis of ID (DIAGMR=2)
Other Disabilities Categories changed for 15-16
DXMIPDMD13 DXMIPDAD13 DXMIPDBC13 DXMIPDPD13 DXMIPDOTH13 DXAUTISM0813 DXCP13 DXBI13 DXNEURO13 DXCHEMDP13 DXDOWN0813 PRWISYND13 DXFETALALCH15 DXVISION15 DXHEARING15 DXNONE13
Don’t Know included in denominators
Health variables Categories changed for 15-16
HCCARVAS HCDIAB HCCANCER HCHIBP HCHICHL HCDYSPH15 HCPRESULC HCALZHEIM15
Don’t Know included in denominators
Preferred Means of Expression Wording of question changed 15-16
EXPRESS Don’t Know shown

NCI Adult Consumer Survey Final Report 2015-16
Appendices | 39
Language LANGUAGE
Overall Health NO LONGER IN DEMOGRAPHICS SECTION
Mobility (Variable used for risk adjustment)
MOBILITY08 Don’t Know shown
Support to Manage Self Injurious Behavior (Variable used for risk adjustment)
SELFINJ08 Don’t Know shown
Support to Manage Disruptive Behavior (Variable used for risk adjustment)
DISBEH08 Don’t Know shown
Support to Manage Destructive Behavior (Variable used for risk adjustment)
UNCPBEH08 Don’t Know shown
Guardianship Categories changed 15-16
LGLSTAT15 Don’t Know shown
Relationship of guardian New in 15-16 GUARDRELAT15 Don’t Know shown
Owns or leases home NO LONGER IN SURVEY

NCI Adult Consumer Survey Final Report 2015-16
Appendices | 40
Choice and Decision-making
Proportion of people who reported they chose or had some input in choosing where they live if not living in the family home (Adjusted Variable)
CHOSHOME2
Recoded variable in which response options are collapsed into the following: 0 no 1 had at least some input
Filtered for Section II (INVL_CR2_15=0) and for residence type (typehome08 not equal to 5 (parent or relatives home)
Risk adjusted
Proportion of people who reported they chose or had some input in choosing their roommates if not living in the family home (Adjusted Variable)
HOUSEMATES2
Recoded variable in which response options are collapsed into the following: 0 no 1 had at least some input
Filtered for Section II (INVL_CR2_15=0)
Risk adjusted
Proportion of people reported to have a job in the community and who reported they chose or had some input in choosing their job* (Adjusted Variable)
* reported for those who were determined to have a paid community job from Background section
CHOSJOB2
Recoded variable in which response options are collapsed into the following: 0 no 1 had at least some input
Filtered for Section II (INVL_CR2_15=0) and for PAIDCOMMJOB2=1
Risk adjusted
Proportion of people who reported they have a day program or activity and chose or had some input in choosing their day program or activity (Adjusted Variable)
CHOOSDAY2
Recoded variable in which response options are collapsed into the following: 0 no 1 had at least some input
Filtered for Section II (INVL_CR2_15=0)
Risk adjusted

NCI Adult Consumer Survey Final Report 2015-16
Appendices | 41
Proportion of people who reported they choose or help decide their daily schedule (Adjusted Variable)
SCHEDULE2
Recoded variable in which response options are collapsed into the following: 0 no 1 had at least some input
Filtered for Section II (INVL_CR2_15=0)
Risk adjusted
Proportion of people who reported they choose or help decide how to spend free time (Adjusted Variable)
FREETIME2
Recoded variable in which response options are collapsed into the following: 0 no 1 had at least some input
Filtered for Section II (INVL_CR2_15=0)
Risk adjusted
Proportion of people who reported they chose or help decide what to buy with their spending money (Adjusted Variable)
CHOOSBUY2
Recoded variable in which response options are collapsed into the following: 0 no 1 had at least some input
Filtered for Section II (INVL_CR2_15=0)
Risk adjusted
Proportion of people who reported they chose or were aware they could request to change their case manager/service coordinator (“yes” and “no, but can change” responses)
CHOOSCM2
Recoded variable in which response options are collapsed into the following: 0 no 1 had at least some input
Filtered for Section II (INVL_CR2_15=0)
YES

NCI Adult Consumer Survey Final Report 2015-16
Appendices | 42
Proportion of people who reported they chose or were aware they could request to change their staff (“yes” and “no, but can change” responses)
CHOOSSTAF2
Recoded variable in which response options are collapsed into the following: 0 no 1 had at least some input
Filtered for Section II (INVL_CR2_15=0)
Risk adjusted
YES
Work Proportion of people who were reported to have a job in the community*
* reported for those who were determined to have a paid community job from Background section
Changed how asked and analyzed in 15-16
PAIDCOMMJOB2
Variable created indicating those who have at least one of the following marked “yes”
1) PAIDCOMMJOBIND15 2) PAIDCOMMJOBGRP15
Creates and makes DK missing
YES
Proportion of people who were reported to have a job in the community by type of employment support*
* reported for those who were determined to have a paid community job from Background section
Changed how asked and analyzed in 15-16
commwork_type_Individual
commwork_type_Group
Variables created to identify types of paid jobs in the community and whether public support is received for that job.
Variables created using
1) PAIDCOMMJOBIND15 and PCJISERV15
2) PAIDCOMMJOBGRP15
Filtered for PAIDCOMMJOB2=1

NCI Adult Consumer Survey Final Report 2015-16
Appendices | 43
Average number of bi-weekly hours by type of community employment support
Changed how asked and analyzed in 15-16
Filter separately for commwork_type_Individual=1, commwork_type_Individual=2 and
commwork_type_Group=1
Then compare means with the variable PCJIHOURS15 or PCJGHOURS15 (for commwork_type_group=1)
Filtered for PAIDCOMMJOB2=1
Average bi-weekly gross wages by type of community employment support
Changed how asked and analyzed in 15-16
Filter separately for commwork_type_Individual=1, commwork_type_Individual=2 and
commwork_type_Group=1
Then compare means with the variable PCJIWAGES15 or PCJGWAGES15 (for commwork_type_group=1)
Filtered for PAIDCOMMJOB2=1
Average bi-weekly hourly wage by type of community employment support
Changed how asked and analyzed in 15-16
Filter separately for commwork_type_Individual=1, commwork_type_Individual=2 and
commwork_type_Group=1
Then compare means with the variable PCJIHWAGE or PCJGHWAGE (for commwork_type_group=1)
PCJIHWAGE and PCJGHWAGE were computed by dividing the wage in two week period by the wages earned in two week period
Filtered for PAIDCOMMJOB2=1

NCI Adult Consumer Survey Final Report 2015-16
Appendices | 44
Proportion of people who were reported to have a job in community employment who worked 10 of the past 12 months in community employment
No Longer in Survey
Average length of employment in current job for people who were reported to have a job in the community
Calculated variable using JOBYRS and JOBMOS to equal total months
Proportion of people who were reported to have a job in the community and received paid time off
Question changed in 15-16
PDTIMEOFF2
Recoded variable in which response options are collapsed into the following: 0 no 1 receives paid time off.
YES
Proportion of people who were reported to have a job in the community in the four most common types of employment
JOBTYPE
Proportion of people who were reported not to have a job in the community and who reported they would like a job in the community* (“yes” responses only)
*reported for those who were determined to not have a
LIKEAJOB2
Recoded variable in which response options are collapsed into the following: 0 no, in-between 1 yes.
Filtered for PAIDCOMMJOB2=0 and Section I valid (INVL_CR1_15=0)
YES

NCI Adult Consumer Survey Final Report 2015-16
Appendices | 45
community job from Background section
Proportion of people who were reported to have community employment as a goal in their service plan
IEGOAL2
Recoded variable in which response options are collapsed into the following: 0 no 1 integrated employment in service plan.
YES
Proportion of people who report taking classes or training to help get a job, or get a better job
New for 15-16 TRAINING2
Recoded variable in which response options are collapsed into the following: 0 no 1 yes.
Filtered for Section I (INVL_CR1_15=0)
yes
Proportion of people who reported going to a day program or regular activity
HAVEDAYACT2
Recoded variable in which response options are collapsed into the following: 0 no 1 yes.
Filtered for Section I (INVL_CR1_15=0)
YES
Proportion of people who reported doing volunteer work
VOLUNT2
Recoded variable in which response options are collapsed into the following: 0 no 1 yes.
Filtered for Section I (INVL_CR1_15=0)
YES
NCI Adult Consumer Survey Final Report 2015-16
Appendices | 46
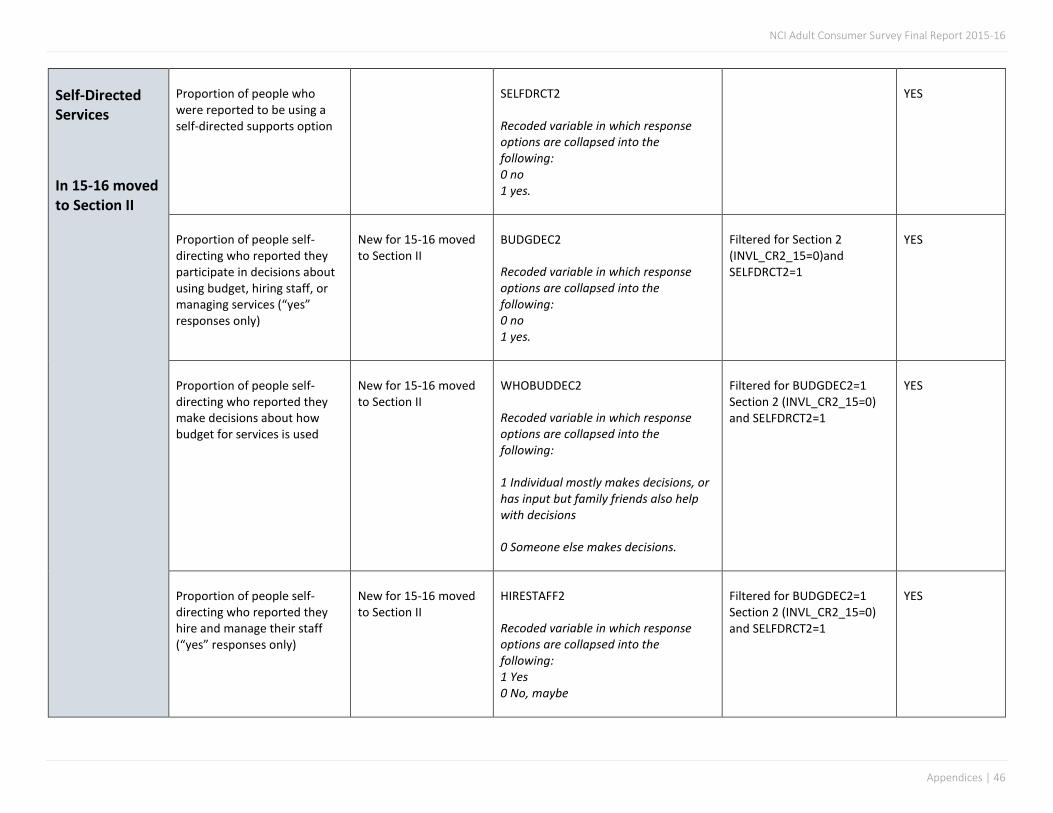
Self-Directed Services
In 15-16 moved to Section II
Proportion of people who were reported to be using a self-directed supports option
SELFDRCT2
Recoded variable in which response options are collapsed into the following: 0 no 1 yes.
YES
Proportion of people self-directing who reported they participate in decisions about using budget, hiring staff, or managing services (“yes” responses only)
New for 15-16 moved to Section II
BUDGDEC2
Recoded variable in which response options are collapsed into the following: 0 no 1 yes.
Filtered for Section 2 (INVL_CR2_15=0)and SELFDRCT2=1
YES
Proportion of people self-directing who reported they make decisions about how budget for services is used
New for 15-16 moved to Section II
WHOBUDDEC2
Recoded variable in which response options are collapsed into the following:
1 Individual mostly makes decisions, or has input but family friends also help with decisions
0 Someone else makes decisions.
Filtered for BUDGDEC2=1 Section 2 (INVL_CR2_15=0) and SELFDRCT2=1
YES
Proportion of people self-directing who reported they hire and manage their staff (“yes” responses only)
New for 15-16 moved to Section II
HIRESTAFF2
Recoded variable in which response options are collapsed into the following: 1 Yes 0 No, maybe
Filtered for BUDGDEC2=1 Section 2 (INVL_CR2_15=0) and SELFDRCT2=1
YES

NCI Adult Consumer Survey Final Report 2015-16
Appendices | 47
Proportion of people self-directing who reported they have enough help deciding how to use their budget/services (“yes” responses only)
New for 15-16 moved to Section II
ENUFHELP2
Recoded variable in which response options are collapsed into the following: 1 Yes, have enough help 0 No, want more help or maybe, not sure.
Filtered for BUDGDEC2=1 Section 2 (INVL_CR2_15=0) and SELFDRCT2=1
YES
Proportion of people self-directing who reported they receive information about money that’s left in budget (“yes” responses only)
New for 15-16 moved to Section II
ENUFINFO2
Recoded variable in which response options are collapsed into the following: 1 Yes 0 No, maybe, not sure.
Filtered for BUDGDEC2=1 Section 2 (INVL_CR2_15=0) and SELFDRCT2=1
YES
Proportion of people self-directing who report they get enough information about their budget/services and information is easy to understand (“yes” responses only)
New for 15-16 moved to Section II
INFOUNDERST2
Recoded variable in which response options are collapsed into the following: 1 Yes 0 No, maybe, not sure.
Filtered for BUDGDEC2=1 Section 2 (INVL_CR2_15=0) and SELFDRCT2=1 and ENUFINFO15=2 or ENUFINFO15=3
YES
Community Inclusion, Participation and Leisure (new name 15-16)
Proportion of people who report being able to go out and do the things they like to do (yes responses only)
New in 15-16 GOOUT2
Recoded variable in which response options are collapsed into the following: 0 No, in-between 1 yes.
Filtered for Section I (INVL_CR1_15=0)
YES
Proportion of people who report being able to go out and do the things they like to do enough (yes responses only)
New in 15-16 GOOUTENOUGH2
Recoded variable in which response options are collapsed into the following: 0 No 1 Yes.
Filtered for Section I (INVL_CR1_15=0)
YES

NCI Adult Consumer Survey Final Report 2015-16
Appendices | 48
Proportion of people who report that they have enough things to do at home (yes only)
New in 15-16 HOMETODO2 Recoded variable in which response options are collapsed into the following:
0 Not enough, in the middle 1 Yes
Filtered for Section I (INVL_CR1_15=0)
YES
Proportion of people who reported going shopping at least once in the past month
Changed for 15-16 SHOPPING15_2
Recoded variable in which response options are collapsed into the following: 0 no, 0 times 1 at least once in past month.
Filtered for Section II (INVL_CR2_15=0)
YES
Number of times people reported they went out shopping in the past month (Adjusted Variable)
No longer in report 15-16
Proportion of people who reported going on errands at least once in the past month
Changed for 15-16 ERRANDS15_2
Recoded variable in which response options are collapsed into the following: 0 no, 0 times 1 at least once in past month.
Filtered for Section II (INVL_CR2_15=0)
YES
Number of times people reported they went out on errands in the past month (Adjusted Variable)
NCI Adult Consumer Survey Final Report 2015-16
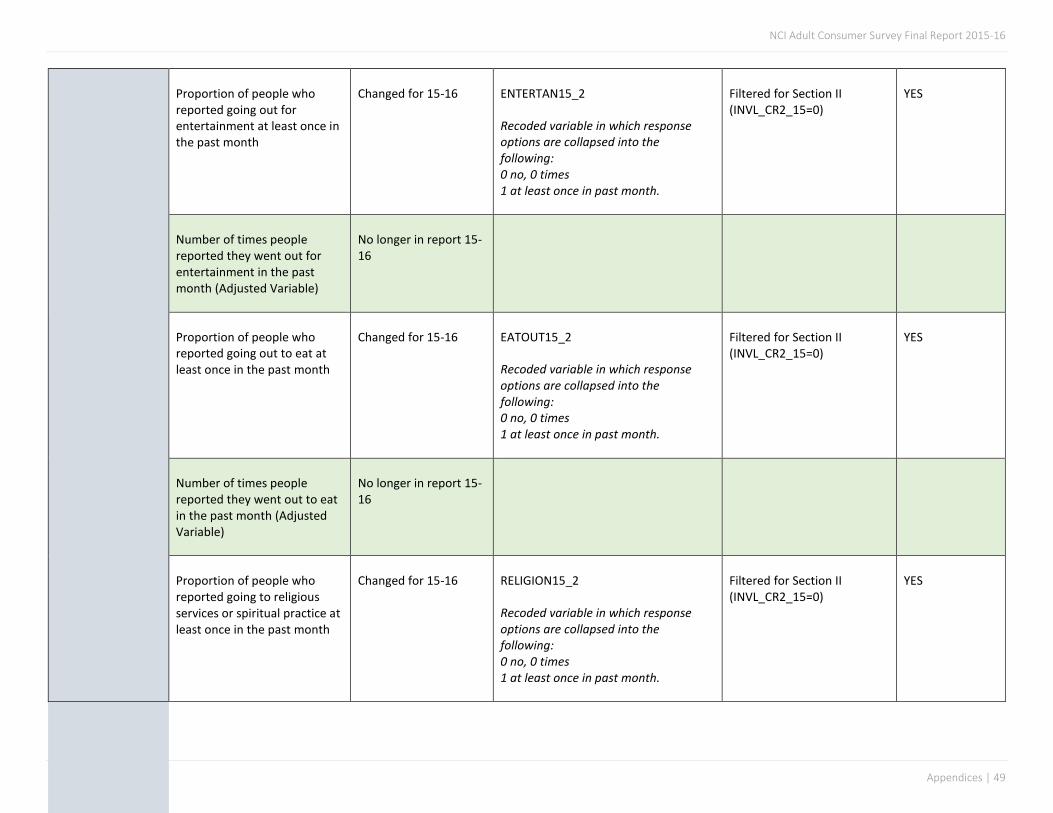
Appendices | 49
Proportion of people who reported going out for entertainment at least once in the past month
Changed for 15-16 ENTERTAN15_2
Recoded variable in which response options are collapsed into the following: 0 no, 0 times 1 at least once in past month.
Filtered for Section II (INVL_CR2_15=0)
YES
Number of times people reported they went out for entertainment in the past month (Adjusted Variable)
No longer in report 15-16
Proportion of people who reported going out to eat at least once in the past month
Changed for 15-16 EATOUT15_2
Recoded variable in which response options are collapsed into the following: 0 no, 0 times 1 at least once in past month.
Filtered for Section II (INVL_CR2_15=0)
YES
Number of times people reported they went out to eat in the past month (Adjusted Variable)
No longer in report 15-16
Proportion of people who reported going to religious services or spiritual practice at least once in the past month
Changed for 15-16 RELIGION15_2
Recoded variable in which response options are collapsed into the following: 0 no, 0 times 1 at least once in past month.
Filtered for Section II (INVL_CR2_15=0)
YES

NCI Adult Consumer Survey Final Report 2015-16
Appendices | 50
Number of times people reported they went out to religious services in the past month (Adjusted Variable)
No longer in report 15-16
In the past month, did you (did this person) go out for exercise?
No longer in report 15-16
Number of times people reported they went out for exercise in the past month (Adjusted Variable)
No longer in report 15-16
Proportion of people who reported participating in community groups (yes response only)
New 15-16 Commact2
Recoded variable in which response options are collapsed into the following: 0 no 1 yes
Filtered for Section II (INVL_CR2_15=0)
YES
Proportion of people who reported having gone on vacation in the past year (yes only)
VACATION2
Recoded variable in which response options are collapsed into the following: 0 no 1 yes
Filtered for Section II (INVL_CR2_15=0)
YES
Number of times people reported they went on vacation in the past year (Adjusted Variable)
No longer in report 15-16

NCI Adult Consumer Survey Final Report 2015-16
Appendices | 51
Relationships Proportion of people who reported they have friends who are not staff or family members (“yes, not staff or family” only)
HASFRNDS2
Recoded variable in which response options are collapsed into the following: 0 no, only staff or family 1 yes, not staff or family.
Filtered for Section I (INVL_CR1_15=0)
YES
Proportion of people who reported they have a best friend (may be staff or family)
No longer in survey 15-16
Proportion of people who reported they have family they see and the support needed to see their family when they want to (“yes” responses only)
SEEFAMLY2
Recoded variable in which response options are collapsed into the following:
0 no, sometimes 1 yes, whenever wants to, or chooses not to see family.
Filtered for Section I (INVL_CR1_15=0)
YES
Proportion of people who reported they have friends (may be staff or family) and the support needed to see their friends when they want to (“yes” responses only)
SEEFRNDS2
Recoded variable in which response options are collapsed into the following: 0 No, often unable to see friends, sometimes cannot see friends when wants 1 Yes.
Filtered for Section I (INVL_CR1_15=0)
YES

NCI Adult Consumer Survey Final Report 2015-16
Appendices | 52
Proportion of people who want more help to keep in contact with friends
New 15-16 FRNDSHELP2
Recoded variable in which response options are collapsed into the following: 0 No, 1 Yes, maybe.
Filtered for Section I (INVL_CR1_15=0)
YES
Reasons why can’t see friends New 15-16 WHYSEEFRNDS15 Filtered for Section I (INVL_CR1_15=0)
Proportion of people who reported they had other ways of communicating with friends (yes, but not often and yes, often responses)
New 15-16 FRNDSCOMM2
Recoded variable in which response options are collapsed into the following: 0 No, Sometimes 1 Yes
Filtered for Section I (INVL_CR1_15=0)
YES
Proportion of people who reported they talk with their neighbors (yes, but not often and yes, often responses)
Not in survey 15-16
Proportion of people who reported they can go on a date if they want to or can date with some restriction (“yes, can date” responses)
15-16 Analyzed only the proportion of people who reported: “yes, or is married living with partner”
CANDATE2
Recoded variable in which response options are collapsed into the following: 0 No, Yes but with restrictions 1 Yes or is married living with partner
Filtered for Section I (INVL_CR1_15=0)
YES
Proportion of people who reported they feel lonely at least half the time (“often” responses)
15-16 Analyzed only the proportion of people who say OFTEN
LONELY2_15
Recoded variable in which response options are collapsed into the following: 0 no, not often, or sometimes 1 yes, often.
Filtered for Section I (INVL_CR1_15=0)
YES

NCI Adult Consumer Survey Final Report 2015-16
Appendices | 53
Proportion of people who reported they can help other people if they want to at least some of the time (“yes” responses only)
Not in survey 15-16
Satisfaction Proportion of people who reported they like their home (“yes” responses only)
LIKEHOME2
Recoded variable in which response options are collapsed into the following: 0 no, in-between 1 yes.
Filtered for Section I (INVL_CR1_15=0)
YES
Proportion of people who report disliking where they live for reasons indicated.
New 15-16 DON’TLIKE15_1 DON’TLIKE15_2 DON’TLIKE15_3 DON’TLIKE15_4 DON’TLIKE15_5 DON’TLIKE15_6 DON’TLIKE15_7 DON’TLIKE15_10 DON’TLIKE15_11 DON’TLIKE15_99
Filtered for Section I (INVL_CR1_15=0)
Proportion of people who reported they would like to live somewhere else (“yes” responses only)
HOMEELSE2
Recoded variable in which response options are collapsed into the following: 0 no, in-between 1 yes.
Filtered for Section I (INVL_CR1_15=0)
YES

NCI Adult Consumer Survey Final Report 2015-16
Appendices | 54
Proportion of people who were reported to have a job in the community and who reported they like where they work (“yes” responses only) * * reported for those who were determined to have a paid community job from Background section
LIKEJOB2
Recoded variable in which response options are collapsed into the following: 0 no, in-between 1 yes.
Filtered for Section I (INVL_CR1_15=0) and for PAIDCOMMJOB2=1
YES
Proportion of people who were reported to have a job in the community and who reported they want to work somewhere else*(“yes” responses only) * reported for those who were determined to have a paid community job from Background section
JOBELSE2
Recoded variable in which response options are collapsed into the following: 0 no, in-between 1 yes.
Filtered for Section I (INVL_CR1_15=0) and for PAIDCOMMJOB2=1
YES
Proportion of people who reported they attend a day program or activity and like their day program or activity (“yes” responses only)
Not in 15-16 survey
Proportion of people who reported they attend a day program or activity and want to go or do something different during the day (“yes” responses only)
Not in 15-16 survey

NCI Adult Consumer Survey Final Report 2015-16
Appendices | 55
Proportion of people who reported that they want to go to their day program less (“less” responses only)
New 15-16 LESSDAYACT2
Recoded variable in which response options are collapsed into the following: 0 more, same 1 less.
Filtered for Section I (INVL_CR1_15=0) and havedayact2=1
YES
Proportion of people who reported that services and supports were helping them live a good life (“yes” responses only)
New 15-16 GOODLIFE2
Recoded variable in which response options are collapsed into the following: 0 No, in between 1 Yes.
Filtered for Section I (INVL_CR1_15=0)
YES
Proportion of people who reported they met their service coordinator/case manager (“yes” responses only)
KNOWSCM082
Recoded variable in which response options are collapsed into the following: 0 maybe, no 1 yes.
Filtered for Section I (INVL_CR1_15=0)
YES
Service Coordination
Proportion of people who reported their service coordinator/case manager asks them what they want (“yes” responses only)
ASKIMPOR2
Recoded variable in which response options are collapsed into the following: 0 sometimes, no 1 yes.
Filtered for Section I (INVL_CR1_15=0)
YES
Proportion of people who reported their service coordinator/case manager
Not in survey 15-16

NCI Adult Consumer Survey Final Report 2015-16
Appendices | 56
helps them get what they need (“yes” responses only)
Proportion of people who reported their service coordinator/case manager gets them back right away (”yes” responses only)
Question wording changed 15-16
GETSBACK2
Recoded variable in which response options are collapsed into the following: 0 No, sometimes 1 Yes.
Filtered for Section I (INVL_CR1_15=0)
YES
Proportion of people who reported taking part in the last service planning meeting (“yes” responses only)
New in 15-16 MSPLAN2
Recoded variable in which response options are collapsed into the following: 0 No 1 Yes, or had option but chose not to.
Filtered for Section I (INVL_CR1_15=0)
YES
Proportion of people who reported that they understood what was discussed in last service planning meeting (“yes” responses only)
New in 15-16 PLANUNDRSTND2
Recoded variable in which response options are collapsed into the following: 0 No, in-between 1 Yes.
Filtered for Section I (INVL_CR1_15=0)
YES
Proportion of people who reported that service planning meeting included people the person wanted to be there (“yes” responses only)
New in 15-16 PLANPEOPLE2
Recoded variable in which response options are collapsed into the following: 0 No, in-between 1 Yes.
Filtered for Section I (INVL_CR1_15=0)
YES

NCI Adult Consumer Survey Final Report 2015-16
Appendices | 57
Proportion of people who reported that they were able to choose the services that were received as part of service plan (“yes” responses only)
New in 15-16 PLANCHOOSE2
Recoded variable in which response options are collapsed into the following:
0 No, had some input 1 Yes
Filtered for Section I (INVL_CR1_15=0)
YES
Proportion of people who reported support workers come and leave when they are supposed to (“yes” responses only)
SWORKCOME2
Recoded variable in which response options are collapsed into the following: 0 No, maybe not sure 1 Yes.
Filtered for Section I (INVL_CR1_15=0)
YES
Proportion of people who reported they get the help they need to work out problems they have with their support workers (“yes” responses only)
Not in survey 15-16
Proportion of people who reported they helped make their service plan (“yes” responses only)
Not in survey 15-16
Proportion of people who reported they always they have a way to get places when they need to go somewhere (“yes” responses only)
TRANSPORT2
Recoded variable in which response options are collapsed into the following: 0 No almost never, sometimes 1 Yes, almost always.
Filtered for Section I (INVL_CR1_15=0)
YES
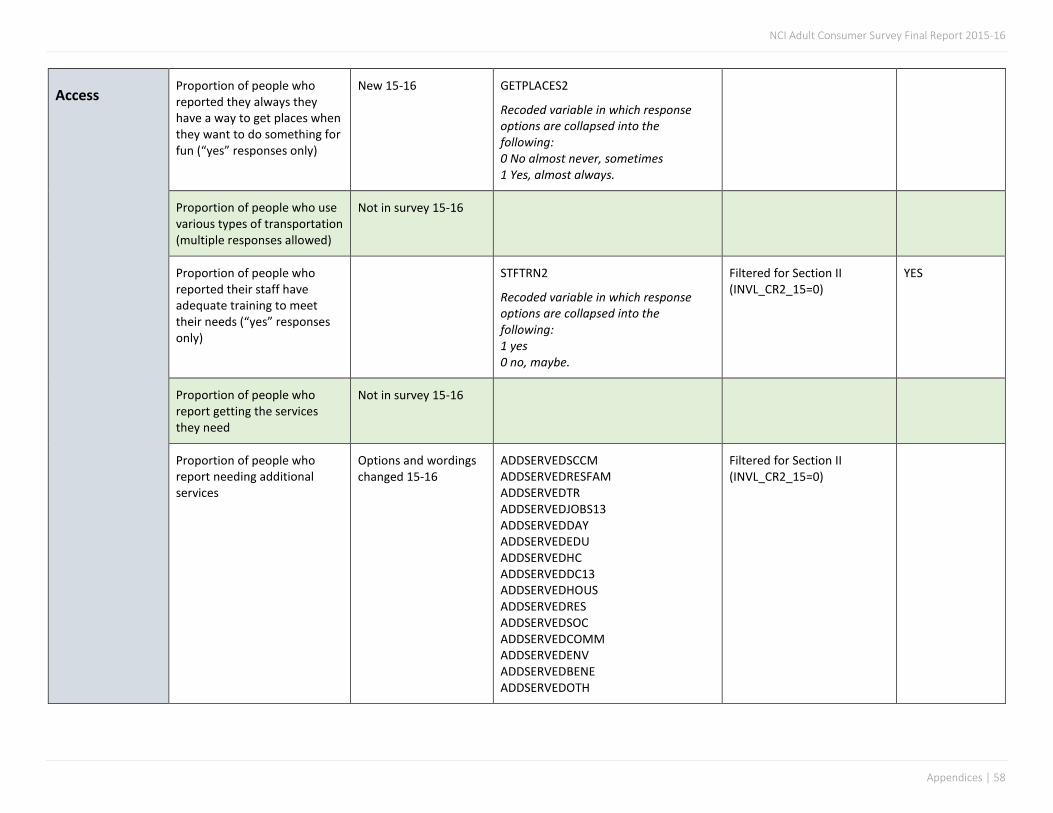
NCI Adult Consumer Survey Final Report 2015-16
Appendices | 58
Access Proportion of people who reported they always they have a way to get places when they want to do something for fun (“yes” responses only)
New 15-16 GETPLACES2
Recoded variable in which response options are collapsed into the following: 0 No almost never, sometimes 1 Yes, almost always.
Proportion of people who use various types of transportation (multiple responses allowed)
Not in survey 15-16
Proportion of people who reported their staff have adequate training to meet their needs (“yes” responses only)
STFTRN2
Recoded variable in which response options are collapsed into the following: 1 yes 0 no, maybe.
Filtered for Section II (INVL_CR2_15=0)
YES
Proportion of people who report getting the services they need
Not in survey 15-16
Proportion of people who report needing additional services
Options and wordings changed 15-16
ADDSERVEDSCCM ADDSERVEDRESFAM ADDSERVEDTR ADDSERVEDJOBS13 ADDSERVEDDAY ADDSERVEDEDU ADDSERVEDHC ADDSERVEDDC13 ADDSERVEDHOUS ADDSERVEDRES ADDSERVEDSOC ADDSERVEDCOMM ADDSERVEDENV ADDSERVEDBENE ADDSERVEDOTH
Filtered for Section II (INVL_CR2_15=0)

NCI Adult Consumer Survey Final Report 2015-16
Appendices | 59
Health Proportion of people who were reported to have a primary care practioner
PRIMDOC2_woDK
Removes DK responses and Recoded variable in which response options are collapsed into the following: 0 doesnt have a primary doc 1 has a primary doc.
YES
Proportion of people who were reported to be in poor health (“poor health” response only)
Health_poor
Recoded variable in which 0 excellent or very good or fairly good 1 poor
INVL_CR2_15=0 YES
Proportion of people who were reported to have had a complete physical exam in the past year (“within the past year” responses)
physexam2
Recoded variable in which response options are collapsed into the following: 0 not in past year 1 in past year.
WI MS not included in 15-16 YES
Proportion of people who were reported to have had a dental exam in the past year (“within the past year” or “within the past six months” responses)
dentvis2
Recoded variable in which response options are collapsed into the following: 0 not in past year 1 in past year.
WI not included for 15-16 YES

NCI Adult Consumer Survey Final Report 2015-16
Appendices | 60
Proportion of people who were reported to have had an eye exam in the past year (“within the past year” responses)
EYEEXAM2
Recoded variable in which response options are collapsed into the following: 0 not in past year 1 in past year.
WI not included for 15-16 YES
Proportion of people who were reported to have had a hearing test in the past five years (“within the past five years” responses)
HEARTEST2
Recoded variable in which response options are collapsed into the following: 0 not in the past 5 years 1 hearing test in the past 5 years.
WI not included for 15-16 YES
Proportion of women who were reported to have had a Pap test in the past three years (“within the past three years” or less responses)
PAPTEST2
Recoded variable in which response options are collapsed into the following:
0 more than 3 years 1 in past 3 years.
Filtered for GENDER=2
WI not included for 15-16
YES
Proportion of women over 40 who were reported to have had a mammogram test in the past two years (“within the past two years” or “within past year” responses)
MAMMO2
Recoded variable in which response options are collapsed into the following: 1 in last 2 years 0 more than 2 years.
Filtered for GENDER=2 and AGE>=40
WI DC not included for 15-16
YES

NCI Adult Consumer Survey Final Report 2015-16
Appendices | 61
Proportion of people 50 or over who were reported to have had a colorectal cancer screening in the past year (“within the past year” responses)
CCSCREEN2
Recoded variable in which response options are collapsed into the following: 1 in past year 0 more than 1 year.
Filtered for AGE>=50
AZ DC WI not included 15-16
YES
Proportion of people who were reported to have had a flu vaccine in the past year (“within the past year “responses)
FLUVACC2
Recoded variable in which response options are collapsed into the following: 0 not in the past year 1 flu vaccine in the past year.
WI not included in 15-16 YES
Proportion of people who were reported to have had a pneumonia vaccine
Not in 15-16
Proportion of people who take at least one med for mood disorder, anxiety, psychotic disorder, behavioral challenges
Totmeds
Recoded variable using MEDS15 and MEDBEHAV 0 No meds 1 At least one kind.
WI not included 15-16 YES
Proportion of people who were reported to take medication for at least one of the following: mood disorders, anxiety, psychotic disorders**
meds_mood
Recoded variable in which response options are collapsed into the following: 0 No meds for mood, anxiety, psychotic 1 Takes meds for mood, anxiety, psychotic.
WI not included 15-16 YES

NCI Adult Consumer Survey Final Report 2015-16
Appendices | 62
Wellness Number of meds taken for at least one of the following: mood disorders, anxiety, psychotic disorders
NUMMEDS WI not included 15-16
Proportion of people who were reported to take medication for behavior challenges**
meds_behav
Recoded variable in which response options are collapsed into the following: 0 No meds for behavior challenges 1 Takes meds for behavior challenges.
WI not included 15-16 YES
Number of meds taken for behavior challenges
NUMBEMEDS WI not included 15-16
Proportion of people who were reported to engage in regular physical activity at least sometimes
Moved to section II for 15-16.
PhysAct_yes
Recoded variable in which response options are collapsed into the following: 1 yes, regularly at least 3 times per week or sometimes 1 or 2 times per week 0 no.
Filtered for Section II (INVL_CR2_15=0)
YES

NCI Adult Consumer Survey Final Report 2015-16
Appendices | 63
Proportion of people in each BMI category
BMI_categ
BMI variable created using formula:
BMI=(Weight/(height in inches*height in inches))*703
Creates categories for BMI
1 underweight 2 normal 3 overweight 4 obese.
WI not included 15-16
Proportion of people who were reported to chew or smoke tobacco**
TOBACCO2
Recoded variable in which response options are collapsed into the following: 0 no 1 uses tobacco products.
WI is N/A for 15-16 YES
Proportion of people reported to have a behavior plan
New 15-16 BehPlan_yes
Recoded variable in which response options are collapsed into the following: 0 No 1 Yes.
WI MN is N/A for 15-16 YES
Proportion of people who take meds for behavior challenges who have a behavior plan
New 15-16 BehPlan_yes
Recoded variable in which response options are collapsed into the following:
Filtered for meds_behav=1 YES

NCI Adult Consumer Survey Final Report 2015-16
Appendices | 64
0 No 1 Yes.
Rights and Respect
Proportion of people who reported people always knock before entering home (“yes” responses only)
ENTERHM2
Recoded variable in which response options are collapsed into the following: 1 yes 0 sometimes, no.
Filtered for Section I (INVL_CR1_15=0)
YES
Proportion of people who reported people always knock before entering bedroom (“yes” responses only)
ENTERBRM2
Recoded variable in which response options are collapsed into the following: 1 yes 0 sometimes, no.
Filtered for Section I (INVL_CR1_15=0)
YES

NCI Adult Consumer Survey Final Report 2015-16
Appendices | 65
Proportion of people who reported they could be alone at home with visitors (“yes” responses only)
Moved to Section I in 15-16
ALONEGST2
Recoded variable in which response options are collapsed into the following: 1 yes 0 no.
Filtered for Section 1 (INVL_CR1_15=0)
YES
Proportion of people who reported they have enough privacy at home
BEALONE2
Recoded variable in which response options are collapsed into the following: 1 yes 0 no.
Filtered for Section I (INVL_CR1_15=0)
YES
Proportion of people who reported people never read their mail without permission (“no” responses only)
Moved to Section I in 15-16
MAILOPEN2
Recoded variable in which response options are collapsed into the following: 1 yes 0 no.
Filtered for Section 1 (INVL_CR1_15=0)
YES
Proportion of people who reported they can use phone and internet without restriction (“yes without restriction” response only)
Moved to Section I in 15-16
USEPHONE2
Recoded variable in which response options are collapsed into the following: 1 yes 0 no.
Filtered for Section 1 (INVL_CR1_15=0)
YES

NCI Adult Consumer Survey Final Report 2015-16
Appendices | 66
Proportion of people who have a place to be alone (can have time to self) (“yes” responses only)
New 15-16 BEALONE2
Recoded variable in which response options are collapsed into the following: 1 yes 0 no.
Filtered for Section 1 (INVL_CR1_15=0)
YES
Proportion of people who reported their staff treat them with respect (“yes” responses only)
Wording changed 15-16
STAF2
Recoded variable in which response options are collapsed into the following: 1 yes 0 no, sometimes, some staff.
Filtered for Section I (INVL_CR1_15=0)
YES
Proportion of people who reported they have attended a self-advocacy event, or chose not to (“yes” and “chose not to” responses)
SELFADVO2
Recoded variable in which response options are collapsed into the following: 0 no 1 had opportunity, yes.
Filtered for Section II (INVL_CR2_15=0)
YES
Proportion of people who report having a key to their home (“yes” responses only)
New 15-16 KEY2
Recoded variable in which response options are collapsed into the following: 1 Yes 0 No, maybe not sure.
Filtered for Section II (INVL_CR2_15=0)
YES

NCI Adult Consumer Survey Final Report 2015-16
Appendices | 67
Proportion of people who report they can lock their bedroom (“yes” responses only)
New 15-16 LOCK2
Recoded variable in which response options are collapsed into the following: 1 Yes 0 No, maybe not sure.
Filtered for Section II (INVL_CR2_15=0)
YES
Proportion of people who report having voted (“yes” and “had opportunity” only)
New 15-16 VOTE2
Recoded variable in which response options are collapsed into the following: 1 Yes or had opportunity to register to vote but chose not to 0 No.
Filtered for Section II (INVL_CR2_15=0)
YES
Proportion of people who report that there are rules about having friends or visitors (“yes” responses only)
New 15-16 VISITRULES2
Recoded variable in which response options are collapsed into the following: 0 No 1 Yes
Filtered for Section I (INVL_CR1_15=0)
YES
Proportion of people who reported they never feel scared or afraid in their home** (no responses only)
Not in 15-16 survey
Proportion of people who reported they never feel scared or afraid in their neighborhood** (“no” responses only)
Not in 15-16 survey

NCI Adult Consumer Survey Final Report 2015-16
Appendices | 68
Proportion of people who reported they never feel scared or afraid at their work or day program/regular activity** (“no” responses only)
Not in 15-16 survey
Safety Proportion of people who report that there is at least one place where s/he feels afraid.
New 15-16 Afraid_yes
Recoded variable in which response options are collapsed into the following: 0 No 1 Yes, either in home, day program, work, community, transport, or other.
Filtered for Section I (INVL_CR1_15=0)
YES
Proportion of people who reported they have someone to go to for help if they feel scared (“yes” responses only)
AFRAIDHELP2
Recoded variable in which response options are collapsed into the following: 0 no, maybe 1 yes.
Filtered for Section I (INVL_CR1_15=0)
YES

NCI Adult Consumer Survey Final Report 2015-16
Appendices | 69
Appendix C Sampling Procedures
SAMPLING AS REPORTED IN 2015-16 STATE WORK PLANS
Sampling Description Included Programs Total
Population in
program
(eligible for
ACS)
Excluded Programs
AL Random sample from ~ 5,500 people
receiving services through the ID and LAH
Home and Community Based Services
waivers. In addition, a selected sample of
30 individuals who have participated in a
statewide planning pilot using Personal
Outcome Measures (CQL) as the
foundation for person-centered planning.
LAH 1915(c) Persons receiving supports and
services in their own home or family home.
569 Non-waiver
population
ID 1915(c) Persons receiving supports and services
through contracted residential providers
5,260
AR Stratified random sampling methodology
(sample based on CM Provider.)
1915 HCB WAIVER (There are about 100 programs-
including residential and non-residential)
4,000+

NCI Adult Consumer Survey Final Report 2015-16
Appendices | 70
Each CM provider has at least 1 case
selected. (There are ~ 100 providers)
ICF sample is pulled random sample. ICF
system is separate.
ICF-ID 960
AZ Random pull from total service population Long Term Care (LTC) 1115 Waiver 28,070
Non-LTC State only 7,000
CO Colorado is using a stratified random
sample of all adults 18 and over enrolled
in the Developmental Disabilities Waiver,
the Supported Living Services Waiver, or
receiving Supported Living Services
through state funding, who receive at
least one service in addition to case
management. The sample will be
stratified by the data team at HCPF based
on the total number of clients served by
each of 21 agencies.
HCBS-DD 1915 (c): All adults age 18 and over,
enrolled in HCBS-DD who receive at least one
service other than case management.
3,247
HCBS-SLS 1915 (c): All adults age 18 and over,
enrolled in HCBS-SLS who receive at least one
service other than case management.
2,769
State-SLS State General Fund: All adults age 18 and
over, enrolled in State-SLS who receive at least one
service other than case management.
642
CT CT DDS does a random sample pull from
all individuals meeting the criteria of age
18 or over as of July 1, 2015 and receiving
at least one funded service in addition to
Case Management.
DDS Waiver Population HCBS 1915(c) Individuals in
one of the four HCBS adult waivers DDS Manages
including people in the Autism Waiver
9,869 People without case
managers

NCI Adult Consumer Survey Final Report 2015-16
Appendices | 71
All individuals meeting these criteria are
pulled from CT central database (CAMRIS);
the state then uses Excel to assign each a
random number. The records are then
sorted by that random number and the
first 2,400 are used as the randomly
selected survey participants, from which
CT tries to interview at least 400.
Non-Waivered DDS Funding Individuals who are
not enrolled in an HCBS waiver but are receiving at
least one funded service in addition to Case
Management
ICF are included.
DC Sample of people who receive service
coordination and at least one service.
People must also affirmatively consent to
participation in NCI.
HCBS Waiver: People who receive service
coordination and at least one service
~ 1,575 State Plan Only
Medicaid: People
who receive service
coordination and
state plan services
only
ICF-ID: People who receive service coordination
and live in an ICF.
~330
DE Sample was randomly pulled from list of
individuals receiving services from the
Delaware Division of Developmental
Disabilities. Sample included HCBS waiver
participants receiving case management
services and individuals receiving Family
Support Services, plus one other service
HCBS Waiver 1915(c): Adults age 21 and older who
are receiving residential support services through
the Home and Community Based Services Waiver.
1,106 HCBS receiving only
FSS supports funded
through HCBS
1915(c)
HCBS Waiver 1915(c): Adults age 21 and older who
live at home and receive Family Support Services
(FSS) AND participate in a Day Program funded
through the HCBS.
ICF (4 people
remain)

NCI Adult Consumer Survey Final Report 2015-16
Appendices | 72
FL Stratified random sample taken from all
individuals age 18 and over receiving
services through the iBudget HCBS waiver.
Stratified by Support Coordinator (there
are 800-900) and sample up to two
individuals from each coordinator.
HCBS 1915(c) Waiver: Individuals with IDD
(primarily ID, Cerebral Palsy, Spina Bifida, Prader
Willi, and Autism)
~30,000 Non-waiver
population
GA Individuals receiving services through the
NOW and COMP Home and Community
Based Services or receiving State Funded
Services are included in the population. A
random sample of 480 individuals is
selected from the population, stratified by
region (regional samples are
proportionate to regional representation
in total population).
HCBS 1915(C) Federal IDD 13,000 Individuals who
received the NCI
interview within the
12 previous months
are excluded.
State Funded State Individuals age 18 and over
with IDD
1,760
HI A random sample was drawn from the
entire service population of adults over
age 18 who receive at least one waiver
service besides case management.
Developmental Disabilities Division HCBS 1915 (c)
ID/DD
2,354
IL A random sample of 400 adults selected
from the entire population of adults
participating in Illinois’ Adults with
Developmental Disabilities Waiver. The
Adult waiver HCBS 1915 19,774 State operated
developmental
centers funded by
ICF/ID

NCI Adult Consumer Survey Final Report 2015-16
Appendices | 73
selection of adults for the sample is
completed by the Information Services
department using a random number
generator to assign numbers to all
participants, placing the participants in
numerical order, and selecting the first
400 names that appear. In addition, an
additional 40 participants (numbers 401 –
440 on the randomly ordered list) have
been selected for use as substitutes in the
event that any of the original sample of
400 are unavailable or unwilling to
participate. If substitutes are needed,
they will be used in numerical order
beginning at 401.
ICF/DD ICF/ID
IN The actual sample size will vary
throughout the course of a year, as waiver
participation changes with additions and
departures from the waiver program. On
a quarterly basis, Indiana calibrates the
targeted sample size with actual waiver
participation numbers and adjusts the
sample size accordingly. The sample will
be stratified by waiver population (Family
Supports (FS) waiver, Community
Integration and Habilitation (CIH) waiver
Family Supports Waiver (FSW) HCBS 1915(c)
(capped waiver program).
10,613 Those selected for
prior NCI survey in
year prior from the
potential pool of
individuals Community Integration & Habilitation Waiver (CIH)
HCBS 1915(c) (uncapped waiver program).
8,455
Money Follows the Person-- Money Follows the
Person Rebalancing Demonstration Grant
99

NCI Adult Consumer Survey Final Report 2015-16
Appendices | 74
populations, Money Follows the Person
(MFP) waiver). Sample size for each
waiver will be determined using a 95%
confidence level and 5% margin of error
threshold (based on population as of July
1, 2015). Sample is also proportional
based on the total number of Individuals
who reside in each BDDS District. The
percentage of waiver participants by
waiver type residing in each BDDS District
shall be multiplied by the total number of
targeted surveys to establish a
proportioned sample population.
KS The KDADS Fiscal Department pulls a
random stratified sample of consumer
names that consist of only those
individuals who are on the IDD Waiver. KS
stratifies the NCI-DD by the 26 Community
Developmental Disability Organization
(CDDO). KS uses unduplicated eligibility
(DD=8,787 customers) to come up with a
percent for each CDDO. KS then uses that
percent to determine the strata.
IDD 1915 (c) waiver 8,787
KY Stratified random sample by funding type SCL 1915 (c) 4,279

NCI Adult Consumer Survey Final Report 2015-16
Appendices | 75
Michelle P 1915 (c) 4,577
State general funds 430
MFP 99
ICF/IID 368
LA Random sample of all adults, 18 years and
older, receiving developmental disability
services. This includes ICF/DD residents,
HCBS waiver recipients, and adults
receiving state-funded services. All names
are placed in a single file and a random
sample is selected.
New Opportunity, Children’s Choice, Residential
Options, and Support Waivers Medicaid, HCBS
waiver
10,426
Large & small, public & private ICF/DDs Medicaid,
ICF/DD
2,326
Individual & Family Support State funding 7,548
MA A random sample of all adults 22 and over
receiving at least one service since
November 2, 2015 in addition to service
coordination/ case management.
State fund and Waiver Participants Total
population numbers
19,197 ICF/ID
Autism Only—
eligibility just
changed. Small pool
and in starter stage.
Praeder Willi

NCI Adult Consumer Survey Final Report 2015-16
Appendices | 76
Psychiatric
admissions
Incarcerated
Homeless
If enrolled
exclusively in one of
the following;
--Day Habilitation -
Mass Health
--Transportation
--Assistive
Technology-
Contract
--Occupancy
--Stipends
--Financial
Assistance
--Financial
Assistance
Administration
--Assistive
Technology-
MassHealth

NCI Adult Consumer Survey Final Report 2015-16
Appendices | 77
--Financial
Assistance - AWC
ME Random selection of 1,000 consumers to
produce a final sample of 400 surveys.
Case management (Medicaid): Medicaid State Plan
Case Management is an entitlement for all persons
who qualify for developmental services. Case
management is not available to any other (adult)
population.
6,263
Person needs to receive one other service
in addition to Case Management services.
Sample selected from MaineCare DSS
database
MI Random sample of adults 18 and over. BHDDA enrollment: State/DDI funding source: 34,509
Medicaid and non-Medicaid individuals
receiving at least 3 services (service
outside of case management, assessment,
crisis and respite)
MN The population includes any adult 18
years or over noted in state records as a
person with developmental disabilities on
Home Care only, State Plan funded: 19,000
Waivers (DD, TBI, CADI, CAC) 1915c 34,500

NCI Adult Consumer Survey Final Report 2015-16
Appendices | 78
a DD, or a long-term care screening
document who also receives case
management and at least one long-term
service or support. This service could be a
State Plan, or state grant service, or a
service funded through a waiver.
Support Grants, State funded: 1,900
ICF/DD, state plan funded: 1,725
MO Random sample of the service population
of adults over 18, enrolled in the
Comprehensive Waiver, and receiving at
least one service besides case
management. Random sample is a
statistically valid sample based upon the
size of the total service population.
HCBS 1915(c) Comprehensive Waiver participants: 8,000 Support Wavier,
Autism Waiver,
Lopez Waiver, and
Partnership for Hope
Waiver HCBS
1915(c)
ICF/ID
DMH: General
Revenue, PAC, SB40,
etc.
MS A random sample of 1,200 adults in the
IDD Mississippi Medicaid Waiver MMIS
Database. These adults will be 21 years or
older, according to Mississippi’s definition
of an “adult.”
IDD Waiver 1915c: 2,002 1915i funded by
Medicaid
State Funded-Only
IDD

NCI Adult Consumer Survey Final Report 2015-16
Appendices | 79
Persons living in ICF-
IDD: funded through
Medicaid/CMH State
Funded
NC Random samples of adults 18 and over
who received at least one I/DD service
other than case management were
selected from within each of the State’s
Local Management Entity-Managed Care
Organization catchment areas and
Developmental Treatment Centers. LME-
MCO sample sizes were approximately
proportional to their percentages of the
state I/DD population served. Targeted
sampling within Developmental Centers
resulted in a final sample percentage of
individuals served in these settings
approximately three times the actual
percentage.
ICF/ID and HCBS 1915b, 1915 b/c, 1915 c waivers Approximately
20,000
NY Random sample of the entire service
population of adults over 18 receiving at
least one service besides case
management. The sample includes people
getting residential, day and family support
People receiving support through waivers and
ICF/IID funding are included
103,000 Those receiving
“light services”

NCI Adult Consumer Survey Final Report 2015-16
Appendices | 80
services as well as people who are self-
directing their services.
NV Using geographic stratification, 700
people will be included in sample pull.
Stratified by region
SC + SLA funded through Medicaid and State
general fund. Includes clients 18 years and over
who are receiving service coordination plus
supportive living arrangements.
1,453 Clients only
receiving service
coordination
SC + JDT funded through Medicaid and State
general fund. Includes clients 18 years and over
who are receiving service coordination plus jobs
and day training
1,592 ICF--consumers
housed in the 48
bed Intermediate
Care Facility.
OH The sample is pulled from the DODD data
warehouse. Anyone over age 18 who is
receiving at least one service in addition
to case management (Case management
and family support alone do not count as
services) administered by county board, or
lives in ICF, has the potential to be part of
the random sample.
1915 c waiver. Total number of people served: 35,000
ICF/ID, 6,000

NCI Adult Consumer Survey Final Report 2015-16
Appendices | 81
OK Representative random sample of 400 is
pulled from state database of all adults
receiving HCBS services in Oklahoma. -
In-Home Supports Waiver (IHSW); Community
Waiver (CW)—including individuals recently
transitioning from state-run institutions, individuals
receiving residential support, and individuals not
receiving residential supports; and Homeward
Bound Waiver (HBW)
5,102
PA PA uses a statewide random sample which
is not stratified across 48 counties and
county joinders. Individuals enrolled in
waiver, base, and private and public ICF/ID
funding are included in the sample.
Consolidated Waiver HCBS 1915(c) 17,088 People previously
surveyed the prior
year are not
included in sample. Person/Family Driven Supports (P/FDS) Waiver
HCBS 1915(c)
12,264
Base Funding (State) 12,620
ICFs/ID 2,913
RI Sample comes from Medicaid database.
Stratified by the 9 agencies under the
consent decree with percent of sample
based on agency size, and the remaining
agencies as a group
Adults served through BHDDH/DDD (Global Waiver
(1115))
Total population
of both
programs:
3,800
ICFs (managed by
Department of
Health)
State plan

NCI Adult Consumer Survey Final Report 2015-16
Appendices | 82
SC SCDDSN will use a random sample of all
adults 18 and over receiving at least one
service (in addition to case management).
The sample is drawn from the names
included in the QIO Quality Assurance
review of provider agencies. The QIO
includes representation from each agency
that is selected for review, but not each
agency is reviewed each calendar year.
Based on compliance scores. If they score
over 75% in QA review (largely based on
waiver reviews) they have 18-month
review, if less, annual. ~ 75%-80% of state
agencies are included in each NCI data
cycle
Residential Services: HCB Waiver
1915(c) and State Funded: Residential services in a
DDSN contracted residential setting. (The number
in the State funded category will be limited.)
10,980 ICFs
Day and Employment Services HCB Waiver
(1915(c)) and State Funded: Day and Employment
Services through a DDSN contracted provider. (The
number in the State funded category will be
limited.)
In-home supports: HCB Waiver
(1915(c)) and State Funded: In-home supports
through a DDSN contracted provider. (The number
in the State funded category will be limited.)
SD Sample stratified by program CHOICES HCBS 1915(c)
Adults who receive residential, day, employment,
and case management services from any of the 19
service providers in South Dakota.
2,600 Those that
participated in the
Adult Consumer
Survey the previous
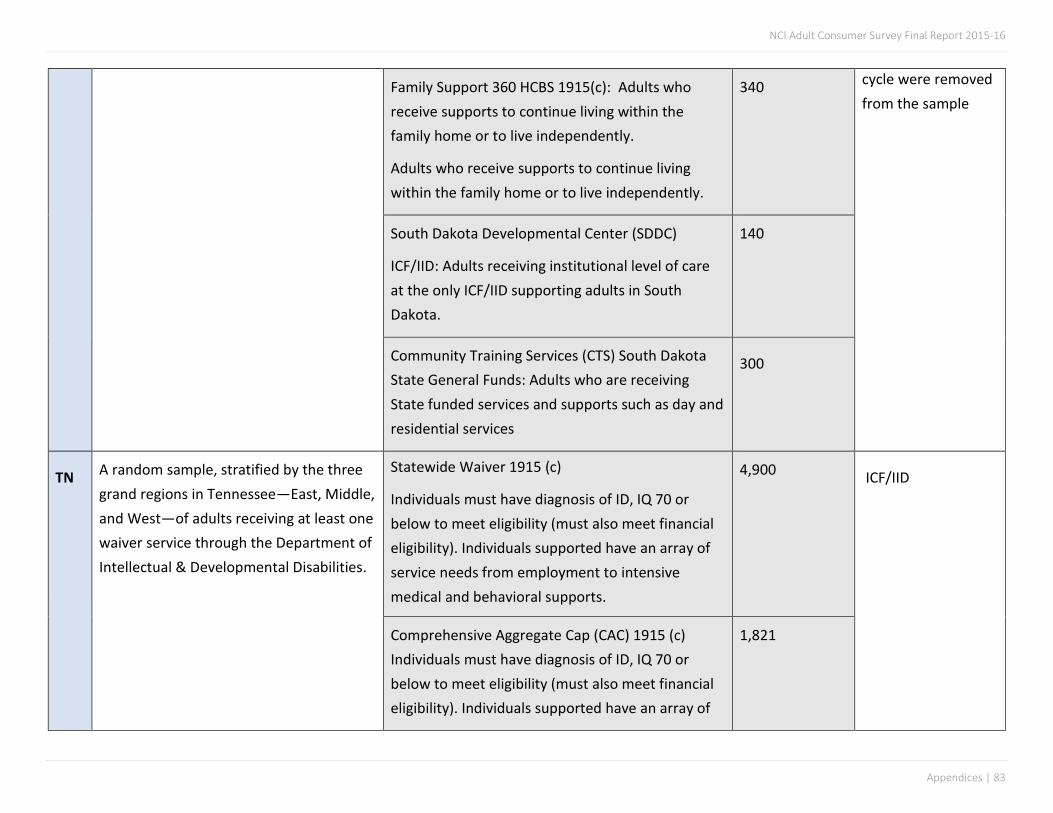
NCI Adult Consumer Survey Final Report 2015-16
Appendices | 83
Family Support 360 HCBS 1915(c): Adults who
receive supports to continue living within the
family home or to live independently.
Adults who receive supports to continue living
within the family home or to live independently.
340 cycle were removed
from the sample
South Dakota Developmental Center (SDDC)
ICF/IID: Adults receiving institutional level of care
at the only ICF/IID supporting adults in South
Dakota.
140
Community Training Services (CTS) South Dakota
State General Funds: Adults who are receiving
State funded services and supports such as day and
residential services
300
TN A random sample, stratified by the three
grand regions in Tennessee—East, Middle,
and West—of adults receiving at least one
waiver service through the Department of
Intellectual & Developmental Disabilities.
Statewide Waiver 1915 (c)
Individuals must have diagnosis of ID, IQ 70 or
below to meet eligibility (must also meet financial
eligibility). Individuals supported have an array of
service needs from employment to intensive
medical and behavioral supports.
4,900 ICF/IID
Comprehensive Aggregate Cap (CAC) 1915 (c)
Individuals must have diagnosis of ID, IQ 70 or
below to meet eligibility (must also meet financial
eligibility). Individuals supported have an array of
1,821
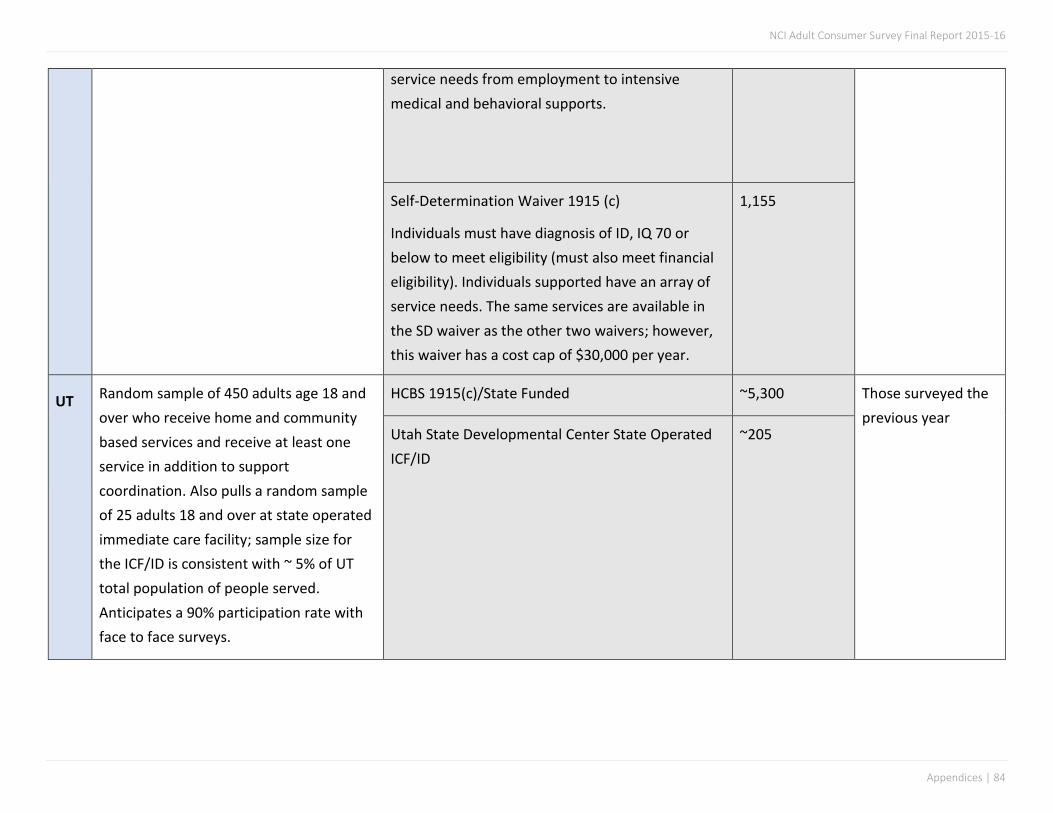
NCI Adult Consumer Survey Final Report 2015-16
Appendices | 84
service needs from employment to intensive
medical and behavioral supports.
Self-Determination Waiver 1915 (c)
Individuals must have diagnosis of ID, IQ 70 or
below to meet eligibility (must also meet financial
eligibility). Individuals supported have an array of
service needs. The same services are available in
the SD waiver as the other two waivers; however,
this waiver has a cost cap of $30,000 per year.
1,155
UT Random sample of 450 adults age 18 and
over who receive home and community
based services and receive at least one
service in addition to support
coordination. Also pulls a random sample
of 25 adults 18 and over at state operated
immediate care facility; sample size for
the ICF/ID is consistent with ~ 5% of UT
total population of people served.
Anticipates a 90% participation rate with
face to face surveys.
HCBS 1915(c)/State Funded ~5,300 Those surveyed the
previous year Utah State Developmental Center State Operated
ICF/ID
~205

NCI Adult Consumer Survey Final Report 2015-16
Appendices | 85
VA Medicaid waiver recipient data are
received from the Department of Medical
Assistance Services and sorted by zip
code. A birthdate cutoff is selected and all
people under age 18 are removed from
the dataset. All people are divided into
one of five health planning regions based
on their zip code.
Sample is proportional: the number of
people receiving services per region is
determined and used to calculate target
numbers for each health planning region.
Data is randomly sorted within the
appropriate health planning region. A
sample double the target number is then
selected to begin the data cycle.
ID Waiver C VA Intellectual Disability (ID) Waiver:
Provides day support, personal assistance,
prevocational, residential support, respite,
supported employment, consumer directed
services facilitation, assistive technology,
companion services, crisis stabilization, crisis
supervision, environmental mods, PERS, skilled
nursing, therapeutic consultation, transition for
individuals with ID
~10,116 EDCD 1915c
VA Elderly or
Disabled
w/Consumer
Direction
(0321.R03.00)
Provides adult day
health care,
personal assistance,
respite care,
consumer directed
services facilitation,

NCI Adult Consumer Survey Final Report 2015-16
Appendices | 86
DD Waiver 1915c VA Individual & Family DD
Support: Provides day support, in-home residential,
personal care, prevocational, respite care,
supported employment - group/individual, services
facilitation, adult companion, assistive technology,
crisis stabilization, crisis supervision, environmental
mods, family/caregiver training, PERS, skilled
nursing, therapeutic consultation, transition for
individuals w/autism and DD
~1,053 PERS, transition
coordination
DS Waiver 1915c VA Day Support HCBW for
Persons w/ID: Provides day support, prevocational,
supported employment for individuals w/ID ages 6
- no max age
~300
Community ICF/ID ICF/ID Intermediate Care
Facilities for Individuals with Intellectual Disability
(ICF/ID)
Provides comprehensive and individualized health
care and rehabilitation services to individuals to
promote their functional status and independence.
~481
Nursing Facility with Dx ICF - SNF ~850
State Training Center Residents ICF/ID Provides
comprehensive and individualized health care and
rehabilitation services to individuals to promote
their functional status and independence.
~480
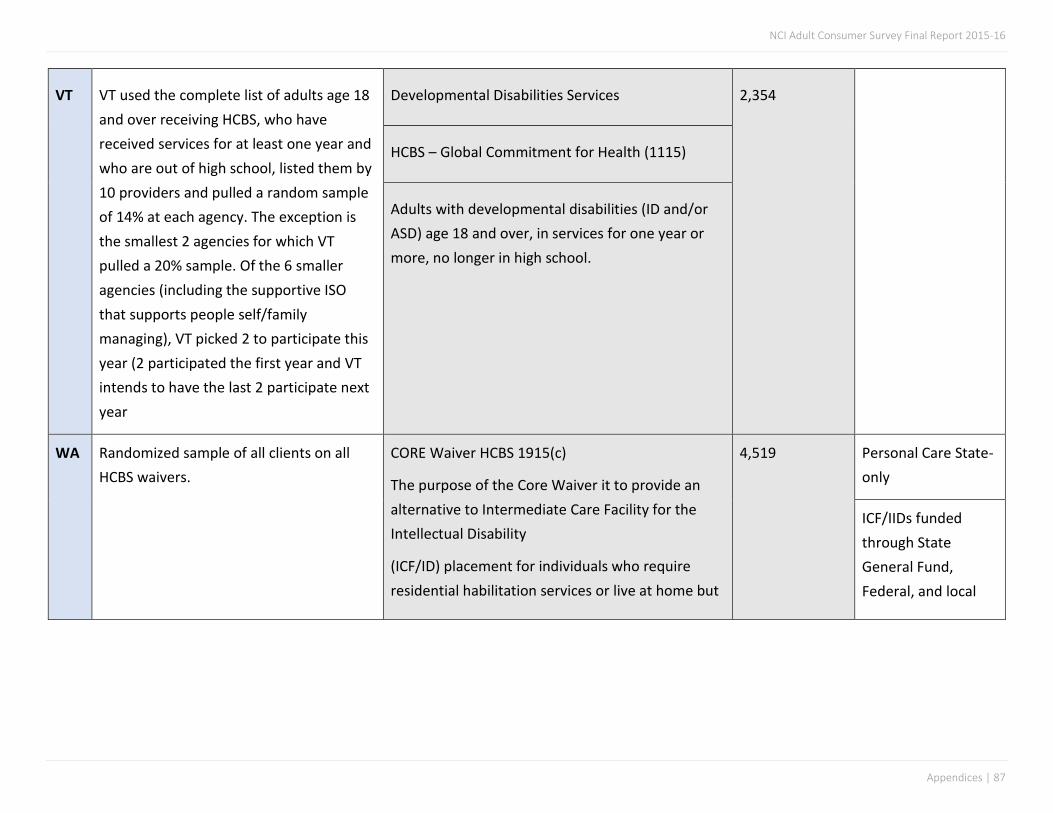
NCI Adult Consumer Survey Final Report 2015-16
Appendices | 87
VT VT used the complete list of adults age 18
and over receiving HCBS, who have
received services for at least one year and
who are out of high school, listed them by
10 providers and pulled a random sample
of 14% at each agency. The exception is
the smallest 2 agencies for which VT
pulled a 20% sample. Of the 6 smaller
agencies (including the supportive ISO
that supports people self/family
managing), VT picked 2 to participate this
year (2 participated the first year and VT
intends to have the last 2 participate next
year
Developmental Disabilities Services 2,354
HCBS – Global Commitment for Health (1115)
Adults with developmental disabilities (ID and/or
ASD) age 18 and over, in services for one year or
more, no longer in high school.
WA Randomized sample of all clients on all
HCBS waivers.
CORE Waiver HCBS 1915(c)
The purpose of the Core Waiver it to provide an
alternative to Intermediate Care Facility for the
Intellectual Disability
(ICF/ID) placement for individuals who require
residential habilitation services or live at home but
4,519 Personal Care State-
only
ICF/IIDs funded
through State
General Fund,
Federal, and local

NCI Adult Consumer Survey Final Report 2015-16
Appendices | 88
are at immediate risk of out of home placement
due to one or more of the following extraordinary
needs.
• The individual has extreme and frequently
occurring behavior challenges resulting in danger
to health or safety or
• Has had 18 or more days of inpatient psychiatric
care in the past 12 months or
• The individual lives in an ICF/ID and requests
community placement or
• The person requires daily to weekly one-on-one
support, supervision and 24-hour access to
trained others to meet basic health and safety
needs.
The Developmental
Disabilities
Administration
(DDA) operates four
Residential
Habilitation Centers
(RHCs). The RHCs
currently serve
around 850 people,
down from a census
of more than 4,000
people in the early
1960s. The census
varies as all facilities

NCI Adult Consumer Survey Final Report 2015-16
Appendices | 89
Community Protection HCBS 1915(c)
The purpose of the Community Protection Waiver
is to provide an alternative to ICF/ID placement for
individuals who:
• Are at least 18 years of age, and
• Meet the criteria for ICF/ID level of care, and
• Live or are moving into the community, and
• Require 24-hour, on-site, awake staff supervision
to ensure the safety of others, and
• Require therapies and other habilitation, and
• Are found by DDD to meet the criteria for an
“individual with community protection issues.”
426 will admit some
individuals for short-
term care,
treatment, or
assessment.
Individuals who
meet eligibility
requirements:
• Are enrolled and
eligible clients of
DDA;
• Are 18 years of age
or older;
• Meet Medicaid
eligibility and need
active treatment
as defined in the
Code of Federal
Regulations;
• Who have a
functional or
intellectual
disability that
requires ICF/ID
IFS Waiver HCBS 1915(c)
Services to individuals continuing to reside in their
family home.
This waiver went live June 1, 2015. The sample
was pulled before the waiver transition period. It
is unlikely that individuals receiving services
through this waiver will be included, but it is
possible that someone could transition to this
waiver during the survey cycle. Still in transition, no
count at this time.
In transition –
count
unavailable

NCI Adult Consumer Survey Final Report 2015-16
Appendices | 90
Basic Plus Waiver HCBS 1915(c) The goal of the
Basic Plus Waiver is to support individuals (who
require the level of care provided in an ICF/ID) who
choose to live in their community. This is
accomplished by coordination of natural supports,
community resources/services.
7,769 level of support
and supervision; or
• Need 24 hour per
day nursing level
of care
WI Wisconsin will sample Adult Waiver
participants. Generates random sample.
HCBS Adult Waivers
(Family Care, PACE/Partnership, IRIS, Legacy
Waivers Fed/State Adults with IDD/DD)
26,000 Children’s Waiver
(all children’s waiver
participants were
excluded from the
Adult Consumer
Survey)
Adult Waivers
Fed/State Physically
Disabled and Frail
Elders (does not
meet target group)
ICF/ID residents
whose care is paid

NCI Adult Consumer Survey Final Report 2015-16
Appendices | 91
by Fee for Service
Medicaid (managed
long-term care
enrollees in Family
Care and
Partnership may
reside in ICFs and
were not explicitly
excluded based on
setting).
WY In Wyoming, a participant is added to the
Adult Waivers at the age of 21. The
Division plans on oversampling adults,
randomly selecting 500 adults to sample.
HCBS 1915(c) Adults with developmental
disabilities (over the age of 21) and persons with
Acquired Brain Injuries.
1,793 ICF Will not be
surveyed

NCI Adult Consumer Survey Final Report 2015-16
Appendices | 92
Appendix D
Un-collapsed and unadjusted data by state

NCI Adult Consumer Survey Final Report 2015-16
Appendices | 93
Choice and Decision-Making (unadjusted and un-collapsed)
Table 1. Level of choice in where they live if not in the family home (proxy responses allowed)
State Person Chose Person Had Some Input Someone Else Chose N
AL 20% 30% 50% 233
AR 28% 21% 51% 267
AZ 37% 39% 24% 160
CO 20% 45% 35% 281
CT 19% 25% 55% 191
DC 13% 18% 69% 255
DE 17% 34% 50% 307
FL 36% 30% 34% 611
GA 38% 36% 27% 199
HI 19% 11% 70% 140
IL 18% 38% 43% 208
IN 44% 35% 22% 197
KS 30% 43% 27% 271
KY 21% 37% 42% 254
LA 24% 27% 49% 209
MA 18% 39% 43% 290
ME 28% 29% 44% 277
MI 19% 35% 46% 259
MN 19% 37% 44% 245
MO 19% 28% 53% 335
MS 32% 24% 43% 196
NC 14% 32% 53% 423
NV 32% 30% 38% 320
NY 20% 26% 54% 314
OH 25% 29% 47% 306
OK 20% 19% 60% 263
PA 31% 25% 45% 321
RI 27% 32% 41% 294
SD 33% 34% 32% 293
TN 19% 42% 39% 299
UT 28% 30% 42% 223
VA 20% 37% 43% 522
VT 27% 26% 47% 236
WA 26% 44% 31% 200
WI 26% 36% 38% 204
WY 35% 33% 31% 234
NCI Average 25% 32% 43% 9,837
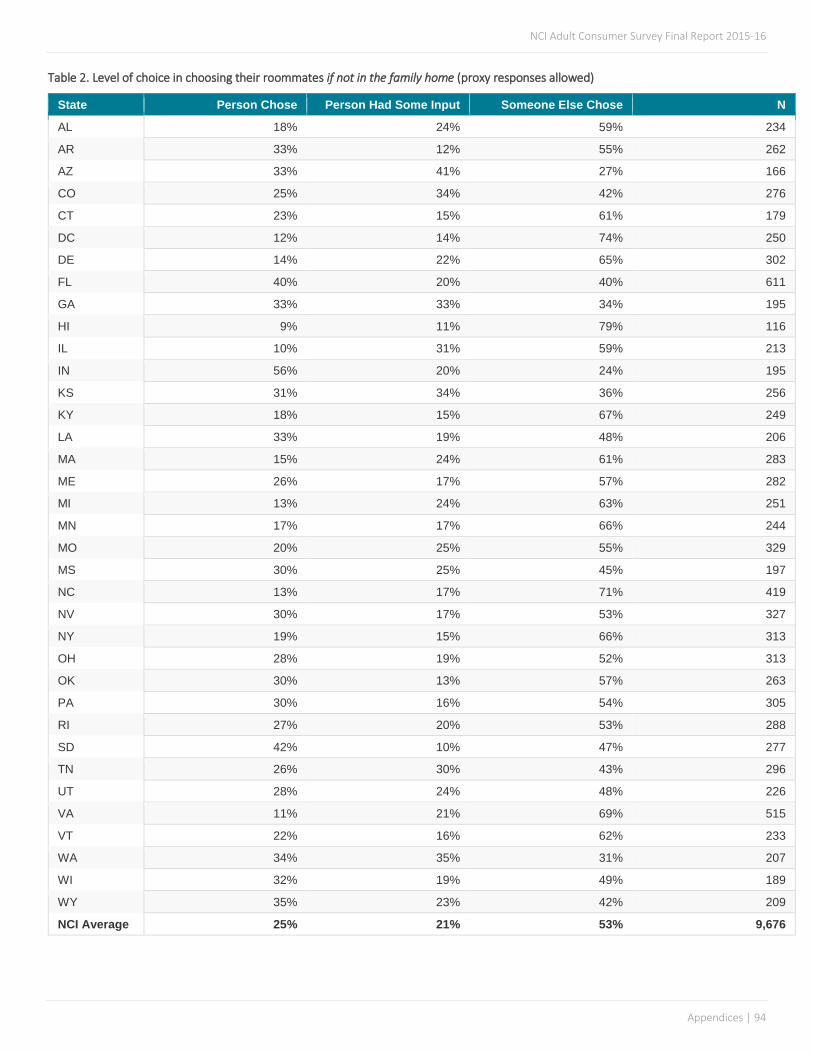
NCI Adult Consumer Survey Final Report 2015-16
Appendices | 94
Table 2. Level of choice in choosing their roommates if not in the family home (proxy responses allowed)
State Person Chose Person Had Some Input Someone Else Chose N
AL 18% 24% 59% 234
AR 33% 12% 55% 262
AZ 33% 41% 27% 166
CO 25% 34% 42% 276
CT 23% 15% 61% 179
DC 12% 14% 74% 250
DE 14% 22% 65% 302
FL 40% 20% 40% 611
GA 33% 33% 34% 195
HI 9% 11% 79% 116
IL 10% 31% 59% 213
IN 56% 20% 24% 195
KS 31% 34% 36% 256
KY 18% 15% 67% 249
LA 33% 19% 48% 206
MA 15% 24% 61% 283
ME 26% 17% 57% 282
MI 13% 24% 63% 251
MN 17% 17% 66% 244
MO 20% 25% 55% 329
MS 30% 25% 45% 197
NC 13% 17% 71% 419
NV 30% 17% 53% 327
NY 19% 15% 66% 313
OH 28% 19% 52% 313
OK 30% 13% 57% 263
PA 30% 16% 54% 305
RI 27% 20% 53% 288
SD 42% 10% 47% 277
TN 26% 30% 43% 296
UT 28% 24% 48% 226
VA 11% 21% 69% 515
VT 22% 16% 62% 233
WA 34% 35% 31% 207
WI 32% 19% 49% 189
WY 35% 23% 42% 209
NCI Average 25% 21% 53% 9,676

NCI Adult Consumer Survey Final Report 2015-16
Appendices | 95
Table 3. Level of choice in choosing where they work (among those with a job in the community; proxy responses allowed)
State Person Chose Person Had Some Input Someone Else Chose N
AL 46% 42% 12% 26
AR 62% 33% 5% 21
AZ 57% 30% 13% 61
CO 37% 45% 18% 49
CT 29% 45% 26% 116
DC n/a n/a n/a n/a
DE 39% 29% 31% 51
FL 79% 21% 0% 126
GA 68% 25% 7% 71
HI n/a n/a n/a n/a
IL 59% 31% 10% 29
IN 59% 34% 7% 134
KS 69% 31% 0% 45
KY 68% 24% 8% 25
LA 63% 27% 10% 49
MA 43% 38% 19% 95
ME 41% 44% 15% 71
MI 35% 49% 16% 43
MN 34% 43% 23% 160
MO 50% 47% 3% 36
MS 38% 38% 24% 58
NC 38% 44% 18% 82
NV 52% 34% 14% 58
NY 57% 26% 17% 47
OH 62% 30% 8% 100
OK 54% 9% 38% 56
PA 57% 37% 6% 68
RI 35% 42% 23% 66
SD 51% 41% 8% 114
TN 78% 17% 4% 46
UT 50% 41% 9% 64
VA 40% 45% 15% 55
VT 22% 60% 17% 129
WA 29% 65% 6% 158
WI 30% 53% 17% 53
WY 59% 27% 14% 97
NCI Average 50% 37% 14% 2,459

NCI Adult Consumer Survey Final Report 2015-16
Appendices | 96
Table 4. Level of choice in choosing where they go during the day (among those with a day program or activity; proxy responses allowed)
State Person Chose Person Had Some Input Someone Else Chose N
AL 29% 33% 37% 350
AR 29% 35% 37% 254
AZ 56% 25% 18% 276
CO 26% 36% 38% 301
CT 25% 30% 45% 263
DC 15% 25% 60% 338
DE 22% 28% 50% 238
FL 47% 34% 19% 999
GA 45% 38% 18% 381
HI 41% 19% 39% 365
IL 28% 32% 40% 321
IN 35% 29% 36% 527
KS 38% 41% 21% 328
KY 30% 37% 33% 380
LA 24% 32% 43% 231
MA 24% 37% 39% 325
ME 34% 30% 36% 235
MI 32% 32% 36% 292
MN 32% 28% 40% 275
MO 35% 35% 30% 247
MS 29% 23% 48% 310
NC 17% 40% 42% 558
NV 42% 30% 28% 301
NY 24% 31% 45% 397
OH 35% 29% 36% 401
OK 22% 20% 58% 152
PA 37% 32% 31% 453
RI 33% 38% 28% 418
SD 51% 24% 24% 274
TN 44% 30% 26% 271
UT 29% 35% 36% 283
VA 20% 42% 38% 577
VT 30% 46% 25% 125
WA 45% 41% 14% 236
WI 16% 44% 40% 214
WY 44% 28% 29% 269
NCI Average 32% 33% 35% 12,165

NCI Adult Consumer Survey Final Report 2015-16
Appendices | 97
Table 5. Level of choice of staff who help them at their home, job, or day program or activity (proxy responses allowed)
State Person Chose Person Had Some Input Someone Else Chose N
AL 1% 97% 3% 372
AR 18% 56% 26% 370
AZ 8% 76% 15% 370
CO 12% 66% 22% 361
CT 13% 45% 42% 295
DC 9% 37% 53% 363
DE 10% 41% 49% 353
FL 43% 36% 21% 1283
GA 8% 68% 23% 433
HI 29% 32% 39% 363
IL 7% 54% 39% 360
IN 29% 56% 15% 739
KS 12% 78% 10% 349
KY 10% 14% 75% 419
LA 20% 58% 22% 383
MA 22% 40% 38% 377
ME 8% 81% 12% 370
MI 21% 38% 42% 349
MN 14% 45% 41% 362
MO 16% 55% 29% 383
MS 11% 61% 28% 370
NC 16% 44% 41% 693
NV 12% 68% 20% 372
NY 7% 60% 33% 422
OH 17% 54% 29% 446
OK 12% 58% 29% 363
PA 16% 39% 45% 549
RI 15% 54% 30% 424
SD 16% 57% 27% 316
TN 12% 84% 4% 425
UT 19% 59% 22% 381
VA 10% 46% 44% 760
VT 11% 56% 33% 261
WA 24% 58% 18% 375
WI 20% 57% 22% 284
WY 33% 30% 37% 291
NCI Average 16% 54% 30% 15,386

NCI Adult Consumer Survey Final Report 2015-16
Appendices | 98
Table 6. Level of choice in deciding their daily schedule (proxy responses allowed)
State Person Chose Person Had Some Input Someone Else Chose N
AL 61% 29% 10% 379
AR 48% 31% 21% 382
AZ 78% 11% 11% 468
CO 55% 33% 12% 405
CT 41% 36% 23% 319
DC 37% 24% 38% 383
DE 49% 29% 23% 364
FL 57% 35% 8% 1,396
GA 65% 31% 4% 443
HI 41% 24% 35% 379
IL 45% 37% 19% 375
IN 62% 24% 14% 810
KS 54% 35% 11% 353
KY 66% 26% 9% 441
LA 46% 31% 23% 424
MA 55% 36% 9% 406
ME 60% 33% 7% 375
MI 48% 39% 13% 432
MN 54% 27% 18% 402
MO 54% 38% 9% 388
MS 55% 22% 23% 399
NC 35% 41% 24% 744
NV 63% 29% 9% 390
NY 44% 33% 23% 478
OH 54% 29% 17% 538
OK 35% 36% 29% 398
PA 56% 31% 13% 658
RI 52% 32% 16% 442
SD 65% 21% 14% 333
TN 47% 37% 16% 424
UT 48% 42% 10% 382
VA 40% 40% 21% 800
VT 61% 27% 12% 320
WA 64% 31% 5% 392
WI 52% 34% 15% 399
WY 60% 28% 13% 309
NCI Average 53% 31% 16% 16,730

NCI Adult Consumer Survey Final Report 2015-16
Appendices | 99
Table 7. Level of choice in deciding how to spend free time (proxy responses allowed)
State Person Chose Person Had Some Input Someone Else Chose N
AL 79% 18% 4% 379
AR 72% 17% 12% 377
AZ 89% 6% 5% 468
CO 75% 20% 5% 404
CT 59% 28% 13% 320
DC 49% 27% 24% 375
DE 62% 27% 11% 356
FL 65% 30% 5% 1,405
GA 78% 20% 2% 445
HI 59% 20% 22% 368
IL 64% 30% 6% 375
IN 78% 16% 7% 809
KS 69% 24% 7% 359
KY 71% 23% 6% 434
LA 68% 24% 8% 406
MA 68% 26% 5% 409
ME 69% 27% 4% 388
MI 63% 31% 6% 426
MN 74% 18% 8% 406
MO 69% 28% 3% 389
MS 72% 16% 13% 394
NC 56% 34% 10% 743
NV 72% 23% 5% 389
NY 58% 27% 16% 481
OH 71% 20% 9% 535
OK 71% 18% 10% 397
PA 70% 25% 5% 668
RI 58% 35% 7% 446
SD 78% 18% 4% 333
TN 81% 15% 4% 432
UT 64% 31% 5% 382
VA 67% 25% 8% 799
VT 73% 23% 4% 319
WA 76% 20% 4% 392
WI 74% 22% 4% 406
WY 74% 20% 6% 311
NCI Average 69% 23% 8% 16,725

NCI Adult Consumer Survey Final Report 2015-16
Appendices | 100
Table 8. Level of choice in deciding what to buy with their money (proxy responses allowed)
State Person Chose Person Had Some Input Someone Else Chose N
AL 80% 12% 8% 377
AR 43% 43% 14% 372
AZ 81% 12% 7% 463
CO 55% 33% 11% 398
CT 52% 32% 16% 322
DC 42% 25% 33% 372
DE 41% 43% 16% 358
FL 45% 41% 14% 1,398
GA 58% 38% 4% 440
HI 60% 23% 16% 332
IL 43% 46% 12% 373
IN 58% 30% 12% 806
KS 63% 30% 6% 344
KY 69% 24% 7% 441
LA 53% 32% 15% 415
MA 54% 36% 10% 404
ME 77% 17% 5% 379
MI 47% 41% 13% 426
MN 54% 32% 13% 402
MO 52% 40% 8% 390
MS 64% 23% 13% 395
NC 46% 42% 11% 737
NV 66% 26% 8% 386
NY 48% 31% 21% 484
OH 60% 27% 13% 532
OK 49% 31% 20% 394
PA 61% 28% 11% 657
RI 55% 36% 9% 446
SD 67% 25% 8% 335
TN 51% 36% 14% 428
UT 50% 37% 12% 385
VA 50% 37% 13% 799
VT 43% 46% 11% 320
WA 55% 35% 11% 390
WI 63% 29% 8% 397
WY 64% 28% 9% 311
NCI Average 56% 32% 12% 16,608

NCI Adult Consumer Survey Final Report 2015-16
Appendices | 101
Table 9. Level of choice in their case manager/service coordinator (proxy responses allowed)
State Person Chose Did Not Choose, But Can Change
Someone Else Chose N
AL 0% 98% 2% 380
AR 4% 78% 17% 366
AZ 2% 84% 14% 466
CO 2% 81% 17% 387
CT 5% 48% 48% 296
DC 4% 35% 62% 373
DE 5% 24% 72% 305
FL 39% 36% 24% 1,303
GA 5% 59% 35% 426
HI 8% 21% 70% 365
IL 2% 64% 35% 369
IN 35% 51% 14% 777
KS 19% 69% 12% 356
KY 5% 18% 77% 430
LA 4% 74% 22% 396
MA 3% 44% 53% 386
ME 11% 79% 10% 367
MI 6% 68% 26% 414
MN 3% 58% 38% 372
MO 2% 64% 34% 368
MS 4% 68% 27% 362
NC 2% 65% 33% 602
NV 7% 83% 10% 374
NY 6% 76% 19% 459
OH 11% 66% 22% 513
OK 4% 80% 16% 388
PA 6% 43% 51% 626
RI 13% 50% 38% 424
SD 18% 61% 20% 324
TN 5% 92% 3% 426
UT 37% 36% 27% 358
VA 2% 58% 40% 780
VT 5% 73% 22% 308
WA 2% 84% 14% 381
WI 10% 77% 13% 383
WY 55% 8% 37% 300
NCI Average 10% 60% 30% 15,910

NCI Adult Consumer Survey Final Report 2015-16
Appendices | 102
Work (un-collapsed)
Table 10. Have a paid job in the community (among those with an individual and/or group supported; information comes from Background Information section)
State Yes No N
AL 9% 91% 394
AR 7% 93% 354
AZ 15% 85% 451
CO 15% 85% 407
CT 42% 58% 319
DC 7% 93% 275
DE 16% 84% 401
FL 9% 91% 1,429
GA 18% 82% 461
HI 5% 95% 398
IL 9% 91% 352
IN 17% 83% 821
KS 15% 85% 368
KY 9% 91% 419
LA 15% 85% 427
MA 30% 70% 351
ME 24% 76% 374
MI 17% 83% 360
MN 41% 59% 402
MO 9% 91% 395
MS 17% 83% 370
NC 13% 87% 777
NV 15% 85% 399
NY 10% 90% 488
OH 24% 76% 556
OK 17% 83% 400
PA 16% 84% 549
RI 26% 74% 349
SD 38% 62% 361
TN 16% 84% 402
UT 19% 81% 398
VA 11% 89% 765
VT 42% 58% 325
WA 41% 59% 402
WI 15% 85% 383
WY 37% 63% 293
NCI Average 19% 81% 16,375

NCI Adult Consumer Survey Final Report 2015-16
Appendices | 103
Table 11. Receives paid vacation and/or sick time at their job (among those with a paid job in the community; information comes from Background Information section)
State Yes No N
AL 17% 83% 29
AR 12% 88% 25
AZ 29% 71% 49
CO 37% 63% 35
CT 57% 43% 77
DC n/a n/a n/a
DE 25% 75% 40
FL 26% 74% 125
GA 25% 75% 76
HI n/a n/a n/a
IL 44% 56% 25
IN 28% 72% 123
KS 30% 70% 44
KY 28% 72% 43
LA 9% 91% 44
MA 40% 60% 90
ME 16% 84% 73
MI 15% 85% 46
MN 34% 66% 156
MO 29% 71% 34
MS 11% 89% 47
NC 15% 85% 80
NV 31% 69% 75
NY 42% 58% 38
OH 40% 60% 106
OK 15% 85% 65
PA 28% 72% 43
RI 24% 76% 79
SD 20% 80% 126
TN 19% 81% 42
UT 20% 80% 50
VA 17% 83% 47
VT 11% 89% 125
WA 24% 76% 147
WI n/a n/a n/a
WY 32% 68% 78
NCI Average 26% 74% 2,282

NCI Adult Consumer Survey Final Report 2015-16
Appendices | 104
Table 12. Job industry (among those with a paid job in the community; information comes from Background Information section)
State Food Industry Building and Grounds
Personal Care Provider
Retail Job Office Support N
AL 12% 42% 0% 12% 0% 33
AR 38% 31% 0% 0% 3% 29
AZ 14% 29% 0% 14% 3% 65
CO 17% 30% 0% 19% 2% 47
CT 10% 29% 1% 15% 7% 98
DC n/a n/a n/a n/a n/a n/a
DE 21% 43% 0% 6% 4% 53
FL 20% 21% 0% 30% 2% 140
GA 21% 33% 0% 29% 2% 83
HI 35% 40% 0% 15% 0% 20
IL 21% 12% 0% 21% 3% 33
IN 29% 19% 1% 29% 6% 137
KS 29% 31% 0% 14% 0% 51
KY 25% 20% 0% 32% 0% 56
LA 21% 40% 0% 14% 4% 52
MA 18% 27% 0% 19% 5% 99
ME 21% 28% 0% 25% 7% 87
MI 22% 33% 0% 10% 4% 51
MN 13% 25% 1% 12% 4% 163
MO 11% 34% 0% 18% 0% 38
MS 36% 36% 0% 12% 2% 58
NC 21% 23% 2% 20% 5% 94
NV 7% 47% 0% 11% 3% 90
NY 16% 22% 2% 26% 6% 50
OH 16% 31% 0% 14% 6% 130
OK 3% 46% 3% 15% 6% 67
PA 28% 14% 4% 20% 3% 74
RI 22% 29% 0% 8% 6% 85
SD 24% 36% 2% 10% 2% 135
TN 23% 42% 0% 11% 11% 53
UT 23% 35% 2% 9% 2% 57
VA 15% 32% 0% 18% 2% 68
VT 11% 27% 0% 28% 6% 131
WA 20% 29% 0% 19% 10% 163
WI 14% 27% 0% 19% 14% 63
WY 22% 24% 0% 25% 2% 92
NCI Average 20% 30% 1% 17% 4% 2,745

NCI Adult Consumer Survey Final Report 2015-16
Appendices | 105
Table 13. Job industry, continued (among those with a paid job in the community; information comes from Background Information section)
State Farming, Fishing, Forestry
Construction or Repair
Assembly, Manufacturing,
or Packaging
Materials Handling, Mail
Distribution
Professional or Technical Job
Other N
AL 0% 0% 12% 0% 0% 21% 33
AR 0% 0% 0% 0% 0% 28% 29
AZ 2% 0% 8% 2% 2% 28% 65
CO 0% 2% 13% 0% 0% 17% 47
CT 0% 0% 16% 6% 0% 15% 98
DC n/a n/a n/a n/a n/a n/a n/a
DE 0% 0% 8% 0% 0% 19% 53
FL 1% 1% 4% 3% 1% 18% 140
GA 1% 0% 4% 0% 1% 10% 83
HI 0% 0% 5% 0% 0% 5% 20
IL 0% 0% 18% 0% 0% 24% 33
IN 0% 2% 8% 2% 0% 6% 137
KS 0% 0% 4% 2% 0% 20% 51
KY 0% 0% 7% 2% 0% 14% 56
LA 2% 0% 4% 2% 0% 14% 52
MA 2% 0% 13% 3% 0% 12% 99
ME 0% 1% 5% 1% 0% 13% 87
MI 0% 0% 12% 4% 0% 16% 51
MN 1% 0% 30% 6% 1% 9% 163
MO 0% 0% 3% 0% 0% 34% 38
MS 0% 0% 0% 0% 0% 14% 58
NC 0% 0% 2% 1% 1% 23% 94
NV 2% 0% 12% 1% 1% 16% 90
NY 0% 0% 12% 4% 0% 12% 50
OH 3% 0% 12% 3% 0% 15% 130
OK 0% 0% 8% 13% 0% 6% 67
PA 0% 0% 10% 1% 0% 20% 74
RI 0% 1% 4% 5% 0% 25% 85
SD 0% 0% 8% 4% 0% 15% 135
TN 0% 0% 4% 2% 2% 6% 53
UT 0% 2% 14% 0% 0% 14% 57
VA 0% 0% 10% 7% 0% 16% 68
VT 2% 0% 8% 5% 0% 15% 131
WA 1% 1% 6% 4% 0% 10% 163
WI 0% 2% 5% 0% 0% 19% 63
WY 0% 1% 3% 4% 0% 19% 92
NCI Average
0% 0% 8% 3% 0% 17% 2,745

NCI Adult Consumer Survey Final Report 2015-16
Appendices | 106
Table 14. Would like a job in the community (among those without a paid job in the community)
State Yes In-between
No N
AL 53% 15% 31% 278
AR 59% 6% 35% 108
AZ 7% 1% 93% 269
CO 40% 14% 46% 145
CT 38% 12% 50% 74
DC 66% 3% 31% 80
DE 73% 4% 23% 165
FL 41% 9% 51% 655
GA 49% 11% 39% 194
HI 54% 10% 36% 122
IL 50% 9% 41% 150
IN 40% 4% 56% 389
KS 39% 13% 48% 159
KY 29% 2% 69% 206
LA 40% 8% 52% 142
MA 45% 4% 51% 134
ME 61% 10% 29% 150
MI 42% 12% 46% 146
MN 52% 4% 44% 79
MO 36% 7% 56% 188
MS 50% 6% 44% 161
NC 59% 8% 33% 250
NV 46% 12% 41% 241
NY 38% 13% 49% 208
OH 42% 6% 51% 177
OK 60% 3% 37% 101
PA 35% 3% 62% 215
RI 48% 8% 44% 117
SD 51% 13% 36% 109
TN 36% 2% 61% 222
UT 56% 5% 39% 125
VA 52% 10% 38% 293
VT 52% 10% 38% 140
WA 48% 9% 44% 117
WI 41% 9% 50% 141
WY 53% 6% 41% 100
NCI Average 47% 8% 45% 6,550

NCI Adult Consumer Survey Final Report 2015-16
Appendices | 107
Table 15. Have community employment as a goal in their service plan (among those with a paid job in the community; information comes from Background Information section)
State Yes No N
AL 28% 72% 384
AR 19% 81% 364
AZ 20% 80% 441
CO 30% 70% 398
CT 31% 69% 332
DC 48% 52% 183
DE 37% 63% 380
FL 19% 81% 1,408
GA 20% 80% 461
HI 16% 84% 392
IL 17% 83% 386
IN 21% 79% 796
KS 25% 75% 369
KY 22% 78% 437
LA 23% 77% 399
MA 27% 73% 403
ME 34% 66% 377
MI 26% 74% 417
MN 46% 54% 380
MO 15% 85% 393
MS 44% 56% 374
NC 19% 81% 797
NV 44% 56% 384
NY 21% 79% 476
OH 39% 61% 591
OK 33% 67% 400
PA 24% 76% 604
RI 69% 31% 340
SD 31% 69% 350
TN 29% 71% 417
UT 27% 73% 387
VA 23% 77% 763
VT 50% 50% 325
WA 59% 41% 398
WI 19% 81% 376
WY 36% 64% 304
NCI Average 30% 70% 16,386

NCI Adult Consumer Survey Final Report 2015-16
Appendices | 108
Table 16. Takes classes to help get a job or get a better job
State Yes No N
AL 38% 62% 331
AR 34% 66% 215
AZ 12% 88% 416
CO 20% 80% 295
CT 23% 77% 227
DC 34% 66% 190
DE 21% 79% 243
FL 29% 71% 827
GA 40% 60% 284
HI 32% 68% 189
IL 47% 53% 233
IN 21% 79% 558
KS 14% 86% 240
KY 12% 88% 288
LA 21% 79% 281
MA 29% 71% 296
ME 25% 75% 278
MI 31% 69% 275
MN 22% 78% 248
MO 10% 90% 247
MS 26% 74% 286
NC 27% 73% 423
NV 22% 78% 338
NY 17% 83% 296
OH 22% 78% 384
OK 22% 78% 195
PA 14% 86% 419
RI 24% 76% 341
SD 28% 72% 273
TN 17% 83% 330
UT 32% 68% 230
VA 18% 82% 462
VT 17% 83% 267
WA 12% 88% 262
WI 18% 82% 292
WY 18% 82% 234
NCI Average 24% 76% 11,193

NCI Adult Consumer Survey Final Report 2015-16
Appendices | 109
Table 17. Attend a day program or regular activity
State Yes No N
AL 93% 7% 331
AR 70% 30% 217
AZ 54% 46% 421
CO 63% 37% 305
CT 54% 46% 228
DC 0% 100% 195
DE 75% 25% 274
FL 44% 56% 852
GA 69% 31% 311
HI 72% 28% 199
IL 82% 18% 258
IN 56% 44% 578
KS 72% 28% 266
KY 74% 26% 299
LA 49% 51% 289
MA 70% 30% 310
ME 73% 27% 289
MI 56% 44% 286
MN 51% 49% 251
MO 45% 55% 273
MS 77% 23% 293
NC 61% 39% 437
NV 70% 30% 346
NY 63% 37% 309
OH 65% 35% 399
OK 32% 68% 210
PA 56% 44% 429
RI 70% 30% 344
SD 62% 38% 279
TN 45% 55% 334
UT 63% 37% 241
VA 69% 31% 502
VT 14% 86% 274
WA 10% 90% 266
WI 42% 58% 287
WY 49% 51% 237
NCI Average 57% 43% 11,619

NCI Adult Consumer Survey Final Report 2015-16
Appendices | 110
Table 18. Volunteer
State Yes No N
AL 38% 62% 331
AR 34% 66% 218
AZ 8% 92% 411
CO 33% 67% 299
CT 37% 63% 239
DC 40% 60% 190
DE 30% 70% 250
FL 23% 77% 838
GA 30% 70% 300
HI 49% 51% 196
IL 33% 67% 242
IN 38% 62% 576
KS 29% 71% 259
KY 15% 85% 292
LA 32% 68% 284
MA 39% 61% 298
ME 39% 61% 286
MI 30% 70% 275
MN 41% 59% 249
MO 27% 73% 267
MS 26% 74% 288
NC 34% 66% 425
NV 25% 75% 342
NY 29% 71% 309
OH 28% 72% 388
OK 28% 72% 210
PA 28% 72% 429
RI 33% 67% 347
SD 39% 61% 282
TN 23% 77% 332
UT 37% 63% 236
VA 40% 60% 479
VT 27% 73% 273
WA 29% 71% 265
WI 40% 60% 292
WY 32% 68% 237
NCI Average 32% 68% 11,434

NCI Adult Consumer Survey Final Report 2015-16
Appendices | 111
Self-Directed Supports (un-collapsed)
Table 19. Using a self-directed supports option (information comes from Background Information section)
State Yes No N
AL 0% 100% 396
AR 0% 100% 363
AZ 0% 100% 471
CO 0% 100% 411
CT 9% 91% 339
DC 0% 100% 341
DE 0% 100% 436
FL 20% 80% 1,433
GA 3% 97% 468
HI 17% 83% 401
IL 32% 68% 386
IN 0% 100% 825
KS 20% 80% 378
KY 27% 73% 450
LA 3% 97% 435
MA 2% 98% 416
ME 0% 100% 386
MI 22% 78% 420
MN 7% 93% 428
MO 4% 96% 397
MS 0% 100% 414
NC 2% 98% 800
NV 0% 100% 400
NY 4% 96% 484
OH 3% 97% 574
OK 3% 97% 400
PA 14% 86% 611
RI 10% 90% 358
SD 6% 94% 354
TN 4% 96% 425
UT 23% 77% 407
VA 17% 83% 747
VT 12% 88% 326
WA 67% 33% 406
WI 33% 67% 304
WY 7% 93% 315
NCI Average 10% 90% 16,905
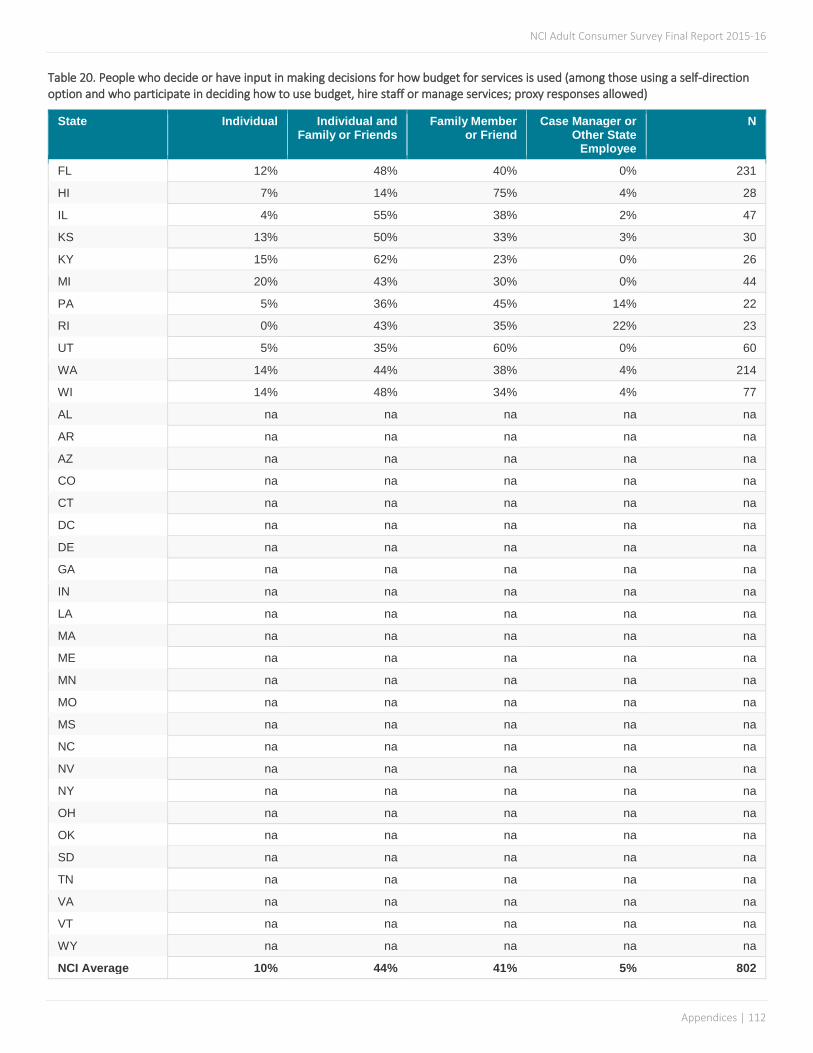
NCI Adult Consumer Survey Final Report 2015-16
Appendices | 112
Table 20. People who decide or have input in making decisions for how budget for services is used (among those using a self-direction option and who participate in deciding how to use budget, hire staff or manage services; proxy responses allowed)
State Individual Individual and Family or Friends
Family Member or Friend
Case Manager or Other State
Employee
N
FL 12% 48% 40% 0% 231
HI 7% 14% 75% 4% 28
IL 4% 55% 38% 2% 47
KS 13% 50% 33% 3% 30
KY 15% 62% 23% 0% 26
MI 20% 43% 30% 0% 44
PA 5% 36% 45% 14% 22
RI 0% 43% 35% 22% 23
UT 5% 35% 60% 0% 60
WA 14% 44% 38% 4% 214
WI 14% 48% 34% 4% 77
AL na na na na na
AR na na na na na
AZ na na na na na
CO na na na na na
CT na na na na na
DC na na na na na
DE na na na na na
GA na na na na na
IN na na na na na
LA na na na na na
MA na na na na na
ME na na na na na
MN na na na na na
MO na na na na na
MS na na na na na
NC na na na na na
NV na na na na na
NY na na na na na
OH na na na na na
OK na na na na na
SD na na na na na
TN na na na na na
VA na na na na na
VT na na na na na
WY na na na na na
NCI Average 10% 44% 41% 5% 802

NCI Adult Consumer Survey Final Report 2015-16
Appendices | 113
Table 21. Hires or manages staff (among those using a self-direction option and who participate in deciding how to use budget, hire staff, or manage services; proxy responses allowed)
State Yes Maybe, Not Sure No N
FL 85% 4% 10% 229
HI 93% 4% 4% 28
IL 55% 18% 27% 44
KS 67% 22% 11% 27
KY 83% 9% 9% 23
MI 71% 7% 21% 42
PA 95% 0% 5% 21
RI 64% 18% 18% 22
UT 91% 0% 9% 57
WA 73% 6% 21% 204
WI 67% 1% 31% 70
AL na na na na
AR na na na na
AZ na na na na
CO na na na na
CT na na na na
DC na na na na
DE na na na na
GA na na na na
IN na na na na
LA na na na na
MA na na na na
ME na na na na
MN na na na na
MO na na na na
MS na na na na
NC na na na na
NV na na na na
NY na na na na
OH na na na na
OK na na na na
SD na na na na
TN na na na na
VA na na na na
VT na na na na
WY na na na na
NCI Average 77% 8% 15% 767

NCI Adult Consumer Survey Final Report 2015-16
Appendices | 114
Table 22. Can make changes to individual budget/services if needed (among those using a self-direction option and who participate in deciding how to use budget, hire staff, or manage services; proxy responses allowed)
State Yes Maybe, Not Sure No N
FL 92% 5% 3% 229
HI 74% 7% 19% 27
IL 64% 29% 7% 45
KS 78% 22% 0% 27
KY 88% 8% 4% 24
MI 71% 17% 12% 42
RI 74% 22% 4% 23
UT 91% 5% 4% 56
WA 87% 13% 1% 200
WI 91% 9% 0% 77
WI na na na na
AL na na na na
AR na na na na
AZ na na na na
CO na na na na
CT na na na na
DC na na na na
DE na na na na
GA na na na na
IN na na na na
LA na na na na
MA na na na na
ME na na na na
MN na na na na
MO na na na na
MS na na na na
NC na na na na
NV na na na na
NY na na na na
OH na na na na
OK na na na na
SD na na na na
TN na na na na
VA na na na na
VT na na na na
WY na na na na
NCI Average 81% 14% 5% 750

NCI Adult Consumer Survey Final Report 2015-16
Appendices | 115
Table 23. Has enough help deciding how to use their individual budget/services (among those using a self-direction option and who participate in deciding how to use budget, hire staff, or manage services; proxy responses allowed)
State Yes Maybe, Not Sure
No N
FL 96% 3% 1% 231
HI 96% 4% 0% 27
IL 87% 13% 0% 46
KS 79% 21% 0% 29
KY 84% 12% 4% 25
MI 83% 7% 10% 42
PA 95% 5% 0% 21
RI 87% 0% 13% 23
UT 91% 9% 0% 58
WA 93% 4% 2% 208
WI 93% 3% 4% 74
AL na na na na
AR na na na na
AZ na na na na
CO na na na na
CT na na na na
DC na na na na
DE na na na na
GA na na na na
IN na na na na
LA na na na na
MA na na na na
ME na na na na
MN na na na na
MO na na na na
MS na na na na
NC na na na na
NV na na na na
NY na na na na
OH na na na na
OK na na na na
SD na na na na
TN na na na na
VA na na na na
VT na na na na
WY na na na na
NCI Average 90% 7% 3% 784
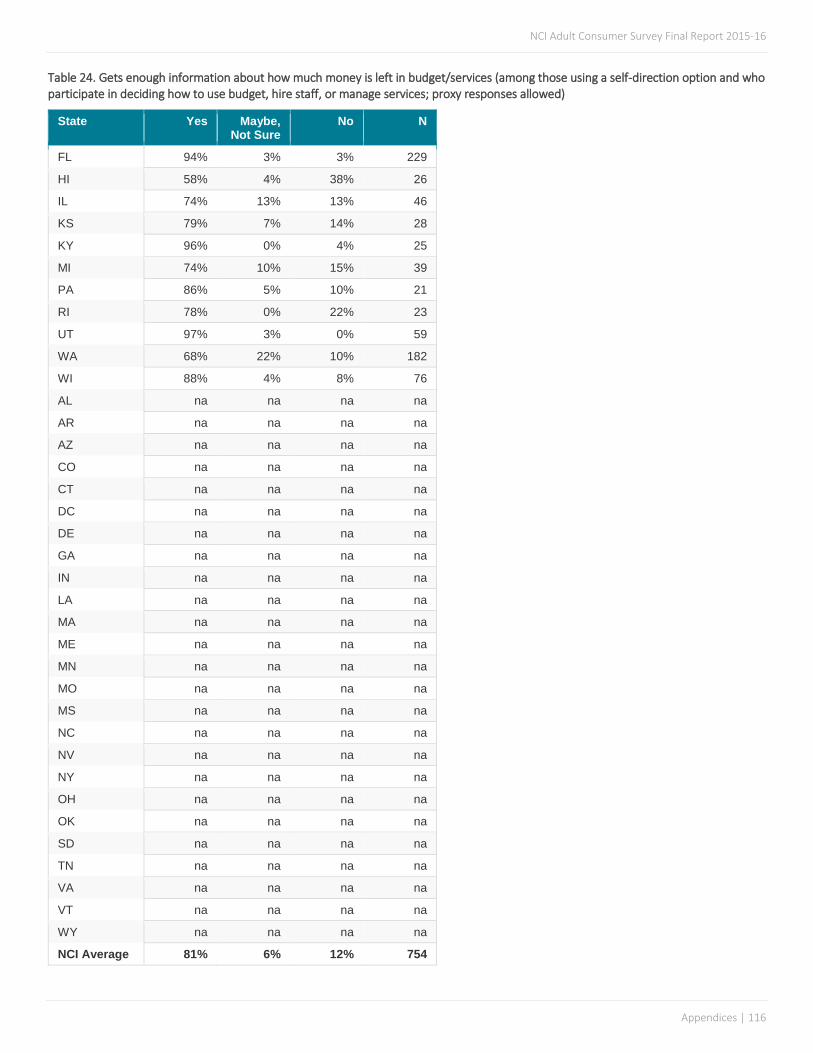
NCI Adult Consumer Survey Final Report 2015-16
Appendices | 116
Table 24. Gets enough information about how much money is left in budget/services (among those using a self-direction option and who participate in deciding how to use budget, hire staff, or manage services; proxy responses allowed)
State Yes Maybe, Not Sure
No N
FL 94% 3% 3% 229
HI 58% 4% 38% 26
IL 74% 13% 13% 46
KS 79% 7% 14% 28
KY 96% 0% 4% 25
MI 74% 10% 15% 39
PA 86% 5% 10% 21
RI 78% 0% 22% 23
UT 97% 3% 0% 59
WA 68% 22% 10% 182
WI 88% 4% 8% 76
AL na na na na
AR na na na na
AZ na na na na
CO na na na na
CT na na na na
DC na na na na
DE na na na na
GA na na na na
IN na na na na
LA na na na na
MA na na na na
ME na na na na
MN na na na na
MO na na na na
MS na na na na
NC na na na na
NV na na na na
NY na na na na
OH na na na na
OK na na na na
SD na na na na
TN na na na na
VA na na na na
VT na na na na
WY na na na na
NCI Average 81% 6% 12% 754

NCI Adult Consumer Survey Final Report 2015-16
Appendices | 117
Table 25. Information received about budget/services is easy to understand (among those using a self-direction option and who participate in making decisions about how to use budget, hire staff, or manage services; proxy responses allowed)
State Yes Maybe, Not Sure
No N
FL 82% 13% 5% 215
IL 70% 27% 3% 37
KS 77% 18% 5% 22
KY 92% 8% 0% 24
MI 67% 10% 23% 30
UT 75% 17% 8% 59
WA 67% 26% 7% 153
WI 75% 13% 12% 68
AL na na na na
AR na na na na
AZ na na na na
CO na na na na
CT na na na na
DC na na na na
DE na na na na
GA na na na na
HI na na na na
IN na na na na
LA na na na na
MA na na na na
ME na na na na
MN na na na na
MO na na na na
MS na na na na
NC na na na na
NV na na na na
NY na na na na
OH na na na na
OK na na na na
PA na na na na
RI na na na na
SD na na na na
TN na na na na
VA na na na na
VT na na na na
WY na na na na
NCI Average 76% 17% 8% 608

NCI Adult Consumer Survey Final Report 2015-16
Appendices | 118
Community Inclusion, Participation and Leisure (un-collapsed)
Table 26. Went out shopping at least once in the past month (proxy responses allowed)
State 0 times 1-2 Times 3-4 Times More Than 5 Times
N
AL 11% 31% 49% 8% 380
AR 16% 23% 29% 32% 376
AZ 6% 71% 9% 14% 469
CO 10% 23% 38% 29% 403
CT 10% 33% 27% 30% 322
DC 8% 39% 40% 14% 382
DE 14% 40% 29% 17% 354
FL 10% 28% 36% 26% 1,416
GA 5% 45% 33% 17% 441
HI 12% 26% 30% 32% 380
IL 9% 42% 35% 14% 377
IN 9% 17% 29% 46% 812
KS 8% 20% 41% 30% 362
KY 6% 61% 23% 10% 445
LA 16% 28% 29% 27% 421
MA 12% 31% 32% 25% 406
ME 5% 14% 22% 59% 391
MI 9% 31% 31% 29% 429
MN 8% 26% 40% 26% 401
MO 7% 22% 35% 36% 394
MS 9% 30% 42% 20% 394
NC 10% 35% 26% 29% 733
NV 6% 25% 34% 35% 382
NY 11% 43% 30% 16% 483
OH 11% 33% 27% 29% 532
OK 10% 25% 28% 37% 397
PA 8% 33% 33% 25% 660
RI 8% 29% 36% 27% 450
SD 7% 30% 48% 16% 326
TN 6% 29% 32% 32% 429
UT 12% 26% 40% 23% 380
VA 10% 25% 32% 33% 804
VT 8% 17% 21% 53% 319
WA 11% 19% 27% 43% 394
WI 17% 29% 28% 26% 405
WY 3% 23% 34% 40% 306
NCI Average 9% 31% 32% 28% 16,755

NCI Adult Consumer Survey Final Report 2015-16
Appendices | 119
Table 27. Who person typically went out shopping with in the past month (proxy responses allowed)
State Alone Friends or Family
Housemates or Co-
workers
Staff Others Don't know
AL 1% 48% 34% 57% 2% 1%
AR 4% 26% 8% 72% 1% 1%
AZ 4% 73% 10% 25% 0% 1%
CO 15% 47% 20% 52% 0% 0%
CT 6% 44% 21% 65% 1% 2%
DC 5% 24% 17% 74% 0% 3%
DE 3% 19% 32% 79% 1% 8%
FL 8% 52% 17% 52% 0% 2%
GA 7% 52% 25% 73% 6% 3%
HI 4% 46% 1% 65% 14% 4%
IL 6% 44% 29% 55% 0% 1%
IN 5% 67% 0% 53% 1% 1%
KS 4% 48% 25% 65% 0% 2%
KY 3% 49% 3% 65% 0% 1%
LA 3% 50% 13% 62% 0% 2%
MA 9% 31% 25% 64% 0% 2%
ME 9% 28% 18% 80% 10% 1%
MI 12% 49% 26% 58% 1% 0%
MN 9% 42% 13% 62% 1% 2%
MO 3% 22% 40% 88% 1% 1%
MS 2% 47% 21% 65% 0% 2%
NC 5% 46% 17% 68% 1% 1%
NV 14% 34% 35% 84% 0% 2%
NY 7% 35% 27% 61% 1% 1%
OH 7% 45% 10% 53% 1% 2%
OK 0% 34% 19% 71% 0% 1%
PA 5% 48% 9% 54% 2% 3%
RI 5% 42% 22% 69% 1% 3%
SD 16% 36% 17% 70% 0% 3%
TN 1% 31% 36% 78% 0% 2%
UT 5% 41% 29% 66% 0% 3%
VA 3% 42% 38% 69% 1% 1%
VT 10% 36% 1% 73% 1% 2%
WA 13% 54% 9% 51% 0% 0%
WI 13% 53% 8% 44% 0% 1%
WY 11% 42% 19% 75% 2% 3%
NCI Average 7% 42% 19% 64% 1% 2%

NCI Adult Consumer Survey Final Report 2015-16
Appendices | 120
Table 28. Went out on errands at least once in the past month (proxy responses allowed)
State 0 times 1-2 Times
3-4 Times
More Than 5 Times
N
AL 11% 74% 14% 1% 374
AR 16% 41% 23% 21% 381
AZ 7% 75% 10% 7% 467
CO 6% 42% 33% 19% 401
CT 8% 43% 23% 27% 317
DC 14% 68% 14% 4% 367
DE 6% 46% 33% 15% 329
FL 16% 46% 26% 12% 1,411
GA 15% 63% 18% 4% 420
HI 25% 47% 15% 12% 323
IL 10% 60% 22% 8% 378
IN 13% 40% 24% 24% 803
KS 18% 49% 18% 15% 360
KY 8% 63% 24% 4% 447
LA 15% 45% 25% 15% 424
MA 9% 45% 28% 19% 401
ME 9% 20% 28% 43% 383
MI 12% 45% 26% 16% 427
MN 9% 45% 29% 17% 398
MO 13% 38% 23% 26% 392
MS 15% 44% 34% 8% 395
NC 15% 43% 22% 19% 725
NV 12% 46% 28% 14% 371
NY 11% 53% 26% 10% 484
OH 16% 43% 25% 16% 522
OK 6% 32% 26% 36% 398
PA 9% 46% 25% 20% 649
RI 7% 46% 27% 20% 441
SD 6% 56% 27% 11% 312
TN 7% 53% 22% 18% 429
UT 19% 46% 23% 12% 376
VA 15% 47% 22% 16% 804
VT 6% 29% 25% 39% 308
WA 8% 33% 31% 28% 393
WI 12% 44% 23% 20% 401
WY 9% 40% 20% 30% 299
NCI Average 12% 47% 24% 17% 16,510

NCI Adult Consumer Survey Final Report 2015-16
Appendices | 121
Table 29. Who person typically went on errands with in the past month (proxy responses allowed)
State Alone Friends or Family
Housemates or Co-
workers
Staff Others Don't know
AL 1% 41% 19% 56% 0% 2%
AR 3% 20% 5% 72% 0% 0%
AZ 5% 71% 6% 23% 0% 1%
CO 14% 44% 15% 54% 0% 1%
CT 7% 39% 17% 63% 1% 4%
DC 8% 23% 3% 63% 0% 7%
DE 4% 11% 21% 89% 0% 14%
FL 5% 48% 12% 46% 0% 2%
GA 6% 45% 14% 51% 1% 8%
HI 4% 46% 0% 37% 1% 19%
IL 4% 41% 24% 53% 0% 1%
IN 5% 65% 0% 37% 0% 2%
KS 5% 40% 14% 53% 0% 3%
KY 3% 47% 3% 61% 0% 1%
LA 4% 46% 10% 60% 0% 1%
MA 11% 28% 17% 64% 1% 3%
ME 9% 25% 13% 71% 3% 1%
MI 12% 45% 17% 55% 0% 1%
MN 10% 39% 3% 61% 1% 2%
MO 4% 15% 32% 81% 0% 1%
MS 2% 40% 17% 54% 1% 1%
NC 4% 41% 12% 61% 1% 3%
NV 14% 27% 19% 72% 1% 5%
NY 11% 31% 17% 58% 1% 1%
OH 5% 43% 6% 45% 1% 4%
OK 1% 33% 17% 74% 0% 0%
PA 6% 47% 7% 50% 1% 4%
RI 7% 37% 15% 66% 2% 4%
SD 15% 32% 7% 69% 1% 8%
TN 0% 29% 28% 78% 0% 2%
UT 5% 40% 15% 51% 0% 3%
VA 3% 36% 16% 61% 0% 1%
VT 14% 27% 1% 73% 1% 5%
WA 15% 55% 5% 50% 0% 1%
WI 16% 51% 4% 41% 1% 2%
WY 13% 37% 12% 64% 2% 5%
NCI Average 7% 39% 12% 59% 1% 3%

NCI Adult Consumer Survey Final Report 2015-16
Appendices | 122
Table 30. Went out for entertainment at least once in the past month (proxy responses allowed)
State 0 times 1-2 Times
3-4 Times
More Than 5 Times
N
AL 28% 42% 20% 10% 373
AR 23% 35% 24% 18% 379
AZ 13% 67% 10% 9% 470
CO 24% 34% 27% 15% 404
CT 14% 36% 28% 22% 321
DC 11% 42% 32% 15% 385
DE 31% 42% 17% 10% 347
FL 22% 32% 27% 19% 1,411
GA 17% 47% 23% 13% 430
HI 31% 36% 23% 9% 372
IL 18% 55% 19% 7% 369
IN 29% 26% 20% 26% 814
KS 25% 30% 21% 23% 357
KY 14% 56% 25% 5% 443
LA 26% 36% 19% 18% 419
MA 23% 35% 23% 19% 402
ME 38% 28% 19% 16% 381
MI 23% 40% 21% 16% 430
MN 17% 35% 26% 23% 403
MO 24% 32% 19% 25% 394
MS 36% 39% 17% 8% 396
NC 24% 38% 23% 16% 736
NV 15% 33% 18% 34% 379
NY 34% 42% 17% 8% 483
OH 21% 37% 25% 17% 532
OK 18% 26% 26% 30% 394
PA 26% 42% 18% 14% 666
RI 17% 36% 26% 21% 443
SD 22% 45% 23% 10% 319
TN 15% 33% 24% 29% 433
UT 20% 29% 25% 26% 381
VA 22% 35% 25% 18% 797
VT 37% 25% 15% 24% 316
WA 24% 34% 20% 22% 397
WI 25% 27% 21% 27% 404
WY 21% 35% 18% 27% 308
NCI Average 23% 37% 22% 18% 16,688

NCI Adult Consumer Survey Final Report 2015-16
Appendices | 123
Table 31. Who person typically went out for entertainment with in the past month (proxy responses allowed)
State Alone Friends or Family
Housemates or Co-
workers
Staff Others Don't know
AL 0% 42% 26% 53% 9% 3%
AR 3% 24% 11% 66% 0% 1%
AZ 4% 68% 10% 22% 0% 1%
CO 8% 47% 18% 44% 0% 0%
CT 6% 42% 21% 56% 1% 2%
DC 5% 24% 17% 73% 0% 2%
DE 2% 18% 32% 61% 1% 9%
FL 4% 47% 20% 46% 1% 1%
GA 7% 49% 23% 63% 7% 5%
HI 1% 34% 1% 49% 10% 6%
IL 2% 42% 29% 51% 0% 3%
IN 3% 51% 1% 46% 0% 1%
KS 2% 46% 26% 49% 0% 4%
KY 2% 43% 4% 60% 0% 1%
LA 4% 46% 14% 56% 0% 2%
MA 6% 33% 26% 55% 1% 3%
ME 3% 22% 9% 48% 7% 2%
MI 6% 45% 27% 48% 2% 0%
MN 4% 47% 16% 49% 1% 1%
MO 2% 24% 36% 71% 0% 1%
MS 2% 31% 19% 43% 1% 1%
NC 1% 37% 18% 59% 1% 1%
NV 14% 39% 45% 69% 1% 3%
NY 4% 25% 24% 42% 2% 1%
OH 5% 42% 14% 49% 2% 2%
OK 1% 34% 20% 62% 0% 1%
PA 3% 41% 10% 43% 1% 3%
RI 4% 43% 23% 62% 1% 4%
SD 8% 42% 15% 54% 0% 5%
TN 0% 29% 37% 74% 0% 1%
UT 1% 41% 31% 59% 1% 2%
VA 1% 33% 37% 62% 1% 2%
VT 6% 30% 2% 46% 1% 3%
WA 9% 52% 9% 37% 0% 0%
WI 6% 56% 14% 37% 1% 2%
WY 7% 44% 16% 55% 1% 3%
NCI Average 4% 39% 19% 53% 2% 2%

NCI Adult Consumer Survey Final Report 2015-16
Appendices | 124
Table 32. Went out to eat at least once in the past month (proxy responses allowed)
State 0 times 1-2 Times
3-4 Times
More Than 5 Times
N
AL 7% 29% 56% 8% 376
AR 18% 28% 21% 34% 379
AZ 17% 62% 12% 9% 468
CO 11% 34% 33% 23% 400
CT 11% 32% 26% 31% 322
DC 18% 36% 33% 13% 372
DE 18% 37% 33% 11% 347
FL 14% 30% 33% 24% 1,412
GA 4% 40% 41% 16% 445
HI 21% 29% 28% 21% 373
IL 7% 50% 28% 14% 372
IN 13% 21% 20% 46% 813
KS 11% 24% 36% 29% 362
KY 7% 54% 28% 12% 446
LA 17% 29% 29% 25% 405
MA 11% 27% 28% 34% 404
ME 15% 21% 27% 38% 390
MI 14% 33% 22% 32% 429
MN 14% 34% 28% 25% 404
MO 8% 25% 35% 32% 393
MS 14% 39% 28% 19% 395
NC 12% 32% 24% 32% 735
NV 14% 33% 24% 28% 374
NY 19% 42% 26% 14% 483
OH 13% 36% 29% 23% 533
OK 12% 19% 30% 39% 396
PA 13% 36% 29% 21% 658
RI 8% 29% 26% 37% 449
SD 11% 37% 33% 19% 326
TN 8% 26% 35% 31% 432
UT 13% 34% 33% 20% 382
VA 12% 30% 29% 30% 808
VT 11% 28% 23% 38% 318
WA 12% 25% 25% 39% 397
WI 16% 31% 25% 28% 403
WY 7% 35% 25% 33% 304
NCI Average 12% 33% 29% 26% 16,705

NCI Adult Consumer Survey Final Report 2015-16
Appendices | 125
Table 33. Who person typically went out to eat with in the past month (proxy responses allowed)
State Alone Friends or Family
Housemates or Co-
workers
Staff Others Don't know
AL 1% 53% 37% 65% 9% 2%
AR 5% 30% 9% 69% 2% 1%
AZ 3% 69% 7% 19% 0% 0%
CO 13% 59% 23% 52% 1% 1%
CT 5% 47% 23% 61% 3% 3%
DC 6% 26% 9% 64% 0% 5%
DE 2% 19% 42% 73% 1% 9%
FL 5% 57% 21% 47% 1% 1%
GA 6% 58% 26% 76% 7% 2%
HI 4% 44% 1% 53% 8% 5%
IL 6% 53% 31% 55% 0% 2%
IN 3% 71% 1% 50% 0% 1%
KS 5% 58% 29% 59% 1% 2%
KY 3% 48% 4% 64% 1% 1%
LA 3% 55% 16% 62% 0% 2%
MA 6% 40% 29% 64% 1% 2%
ME 3% 38% 15% 68% 9% 1%
MI 11% 56% 30% 50% 1% 1%
MN 4% 50% 17% 52% 1% 1%
MO 4% 35% 41% 83% 1% 1%
MS 1% 51% 24% 56% 2% 1%
NC 3% 51% 21% 66% 1% 1%
NV 10% 49% 43% 67% 1% 5%
NY 8% 35% 28% 54% 2% 1%
OH 5% 51% 14% 50% 2% 1%
OK 0% 37% 24% 68% 0% 1%
PA 4% 52% 12% 46% 1% 3%
RI 7% 50% 23% 70% 1% 2%
SD 13% 51% 19% 60% 0% 3%
TN 0% 34% 37% 78% 0% 1%
UT 3% 48% 30% 60% 1% 2%
VA 1% 45% 41% 68% 1% 1%
VT 7% 41% 3% 69% 2% 2%
WA 13% 64% 10% 42% 1% 0%
WI 10% 62% 12% 37% 1% 1%
WY 8% 53% 21% 69% 4% 3%
NCI Average 5% 48% 21% 60% 2% 2%
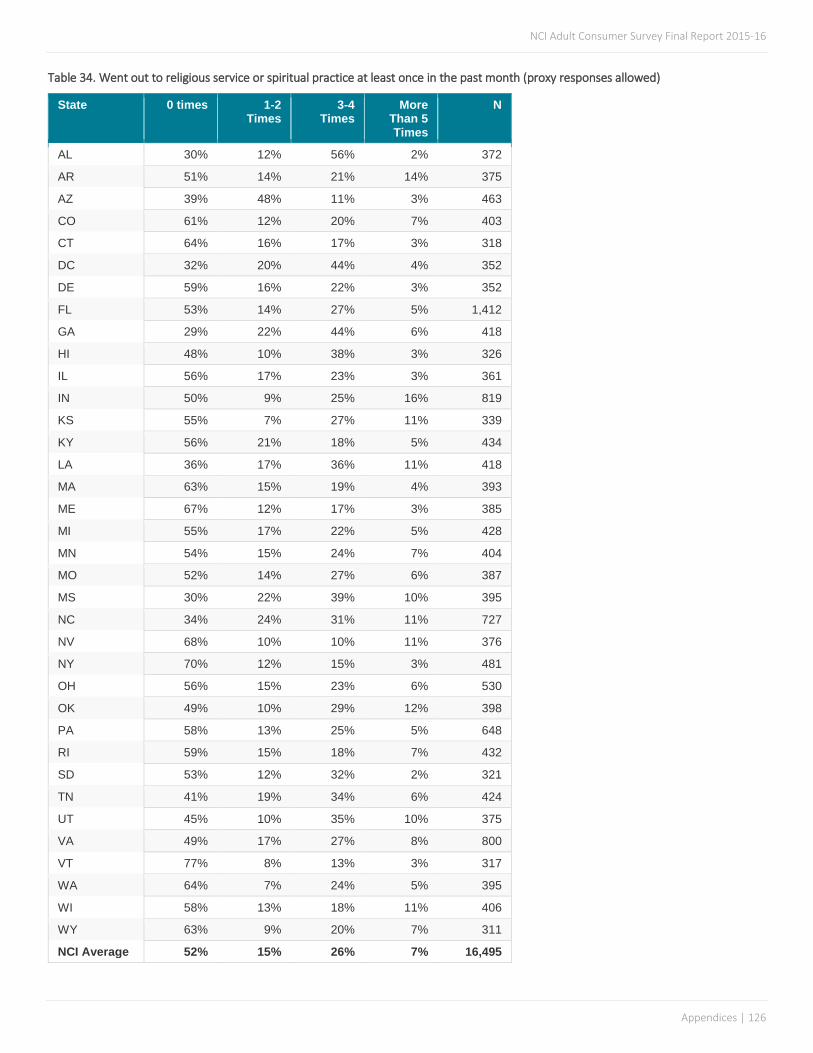
NCI Adult Consumer Survey Final Report 2015-16
Appendices | 126
Table 34. Went out to religious service or spiritual practice at least once in the past month (proxy responses allowed)
State 0 times 1-2 Times
3-4 Times
More Than 5 Times
N
AL 30% 12% 56% 2% 372
AR 51% 14% 21% 14% 375
AZ 39% 48% 11% 3% 463
CO 61% 12% 20% 7% 403
CT 64% 16% 17% 3% 318
DC 32% 20% 44% 4% 352
DE 59% 16% 22% 3% 352
FL 53% 14% 27% 5% 1,412
GA 29% 22% 44% 6% 418
HI 48% 10% 38% 3% 326
IL 56% 17% 23% 3% 361
IN 50% 9% 25% 16% 819
KS 55% 7% 27% 11% 339
KY 56% 21% 18% 5% 434
LA 36% 17% 36% 11% 418
MA 63% 15% 19% 4% 393
ME 67% 12% 17% 3% 385
MI 55% 17% 22% 5% 428
MN 54% 15% 24% 7% 404
MO 52% 14% 27% 6% 387
MS 30% 22% 39% 10% 395
NC 34% 24% 31% 11% 727
NV 68% 10% 10% 11% 376
NY 70% 12% 15% 3% 481
OH 56% 15% 23% 6% 530
OK 49% 10% 29% 12% 398
PA 58% 13% 25% 5% 648
RI 59% 15% 18% 7% 432
SD 53% 12% 32% 2% 321
TN 41% 19% 34% 6% 424
UT 45% 10% 35% 10% 375
VA 49% 17% 27% 8% 800
VT 77% 8% 13% 3% 317
WA 64% 7% 24% 5% 395
WI 58% 13% 18% 11% 406
WY 63% 9% 20% 7% 311
NCI Average 52% 15% 26% 7% 16,495
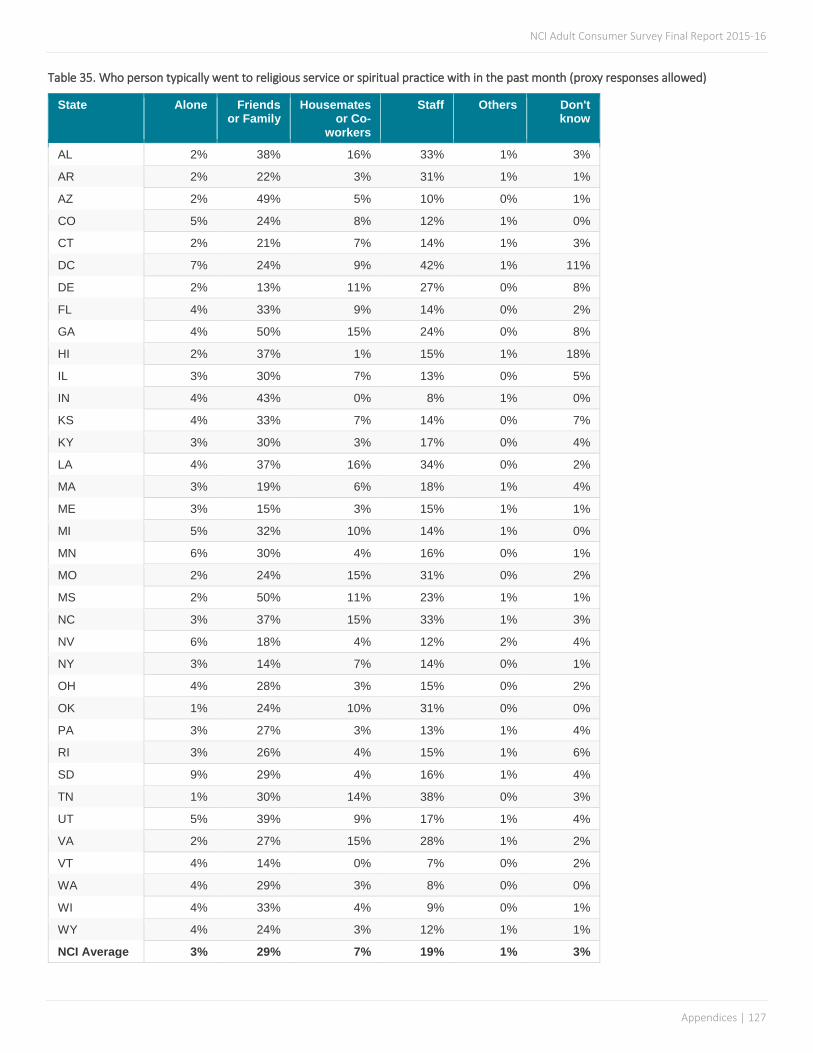
NCI Adult Consumer Survey Final Report 2015-16
Appendices | 127
Table 35. Who person typically went to religious service or spiritual practice with in the past month (proxy responses allowed)
State Alone Friends or Family
Housemates or Co-
workers
Staff Others Don't know
AL 2% 38% 16% 33% 1% 3%
AR 2% 22% 3% 31% 1% 1%
AZ 2% 49% 5% 10% 0% 1%
CO 5% 24% 8% 12% 1% 0%
CT 2% 21% 7% 14% 1% 3%
DC 7% 24% 9% 42% 1% 11%
DE 2% 13% 11% 27% 0% 8%
FL 4% 33% 9% 14% 0% 2%
GA 4% 50% 15% 24% 0% 8%
HI 2% 37% 1% 15% 1% 18%
IL 3% 30% 7% 13% 0% 5%
IN 4% 43% 0% 8% 1% 0%
KS 4% 33% 7% 14% 0% 7%
KY 3% 30% 3% 17% 0% 4%
LA 4% 37% 16% 34% 0% 2%
MA 3% 19% 6% 18% 1% 4%
ME 3% 15% 3% 15% 1% 1%
MI 5% 32% 10% 14% 1% 0%
MN 6% 30% 4% 16% 0% 1%
MO 2% 24% 15% 31% 0% 2%
MS 2% 50% 11% 23% 1% 1%
NC 3% 37% 15% 33% 1% 3%
NV 6% 18% 4% 12% 2% 4%
NY 3% 14% 7% 14% 0% 1%
OH 4% 28% 3% 15% 0% 2%
OK 1% 24% 10% 31% 0% 0%
PA 3% 27% 3% 13% 1% 4%
RI 3% 26% 4% 15% 1% 6%
SD 9% 29% 4% 16% 1% 4%
TN 1% 30% 14% 38% 0% 3%
UT 5% 39% 9% 17% 1% 4%
VA 2% 27% 15% 28% 1% 2%
VT 4% 14% 0% 7% 0% 2%
WA 4% 29% 3% 8% 0% 0%
WI 4% 33% 4% 9% 0% 1%
WY 4% 24% 3% 12% 1% 1%
NCI Average 3% 29% 7% 19% 1% 3%

NCI Adult Consumer Survey Final Report 2015-16
Appendices | 128
Table 36. Participated in a community group in the past month (proxy responses allowed)
State Yes No N
AL 22% 78% 369
AR 33% 67% 368
AZ 19% 81% 466
CO 29% 71% 402
CT 47% 53% 319
DC 29% 71% 338
DE 17% 83% 338
FL 47% 53% 1,399
GA 63% 37% 421
HI 62% 38% 356
IL 40% 60% 352
IN 34% 66% 807
KS 42% 58% 321
KY 16% 84% 426
LA 32% 68% 415
MA 38% 62% 388
ME 28% 72% 381
MI 36% 64% 423
MN 37% 63% 401
MO 45% 55% 385
MS 34% 66% 387
NC 41% 59% 722
NV 47% 53% 381
NY 23% 77% 478
OH 30% 70% 535
OK 36% 64% 397
PA 39% 61% 646
RI 36% 64% 436
SD 41% 59% 313
TN 37% 63% 428
UT 54% 46% 375
VA 42% 58% 790
VT 28% 72% 317
WA 49% 51% 395
WI 36% 64% 403
WY 38% 62% 305
NCI Average 37% 63% 16,383

NCI Adult Consumer Survey Final Report 2015-16
Appendices | 129
Table 37. Who person typically participated in a community group with in the past month (proxy responses allowed)
State Alone Friends or Family
Housemates or Co-
workers
Staff Others Don't know
AL 1% 16% 4% 10% 1% 3%
AR 2% 14% 3% 24% 1% 3%
AZ 2% 11% 0% 9% 0% 1%
CO 3% 19% 6% 16% 1% 2%
CT 3% 21% 8% 28% 1% 4%
DC 4% 9% 2% 20% 1% 14%
DE 1% 4% 8% 13% 0% 10%
FL 4% 29% 11% 23% 2% 2%
GA 6% 37% 13% 45% 4% 6%
HI 0% 24% 2% 48% 1% 11%
IL 2% 20% 11% 20% 1% 7%
IN 4% 22% 0% 17% 0% 1%
KS 2% 25% 13% 27% 1% 12%
KY 2% 10% 1% 8% 0% 5%
LA 2% 18% 7% 20% 0% 3%
MA 3% 15% 10% 25% 0% 6%
ME 3% 11% 4% 15% 1% 5%
MI 5% 18% 12% 20% 2% 2%
MN 4% 18% 7% 21% 1% 2%
MO 2% 19% 18% 38% 1% 1%
MS 1% 19% 10% 18% 1% 3%
NC 2% 22% 6% 26% 1% 3%
NV 11% 21% 22% 34% 1% 2%
NY 4% 8% 7% 13% 1% 1%
OH 4% 18% 4% 13% 1% 1%
OK 1% 18% 8% 23% 1% 1%
PA 3% 21% 4% 19% 2% 3%
RI 3% 17% 7% 26% 1% 5%
SD 7% 21% 5% 22% 1% 6%
TN 0% 12% 14% 30% 1% 2%
UT 2% 27% 18% 35% 1% 3%
VA 2% 17% 16% 30% 1% 3%
VT 4% 15% 1% 21% 1% 2%
WA 11% 34% 6% 20% 1% 0%
WI 6% 24% 5% 12% 1% 3%
WY 5% 19% 6% 21% 3% 4%
NCI Average 3% 19% 8% 22% 1% 4%
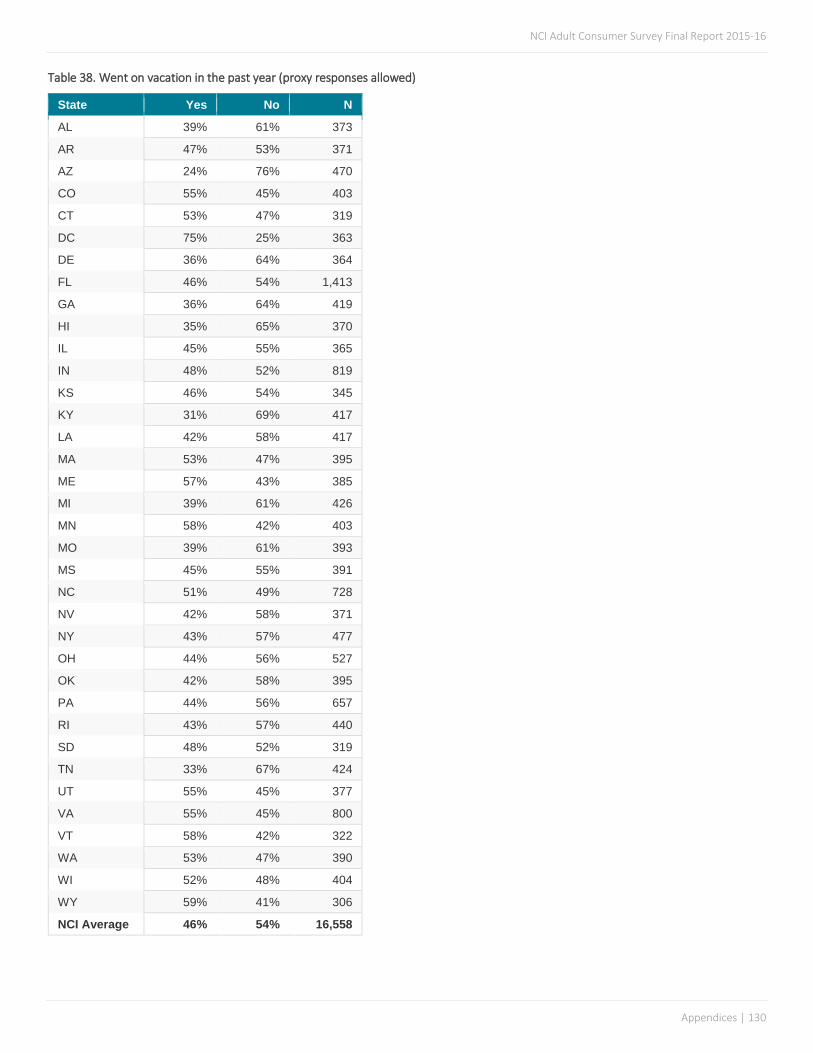
NCI Adult Consumer Survey Final Report 2015-16
Appendices | 130
Table 38. Went on vacation in the past year (proxy responses allowed)
State Yes No N
AL 39% 61% 373
AR 47% 53% 371
AZ 24% 76% 470
CO 55% 45% 403
CT 53% 47% 319
DC 75% 25% 363
DE 36% 64% 364
FL 46% 54% 1,413
GA 36% 64% 419
HI 35% 65% 370
IL 45% 55% 365
IN 48% 52% 819
KS 46% 54% 345
KY 31% 69% 417
LA 42% 58% 417
MA 53% 47% 395
ME 57% 43% 385
MI 39% 61% 426
MN 58% 42% 403
MO 39% 61% 393
MS 45% 55% 391
NC 51% 49% 728
NV 42% 58% 371
NY 43% 57% 477
OH 44% 56% 527
OK 42% 58% 395
PA 44% 56% 657
RI 43% 57% 440
SD 48% 52% 319
TN 33% 67% 424
UT 55% 45% 377
VA 55% 45% 800
VT 58% 42% 322
WA 53% 47% 390
WI 52% 48% 404
WY 59% 41% 306
NCI Average 46% 54% 16,558

NCI Adult Consumer Survey Final Report 2015-16
Appendices | 131
Table 39. Who person typically went on vacation with in the past year (proxy responses allowed)
State Alone Friends or Family
Housemates or Co-
workers
Staff Others Don't know
AL 1% 27% 8% 15% 3% 3%
AR 1% 30% 4% 21% 0% 2%
AZ 0% 21% 1% 3% 1% 0%
CO 3% 41% 8% 16% 1% 0%
CT 4% 33% 7% 19% 2% 3%
DC 1% 22% 18% 56% 0% 8%
DE 2% 18% 6% 17% 1% 6%
FL 2% 37% 6% 9% 0% 2%
GA 1% 28% 5% 9% 0% 8%
HI 1% 30% 0% 6% 1% 6%
IL 0% 39% 4% 6% 1% 3%
IN 1% 44% 0% 5% 0% 0%
KS 1% 40% 5% 10% 0% 6%
KY 0% 23% 1% 10% 0% 6%
LA 1% 34% 4% 10% 0% 3%
MA 5% 28% 11% 23% 2% 2%
ME 12% 27% 6% 32% 4% 2%
MI 1% 30% 5% 9% 1% 1%
MN 3% 40% 7% 15% 2% 0%
MO 0% 22% 14% 21% 2% 1%
MS 1% 34% 6% 13% 0% 2%
NC 0% 39% 8% 16% 1% 2%
NV 4% 31% 7% 10% 3% 4%
NY 1% 23% 9% 18% 2% 2%
OH 1% 33% 5% 11% 1% 3%
OK 1% 31% 4% 18% 0% 1%
PA 2% 32% 2% 11% 2% 3%
RI 1% 29% 4% 15% 1% 5%
SD 2% 37% 4% 13% 1% 5%
TN 1% 23% 6% 13% 0% 3%
UT 0% 42% 7% 15% 1% 3%
VA 2% 32% 16% 25% 1% 2%
VT 7% 33% 1% 24% 0% 1%
WA 1% 47% 2% 8% 1% 1%
WI 5% 43% 4% 11% 1% 2%
WY 5% 45% 6% 16% 2% 3%
NCI Average 2% 32% 6% 15% 1% 3%

NCI Adult Consumer Survey Final Report 2015-16
Appendices | 132
Table 40. Able to go out and do the things like to do in the community
State Yes In-between No N
AL 83% 13% 4% 334
AR 91% 7% 1% 219
AZ 93% 6% 1% 412
CO 78% 19% 3% 304
CT 89% 8% 2% 244
DC 87% 12% 2% 189
DE 70% 23% 7% 232
FL 84% 14% 1% 836
GA 90% 9% 1% 299
HI 86% 9% 6% 188
IL 85% 13% 2% 252
IN 92% 5% 3% 571
KS 84% 13% 3% 255
KY 92% 6% 2% 299
LA 86% 12% 2% 287
MA 88% 9% 3% 311
ME 80% 18% 2% 280
MI 77% 21% 2% 273
MN 89% 8% 2% 251
MO 85% 14% 1% 265
MS 79% 15% 6% 283
NC 85% 13% 2% 428
NV 81% 15% 4% 339
NY 83% 14% 3% 303
OH 89% 9% 2% 386
OK 86% 10% 4% 207
PA 92% 6% 2% 432
RI 82% 14% 3% 340
SD 82% 14% 4% 285
TN 89% 9% 2% 330
UT 88% 10% 2% 243
VA 90% 8% 2% 499
VT 65% 29% 5% 252
WA 91% 7% 1% 257
WI 78% 19% 3% 285
WY 80% 15% 5% 237
NCI Average 85% 12% 3% 11,407

NCI Adult Consumer Survey Final Report 2015-16
Appendices | 133
Table 41. Able to go out and do the things likes to do in the community as often as wants to
State Yes No N
AL 59% 41% 319
AR 73% 27% 211
AZ 92% 8% 400
CO 73% 27% 282
CT 83% 17% 219
DC 76% 24% 182
DE 62% 38% 201
FL 79% 21% 791
GA 86% 14% 277
HI 72% 28% 148
IL 80% 20% 214
IN 78% 22% 526
KS 83% 17% 233
KY 91% 9% 287
LA 79% 21% 260
MA 79% 21% 279
ME 54% 46% 258
MI 70% 30% 250
MN 80% 20% 241
MO 76% 24% 250
MS 75% 25% 261
NC 76% 24% 402
NV 74% 26% 310
NY 77% 23% 281
OH 77% 23% 364
OK 76% 24% 192
PA 87% 13% 398
RI 76% 24% 309
SD 69% 31% 267
TN 85% 15% 314
UT 81% 19% 224
VA 80% 20% 469
VT 56% 44% 228
WA 85% 15% 248
WI 63% 37% 257
WY 73% 27% 201
NCI Average 76% 24% 10,553

NCI Adult Consumer Survey Final Report 2015-16
Appendices | 134
Table 42. Has enough things to do when at home
State Yes In-between
No N
AL 77% 13% 10% 328
AR 83% 12% 6% 223
AZ 96% 3% 1% 418
CO 87% 11% 2% 307
CT 84% 10% 6% 244
DC 78% 13% 9% 190
DE 62% 21% 17% 238
FL 84% 12% 3% 837
GA 85% 11% 4% 303
HI 71% 18% 11% 193
IL 88% 9% 3% 260
IN 92% 4% 3% 574
KS 81% 16% 3% 256
KY 89% 8% 3% 299
LA 82% 11% 7% 289
MA 83% 13% 4% 304
ME 66% 22% 12% 284
MI 78% 18% 4% 278
MN 89% 6% 6% 254
MO 86% 10% 3% 265
MS 71% 15% 14% 290
NC 85% 10% 5% 432
NV 72% 16% 11% 346
NY 81% 11% 8% 307
OH 84% 9% 7% 391
OK 79% 13% 8% 210
PA 91% 6% 4% 434
RI 80% 13% 7% 349
SD 83% 11% 6% 284
TN 91% 5% 4% 333
UT 84% 10% 7% 243
VA 87% 7% 6% 501
VT 69% 24% 7% 262
WA 92% 4% 5% 264
WI 90% 3% 7% 290
WY 79% 14% 7% 234
NCI Average 82% 11% 6% 11,514

NCI Adult Consumer Survey Final Report 2015-16
Appendices | 135
Relationships (un-collapsed)
Table 43. Have friends who are not staff or family members
State Has Friends Who Are Not Staff or Family
All Friends Are Staff or Family
Does Not Have Friends
N
AL 89% 5% 6% 331
AR 78% 14% 9% 221
AZ 67% 30% 3% 422
CO 78% 10% 13% 304
CT 74% 22% 4% 245
DC 81% 9% 10% 192
DE 68% 23% 9% 253
FL 77% 16% 8% 852
GA 84% 10% 6% 307
HI 67% 19% 13% 196
IL 82% 9% 9% 260
IN 87% 4% 9% 575
KS 74% 17% 9% 258
KY 60% 37% 3% 300
LA 81% 9% 11% 292
MA 82% 10% 8% 309
ME 88% 4% 8% 285
MI 70% 21% 9% 282
MN 83% 11% 6% 246
MO 81% 12% 7% 267
MS 81% 13% 6% 290
NC 69% 20% 10% 438
NV 71% 15% 14% 345
NY 71% 14% 15% 312
OH 79% 15% 6% 392
OK 73% 17% 9% 212
PA 74% 13% 13% 438
RI 75% 18% 7% 352
SD 83% 12% 5% 281
TN 87% 11% 2% 331
UT 70% 22% 8% 239
VA 82% 12% 6% 500
VT 71% 10% 19% 268
WA 83% 9% 8% 262
WI 80% 7% 12% 291
WY 83% 9% 9% 233
NCI Average 77% 14% 9% 11,581

NCI Adult Consumer Survey Final Report 2015-16
Appendices | 136
Table 44. Wants more help to meet or keep in contact with friends
State Yes Maybe, Not Sure
No N
AL 49% 12% 39% 327
AR 38% 7% 55% 216
AZ 14% 2% 84% 418
CO 37% 14% 49% 295
CT 45% 8% 47% 239
DC 36% 9% 54% 180
DE 45% 4% 51% 220
FL 35% 11% 54% 800
GA 27% 16% 57% 282
HI 44% 3% 53% 185
IL 25% 6% 69% 251
IN 36% 5% 59% 529
KS 32% 9% 60% 240
KY 16% 8% 76% 293
LA 35% 12% 53% 288
MA 44% 12% 45% 286
ME 34% 6% 59% 270
MI 38% 9% 53% 271
MN 39% 8% 53% 241
MO 35% 10% 55% 233
MS 40% 3% 56% 280
NC 31% 9% 61% 413
NV 58% 7% 35% 333
NY 32% 9% 59% 296
OH 37% 5% 59% 374
OK 67% 5% 28% 195
PA 25% 4% 72% 388
RI 49% 9% 41% 331
SD 46% 8% 47% 270
TN 25% 2% 73% 328
UT 52% 5% 43% 220
VA 35% 11% 54% 470
VT 34% 12% 54% 242
WA 25% 9% 66% 255
WI 30% 4% 66% 274
WY 23% 7% 70% 225
NCI Average 36% 8% 56% 10,958

NCI Adult Consumer Survey Final Report 2015-16
Appendices | 137
Table 45. Have friends (may be staff or family) and the support needed to see their friends when they want
State Yes Sometimes Can't See
Friends
No, or Often
Unable
N
AL 74% 24% 2% 316
AR 89% 6% 5% 196
AZ 90% 8% 2% 397
CO 72% 21% 7% 259
CT 76% 16% 8% 234
DC 77% 14% 9% 168
DE 72% 20% 9% 220
FL 79% 17% 4% 760
GA 79% 18% 4% 280
HI 80% 7% 13% 166
IL 82% 17% 1% 221
IN 80% 14% 6% 523
KS 90% 7% 2% 242
KY 88% 9% 3% 285
LA 83% 11% 6% 262
MA 82% 12% 5% 282
ME 57% 39% 4% 236
MI 78% 17% 5% 246
MN 77% 15% 8% 237
MO 82% 14% 4% 233
MS 84% 12% 5% 269
NC 81% 13% 6% 372
NV 76% 17% 8% 303
NY 83% 14% 4% 253
OH 82% 11% 7% 355
OK 77% 17% 6% 188
PA 89% 7% 4% 368
RI 78% 15% 7% 317
SD 84% 11% 4% 273
TN 89% 9% 2% 328
UT 83% 14% 4% 220
VA 85% 10% 5% 445
VT 58% 33% 9% 215
WA 82% 14% 4% 243
WI 79% 16% 6% 250
WY 82% 14% 5% 212
NCI Average 80% 15% 5% 10,374

NCI Adult Consumer Survey Final Report 2015-16
Appendices | 138
Table 46. Reasons cannot always see friends
State Lack of Transportation
Lack of Staff
Rules and Restrictions
Cost Difficulty Finding
Time
Other N
AL 55% 1% 7% 3% 32% 3% 76
AR N/A N/A N/A N/A N/A N/A N/A
AZ 32% 6% 32% 3% 6% 21% 34
CO 15% 6% 12% 1% 51% 15% 67
CT 27% 24% 16% 2% 9% 22% 45
DC 48% 19% 15% 7% 11% 0% 27
DE 20% 12% 27% 2% 31% 8% 51
FL 34% 9% 7% 9% 29% 13% 152
GA 58% 13% 6% 4% 15% 4% 48
HI 33% 0% 7% 0% 4% 56% 27
IL 39% 13% 9% 9% 9% 22% 23
IN 22% 2% 3% 0% 57% 15% 89
KS N/A N/A N/A N/A N/A N/A N/A
KY 45% 7% 31% 3% 10% 3% 29
LA 16% 9% 14% 0% 23% 39% 44
MA 24% 16% 11% 2% 27% 20% 45
ME 35% 10% 4% 1% 26% 23% 91
MI 49% 2% 15% 5% 12% 17% 41
MN 34% 8% 6% 6% 34% 12% 50
MO 11% 17% 25% 11% 19% 17% 36
MS 34% 5% 3% 3% 34% 21% 38
NC 42% 6% 8% 3% 12% 29% 65
NV 28% 4% 14% 5% 28% 20% 74
NY 32% 14% 11% 3% 27% 14% 37
OH 36% 9% 7% 2% 26% 21% 58
OK 18% 0% 15% 3% 21% 44% 39
PA 25% 14% 8% 3% 11% 39% 36
RI 23% 13% 8% 2% 34% 20% 61
SD 30% 19% 16% 8% 14% 14% 37
TN 12% 6% 9% 3% 48% 21% 33
UT 29% 9% 17% 3% 26% 17% 35
VA 41% 8% 6% 4% 31% 10% 51
VT 35% 1% 2% 1% 49% 11% 81
WA 19% 7% 9% 2% 47% 16% 43
WI 40% 4% 0% 4% 32% 20% 50
WY 19% 13% 19% 3% 16% 31% 32
NCI Average 31% 9% 12% 4% 25% 19% 1,745
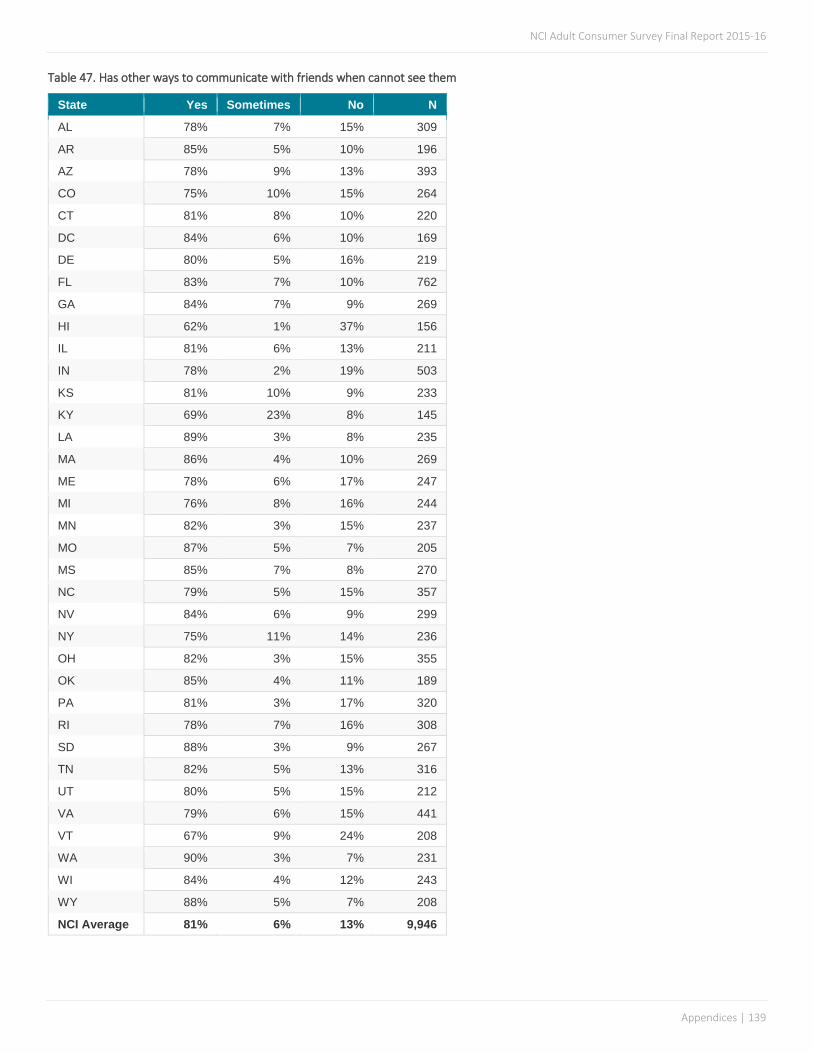
NCI Adult Consumer Survey Final Report 2015-16
Appendices | 139
Table 47. Has other ways to communicate with friends when cannot see them
State Yes Sometimes No N
AL 78% 7% 15% 309
AR 85% 5% 10% 196
AZ 78% 9% 13% 393
CO 75% 10% 15% 264
CT 81% 8% 10% 220
DC 84% 6% 10% 169
DE 80% 5% 16% 219
FL 83% 7% 10% 762
GA 84% 7% 9% 269
HI 62% 1% 37% 156
IL 81% 6% 13% 211
IN 78% 2% 19% 503
KS 81% 10% 9% 233
KY 69% 23% 8% 145
LA 89% 3% 8% 235
MA 86% 4% 10% 269
ME 78% 6% 17% 247
MI 76% 8% 16% 244
MN 82% 3% 15% 237
MO 87% 5% 7% 205
MS 85% 7% 8% 270
NC 79% 5% 15% 357
NV 84% 6% 9% 299
NY 75% 11% 14% 236
OH 82% 3% 15% 355
OK 85% 4% 11% 189
PA 81% 3% 17% 320
RI 78% 7% 16% 308
SD 88% 3% 9% 267
TN 82% 5% 13% 316
UT 80% 5% 15% 212
VA 79% 6% 15% 441
VT 67% 9% 24% 208
WA 90% 3% 7% 231
WI 84% 4% 12% 243
WY 88% 5% 7% 208
NCI Average 81% 6% 13% 9,946

NCI Adult Consumer Survey Final Report 2015-16
Appendices | 140
Table 48. Can see and communicate with their family when they want
State Whenever Person Wants or Chooses Not to See Family
Sometimes No N
AL 73% 21% 6% 323
AR 88% 10% 2% 212
AZ 96% 2% 2% 413
CO 83% 10% 6% 277
CT 90% 9% 1% 229
DC 80% 15% 5% 168
DE 79% 16% 5% 222
FL 84% 11% 4% 803
GA 90% 9% 2% 290
HI 90% 5% 5% 190
IL 85% 12% 2% 241
IN 92% 4% 4% 567
KS 93% 5% 2% 244
KY 75% 22% 3% 298
LA 86% 11% 3% 284
MA 89% 9% 2% 288
ME 61% 30% 9% 237
MI 87% 11% 2% 268
MN 94% 5% 1% 238
MO 84% 12% 4% 244
MS 86% 11% 3% 278
NC 82% 13% 5% 418
NV 88% 10% 2% 323
NY 79% 18% 3% 282
OH 91% 7% 2% 367
OK 85% 9% 6% 200
PA 93% 5% 1% 353
RI 86% 10% 4% 322
SD 85% 10% 5% 280
TN 90% 7% 3% 309
UT 86% 9% 5% 237
VA 86% 12% 2% 464
VT 70% 19% 11% 246
WA 93% 5% 2% 250
WI 88% 8% 4% 278
WY 84% 10% 6% 231
NCI Average 85% 11% 4% 10,874

NCI Adult Consumer Survey Final Report 2015-16
Appendices | 141
Table 49. Feel lonely at least half the time
State Yes, Often Sometimes No, Not Often N
AL 14% 38% 48% 326
AR 16% 36% 48% 223
AZ 5% 8% 87% 415
CO 16% 35% 49% 302
CT 9% 30% 61% 244
DC 12% 40% 48% 191
DE 19% 32% 49% 243
FL 8% 29% 63% 824
GA 6% 42% 53% 297
HI 15% 26% 59% 188
IL 12% 41% 47% 250
IN 12% 24% 64% 563
KS 18% 37% 45% 262
KY 5% 31% 64% 298
LA 7% 32% 61% 285
MA 13% 34% 53% 293
ME 16% 29% 56% 273
MI 12% 32% 56% 277
MN 11% 31% 58% 252
MO 9% 29% 62% 259
MS 14% 42% 44% 286
NC 10% 37% 53% 430
NV 17% 30% 53% 339
NY 9% 36% 54% 307
OH 11% 30% 59% 382
OK 11% 32% 57% 209
PA 6% 31% 63% 418
RI 14% 32% 55% 339
SD 13% 40% 47% 276
TN 7% 27% 66% 331
UT 16% 36% 47% 231
VA 8% 31% 61% 472
VT 10% 38% 51% 259
WA 11% 33% 56% 257
WI 15% 27% 58% 282
WY 14% 39% 47% 233
NCI Average 12% 33% 56% 11,316

NCI Adult Consumer Survey Final Report 2015-16
Appendices | 142
Table 50. Can go on a date if they want or can date with some restriction
State Can Date, Is Married, or Living
With Partner
With Restrictions or Rules
No N
AL 79% 3% 18% 312
AR 73% 19% 8% 182
AZ 17% 67% 16% 389
CO 74% 11% 15% 243
CT 49% 30% 21% 187
DC 66% 15% 19% 175
DE 57% 34% 9% 202
FL 79% 9% 12% 639
GA 82% 12% 6% 267
HI 52% 16% 32% 146
IL 59% 16% 25% 209
IN 71% 9% 20% 461
KS 85% 9% 6% 235
KY 58% 27% 15% 233
LA 68% 20% 12% 227
MA 77% 12% 12% 252
ME 74% 19% 7% 199
MI 76% 13% 11% 230
MN 70% 21% 9% 199
MO 77% 14% 9% 202
MS 70% 15% 15% 198
NC 56% 30% 14% 373
NV 71% 17% 12% 312
NY 69% 14% 17% 213
OH 79% 10% 11% 328
OK 68% 13% 19% 192
PA 73% 17% 11% 320
RI 68% 15% 17% 302
SD 80% 12% 8% 255
TN 85% 8% 8% 253
UT 74% 16% 10% 210
VA 58% 19% 23% 398
VT 88% 4% 8% 197
WA 87% 6% 7% 184
WI 82% 10% 8% 208
WY 72% 18% 10% 213
NCI Average 70% 17% 13% 9,345

NCI Adult Consumer Survey Final Report 2015-16
Appendices | 143
Satisfaction (un-collapsed)
Table 51. Like their home
State Yes In-between No N
AL 89% 5% 6% 334
AR 93% 3% 4% 223
AZ 98% 1% 1% 420
CO 86% 9% 4% 308
CT 90% 6% 4% 247
DC 88% 7% 5% 195
DE 83% 8% 9% 278
FL 91% 7% 2% 872
GA 90% 9% 1% 311
HI 94% 3% 3% 200
IL 91% 4% 5% 260
IN 97% 2% 1% 587
KS 86% 10% 4% 273
KY 89% 7% 4% 301
LA 92% 4% 3% 293
MA 86% 7% 7% 314
ME 83% 11% 6% 287
MI 89% 6% 5% 287
MN 89% 6% 5% 253
MO 85% 8% 6% 274
MS 87% 6% 6% 315
NC 90% 7% 3% 448
NV 80% 10% 10% 349
NY 86% 7% 7% 323
OH 87% 6% 7% 403
OK 93% 3% 4% 212
PA 90% 5% 5% 447
RI 91% 6% 4% 350
SD 89% 6% 4% 289
TN 93% 4% 3% 336
UT 91% 5% 5% 243
VA 91% 6% 3% 508
VT 92% 6% 2% 288
WA 86% 9% 4% 267
WI 89% 5% 6% 292
WY 86% 11% 3% 236
NCI Average 89% 6% 4% 11,823

NCI Adult Consumer Survey Final Report 2015-16
Appendices | 144
Table 52. Reasons why person does not like home (categories are not mutually exclusive)
State Accessibility Feels Unsafe in
Neighborhood
Home Needs Repairs and
Upkeep
Doesn't Feel Like Home
N
AL 0% 0% 1% 1% 334
AR 0% 0% 1% 1% 223
AZ 1% 0% 0% 0% 421
CO 0% 2% 1% 1% 308
CT 0% 0% 0% 0% 249
DC 1% 2% 2% 1% 194
DE 1% 3% 1% 4% 277
FL 0% 1% 1% 1% 878
GA 0% 1% 0% 0% 310
HI 1% 0% 0% 0% 200
IL 0% 2% 0% 1% 262
IN 0% 0% 1% 0% 589
KS 0% 0% 0% 1% 280
KY 0% 2% 3% 2% 300
LA 0% 2% 1% 2% 293
MA 1% 2% 1% 1% 313
ME 0% 1% 1% 2% 287
MI 0% 1% 1% 1% 288
MN 0% 1% 1% 3% 256
MO 1% 1% 2% 2% 277
MS 1% 2% 1% 3% 335
NC 0% 0% 1% 1% 450
NV 2% 1% 0% 3% 310
NY 1% 2% 1% 1% 325
OH 1% 1% 1% 1% 403
OK 0% 0% 0% 0% 212
PA 1% 1% 1% 0% 453
RI 1% 1% 1% 1% 347
SD 0% 1% 1% 2% 290
TN 0% 1% 1% 1% 340
UT 1% 2% 2% 2% 244
VA 0% 1% 0% 1% 508
VT 0% 0% 0% 1% 293
WA 2% 1% 1% 1% 267
WI 1% 0% 1% 1% 296
WY 1% 0% 1% 1% 237
NCI Average 1% 1% 1% 1% 11,849

NCI Adult Consumer Survey Final Report 2015-16
Appendices | 145
Table 53. Reasons why person does not like home, continued (categories are not mutually exclusive)
State Problems With
Roommates
Problems With Staff
Closer to Family or
Friends
More Independence
Other N
AL 3% 0% 1% 3% 2% 334
AR 1% 0% 2% 1% 3% 223
AZ 0% 1% 0% 0% 1% 421
CO 4% 2% 3% 6% 6% 308
CT 1% 1% 2% 3% 4% 249
DC 3% 3% 1% 4% 3% 194
DE 8% 6% 3% 4% 1% 277
FL 2% 0% 1% 2% 3% 878
GA 0% 1% 2% 2% 4% 310
HI 0% 0% 0% 0% 5% 200
IL 3% 0% 2% 2% 2% 262
IN 0% 0% 0% 1% 1% 589
KS 2% 1% 2% 4% 5% 280
KY 7% 2% 1% 2% 1% 300
LA 1% 1% 3% 2% 1% 293
MA 5% 3% 4% 5% 3% 313
ME 5% 2% 5% 4% 5% 287
MI 3% 2% 2% 3% 3% 288
MN 5% 4% 2% 4% 4% 256
MO 3% 2% 4% 4% 5% 277
MS 3% 2% 4% 2% 3% 335
NC 2% 1% 1% 2% 4% 450
NV 5% 3% 2% 7% 10% 310
NY 1% 1% 2% 2% 5% 325
OH 2% 1% 2% 2% 6% 403
OK 0% 0% 0% 0% 1% 212
PA 1% 1% 1% 2% 3% 453
RI 2% 1% 1% 1% 4% 347
SD 3% 2% 3% 2% 3% 290
TN 3% 1% 0% 1% 2% 340
UT 2% 1% 2% 1% 2% 244
VA 2% 1% 2% 2% 3% 508
VT 1% 1% 1% 2% 2% 293
WA 2% 1% 0% 2% 6% 267
WI 2% 1% 2% 4% 5% 296
WY 3% 2% 3% 5% 5% 237
NCI Average 3% 1% 2% 3% 3% 11,849

NCI Adult Consumer Survey Final Report 2015-16
Appendices | 146
Table 54. Want to live somewhere else
State Yes In-between
No N
AL 28% 4% 68% 329
AR 32% 7% 61% 222
AZ 13% 4% 83% 418
CO 20% 17% 63% 304
CT 31% 8% 61% 236
DC 32% 8% 59% 189
DE 43% 8% 49% 263
FL 23% 10% 68% 856
GA 21% 9% 70% 302
HI 23% 3% 73% 196
IL 27% 6% 67% 252
IN 21% 4% 75% 560
KS 23% 10% 68% 260
KY 19% 3% 78% 297
LA 29% 11% 60% 275
MA 26% 11% 63% 301
ME 27% 12% 62% 282
MI 29% 7% 64% 281
MN 29% 11% 60% 250
MO 28% 7% 64% 269
MS 23% 7% 69% 311
NC 28% 9% 64% 433
NV 46% 10% 44% 335
NY 20% 8% 72% 317
OH 32% 10% 58% 388
OK 31% 9% 60% 206
PA 23% 7% 70% 435
RI 27% 12% 62% 338
SD 37% 10% 53% 278
TN 17% 3% 80% 332
UT 28% 9% 63% 239
VA 25% 7% 68% 482
VT 27% 13% 61% 272
WA 22% 19% 59% 258
WI 28% 8% 64% 289
WY 26% 13% 61% 237
NCI Average 27% 9% 65% 11,492
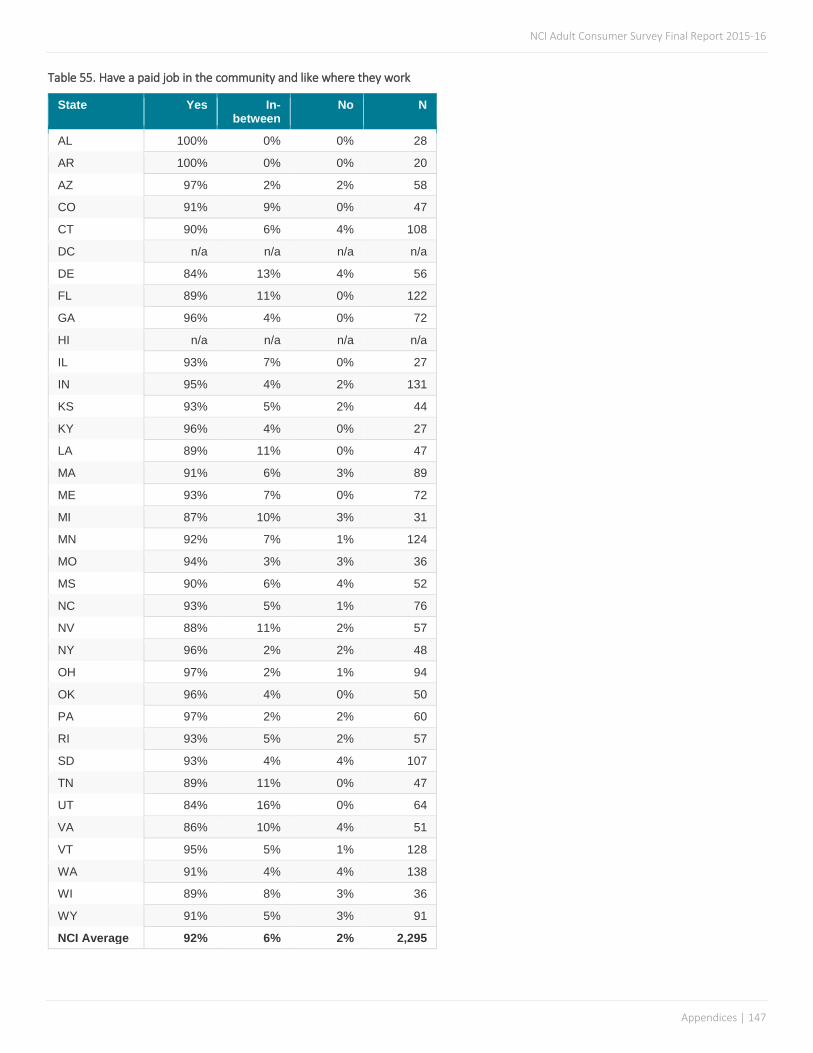
NCI Adult Consumer Survey Final Report 2015-16
Appendices | 147
Table 55. Have a paid job in the community and like where they work
State Yes In-between
No N
AL 100% 0% 0% 28
AR 100% 0% 0% 20
AZ 97% 2% 2% 58
CO 91% 9% 0% 47
CT 90% 6% 4% 108
DC n/a n/a n/a n/a
DE 84% 13% 4% 56
FL 89% 11% 0% 122
GA 96% 4% 0% 72
HI n/a n/a n/a n/a
IL 93% 7% 0% 27
IN 95% 4% 2% 131
KS 93% 5% 2% 44
KY 96% 4% 0% 27
LA 89% 11% 0% 47
MA 91% 6% 3% 89
ME 93% 7% 0% 72
MI 87% 10% 3% 31
MN 92% 7% 1% 124
MO 94% 3% 3% 36
MS 90% 6% 4% 52
NC 93% 5% 1% 76
NV 88% 11% 2% 57
NY 96% 2% 2% 48
OH 97% 2% 1% 94
OK 96% 4% 0% 50
PA 97% 2% 2% 60
RI 93% 5% 2% 57
SD 93% 4% 4% 107
TN 89% 11% 0% 47
UT 84% 16% 0% 64
VA 86% 10% 4% 51
VT 95% 5% 1% 128
WA 91% 4% 4% 138
WI 89% 8% 3% 36
WY 91% 5% 3% 91
NCI Average 92% 6% 2% 2,295
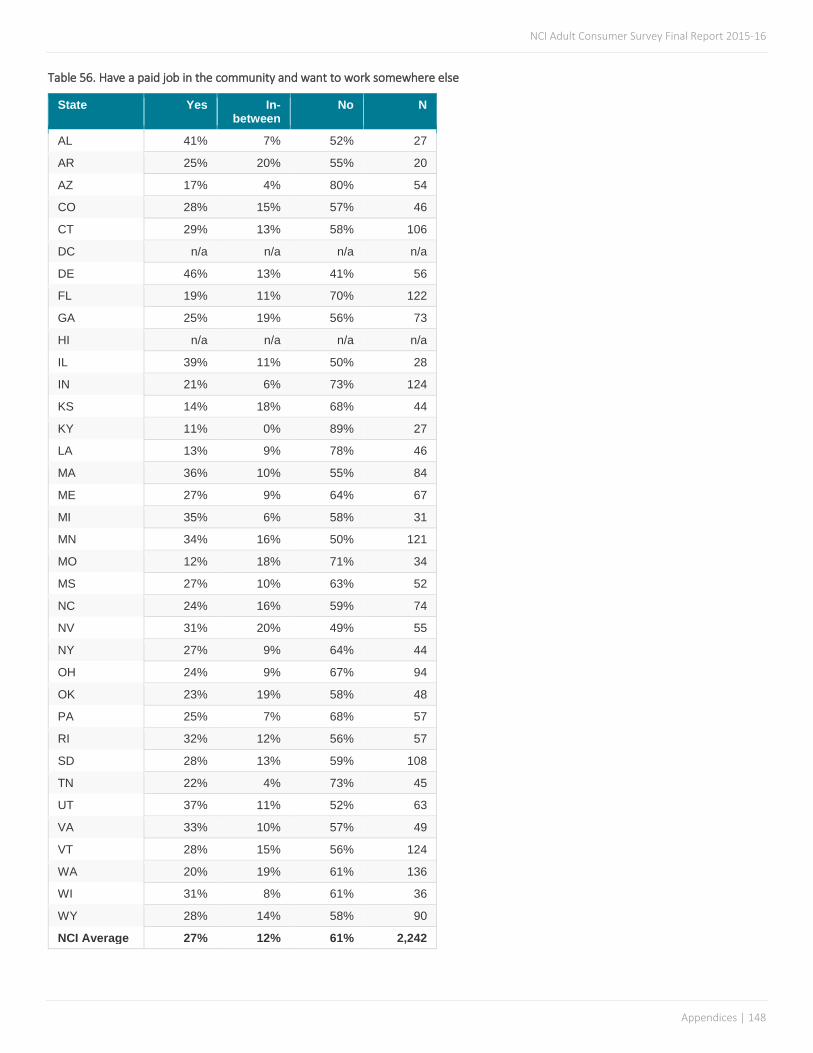
NCI Adult Consumer Survey Final Report 2015-16
Appendices | 148
Table 56. Have a paid job in the community and want to work somewhere else
State Yes In-between
No N
AL 41% 7% 52% 27
AR 25% 20% 55% 20
AZ 17% 4% 80% 54
CO 28% 15% 57% 46
CT 29% 13% 58% 106
DC n/a n/a n/a n/a
DE 46% 13% 41% 56
FL 19% 11% 70% 122
GA 25% 19% 56% 73
HI n/a n/a n/a n/a
IL 39% 11% 50% 28
IN 21% 6% 73% 124
KS 14% 18% 68% 44
KY 11% 0% 89% 27
LA 13% 9% 78% 46
MA 36% 10% 55% 84
ME 27% 9% 64% 67
MI 35% 6% 58% 31
MN 34% 16% 50% 121
MO 12% 18% 71% 34
MS 27% 10% 63% 52
NC 24% 16% 59% 74
NV 31% 20% 49% 55
NY 27% 9% 64% 44
OH 24% 9% 67% 94
OK 23% 19% 58% 48
PA 25% 7% 68% 57
RI 32% 12% 56% 57
SD 28% 13% 59% 108
TN 22% 4% 73% 45
UT 37% 11% 52% 63
VA 33% 10% 57% 49
VT 28% 15% 56% 124
WA 20% 19% 61% 136
WI 31% 8% 61% 36
WY 28% 14% 58% 90
NCI Average 27% 12% 61% 2,242

NCI Adult Consumer Survey Final Report 2015-16
Appendices | 149
Table 57. Attend a day program or workshop and wants to go less often
State More About the Same
Less N
AL 23% 55% 23% 304
AR 28% 53% 19% 134
AZ 8% 88% 4% 218
CO 18% 69% 13% 182
CT 38% 51% 11% 99
DE 27% 40% 33% 187
FL 12% 74% 14% 354
GA 8% 85% 7% 202
HI 27% 60% 13% 128
IL 21% 63% 16% 198
IN 22% 66% 11% 303
KS 7% 80% 13% 170
KY 5% 75% 20% 215
LA 21% 68% 11% 132
MA 22% 60% 18% 194
ME 10% 72% 19% 200
MI 27% 62% 11% 140
MN 29% 52% 18% 119
MO 18% 70% 12% 108
MS 32% 42% 26% 216
NC 24% 67% 9% 243
NV 36% 47% 16% 225
NY 19% 75% 5% 166
OH 17% 65% 18% 239
OK 24% 54% 22% 63
PA 23% 67% 10% 211
RI 25% 55% 20% 222
SD 28% 54% 18% 165
TN 21% 66% 13% 148
UT 15% 68% 17% 133
VA 14% 71% 14% 312
VT 42% 44% 14% 36
WA 52% 39% 9% 23
WI 26% 60% 14% 108
WY 24% 55% 22% 102
DC n/a n/a n/a n/a
NCI Average 23% 61% 17% 6,199

NCI Adult Consumer Survey Final Report 2015-16
Appendices | 150
Table 58. Services and Supports help person live a good life
State Yes In-between
No N
AL 95% 3% 2% 333
AR 93% 5% 2% 225
AZ 97% 2% 1% 416
CO 89% 9% 2% 307
CT 93% 7% 1% 241
DC 88% 8% 4% 168
DE 87% 8% 5% 230
FL 94% 6% 0% 827
GA 92% 8% 0% 300
HI 93% 4% 4% 195
IL 94% 6% 0% 254
IN 95% 4% 1% 566
KS 90% 8% 1% 252
KY 92% 7% 1% 296
LA 91% 8% 1% 283
MA 91% 6% 3% 309
ME 85% 13% 1% 280
MI 86% 13% 1% 267
MN 91% 7% 2% 250
MO 89% 9% 2% 259
MS 91% 7% 2% 292
NC 92% 6% 2% 418
NV 91% 7% 2% 346
NY 87% 11% 2% 307
OH 90% 7% 3% 384
OK 89% 6% 5% 209
PA 92% 6% 2% 423
RI 92% 7% 1% 335
SD 92% 6% 2% 282
TN 97% 2% 1% 328
UT 94% 5% 1% 239
VA 94% 4% 2% 494
VT 87% 11% 2% 254
WA 94% 5% 1% 258
WI 88% 10% 3% 289
WY 86% 10% 4% 234
NCI Average 91% 7% 2% 11,350

NCI Adult Consumer Survey Final Report 2015-16
Appendices | 151
Service Coordination (un-collapsed)
Table 59. Met their case manager/service coordinator
State Yes Maybe, Not Sure
No N
AL 97% 2% 1% 334
AR 97% 3% 0% 216
AZ 98% 1% 1% 423
CO 93% 5% 2% 303
CT 94% 4% 2% 242
DC 95% 2% 4% 185
DE 81% 4% 15% 223
FL 99% 1% 0% 857
GA 91% 5% 4% 295
HI 96% 1% 4% 199
IL 97% 2% 1% 254
IN 96% 2% 2% 576
KS 97% 2% 1% 269
KY 97% 1% 2% 300
LA 95% 3% 1% 278
MA 94% 2% 4% 309
ME 98% 1% 1% 283
MI 97% 1% 2% 283
MN 91% 3% 6% 243
MO 98% 1% 1% 266
MS 94% 2% 4% 281
NC 96% 2% 3% 353
NV 96% 1% 3% 344
NY 97% 1% 2% 313
OH 96% 1% 3% 387
OK 90% 1% 9% 209
PA 96% 0% 3% 427
RI 91% 6% 3% 336
SD 97% 1% 2% 285
TN 99% 0% 1% 325
UT 98% 1% 1% 234
VA 95% 4% 1% 493
VT 100% 0% 0% 277
WA 87% 2% 11% 264
WI 97% 1% 2% 289
WY 100% 0% 0% 234
NCI Average 95% 2% 3% 11,389

NCI Adult Consumer Survey Final Report 2015-16
Appendices | 152
Table 60. Case manager/service coordinator asks person what s/he want
State Yes Sometimes No N
AL 94% 4% 2% 324
AR 92% 4% 4% 212
AZ 95% 2% 2% 408
CO 88% 9% 4% 280
CT 88% 8% 5% 226
DC 82% 13% 5% 167
DE 70% 14% 16% 171
FL 95% 4% 1% 818
GA 87% 11% 2% 264
HI 86% 3% 11% 180
IL 90% 7% 3% 239
IN 95% 3% 2% 533
KS 91% 6% 3% 250
KY 92% 6% 2% 291
LA 90% 8% 3% 265
MA 85% 9% 6% 282
ME 78% 14% 8% 262
MI 84% 13% 3% 265
MN 89% 4% 8% 211
MO 86% 12% 2% 247
MS 87% 8% 5% 260
NC 87% 10% 4% 324
NV 84% 12% 4% 315
NY 87% 9% 4% 303
OH 89% 7% 4% 354
OK 85% 8% 7% 179
PA 92% 4% 4% 388
RI 86% 11% 3% 302
SD 86% 8% 6% 272
TN 98% 2% 0% 319
UT 88% 6% 5% 223
VA 89% 7% 3% 466
VT 74% 18% 8% 257
WA 93% 5% 2% 222
WI 86% 7% 7% 269
WY 92% 4% 4% 228
NCI Average 88% 8% 4% 10,576

NCI Adult Consumer Survey Final Report 2015-16
Appendices | 153
Table 61. Able to contact case manager/service coordinator when wants
State Yes Sometimes No N
AL 86% 9% 5% 302
AR 90% 6% 4% 214
AZ 96% 1% 3% 410
CO 90% 5% 5% 292
CT 85% 9% 6% 226
DC 82% 6% 12% 172
DE 61% 9% 29% 179
FL 93% 5% 2% 773
GA 87% 4% 9% 219
HI 82% 4% 13% 181
IL 86% 11% 3% 235
IN 96% 2% 2% 472
KS 86% 12% 2% 230
KY 91% 5% 3% 293
LA 93% 5% 2% 260
MA 86% 7% 7% 271
ME 90% 5% 6% 196
MI 84% 12% 4% 276
MN 87% 4% 9% 222
MO 89% 3% 8% 212
MS 88% 4% 8% 265
NC 87% 5% 8% 315
NV 76% 13% 11% 336
NY 91% 6% 3% 278
OH 91% 7% 2% 353
OK 85% 3% 12% 195
PA 88% 3% 8% 321
RI 88% 6% 6% 308
SD 88% 8% 4% 278
TN 97% 2% 1% 322
UT 88% 5% 6% 217
VA 83% 6% 11% 438
VT 73% 15% 12% 203
WA 88% 5% 7% 181
WI 91% 4% 5% 278
WY 89% 7% 3% 231
NCI Average 87% 6% 7% 10,154
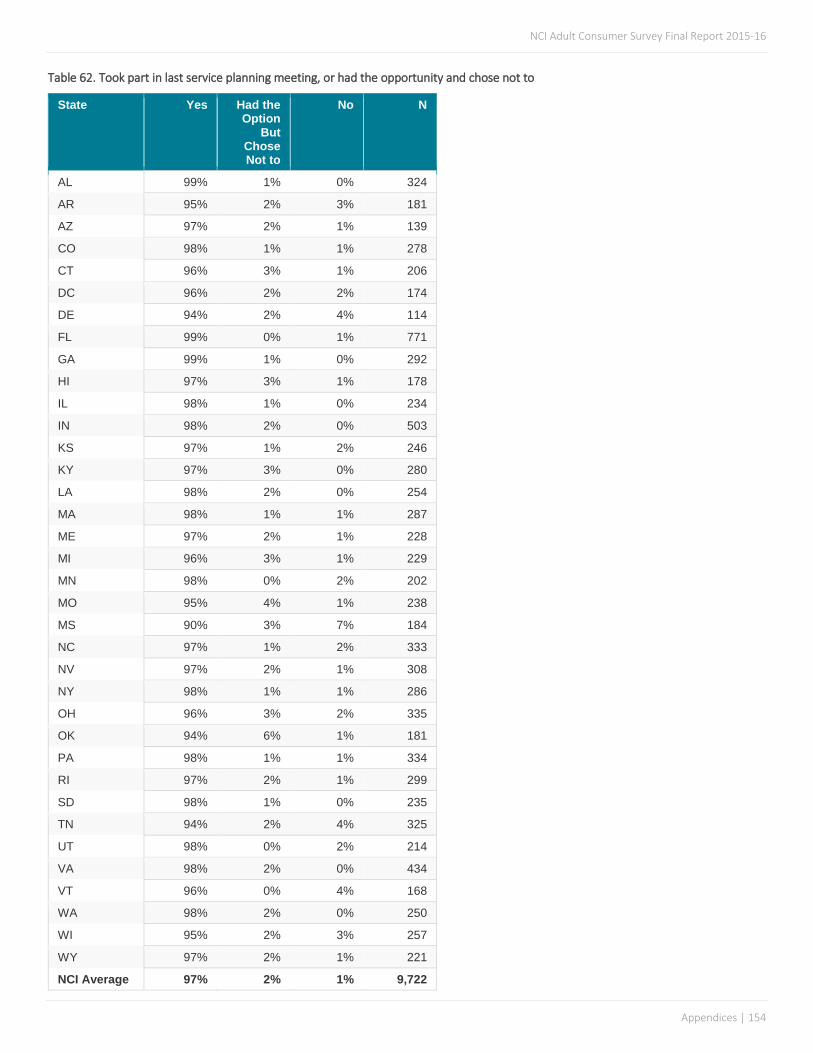
NCI Adult Consumer Survey Final Report 2015-16
Appendices | 154
Table 62. Took part in last service planning meeting, or had the opportunity and chose not to
State Yes Had the Option
But Chose Not to
No N
AL 99% 1% 0% 324
AR 95% 2% 3% 181
AZ 97% 2% 1% 139
CO 98% 1% 1% 278
CT 96% 3% 1% 206
DC 96% 2% 2% 174
DE 94% 2% 4% 114
FL 99% 0% 1% 771
GA 99% 1% 0% 292
HI 97% 3% 1% 178
IL 98% 1% 0% 234
IN 98% 2% 0% 503
KS 97% 1% 2% 246
KY 97% 3% 0% 280
LA 98% 2% 0% 254
MA 98% 1% 1% 287
ME 97% 2% 1% 228
MI 96% 3% 1% 229
MN 98% 0% 2% 202
MO 95% 4% 1% 238
MS 90% 3% 7% 184
NC 97% 1% 2% 333
NV 97% 2% 1% 308
NY 98% 1% 1% 286
OH 96% 3% 2% 335
OK 94% 6% 1% 181
PA 98% 1% 1% 334
RI 97% 2% 1% 299
SD 98% 1% 0% 235
TN 94% 2% 4% 325
UT 98% 0% 2% 214
VA 98% 2% 0% 434
VT 96% 0% 4% 168
WA 98% 2% 0% 250
WI 95% 2% 3% 257
WY 97% 2% 1% 221
NCI Average 97% 2% 1% 9,722

NCI Adult Consumer Survey Final Report 2015-16
Appendices | 155
Table 63. Understood what was talked about at last service planning meeting
State Yes In-between
No N
AL 93% 5% 2% 317
AR 87% 9% 4% 170
AZ 85% 10% 5% 130
CO 71% 23% 6% 271
CT 79% 18% 3% 192
DC 80% 15% 5% 167
DE 78% 17% 5% 101
FL 90% 7% 3% 751
GA 83% 16% 1% 283
HI 80% 9% 10% 169
IL 88% 10% 2% 225
IN 86% 10% 5% 484
KS 91% 9% 0% 233
KY 93% 5% 2% 268
LA 89% 7% 4% 244
MA 88% 10% 3% 271
ME 73% 23% 4% 213
MI 79% 17% 4% 214
MN 86% 13% 2% 189
MO 83% 15% 2% 213
MS 81% 17% 3% 156
NC 84% 14% 2% 311
NV 81% 14% 5% 286
NY 91% 7% 2% 273
OH 85% 12% 4% 310
OK 71% 16% 12% 161
PA 84% 12% 4% 321
RI 77% 18% 4% 273
SD 82% 13% 5% 222
TN 89% 9% 2% 302
UT 85% 10% 6% 200
VA 83% 12% 5% 406
VT 78% 19% 3% 157
WA 85% 13% 3% 240
WI 77% 18% 5% 243
WY 84% 12% 4% 206
NCI Average 83% 13% 4% 9,172
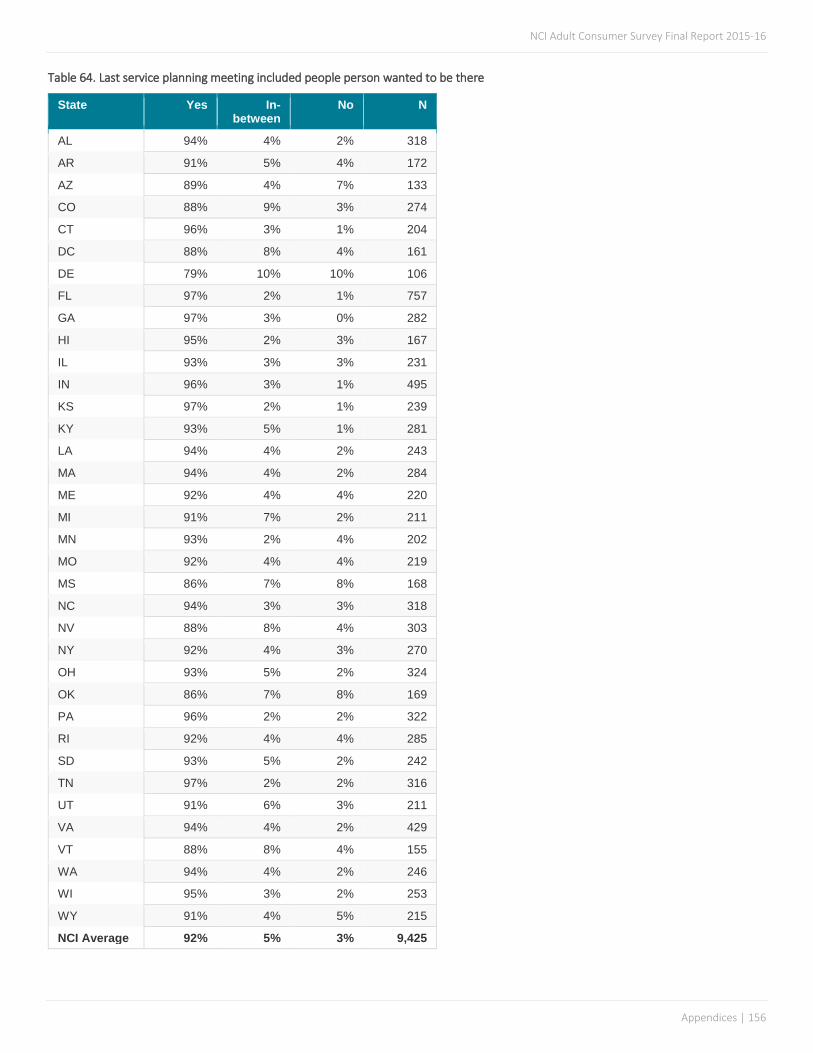
NCI Adult Consumer Survey Final Report 2015-16
Appendices | 156
Table 64. Last service planning meeting included people person wanted to be there
State Yes In-between
No N
AL 94% 4% 2% 318
AR 91% 5% 4% 172
AZ 89% 4% 7% 133
CO 88% 9% 3% 274
CT 96% 3% 1% 204
DC 88% 8% 4% 161
DE 79% 10% 10% 106
FL 97% 2% 1% 757
GA 97% 3% 0% 282
HI 95% 2% 3% 167
IL 93% 3% 3% 231
IN 96% 3% 1% 495
KS 97% 2% 1% 239
KY 93% 5% 1% 281
LA 94% 4% 2% 243
MA 94% 4% 2% 284
ME 92% 4% 4% 220
MI 91% 7% 2% 211
MN 93% 2% 4% 202
MO 92% 4% 4% 219
MS 86% 7% 8% 168
NC 94% 3% 3% 318
NV 88% 8% 4% 303
NY 92% 4% 3% 270
OH 93% 5% 2% 324
OK 86% 7% 8% 169
PA 96% 2% 2% 322
RI 92% 4% 4% 285
SD 93% 5% 2% 242
TN 97% 2% 2% 316
UT 91% 6% 3% 211
VA 94% 4% 2% 429
VT 88% 8% 4% 155
WA 94% 4% 2% 246
WI 95% 3% 2% 253
WY 91% 4% 5% 215
NCI Average 92% 5% 3% 9,425

NCI Adult Consumer Survey Final Report 2015-16
Appendices | 157
Table 65. Person was able to choose services they get as part of service plan
State Yes Had Some Input
No N
AL 72% 11% 17% 319
AR 81% 15% 4% 175
AZ 64% 33% 3% 132
CO 63% 34% 3% 273
CT 69% 23% 8% 201
DC 79% 17% 4% 163
DE 56% 24% 20% 95
FL 89% 10% 1% 759
GA 85% 15% 0% 284
HI 82% 9% 9% 168
IL 77% 19% 4% 226
IN 91% 8% 1% 490
KS 81% 16% 2% 243
KY 93% 7% 1% 280
LA 84% 13% 2% 251
MA 71% 25% 5% 273
ME 79% 19% 2% 217
MI 72% 23% 5% 219
MN 66% 27% 7% 197
MO 72% 21% 7% 208
MS 55% 31% 14% 181
NC 70% 24% 6% 308
NV 72% 23% 5% 301
NY 78% 17% 5% 271
OH 77% 18% 5% 319
OK 67% 16% 17% 167
PA 81% 13% 6% 304
RI 73% 23% 5% 288
SD 77% 17% 6% 236
TN 88% 11% 1% 321
UT 91% 6% 2% 204
VA 86% 9% 5% 430
VT 59% 35% 6% 163
WA 74% 23% 2% 231
WI 62% 26% 12% 250
WY 74% 20% 6% 213
NCI Average 75% 19% 6% 9,360

NCI Adult Consumer Survey Final Report 2015-16
Appendices | 158
Table 66. Staff show up and leave when they are supposed to
State Yes Maybe, Not Sure No N
AL 98% 1% 1% 313
AR 98% 1% 1% 200
AZ 96% 2% 2% 300
CO 89% 8% 3% 267
CT 93% 4% 3% 222
DC 94% 3% 3% 163
DE 85% 8% 7% 214
FL 96% 3% 1% 746
GA 88% 11% 0% 290
HI 87% 9% 4% 178
IL 96% 3% 1% 225
IN 96% 3% 2% 500
KS 90% 9% 2% 252
KY 94% 5% 1% 283
LA 96% 3% 1% 254
MA 87% 11% 2% 263
ME 93% 6% 2% 266
MI 90% 7% 3% 218
MN 91% 4% 5% 226
MO 91% 6% 3% 250
MS 95% 4% 1% 278
NC 92% 6% 2% 380
NV 93% 4% 2% 323
NY 92% 7% 2% 255
OH 95% 3% 2% 312
OK 95% 2% 3% 185
PA 93% 5% 2% 312
RI 87% 9% 3% 295
SD 91% 5% 4% 253
TN 99% 1% 0% 326
UT 96% 3% 1% 232
VA 95% 3% 2% 460
VT 91% 8% 1% 217
WA 95% 3% 2% 237
WI 94% 3% 3% 204
WY 88% 8% 4% 215
NCI Average 93% 5% 2% 10,114

NCI Adult Consumer Survey Final Report 2015-16
Appendices | 159
Access (un-collapsed)
Table 67. Has a way to get places needs to go
State Yes, Almost Always Sometimes No, Almost Never N
AL 93% 7% 1% 334
AR 98% 2% 0% 226
AZ 95% 5% 0% 417
CO 93% 7% 0% 306
CT 96% 4% 0% 240
DC 90% 10% 0% 193
DE 93% 7% 0% 228
FL 92% 7% 0% 830
GA 81% 18% 1% 301
HI 93% 5% 2% 198
IL 92% 7% 2% 255
IN 96% 4% 0% 567
KS 90% 9% 0% 266
KY 85% 14% 1% 293
LA 94% 6% 0% 289
MA 97% 3% 1% 311
ME 94% 6% 0% 280
MI 88% 12% 0% 284
MN 96% 4% 1% 253
MO 95% 5% 0% 264
MS 91% 8% 1% 295
NC 94% 6% 0% 428
NV 89% 9% 2% 344
NY 89% 10% 1% 310
OH 96% 4% 1% 390
OK 98% 2% 0% 210
PA 94% 5% 0% 435
RI 95% 5% 1% 340
SD 92% 7% 1% 277
TN 99% 1% 0% 326
UT 90% 9% 1% 234
VA 93% 6% 1% 496
VT 92% 7% 1% 269
WA 95% 5% 0% 261
WI 93% 6% 1% 294
WY 90% 9% 1% 235
NCI Average 93% 7% 1% 11,479

NCI Adult Consumer Survey Final Report 2015-16
Appendices | 160
Table 68. Has a way to get places when wants to go outside of home
State Yes, Almost Always Sometimes No, Almost Never N
AL 77% 20% 3% 332
AR 92% 6% 2% 225
AZ 91% 9% 1% 424
CO 83% 16% 1% 304
CT 85% 13% 2% 241
DC 80% 18% 3% 192
DE 71% 22% 7% 219
FL 81% 18% 1% 832
GA 74% 24% 2% 293
HI 88% 7% 5% 191
IL 80% 17% 3% 250
IN 84% 14% 1% 563
KS 82% 16% 2% 264
KY 85% 13% 2% 297
LA 86% 13% 1% 289
MA 87% 11% 2% 309
ME 73% 25% 2% 264
MI 79% 19% 2% 278
MN 91% 8% 1% 253
MO 85% 14% 1% 264
MS 75% 20% 5% 291
NC 81% 15% 3% 429
NV 74% 22% 4% 339
NY 81% 17% 2% 301
OH 87% 10% 3% 388
OK 88% 8% 4% 206
PA 93% 7% 1% 432
RI 79% 17% 4% 335
SD 80% 17% 3% 281
TN 96% 4% 0% 327
UT 82% 16% 2% 239
VA 88% 10% 2% 494
VT 67% 27% 7% 254
WA 91% 9% 0% 263
WI 80% 16% 4% 289
WY 77% 20% 3% 235
NCI Average 83% 15% 3% 11,387

NCI Adult Consumer Survey Final Report 2015-16
Appendices | 161
Table 69. Staff have adequate training to meet the person’s needs (proxy responses allowed)
State Yes Maybe, Not Sure No N
AL 93% 4% 3% 332
AR 96% 3% 2% 246
AZ 92% 5% 3% 355
CO 86% 9% 4% 327
CT 92% 4% 4% 234
DC 91% 5% 4% 161
DE 81% 7% 11% 193
FL 94% 4% 2% 1152
GA 87% 12% 1% 292
HI 92% 6% 3% 218
IL 93% 6% 1% 256
IN 87% 10% 3% 735
KS 92% 7% 1% 270
KY 91% 7% 2% 317
LA 94% 4% 2% 313
MA 88% 7% 5% 277
ME 91% 7% 2% 292
MI 87% 7% 5% 256
MN 92% 6% 2% 307
MO 93% 5% 2% 245
MS 90% 5% 5% 369
NC 90% 6% 4% 508
NV 83% 11% 6% 350
NY 84% 10% 5% 299
OH 91% 5% 5% 351
OK 95% 3% 2% 177
PA 93% 5% 3% 424
RI 88% 9% 4% 337
SD 91% 5% 3% 275
TN 98% 1% 1% 354
UT 94% 4% 2% 273
VA 89% 8% 3% 566
VT 87% 10% 3% 219
WA 92% 6% 2% 311
WI 86% 8% 6% 266
WY 87% 8% 5% 261
NCI Average 90% 6% 3% 12118

NCI Adult Consumer Survey Final Report 2015-16
Appendices | 162
Table 70. Additional services needed (categories are not mutually exclusive; proxy responses allowed)
State Service Coordination
, Case Management
Respite or Family
Support
Transport-ation Job Assistanc
e
Day Services (Not
Employment)
Education Health Care Coordination
AL 1% 3% 27% 59% 1% 14% 3%
AR 2% 7% 6% 13% 3% 13% 3%
AZ 5% 20% 26% 20% 9% 26% 11%
CO 20% 28% 35% 30% 18% 27% 15%
CT 15% 24% 37% 24% 21% 28% 16%
DC 3% 6% 26% 31% 5% 28% 6%
DE 38% 22% 24% 50% 20% 42% 18%
FL 3% 13% 14% 18% 8% 9% 5%
GA 11% 12% 26% 21% 3% 14% 11%
HI 4% 21% 23% 11% 5% 14% 4%
IL 5% 5% 12% 16% 4% 9% 5%
IN 1% 22% 21% 11% 10% 15% 6%
KS 45% 7% 33% 21% 36% 14% 44%
KY 3% 9% 20% 22% 9% 11% 5%
LA 2% 8% 11% 25% 4% 19% 7%
MA 11% 16% 15% 19% 12% 15% 7%
ME 3% 11% 15% 34% 5% 20% 2%
MI 7% 16% 31% 33% 22% 33% 10%
MN 26% 23% 44% 36% 23% 35% 17%
MO 6% 6% 16% 31% 11% 24% 10%
MS 13% 28% 34% 25% 15% 40% 18%
NC 15% 27% 23% 26% 14% 32% 13%
NV 28% 26% 49% 37% 30% 35% 33%
NY 24% 14% 33% 19% 15% 21% 30%
OH 20% 14% 31% 32% 23% 36% 15%
OK 16% 16% 34% 18% 13% 30% 5%
PA 6% 18% 22% 16% 12% 18% 6%
RI 19% 19% 38% 43% 23% 38% 22%
SD 29% 14% 51% 33% 19% 25% 25%
TN 6% 11% 8% 27% 2% 22% 2%
UT 6% 10% 13% 16% 8% 19% 7%
VA 8% 19% 19% 21% 13% 18% 9%
VT 13% 23% 22% 29% 35% 11% 3%
WA 15% 25% 25% 26% 16% 18% 13%
WI 17% 17% 42% 20% 14% 27% 14%
WY 32% 13% 29% 30% 21% 17% 22%
NCI Average 13% 16% 26% 26% 14% 23% 12%

NCI Adult Consumer Survey Final Report 2015-16
Appendices | 163
Table 71. Additional services needed, continued (categories are not mutually exclusive; proxy responses allowed)
State Dental Care Coordination
Housing Assistance
Residential Support
Services
Social or Relationship
Communication Technology
Environmental Adaptations
Benefits Information
Other
AL 2% 29% 8% 37% 4% 5% 2% 9%
AR 12% 6% 2% 14% 8% 7% 2% 54%
AZ 16% 14% 9% 19% 16% 11% 12% 35%
CO 13% 12% 13% 32% 16% 11% 17% 14%
CT 14% 14% 22% 31% 19% 11% 13% 19%
DC 9% 16% 5% 18% 17% 5% 1% 22%
DE 18% 23% 15% 44% 21% 4% 5% 9%
FL 17% 4% 5% 19% 7% 8% 2% 32%
GA 26% 8% 15% 8% 9% 0% 2% 12%
HI 14% 11% 2% 6% 9% 4% 7% 50%
IL 5% 8% 5% 12% 7% 3% 2% 55%
IN 5% 7% 17% 16% 9% 6% 4% 33%
KS 42% 7% 36% 20% 5% 7% 27% 13%
KY 3% 22% 5% 17% 8% 5% 7% 14%
LA 16% 18% 6% 20% 8% 13% 4% 39%
MA 8% 10% 12% 20% 11% 5% 9% 39%
ME 7% 12% 4% 31% 15% 4% 1% 48%
MI 21% 17% 21% 33% 17% 7% 7% 8%
MN 21% 24% 16% 30% 17% 17% 18% 4%
MO 19% 14% 8% 23% 14% 11% 8% 20%
MS 28% 10% 15% 22% 20% 22% 29% 8%
NC 16% 11% 13% 26% 21% 15% 7% 36%
NV 46% 36% 23% 42% 20% 9% 23% 27%
NY 27% 18% 9% 36% 12% 5% 30% 18%
OH 17% 21% 14% 28% 22% 13% 15% 23%
OK 6% 10% 10% 15% 18% 18% 10% 45%
PA 8% 13% 9% 18% 11% 9% 5% 26%
RI 19% 23% 21% 42% 27% 18% 21% 22%
SD 27% 23% 31% 25% 29% 12% 29% 6%
TN 1% 12% 4% 21% 18% 8% 3% 53%
UT 16% 7% 7% 15% 9% 9% 5% 38%
VA 36% 7% 10% 18% 22% 14% 4% 20%
VT 3% 9% 1% 28% 4% 1% 1% 25%
WA 18% 11% 9% 21% 12% 10% 8% 17%
WI 24% 17% 19% 29% 12% 19% 23% 23%
WY 20% 16% 24% 18% 13% 5% 8% 25%
NCI Average 17% 14% 12% 24% 14% 9% 10% 26%

NCI Adult Consumer Survey Final Report 2015-16
Appendices | 164
Health (un-collapsed)
Table 72. Have a primary care doctor or primary care practitioner (information comes from Background Information section)
State Yes No N
AL 99% 1% 393
AR 97% 3% 390
AZ 97% 3% 463
CO 96% 4% 405
CT 98% 2% 341
DC 100% 0% 346
DE 99% 1% 424
FL 98% 2% 1,442
GA 98% 2% 462
HI 99% 1% 395
IL 97% 3% 393
IN 98% 2% 827
KS 99% 1% 371
KY 98% 2% 450
LA 97% 3% 433
MA 99% 1% 417
ME 98% 2% 397
MI 97% 3% 431
MN 99% 1% 409
MO 99% 1% 398
MS 97% 3% 395
NC 98% 2% 817
NV 99% 1% 393
NY 98% 2% 497
OH 97% 3% 593
OK 99% 1% 400
PA 97% 3% 627
RI 99% 1% 375
SD 99% 1% 362
TN 96% 4% 435
UT 97% 3% 386
VA 98% 2% 778
VT 98% 2% 326
WA 99% 1% 401
WI 100% 0% 391
WY 98% 2% 313
NCI Average 98% 2% 17,076

NCI Adult Consumer Survey Final Report 2015-16
Appendices | 165
Table 73. Overall health (proxy responses allowed)
State Excellent Very Good
Fairly Good
Poor N
AL 17% 60% 23% 1% 376
AR 19% 43% 35% 3% 368
AZ 8% 30% 59% 3% 465
CO 13% 56% 29% 3% 404
CT 27% 53% 19% 1% 323
DC 31% 49% 18% 2% 390
DE 25% 47% 25% 3% 372
FL 18% 51% 27% 3% 1,420
GA 17% 59% 23% 1% 447
HI 26% 45% 27% 2% 374
IL 17% 46% 35% 2% 368
IN 17% 54% 26% 3% 815
KS 18% 41% 38% 4% 353
KY 4% 44% 46% 7% 443
LA 23% 47% 27% 3% 423
MA 22% 49% 27% 2% 408
ME 22% 50% 25% 3% 376
MI 18% 48% 31% 3% 427
MN 21% 50% 24% 4% 403
MO 14% 54% 28% 4% 388
MS 13% 49% 32% 5% 397
NC 18% 49% 31% 2% 739
NV 26% 48% 24% 3% 393
NY 16% 47% 35% 1% 483
OH 19% 46% 31% 5% 537
OK 20% 50% 26% 4% 397
PA 21% 51% 26% 2% 660
RI 21% 49% 28% 2% 449
SD 28% 43% 26% 4% 334
TN 16% 52% 28% 4% 433
UT 20% 49% 28% 3% 387
VA 21% 47% 29% 3% 806
VT 26% 45% 25% 4% 321
WA 18% 46% 34% 3% 396
WI 14% 48% 34% 4% 403
WY 20% 43% 32% 5% 303
NCI Average 19% 48% 30% 3% 16,781

NCI Adult Consumer Survey Final Report 2015-16
Appendices | 166
Table 74. Had a complete physical exam in the past year (information comes from Background Information section)
State Past Year One Year or More N
AL 93% 7% 392
AR 97% 3% 377
AZ 81% 19% 365
CO 89% 11% 387
CT 95% 5% 316
DC 83% 17% 268
DE 84% 16% 398
FL 94% 6% 1,438
GA 89% 11% 454
HI 76% 24% 396
IL 86% 14% 372
IN 90% 10% 809
KS 81% 19% 363
KY 88% 12% 412
LA 94% 6% 409
MA 93% 7% 406
ME 95% 5% 388
MI 90% 10% 397
MN 64% 36% 386
MO 96% 4% 391
MS n/a n/a n/a
NC 93% 7% 774
NV 91% 9% 383
NY 90% 10% 487
OH 85% 15% 498
OK 97% 3% 400
PA 92% 8% 604
RI 88% 12% 319
SD 95% 5% 353
TN 93% 7% 432
UT 90% 10% 361
VA 86% 14% 749
VT 88% 12% 316
WA 86% 14% 395
WI n/a n/a n/a
WY 80% 20% 314
NCI Average 89% 11% 15,509

NCI Adult Consumer Survey Final Report 2015-16
Appendices | 167
Table 75. Had a dental exam in the past year (information comes from Background Information section)
State Within Last Six Months Within the Past Year One Year or More N
AL 50% 32% 19% 345
AR 55% 31% 13% 318
AZ 42% 33% 25% 313
CO 24% 47% 29% 384
CT 59% 35% 5% 300
DC 17% 69% 14% 249
DE 29% 60% 11% 390
FL 42% 38% 20% 1,404
GA 32% 45% 23% 402
HI 25% 31% 44% 319
IL 42% 37% 20% 327
IN 58% 27% 15% 795
KS 48% 33% 20% 312
KY 33% 50% 16% 363
LA 46% 29% 25% 357
MA 58% 34% 7% 401
ME 44% 36% 21% 369
MI 39% 34% 26% 341
MN 59% 14% 27% 396
MO 51% 35% 14% 374
MS 21% 43% 36% 258
NC 57% 29% 15% 739
NV 46% 33% 21% 345
NY 62% 28% 9% 457
OH 32% 48% 20% 419
OK 60% 27% 14% 388
PA 49% 35% 17% 528
RI 49% 39% 12% 247
SD 83% 14% 3% 346
TN 67% 23% 11% 409
UT 34% 45% 20% 318
VA 40% 32% 28% 645
VT 63% 23% 14% 295
WA 58% 20% 22% 399
WI n/a n/a n/a n/a
WY 36% 40% 24% 306
NCI Average 46% 35% 19% 14,558

NCI Adult Consumer Survey Final Report 2015-16
Appendices | 168
Table 76. Had an eye exam in the past year (information comes from Background Information section)
State Within the Past
Year
Within Past 2 Years
Within Past 3 Years
Within Past 5 Years
5 Years Or More
Never Had Test/Screening
N
AL 49% 33% 10% 4% 4% 0% 313
AR 70% 15% 5% 2% 6% 2% 285
AZ 61% 20% 8% 4% 7% 1% 226
CO 41% 39% 11% 7% 1% 0% 335
CT 59% 32% 7% 1% 0% 0% 231
DC 76% 20% 2% 1% 0% 0% 187
DE 64% 30% 5% 1% 0% 0% 351
FL 54% 25% 6% 4% 8% 3% 1,342
GA 64% 19% 5% 3% 6% 3% 306
HI 50% 25% 7% 3% 5% 10% 282
IL 73% 18% 4% 3% 3% 0% 298
IN 51% 27% 5% 4% 7% 5% 772
KS 59% 28% 4% 3% 6% 0% 282
KY 69% 16% 5% 4% 4% 1% 304
LA 61% 16% 5% 5% 10% 4% 329
MA 61% 24% 6% 3% 4% 1% 376
ME 39% 36% 15% 6% 3% 1% 356
MI 48% 27% 8% 3% 9% 5% 293
MN 56% 23% 7% 5% 8% 0% 351
MO 67% 26% 3% 1% 3% 1% 375
MS 58% 29% 2% 3% 7% 1% 195
NC 50% 26% 8% 4% 9% 4% 647
NV 72% 18% 3% 2% 1% 5% 307
NY 69% 22% 3% 2% 3% 0% 450
OH 53% 33% 5% 4% 3% 2% 393
OK 66% 12% 4% 2% 10% 6% 385
PA 69% 22% 4% 1% 4% 1% 454
RI 58% 32% 4% 1% 4% 0% 235
SD 71% 23% 3% 1% 1% 0% 346
TN 80% 15% 2% 1% 2% 0% 396
UT 49% 25% 7% 5% 9% 4% 202
VA 53% 22% 6% 4% 11% 4% 467
VT 54% 31% 6% 4% 5% 1% 250
WA 49% 19% 7% 3% 11% 10% 346
WI n/a n/a n/a n/a n/a n/a n/a
WY 57% 33% 5% 1% 3% 0% 297
NCI Average 59% 25% 6% 3% 5% 2% 12,964
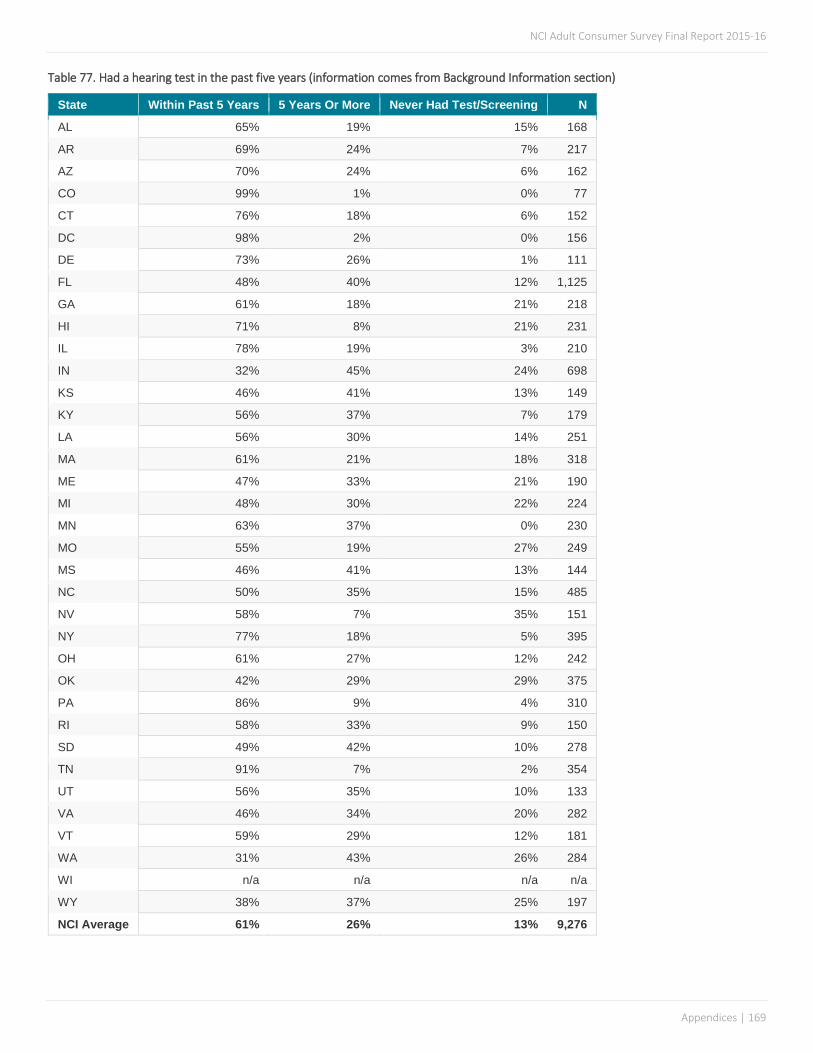
NCI Adult Consumer Survey Final Report 2015-16
Appendices | 169
Table 77. Had a hearing test in the past five years (information comes from Background Information section)
State Within Past 5 Years 5 Years Or More Never Had Test/Screening N
AL 65% 19% 15% 168
AR 69% 24% 7% 217
AZ 70% 24% 6% 162
CO 99% 1% 0% 77
CT 76% 18% 6% 152
DC 98% 2% 0% 156
DE 73% 26% 1% 111
FL 48% 40% 12% 1,125
GA 61% 18% 21% 218
HI 71% 8% 21% 231
IL 78% 19% 3% 210
IN 32% 45% 24% 698
KS 46% 41% 13% 149
KY 56% 37% 7% 179
LA 56% 30% 14% 251
MA 61% 21% 18% 318
ME 47% 33% 21% 190
MI 48% 30% 22% 224
MN 63% 37% 0% 230
MO 55% 19% 27% 249
MS 46% 41% 13% 144
NC 50% 35% 15% 485
NV 58% 7% 35% 151
NY 77% 18% 5% 395
OH 61% 27% 12% 242
OK 42% 29% 29% 375
PA 86% 9% 4% 310
RI 58% 33% 9% 150
SD 49% 42% 10% 278
TN 91% 7% 2% 354
UT 56% 35% 10% 133
VA 46% 34% 20% 282
VT 59% 29% 12% 181
WA 31% 43% 26% 284
WI n/a n/a n/a n/a
WY 38% 37% 25% 197
NCI Average 61% 26% 13% 9,276

NCI Adult Consumer Survey Final Report 2015-16
Appendices | 170
Table 78. Had a Pap test in the past three years (among women; information comes from Background Information section)
State Within the Past Year
Within Past 2 Years
Within Past 3 Years
Within Past 5 Years
5 Years or More
Never Had Test/
Screening
N
AL 59% 12% 6% 3% 8% 12% 147
AR 57% 12% 3% 5% 7% 16% 115
AZ 49% 9% 12% 0% 7% 23% 57
CO 26% 22% 7% 13% 9% 22% 54
CT 48% 27% 5% 4% 4% 11% 92
DC 76% 18% 6% 0% 0% 0% 34
DE 62% 22% 8% 3% 3% 2% 124
FL 39% 11% 6% 3% 8% 34% 541
GA 60% 19% 3% 1% 7% 9% 116
HI 23% 20% 6% 6% 14% 31% 110
IL 40% 21% 7% 5% 11% 16% 85
IN 23% 10% 7% 5% 12% 44% 308
KS 23% 23% 5% 10% 8% 30% 77
KY 52% 16% 6% 4% 7% 14% 97
LA 51% 17% 5% 5% 3% 19% 111
MA 30% 18% 7% 11% 17% 16% 149
ME 25% 20% 9% 8% 18% 19% 108
MI 34% 14% 9% 4% 13% 26% 120
MN 18% 26% 10% 12% 34% 0% 102
MO 30% 18% 10% 6% 15% 20% 119
MS 41% 30% 10% 2% 3% 14% 145
NC 40% 10% 6% 6% 10% 28% 247
NV 58% 19% 6% 3% 4% 11% 102
NY 56% 20% 3% 5% 3% 13% 158
OH 40% 14% 13% 5% 8% 19% 118
OK 32% 9% 5% 4% 10% 39% 170
PA 56% 18% 3% 6% 7% 10% 135
RI 35% 24% 2% 2% 12% 23% 82
SD 27% 20% 13% 6% 24% 9% 128
TN 41% 20% 11% 9% 7% 13% 103
UT 25% 17% 7% 10% 10% 32% 60
VA 38% 13% 8% 4% 8% 29% 182
VT 30% 18% 9% 8% 9% 25% 99
WA 27% 17% 6% 4% 6% 40% 114
WI n/a n/a n/a n/a n/a n/a n/a
WY 39% 20% 4% 4% 7% 27% 105
NCI Average
40% 18% 7% 5% 9% 20% 4,614

NCI Adult Consumer Survey Final Report 2015-16
Appendices | 171
Table 79. Had a mammogram test in the past two years (among women age 40 and over; (information comes from Background Information section)
State Within the Past
Year
Within Past 2 Years
Within Past 3 Years
Within Past 5 Years
5 Years or More
Never Had Test/Screening
N
AL 68% 19% 5% 3% 2% 3% 103
AR 81% 2% 0% 2% 3% 12% 58
AZ 56% 24% 8% 4% 0% 8% 25
CO 24% 32% 11% 21% 3% 11% 38
CT 63% 22% 2% 5% 2% 8% 64
DC n/a n/a n/a n/a n/a n/a n/a
DE 58% 22% 8% 7% 2% 3% 88
FL 60% 16% 2% 3% 5% 15% 225
GA 72% 12% 0% 0% 1% 15% 67
HI 24% 29% 6% 11% 6% 23% 62
IL 66% 22% 3% 2% 3% 3% 59
IN 49% 12% 3% 4% 6% 27% 173
KS 50% 9% 9% 9% 9% 15% 34
KY 80% 13% 0% 0% 2% 4% 45
LA 72% 10% 0% 0% 2% 16% 61
MA 70% 9% 9% 1% 7% 4% 112
ME 52% 23% 6% 6% 4% 10% 83
MI 53% 16% 5% 4% 4% 19% 83
MN 71% 9% 6% 7% 7% 0% 70
MO 70% 15% 0% 1% 3% 11% 74
MS 46% 27% 4% 1% 4% 17% 70
NC 61% 11% 8% 2% 3% 15% 130
NV 73% 17% 2% 0% 2% 6% 52
NY 67% 13% 2% 6% 3% 9% 87
OH 73% 9% 3% 5% 0% 11% 66
OK 61% 4% 4% 4% 4% 24% 80
PA 61% 16% 6% 4% 8% 5% 80
RI 55% 22% 7% 2% 11% 4% 55
SD 69% 18% 4% 0% 3% 6% 67
TN 69% 16% 4% 2% 2% 6% 94
UT 33% 27% 9% 6% 0% 24% 33
VA 49% 22% 4% 6% 6% 15% 109
VT 62% 16% 13% 2% 4% 4% 55
WA 52% 7% 7% 2% 0% 31% 42
WI n/a n/a n/a n/a n/a n/a n/a
WY 58% 13% 6% 2% 6% 15% 53
NCI Average 60% 16% 5% 4% 4% 12% 2,597

NCI Adult Consumer Survey Final Report 2015-16
Appendices | 172
Table 80 Had a colorectal cancer screening in past year (among people age 50 and over; comes from Background Information section)
State Within the Past
Year
Within Past 2 Years
Within Past 3 Years
Within Past 5 Years
5 Years or More
Never Had Test/Screening
N
AL 24% 11% 10% 10% 14% 31% 83
AR 17% 19% 9% 15% 15% 25% 53
AZ n/a n/a n/a n/a n/a n/a n/a
CO 12% 24% 15% 18% 15% 15% 33
CT 18% 21% 11% 18% 24% 9% 91
DC n/a n/a n/a n/a n/a n/a n/a
DE 27% 25% 9% 18% 16% 5% 79
FL 18% 18% 7% 12% 9% 36% 262
GA 34% 16% 0% 1% 4% 46% 83
HI 8% 4% 8% 4% 0% 77% 26
IL 18% 14% 9% 13% 9% 36% 76
IN 19% 8% 7% 7% 8% 51% 178
KS 24% 20% 5% 8% 11% 33% 66
KY 36% 17% 4% 6% 6% 30% 47
LA 17% 13% 6% 11% 10% 43% 70
MA 17% 17% 9% 17% 23% 18% 142
ME 14% 8% 10% 21% 15% 32% 78
MI 18% 23% 8% 10% 4% 36% 98
MN 15% 13% 13% 26% 33% 0% 89
MO 17% 17% 10% 17% 13% 25% 104
MS 19% 19% 6% 3% 8% 44% 77
NC 19% 17% 11% 18% 13% 23% 173
NV 44% 3% 5% 3% 3% 44% 39
NY 36% 19% 3% 15% 14% 13% 134
OH 18% 16% 7% 7% 23% 30% 88
OK 20% 8% 8% 7% 5% 52% 115
PA 36% 8% 7% 19% 10% 21% 73
RI 15% 19% 17% 10% 19% 21% 81
SD 16% 9% 11% 20% 16% 28% 108
TN 19% 24% 10% 19% 9% 19% 105
UT 18% 18% 5% 13% 13% 32% 38
VA 22% 12% 11% 9% 6% 41% 123
VT 21% 13% 7% 15% 13% 30% 82
WA 22% 7% 9% 6% 12% 45% 69
WI n/a n/a n/a n/a n/a n/a n/a
WY 14% 20% 5% 9% 5% 46% 56
NCI Average 21% 15% 8% 12% 12% 31% 3,019

NCI Adult Consumer Survey Final Report 2015-16
Appendices | 173
Table 81. Had a flu vaccine in the past year (information comes from Background Information section)
State Yes No N
AL 72% 28% 276
AR 81% 19% 301
AZ 80% 20% 166
CO 81% 19% 392
CT 90% 10% 201
DC 80% 20% 46
DE 97% 3% 275
FL 52% 48% 1,316
GA 69% 31% 338
HI 45% 55% 238
IL 84% 16% 237
IN 60% 40% 793
KS 78% 22% 283
KY 72% 28% 229
LA 80% 20% 266
MA 81% 19% 375
ME 83% 17% 260
MI 77% 23% 303
MN 100% 0% 142
MO 86% 14% 356
MS 80% 20% 174
NC 75% 25% 614
NV 60% 40% 214
NY 79% 21% 403
OH 78% 22% 305
OK 70% 30% 392
PA 74% 26% 309
RI 92% 8% 264
SD 93% 7% 346
TN 80% 20% 344
UT 86% 14% 218
VA 87% 13% 538
VT 77% 23% 251
WA 74% 26% 395
WI n/a n/a n/a
WY 66% 34% 270
NCI Average 78% 22% 11,830

NCI Adult Consumer Survey Final Report 2015-16
Appendices | 174
Medications (un-collapsed)
Table 82. Takes at least one medication for behavior, mood disorders, anxiety, and/or psychotic disorders (information comes from Background Information section)
State Yes No N
AL 52% 48% 382
AR 59% 41% 378
AZ 40% 60% 451
CO 55% 45% 396
CT 52% 48% 327
DC 53% 47% 256
DE 67% 33% 386
FL 45% 55% 1,420
GA 51% 49% 455
HI 30% 70% 388
IL 53% 47% 394
IN 41% 59% 816
KS 59% 41% 374
KY 59% 41% 433
LA 53% 47% 436
MA 61% 39% 410
ME 64% 36% 363
MI 59% 41% 422
MN 51% 49% 397
MO 70% 30% 393
MS 47% 53% 350
NC 54% 46% 798
NV 60% 40% 391
NY 53% 47% 474
OH 52% 48% 570
OK 60% 40% 400
PA 50% 50% 611
RI 61% 39% 331
SD 50% 50% 353
TN 63% 37% 424
UT 62% 38% 386
VA 66% 34% 764
VT 58% 42% 325
WA 46% 54% 399
WI n/a na n/a
WY 55% 45% 306
NCI Average 55% 45% 16,159
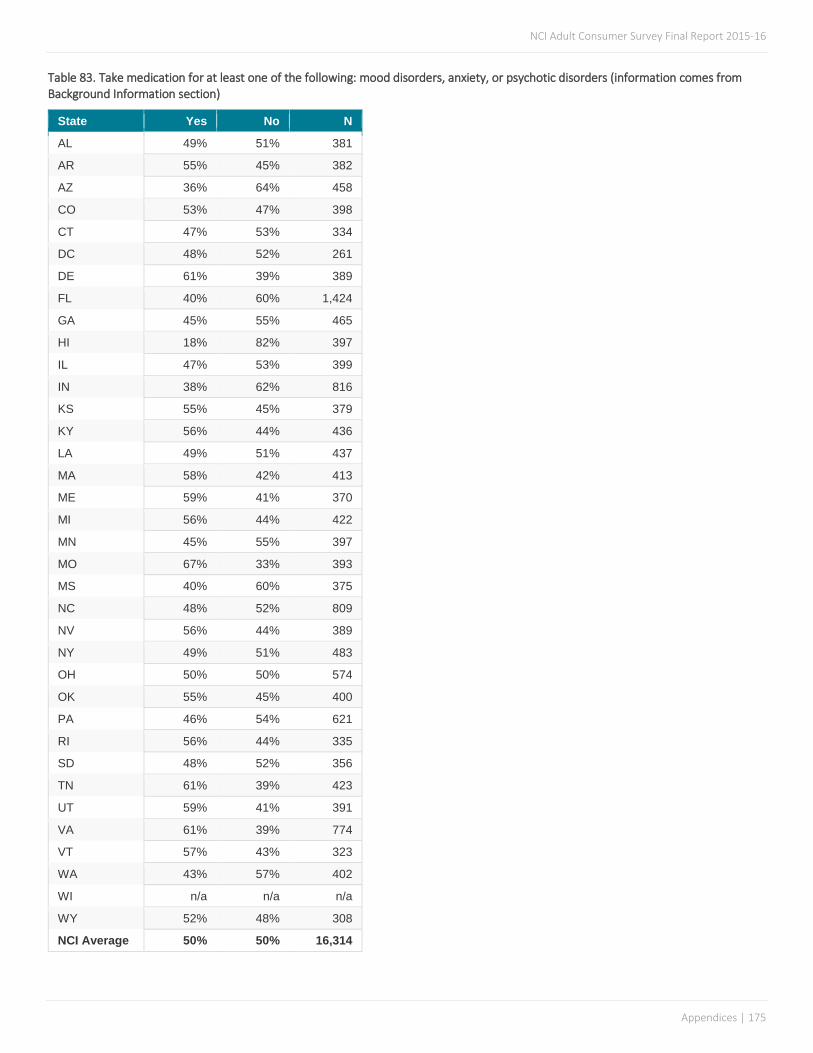
NCI Adult Consumer Survey Final Report 2015-16
Appendices | 175
Table 83. Take medication for at least one of the following: mood disorders, anxiety, or psychotic disorders (information comes from Background Information section)
State Yes No N
AL 49% 51% 381
AR 55% 45% 382
AZ 36% 64% 458
CO 53% 47% 398
CT 47% 53% 334
DC 48% 52% 261
DE 61% 39% 389
FL 40% 60% 1,424
GA 45% 55% 465
HI 18% 82% 397
IL 47% 53% 399
IN 38% 62% 816
KS 55% 45% 379
KY 56% 44% 436
LA 49% 51% 437
MA 58% 42% 413
ME 59% 41% 370
MI 56% 44% 422
MN 45% 55% 397
MO 67% 33% 393
MS 40% 60% 375
NC 48% 52% 809
NV 56% 44% 389
NY 49% 51% 483
OH 50% 50% 574
OK 55% 45% 400
PA 46% 54% 621
RI 56% 44% 335
SD 48% 52% 356
TN 61% 39% 423
UT 59% 41% 391
VA 61% 39% 774
VT 57% 43% 323
WA 43% 57% 402
WI n/a n/a n/a
WY 52% 48% 308
NCI Average 50% 50% 16,314

NCI Adult Consumer Survey Final Report 2015-16
Appendices | 176
Table 84. Number of medications taken for at least one of the following: mood disorders, anxiety, or psychotic disorders (information comes from Background Information section)
State 1-2 Medications
3-4 Medications
5-10 Medications
11 or More Medications
N
AL 68% 28% 4% 0% 188
AR 66% 30% 3% 0% 202
AZ 63% 30% 7% 0% 151
CO 68% 27% 5% 0% 204
CT 76% 21% 3% 0% 149
DC 96% 4% 0% 0% 68
DE 72% 22% 5% 0% 203
FL 77% 21% 2% 0% 559
GA 70% 21% 9% 0% 208
HI 79% 20% 1% 0% 71
IL 78% 20% 2% 0% 183
IN 85% 15% 0% 0% 307
KS 66% 30% 4% 0% 206
KY 70% 26% 4% 0% 232
LA 66% 28% 5% 1% 209
MA 59% 31% 10% 0% 237
ME 69% 25% 6% 1% 189
MI 61% 32% 7% 0% 234
MN 68% 25% 7% 1% 169
MO 60% 32% 9% 0% 262
MS 78% 16% 6% 0% 134
NC 69% 25% 7% 0% 378
NV 61% 29% 9% 1% 216
NY 61% 33% 5% 1% 228
OH 70% 21% 9% 0% 267
OK 65% 29% 6% 0% 220
PA 66% 30% 5% 0% 277
RI 71% 25% 3% 1% 181
SD 62% 30% 8% 0% 169
TN 56% 35% 9% 0% 247
UT 63% 32% 5% 0% 222
VA 61% 29% 10% 0% 467
VT 68% 25% 7% 0% 182
WA 70% 27% 3% 0% 172
WI 73% 25% 3% 0% 158
WY n/a n/a n/a n/a n/a
NCI Average 69% 26% 5% 0% 7,749

NCI Adult Consumer Survey Final Report 2015-16
Appendices | 177
Table 85. Take medication for behavior challenges (information comes from Background Information section)
State Yes No N
AL 19% 81% 381
AR 34% 66% 374
AZ 28% 72% 447
CO 25% 75% 385
CT 33% 67% 321
DC 33% 67% 238
DE 47% 53% 371
FL 20% 80% 1,425
GA 15% 85% 461
HI 17% 83% 389
IL 29% 71% 388
IN 15% 85% 814
KS 32% 68% 368
KY 20% 80% 426
LA 27% 73% 435
MA 19% 81% 409
ME 30% 70% 359
MI 33% 67% 419
MN 30% 70% 393
MO 28% 72% 384
MS 15% 85% 334
NC 31% 69% 799
NV 35% 65% 388
NY 32% 68% 476
OH 17% 83% 563
OK 13% 87% 400
PA 20% 80% 599
RI 35% 65% 330
SD 15% 85% 353
TN 29% 71% 420
UT 36% 64% 380
VA 33% 67% 744
VT 22% 78% 324
WA 14% 86% 402
WI n/a n/a n/a
WY 18% 82% 305
NCI Average 26% 74% 16,004

NCI Adult Consumer Survey Final Report 2015-16
Appendices | 178
Table 86. Number of medications taken for behavior challenges (information comes from Background Information section)
State 1-2 Medications
3-4 Medications
5-10 Medications
11 or More Medications
N
AL 84% 15% 1% 0% 68
AR 66% 30% 4% 0% 122
AZ 73% 20% 7% 0% 111
CO 83% 15% 2% 0% 86
CT 81% 17% 3% 0% 103
DC 92% 8% 0% 0% 37
DE 80% 18% 3% 0% 142
FL 81% 17% 3% 0% 280
GA 77% 21% 1% 0% 70
HI 67% 21% 12% 0% 66
IL 83% 15% 3% 0% 110
IN 88% 11% 1% 0% 121
KS 80% 18% 2% 0% 114
KY 83% 17% 0% 0% 83
LA 77% 19% 4% 0% 112
MA 72% 26% 3% 0% 78
ME 80% 14% 6% 0% 90
MI 74% 21% 4% 1% 132
MN 87% 6% 5% 1% 111
MO 75% 23% 3% 0% 106
MS 80% 16% 4% 0% 45
NC 76% 21% 3% 0% 241
NV 62% 33% 5% 0% 132
NY 66% 26% 8% 0% 145
OH 75% 19% 6% 0% 88
OK 82% 16% 2% 0% 51
PA 80% 16% 4% 0% 105
RI 81% 16% 3% 0% 107
SD 76% 22% 2% 0% 51
TN 69% 26% 5% 0% 112
UT 73% 22% 5% 0% 133
VA 80% 16% 5% 0% 235
VT 77% 16% 7% 0% 69
WA 90% 10% 0% 0% 58
WI 87% 11% 2% 0% 53
WY n/a n/a n/a n/a n/a
NCI Average 78% 18% 4% 0% 3,767
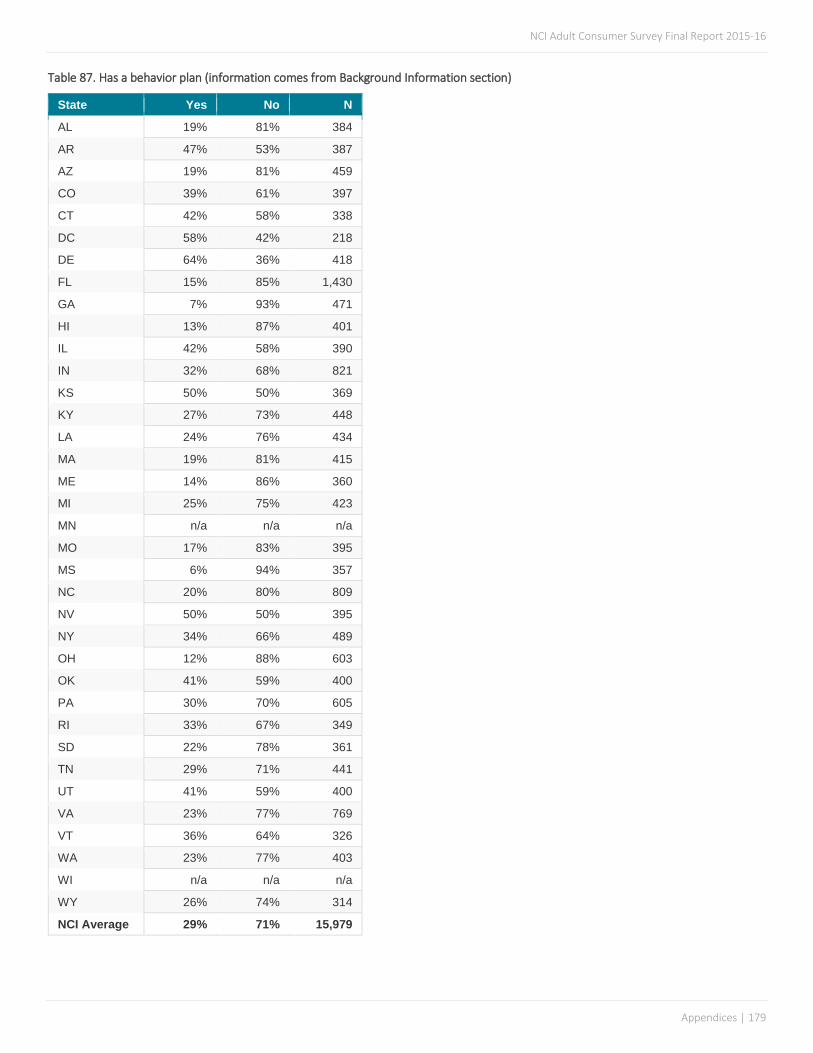
NCI Adult Consumer Survey Final Report 2015-16
Appendices | 179
Table 87. Has a behavior plan (information comes from Background Information section)
State Yes No N
AL 19% 81% 384
AR 47% 53% 387
AZ 19% 81% 459
CO 39% 61% 397
CT 42% 58% 338
DC 58% 42% 218
DE 64% 36% 418
FL 15% 85% 1,430
GA 7% 93% 471
HI 13% 87% 401
IL 42% 58% 390
IN 32% 68% 821
KS 50% 50% 369
KY 27% 73% 448
LA 24% 76% 434
MA 19% 81% 415
ME 14% 86% 360
MI 25% 75% 423
MN n/a n/a n/a
MO 17% 83% 395
MS 6% 94% 357
NC 20% 80% 809
NV 50% 50% 395
NY 34% 66% 489
OH 12% 88% 603
OK 41% 59% 400
PA 30% 70% 605
RI 33% 67% 349
SD 22% 78% 361
TN 29% 71% 441
UT 41% 59% 400
VA 23% 77% 769
VT 36% 64% 326
WA 23% 77% 403
WI n/a n/a n/a
WY 26% 74% 314
NCI Average 29% 71% 15,979

NCI Adult Consumer Survey Final Report 2015-16
Appendices | 180
Table 88. Has a behavior plan (of those who take medication for a behavior challenge); information comes from Background Information section)
State Yes No N
AL 98% 2% 71
AR 94% 6% 127
AZ 91% 9% 117
CO 88% 12% 95
CT 87% 13% 104
DC 83% 17% 77
DE 81% 19% 170
FL 81% 19% 281
GA 76% 24% 71
HI 74% 26% 66
IL 73% 27% 111
IN 71% 29% 121
KS 67% 33% 116
KY 67% 33% 86
LA 63% 37% 116
MA 61% 39% 76
ME 61% 39% 99
MI 59% 41% 136
MN 59% 41% 104
MO 57% 43% 47
MS 57% 43% 250
NC 55% 45% 133
NV 54% 46% 151
NY 54% 46% 94
OH 47% 53% 51
OK 47% 53% 115
PA 51% 49% 112
RI 46% 54% 51
SD 41% 59% 119
TN 40% 60% 135
UT 34% 66% 243
VA 33% 67% 71
VT 32% 68% 57
WA 21% 79% 54
WI n/a n/a n/a
WY n/a n/a n/a
NCI Average 62% 38% 3827

NCI Adult Consumer Survey Final Report 2015-16
Appendices | 181
Wellness (un-collapsed)
Table 89. Engage in physical activity (proxy respondents were allowed)
State At Least 3 Times a Week 1-2 Times a Week No N
AL 34% 46% 20% 378
AR 40% 31% 29% 373
AZ 21% 59% 20% 462
CO 41% 36% 23% 402
CT 47% 33% 21% 325
DC 55% 33% 12% 389
DE 39% 29% 33% 366
FL 35% 34% 31% 1,422
GA 39% 39% 22% 449
HI 83% 8% 8% 390
IL 41% 37% 23% 377
IN 35% 38% 27% 814
KS 39% 31% 30% 344
KY 13% 32% 55% 447
LA 43% 32% 25% 423
MA 46% 33% 21% 410
ME 52% 29% 19% 383
MI 39% 35% 25% 429
MN 55% 28% 17% 400
MO 42% 29% 29% 395
MS 44% 31% 26% 396
NC 51% 29% 20% 742
NV 54% 30% 15% 388
NY 36% 36% 28% 483
OH 46% 30% 25% 534
OK 50% 28% 22% 395
PA 42% 34% 24% 665
RI 50% 33% 17% 447
SD 47% 29% 24% 333
TN 45% 34% 21% 434
UT 54% 29% 17% 385
VA 43% 33% 24% 800
VT 48% 25% 28% 324
WA 48% 29% 23% 392
WI 51% 28% 20% 404
WY 46% 34% 20% 312
NCI Average 44% 32% 23% 16,812

NCI Adult Consumer Survey Final Report 2015-16
Appendices | 182
Table 90. BMI category (BMI is calculated using person’s height and weight; information comes from Background Information section)
State Underweight Healthy Overweight Obese N
AL 3% 25% 27% 45% 368
AR 5% 27% 32% 36% 328
AZ 5% 44% 27% 23% 228
CO 6% 32% 32% 31% 392
CT 5% 26% 40% 29% 212
DC 7% 33% 30% 29% 312
DE 3% 31% 30% 36% 397
FL 8% 35% 31% 26% 1,206
GA 4% 36% 29% 30% 341
HI 6% 32% 29% 33% 382
IL 7% 30% 26% 37% 378
IN 5% 29% 27% 39% 781
KS 6% 28% 29% 37% 314
KY 7% 26% 24% 42% 434
LA 5% 29% 25% 41% 404
MA 4% 33% 29% 34% 411
ME 5% 26% 31% 38% 316
MI 6% 29% 31% 34% 379
MN 5% 34% 32% 30% 358
MO 5% 31% 29% 35% 366
MS 6% 27% 27% 40% 301
NC 8% 31% 28% 32% 713
NV 3% 29% 29% 39% 397
NY 5% 34% 32% 30% 476
OH 5% 32% 31% 33% 429
OK 9% 33% 25% 33% 400
PA 5% 29% 33% 33% 374
RI 7% 33% 28% 32% 358
SD 4% 27% 25% 44% 360
TN 4% 29% 30% 37% 404
UT 8% 35% 26% 31% 378
VA 6% 33% 26% 35% 645
VT 5% 28% 30% 38% 324
WA 6% 36% 27% 31% 379
WI 6% 38% 27% 30% 301
WY n/a n/a n/a n/a n/a
NCI Average 6% 31% 29% 34% 14,546

NCI Adult Consumer Survey Final Report 2015-16
Appendices | 183
Table 91. Chew or smoke tobacco (information comes from Background Information section)
State Yes No N
AL 4% 96% 386
AR 8% 92% 365
AZ 5% 95% 441
CO 9% 91% 399
CT 4% 96% 334
DC 2% 98% 229
DE 7% 93% 412
FL 5% 95% 1,417
GA 4% 96% 468
HI 2% 98% 293
IL 7% 93% 376
IN 5% 95% 812
KS 9% 91% 367
KY 15% 85% 443
LA 9% 91% 382
MA 5% 95% 413
ME 7% 93% 381
MI 4% 96% 420
MN 7% 93% 409
MO 8% 92% 394
MS 7% 93% 397
NC 8% 92% 793
NV 7% 93% 387
NY 5% 95% 488
OH 9% 91% 567
OK 6% 94% 400
PA 8% 92% 586
RI 4% 96% 362
SD 10% 90% 361
TN 10% 90% 437
UT 6% 94% 395
VA 5% 95% 750
VT 8% 92% 322
WA 7% 93% 392
WI n/a n/a n/a
WY 11% 89% 309
NCI Average 7% 93% 16,087
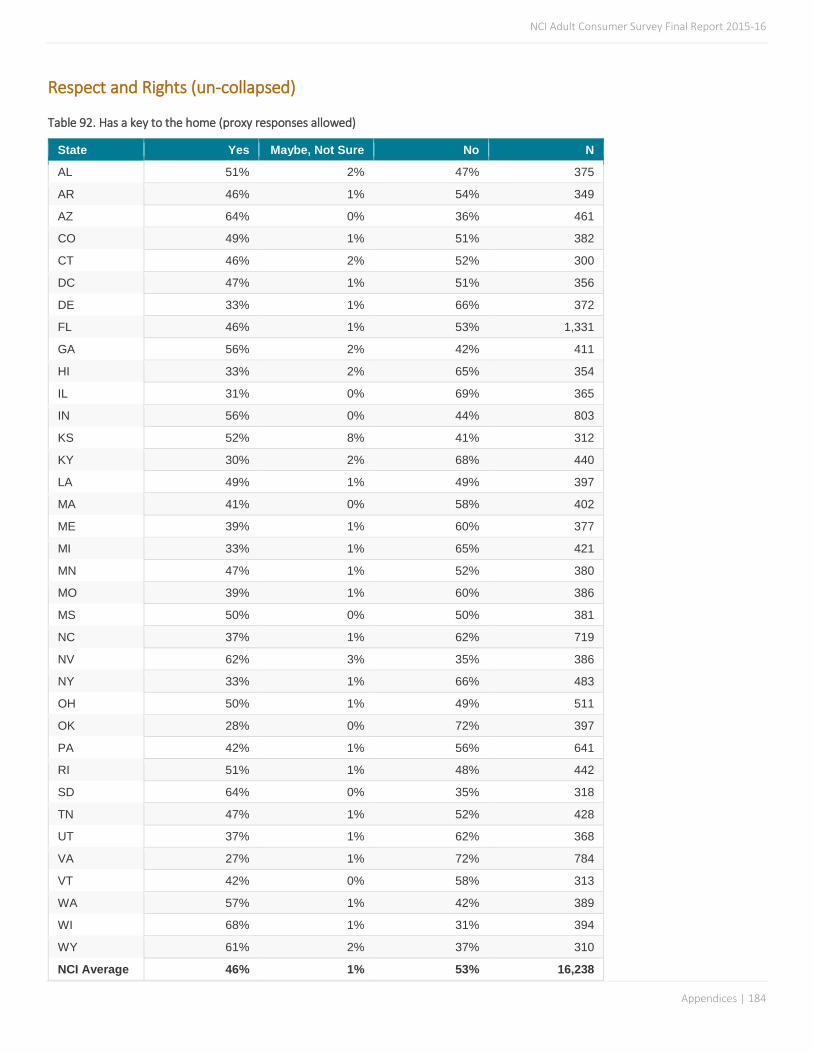
NCI Adult Consumer Survey Final Report 2015-16
Appendices | 184
Respect and Rights (un-collapsed)
Table 92. Has a key to the home (proxy responses allowed)
State Yes Maybe, Not Sure No N
AL 51% 2% 47% 375
AR 46% 1% 54% 349
AZ 64% 0% 36% 461
CO 49% 1% 51% 382
CT 46% 2% 52% 300
DC 47% 1% 51% 356
DE 33% 1% 66% 372
FL 46% 1% 53% 1,331
GA 56% 2% 42% 411
HI 33% 2% 65% 354
IL 31% 0% 69% 365
IN 56% 0% 44% 803
KS 52% 8% 41% 312
KY 30% 2% 68% 440
LA 49% 1% 49% 397
MA 41% 0% 58% 402
ME 39% 1% 60% 377
MI 33% 1% 65% 421
MN 47% 1% 52% 380
MO 39% 1% 60% 386
MS 50% 0% 50% 381
NC 37% 1% 62% 719
NV 62% 3% 35% 386
NY 33% 1% 66% 483
OH 50% 1% 49% 511
OK 28% 0% 72% 397
PA 42% 1% 56% 641
RI 51% 1% 48% 442
SD 64% 0% 35% 318
TN 47% 1% 52% 428
UT 37% 1% 62% 368
VA 27% 1% 72% 784
VT 42% 0% 58% 313
WA 57% 1% 42% 389
WI 68% 1% 31% 394
WY 61% 2% 37% 310
NCI Average 46% 1% 53% 16,238

NCI Adult Consumer Survey Final Report 2015-16
Appendices | 185
Table 93. People always ask before entering home
State Yes Sometimes No N
AL 90% 5% 5% 331
AR 88% 7% 5% 222
AZ 98% 1% 1% 417
CO 91% 8% 2% 306
CT 88% 8% 3% 242
DC 88% 7% 5% 193
DE 75% 19% 6% 258
FL 92% 5% 3% 838
GA 87% 12% 1% 294
HI 87% 4% 9% 191
IL 87% 9% 4% 257
IN 95% 3% 2% 555
KS 90% 7% 3% 269
KY 94% 4% 2% 298
LA 92% 4% 4% 285
MA 91% 5% 4% 306
ME 77% 18% 6% 274
MI 82% 13% 6% 266
MN 93% 6% 2% 248
MO 88% 8% 4% 260
MS 91% 7% 2% 313
NC 90% 5% 5% 427
NV 88% 7% 4% 343
NY 82% 12% 6% 306
OH 91% 3% 7% 383
OK 92% 5% 3% 210
PA 91% 6% 4% 424
RI 89% 8% 3% 342
SD 84% 9% 7% 283
TN 97% 2% 1% 327
UT 84% 11% 5% 236
VA 90% 6% 5% 489
VT 85% 9% 6% 269
WA 95% 4% 1% 261
WI 94% 3% 3% 279
WY 89% 8% 3% 235
NCI Average 89% 7% 4% 11,437

NCI Adult Consumer Survey Final Report 2015-16
Appendices | 186
Table 94. Can lock bedroom (proxy responses allowed)
State Yes Maybe, Not Sure
No N
AL 64% 6% 30% 375
AR 49% 3% 48% 365
AZ 67% 3% 31% 453
CO 44% 6% 51% 376
CT 45% 3% 52% 304
DC 31% 4% 65% 351
DE 42% 3% 55% 351
FL 66% 5% 29% 1,317
GA 76% 5% 19% 385
HI 49% 6% 45% 337
IL 34% 4% 62% 352
IN 45% 3% 52% 782
KS 47% 12% 42% 277
KY 53% 5% 42% 417
LA 38% 5% 57% 407
MA 33% 1% 65% 378
ME 38% 3% 59% 349
MI 33% 4% 63% 413
MN 42% 2% 56% 383
MO 41% 3% 56% 360
MS 62% 2% 36% 379
NC 46% 4% 51% 698
NV 58% 4% 38% 340
NY 32% 5% 63% 464
OH 44% 4% 52% 510
OK 37% 2% 62% 395
PA 40% 5% 55% 590
RI 39% 3% 57% 414
SD 61% 4% 35% 306
TN 53% 5% 42% 418
UT 46% 2% 52% 363
VA 53% 3% 44% 788
VT 36% 3% 61% 269
WA 35% 2% 63% 358
WI 37% 4% 59% 343
WY 55% 3% 42% 274
NCI Average 46% 4% 50% 15,641

NCI Adult Consumer Survey Final Report 2015-16
Appendices | 187
Table 95. People always ask before entering bedroom
State Yes Sometimes No N
AL 82% 6% 11% 329
AR 84% 7% 9% 218
AZ 95% 2% 3% 419
CO 90% 6% 4% 292
CT 83% 11% 6% 240
DC 85% 8% 7% 186
DE 74% 13% 13% 260
FL 87% 7% 6% 814
GA 87% 10% 3% 296
HI 76% 5% 19% 179
IL 83% 8% 9% 242
IN 78% 8% 14% 525
KS 85% 9% 7% 247
KY 94% 3% 3% 292
LA 86% 5% 9% 274
MA 84% 8% 7% 299
ME 73% 15% 12% 267
MI 77% 13% 10% 253
MN 85% 9% 6% 239
MO 82% 8% 10% 249
MS 80% 13% 7% 290
NC 85% 8% 7% 430
NV 88% 6% 6% 338
NY 78% 17% 5% 301
OH 81% 7% 12% 381
OK 79% 9% 12% 201
PA 85% 7% 8% 403
RI 82% 8% 10% 338
SD 81% 8% 10% 269
TN 92% 6% 2% 330
UT 79% 9% 12% 232
VA 85% 7% 8% 485
VT 76% 10% 15% 241
WA 88% 9% 3% 244
WI 88% 7% 5% 274
WY 85% 8% 7% 226
NCI Average 83% 8% 8% 11,103

NCI Adult Consumer Survey Final Report 2015-16
Appendices | 188
Table 96. Others read mail or email without asking
State Yes No N
AL 17% 83% 293
AR 11% 89% 213
AZ 2% 98% 379
CO 11% 89% 283
CT 19% 81% 213
DC 22% 78% 149
DE 28% 72% 205
FL 10% 90% 770
GA 9% 91% 273
HI 28% 72% 166
IL 22% 78% 227
IN 18% 82% 541
KS 11% 89% 239
KY 7% 93% 288
LA 9% 91% 275
MA 15% 85% 282
ME 3% 97% 266
MI 15% 85% 261
MN 9% 91% 236
MO 17% 83% 233
MS 7% 93% 274
NC 8% 92% 371
NV 12% 88% 319
NY 13% 87% 265
OH 16% 84% 352
OK 21% 79% 194
PA 12% 88% 411
RI 24% 76% 316
SD 14% 86% 265
TN 2% 98% 289
UT 21% 79% 212
VA 14% 86% 450
VT 3% 97% 253
WA 4% 96% 252
WI 9% 91% 283
WY 15% 85% 209
NCI Average 13% 87% 10,507

NCI Adult Consumer Survey Final Report 2015-16
Appendices | 189
Table 97. Can use phone and internet whenever wants
State Yes No N
AL 88% 12% 321
AR 91% 9% 221
AZ 84% 16% 402
CO 87% 13% 285
CT 90% 10% 224
DC 86% 14% 166
DE 76% 24% 225
FL 89% 12% 800
GA 94% 6% 295
HI 75% 25% 172
IL 93% 7% 239
IN 89% 11% 532
KS 93% 7% 228
KY 91% 9% 289
LA 86% 14% 279
MA 88% 12% 303
ME 84% 16% 261
MI 93% 7% 269
MN 90% 10% 242
MO 88% 12% 245
MS 94% 6% 276
NC 90% 10% 406
NV 93% 7% 335
NY 87% 13% 270
OH 95% 5% 358
OK 89% 11% 201
PA 90% 10% 400
RI 90% 10% 324
SD 90% 10% 267
TN 87% 13% 300
UT 88% 12% 230
VA 89% 11% 482
VT 80% 20% 238
WA 97% 3% 254
WI 97% 3% 276
WY 83% 17% 220
NCI Average 89% 11% 10,835
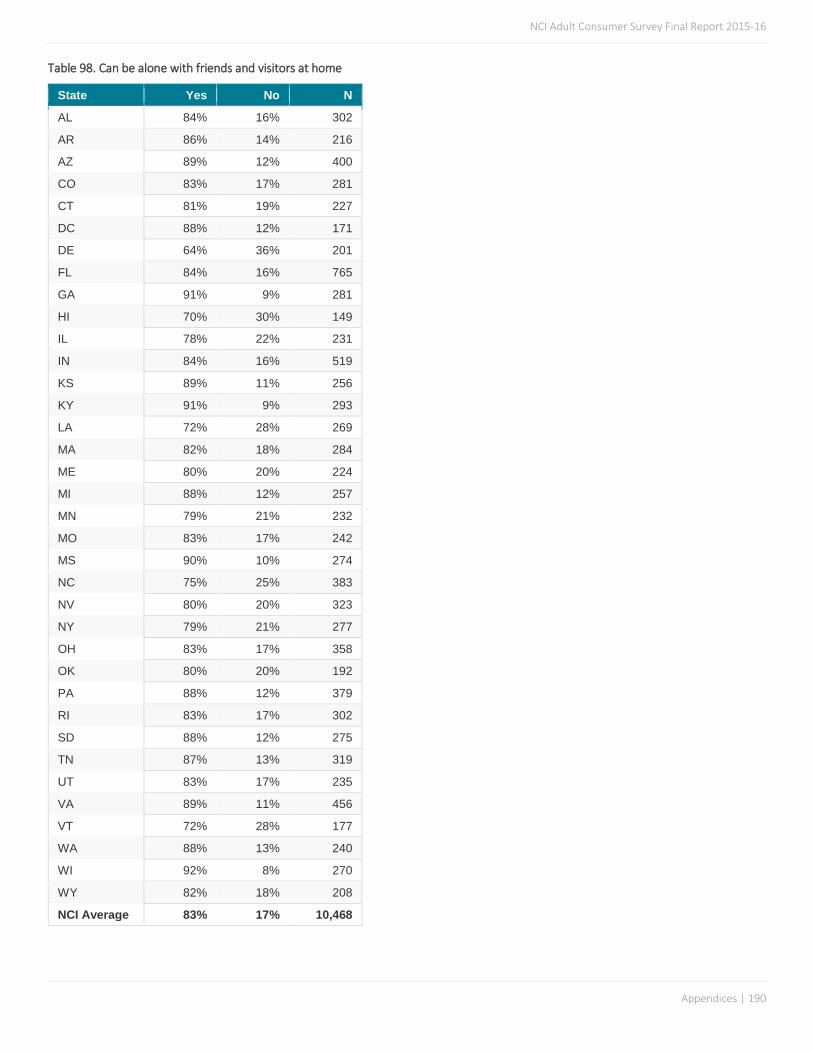
NCI Adult Consumer Survey Final Report 2015-16
Appendices | 190
Table 98. Can be alone with friends and visitors at home
State Yes No N
AL 84% 16% 302
AR 86% 14% 216
AZ 89% 12% 400
CO 83% 17% 281
CT 81% 19% 227
DC 88% 12% 171
DE 64% 36% 201
FL 84% 16% 765
GA 91% 9% 281
HI 70% 30% 149
IL 78% 22% 231
IN 84% 16% 519
KS 89% 11% 256
KY 91% 9% 293
LA 72% 28% 269
MA 82% 18% 284
ME 80% 20% 224
MI 88% 12% 257
MN 79% 21% 232
MO 83% 17% 242
MS 90% 10% 274
NC 75% 25% 383
NV 80% 20% 323
NY 79% 21% 277
OH 83% 17% 358
OK 80% 20% 192
PA 88% 12% 379
RI 83% 17% 302
SD 88% 12% 275
TN 87% 13% 319
UT 83% 17% 235
VA 89% 11% 456
VT 72% 28% 177
WA 88% 13% 240
WI 92% 8% 270
WY 82% 18% 208
NCI Average 83% 17% 10,468

NCI Adult Consumer Survey Final Report 2015-16
Appendices | 191
Table 99. There are rules against having friends and visitors at home
State Yes No N
AL 15% 85% 300
AR 36% 64% 211
AZ 87% 13% 389
CO 41% 59% 273
CT 43% 57% 207
DC 34% 66% 158
DE 47% 53% 184
FL 19% 81% 738
GA 19% 81% 276
HI 43% 57% 149
IL 43% 57% 214
IN 27% 73% 503
KS 18% 82% 238
KY 35% 65% 293
LA 37% 63% 246
MA 28% 72% 276
ME 27% 73% 214
MI 32% 68% 246
MN 33% 67% 227
MO 26% 74% 222
MS 36% 64% 258
NC 51% 49% 345
NV 47% 53% 318
NY 37% 63% 273
OH 38% 62% 334
OK 43% 57% 188
PA 23% 77% 355
RI 43% 57% 286
SD 29% 71% 263
TN 16% 84% 319
UT 34% 66% 220
VA 30% 70% 412
VT 36% 64% 177
WA 21% 79% 230
WI 17% 83% 262
WY 41% 59% 209
NCI Average 34% 66% 10,013

NCI Adult Consumer Survey Final Report 2015-16
Appendices | 192
Table 100. Has a place to be alone
State Yes No N
AL 97% 3% 331
AR 95% 5% 225
AZ 99% 1% 423
CO 98% 2% 307
CT 97% 3% 246
DC 93% 7% 185
DE 91% 9% 259
FL 97% 3% 856
GA 100% 0% 304
HI 86% 14% 199
IL 95% 5% 256
IN 98% 2% 575
KS 99% 1% 267
KY 94% 6% 298
LA 96% 4% 290
MA 97% 3% 306
ME 98% 2% 281
MI 94% 6% 285
MN 99% 1% 251
MO 97% 3% 268
MS 95% 5% 295
NC 95% 5% 438
NV 97% 3% 349
NY 91% 9% 300
OH 94% 6% 393
OK 93% 7% 211
PA 96% 4% 434
RI 93% 7% 346
SD 94% 6% 286
TN 96% 4% 335
UT 94% 6% 239
VA 93% 7% 486
VT 96% 4% 272
WA 98% 2% 263
WI 97% 3% 288
WY 98% 2% 236
NCI Average 96% 4% 11,583

NCI Adult Consumer Survey Final Report 2015-16
Appendices | 193
Table 101. Staff (at home, work, and/or day activity or program) are respectful
State Yes Sometimes or Some
Staff
No N
AL 95% 4% 0% 317
AR 96% 2% 1% 203
AZ 95% 4% 1% 313
CO 90% 9% 1% 278
CT 94% 5% 1% 229
DC 91% 6% 3% 167
DE 79% 19% 2% 225
FL 95% 4% 1% 762
GA 95% 5% 0% 305
HI 92% 5% 3% 182
IL 95% 5% 0% 231
IN 97% 2% 0% 519
KS 91% 8% 1% 256
KY 93% 6% 1% 284
LA 96% 3% 1% 256
MA 90% 10% 1% 283
ME 90% 10% 0% 273
MI 93% 6% 0% 227
MN 92% 8% 0% 232
MO 87% 13% 0% 256
MS 87% 12% 1% 285
NC 93% 6% 1% 395
NV 89% 11% 1% 323
NY 92% 7% 1% 265
OH 93% 6% 1% 324
OK 90% 9% 1% 188
PA 95% 4% 0% 347
RI 93% 7% 1% 321
SD 91% 7% 2% 257
TN 99% 1% 0% 329
UT 93% 7% 0% 233
VA 95% 4% 0% 483
VT 88% 11% 1% 223
WA 94% 5% 1% 244
WI 93% 6% 0% 220
WY 87% 10% 3% 212
NCI Average 92% 7% 1% 10,447

NCI Adult Consumer Survey Final Report 2015-16
Appendices | 194
Table 102. Have attended a self-advocacy event or chose not to (proxy responses allowed)
State Yes Had the Opportunity But
Chose Not to
No N
AL 38% 12% 51% 352
AR 20% 2% 77% 270
AZ 6% 1% 93% 362
CO 16% 5% 79% 382
CT 34% 6% 60% 284
DC 19% 1% 80% 340
DE 14% 2% 84% 322
FL 16% 3% 81% 1,260
GA 11% 6% 83% 369
HI 38% 2% 60% 351
IL 27% 4% 69% 226
IN 22% 1% 77% 756
KS 25% 10% 65% 298
KY 10% 6% 85% 362
LA 24% 4% 71% 342
MA 22% 6% 72% 345
ME 26% 1% 73% 358
MI 20% 5% 75% 372
MN 26% 4% 70% 360
MO 21% 17% 63% 321
MS 24% 2% 75% 316
NC 35% 6% 60% 544
NV 22% 5% 73% 374
NY 16% 6% 78% 370
OH 22% 6% 72% 485
OK 23% 2% 75% 370
PA 12% 1% 87% 506
RI 27% 10% 64% 403
SD 39% 6% 55% 314
TN 17% 6% 76% 343
UT 23% 7% 70% 354
VA 21% 5% 75% 661
VT 32% 7% 61% 314
WA 16% 4% 80% 374
WI 22% 2% 76% 385
WY 37% 5% 58% 242
NCI Average 23% 5% 72% 14,387

NCI Adult Consumer Survey Final Report 2015-16
Appendices | 195
Table 103. Has ever voted in local, state, or federal election, or had the opportunity and chose not (proxy responses allowed)
State Yes Had the Opportunity But Chose Not to
No N
AL 49% 6% 45% 371
AR 26% 3% 71% 356
AZ 47% 1% 52% 456
CO 42% 8% 51% 396
CT 33% 6% 60% 311
DC 33% 2% 65% 358
DE 34% 7% 59% 320
FL 32% 5% 63% 1,356
GA 21% 8% 71% 404
HI 23% 5% 72% 347
IL 39% 8% 53% 339
IN 28% 2% 70% 814
KS 31% 20% 49% 298
KY 15% 2% 83% 413
LA 45% 2% 53% 392
MA 38% 9% 54% 387
ME 36% 1% 63% 357
MI 30% 4% 66% 408
MN 45% 5% 50% 394
MO 16% 5% 80% 385
MS 46% 5% 49% 385
NC 37% 8% 55% 711
NV 34% 27% 39% 371
NY 21% 8% 71% 461
OH 37% 9% 54% 523
OK 14% 0% 86% 382
PA 30% 11% 59% 646
RI 42% 8% 51% 431
SD 37% 5% 58% 324
TN 25% 5% 70% 416
UT 26% 2% 72% 370
VA 27% 5% 68% 778
VT 36% 1% 63% 308
WA 35% 3% 62% 378
WI 38% 7% 54% 399
WY 34% 5% 60% 302
NCI Average 33% 6% 61% 16,047

NCI Adult Consumer Survey Final Report 2015-16
Appendices | 196
Safety (un-collapsed)
Table 104. There is at least one place where the person feels afraid or scared
State Home Day Program Work Walking in the Community
In Transport N
AL 3% 2% 0% 2% 0% 334
AR 14% 7% 3% 13% 4% 224
AZ 2% 2% 1% 4% 6% 425
CO 8% 5% 2% 18% 8% 308
CT 7% 2% 2% 6% 4% 246
DC 3% 0% 0% 10% 4% 194
DE 12% 4% 2% 6% 3% 266
FL 3% 1% 0% 3% 1% 859
GA 3% 2% 1% 1% 1% 292
HI 4% 2% 0% 8% 1% 171
IL 10% 9% 1% 14% 4% 255
IN 3% 1% 2% 5% 2% 581
KS 15% 8% 2% 13% 2% 262
KY 1% 1% 0% 3% 1% 298
LA 6% 2% 1% 5% 1% 289
MA 10% 4% 2% 10% 6% 316
ME 20% 9% 2% 16% 8% 282
MI 7% 2% 2% 10% 3% 284
MN 5% 4% 1% 10% 8% 254
MO 5% 1% 0% 4% 2% 276
MS 5% 2% 2% 7% 2% 295
NC 8% 2% 1% 6% 2% 442
NV 8% 1% 3% 10% 4% 346
NY 4% 2% 1% 7% 4% 304
OH 6% 3% 2% 7% 3% 398
OK 6% 0% 2% 3% 3% 213
PA 6% 1% 1% 6% 1% 442
RI 12% 7% 1% 15% 8% 336
SD 11% 3% 2% 10% 3% 282
TN 6% 4% 1% 2% 1% 323
UT 12% 8% 3% 6% 5% 238
VA 7% 4% 0% 3% 3% 506
VT 9% 0% 0% 6% 1% 289
WA 3% 0% 0% 5% 3% 264
WI 2% 2% 3% 7% 3% 296
WY 10% 3% 0% 8% 2% 235
NCI Average 7% 3% 1% 7% 3% 11,625

NCI Adult Consumer Survey Final Report 2015-16
Appendices | 197
Table 105. Have someone to go to for help if they ever feel scared
State Yes Maybe, Not Sure No N
AL 97% 2% 2% 328
AR 91% 4% 5% 220
AZ 96% 1% 3% 420
CO 93% 4% 3% 299
CT 92% 3% 5% 238
DC 89% 2% 9% 187
DE 92% 2% 6% 250
FL 95% 2% 3% 838
GA 96% 1% 3% 295
HI 88% 1% 12% 195
IL 94% 3% 2% 241
IN 95% 1% 4% 560
KS 94% 3% 3% 265
KY 99% 1% 0% 298
LA 96% 1% 3% 282
MA 95% 1% 4% 294
ME 96% 2% 2% 290
MI 89% 8% 3% 271
MN 95% 1% 4% 247
MO 96% 2% 2% 253
MS 92% 2% 6% 289
NC 96% 2% 2% 425
NV 93% 2% 5% 340
NY 92% 5% 3% 311
OH 96% 2% 2% 379
OK 94% 0% 5% 209
PA 95% 1% 4% 416
RI 92% 3% 5% 344
SD 94% 2% 4% 280
TN 99% 0% 1% 334
UT 94% 2% 4% 238
VA 94% 4% 1% 488
VT 89% 8% 3% 265
WA 96% 2% 2% 259
WI 95% 1% 4% 285
WY 92% 5% 4% 225
NCI Average 94% 3% 4% 11,358


