Page 1
2015–16: the squeeze continues Carl Emmerson
Presentation for IFS and IfG background briefing on “The 2015–16 Spending Round”, Friday 7 June 2013, IfG, London.
Available at http://www.ifs.org.uk/projects/418 (with bonus slides)
© Institute for Fiscal Studies
Page 2
Introduction
• The Government’s deficit reduction plan and how 2015–16 fits within this
• The cuts planned under the last spending review (2011–12 to 2014–15) and those implied by the plans for 2016–17 & 2017–18
• What the 2015–16 spending round might mean for individual departments
• Outlook for public sector pay and employment
© Institute for Fiscal Studies
Page 3
Deficit to fall from post WW2 peak
© Institute for Fiscal Studies
-10
-5
0
5
10
15 1
95
0
19
55
–5
6
19
60
–6
1
19
65
–6
6
19
70
–7
1
19
75
–7
6
19
80
–8
1
19
85
–8
6
19
90
–9
1
19
95
–9
6
20
00
–0
1
20
05
–0
6
20
10
–1
1
20
15
–1
6
Pe
rce
nta
ge
of
na
tio
na
l in
com
e PSNB
Cyclically-adjusted PSNB
Notes: Data prior to 1955–56 are calendar rather than financial year. Data
exclude Royal Mail and APF transfers.
Source: ONS; OBR.
Page 4
-1
0
1
2
3
4
5
6
7
8
9
10
2010–11 2011–12 2012–13 2013–14 2014–15 2015–16 2016–17 2017–18
Pe
rce
nta
ge
of
na
tio
na
l in
com
e Other current spend
Debt interest
Benefits
Investment
Tax increases
© Institute for Fiscal Studies
Disease and cure
Notes: Figures include realised underspends by government departments and
latest estimate of Exchequer savings from changing to CPI indexation.
Source: Tetlow (2013).
Mar 2013: 8.6% national income (£133bn) hole in public finances,
offset by 9.1% national income (£141bn) consolidation over 8 years
Page 5
-1
0
1
2
3
4
5
6
7
8
9
10
2010–11 2011–12 2012–13 2013–14 2014–15 2015–16 2016–17 2017–18
Pe
rce
nta
ge
of
na
tio
na
l in
com
e Tax increases
Investment
Benefits
Other current spend
Total
© Institute for Fiscal Studies
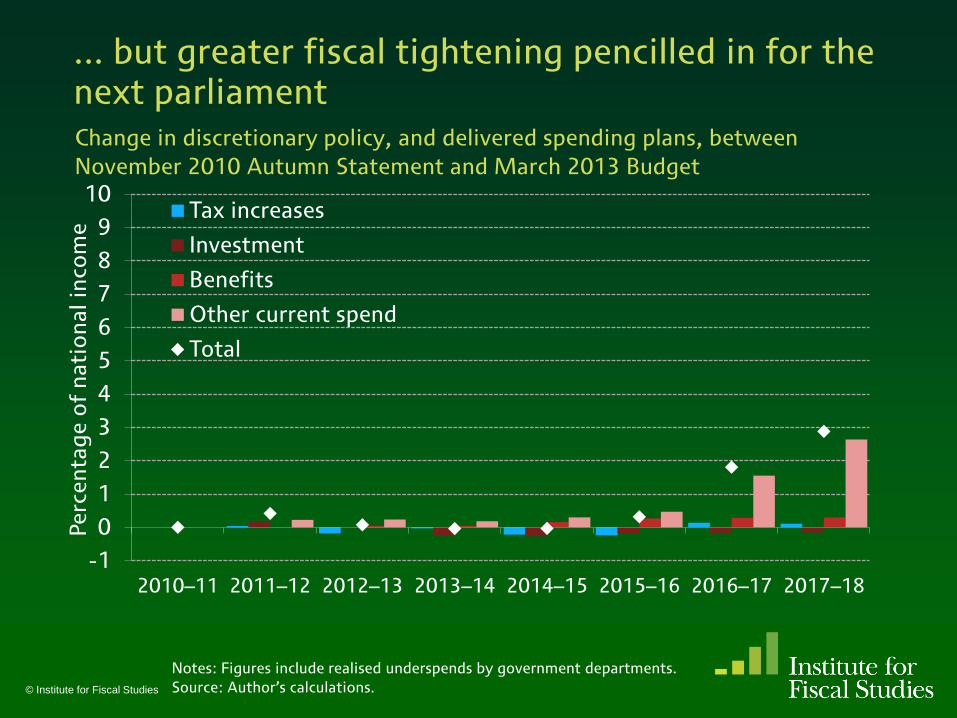
Aggregate impact of measures largely as planned in SR2010 in this parliament ...
Notes: Figures include realised underspends by government departments.
Source: Author’s calculations.
Change in discretionary policy and delivered spending plans, between
November 2010 Autumn Statement and March 2013 Budget
Page 6
-1
0
1
2
3
4
5
6
7
8
9
10
2010–11 2011–12 2012–13 2013–14 2014–15 2015–16 2016–17 2017–18
Pe
rce
nta
ge
of
na
tio
na
l in
com
e Tax increases
Investment
Benefits
Other current spend
Total
© Institute for Fiscal Studies
... but greater fiscal tightening pencilled in for the next parliament
Notes: Figures include realised underspends by government departments.
Source: Author’s calculations.
Change in discretionary policy, and delivered spending plans, between
November 2010 Autumn Statement and March 2013 Budget
Page 7
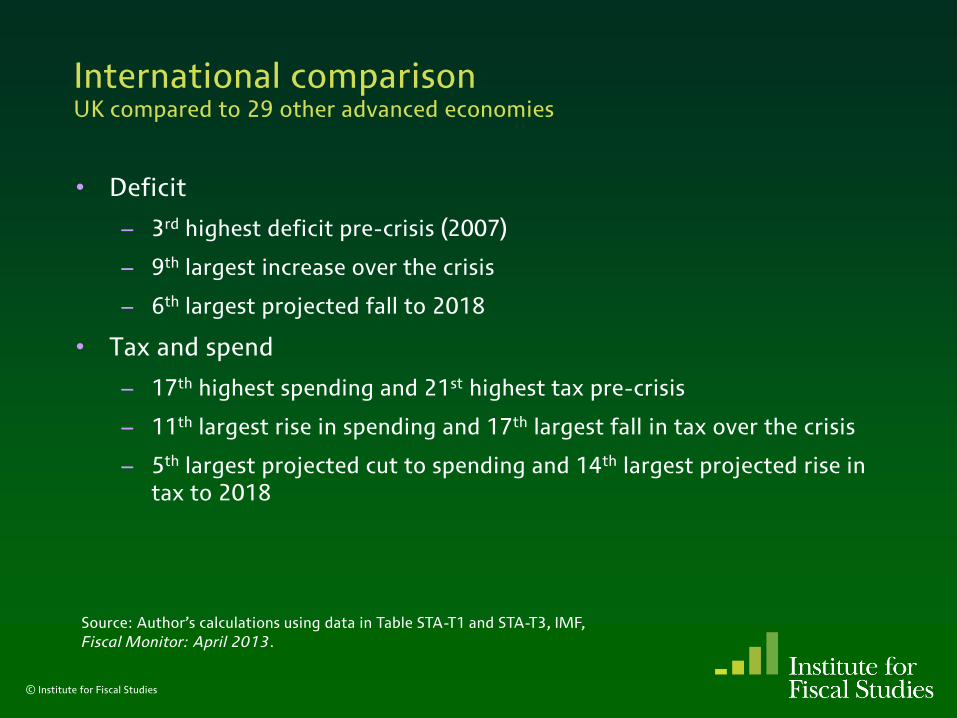
International comparison UK compared to 29 other advanced economies
• Deficit
– 3rd highest deficit pre-crisis (2007)
– 9th largest increase over the crisis
– 6th largest projected fall to 2018
• Tax and spend
– 17th highest spending and 21st highest tax pre-crisis
– 11th largest rise in spending and 17th largest fall in tax over the crisis
– 5th largest projected cut to spending and 14th largest projected rise in tax to 2018
© Institute for Fiscal Studies
Source: Author’s calculations using data in Table STA-T1 and STA-T3, IMF,
Fiscal Monitor: April 2013.
Page 8
6–year squeeze on public service spending
© Institute for Fiscal Studies
-10
-5
0
5
10
15 1
95
0–5
1
19
55
–5
6
19
60
–6
1
19
65
–6
6
19
70
–7
1
19
75
–7
6
19
80
–8
1
19
85
–8
6
19
90
–9
1
19
95
–9
6
20
00
–0
1
20
05
–0
6
20
10
–1
1
20
15
–1
6
An
nu
al
pe
rce
nta
ge
re
al
incr
ea
se
Labour ConLib Historic
Note: Figure shows total public spending less spending on net social benefits
and public sector net debt interest. Data exclude 3G and 4G spectrum sales
and Royal Mail pension transfer.
9.2% cut
over 2 years
15.8% cut
over 8 years
7–year 8–year
Page 9
Public Sector Net Investment
0.0%
0.5%
1.0%
1.5%
2.0%
2.5%
3.0%
3.5%
4.0% 1
99
2–9
3
19
93
–9
4
19
94
–9
5
19
95
–9
6
19
96
–9
7
19
97
–9
8
19
98
–9
9
19
99
–0
0
20
00
–0
1
20
01
–0
2
20
02
–0
3
20
03
–0
4
20
04
–0
5
20
05
–0
6
20
06
–0
7
20
07
–0
8
20
08
–0
9
20
09
–1
0
20
10
–1
1
20
11
–1
2
20
12
–1
3
20
13
–1
4
20
14
–1
5
20
15
–1
6
20
16
–1
7
20
17
–1
8 P
erc
en
tag
e o
f n
ati
on
al
inco
me
Budget March 2010
Budget 2013
© Institute for Fiscal Studies
Page 10
The outlook for DEL and AME
0
100
200
300
400
500
600
700
800 1
99
8–9
9
19
99
–0
0
20
00
–0
1
20
01
–0
2
20
02
–0
3
20
03
–0
4
20
04
–0
5
20
05
–0
6
20
06
–0
7
20
07
–0
8
20
08
–0
9
20
09
–1
0
20
10
–1
1
20
11
–1
2
20
12
–1
3
20
13
–1
4
20
14
–1
5
20
15
–1
6
20
16
–1
7
20
17
–1
8
£ b
illi
on
(2
01
2–1
3 p
rice
s) Total public spending
AME
DEL
© Institute for Fiscal Studies Note: DEL and AME figures from 2013–14 adjusted for changes for local government
funding for Business Rates Retention and Council Tax Benefit localisation.
Page 11
Managing Annually Managed Expenditure?
• DEL should not include unpredictable/uncontrollable spending
– failure of the pre-1992 spending regime was to allow a boost to structural spending to be hidden by falling cyclical spending in the late 1980s boom
• AME not subject to firm limits so departments may not face the same incentive to manage it as with their cash limited DEL spending
• Cap on working age social security spending could help force active decisions over how best to manage this spending
• But frequent and regular reviews should consider all – both rising and falling – components of public spending
© Institute for Fiscal Studies
Page 12
Departmental spending: SR2013 and beyond
© Institute for Fiscal Studies
50
60
70
80
90
100
110
120 2
01
0–1
1
20
11
–1
2
20
12
–1
3
20
13
–1
4
20
14
–1
5
20
15
–1
6
20
16
–1
7
20
17
-18
Re
al D
EL s
pe
nd
ing
(2
01
0–1
1 =
10
0) Spending Review 2010 period
'Unchanged policy' projections
–9.1% –11.7% –18.4%
–7.6% –2.8%
Will be allocated between
departments in 2013
Spending Round
Will be allocated between
departments after next
election
–8.9%
Note: DEL and AME figures from 2013–14 adjusted for changes for local government
funding for Business Rates Retention and Council Tax Benefit localisation.
Page 13
Departmental spending: 2010–11 to 2017–18
• Current plans imply cuts of
– 18.4% to total DEL over 7 years from April 2011, with just under half done over the first 4 years
– 2.8% to be implemented in 2015–16
– further 7.6% to occur over 2016–17 and 2017–18
• Budget 2013: “Fiscal consolidation for 2016–17 and 2017–18 is expressed as a reduction in TME. It would, of course, be possible to do more of this further consolidation through tax instead”
– implied DEL cuts over these years equivalent to £23bn in today’s terms
– cutting DEL at the same rate as planned over SR2010 years would require £9bn of tax rises/welfare cuts (or other cuts to AME) or higher borrowing in 2017–18
– further tax rises and/or welfare cuts after next election?
© Institute for Fiscal Studies
Page 14
Central government sharing the cuts unevenly...
-9.1 -7.2
-7.0
-3.2
-1.1
4.2
27.9
-50.5
-44.0
-34.7
-27.3
-26.6
-25.6
-23.5
-22.9
-21.8
-80 -60 -40 -20 0 20 40
Foreign and Commonwealth Office
CLG Communities
Culture, Media and Sport
Justice
CLG Local Government
Environment, Food and Rural Affairs
Home Office
Business, Innovation and Skills
Work and Pensions
Total DEL
Education
Defence
Energy and Climate Change
Transport
NHS (Health)
International Development
Real budget increase 2010–11 to 2014–15
© Institute for Fiscal Studies
Note: Figures show cumulative change in total DEL after economy-wide inflation.
Page 15
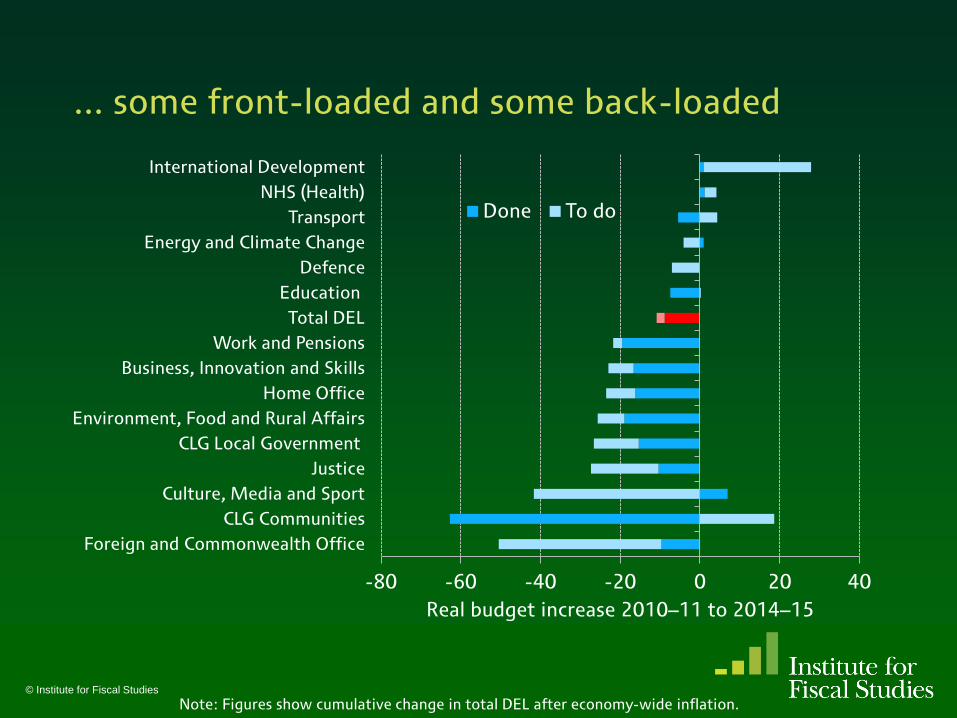
... some front-loaded and some back-loaded
-80 -60 -40 -20 0 20 40
Foreign and Commonwealth Office
CLG Communities
Culture, Media and Sport
Justice
CLG Local Government
Environment, Food and Rural Affairs
Home Office
Business, Innovation and Skills
Work and Pensions
Total DEL
Education
Defence
Energy and Climate Change
Transport
NHS (Health)
International Development
Real budget increase 2010–11 to 2014–15
Done To do
© Institute for Fiscal Studies
Note: Figures show cumulative change in total DEL after economy-wide inflation.
Page 16
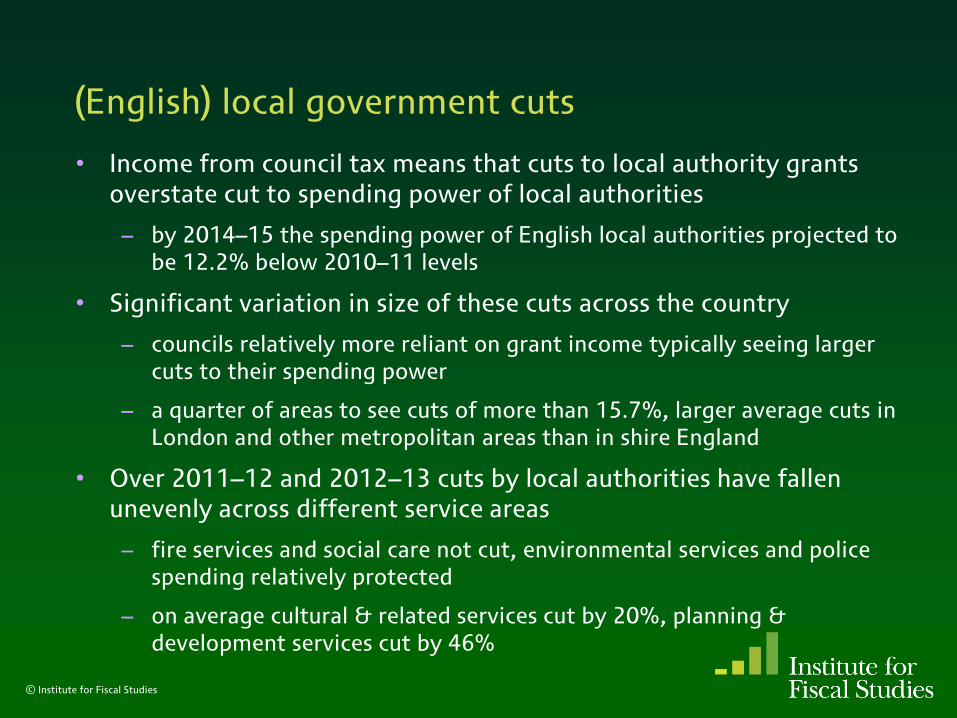
(English) local government cuts
• Income from council tax means that cuts to local authority grants overstate cut to spending power of local authorities
– by 2014–15 the spending power of English local authorities projected to be 12.2% below 2010–11 levels
• Significant variation in size of these cuts across the country
– councils relatively more reliant on grant income typically seeing larger cuts to their spending power
– a quarter of areas to see cuts of more than 15.7%, larger average cuts in London and other metropolitan areas than in shire England
• Over 2011–12 and 2012–13 cuts by local authorities have fallen unevenly across different service areas
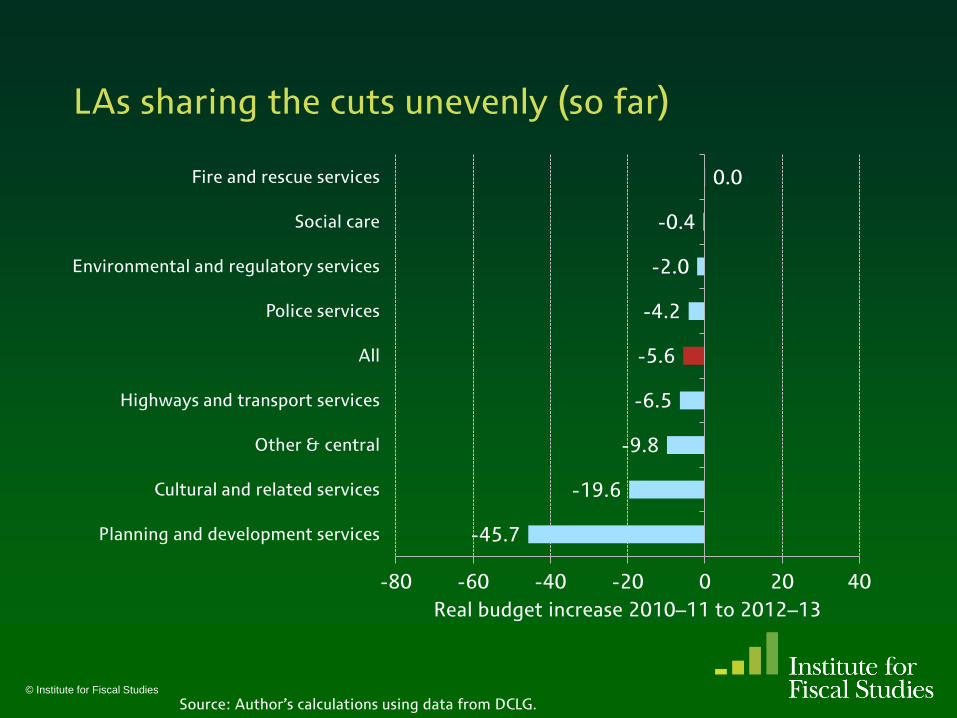
– fire services and social care not cut, environmental services and police spending relatively protected
– on average cultural & related services cut by 20%, planning & development services cut by 46%
© Institute for Fiscal Studies
Page 17
The 2015–16 Spending Round (1/3)
• Budget 2013 set the total spending envelope for 2015–16, given OBR forecast for non-departmental spending:
– implied total DEL to be cut in real terms by £9.8 billion or 2.8%, with resource DEL being cut by 2.7% (£8.4bn) and capital DEL by 3.3% (£1.4bn)
– over SR2010 years total DEL is forecast to be cut by an average of 2.4% a year: to cut at this rate would require an extra £1 billion from welfare spending/other non-departmental spending
• Note the widely quoted £11.5bn cuts to resource DEL number differs from the £8.4bn stated above since the latter
– is in current terms
– includes the OBR’s projected 2014–15 underspend
– excludes £1.5bn of cuts already scored in 2014–15
© Institute for Fiscal Studies
Page 18
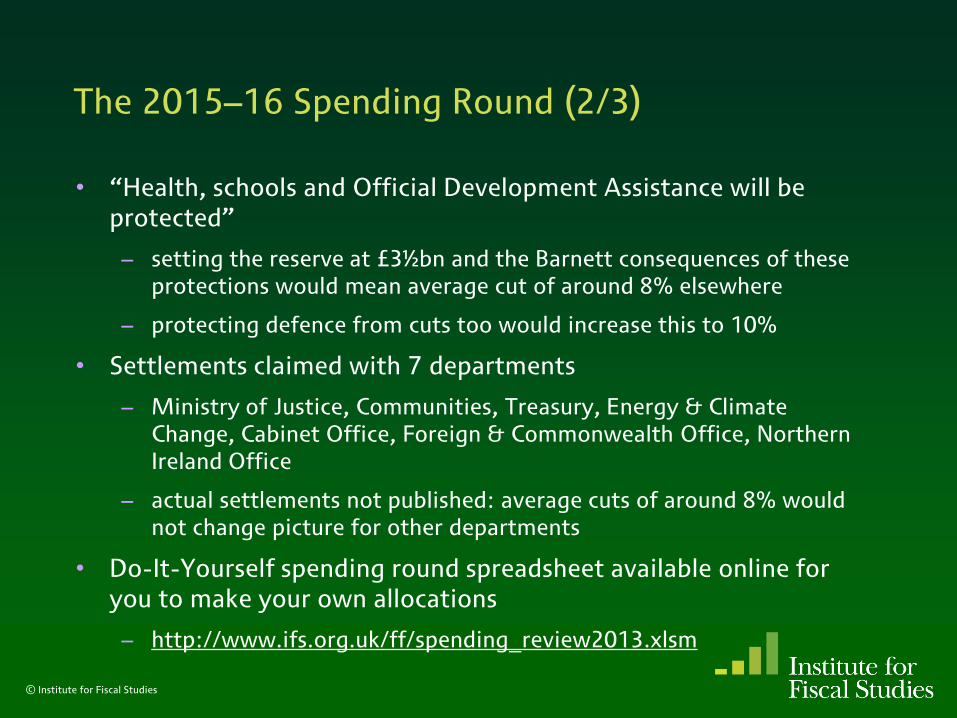
The 2015–16 Spending Round (2/3)
• “Health, schools and Official Development Assistance will be protected”
– setting the reserve at £3½bn and the Barnett consequences of these protections would mean average cut of around 8% elsewhere
– protecting defence from cuts too would increase this to 10%
• Settlements claimed with 7 departments
– Ministry of Justice, Communities, Treasury, Energy & Climate Change, Cabinet Office, Foreign & Commonwealth Office, Northern Ireland Office
– actual settlements not published: average cuts of around 8% would not change picture for other departments
• Do-It-Yourself spending round spreadsheet available online for you to make your own allocations
– http://www.ifs.org.uk/ff/spending_review2013.xlsm
© Institute for Fiscal Studies
Page 19
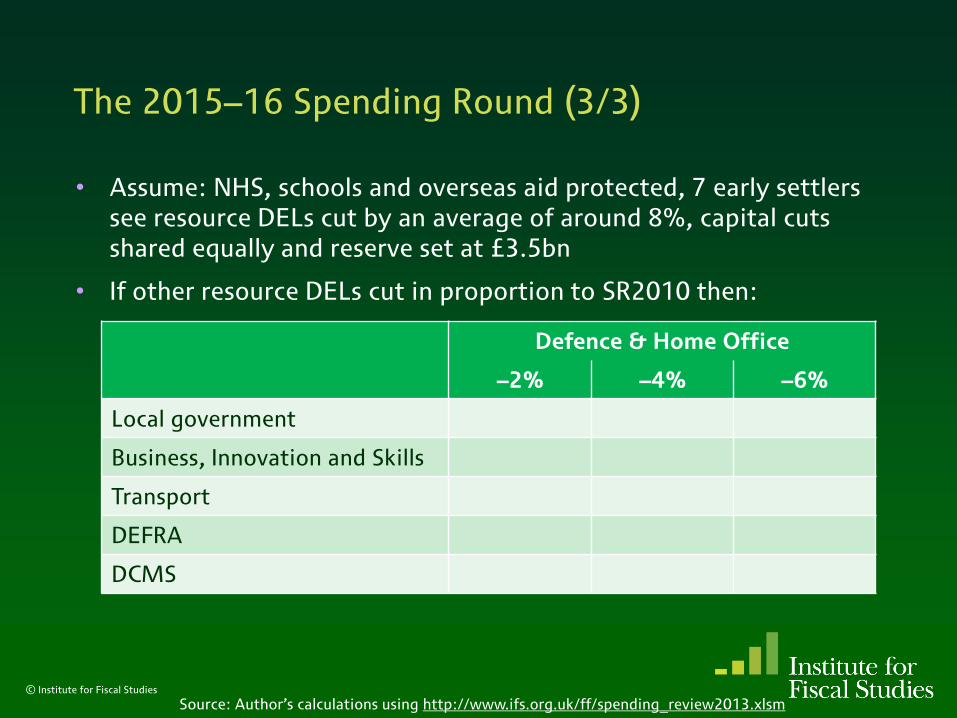
The 2015–16 Spending Round (3/3)
• Assume: NHS, schools and overseas aid protected, 7 early settlers see resource DELs cut by an average of around 8%, capital cuts shared equally and reserve set at £3.5bn
• If other resource DELs cut in proportion to SR2010 then:
© Institute for Fiscal Studies
Defence & Home Office
–2% –4% –6%
Local government
Business, Innovation and Skills
Transport
DEFRA
DCMS
Source: Author’s calculations using http://www.ifs.org.uk/ff/spending_review2013.xlsm
Page 20
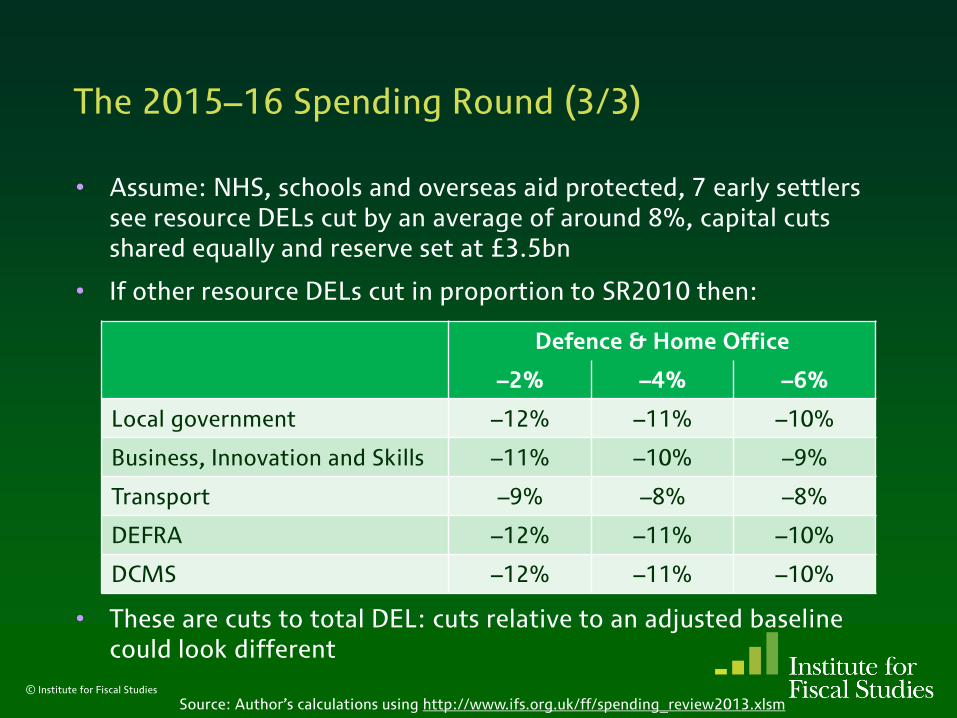
The 2015–16 Spending Round (3/3)
• Assume: NHS, schools and overseas aid protected, 7 early settlers see resource DELs cut by an average of around 8%, capital cuts shared equally and reserve set at £3.5bn
• If other resource DELs cut in proportion to SR2010 then:
• These are cuts to total DEL: cuts relative to an adjusted baseline could look different
© Institute for Fiscal Studies
Defence & Home Office
–2% –4% –6%
Local government –12% –11% –10%
Business, Innovation and Skills –11% –10% –9%
Transport –9% –8% –8%
DEFRA –12% –11% –10%
DCMS –12% –11% –10%
Source: Author’s calculations using http://www.ifs.org.uk/ff/spending_review2013.xlsm
Page 21
Public sector pay
• Budget 2013 extended 1% average public sector pay increase to 2015–16
– lower than projected economy-wide inflation (1.8%), CPI inflation (2.1%) and average earnings growth (3.8%)
– central government paybill in 2014–15 projected (in summer 2012) to be £94.5bn and this is currently just over half of general government paybill
– pay falling by 0.8% relative to economy-wide inflation cuts real DEL by around £1bn to £1½bn
© Institute for Fiscal Studies
Page 22
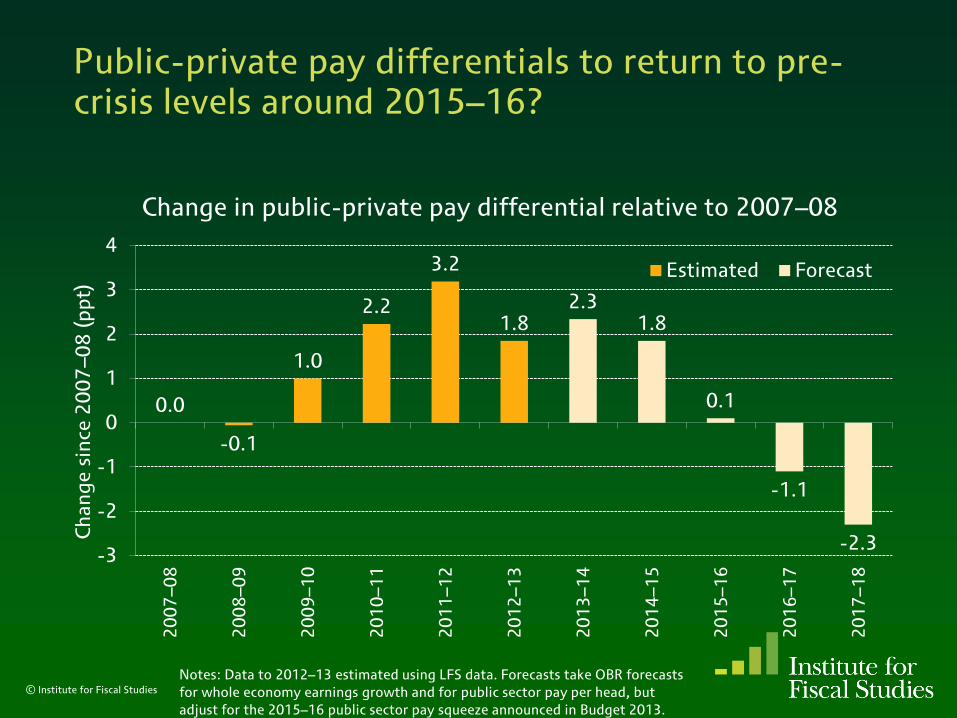
0.0
-0.1
1.0
2.2
3.2
1.8 2.3
1.8
0.1
-1.1
-2.3 -3
-2
-1
0
1
2
3
4
20
07
–0
8
20
08
–0
9
20
09
–1
0
20
10
–1
1
20
11
–1
2
20
12
–1
3
20
13
–1
4
20
14
–1
5
20
15
–1
6
20
16
–1
7
20
17
–1
8
Ch
an
ge
sin
ce 2
00
7–0
8 (
pp
t) Estimated Forecast
© Institute for Fiscal Studies
Public-private pay differentials to return to pre-crisis levels around 2015–16?
Change in public-private pay differential relative to 2007–08
Notes: Data to 2012–13 estimated using LFS data. Forecasts take OBR forecasts
for whole economy earnings growth and for public sector pay per head, but
adjust for the 2015–16 public sector pay squeeze announced in Budget 2013.
Page 23
Public sector employment
• 410,000 fewer public sector workers in Dec. 2012 than in Dec. 2010
• OBR March 2013 forecast that between 2010–11 and 2017–18 general government employment to fall by 1 million
• But
– departments plan to cut paybill faster to 2014–15 than OBR assumes: implies a fall of 150,000 more than forecast by OBR by 2017–18, rising to 250,000 if paybill trend persists
– 2015–16 public sector pay policy not incorporated into the OBR’s forecast: likely to boost employment by around 30,000
© Institute for Fiscal Studies
Page 24
Conclusions
• Average real DEL cut in 2015–16 projected at 2.8%
– unprotected departments could see planned cuts averaging 8%
– some departments could see a cut to their total budget of 10% between 2014–15 and 2015–16?
• Significant cuts have been delivered with more to come
– rising AME leaves total spending broadly flat in real terms
– 2015–16 cuts on top of those in last Spending Review: some unprotected departments cut by 30%+ since 2010–11
– two further years of cuts pencilled into the Government’s plans
• Public sector pay squeeze to 2015–16 on course to restore pay relative to private sector to pre-crisis levels
– further squeezes to public sector pay beyond 2015–16 might be likely but would inevitably become harder to deliver
© Institute for Fiscal Studies
Page 25
2015–16: the squeeze continues Carl Emmerson
Presentation for IFS and IfG background briefing on “The 2015–16 Spending Round”, Friday 7 June 2013, IfG, London.
Available at http://www.ifs.org.uk/projects/418 (with bonus slides)
© Institute for Fiscal Studies
Page 26
IFS references
• Crawford, R. (2013), “Do It Yourself Spending Round Spreadsheet” http://www.ifs.org.uk/ff/spending_review2013.xlsm
• Crawford, R. (2013), “Spending Review 2013 and beyond” http://www.ifs.org.uk/publications/6652
• Crawford, R. Cribb, J. & Sibieta, L. (2013) “Public spending, public sector employment and public sector pay” http://www.ifs.org.uk/budgets/gb2013/GB2013_Ch6.pdf
• Crawford, R. Emmerson, C. Phillips, D. & Tetlow, G. (2011) “Public spending cuts: pain shared?” http://www.ifs.org.uk/budgets/gb2011/11chap6.pdf
• Crawford, R. & Johnson, P. (2013), “The rapidly changing state” http://www.ifs.org.uk/publications/6642
• Tetlow, G. (2013) “Cutting the deficit: three years down, five to go?” http://www.ifs.org.uk/publications/6683
© Institute for Fiscal Studies
Page 27
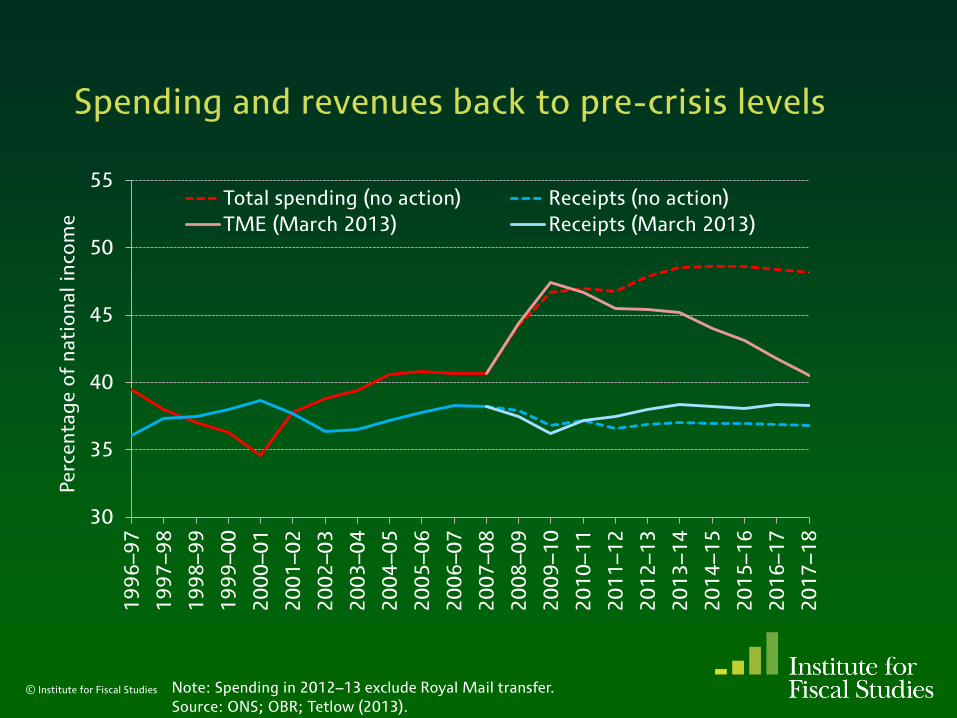
Spending and revenues back to pre-crisis levels
© Institute for Fiscal Studies
30
35
40
45
50
55
19
96
–9
7
19
97
–9
8
19
98
–9
9
19
99
–0
0
20
00
–0
1
20
01
–0
2
20
02
–0
3
20
03
–0
4
20
04
–0
5
20
05
–0
6
20
06
–0
7
20
07
–0
8
20
08
–0
9
20
09
–1
0
20
10
–1
1
20
11
–1
2
20
12
–1
3
20
13
–1
4
20
14
–1
5
20
15
–1
6
20
16
–1
7
20
17
–1
8
Pe
rce
nta
ge
of
na
tio
na
l in
com
e
Total spending (no action) Receipts (no action)
TME (March 2013) Receipts (March 2013)
Note: Spending in 2012–13 exclude Royal Mail transfer.
Source: ONS; OBR; Tetlow (2013).
Page 28
0
1
2
3
4
5
6
7
8
9
10 H
MT
Bu
dg
et
20
08
HM
T P
BR
20
08
HM
T B
ud
ge
t 2
00
9
HM
T P
BR
20
09
HM
T B
ud
ge
t M
arc
h 2
01
0
OB
R B
ud
ge
t Ju
ne
2
01
0
OB
R N
ove
mb
er
20
10
OB
R B
ud
ge
t 2
01
1
OB
R N
ove
mb
er
20
11
OB
R B
ud
ge
t 2
01
2
OB
R D
ece
mb
er
20
12
OB
R M
arc
h 2
01
3
Pe
rce
nta
ge
of
na
tio
na
l in
com
e
Size of the problem Planned fiscal consolidation
© Institute for Fiscal Studies
The hole in the public finances has increased
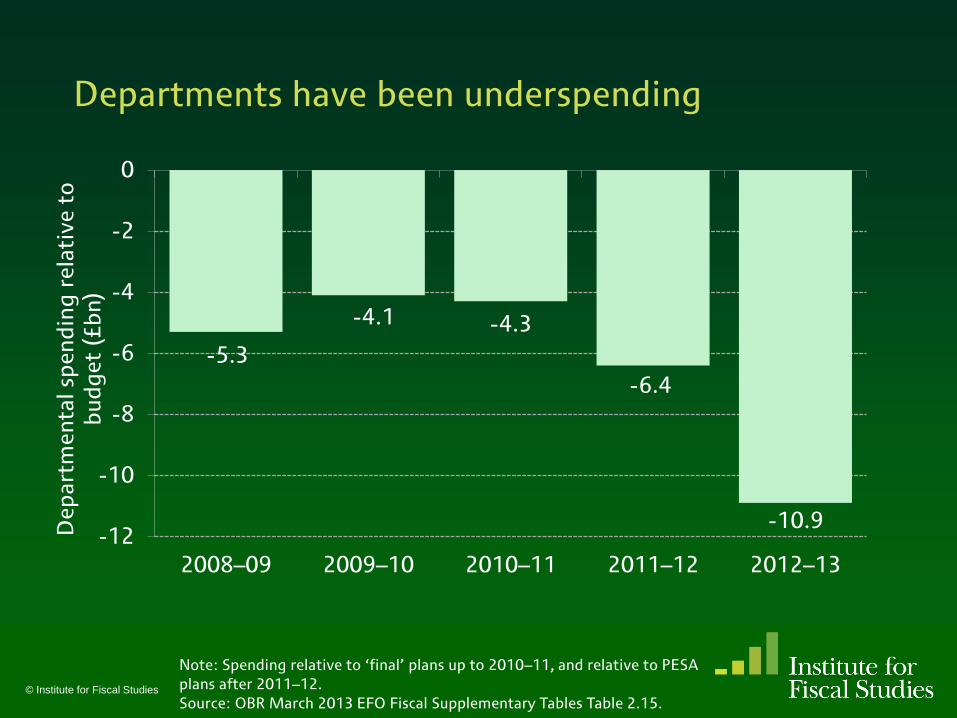
Page 29
-5.3
-4.1 -4.3
-6.4
-10.9 -12
-10
-8
-6
-4
-2
0
2008–09 2009–10 2010–11 2011–12 2012–13
De
pa
rtm
en
tal
spe
nd
ing
re
lati
ve
to
b
ud
ge
t (£
bn
)
© Institute for Fiscal Studies
Departments have been underspending
Note: Spending relative to ‘final’ plans up to 2010–11, and relative to PESA
plans after 2011–12.
Source: OBR March 2013 EFO Fiscal Supplementary Tables Table 2.15.
Page 30
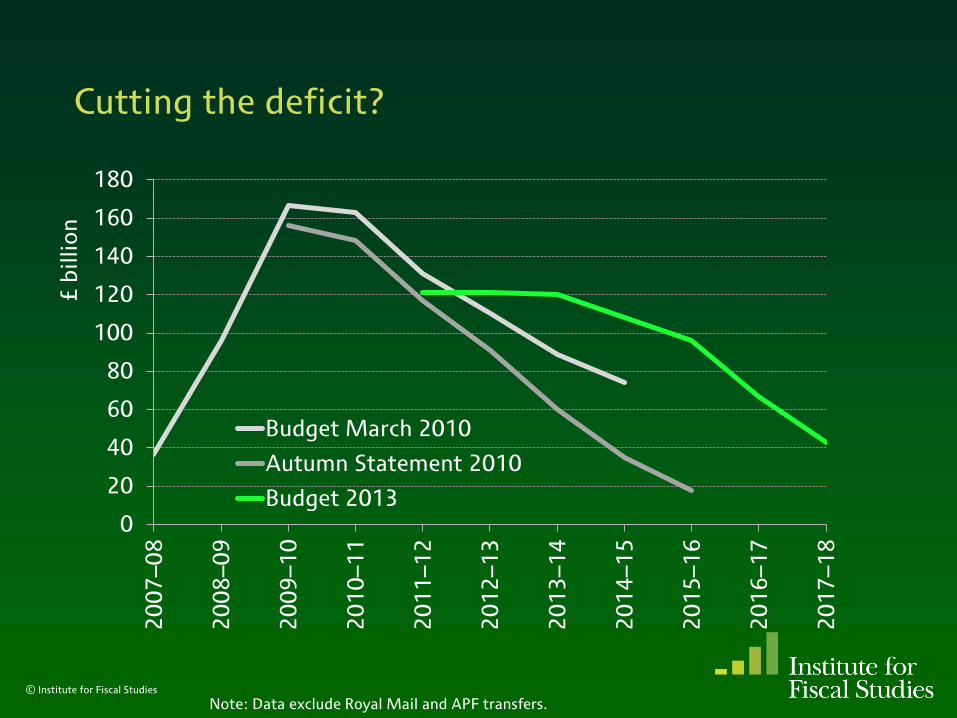
Cutting the deficit?
© Institute for Fiscal Studies
0
20
40
60
80
100
120
140
160
180 2
00
7–0
8
20
08
–0
9
20
09
–1
0
20
10
–1
1
20
11
–1
2
20
12
–1
3
20
13
–1
4
20
14
–1
5
20
15
–1
6
20
16
–1
7
20
17
–1
8
£ b
illi
on
Budget March 2010
Autumn Statement 2010
Budget 2013
Note: Data exclude Royal Mail and APF transfers.
Page 31
International comparison: tax, spend and borrow
© Institute for Fiscal Studies
UK rank Tax Spend Borrow
Level
Pre-crisis (2007) 21st highest 17th highest 3rd highest
Peak/trough 19th highest 16th highest 4th highest
2018 19th highest 20th highest 8th highest
Change
Pre-crisis (2007)-peak/trough 17th largest fall 11th largest rise 9th largest rise
Peak/trough-2018 14th largest rise 5th largest cut 6th largest cut
2007-2018 14th largest rise 9th largest cut 6th largest cut
Source: Table STA-T1 and STA-T3, IMF, Fiscal Monitor: April 2013.
Comparison of IMF forecasts for the UK and 29 other advanced
economies show:
Page 32
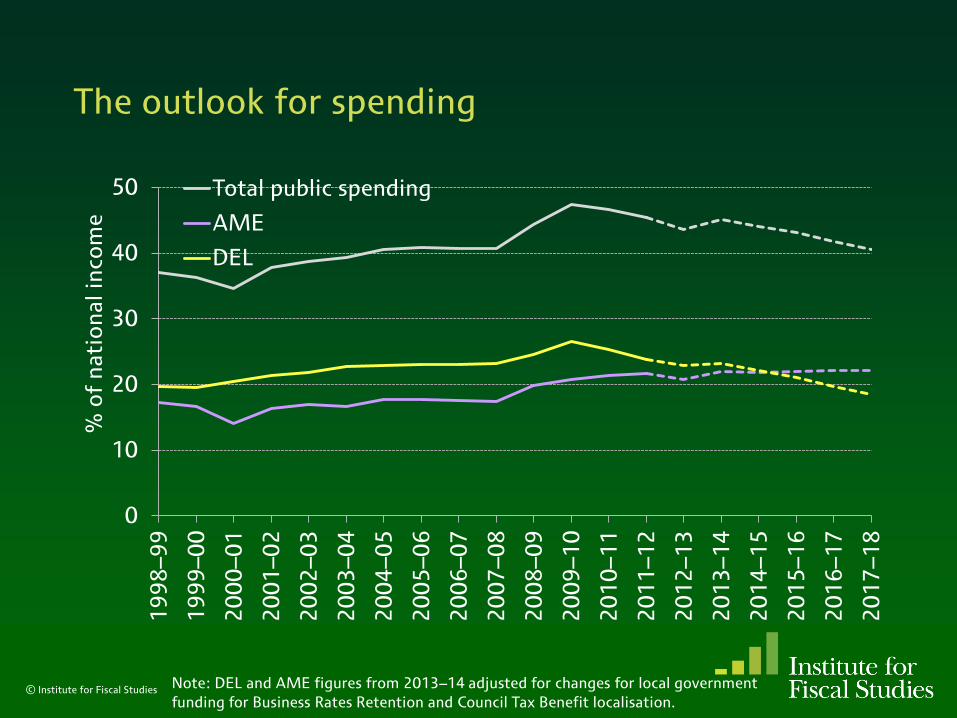
The outlook for spending
0
10
20
30
40
50
19
98
–9
9
19
99
–0
0
20
00
–0
1
20
01
–0
2
20
02
–0
3
20
03
–0
4
20
04
–0
5
20
05
–0
6
20
06
–0
7
20
07
–0
8
20
08
–0
9
20
09
–1
0
20
10
–1
1
20
11
–1
2
20
12
–1
3
20
13
–1
4
20
14
–1
5
20
15
–1
6
20
16
–1
7
20
17
–1
8
% o
f n
ati
on
al
inco
me
Total public spending
AME
DEL
© Institute for Fiscal Studies Note: DEL and AME figures from 2013–14 adjusted for changes for local government
funding for Business Rates Retention and Council Tax Benefit localisation.
Page 33
Variation in local authority cuts across England]
© Institute for Fiscal Studies
Notes: Spending power aggregated to the levels of local government shown in
the Figure. Excludes spending by the GLA and fire authorities.
Source: Author’s calculations using data from DCLG.
-20
-18
-16
-14
-12
-10
-8
-6
-4
-2
0 Shire Unitary London Metropolitan All
Pe
rce
nta
ge
ch
an
ge
in
sp
en
din
g
po
we
r A
pri
l 2
01
1 t
o M
arc
h 2
01
5
Median
p75
p25
Change in spending power (grants and council tax revenue) among
English local authorities between April 2011 and March 2015
Page 34
LAs sharing the cuts unevenly (so far)
-45.7
-19.6
-9.8
-6.5
-5.6
-4.2
-2.0
-0.4
0.0
-80 -60 -40 -20 0 20 40
Planning and development services
Cultural and related services
Other & central
Highways and transport services
All
Police services
Environmental and regulatory services
Social care
Fire and rescue services
Real budget increase 2010–11 to 2012–13
© Institute for Fiscal Studies
Source: Author’s calculations using data from DCLG.
Page 35
Beyond SR 2013: Trade off between DEL cuts and other policy action
© Institute for Fiscal Studies
-10
-5
0
5
10
15
20
25
30
35
40
-15% -10% -5% 0% 5%
Ta
x i
ncr
ea
se o
r so
cia
l se
curi
ty s
pe
nd
ing
cu
t, £
bil
lio
n (
20
12
–1
3 t
erm
s)
Real change in departmental spending, 2015–16 to 2017–18
Total DEL
‘Unprotected DEL’
No new tax rise or social security cuts:
7.6% total DEL cut
No real cuts to total DEL:
£23 billion policy action
Total DEL cut at same rate as over SR2010:
£9 billion policy action
No new tax rise or social
security cuts: 14.5%
‘unprotected’ DEL cut
‘Unprotected’ DEL cut at
same rate as over SR2010:
£8 billion policy action
Page 36
Employment
© Institute for Fiscal Studies
4.0
4.5
5.0
5.5
6.0
6.5
7.0
21.0
21.5
22.0
22.5
23.0
23.5
24.0 1
99
9 M
ar
19
99
Se
p
20
00
Ma
r 2
00
0 S
ep
2
00
1 M
ar
20
01
Se
p
20
02
Ma
r 2
00
2 S
ep
2
00
3 M
ar
20
03
Se
p
20
04
Ma
r 2
00
4 S
ep
2
00
5 M
ar
20
05
Se
p
20
06
Ma
r 2
00
6 S
ep
2
00
7 M
ar
20
07
Se
p
20
08
Ma
r 2
00
8 S
ep
2
00
9 M
ar
20
09
Se
p
20
10
Ma
r 2
01
0 S
ep
2
01
1 M
ar
20
11
Se
p
20
12
Ma
r 2
01
2 S
ep
Pu
bli
c se
cto
r e
mp
loy
ee
s (m
illi
on
)
Pri
va
te s
ect
or
em
plo
ye
es
(mil
lio
n)
Private sector (LH axis)
Public sector (RH axis)
Note: To aid comparison all financial sector workers are attributed to the private
sector for the whole period.
Source: ONS.
Page 37
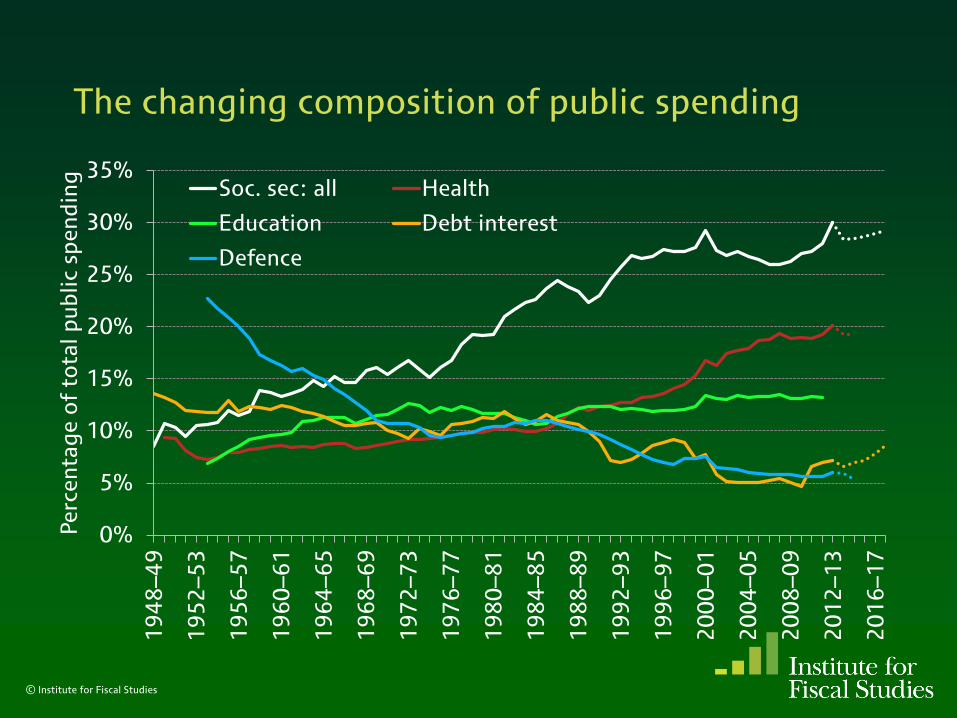
The changing composition of public spending
© Institute for Fiscal Studies
0%
5%
10%
15%
20%
25%
30%
35% 1
94
8–4
9
19
52
–5
3
19
56
–5
7
19
60
–6
1
19
64
–6
5
19
68
–6
9
19
72
–7
3
19
76
–7
7
19
80
–8
1
19
84
–8
5
19
88
–8
9
19
92
–9
3
19
96
–9
7
20
00
–0
1
20
04
–0
5
20
08
–0
9
20
12
–1
3
20
16
–1
7
Pe
rce
nta
ge
of
tota
l p
ub
lic
spe
nd
ing
Soc. sec: all
Soc. sec: pensioners
Soc. sec: working age
Page 38
The changing composition of public spending
© Institute for Fiscal Studies
0%
5%
10%
15%
20%
25%
30%
35% 1
94
8–4
9
19
52
–5
3
19
56
–5
7
19
60
–6
1
19
64
–6
5
19
68
–6
9
19
72
–7
3
19
76
–7
7
19
80
–8
1
19
84
–8
5
19
88
–8
9
19
92
–9
3
19
96
–9
7
20
00
–0
1
20
04
–0
5
20
08
–0
9
20
12
–1
3
20
16
–1
7
Pe
rce
nta
ge
of
tota
l p
ub
lic
spe
nd
ing
Soc. sec: all Health
Education Debt interest
Defence
Page 39
The changing composition of public spending
© Institute for Fiscal Studies
0%
5%
10%
15%
20%
25%
30%
35% 1
94
8–4
9
19
52
–5
3
19
56
–5
7
19
60
–6
1
19
64
–6
5
19
68
–6
9
19
72
–7
3
19
76
–7
7
19
80
–8
1
19
84
–8
5
19
88
–8
9
19
92
–9
3
19
96
–9
7
20
00
–0
1
20
04
–0
5
20
08
–0
9
20
12
–1
3
20
16
–1
7
Pe
rce
nta
ge
of
tota
l p
ub
lic
spe
nd
ing
Soc. sec: all Health
Soc. sec: pensioners Soc. sec: working age
Education Debt interest
Defence