+ All Categories
Home > Documents > 2015 - 2016 City of Saint Paul Bicycle and Pedestrian ... Root/Public Works... · 2015 - 2016 City...

2015 - 2016 City of Saint Paul Bicycle and Pedestrian ... Root/Public Works... · 2015 - 2016 City...

Date post: 29-Jun-2018
Category:
Upload: vandien
View: 214 times
Download: 0 times
Share this document with a friend
17
2015 - 2016 City of Saint Paul Bicycle and Pedestrian Count Report August 1, 2017 Contact Info For questions or additional information about this report, contact Luke Hanson at 651-266-6146 or [email protected] Since 2013, the City of Saint Paul Department of Public Works has conducted annual bicycle and pedestrian counts mid-week in September. In 2016, with the help of 40 volunteers, bicycle and pedestrian data was manually tabulated for 95 screen lines throughout the city. The number of participating volunteers determined the number of locations counted. KEY FINDINGS Traffic at Annual Benchmark Locations Benchmark locations for bicycle and pedestrian traffic are counted each year to measure annual changes in non-mo- torized traffic. 30 benchmark sites for bicycle traffic and 25 benchmark sites for pedestrian traffic have been counted annually since 2013. The counts performed in 2016 at benchmark locations recorded a 14% increase in both bicycle and pedestrian traffic from 2015. Poor weather in 2015 required many of the counts to be rescheduled and pushed back into late September/early October, and may account for the large increase in observed bicycle and pedestrian traffic in 2016. 2015 – 2016 Changes in Non-Motorized Traffic The number of people bicycling at 30 benchmark locations increased by 14% The number of people walking at 25 benchmark locations increased by 14% 2013 – 2016 Changes in Non-Motorized Traffic The number of people bicycling at 30 benchmark locations increased by 2% The number of people walking at 25 benchmark locations increased by 10% Top Bicycling Locations Measured in 2016 (Location totals reflect tabulated 2-hour peak counts) 1. Marshall Avenue Bridge (437) 2. Summit Ave east of Fairview Ave (246) 3. Ford Parkway Bridge (193) 4. U of M Transitway west of Energy Park Dr (185) 5. Mississippi River Blvd south of Jefferson Ave (181) Top Walking Locations Measured in 2016 (Location totals reflect tabulated 2-hour peak counts) 1. Lexington Pkwy south of Como Lake Dr. (363) 2. Kellogg Blvd east of Broadway Ave (244) 3. Mississippi River Blvd south of Jefferson Ave (215) 4. Kellogg Blvd north of Smith Ave (175) 5. Summit Ave east of Dale St (165)
Transcript

2015 - 2016 City of Saint Paul Bicycle and Pedestrian Count ReportAugust 1, 2017

Contact InfoFor questions or additional information about this report, contact Luke Hanson at 651-266-6146 or [email protected]

Since 2013, the City of Saint Paul Department of Public Works has conducted annual bicycle and pedestrian counts mid-week in September. In 2016, with the help of 40 volunteers, bicycle and pedestrian data was manually tabulated for 95 screen lines throughout the city. The number of participating volunteers determined the number of locations counted.

KEY FINDINGS

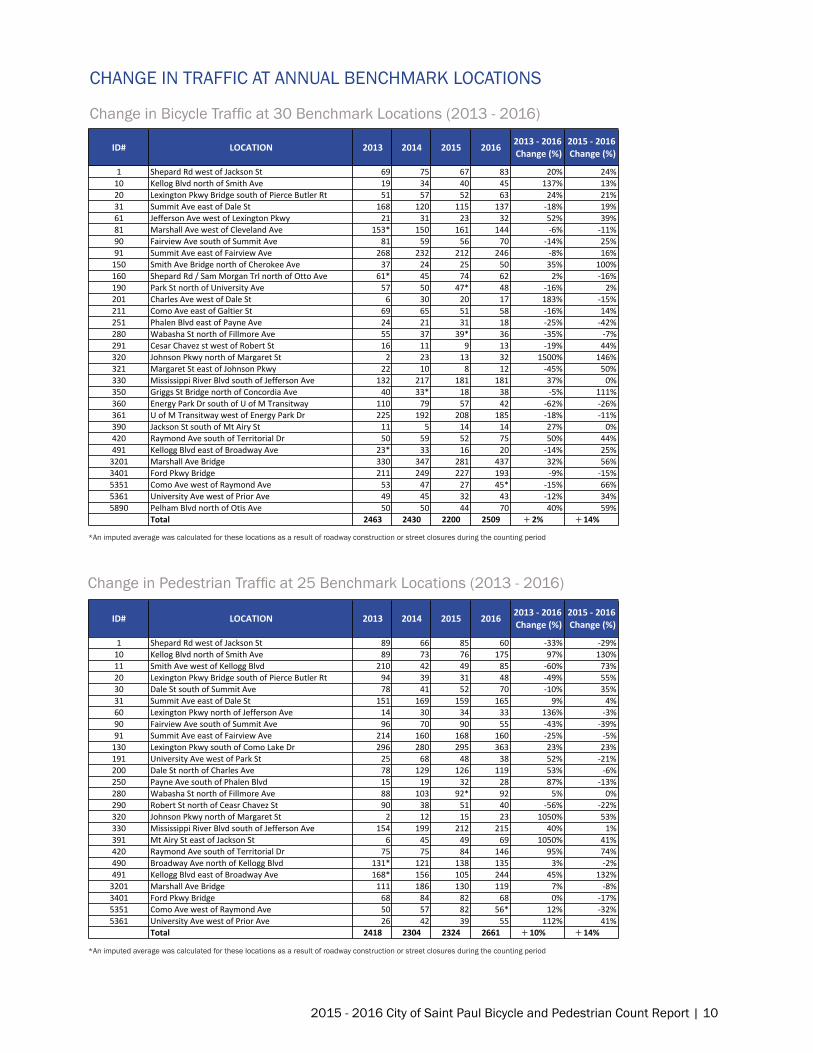
Traffic at Annual Benchmark LocationsBenchmark locations for bicycle and pedestrian traffic are counted each year to measure annual changes in non-mo-torized traffic. 30 benchmark sites for bicycle traffic and 25 benchmark sites for pedestrian traffic have been counted annually since 2013. The counts performed in 2016 at benchmark locations recorded a 14% increase in both bicycle and pedestrian traffic from 2015. Poor weather in 2015 required many of the counts to be rescheduled and pushed back into late September/early October, and may account for the large increase in observed bicycle and pedestrian traffic in 2016.

2015 – 2016 Changes in Non-Motorized TrafficThe number of people bicycling at 30 benchmark locations increased by 14%The number of people walking at 25 benchmark locations increased by 14%

2013 – 2016 Changes in Non-Motorized TrafficThe number of people bicycling at 30 benchmark locations increased by 2%The number of people walking at 25 benchmark locations increased by 10%

Top Bicycling Locations Measured in 2016(Location totals reflect tabulated 2-hour peak counts)

1. Marshall Avenue Bridge (437)2. Summit Ave east of Fairview Ave (246)3. Ford Parkway Bridge (193)4. U of M Transitway west of Energy Park Dr (185)5. Mississippi River Blvd south of Jefferson Ave (181)

Top Walking Locations Measured in 2016(Location totals reflect tabulated 2-hour peak counts)

1. Lexington Pkwy south of Como Lake Dr. (363)2. Kellogg Blvd east of Broadway Ave (244)3. Mississippi River Blvd south of Jefferson Ave (215)4. Kellogg Blvd north of Smith Ave (175)5. Summit Ave east of Dale St (165)

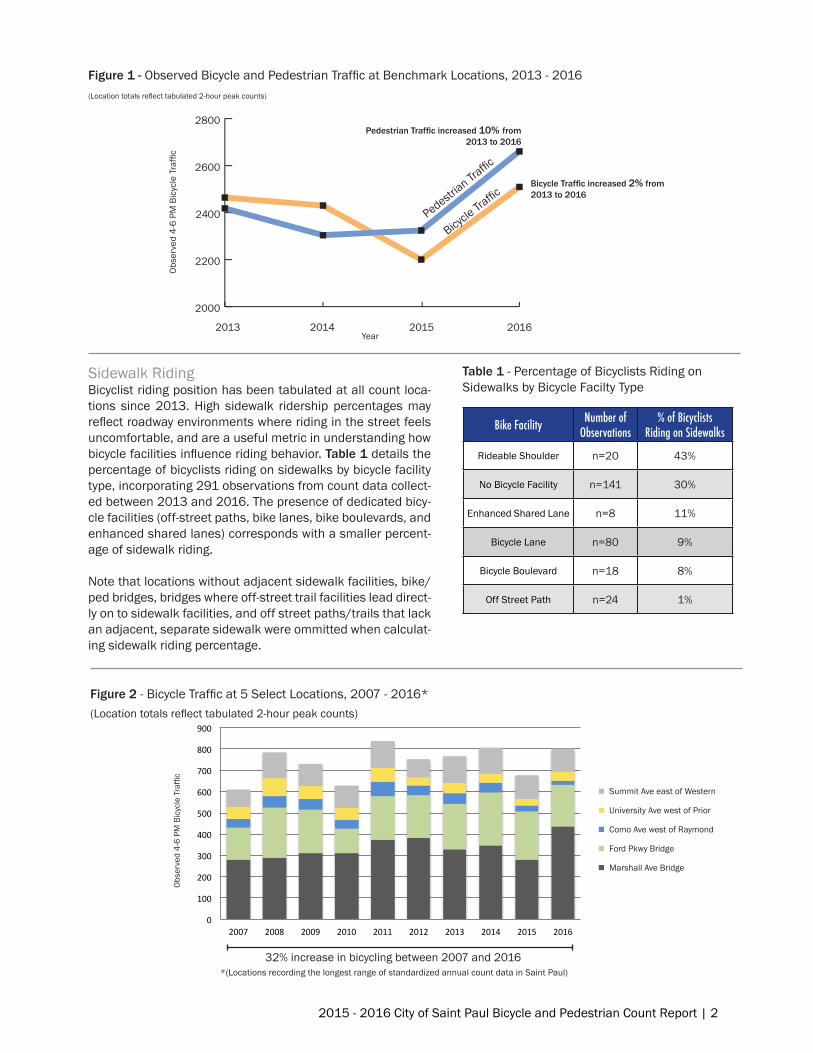
Sidewalk RidingBicyclist riding position has been tabulated at all count loca-tions since 2013. High sidewalk ridership percentages may reflect roadway environments where riding in the street feels uncomfortable, and are a useful metric in understanding how bicycle facilities influence riding behavior. Table 1 details the percentage of bicyclists riding on sidewalks by bicycle facility type, incorporating 291 observations from count data collect-ed between 2013 and 2016. The presence of dedicated bicy-cle facilities (off-street paths, bike lanes, bike boulevards, and enhanced shared lanes) corresponds with a smaller percent-age of sidewalk riding.

Note that locations without adjacent sidewalk facilities, bike/ped bridges, bridges where off-street trail facilities lead direct-ly on to sidewalk facilities, and off street paths/trails that lack an adjacent, separate sidewalk were ommitted when calculat-ing sidewalk riding percentage.

Bike Facility Number ofObservations

% of BicyclistsRiding on Sidewalks

Rideable Shoulder n=20 43%

No Bicycle Facility n=141 30%

Enhanced Shared Lane n=8 11%

Bicycle Lane n=80 9%

Bicycle Boulevard n=18 8%

Off Street Path n=24 1%

Table 1 - Percentage of Bicyclists Riding on Sidewalks by Bicycle Facilty Type

Figure 2 - Bicycle Traffic at 5 Select Locations, 2007 - 2016*(Location totals reflect tabulated 2-hour peak counts)

32% increase in bicycling between 2007 and 2016

0  

100  

200  

300  

400  

500  

600  

700  

800  

900  

2007   2008   2009   2010   2011   2012   2013   2014   2015   2016  

Summit  Ave  east  of  Western  

University  Ave  west  of  Prior  

Como  Ave  west  of  Raymond  

Ford  Pkwy  Bridge  

Marshall  Ave  Bridge  

Summit Ave east of Western

University Ave west of Prior

Como Ave west of Raymond

Ford Pkwy Bridge

Marshall Ave Bridge

Obse

rved

4-6

PM

Bic

ycle

Tra

ffic

Figure 1 - Observed Bicycle and Pedestrian Traffic at Benchmark Locations, 2013 - 2016(Location totals reflect tabulated 2-hour peak counts)

2000

2200

2400

2600

2800

2016201520142013

Obse

rved

4-6

PM

Bic

ycle

Tra

ffic

Bicycle Traffic increased 2% from 2013 to 2016

Pedestrian Traffic increased 10% from 2013 to 2016

Year

Bicycle

Traffic

Pedestrian Tra

ffic

*(Locations recording the longest range of standardized annual count data in Saint Paul)

2015 - 2016 City of Saint Paul Bicycle and Pedestrian Count Report | 2

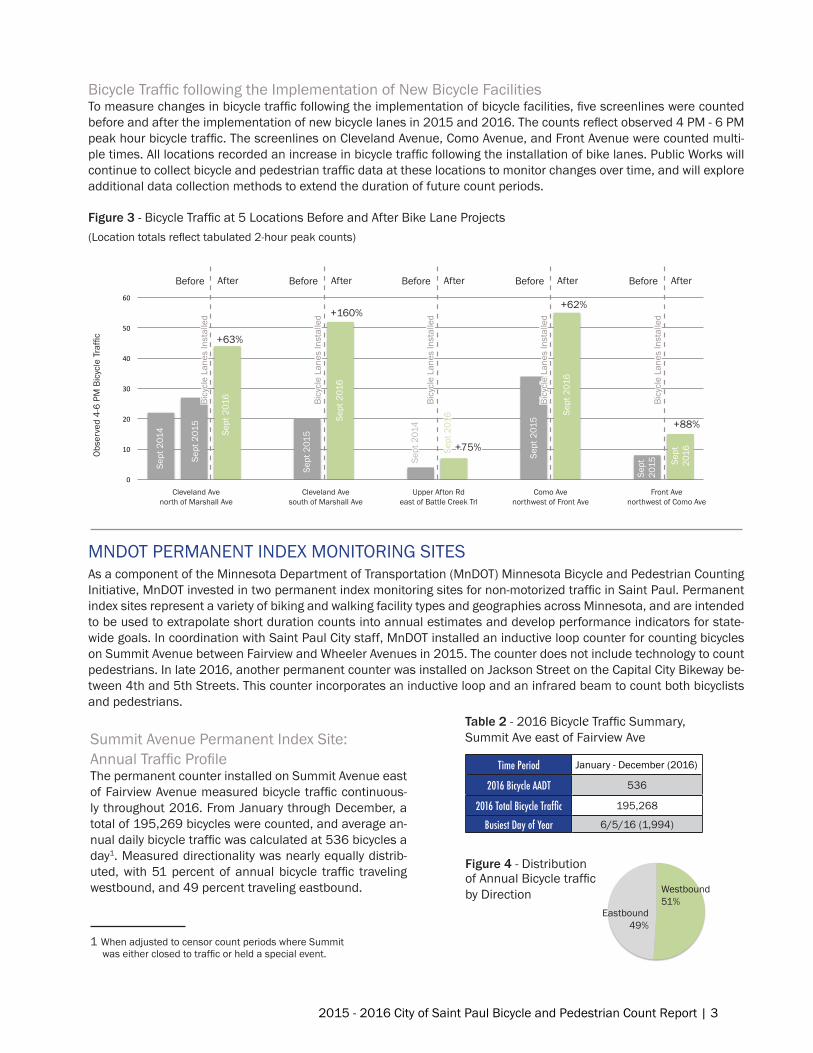
Bicycle Traffic following the Implementation of New Bicycle FacilitiesTo measure changes in bicycle traffic following the implementation of bicycle facilities, five screenlines were counted before and after the implementation of new bicycle lanes in 2015 and 2016. The counts reflect observed 4 PM - 6 PM peak hour bicycle traffic. The screenlines on Cleveland Avenue, Como Avenue, and Front Avenue were counted multi-ple times. All locations recorded an increase in bicycle traffic following the installation of bike lanes. Public Works will continue to collect bicycle and pedestrian traffic data at these locations to monitor changes over time, and will explore additional data collection methods to extend the duration of future count periods.

Figure 3 - Bicycle Traffic at 5 Locations Before and After Bike Lane Projects(Location totals reflect tabulated 2-hour peak counts)

0  

10  

20  

30  

40  

50  

60  

Cleveland  Ave  north  of  Marshall  Ave  Cleveland  Ave  south  of  Marshall  Ave  Upper  A;on  Rd  east  of  Ba>le  Creek  Trl  

Como  Ave  northwest  of  Front  Ave   Front  Ave  west  of  Como  Ave  

Chart  Title  

2014   2015   2016  

After

Sept

201

4

Sept

201

5

Sept

201

6

AfterBefore

Bicy

cle

Lane

s In

stal

led

AfterBefore

Bicy

cle

Lane

s In

stal

led

AfterBefore

Bicy

cle

Lane

s In

stal

led

AfterBefore

Bicy

cle

Lane

s In

stal

led

Sept

201

6

Sept

201

6

Sept

20

16

Sept

201

5

Sept

201

5

Sept

201

5

Sept

201

6

Sept

201

4

Before

Bicy

cle

Lane

s In

stal

led

Cleveland Avenorth of Marshall Ave

Cleveland Ave south of Marshall Ave

Upper Afton Rd east of Battle Creek Trl

Como Avenorthwest of Front Ave

Front Avenorthwest of Como Ave

Obse

rved

4-6

PM

Bic

ycle

Tra

ffic +63%

+160%

+75%

+62%

+88%

MNDOT PERMANENT INDEX MONITORING SITESAs a component of the Minnesota Department of Transportation (MnDOT) Minnesota Bicycle and Pedestrian Counting Initiative, MnDOT invested in two permanent index monitoring sites for non-motorized traffic in Saint Paul. Permanent index sites represent a variety of biking and walking facility types and geographies across Minnesota, and are intended to be used to extrapolate short duration counts into annual estimates and develop performance indicators for state-wide goals. In coordination with Saint Paul City staff, MnDOT installed an inductive loop counter for counting bicycles on Summit Avenue between Fairview and Wheeler Avenues in 2015. The counter does not include technology to count pedestrians. In late 2016, another permanent counter was installed on Jackson Street on the Capital City Bikeway be-tween 4th and 5th Streets. This counter incorporates an inductive loop and an infrared beam to count both bicyclists and pedestrians.

Table 2 - 2016 Bicycle Traffic Summary,Summit Ave east of Fairview Ave

Time Period January - December (2016)

2016 Bicycle AADT 536

2016 Total Bicycle Traffic 195,268

Busiest Day of Year 6/5/16 (1,994)

Summit Avenue Permanent Index Site: Annual Traffic ProfileThe permanent counter installed on Summit Avenue east of Fairview Avenue measured bicycle traffic continuous-ly throughout 2016. From January through December, a total of 195,269 bicycles were counted, and average an-nual daily bicycle traffic was calculated at 536 bicycles a day1. Measured directionality was nearly equally distrib-uted, with 51 percent of annual bicycle traffic traveling westbound, and 49 percent traveling eastbound.

1 When adjusted to censor count periods where Summit was either closed to traffic or held a special event.

Wesbound     Eastbound  

Westbound51%

Eastbound49%

Figure 4 - Distribution of Annual Bicycle traffic by Direction

2015 - 2016 City of Saint Paul Bicycle and Pedestrian Count Report | 3

Month Monthly Bicycle ADT

Monthly Bicycle Traffic

Busiest Day of Month

January 69 2,160 1/31 (142)February 119 3,434 2/27 (814)March 341 10,589 3/12 (1,223)April 537 16,087 4/17 (1,315)May 814 25,224 5/30 (1,479)June 996 29,901 6/5 (1,994)July 942 29,189 7/9 (1,439)August 857 26,565 8/21 (1,265)September 730 21,151 9/18 (1,129)October 548 17,003 10/2 (1,007)November 384 11,536 11/5 (974)December 79 2,430 12/1 (228)

Table 3 - 2016 Monthly Bicycle Traffic, Summit Ave east of Fairview Ave

Monthly Traffic ProfileTable 3 details the distribution of recorded bicycle traffic by month. The bicycle traffic recorded is char-acterized by seasonality, with 76 percent of all bicycle traffic measured between May and October. Figure 5 depicts the distribution of bicycle traffic throughout the year, with seasonality clearly identifiable as bicycle traffic peaked in the summer months, and trailed off substantially as temperatures decreased into the fall and winter.

0  

2  

4  

6  

8  

10  

12  

14  

16  

18  

20  

Monday   Tuesday   Wednesday   Thursday   Friday   Saturday   Sunday  

Percentage  of  Bicycle  Traffic  

Percentage  of  Bicycle  Traffic  

Mon

day

Tues

day

Wed

nesd

ay

Thur

sday

Frid

ay

Satu

rday

Sund

ay

14.5% 13.8% 13.2% 13.3% 12.5%

15.2%

17.5%

Figure 6 - Average Annual Distribution of Bicycle Traffic by Day,Summit Ave east of Fairview Ave

Daily Traffic ProfileThe distribution of annual bicycle traffic by day of week is illustrated in Figure 6. Sunday was the busiest day of the week for bicycle traffic, record-ing 17.5 percent of annual traffic volumes. Satur-day was the second busiest day of the week, with 15.2 percent of annual traffic volumes. Overall, 67 percent of total annual bicycle traffic measured on Summit Avenue occurred during weekdays, and 33 percent occurred during the weekend.

Figure 5 - Monthly Bicycle Traffic and Average High Temperature, Summit Ave east of Fairview Ave

Perc

ent o

f Ann

ual B

icyc

le T

raffi

c

Day of Week

Month

Aver

age

Mon

thly

Hig

h Te

mpe

ratu

re(D

egre

es F

)

Mon

thly

Bic

ycle

Tra

ffic

Monthly Total Bicycle Traffic

Average Monthly High Temperature

2015 - 2016 City of Saint Paul Bicycle and Pedestrian Count Report | 4

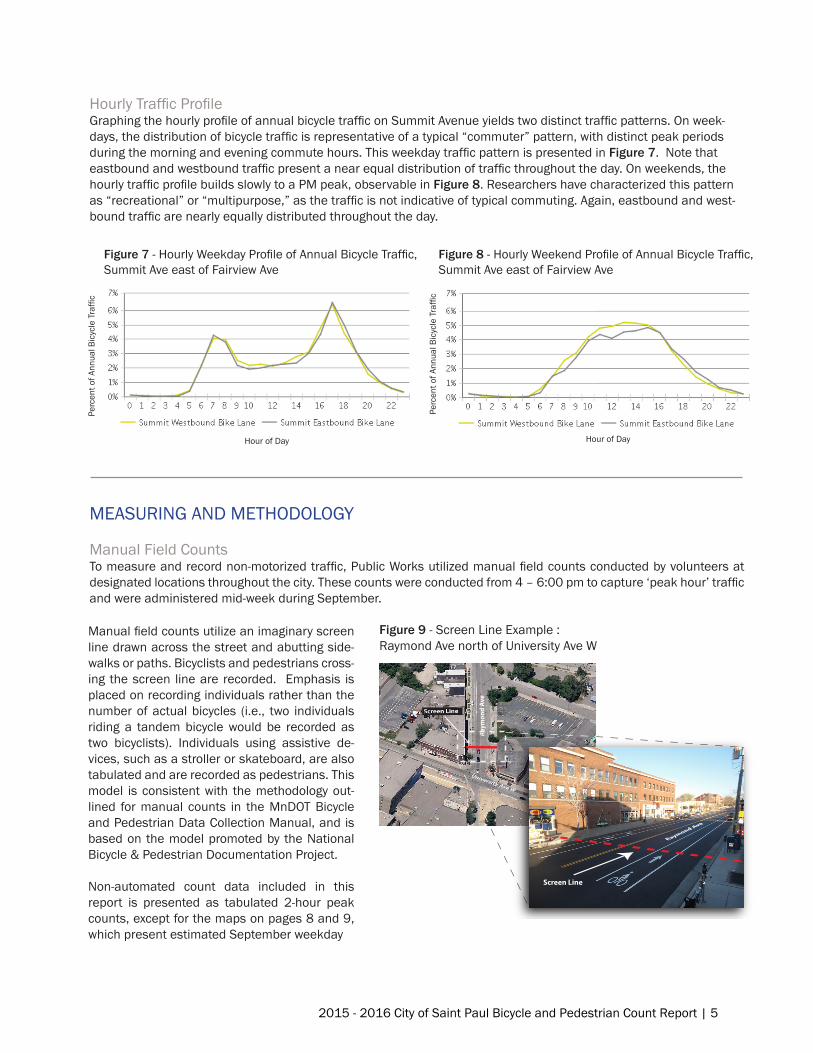
Hourly Traffic ProfileGraphing the hourly profile of annual bicycle traffic on Summit Avenue yields two distinct traffic patterns. On week-days, the distribution of bicycle traffic is representative of a typical “commuter” pattern, with distinct peak periods during the morning and evening commute hours. This weekday traffic pattern is presented in Figure 7. Note that eastbound and westbound traffic present a near equal distribution of traffic throughout the day. On weekends, the hourly traffic profile builds slowly to a PM peak, observable in Figure 8. Researchers have characterized this pattern as “recreational” or “multipurpose,” as the traffic is not indicative of typical commuting. Again, eastbound and west-bound traffic are nearly equally distributed throughout the day.

Figure 8 - Hourly Weekend Profile of Annual Bicycle Traffic,Summit Ave east of Fairview Ave

Perc

ent o

f Ann

ual B

icyc

le T

raffi

cHour of Day

Figure 7 - Hourly Weekday Profile of Annual Bicycle Traffic,Summit Ave east of Fairview Ave

Perc

ent o

f Ann

ual B

icyc

le T

raffi

c

Hour of Day

MEASURING AND METHODOLOGY

Manual Field CountsTo measure and record non-motorized traffic, Public Works utilized manual field counts conducted by volunteers at designated locations throughout the city. These counts were conducted from 4 – 6:00 pm to capture ‘peak hour’ traffic and were administered mid-week during September.

Figure 9 - Screen Line Example :Raymond Ave north of University Ave W

Screen Line

Manual field counts utilize an imaginary screen line drawn across the street and abutting side-walks or paths. Bicyclists and pedestrians cross-ing the screen line are recorded. Emphasis is placed on recording individuals rather than the number of actual bicycles (i.e., two individuals riding a tandem bicycle would be recorded as two bicyclists). Individuals using assistive de-vices, such as a stroller or skateboard, are also tabulated and are recorded as pedestrians. This model is consistent with the methodology out-lined for manual counts in the MnDOT Bicycle and Pedestrian Data Collection Manual, and is based on the model promoted by the National Bicycle & Pedestrian Documentation Project.

Non-automated count data included in this report is presented as tabulated 2-hour peak counts, except for the maps on pages 8 and 9, which present estimated September weekday

2015 - 2016 City of Saint Paul Bicycle and Pedestrian Count Report | 5

bicycle and pedestrian traffic. To develop these figures, a simple adjustment model was applied to extrapolate the 2-hour count data collected to an estimated September weekday daily bicycle and pedestrian traffic figure. This extrap-olation model makes the following assumptions: 1.) That 22 percent of daily weekday September bicycle traffic occurs between 4 PM and 6 PM, and 2.) That 18 percent of daily weekday September pedestrian traffic occurs between 4 PM and 6 PM. These traffic assumptions were derived from reviewing data from automated bicycle and pedestrian counters (permanent inductive loop and infrared counters) and 48-hour video counts conducted by Public Works in 2015 and 2016.

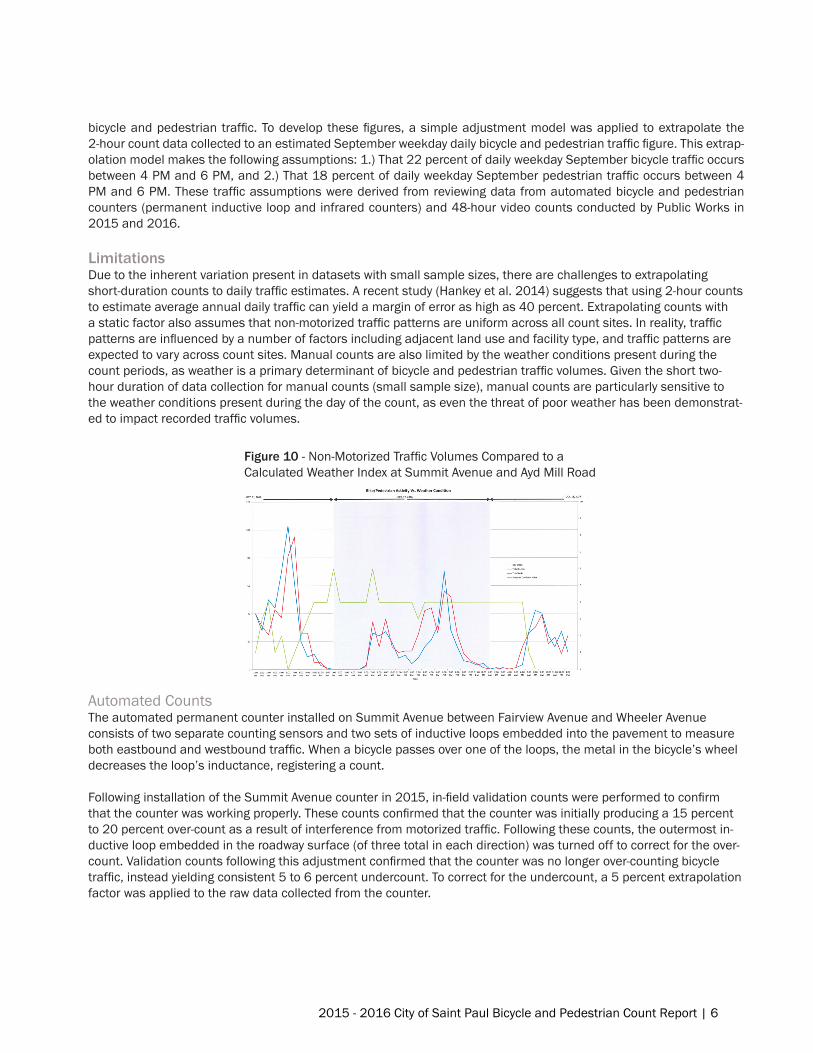
LimitationsDue to the inherent variation present in datasets with small sample sizes, there are challenges to extrapolating short-duration counts to daily traffic estimates. A recent study (Hankey et al. 2014) suggests that using 2-hour counts to estimate average annual daily traffic can yield a margin of error as high as 40 percent. Extrapolating counts with a static factor also assumes that non-motorized traffic patterns are uniform across all count sites. In reality, traffic patterns are influenced by a number of factors including adjacent land use and facility type, and traffic patterns are expected to vary across count sites. Manual counts are also limited by the weather conditions present during the count periods, as weather is a primary determinant of bicycle and pedestrian traffic volumes. Given the short two-hour duration of data collection for manual counts (small sample size), manual counts are particularly sensitive to the weather conditions present during the day of the count, as even the threat of poor weather has been demonstrat-ed to impact recorded traffic volumes.

Figure 10 - Non-Motorized Traffic Volumes Compared to a Calculated Weather Index at Summit Avenue and Ayd Mill Road

Automated CountsThe automated permanent counter installed on Summit Avenue between Fairview Avenue and Wheeler Avenue consists of two separate counting sensors and two sets of inductive loops embedded into the pavement to measure both eastbound and westbound traffic. When a bicycle passes over one of the loops, the metal in the bicycle’s wheel decreases the loop’s inductance, registering a count.

Following installation of the Summit Avenue counter in 2015, in-field validation counts were performed to confirm that the counter was working properly. These counts confirmed that the counter was initially producing a 15 percent to 20 percent over-count as a result of interference from motorized traffic. Following these counts, the outermost in-ductive loop embedded in the roadway surface (of three total in each direction) was turned off to correct for the over-count. Validation counts following this adjustment confirmed that the counter was no longer over-counting bicycle traffic, instead yielding consistent 5 to 6 percent undercount. To correct for the undercount, a 5 percent extrapolation factor was applied to the raw data collected from the counter.

2015 - 2016 City of Saint Paul Bicycle and Pedestrian Count Report | 6

With the raw data adjusted, a visual analysis of the full 2016 count dataset was performed to identify invalid counts. No invalid counts resulting from counter malfunction were identified, though outliers reflecting high traffic values were identified. The dates of the outliers were recorded and compared against events or street closures scheduled for Summit Avenue in 2016. Approximately 48 hours of count data were removed to censor periods where Summit was either closed to traffic or held a special event.

Count LocationsPublic Works identified count locations representing a diversity of walking and bicycling environments throughout Saint Paul. With the aim of better understanding where and how bicyclists and pedestrians travel throughout the city, care was taken to select locations near existing and planned bicycle and pedestrian infrastructure to measure utilization and guide future non-motorized infrastructure investments.

Volunteers counted non-motorized traffic across 95 screenlines in 2016. In most cases, volunteers were asked to collect data at locations identified by Public Works. However, effort was taken to accommodate volunteers who were limited to locations near their work or homes, resulting in geographic disparity in the locations counted.

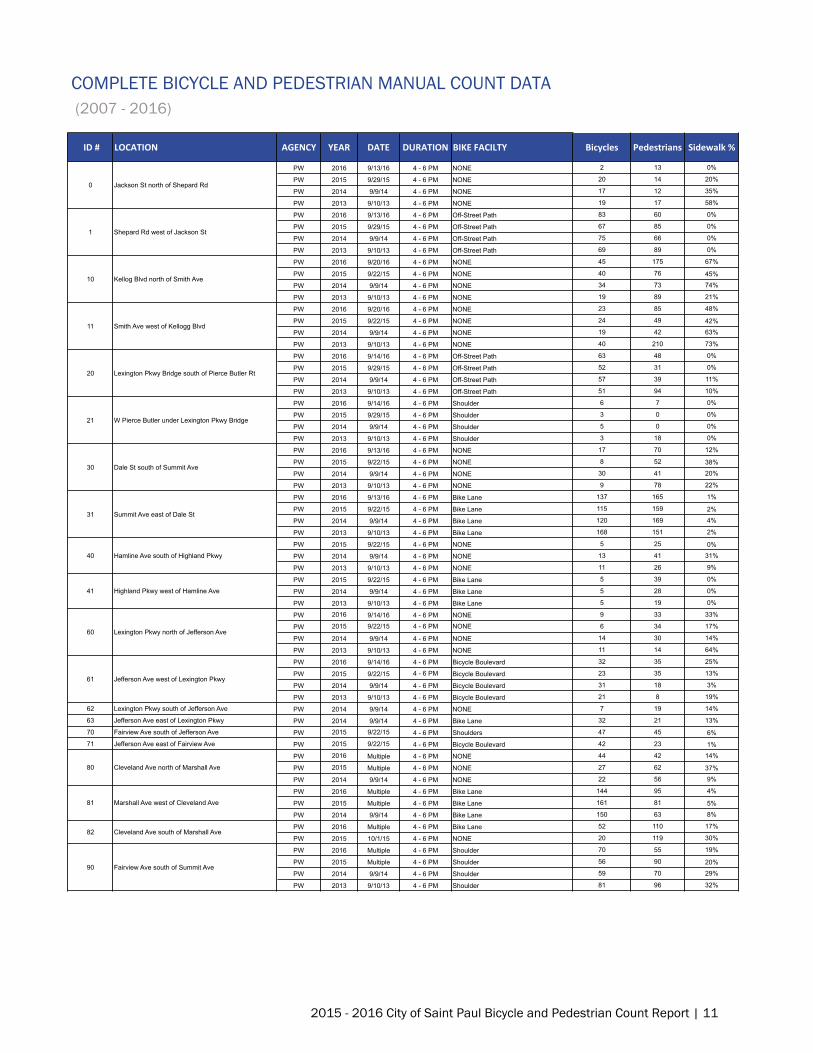
Also reflected in this report are bicycle and pedestrian counts performed by the Minneapolis Public Works Depart-ment (MPW), the Mississippi National River and Recreational Area (MNRRA), and Transit for Livable Communities (TLC). From 2007 to 2013, TLC has conducted annual bicycle and pedestrian counts throughout the Twin Cities, including six locations in Saint Paul. TLC counts were conducted as part of the Bike Walk Twin Cities federal Nonmo-torized Transportation Pilot Program. The data from these counts are included in the ‘Complete Bicycle and Pedestri-an Count Data’ section of this report.

Figure 11 - Summit Avenue Counter Site Plan

2015 - 2016 City of Saint Paul Bicycle and Pedestrian Count Report | 7

7th St

3rd St

Dal

e St

Shepard Rd

Snel

ling

Ave

McK

nigh

t Rd

Rice

St

University Ave

Selby Ave

St Clair Ave

Grand Ave

Summit Ave

Earl

St

Fair

view

Ave

Marshall Ave

Lapenteur Ave

Clev

elan

d A

ve Ham

line

Ave

Robe

rt S

t

Jefferson Ave

Wheelock Pkwy

Thomas Ave

Randolph Ave

Cret

in A

ve

Como Ave

Arlington Ave

6th St

Payn

e A

ve

Miss River Blvd

Arc

ade

St

Phalen Blvd

Minnehaha Ave

Warner Rd

Ruth

St

Vict

oria

St

Front Ave

Water St

Lexi

ngto

n Pk

wy

Energy Park Dr

Edgcumbe Rd

Jack

son

St

Case Ave

Maryland Ave

Pierce Butler Rt

Edge

rton

St

Highland Pkwy

Prio

r Ave

Wes

tern

Ave

Ford Pkwy

Burns Ave

Kellogg Blvd

Smith

Ave

Montreal Ave

John

son

Pkw

y

Ivy Ave

Ayd Mill Rd

George St

Wabasha St

Whi

te B

ear A

ve

Plato Blvd

Annapolis St

St. Paul Ave

Old Hudson Rd

12th St

Mounds Blvd

Fillmore Ave

5th St

Wes

tmin

ster

St

Hudson Rd

Pelh

am B

lvd

Raymond A

ve

East Shore Dr

Ohio St

Ames Pl

Concord St

Upper Afton Rd

Stry

ker A

ve

Lower Afton Rd

Tran

sfer

Rd

Burlington Rd

Horton Ave

Midway Pkwy

Dav

ern

St

Battle Creek Rd

Cesar Chavez St

Engl

ish

St

Maria Ave

Stillwater Ave

Park

way D

r

Mis

siss

ippi

St

Win

thro

p St

Pennsylvania Ave

Como Lake Blvd

Otto Ave

Edge

wat

er B

lvd

Lafayette Rd

Mar

ion

St

Pros

perit

y Av

e

Gateway Dr

Sycamore St

Vand

alia

Ave

Haz

elw

ood

St

Carver Ave

Constitutio

n Ave

Tedesco St

Birm

ingh

am S

t

7th St

Ruth

St

Grand Ave

Minnehaha Ave

Maryland Ave

6th St

Haz

elw

ood

St

5(2015)

9(2016) 5

(2015)

9(2016)

41(2016)

36(2016)

90(2016)

68(2016)

63(2016)

68(2016)

81(2016)

68(2016)

27(2015)

23(2015)

95(2016)

18(2014)

63(2014)

90(2016)

32(2016)

18(2015)

86(2014)

59(2014)

32(2016)

59(2016)

32(2013)

32(2016)

36(2016)

59(2014)

32(2014)

36(2016) 14

(2016)

63(2016)

23(2013)

27(2013)

41(2016)

32(2016)

59(2016)

50(2015)

72(2016)

54(2016)

23(2016)

36(2016)

63(2014)

18(2014)

59(2016)

41(2016)

45(2015)

72(2014)

95(2014)

81(2016)

86(2015)

72(2016) 81

(2016)

32(2016)

90(2014)

63(2015)

90(2015)

27(2016)

77(2016)

81(2016)

41(2016)

63(2016)

45(2016)

63(2016)

68(2016)

41(2016)95

(2016)

32(2014)

41(2016)

23(2015) 23

(2015)

77(2016)

27(2016)

176(2014)

243(2016)

315(2016)

495(2016)

198(2016)

194(2016)

158(2016)

275(2013)

158(2016)

293(2016)869

(2016)

248(2016)

635(2016) 261

(2016)

518(2016)

351(2016)

108(2015)

122(2015)

108(2014)

185(2014)

113(2014)

149(2013)

108(2016)

338(2016)

833(2016)

189(2016)

171(2016)

815(2016)

144(2016)

162(2016)

126(2016)

239(2014)

167(2015)

369(2015)

261(2016)

216(2016)

279(2016)

225(2016)

441(2016)

518(2016)

311(2014)

212(2016)

212(2016)

113(2014)

162(2014)

315(2016)

234(2016)

648(2016)

198(2016)

189(2015)

212(2015)

144(2014)

144(2016)

617(2016)

284(2016)

104(2016)

203(2016)

374(2016)

1967(2016)

1107(2016)

99(2015)

248(2016)

\\ATLANTIS\STP-PWUSERS\Administration\hansonlu\Desktop\Bike & Ped Counts\2016 Counts\2016CountMapJulyBIKE.mxd

0 1 20.5Miles

IKE_EDT0 - 99

100 - 249

250 - 499

500 - 999

1000 - 19

major str

Existing-

7th St

3rd St

Dal

e St

Shepard Rd

Snel

ling

Ave

McK

nigh

t Rd

Rice

St

University Ave

Selby Ave

St Clair Ave

Grand Ave

Summit Ave

Earl

St

Fair

view

Ave

Marshall Ave

Lapenteur Ave

Clev

elan

d A

ve Ham

line

Ave

Robe

rt S

t

Jefferson Ave

Wheelock Pkwy

Thomas Ave

Randolph Ave

Cret

in A

ve

Como Ave

Arlington Ave

6th St

Payn

e A

ve

Miss River Blvd

Arc

ade

St

Phalen Blvd

Minnehaha Ave

Warner Rd

Ruth

St

Vict

oria

St

Front Ave

Water St

Lexi

ngto

n Pk

wy

Energy Park Dr

Edgcumbe Rd

Jack

son

St

Case Ave

Maryland Ave

Pierce Butler Rt

Edge

rton

St

Highland Pkwy

Prio

r Ave

Wes

tern

Ave

Ford Pkwy

Burns Ave

Kellogg Blvd

Smith

Ave

Montreal Ave

John

son

Pkw

y

Ivy Ave

Ayd Mill Rd

George St

Wabasha St

Wh

ite B

ear A

ve

Plato Blvd

Annapolis St

St. Paul Ave

Old Hudson Rd

12th St

Mounds Blvd

Fillmore Ave5th St

Wes

tmin

ster

St

Hudson Rd

Pelh

am B

lvd

East Shore Dr

Cedar St

Ohio St

Ames Pl

Concord St

Upper Afton Rd

Stry

ker A

ve

Lower Afton Rd

Tran

sfer

Rd

Burlington Rd

Horton Ave

Midway Pkwy

Dav

ern

St

Battle Creek Rd

Cesar Chavez St

Engl

ish

St

Maria Ave

Stillwater Ave

Parkw

ay Dr

Mis

siss

ippi

St

Win

thro

p St

Pennsylvania Ave

Otto Ave

Edge

wat

er B

lvd

Lafayette Rd

Mar

ion

St

Pros

perit

y Av

e

Sycamore St

Vand

alia

Ave

Haz

elw

ood

St

Carver Ave

Constitutio

n Ave

Tedesco St

Birm

ingh

am S

t

7th St

Ruth

St

Minnehaha Ave

Maryland Ave

Haz

elw

ood

St

\\ATLANTIS\STP-PWUSERS\Administration\hansonlu\Desktop\Bike & Ped Counts\2016 Counts\2016CountMapJulyBIKEProportional2.mxd

0 1 20.5Miles

LegendAll Count LocationsBIKE_EDT

0 - 99

100 - 249

250 - 499

500 - 999

1000 - 1967

Estimated September Weekday Bicycle Traffic

Estimated September Weekday Bicycle Traffic(Generalized for Digital Interpretation)

Legend

5 - 99

100 - 249

250 - 499

500 - 999

1000 +

Street with a bicycle facility oroff-street trail

Street with no bicycle facilites

Estimated daily bicycle traffic per September weekday

Legend

0 - 99

100 - 249

250 - 499

500 - 999

1000 +

Street with a bicycle facility oroff-street trail

Street with no bicycle facilites

Estimated bicycle traffic per September weekday

2015 - 2016 City of Saint Paul Bicycle and Pedestrian Count Report | 8

7th St

3rd St

Dal

e St

Shepard Rd

Snel

ling

Ave

McK

nigh

t Rd

Rice

St

University Ave

Selby Ave

St Clair Ave

Grand Ave

Summit Ave

Earl

St

Fair

view

Ave

Marshall Ave

Lapenteur Ave

Clev

elan

d A

ve Ham

line

Ave

Robe

rt S

t

Jefferson Ave

Wheelock Pkwy

Thomas Ave

Randolph Ave

Cret

in A

ve

Como Ave

Arlington Ave

6th St

Payn

e A

ve

Miss River Blvd

Arc

ade

St

Phalen Blvd

Minnehaha Ave

Warner Rd

Ruth

St

Vict

oria

St

Front Ave

Water St

Lexi

ngto

n Pk

wy

Energy Park Dr

Edgcumbe Rd

Jack

son

St

Case Ave

Maryland Ave

Pierce Butler Rt

Edge

rton

St

Highland Pkwy

Prio

r Ave

Wes

tern

Ave

Ford Pkwy

Burns Ave

Kellogg Blvd

Smith

Ave

Montreal Ave

John

son

Pkw

y

Ivy Ave

Ayd Mill Rd

George St

Wabasha St

Whi

te B

ear A

ve

Plato Blvd

Annapolis St

St. Paul Ave

Old Hudson Rd

12th St

Mounds Blvd

Fillmore Ave

5th St

Wes

tmin

ster

St

Hudson Rd

Pelh

am B

lvd

Raymond A

ve

East Shore Dr

Ohio St

Ames Pl

Concord St

Upper Afton Rd

Stry

ker A

ve

Lower Afton Rd

Tran

sfer

Rd

Burlington Rd

Horton Ave

Midway Pkwy

Dav

ern

St

Battle Creek Rd

Cesar Chavez St

Engl

ish

St

Maria Ave

Stillwater Ave

Park

way D

r

Mis

siss

ippi

St

Win

thro

p St

Pennsylvania Ave

Como Lake Blvd

Otto Ave

Edge

wat

er B

lvd

Lafayette Rd

Mar

ion

St

Pros

perit

y Av

e

Gateway Dr

Sycamore St

Vand

alia

Ave

Haz

elw

ood

St

Carver Ave

Constitutio

n Ave

Tedesco St

Birm

ingh

am S

t

7th St

Ruth

St

Grand Ave

Minnehaha Ave

Maryland Ave

6th St

Haz

elw

ood

St

0(2016)

6(2015)

99(2014)

28(2013)

55(2016)

50(2015)

61(2014)

11(2015)

33(2015)

83(2016)

39(2013)

83(2016)

61(2016)

61(2013)

83(2016)

55(2016)

55(2016)

61(2016)

77(2016)

88(2016)

22(2015)

33(2016)

50(2015)

77(2016)

66(2014)

99(2015)

88(2015)

83(2016)

61(2016)

83(2016)

11(2014)

55(2014)

39(2016)

72(2016)

209(2016)

193(2016)

138(2016)

770(2016)

440(2016)

281(2016)

303(2016)

286(2016)

402(2016)

160(2016)

132(2016)374

(2016)

655(2016)

105(2016)

391(2016)

341(2016)

336(2016)

363(2016)

308(2015)

275(2016) 270

(2016)

253(2016)

490(2016)

220(2016)

968(2015)

110(2014)

743(2016)

303(2014)

105(2014)

248(2014)

127(2014)

418(2014)

110(2016)

204(2013)

242(2016)

803(2016)

198(2014)

160(2014)

121(2016) 380

(2016)

193(2016)

341(2013)

264(2016)

127(2016)

160(2016)

149(2016)

242(2014)

121(2014)

143(2016)

220(2016)

506(2016)

171(2014)

149(2014)

132(2016)

116(2015)

182(2016)

204(2016)

154(2016)

275(2014)

121(2015)

127(2016)

165(2016)

655(2016)

209(2016)

336(2016)

105(2016)

132(2016)

182(2016)

149(2016)

314(2016)

402(2016)

380(2014)

270(2016)

116(2016)182

(2016)

880(2016)

303(2016)

605(2016)

523(2016)

231(2016)

127(2015)

248(2015)

116(2014)

105(2014)

193(2016)

215(2015)

138(2015)

908(2016)

385(2016)

264(2016)

468(2016)

963(2016)

330(2016)

1342(2016)

1183(2016)

1254(2015)

1997(2016)

325(2016)

182(2016)

2926(2015)

1480(2015)

\\ATLANTIS\STP-PWUSERS\Administration\hansonlu\Desktop\Bike & Ped Counts\2016 Counts\2016CountMapJulyBIKE.mxd

0 1 20.5Miles

PED_EDT0 - 99

100 - 249

250 - 499

500 - 999

1000 - 29

major str

7th St

3rd St

Dal

e St

Shepard Rd

Snel

ling

Ave

McK

nigh

t Rd

Rice

St

University Ave

Selby Ave

St Clair Ave

Grand Ave

Summit Ave

Earl

St

Fair

view

Ave

Marshall Ave

Lapenteur Ave

Clev

elan

d A

ve

Ham

line

Ave

Robe

rt S

t

Jefferson Ave

Wheelock Pkwy

Thomas Ave

Randolph Ave

Cret

in A

ve

Como Ave

Arlington Ave

6th St

Payn

e A

ve

Miss River Blvd

Arc

ade

St

Phalen Blvd

Minnehaha Ave

Warner Rd

Ruth

St

Vict

oria

St

Front Ave

Water St

Lexi

ngto

n Pk

wy

Energy Park Dr

Edgcumbe Rd

Jack

son

St

Case Ave

Maryland Ave

Pierce Butler Rt

Edge

rton

St

Highland Pkwy

Prio

r Ave

Wes

tern

Ave

Ford Pkwy

Burns Ave

Smith

Ave

Montreal Ave

John

son

Pkw

y

Ivy Ave

Ayd Mill Rd

George St

Wabasha St

Wh

ite B

ear A

ve

Plato Blvd

Annapolis St

St. Paul Ave

Old Hudson Rd

12th St

Mounds Blvd

Fillmore Ave

5th St

Wes

tmin

ster

St

Hudson Rd

Pelh

am B

lvd

East Shore Dr

Ohio St

Ames Pl

Concord St

Upper Afton Rd

Stry

ker A

ve

Lower Afton Rd

Tran

sfer

Rd

Burlington Rd

St. Peter St

Horton Ave

Clar

ence

StMidway Pkwy

Dav

ern

St

Battle Creek Rd

Cesar Chavez St

Engl

ish

St

Maria Ave

Stillwater Ave

Parkw

ay Dr

Mis

siss

ippi

St

Win

thro

p St

Otto Ave

Edge

wat

er B

lvd

Lafayette

Rd

Mar

ion

St

Pros

perit

y Av

e

Sycamore St

Vand

alia

Ave

Haz

elw

ood

St

Carver Ave

Birm

ingh

am S

t

7th St

Ruth

St

Minnehaha Ave

Maryland Ave

Haz

elw

ood

St

\\ATLANTIS\STP-PWUSERS\Administration\hansonlu\Desktop\Bike & Ped Counts\2016 Counts\2016CountMapJulyBIKEProportional2.mxd

0 1 20.5Miles

LegendAll Count LocationsPED_EDT

0 - 99

100 - 249

250 - 499

500 - 999

1000 - 2926

Estimated September Weekday Pedestrian Traffic

Estimated September Weekday Pedestrian Traffic(Generalized for Digital Interpretation)

Legend

0 - 99

100 - 249

250 - 499

500 - 999

1000 +

Estimated daily pedestrian traffic per September weekday

Legend

0 - 99

100 - 249

250 - 499

500 - 999

1000 +

Estimated daily pedestrian traffic per September weekday

2015 - 2016 City of Saint Paul Bicycle and Pedestrian Count Report | 9

CHANGE IN TRAFFIC AT ANNUAL BENCHMARK LOCATIONS

Change in Bicycle Traffic at 30 Benchmark Locations (2013 - 2016)

Change in Pedestrian Traffic at 25 Benchmark Locations (2013 - 2016)

*An imputed average was calculated for these locations as a result of roadway construction or street closures during the counting period

*An imputed average was calculated for these locations as a result of roadway construction or street closures during the counting period

Bikes

ID# LOCATION 2013 2014 2015 2016 2013  -­‐  2016  Change  (%)

2015  -­‐  2016  Change  (%)

1 Shepard  Rd  west  of  Jackson  St 69 75 67 83 20% 24%10 Kellog  Blvd  north  of  Smith  Ave 19 34 40 45 137% 13%20 Lexington  Pkwy  Bridge  south  of  Pierce  Butler  Rt 51 57 52 63 24% 21%31 Summit  Ave  east  of  Dale  St 168 120 115 137 -­‐18% 19%61 Jefferson  Ave  west  of  Lexington  Pkwy 21 31 23 32 52% 39%81 Marshall  Ave  west  of  Cleveland  Ave 153* 150 161 144 -­‐6% -­‐11%90 Fairview  Ave  south  of  Summit  Ave 81 59 56 70 -­‐14% 25%91 Summit  Ave  east  of  Fairview  Ave 268 232 212 246 -­‐8% 16%150 Smith  Ave  Bridge  north  of  Cherokee  Ave 37 24 25 50 35% 100%160 Shepard  Rd  /  Sam  Morgan  Trl  north  of  Otto  Ave 61* 45 74 62 2% -­‐16%190 Park  St  north  of  University  Ave 57 50 47* 48 -­‐16% 2%201 Charles  Ave  west  of  Dale  St 6 30 20 17 183% -­‐15%211 Como  Ave  east  of  Galtier  St 69 65 51 58 -­‐16% 14%251 Phalen  Blvd  east  of  Payne  Ave 24 21 31 18 -­‐25% -­‐42%280 Wabasha  St  north  of  Fillmore  Ave 55 37 39* 36 -­‐35% -­‐7%291 Cesar  Chavez  st  west  of  Robert  St 16 11 9 13 -­‐19% 44%320 Johnson  Pkwy  north  of  Margaret  St 2 23 13 32 1500% 146%321 Margaret  St  east  of  Johnson  Pkwy 22 10 8 12 -­‐45% 50%330 Mississippi  River  Blvd  south  of  Jefferson  Ave 132 217 181 181 37% 0%350 Griggs  St  Bridge  north  of  Concordia  Ave 40 33* 18 38 -­‐5% 111%360 Energy  Park  Dr  south  of  U  of  M  Transitway 110 79 57 42 -­‐62% -­‐26%361 U  of  M  Transitway  west  of  Energy  Park  Dr 225 192 208 185 -­‐18% -­‐11%390 Jackson  St  south  of  Mt  Airy  St 11 5 14 14 27% 0%420 Raymond  Ave  south  of  Territorial  Dr 50 59 52 75 50% 44%491 Kellogg  Blvd  east  of  Broadway  Ave 23* 33 16 20 -­‐14% 25%3201 Marshall  Ave  Bridge 330 347 281 437 32% 56%3401 Ford  Pkwy  Bridge 211 249 227 193 -­‐9% -­‐15%5351 Como  Ave  west  of  Raymond  Ave 53 47 27 45* -­‐15% 66%5361 University  Ave  west  of  Prior  Ave 49 45 32 43 -­‐12% 34%5890 Pelham  Blvd  north  of  Otis  Ave 50 50 44 70 40% 59%

Total 2463 2430 2200 2509 2% 14%

Peds

ID# LOCATION 2013 2014 2015 2016 2013  -­‐  2016  Change  (%)

2015  -­‐  2016  Change  (%)

1 Shepard  Rd  west  of  Jackson  St 89 66 85 60 -­‐33% -­‐29%10 Kellog  Blvd  north  of  Smith  Ave 89 73 76 175 97% 130%11 Smith  Ave  west  of  Kellogg  Blvd 210 42 49 85 -­‐60% 73%20 Lexington  Pkwy  Bridge  south  of  Pierce  Butler  Rt 94 39 31 48 -­‐49% 55%30 Dale  St  south  of  Summit  Ave 78 41 52 70 -­‐10% 35%31 Summit  Ave  east  of  Dale  St 151 169 159 165 9% 4%60 Lexington  Pkwy  north  of  Jefferson  Ave 14 30 34 33 136% -­‐3%90 Fairview  Ave  south  of  Summit  Ave 96 70 90 55 -­‐43% -­‐39%91 Summit  Ave  east  of  Fairview  Ave 214 160 168 160 -­‐25% -­‐5%130 Lexington  Pkwy  south  of  Como  Lake  Dr 296 280 295 363 23% 23%191 University  Ave  west  of  Park  St 25 68 48 38 52% -­‐21%200 Dale  St  north  of  Charles  Ave 78 129 126 119 53% -­‐6%250 Payne  Ave  south  of  Phalen  Blvd 15 19 32 28 87% -­‐13%280 Wabasha  St  north  of  Fillmore  Ave 88 103 92* 92 5% 0%290 Robert  St  north  of  Ceasr  Chavez  St 90 38 51 40 -­‐56% -­‐22%320 Johnson  Pkwy  north  of  Margaret  St 2 12 15 23 1050% 53%330 Mississippi  River  Blvd  south  of  Jefferson  Ave 154 199 212 215 40% 1%391 Mt  Airy  St  east  of  Jackson  St 6 45 49 69 1050% 41%420 Raymond  Ave  south  of  Territorial  Dr 75 75 84 146 95% 74%490 Broadway  Ave  north  of  Kellogg  Blvd 131* 121 138 135 3% -­‐2%491 Kellogg  Blvd  east  of  Broadway  Ave 168* 156 105 244 45% 132%3201 Marshall  Ave  Bridge 111 186 130 119 7% -­‐8%3401 Ford  Pkwy  Bridge 68 84 82 68 0% -­‐17%5351 Como  Ave  west  of  Raymond  Ave 50 57 82 56* 12% -­‐32%5361 University  Ave  west  of  Prior  Ave 26 42 39 55 112% 41%

Total 2418 2304 2324 2661 10% 14%

++

++

2015 - 2016 City of Saint Paul Bicycle and Pedestrian Count Report | 10

 ID  # LOCATION AGENCY YEAR DATE DURATION BIKE  FACILTY Bicycles Pedestrians Sidewalk  %

PW 2016 9/13/16 4 - 6 PM NONE 2 13 0%

PW 2015 9/29/15 4 - 6 PM NONE 20 14 20%

PW 2014 9/9/14 4 - 6 PM NONE 17 12 35%

PW 2013 9/10/13 4 - 6 PM NONE 19 17 58%

PW 2016 9/13/16 4 - 6 PM Off-Street Path 83 60 0%

PW 2015 9/29/15 4 - 6 PM Off-Street Path 67 85 0%

PW 2014 9/9/14 4 - 6 PM Off-Street Path 75 66 0%

PW 2013 9/10/13 4 - 6 PM Off-Street Path 69 89 0%

PW 2016 9/20/16 4 - 6 PM NONE 45 175 67%

PW 2015 9/22/15 4 - 6 PM NONE 40 76 45%

PW 2014 9/9/14 4 - 6 PM NONE 34 73 74%

PW 2013 9/10/13 4 - 6 PM NONE 19 89 21%

PW 2016 9/20/16 4 - 6 PM NONE 23 85 48%

PW 2015 9/22/15 4 - 6 PM NONE 24 49 42%

PW 2014 9/9/14 4 - 6 PM NONE 19 42 63%

PW 2013 9/10/13 4 - 6 PM NONE 40 210 73%

PW 2016 9/14/16 4 - 6 PM Off-Street Path 63 48 0%

PW 2015 9/29/15 4 - 6 PM Off-Street Path 52 31 0%

PW 2014 9/9/14 4 - 6 PM Off-Street Path 57 39 11%

PW 2013 9/10/13 4 - 6 PM Off-Street Path 51 94 10%

PW 2016 9/14/16 4 - 6 PM Shoulder 6 7 0%

PW 2015 9/29/15 4 - 6 PM Shoulder 3 0 0%

PW 2014 9/9/14 4 - 6 PM Shoulder 5 0 0%

PW 2013 9/10/13 4 - 6 PM Shoulder 3 18 0%

PW 2016 9/13/16 4 - 6 PM NONE 17 70 12%

PW 2015 9/22/15 4 - 6 PM NONE 8 52 38%

PW 2014 9/9/14 4 - 6 PM NONE 30 41 20%

PW 2013 9/10/13 4 - 6 PM NONE 9 78 22%

PW 2016 9/13/16 4 - 6 PM Bike Lane 137 165 1%

PW 2015 9/22/15 4 - 6 PM Bike Lane 115 159 2%

PW 2014 9/9/14 4 - 6 PM Bike Lane 120 169 4%

PW 2013 9/10/13 4 - 6 PM Bike Lane 168 151 2%

PW 2015 9/22/15 4 - 6 PM NONE 5 25 0%

PW 2014 9/9/14 4 - 6 PM NONE 13 41 31%

PW 2013 9/10/13 4 - 6 PM NONE 11 26 9%

PW 2015 9/22/15 4 - 6 PM Bike Lane 5 39 0%

PW 2014 9/9/14 4 - 6 PM Bike Lane 5 28 0%

PW 2013 9/10/13 4 - 6 PM Bike Lane 5 19 0%

PW 2016 9/14/16 4 - 6 PM NONE 9 33 33%

PW 2015 9/22/15 4 - 6 PM NONE 6 34 17%

PW 2014 9/9/14 4 - 6 PM NONE 14 30 14%

PW 2013 9/10/13 4 - 6 PM NONE 11 14 64%

PW 2016 9/14/16 4 - 6 PM Bicycle Boulevard 32 35 25%

PW 2015 9/22/15 4 - 6 PM Bicycle Boulevard 23 35 13%

PW 2014 9/9/14 4 - 6 PM Bicycle Boulevard 31 18 3%

PW 2013 9/10/13 4 - 6 PM Bicycle Boulevard 21 8 19%

62 Lexington Pkwy south of Jefferson Ave PW 2014 9/9/14 4 - 6 PM NONE 7 19 14%

63 Jefferson Ave east of Lexington Pkwy PW 2014 9/9/14 4 - 6 PM Bike Lane 32 21 13%

70 Fairview Ave south of Jefferson Ave PW 2015 9/22/15 4 - 6 PM Shoulders 47 45 6%

71 Jefferson Ave east of Fairview Ave PW 2015 9/22/15 4 - 6 PM Bicycle Boulevard 42 23 1%

PW 2016 Multiple 4 - 6 PM NONE 44 42 14%

PW 2015 Multiple 4 - 6 PM NONE 27 62 37%

PW 2014 9/9/14 4 - 6 PM NONE 22 56 9%

PW 2016 Multiple 4 - 6 PM Bike Lane 144 95 4%

PW 2015 Multiple 4 - 6 PM Bike Lane 161 81 5%

PW 2014 9/9/14 4 - 6 PM Bike Lane 150 63 8%

PW 2016 Multiple 4 - 6 PM Bike Lane 52 110 17%

PW 2015 10/1/15 4 - 6 PM NONE 20 119 30%

PW 2016 Multiple 4 - 6 PM Shoulder 70 55 19%

PW 2015 Multiple 4 - 6 PM Shoulder 56 90 20%

PW 2014 9/9/14 4 - 6 PM Shoulder 59 70 29%

PW 2013 9/10/13 4 - 6 PM Shoulder 81 96 32%

Highland Pkwy west of Hamline Ave

Cleveland Ave north of Marshall Ave

Marshall Ave west of Cleveland Ave

Fairview Ave south of Summit Ave

Cleveland Ave south of Marshall Ave

Jackson St north of Shepard Rd0

1 Shepard Rd west of Jackson St

Kellog Blvd north of Smith Ave10

11 Smith Ave west of Kellogg Blvd

31 Summit Ave east of Dale St

Lexington Pkwy Bridge south of Pierce Butler Rt20

W Pierce Butler under Lexington Pkwy Bridge21

Dale St south of Summit Ave30

40

41

80

81

82

Hamline Ave south of Highland Pkwy

Lexington Pkwy north of Jefferson Ave

Jefferson Ave west of Lexington Pkwy61

60

90

COMPLETE BICYCLE AND PEDESTRIAN MANUAL COUNT DATA (2007 - 2016)

2015 - 2016 City of Saint Paul Bicycle and Pedestrian Count Report | 11

 ID  # LOCATION AGENCY YEAR DATE DURATION BIKE  FACILTY Bicycles Pedestrians Sidewalk  %

PW 2016 Multiple 4 - 6 PM Bike Lane 246 160 1%

PW 2015 Multiple 4 - 6 PM Bike Lane 212 168 3%

PW 2014 9/9/14 4 - 6 PM Bike Lane 232 160 3%

PW 2013 9/10/13 4 - 6 PM Bike Lane 268 214 4%

PW 2014 9/9/14 4 - 6 PM Bike Lane 36 10 0%

PW 2013 9/10/13 4 - 6 PM Bike Lane 30 7 0%

PW 2014 9/9/14 4 - 6 PM Bike Lane 25 2 0%

PW 2013 9/10/13 4 - 6 PM Bike Lane 26 4 0%

PW 2016 9/14/16 4 - 6 PM Bicycle Boulevard 21 33 3%

PW 2015 9/22/15 4 - 6 PM Bicycle Boulevard 36 20 0%

PW 2016 9/14/16 4 - 6 PM Bicycle Boulevard 9 21 11%

PW 2015 9/22/15 4 - 6 PM Bicycle Boulevard 25 16 0%

PW 2016 9/13/16 4 - 6 PM Off-Street Path 47 363 6%

PW 2015 10/2/15 4 - 6 PM Off-Street Path 42 295 7%

PW 2014 9/9/14 4 - 6 PM Off-Street Path 47 280 13%

PW 2013 9/10/13 4 - 6 PM Off-Street Path 117 296 4%

PW 2016 9/14/16 4 - 6 PM NONE 47 49 11%

PW 2014 9/9/14 4 - 6 PM NONE 42 46 5%

141 Horton Ave east of Hamline Ave PW 2014 9/9/14 4 - 6 PM Off-Street Path, Enhanced Shared Lane 69 69 0%

PW 2016 9/14/16 4 - 6 PM NONE 115 73 2%

PW 2014 9/9/14 4 - 6 PM NONE 27 52 48%

PW 2016 9/14/16 4 - 6 PM Bike Lane 98 57 6%

PW 2014 9/9/14 4 - 6 PM Bike Lane 73 42 8%

PW 2016 9/20/16 4 - 6 PM Shoulder 50 27 54%

PW 2015 9/22/15 4 - 6 PM Shoulder 25 25 16%

PW 2014 9/9/14 4 - 6 PM Shoulder 24 27 13%

PW 2013 9/10/13 4 - 6 PM Shoulder 37 32 11%

PW 2016 9/20/16 4 - 6 PM NONE 15 15 50%

PW 2015 9/22/15 4 - 6 PM NONE 15 25 33%

PW 2014 9/9/14 4 - 6 PM NONE 19 24 58%

PW 2013 9/10/13 4 - 6 PM NONE 18 33 61%

PW 2016 9/13/16 4 - 6 PM Off-Street Path 62 33 0%

PW 2015 9/22/15 4 - 6 PM Off-Street Path 74 21 0%

PW 2014 9/11/14 4 - 6 PM Off-Street Path 45 15 0%

PW 2016 9/13/16 4 - 6 PM Off-Street Path 14 24 0%

PW 2015 9/22/15 4 - 6 PM NONE 18 24 67%

PW 2014 9/11/14 4 - 6 PM NONE 5 19 0%

PW 2016 9/28/16 4 - 6 PM NONE 10 11 0%

PW 2014 9/9/14 4 - 6 PM NONE 14 11 29%

PW 2013 9/10/13 4 - 6 PM NONE 9 16 67%

PW 2016 9/28/16 4 - 6 PM NONE 14 19 29%

PW 2014 9/9/14 4 - 6 PM NONE 10 13 50%

PW 2013 9/10/13 4 - 6 PM NONE 20 32 15%

PW 2016 9/13/16 4 - 6 PM Bike Lane 48 61 0%

PW 2015 9/29/15 4 - 6 PM Bike Lane 1 1 0%

PW 2014 9/9/14 4 - 6 PM Bike Lane 50 52 6%

PW 2013 9/10/13 4 - 6 PM Bike Lane 57 41 4%

PW 2016 9/13/16 4 - 6 PM NONE 9 38 89%

PW 2015 9/29/15 4 - 6 PM NONE 18 48 67%

PW 2014 9/9/14 4 - 6 PM NONE 14 68 86%

PW 2013 9/10/13 4 - 6 PM NONE 4 25 25%

PW 2016 9/13/16 4 - 6 PM NONE 18 119 78%

PW 2015 9/30/15 4 - 6 PM NONE 11 126 91%

PW 2014 9/9/14 4 - 6 PM NONE 34 129 35%

PW 2013 9/10/13 4 - 6 PM NONE 13 78 85%

PW 2016 9/13/16 4 - 6 PM Bicycle Boulevard 17 30 12%

PW 2015 9/30/15 4 - 6 PM Bicycle Boulevard 20 28 10%

PW 2014 9/9/14 4 - 6 PM Bicycle Boulevard 30 45 23%

PW 2013 9/10/13 4 - 6 PM Bicycle Boulevard 6 45 33%

PW 2016 9/13/16 4 - 6 PM NONE 6 15 33%

PW 2015 10/1/15 4 - 6 PM NONE 3 27 67%

PW 2014 9/9/14 4 - 6 PM NONE 6 40 67%

PW 2013 9/10/13 4 - 6 PM NONE 6 9 17%

Summit Ave east of Fairview Ave

Griggs St south of Charles Ave

Charles Aves east of Griggs St

110 Prior Ave south of Minnehaha Ave

111 Minnehaha Ave east of Prior Ave

Dale St north of Marshall Ave

Marshall Ave east of Dale St

Park St north of University Ave

University Ave west of Park St

Lexington Pkwy south of Como Lake Dr

Galtier St south of Como Ave

Charles Ave west of Dale St

91

Smith Ave Bridge north of Cherokee Ave

Cherokee Ave east of Smith Ave

Shepard Rd / Sam Morgan Trl north of Otto Ave

Otto Ave at Shepard Rd / Sam Morgan Trl

201

120

121

130

150

191

190

140 Hamline Ave north of Como Ave / Horton Ave

210

143

142

Como Ave west of Hamline Ave

Hamline Ave south of Como Ave / Horton Ave

161

160

180

181

151

Dale St north of Charles Ave200

2015 - 2016 City of Saint Paul Bicycle and Pedestrian Count Report | 12

 ID  # LOCATION AGENCY YEAR DATE DURATION BIKE  FACILTY Bicycles Pedestrians Sidewalk  %

PW 2016 9/13/16 4 - 6 PM Bike Lane 58 23 7%

PW 2015 10/1/15 4 - 6 PM Bike Lane 51 21 10%

PW 2014 9/9/14 4 - 6 PM Bike Lane 65 40 17%

PW 2013 9/10/13 4 - 6 PM Bike Lane 69 24 16%

220 Victoria north of Maryland PW 2015 9/30/15 4 - 6 PM NONE 22 16 9%

221 Wheelock Pkwy east of Victoria PW 2015 9/30/15 4 - 6 PM NONE 20 22 30%

222 E. Como Blvd & Como Lake Trail south of Maryland PW 2015 9/30/15 4 - 6 PM Off-Street Path 82 269 5%

223 Maryland East of Victoria PW 2015 9/30/15 4 - 6 PM NONE 14 18 29%

224 E. Como Lake Dr & Como Lake Trail west of Victoria PW 2015 9/30/15 4 - 6 PM Off-street Path 37 228 0%

PW 2014 9/9/14 4 - 6 PM NONE 53 50 9%

PW 2013 9/10/13 4 - 6 PM NONE 94 33 10%

PW 2014 9/9/14 4 - 6 PM Off-Street Path 20 12 0%

PW 2013 9/10/13 4 - 6 PM Off-Street Path 36 8 0%

PW 2016 9/28/16 4 - 6 PM Shoulder 7 28 100%

PW 2015 9/22/15 4 - 6 PM Shoulder 7 32 71%

PW 2014 9/11/14 4 - 6 PM Shoulder 8 19 100%

PW 2013 9/10/13 4 - 6 PM Shoulders 12 15 58%

PW 2016 9/28/16 4 - 6 PM Off-Street Path, Shoulder 18 14 0%

PW 2015 9/22/15 4 - 6 PM Off-Street Path, Shoulder 31 9 0%

PW 2014 9/11/14 4 - 6 PM Off-Street Path, Shoulder 21 11 10%

PW 2013 9/10/13 4 - 6 PM Off-Street Path, Shoulder 24 22 13%

252 Payne Ave north of Phalen Blvd PW 2016 9/28/16 4 - 6 PM 16 37 81%

PW 2016 9/13/16 4 - 6 PM Off-Street Path, Shoulder 28 33 0%

PW 2015 10/1/15 4 - 6 PM Off-Street Path, Shoulder 21 11 10%

PW 2014 9/9/14 4 - 6 PM Off-Street Path, Shoulder 26 9 23%

261 Phalen Blvd west of Johnson Pkwy PW 2015 10/1/15 4 - 6 PM Bike Lane 19 21 0%

PW 2016 9/13/16 4 - 6 PM Bike Lane 18 24 100%

PW 2015 10/1/15 4 - 6 PM NONE 3 23 100%

PW 2014 9/9/14 4 - 6 PM Bike Lane 23 16 65%

Gateway State Trl north of Arlington Ave E PW 2014 9/9/14 4 - 6 PM Off-Street Path 21 27 0%

Gateway State Trl north of Arlington Ave E PW 2013 9/10/13 4 - 6 PM Off-Street Path 19 25 0%

Arlington Ave E east of Gateway State Trl PW 2014 9/9/14 4 - 6 PM None 16 31 100%

Arlington Ave E east of Gateway State Trl PW 2013 9/10/13 4 - 6 PM None 14 28 79%

PW 2016 9/13/16 4 - 6 PM Bike Lane 36 92 44%

PW 2014 9/9/14 4 - 6 PM Bike Lane 37 103 38%

PW 2013 9/10/13 4 - 6 PM Bike Lane 55 88 27%

PW 2015 9/13/16 4 - 6 PM NONE 10 9 30%

PW 2014 9/9/14 4 - 6 PM NONE 4 18 25%

PW 2013 9/10/13 4 - 6 PM NONE 7 3 14%

PW 2016 9/13/16 4 - 6 PM NONE 9 40 67%

PW 2015 9/22/15 4 - 6 PM NONE 4 51 100%

PW 2014 9/11/14 4 - 6 PM NONE 4 38 100%

PW 2013 9/10/13 4 - 6 PM NONE 18 90 83%

PW 2016 9/13/16 4 - 6 PM Bike Lane 13 26 23%

PW 2015 9/22/15 4 - 6 PM Bike Lane 9 15 11%

PW 2014 9/11/14 4 - 6 PM Bike Lane 11 16 45%

PW 2013 9/10/13 4 - 6 PM Bike Lane 16 26 13%

292 Robert St south of Cesar Chavez St PW 2014 9/11/14 4 - 6 PM NONE 4 22 25%

293 Cesar Chavez St east of Robert St PW 2014 9/11/14 4 - 6 PM Bike Lane 14 44 50%

PW 2016 9/20/16 4 - 6 PM Bike Lane 8 27 25%

PW 2015 10/1/15 4 - 6 PM Bike Lane 5 62 60%

PW 2013 9/10/13 4 - 6 PM Bike Lane 1 10 0%

PW 2016 9/20/16 4 - 6 PM Bike Lane 5 29 20%

PW 2015 10/1/15 4 - 6 PM Bike Lane 2 47 50%

PW 2013 9/10/13 4 - 6 PM Bike Lane 8 18 0%

PW 2016 9/13/16 4 - 6 PM Shoulder 32 23 0%

PW 2015 10/1/15 4 - 6 PM Shoulder 13 15 0%

PW 2014 9/9/14 4 - 6 PM Shoulder 23 12 0%

PW 2013 9/10/13 4 - 6 PM Shoulder 2 2 0%

PW 2016 9/13/16 4 - 6 PM NONE 12 6 8%

PW 2015 10/1/15 4 - 6 PM NONE 8 5 0%

PW 2014 9/9/14 4 - 6 PM NONE 10 18 0%

PW 2013 9/10/13 4 - 6 PM NONE 22 15 0%

230

231

Como Blvd south of Gateway Dr

Gateway Dr west of Como Blvd

320

262

Burns Ave east of Ruth St N

Johnson Pkwy north of Margaret St

Margaret St east of Johnson Pkwy

Phalen Blvd east of Johnson Pkwy

Johnson Pkwy north of Phalen Blvd

Wabasha St north of Fillmore Ave

Fillmore Ave east of Wabasha St

Robert St north of Ceasr Chavez St

Cesar Chavez st west of Robert St

Ruth St N north of Burns Ave

Como Ave east of Galtier St

Phalen Blvd east of Payne Ave251

Payne Ave south of Phalen Blvd250

211

260

280

281

290

291

310

311

321

270

271

2015 - 2016 City of Saint Paul Bicycle and Pedestrian Count Report | 13

 ID  # LOCATION AGENCY YEAR DATE DURATION BIKE  FACILTY Bicycles Pedestrians Sidewalk  %

PW 2016 9/14/16 4 - 6 PM Off-Street Path, Bike Lane (SB Only) 181 215 0%

PW 2015 9/29/15 4 - 6 PM Off-Street Path, Bike Lane (SB Only) 181 212 0%

PW 2014 9/18/14 4 - 6 PM Off-Street Path, Bike Lane (SB Only) 217 199 0%

PW 2013 9/10/13 4 - 6 PM Off-Street Path, Bike Lane (SB Only) 132 154 0%

PW 2016 9/14/16 4 - 6 PM Bicycle Boulevard 16 48 19%

PW 2015 9/29/15 4 - 6 PM Bicycle Boulevard 20 52 0%

PW 2014 9/18/14 4 - 6 PM Bicycle Boulevard 25 37 0%

PW 2013 9/10/13 4 - 6 PM Bicycle Boulevard 6 22 0%

PW 2015 9/22/15 4 - 6 PM NONE 11 4 18%

PW 2013 9/10/13 4 - 6 PM NONE 9 7 78%

PW 2015 9/22/15 4 - 6 PM Off-Street Path 1 1 100%

PW 2013 9/10/13 4 - 6 PM Off-Street Path 1 1 100%

PW 2016 9/13/16 4 - 6 PM Off-Street Path 38 16 100%

PW 2014 9/9/14 4 - 6 PM Off-Street Path 18 15 0%

PW 2013 9/10/13 4 - 6 PM Off-Street Path 40 17 50%

PW 2016 9/13/16 4 - 6 PM NONE 2 14 50%

PW 2014 9/9/14 4 - 6 PM NONE 1 6 0%

PW 2013 9/10/13 4 - 6 PM NONE 2 27 0%

PW 2016 9/14/16 4 - 6 PM NONE 42 11 41%

PW 2015 9/22/15 4 - 6 PM NONE 57 34 18%

PW 2014 9/9/14 4 - 6 PM Shoulder (NB only) 79 6 9%

PW 2013 9/10/13 4 - 6 PM Shoulder (NB only) 110 11 24%

PW 2016 9/14/16 4 - 6 PM Off-Street Path 185 10 8%

PW 2015 9/22/15 4 - 6 PM Off-Street Path 208 32 0%

PW 2014 9/9/14 4 - 6 PM Off-Street Path 192 7 0%

PW 2013 9/10/13 4 - 6 PM Off-Street Path 225 10 7%

362 N/S Desire Path over train tracks PW 2014 9/9/14 4 - 6 PM NONE 5 5 0%

370 Hamline Ave north of Pierce Butler Rte PW 2016 9/13/16 4 - 6 PM NONE 13 10 0%

371 Pierce Butler Rte east of Hamline Ave PW 2016 9/13/16 4 - 6 PM Shoulder 7 0 0%

372 Hamline Ave south of Pierce Butler Rte PW 2016 9/13/16 4 - 6 PM NONE 9 15 22%

380 Marion St Bridge south of Saint Anthony Ave PW 2013 9/10/13 4 - 6 PM NONE 6 62 83%

381 Saint Anthony Ave west of Marion St PW 2013 9/10/13 4 - 6 PM NONE 5 11 60%

PW 2016 9/13/16 4 - 6 PM NONE 14 35 14%

PW 2015 10/1/15 4 - 6 PM NONE 14 12 22%

PW 2014 9/9/14 4 - 6 PM NONE 5 41 20%

PW 2013 9/10/13 4 - 6 PM NONE 11 24 9%

PW 2016 9/13/16 4 - 6 PM NONE 3 69 33%

PW 2015 10/1/15 4 - 6 PM NONE 5 49 20%

PW 2014 9/9/14 4 - 6 PM NONE 5 45 20%

PW 2013 9/10/13 4 - 6 PM NONE 6 6 17%

PW 2016 9/13/16 4 - 6 PM NONE 8 22 0%

PW 2015 10/1/15 4 - 6 PM NONE 16 36 25%

PW 2014 9/9/14 4 - 6 PM Off-Street Path 7 29 29%

PW 2013 9/11/13 4 - 6 PM Off-Street Path 6 22 83%

PW 2014 9/9/14 4 - 6 PM NONE 13 36 100%

PW 2013 9/11/13 4 - 6 PM NONE 12 27 100%

PW 2016 9/13/16 4 - 6 PM NONE 8 11 38%

PW 2014 9/9/14 4 - 6 PM NONE 14 5 7%

PW 2013 9/10/13 4 - 6 PM NONE 19 12 5%

PW 2016 9/13/16 4 - 6 PM NONE 7 15 86%

PW 2014 9/9/14 4 - 6 PM NONE 6 39 50%

PW 2013 9/10/13 4 - 6 PM NONE 11 25 36%

PW 2016 9/14/16 4 - 6 PM Bike Lane 75 146 4%

PW 2015 9/22/15 4 - 6 PM Bike Lane 52 84 4%

PW 2014 9/9/14 4 - 6 PM Bike Lane 59 75 0%

PW 2013 9/10/13 4 - 6 PM Bike Lane 50 75 14%

PW 2016 9/14/16 4 - 6 PM NONE 24 44 0%

PW 2015 9/22/15 4 - 6 PM NONE 15 31 7%

PW 2014 9/9/14 4 - 6 PM NONE 16 25 0%

PW 2013 9/10/13 4 - 6 PM NONE 32 29 16%

430 Trout Creek Trail north of Arlington Ave E PW 2013 9/11/13 4 - 6 PM Off-Street Path 7 7 0%

431 Arlington Ave E south of Trout Creek Trail PW 2013 9/11/13 4 - 6 PM NONE 33 37 70%

PW 2016 9/13/16 4 - 6 PM Off-Street Path 13 15 0%

PW 2014 9/9/14 4 - 6 PM Off-Street Path 10 22 0%

Jackson St south of Mt Airy St

Mt Airy St east of Jackson St

351

331

Mississippi River Blvd south of Jefferson Ave

Jefferson Ave east of Mississippi River Blvd

Griggs St Bridge north of Concordia Ave

Concordia Ave east of Griggs St

Energy Park Dr south of U of M Transitway

U of M Transitway west of Energy Park Dr

Edgecumbe Rd north of St Paul Ave

St Paul Ave east of Edgecumbe Rd

Raymond Ave south of Territorial Dr

Territorial Dr west of Raymond Ave

350

Battle Creek Trl north of Upper Afton Rd440

420

392

330

421

Jackson St north of Mt Airy St

Burns Ave west of US 10/61

US 10/61 south of Bruns Ave

341

340

360

361

401

400

Timberlake Rd east of Jackson St

Jackson St / Trout Brook Trl south of Timberlake Rd

411

410

390

391

2015 - 2016 City of Saint Paul Bicycle and Pedestrian Count Report | 14

 ID  # LOCATION AGENCY YEAR DATE DURATION BIKE  FACILTY Bicycles Pedestrians Sidewalk  %

PW 2016 9/13/16 4 - 6 PM Bike Lane 7 20 43%

PW 2014 9/9/14 4 - 6 PM NONE 4 10 25%

450 Wheelock Pkwy north of Johnson Pkwy PW 2014 9/9/14 4 - 6 PM Off-Street Path, Shoulder 25 76 0%

460 Griggs St south of Marshall Ave PW 2014 9/9/14 4 - 6 PM Bicycle Boulevard (UC) 13 23 0%

461 Marshall Ave west of Griggs St PW 2014 9/9/14 4 - 6 PM Bike Lane 41 45 20%

470 Smith Ave south of W 7th St PW 2014 9/9/14 4 - 6 PM NONE 19 19 38%

471 W 7th st west of Smith Ave PW 2014 9/9/14 4 - 6 PM NONE 24 55 68%

PW 2015 9/22/15 4 - 6 PM Off-Street Path 4 6 0%

PW 2014 9/9/14 4 - 6 PM Off-Street Path 17 15 0%

PW 2015 9/22/15 4 - 6 PM NONE 1 2 100%

PW 2014 9/9/14 4 - 6 PM NONE 9 33 56%

PW 2016 9/14/16 4 - 6 PM Bike Lane 7 135 29%

PW 2015 9/29/15 4 - 6 PM Bike Lane 22 138 73%

PW 2014 9/9/14 4 - 6 PM Bike Lane 9 121 33%

PW 2016 9/14/16 4 - 6 PM NONE 20 244 75%

PW 2015 9/29/15 4 - 6 PM NONE 16 105 50%

PW 2014 9/9/14 4 - 6 PM NONE 33 156 67%

500 Fairview Ave north of Ford Pkwy PW 2014 9/9/14 4 - 6 PM Shoulder 14 11 14%

501 Ford Pkwy east of Fairview PW 2014 9/9/14 4 - 6 PM NONE 4 20 50%

510 Jackson St south of 5th St PW 2015 9/21/15 4 - 6 PM Bike Lane 27 176 19%

511 5th St west of jackson St PW 2015 9/21/15 4 - 6 PM NONE 24 532 29%

PW 2016 9/28/16 4 - 6 PM NONE 21 40 76%

PW 2015 9/30/15 4 - 6 PM NONE 49 35 65%

PW 2016 9/28/16 4 - 6 PM Bike Lane 78 89 18%

PW 2015 9/30/15 4 - 6 PM Bike Lane 109 88 12%

PW 2016 9/14/16 4 - 6 PM Bike Lane 55 59 16%

PW 2015 10/1/15 4 - 6 PM Bike Lane 41 50 7%

PW 2016 9/14/16 4 - 6 PM Bike Lane 115 46 5%

PW 2015 10/1/15 4 - 6 PM Bike Lane 86 37 2%

PW 2016 9/14/16 4 - 6 PM Enhanced Shared Lane 58 49 9%

PW 2015 10/1/15 4 - 6 PM Enhanced Shared Lane 48 34 8%

PW 2016 9/14/16 4 - 6 PM Bike Lane 141 50 3%

PW 2015 10/1/15 4 - 6 PM Bike Lane 112 51 5%

540 Lexington Pkwy north of Montreal Ave PW 2015 9/30/15 4 - 6 PM NONE 5 9 80%

541 Montreal Ave west of Lexington Pkwy PW 2015 9/30/15 4 - 6 PM Bike Lane 6 56 17%

PW Multiple 9/13/16 4 - 6 PM Bike Lane 55 66 18%

PW 2015 9/1/15 4 - 6 PM NONE 34 61 44%

PW Multiple 9/13/16 4 - 6 PM Bike Lane 15 61 53%

PW 2015 9/1/15 4 - 6 PM NONE 8 45 75%

560 Cleveland Ave south of Randolph Ave PW 2016 9/13/16 4 - 6 PM Bike Lane 18 62 17%

561 Randolph Ave east of Cleveland Ave PW 2016 9/13/16 4 - 6 PM NONE 15 71 20%

580 Cretin Ave south of Beverly Rd PW 2016 9/28/16 4 - 6 PM NONE 14 19 21%

581 Beverly Road west of Cretin Ave PW 2016 9/28/16 4 - 6 PM NONE 15 10 67%

582 Cretin Ave east-west crosswalk south of Beverly Rd PW 2016 9/28/16 4 - 6 PM NONE 9 20 -

PW 2016 Multiple 4 - 6 PM Off-Street Path, Bike Lane 437 119 26%

PW 2015 9/22/15 4 - 6 PM Off-Street Path, Bike Lane 281 130 31%

MPW 2014 9/25/14 4 - 6 PM Off-Street Path, Bike Lane 347 186 31%

TLC 2013 9/10/13 4 - 6 PM Off-Street Path, Bike Lane 330 111 -

TLC 2012 - 4 - 6 PM Off-Street Path, Bike Lane 381 165 -

TLC 2011 - 4 - 6 PM Off-Street Path, Bike Lane 372 116 -

TLC 2010 - 4 - 6 PM Off-Street Path, Bike Lane 311 129 -

TLC 2009 - 4 - 6 PM Off-Street Path, Bike Lane 311 100 -

TLC 2008 - 4 - 6 PM Off-Street Path, Bike Lane 290 141 -

TLC 2007 - 4 - 6 PM Off-Street Path, Bike Lane 280 76 -

PW 2016 Multiple 4 - 6 PM Off-Street Path, Shoulder 193 68 90%

PW 2015 Multiple 4 - 6 PM Off-Street Path, Shoulder 227 82 84%

MPW 2014 9/18/14 4 - 6 PM Off-Street Path, Shoulder 249 84 90%

TLC 2013 9/10/13 4 - 6 PM Off-Street Path, Shoulder 211 68 -

TLC 2012 - 4 - 6 PM Off-Street Path, Shoulder 204 116 -

TLC 2011 - 4 - 6 PM Off-Street Path, Shoulder 206 77 -

TLC 2010 - 4 - 6 PM Off-Street Path, Shoulder 114 66 -

TLC 2009 - 4 - 6 PM Off-Street Path, Shoulder 204 62 -

TLC 2008 - 4 - 6 PM Off-Street Path, Shoulder 234 134 -

TLC 2007 - 4 - 6 PM Off-Street Path, Shoulder 153 119 -

Prior Ave south of Marshall Ave

Marshall Ave west of Prior Ave

Marshall Ave Bridge

Ford Pkwy Bridge

Broadway Ave north of Kellogg Blvd

John Ireland Blvd southwest of Kellogg Blvd

Prior Ave north of Marshall Ave

Marshall Ave east of Prior Ave

Kellogg Blvd southeast of John Ireland Blvd

441 Upper Afton Rd east of Battle Creek Trl

Kellogg Blvd east of Broadway Ave

Plato Blvd east of Ohio St

480

481

550

551

Como Ave northwest of Front Ave

Front Ave west of Como Ave

3401

520

521

533

532

531

530

491

490

Ohio St south of Plato Blvd

3201

2015 - 2016 City of Saint Paul Bicycle and Pedestrian Count Report | 15

 ID  # LOCATION AGENCY YEAR DATE DURATION BIKE  FACILTY Bicycles Pedestrians Sidewalk  %

PW 2016 9/13/16 4 - 6 PM None 65 24 9%

PW 2015 9/29/15 4 - 6 PM None 111 37 18%

PW 2016 9/13/16 4 - 6 PM None 35 29 46%

PW 2015 9/29/15 4 - 6 PM None 31 19 19%

DKCO 2013 - 4 - 6 PM Off-Street Path 61 5 -

DKCO 2012 - 4 - 6 PM Off-Street Path 33 3 -

PW 2016 9/28/16 4 - 6 PM Enhanced Shared Lane 35 73 14%

PW 2015 9/22/15 4 - 6 PM Enhanced Shared Lane 66 85 12%

PW 2014 9/9/14 4 - 6 PM Enhanced Shared Lane 86 88 15%

PW 2016 9/28/16 4 - 6 PM Bike Lane 20 52 25%

PW 2015 9/22/15 4 - 6 PM Bike Lane 27 82 4%

PW 2014 9/9/14 4 - 6 PM Bike Lane 47 57 4%

TLC 2013 9/10/13 4 - 6 PM Bike Lane 53 50 -

TLC 2012 - 4 - 6 PM Bike Lane 42 47 -

TLC 2011 - 4 - 6 PM Bike Lane 67 65 -

TLC 2010 - 4 - 6 PM Bike Lane 40 77 -

TLC 2009 - 4 - 6 PM Bike Lane 51 100 -

TLC 2008 - 4 - 6 PM Bike Lane 55 94 -

TLC 2007 - 4 - 6 PM Bike Lane 38 84 -

PW 2016 9/14/16 4 - 6 PM Bike Lane 44 51 18%

PW 2015 10/1/15 4 - 6 PM Bike Lane 34 62 35%

PW 2014 9/9/14 4 - 6 PM Bike Lane 38 48 34%

PW 2016 9/14/16 4 - 6 PM NONE 43 55 67%

PW 2015 10/1/15 4 - 6 PM NONE 32 39 66%

PW 2014 9/9/14 4 - 6 PM NONE 45 42 18%

TLC 2013 9/10/13 4 - 6 PM NONE 49 26 -

TLC 2012 - 4 - 6 PM NONE 41 37 -

TLC 2011 - 4 - 6 PM NONE 69 27 -

TLC 2010 - 4 - 6 PM NONE 62 28 -

TLC 2009 - 4 - 6 PM NONE 62 26 -

TLC 2008 - 4 - 6 PM NONE 84 26 -

TLC 2007 - 4 - 6 PM NONE 58 23 -

PW 2016 9/20/16 4 - 6 PM NONE 8 80 38%

PW 2015 9/22/15 4 - 6 PM NONE 6 39 0%

PW 2014 9/9/14 4 - 6 PM NONE 8 66 50%

PW 2016 9/20/16 4 - 6 PM Bike Lane 110 140 4%

PW 2015 9/22/15 4 - 6 PM Bike Lane 109 127 0%

PW 2014 9/9/14 4 - 6 PM Bike Lane 119 111 3%

TLC 2013 9/10/13 4 - 6 PM Bike Lane 125 158 -

TLC 2012 - 4 - 6 PM Bike Lane 84 73 -

TLC 2011 - 4 - 6 PM Bike Lane 122 168 -

TLC 2010 - 4 - 6 PM Bike Lane 102 82 -

TLC 2009 - 4 - 6 PM Bike Lane 103 128 -

TLC 2008 - 4 - 6 PM Bike Lane 121 153 -

TLC 2007 - 4 - 6 PM Bike Lane 79 136 -

5412 Irving Ave south of Summit Ave PW 2016 9/20/16 4 - 6 PM NONE 9 25 -

PW 2016 9/14/16 4 - 6 PM Enhanced Shared Lane 70 35 11%

PW 2015 9/22/15 4 - 6 PM Enhanced Shared Lane 44 19 7%

PW 2014 9/9/14 4 - 6 PM Enhanced Shared Lane 50 32 4%

TLC 2013 9/10/13 4 - 6 PM Enhanced Shared Lane 50 20 -

PW 2016 9/14/16 4 - 6 PM NONE 54 38 2%

PW 2015 9/22/15 4 - 6 PM NONE 53 13 8%

PW 2014 9/9/14 4 - 6 PM NONE 54 15 0%

6010 Shepard Rd under the Smith Ave Bridge MNRRA 2014 9/9/14 4 - 6 PM Off-Street Path 39 18 0%

TLC 2013 9/10/13 4 - 6 PM Bike Lane 27 13 -

TLC 2012 - 4 - 6 PM Bike Lane 26 13 -

TLC 2011 - 4 - 6 PM Bike Lane 24 16 -

TLC 2010 - 4 - 6 PM Bike Lane 24 21 -

TLC 2009 - 4 - 6 PM Bike Lane 27 20 -

TLC 2008 - 4 - 6 PM Bike Lane 27 26 -

TLC 2007 - 4 - 6 PM Bike Lane 18 23 -

9021 Larpenteur east of Cleveland

Otis Ave east of Pelham Blvd5891

Pelham Blvd north of Otis Ave5890

Como Ave west of Raymond Ave

Prior Ave north of University Ave

I-35E Bridge over the Mississippi River

University Ave west of Prior Ave

Western Ave north of Summit Ave

Summit Ave east of Western Ave

Agency Key: PW = Saint Paul Department of Public WorksMPW = Minneapolis Public Works Department

TLC = Transit for Livable CommunitiesDKCO = Dakota County

MNRRA = Mississippi National River Recreational Area

5351

5350

5361

5360

5411

5410

Raymond Ave south of Como Ave

3601

Ford Pkwy Ramp to north Mississippi River Blvd

Ford Pkwy Ramp to south Mississippi River Blvd

3402

3403

2015 - 2016 City of Saint Paul Bicycle and Pedestrian Count Report | 16

Weather Conditions During Manual Count Periods (2013 - 2016)

Year Date Rain  (in) High Low Average Max Average9/13/16 Trace 66 55 61 21 10.89/14/16 0.00 70 46 58 10 3.49/20/16 0.01 79 54 67 15 5.19/28/16 0.00 62 50 56 18 9.39/1/15 0.00 84 68 76 10 4.99/21/15 0.00 80 55 68 23 10.89/22/15 0.00 72 61 67 14 4.39/29/15 0.00 62 46 54 20 7.29/30/15 0.00 63 41 52 13 4.210/1/15 0.00 63 43 53 15 6.59/9/14 0.22 75 61 68 15 5.89/11/14 0.00 57 43 50 18 8.59/18/14 0.00 74 47 61 15 6.59/25/14 Trace 76 59 68 14 6.99/10/13 0.04 80 67 74 16 6.09/11/13 0.00 85 62 74 21 7.6

Year Date

Wind  (mph)

2016

2015

2014

2013

Temperature  (F)

Source: Minnesota Department of Natural Resources, www.dnr.state.mn.us/climate

2015 - 2016 City of Saint Paul Bicycle and Pedestrian Count Report | 17


Recommended