HW Mountz School Analysis of 2015-2016 Academic Progress 2015-2016 NJASK Science Test Results compared to 2014-2015 2015-2016 PARCC ELA & Math Test Results Year 2 compared to Year 1 Spring Lake Board of Education Meeting October 24, 2016 Presented By The Data Team: Kerri Walsifer, Cheryl Salway & Karen Dettlinger
Transcript
HW Mountz School Analysis of 2015-2016 Academic Progress
2015-2016 NJASK Science
Test Results compared to
2014-2015
2015-2016 PARCC
ELA & MathTest Results
Year 2 compared to Year 1
Spring Lake Board of Education MeetingOctober 24, 2016
Presented By The Data Team:Kerri Walsifer, Cheryl Salway & Karen Dettlinger
NJ ASK SCIENCEGRADES 4 AND 8
RESULTS FOR SPRING 2016 ADMINISTRATION
Grade Total Student PopulationProficient/Advanced Proficient
2014-2015
Total Student Population Proficient/Advanced Proficient
2015-2016
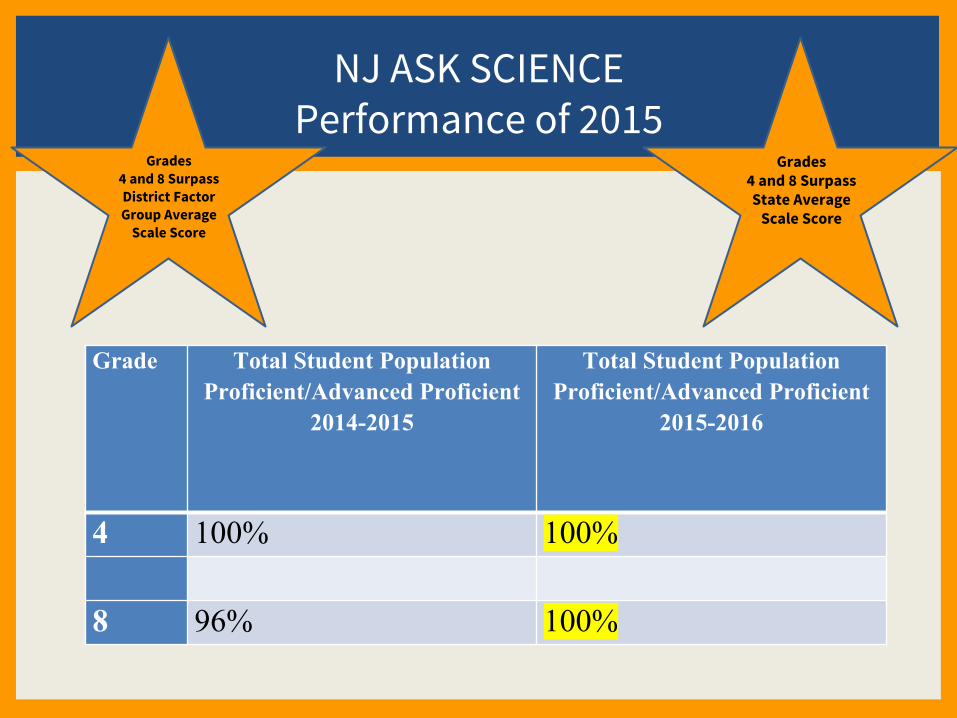
4 100% 100% 8 96% 100%
NJ ASK SCIENCEPerformance of 2015
Grades 4 and 8 Surpass State Average
Scale Score
Grades 4 and 8 Surpass District Factor Group Average
Scale Score
Measuring College and Career Readiness
PARCC RESULTS: YEAR 2
HW Mountz SchoolOctober 24, 2016
July 6, 2016
By Mike Bushnell
5
PARCC Gets High Marks For High Standards, Test Quality
Over the past year, a diverse range of studies have highlighted that PARCC assessments are of the highest quality in the field, endorsed by the country’s top educators, aligned to nationally recognized standards for educational achievement, predictive of college readiness, and accessible to students with physical disabilities and those who are learning English as their second language.
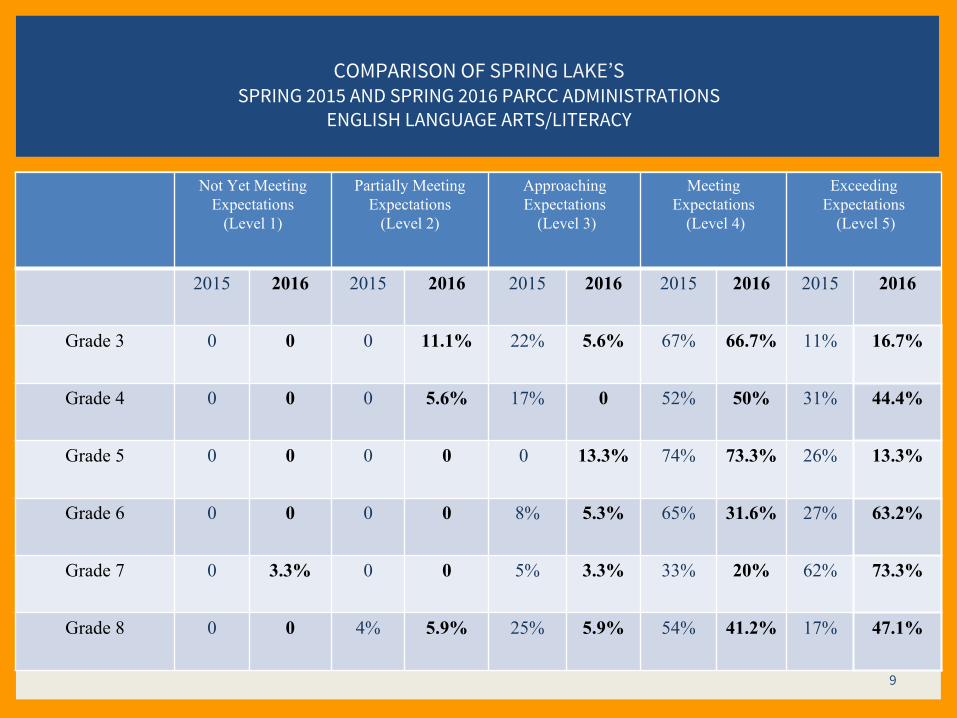
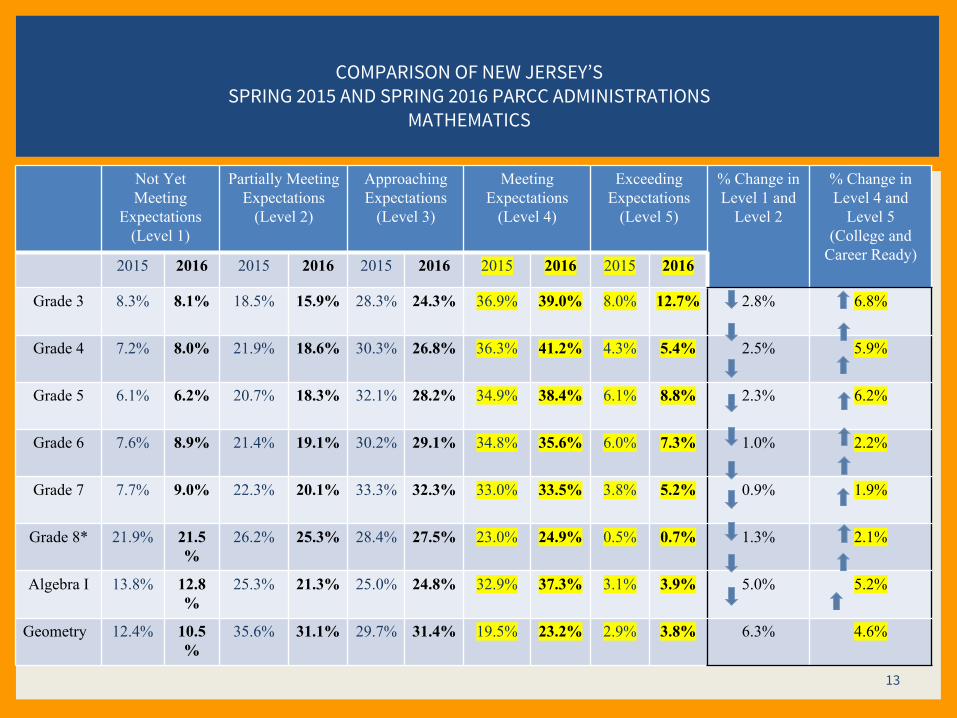
◼ 2016 marks the 2nd administration of the Partnership for Assessment of Readiness for College and Careers (PARCC) and the first opportunity to compare year-to-year results as the following slides will show.
◼ Students took PARCC English Language Arts and Literacy Assessments (ELA/L) in grades 3 – 11.
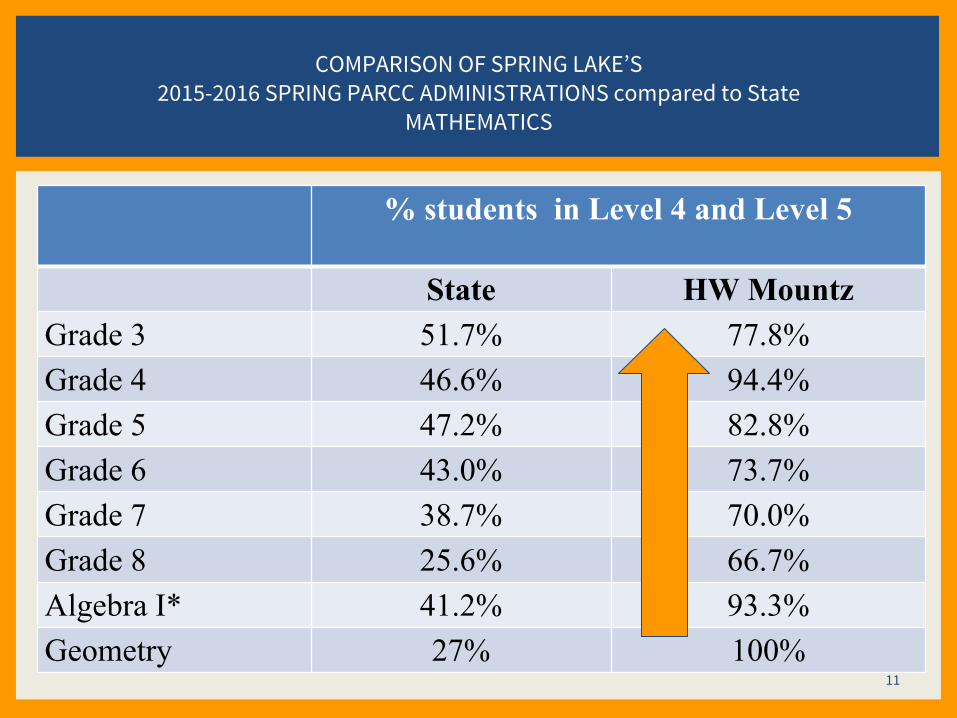
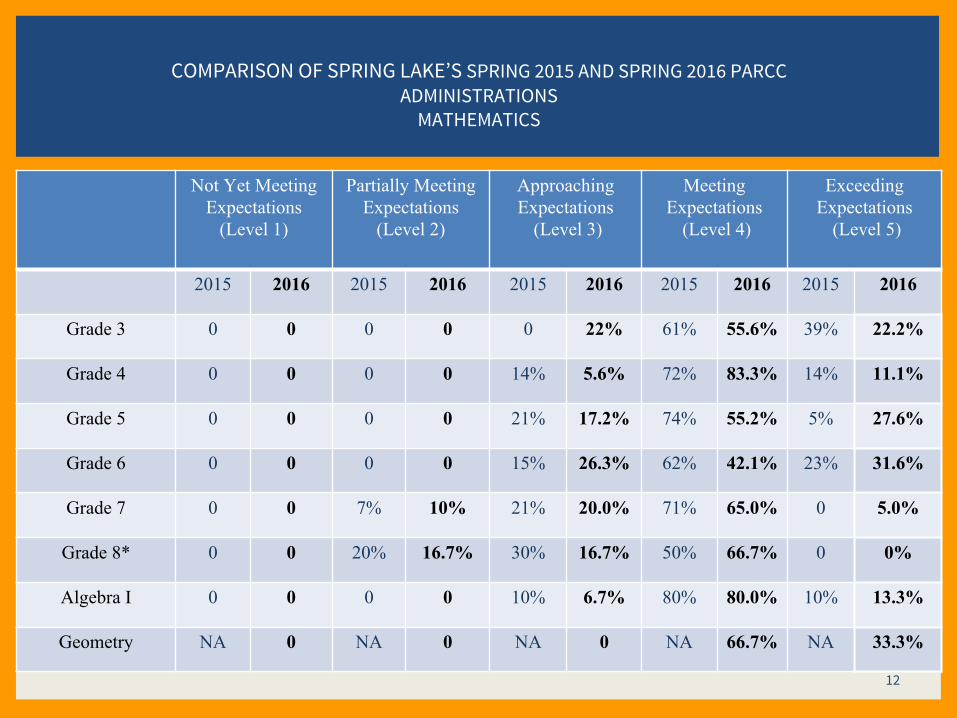
◼ Students took PARCC Mathematics Assessments in grades 3 – 8 and End of Course Assessments in Algebra I, Geometry, and Algebra II.
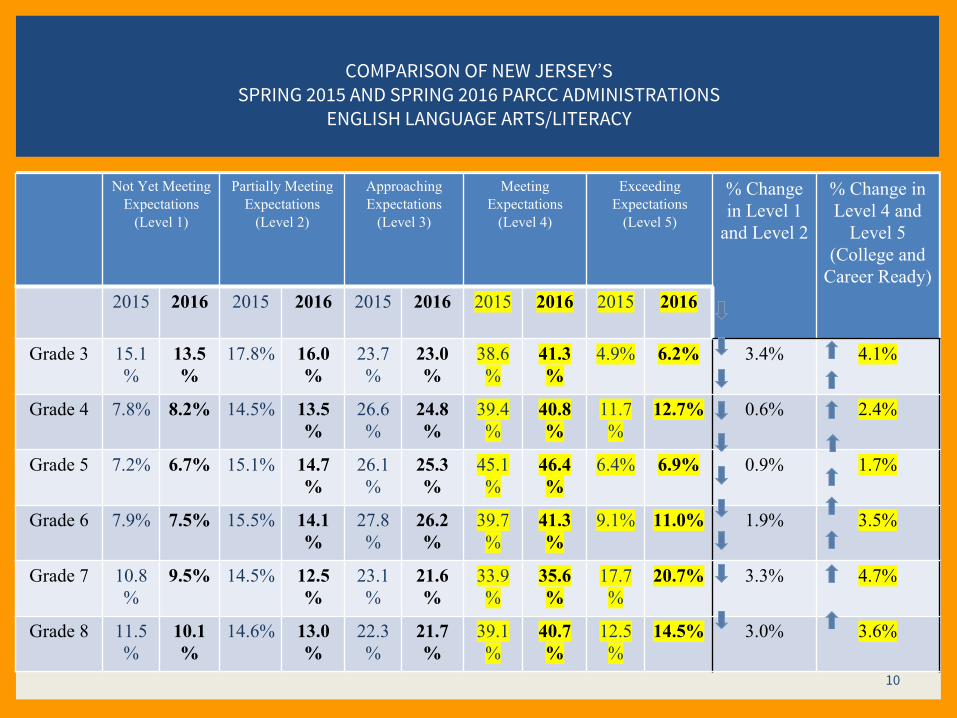
NEW JERSEY’S STATEWIDE ASSESSMENT PROGRAM
6
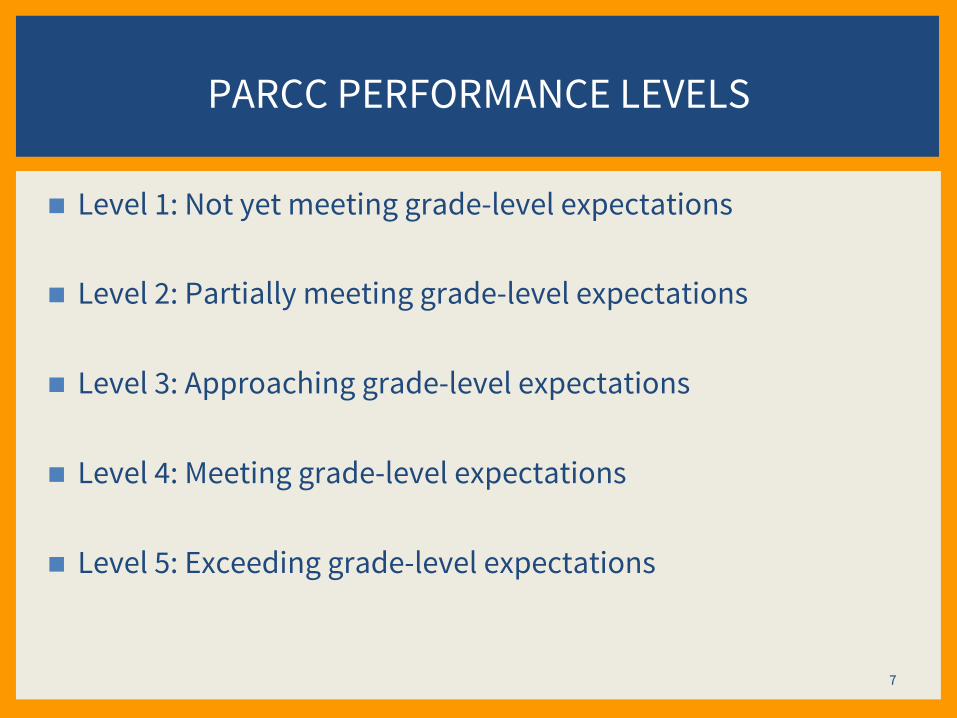
◼ Level 1: Not yet meeting grade-level expectations
◼How will we use PARCC data to identify strengths and gaps that exist in our curriculum and instruction?
◼How will we use PARCC data as a tool to address areas in need of improvement or enhancement?
◼How can we provide additional resources and support for our educators to meet the learning needs of all our students?
14
❏ PARCC data will be used to drive more meaningful conversations around students, standards, instructional improvements, and family engagement.▪ HW Mountz will be “drilling down” to assess our performance and reflect
on areas that are in need of improvement in grades 3-8 in both ELA and Math▪ PLT teams will be analyzing data compared to other “like” schools▪ Curriculum realignment and revamping will take place starting
January of 2016❏ This is a “2015 Blue Ribbon School” and we will continue
to maintain the academic rigor and grit while increasing performance in both teaching and learning for all!▪ HW Mountz will be incorporating these expectations into our Strategic
Planning goals over the next 3 years
HW Mountz Prepares for the Year Ahead...
RESOURCES FOR PARENTS
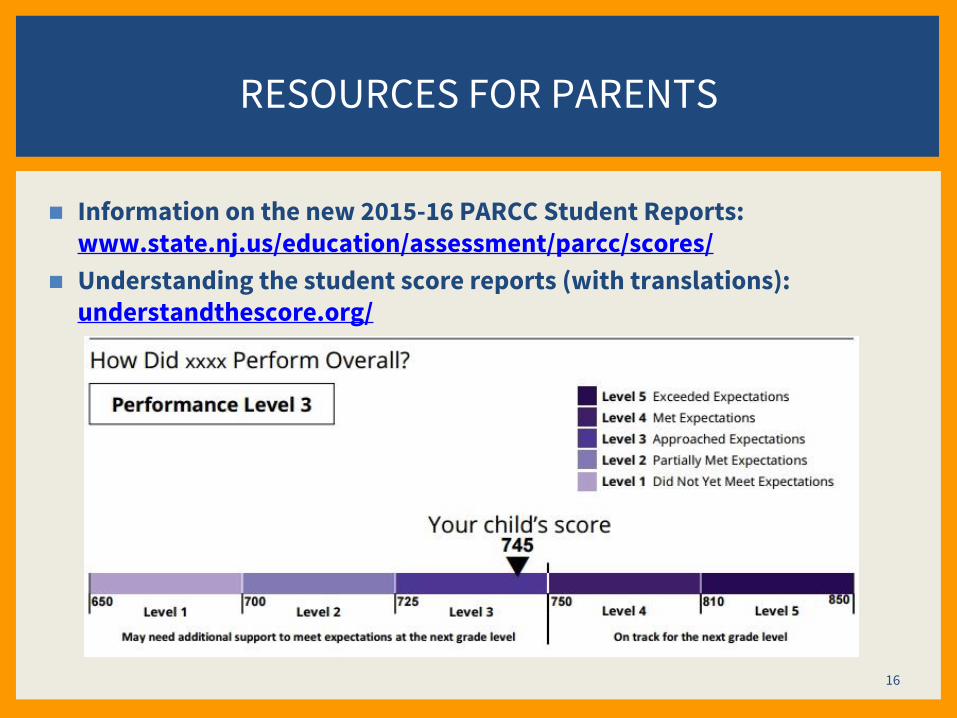
◼ Information on the new 2015-16 PARCC Student Reports: www.state.nj.us/education/assessment/parcc/scores/
◼ Understanding the student score reports (with translations): understandthescore.org/
and thank you to all of our teachers, students and support staff for working so hard over these past few years. Both hard work and dedication contribute to the success of everyone...