175
Investor Relations Summit Tuesday, February 24, 2015 WiFi Name: Hyatt Meeting
| Date post: | 14-Jul-2015 |
| Category: |
Investor Relations |
| Upload: | noellefaris |
| View: | 2,304 times |
| Download: | 1 times |

Investor Relations Summit Tuesday, February 24, 2015
WiFi Name: Hyatt Meeting

Welcome Tom Barth, Head of Investor Relations
©2015 AKAMAI | FASTER FORWARDTM
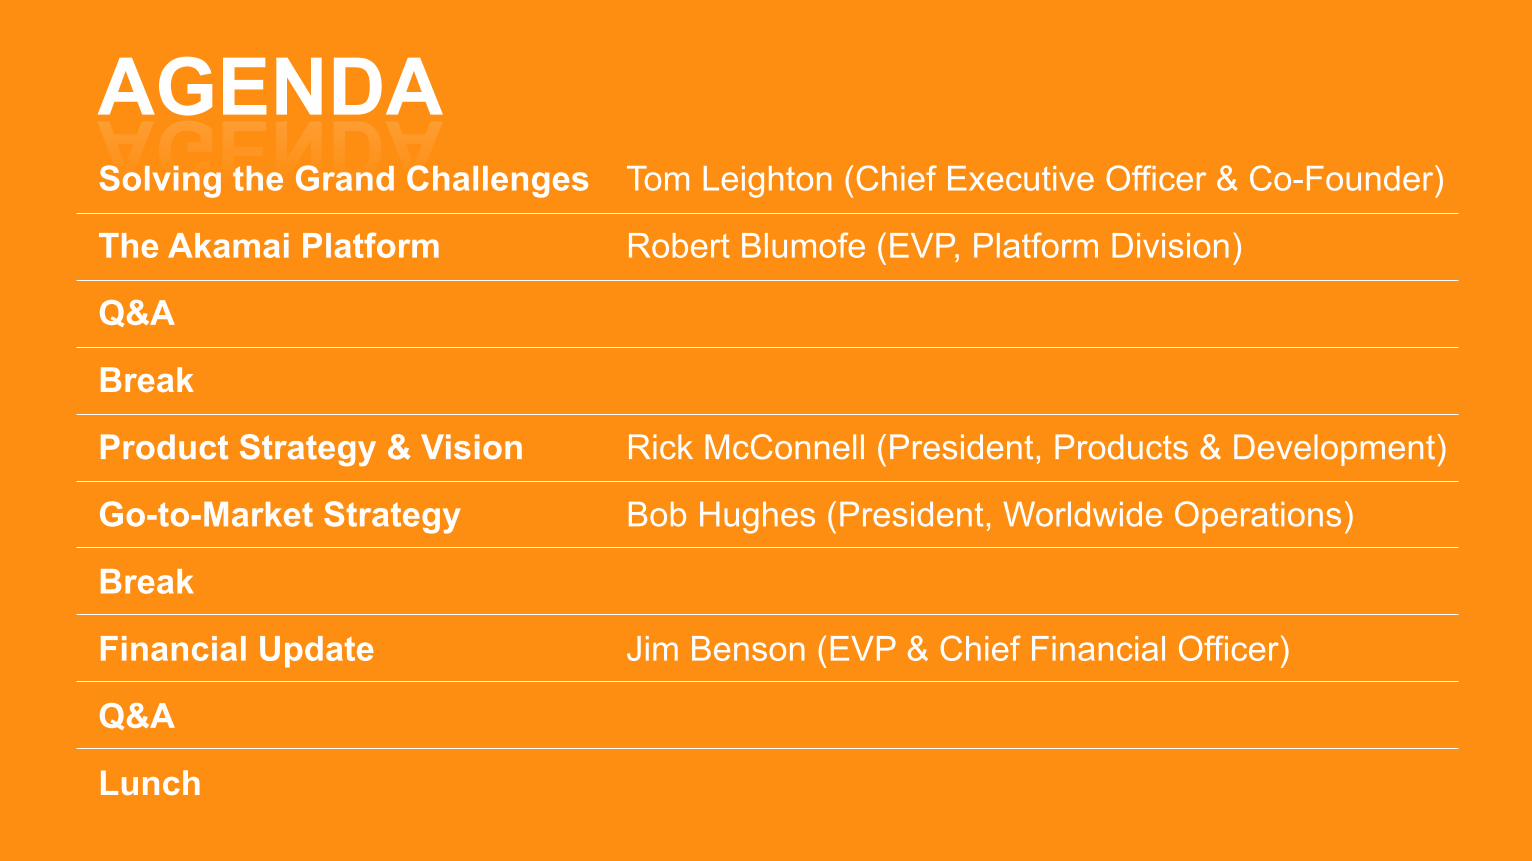
AGENDA Solving the Grand Challenges Tom Leighton (Chief Executive Officer & Co-Founder)
The Akamai Platform Robert Blumofe (EVP, Platform Division) Q&A
Break
Product Strategy & Vision Rick McConnell (President, Products & Development)
Go-to-Market Strategy Bob Hughes (President, Worldwide Operations)
Break
Financial Update Jim Benson (EVP & Chief Financial Officer)
Q&A
Lunch

©2015 AKAMAI | FASTER FORWARDTM
Avoid data theft and downtime by extending the security perimeter outside the data-center and protect from increasing frequency, scale and sophistication of web attacks.
This presentation and webcast include information about Akamai’s future expectations, plans and prospects that constitute forward-looking statements for purposes of the safe harbor provisions under The Private Securities Litigation Reform Act of 1995, including estimates about future revenues and market developments. Actual results may differ materially from those indicated by these forward-looking statements… as a result of various important factors including, but not limited to…
• Failure to maintain the prices we currently charge for our solution and services;
• Inability to effectively compete with existing companies and new entrants in the markets in which we operate;
• Unexpected network and service interruptions that cause loss of revenues, increased expenses or diversion of resources;
• Failure to increase our revenue at the same rate as in the past and keep our expenses from increasing at a greater rate than our revenues;
• Changes in relationships with our network providers that increase our operating expenses;
• Failure of new solutions and services we offer to operate as expected or to gain widespread market acceptance;
• Delay in developing or failure to develop new service offerings or functionalities, and if developed, lack of market acceptance of such service offerings and functionalities; and
• Other factors that are discussed in our annual report, on Form 10-K, our quarterly reports on Form 10-Q, and other documents periodically filed with the SEC.
• In addition, any forward-looking statements represent our views as of February 24, 2015 and should not be relied upon as representing our views as of any subsequent date. While we may elect to update forward-looking statements at some point in the future, we specifically disclaim any obligation to do so, even if our views change.
• Finally, during this presentation we will be referring to non-GAAP financial
measures such as Adjusted EBITDA. These non-GAAP measures are not prepared in accordance with generally accepted accounting principles. A reconciliation between non-GAAP and the most directly comparable GAAP financial measures appears in the News and Publications portion of the Investor Relations section of our Web site.
Safe Harbor Statement

Solving the Grand Challenges Dr. Tom Leighton — CEO and Co-Founder

©2015 AKAMAI | FASTER FORWARDTM
Grow revenue opportunities with fast, personalized web experiences and manage complexity from peak demand, mobile devices and data collection.
The Internet of Things… The Internet of Everything… The Hyperconnected World…

©2015 AKAMAI | FASTER FORWARDTM
Grow revenue opportunities with fast, personalized web experiences and manage complexity from peak demand, mobile devices and data collection. Everyone and
everything is getting connected.

©2015 AKAMAI | FASTER FORWARDTM
Grow revenue opportunities with fast, personalized web experiences and manage complexity from peak demand, mobile devices and data collection.
BILLIONS OF PEOPLE
TENS OF BILLIONS OF DEVICES
COUNTLESS PETABYTES OF DATA

©2015 AKAMAI | FASTER FORWARDTM
Grow revenue opportunities with fast, personalized web experiences and manage complexity from peak demand, mobile devices and data collection.
ENORMOUS EXPECTATIONS

©2015 AKAMAI | FASTER FORWARDTM
Grow revenue opportunities with fast, personalized web experiences and manage complexity from peak demand, mobile devices and data collection.
Fast, affordable IP access in the workplace and branch office
The ultimate in video quality over IP at scale
The web must be secure
Instant web performance
for any device, anywhere
GRAND CHALLENGES

©2015 AKAMAI | FASTER FORWARDTM
Grow revenue opportunities with fast, personalized web experiences and manage complexity from peak demand, mobile devices and data collection.
GRAND CHALLENGE FOR MEDIA
The ultimate in video quality over IP at scale

©2015 AKAMAI | FASTER FORWARDTM
Avoid data theft and downtime by extending the security perimeter outside the data-center and protect from increasing frequency, scale and sophistication of web attacks.
What a Difference a Few Years Makes…
63% CAGR
29 PETABYTES
IN 2010
FIFA World Cup
222 PETABYTES
IN 2014
12 PETABYTES
IN 2010
Winter Olympics
81 PETABYTES
IN 2014

©2015 AKAMAI | FASTER FORWARDTM
Avoid data theft and downtime by extending the security perimeter outside the data-center and protect from increasing frequency, scale and sophistication of web attacks.
12,000
8,000
6,000
4,000
2,000
10,000
2000 2002 2004 2006 2008 2010 2012 2014 0
10
20
30
Peak
Tbp
s
>26 Tbps
>60% CAGR
Traffic Growth on Akamai’s Platform
Add audio of breaking glass

©2015 AKAMAI | FASTER FORWARDTM
Avoid data theft and downtime by extending the security perimeter outside the data-center and protect from increasing frequency, scale and sophistication of web attacks.
12,000
8,000
6,000
4,000
2,000
10,000
2000 2002 2004 2006 2008 2010 2012 2014 0
10
20
30
Peak
Tbp
s
>26 Tbps
>60% CAGR
Traffic Growth on Akamai’s Platform
FUTURE DEMAND 2.5B Primetime Viewers
x 10 Mbps
~25,000 Tbps
Add audio of breaking glass

©2015 AKAMAI | FASTER FORWARDTM
Avoid data theft and downtime by extending the security perimeter outside the data-center and protect from increasing frequency, scale and sophistication of web attacks.
12,000
8,000
6,000
4,000
2,000
10,000
2000 2002 2004 2006 2008 2010 2012 2014 0
10
20
30
Peak
Tbp
s
~2020
Traffic Growth on Akamai’s Platform
Add audio of breaking glass

©2015 AKAMAI | FASTER FORWARDTM
WILL VIDEO BREAK THE INTERNET?

©2015 AKAMAI | FASTER FORWARDTM
Avoid data theft and downtime by extending the security perimeter outside the data-center and protect from increasing frequency, scale and sophistication of web attacks.
The Scalability Challenge
©2015 AKAMAI | FASTER FORWARDTM
Avoid data theft and downtime by extending the security perimeter outside the data-center and protect from increasing frequency, scale and sophistication of web attacks.
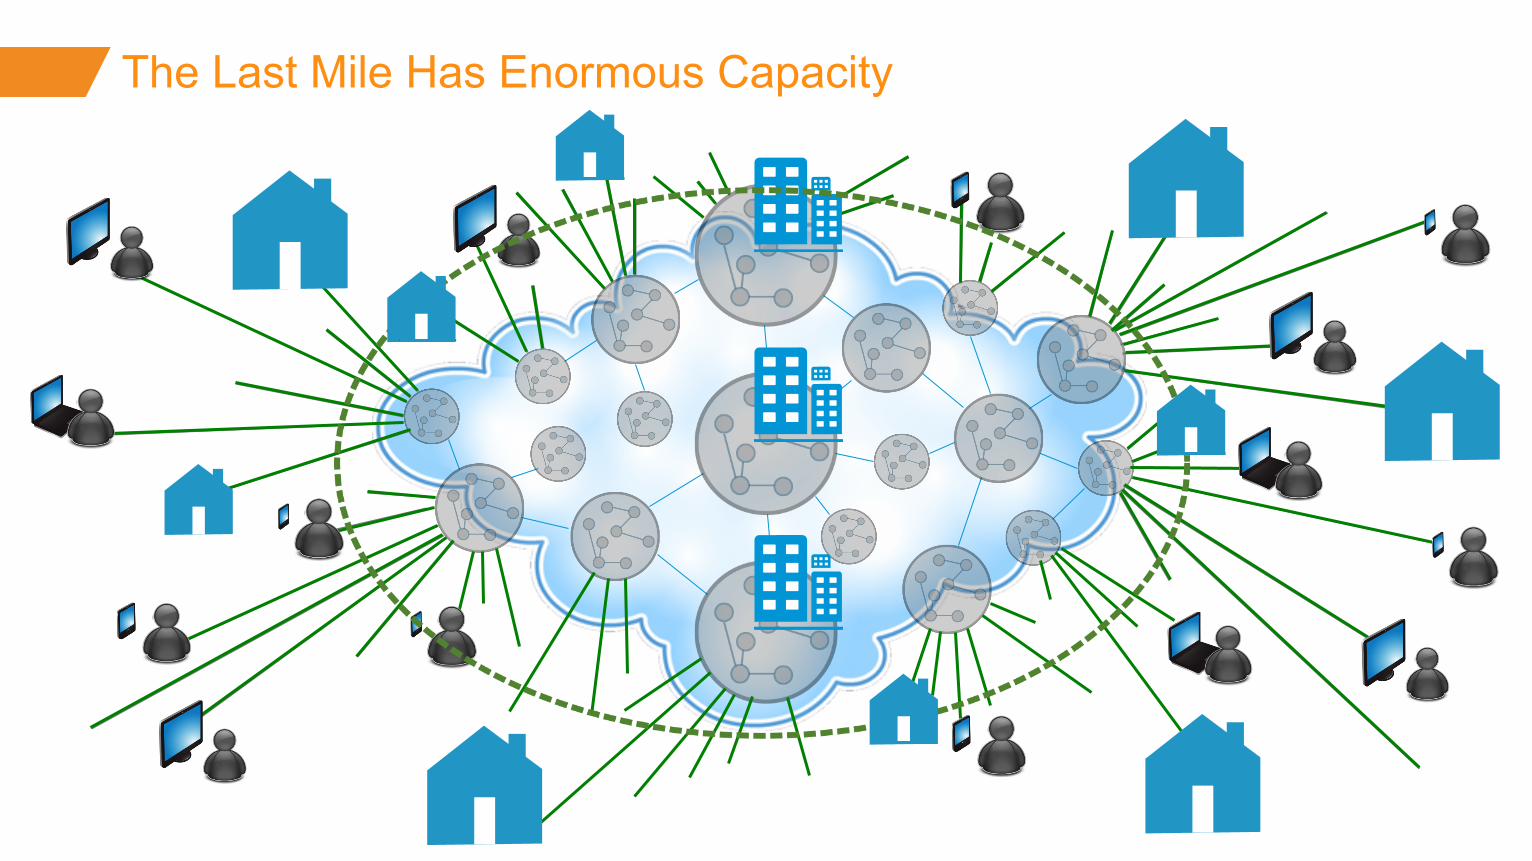
The Last Mile Has Enormous Capacity

©2015 AKAMAI | FASTER FORWARDTM
Avoid data theft and downtime by extending the security perimeter outside the data-center and protect from increasing frequency, scale and sophistication of web attacks.
The Last Mile Has Enormous Capacity
400M Lines
10,000 Tbps X 25 Mbps

©2015 AKAMAI | FASTER FORWARDTM
Avoid data theft and downtime by extending the security perimeter outside the data-center and protect from increasing frequency, scale and sophistication of web attacks.
The Problem is at the Core Cloud Data Centers

©2015 AKAMAI | FASTER FORWARDTM
Avoid data theft and downtime by extending the security perimeter outside the data-center and protect from increasing frequency, scale and sophistication of web attacks.
The Problem is at the Core Cloud Data Centers
100 Major Networks
500 Tbps X 5 Tbps

©2015 AKAMAI | FASTER FORWARDTM
Avoid data theft and downtime by extending the security perimeter outside the data-center and protect from increasing frequency, scale and sophistication of web attacks.
The Problem is at the Core Cloud Data Centers
500 Tbps
25,000 Tbps
2% of what
we need! =

©2015 AKAMAI | FASTER FORWARDTM
Avoid data theft and downtime by extending the security perimeter outside the data-center and protect from increasing frequency, scale and sophistication of web attacks.
Akamai’s Edge Strategy Today: Inside Over 1,300 Networks Akamai Servers
©2015 AKAMAI | FASTER FORWARDTM
Avoid data theft and downtime by extending the security perimeter outside the data-center and protect from increasing frequency, scale and sophistication of web attacks.
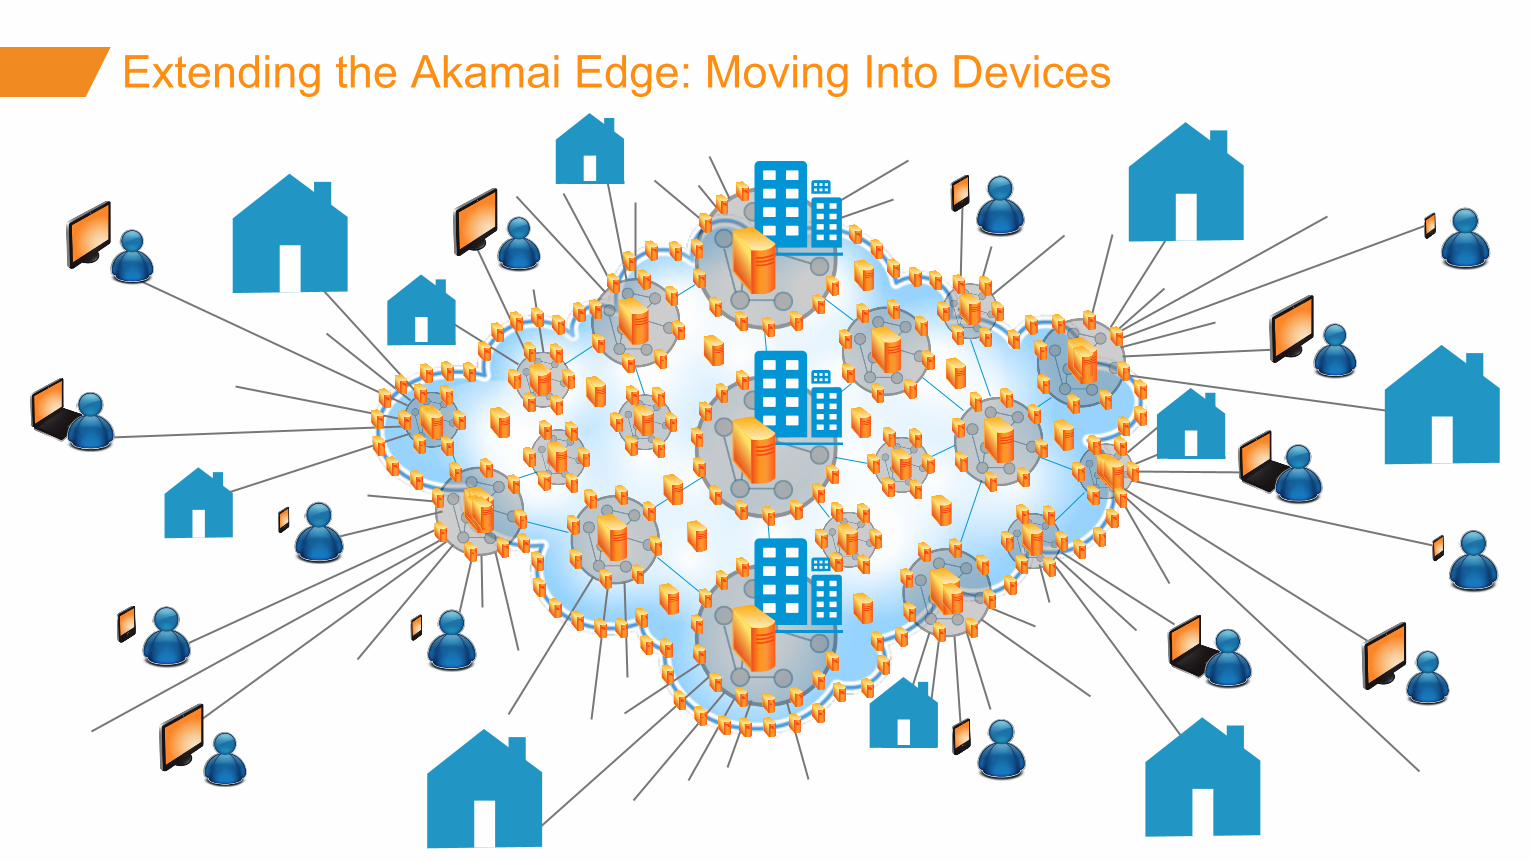
Extending the Akamai Edge: Moving Into Devices

©2015 AKAMAI | FASTER FORWARDTM
Avoid data theft and downtime by extending the security perimeter outside the data-center and protect from increasing frequency, scale and sophistication of web attacks.
Extending the Akamai Edge: Moving Into Devices
>30M NETSESSION
CLIENTS
>100M ADAPTIVE
MEDIA PLAYERS

©2015 AKAMAI | FASTER FORWARDTM
Avoid data theft and downtime by extending the security perimeter outside the data-center and protect from increasing frequency, scale and sophistication of web attacks.
THE FUTURE: Further Extending the Akamai Edge: Moving Into Homes

©2015 AKAMAI | FASTER FORWARDTM
MULTICAST FOR LIVE AND ON-DEMAND

©2015 AKAMAI | FASTER FORWARDTM
LET’S SEE IT LIVE!
Santosh Rao Senior System Software Engineer

©2015 AKAMAI | FASTER FORWARDTM
Grow revenue opportunities with fast, personalized web experiences and manage complexity from peak demand, mobile devices and data collection.
GRAND CHALLENGE FOR PERFORMANCE
Instant web performance for any device, anywhere

©2015 AKAMAI | FASTER FORWARDTM
Avoid data theft and downtime by extending the security perimeter outside the data-center and protect from increasing frequency, scale and sophistication of web attacks.
Web Pages Are Slowing Down!
Typical Page Size Typical # of Objects Mobile Penetration Avg. Page Load Time (Sec.)
1,622 Kb 112
30% 10.7
1,081 Kb 101
19% 7.2
2014 2013
788 Kb 88
9% 6.6
2012
Source: httparchive.org, Akamai, Radware

©2015 AKAMAI | FASTER FORWARDTM
Avoid data theft and downtime by extending the security perimeter outside the data-center and protect from increasing frequency, scale and sophistication of web attacks.
And It’s Getting Even Slower!
3rd Party Content
Chatty Protocols
Cellular Congestion
Complex Experiences
Heavier Content
• # of 3rd party domains up 56% in 2 years
• JavaScript transfer size up 40% in 2 years
• More round trips = more wait time
• Demand is far outstripping growth in capacity

©2015 AKAMAI | FASTER FORWARDTM
Speed Matters: Conversion Rate vs. Load Time C
onve
rsio
n R
ate
(%)
0-1 1-2 2-3 3-4 4-5 5-6 6-7 7-8 8-9 9-10 10-11 11+
Population Conversion Rate (%)
Page Load Time (Sec)
Page Performance & Site Conversion – Feb 2012

©2015 AKAMAI | FASTER FORWARDTM
Speed Matters: Consumer Reaction to Slow Mobile Apps
40% 20% 30% 10% 0%
Switch to a competitor’s app 34%
Less likely to purchase 31%
Negative brand perception 24%
Source: Forrester

©2015 AKAMAI | FASTER FORWARDTM
Akamai Makes the Web Faster
DSA: Acceleration of dynamic sites using network optimization
DSD: Caching of static objects for offload & availability; some performance gain
Ion: Optimized performance for any device, any user, anywhere

©2015 AKAMAI | FASTER FORWARDTM
Akamai Ion is Now… FASTER | EASIER | SMARTER
ION STANDARD & ION PREMIER

©2015 AKAMAI | FASTER FORWARDTM
Simple Front-End Optimization* Image Compression* Resource Domain Sharding Advanced Offload* Mobile Detect and Redirect Device Characteristics Content Targeting Real User Monitoring
* Introduced or enhanced in 2014
Ion Standard
Includes the caching from DSD, all the acceleration from DSA and more, with a focus on situational awareness

©2015 AKAMAI | FASTER FORWARDTM
Simple Front-End Optimization* Image Compression* Resource Domain Sharding Advanced Offload* Mobile Detect and Redirect Device Characteristics Content Targeting Real User Monitoring
Advanced Front-End Optimization* Advanced Cellular Optimizations* Enhanced Large File Downloads* DNS, Page & Resource Prefetching Origin Health Reporting* Fast DNS* Image Placeholders EdgeStart SHUTR
* Introduced or enhanced in 2014
Ion Premier
Includes the caching from DSD, all the acceleration from DSA and more, with a focus on situational awareness
+

©2015 AKAMAI | FASTER FORWARDTM
Simple Front-End Optimization* Image Compression* Resource Domain Sharding Advanced Offload* Mobile Detect and Redirect Device Characteristics Content Targeting Real User Monitoring
Advanced Front-End Optimization* Advanced Cellular Optimizations* Enhanced Large File Downloads* DNS, Page & Resource Prefetching Origin Health Reporting* Fast DNS* Image Placeholders EdgeStart SHUTR
* Introduced or enhanced in 2014
Mobile-Focused Features
Includes the caching from DSD, all the acceleration from DSA and more, with a focus on situational awareness
+

©2015 AKAMAI | FASTER FORWARDTM
Avoid data theft and downtime by extending the security perimeter outside the data-center and protect from increasing frequency, scale and sophistication of web attacks.
Improved Performance Over DSA
15-60% Faster with Ion Standard
20-95% Faster with Ion Premier
0%
20%
80%
40%
60%
100%
120%
Median Range
Performance Over DSA
Ion Standard Ion Premier

©2015 AKAMAI | FASTER FORWARDTM
Avoid data theft and downtime by extending the security perimeter outside the data-center and protect from increasing frequency, scale and sophistication of web attacks.
Cellular Case Study (eCommerce)
35% Faster than DSA with Ion Standard
Ion Standard
DSA
4.8
6.5 5
Cellular Transaction Time (Seconds)
8 4 2 3 1 0 6 7
©2015 AKAMAI | FASTER FORWARDTM
Avoid data theft and downtime by extending the security perimeter outside the data-center and protect from increasing frequency, scale and sophistication of web attacks.
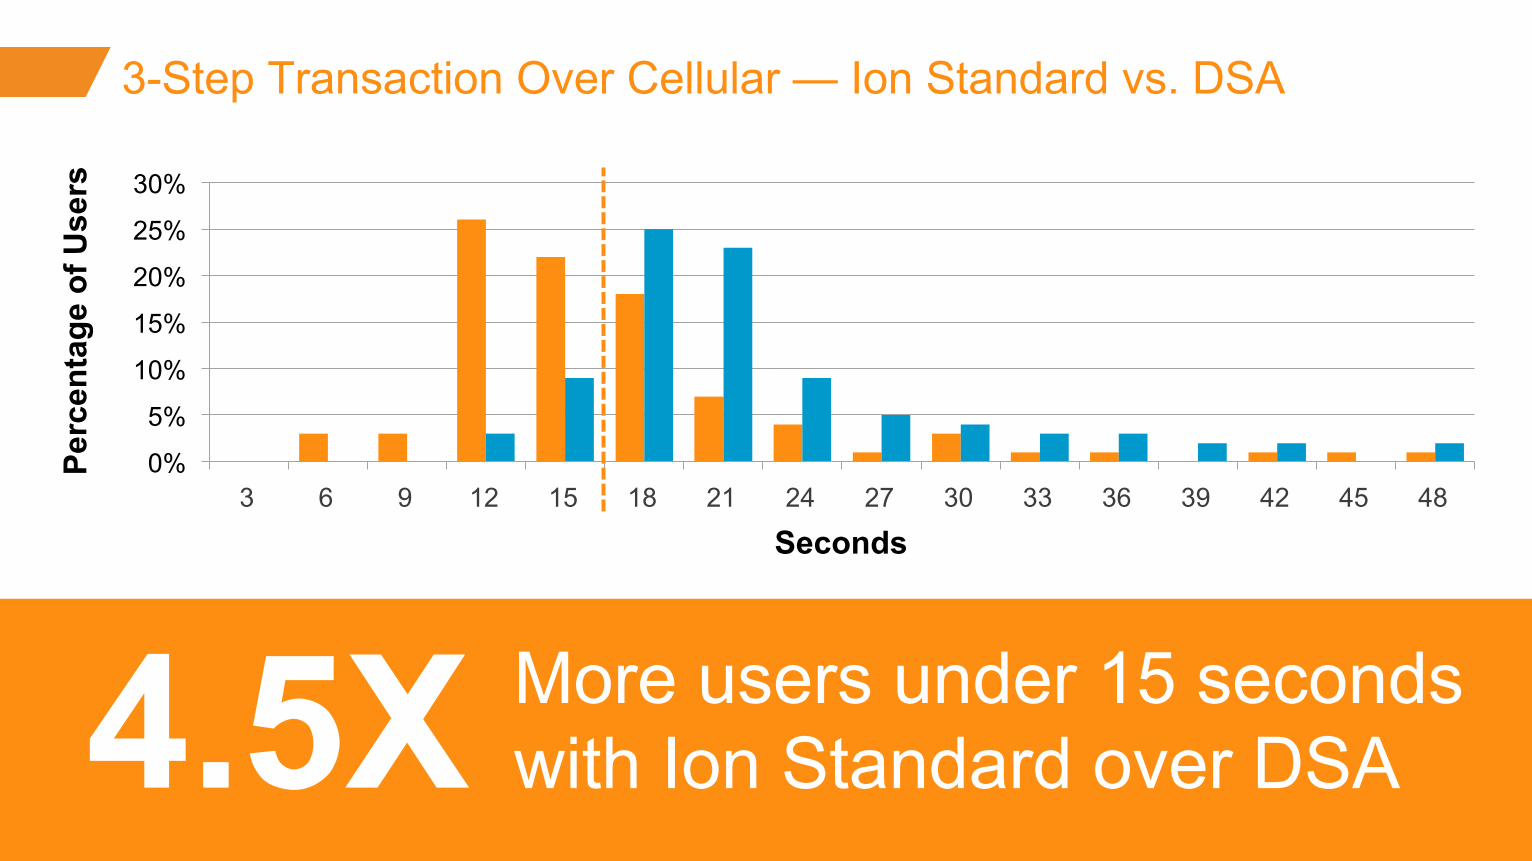
3-Step Transaction Over Cellular — Ion Standard vs. DSA
4.5X More users under 15 seconds with Ion Standard over DSA
0%
5%
10%
15%
20%
25%
30%
1 2 3 4 5 6 7 8 9 10 11 12 13 14 15 16
Seconds
Perc
enta
ge o
f Use
rs
15 12 6 3 9 30 27 21 18 24 33 48 45 39 36 42

©2015 AKAMAI | FASTER FORWARDTM
Avoid data theft and downtime by extending the security perimeter outside the data-center and protect from increasing frequency, scale and sophistication of web attacks.
Cellular Case Study (Retail)
108% Faster than DSA with Ion Premier
Ion Premier
DSA
5.6
11.6 10
Cellular Transaction Time (Seconds) — RUM Data
12 8 4 6 2 0

©2015 AKAMAI | FASTER FORWARDTM
Avoid data theft and downtime by extending the security perimeter outside the data-center and protect from increasing frequency, scale and sophistication of web attacks.
Akamai vs. the Competition: Ion is…
Competitor 1 Origins: NA, APAC
FASTER 71–148%
Competitor 2 Origins: NA, EU
FASTER 30–110%
Competitor 3 Origins: NA
FASTER 49–65%
Competitor 4 Origins: EU, APAC
FASTER 41–91%
more users under 2 seconds with Akamai Ion Premier (cellular) 46X

©2015 AKAMAI | FASTER FORWARDTM
Avoid data theft and downtime by extending the security perimeter outside the data-center and protect from increasing frequency, scale and sophistication of web attacks.
Case Study: Blue Triangle Technologies
Clothing Retailer Specialty Apparel Store
in annual revenue gained by using
Akamai Ion
Major Sporting Goods
$15.6M in annual revenue gained by using
Akamai Ion
$3M increase in
conversion rates by using Akamai DSA
26%

©2015 AKAMAI | FASTER FORWARDTM
The web must be secure
GRAND CHALLENGE FOR SECURITY

©2015 AKAMAI | FASTER FORWARDTM
NOTHING IS SAFE

©2015 AKAMAI | FASTER FORWARDTM
NOTHING IS SAFE

©2015 AKAMAI | FASTER FORWARDTM
Grow revenue opportunities with fast, personalized web experiences and manage complexity from peak demand, mobile devices and data collection.

©2015 AKAMAI | FASTER FORWARDTM

©2015 AKAMAI | FASTER FORWARDTM
10/1 9/30 9/29 9/28 9/27 9/26 9/25 9/24
120,000+
UNIQUE ATTACK PAYLOADS Exploit
Announced

©2015 AKAMAI | FASTER FORWARDTM
Avoid data theft and downtime by extending the security perimeter outside the data-center and protect from increasing frequency, scale and sophistication of web attacks.
Major Attacks on Akamai Customers
Typical Attack Size 10s of Gbps
Attacks are originating from all geographies
and are moving between geographies
during the attack
Large Attack Size 100s of Gbps
14
230
510
Num
ber o
f Atta
cks
2009 2010 2011 2012
800
600
400
200
0
768
2013
1153 1,000
1,200
2014
1274 1,300

©2015 AKAMAI | FASTER FORWARDTM
Traditional Solutions Are Insufficient
Sufficient Capacity
Packet Inspection
Proactive vs. Reactive
Maintain Performance
Data Center Level Defense
Data Center Devices
Carrier Filtering +

©2015 AKAMAI | FASTER FORWARDTM
Avoid data theft and downtime by extending the security perimeter outside the data-center and protect from increasing frequency, scale and sophistication of web attacks.
The Akamai Solution
(Cloud) Data Centers
End User
1
10
100
10000
Origin Traffic
1000
Akamai Traffic
1
10
100
10000
1000
– Kona Site Defender

©2015 AKAMAI | FASTER FORWARDTM
Avoid data theft and downtime by extending the security perimeter outside the data-center and protect from increasing frequency, scale and sophistication of web attacks.
+
The Akamai Solution
(Cloud) Data Centers
End User
1
10
100
10000
Origin Traffic
1000
Akamai Traffic
1
10
100
10000
1000
– Kona Site Defender + PROLEXIC
COVERED

©2015 AKAMAI | FASTER FORWARDTM
LET’S SEE IT LIVE! Stuart Scholly
Senior Vice President and General Manager, Security
(Former President, Prolexic)
Patrick Sullivan Service Line
Manager

©2015 AKAMAI | FASTER FORWARDTM
Grow revenue opportunities with fast, personalized web experiences and manage complexity from peak demand, mobile devices and data collection.
GRAND CHALLENGE FOR ENTERPRISE
Fast, affordable IP access in the workplace and branch office

©2015 AKAMAI | FASTER FORWARDTM
Avoid data theft and downtime by extending the security perimeter outside the data-center and protect from increasing frequency, scale and sophistication of web attacks.
LONG DISTANCE Between branch and web applications
Internet
WAN (MPLS/VPN)
“The Trombone Effect” for MPLS & VPN Branches
Enterprise Data Center
Remote Branch
Cloud Provider
Branch Networks are SLOW
3rd Party Web Sites

©2015 AKAMAI | FASTER FORWARDTM
Avoid data theft and downtime by extending the security perimeter outside the data-center and protect from increasing frequency, scale and sophistication of web attacks.
10-100X increase in capacity needed video, virtual desktops, collaboration tools, digital displays, backup/archiving, catalogue and software downloads, web apps, PowerPoint
Branch Networks are OVERLOADED
Internet
WAN (MPLS/VPN)
“The Trombone Effect” for MPLS & VPN Branches
Enterprise Data Center
Remote Branch
Cloud Provider 3rd Party
Web Sites

©2015 AKAMAI | FASTER FORWARDTM
Avoid data theft and downtime by extending the security perimeter outside the data-center and protect from increasing frequency, scale and sophistication of web attacks.
Akamai is Moving into the Branch
Akamai Functionality:
And everything else the Akamai Intelligent Platform™ does!
• De-Deduplication • Local Caching • Prepositioning of Content • Intelligent Routing • App Acceleration
WAN (MPLS/VPN)
Enterprise Data Center
Remote Branch
Cloud Provider 3rd Party
Web Sites

©2015 AKAMAI | FASTER FORWARDTM
Avoid data theft and downtime by extending the security perimeter outside the data-center and protect from increasing frequency, scale and sophistication of web attacks.
WAN (MPLS/VPN)
Enterprise Data Center
Remote Branch
Cloud Provider 3rd Party
Web Sites
Akamai is Moving into the Branch
• Akamai optimizes bandwidth & speeds up applications on the enterprise WAN
• Akamai optimizes bandwidth & speeds up applications in the cloud
• Akamai offloads the WAN for bandwidth-intensive applications
• Akamai adds quality of service to the enterprise cloud network
• Akamai provides security for the enterprise cloud network
Traffic Prioritization (QoS)
Security
(Cisco with Akamai Connect)
©2015 AKAMAI | FASTER FORWARDTM
Avoid data theft and downtime by extending the security perimeter outside the data-center and protect from increasing frequency, scale and sophistication of web attacks.
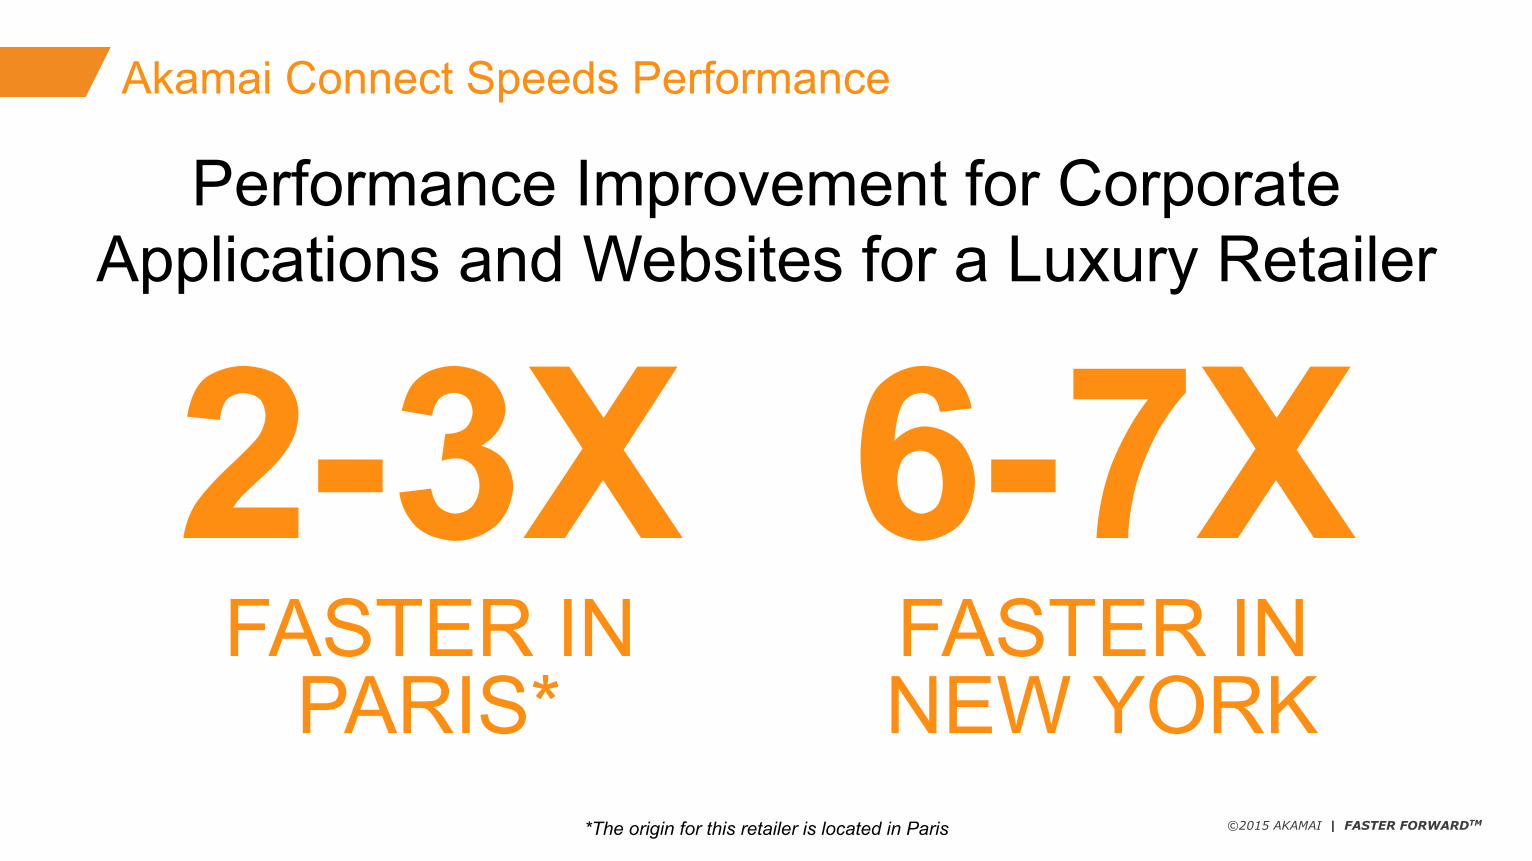
Akamai Connect Speeds Performance
Performance Improvement for Corporate Applications and Websites for a Luxury Retailer
6-7X FASTER IN NEW YORK
2-3X FASTER IN
PARIS* *The origin for this retailer is located in Paris

©2015 AKAMAI | FASTER FORWARDTM
Grow revenue opportunities with fast, personalized web experiences and manage complexity from peak demand, mobile devices and data collection.
Akamai Connect is just the beginning…

©2015 AKAMAI | FASTER FORWARDTM
Grow revenue opportunities with fast, personalized web experiences and manage complexity from peak demand, mobile devices and data collection.
Fast, affordable IP access in the workplace and branch office
The ultimate in video quality over IP at scale
The web must be secure
Instant web performance
for any device, anywhere
GRAND CHALLENGES

The Akamai Platform Dr. Robert Blumofe — EVP, Platform Division

©2015 AKAMAI | FASTER FORWARDTM
Grow revenue opportunities with fast, personalized web experiences and manage complexity from peak demand, mobile devices and data collection.
Fast, affordable IP access in the workplace and branch office
The ultimate in video quality over IP at scale
The web must be secure
Instant web performance
for any device, anywhere
GRAND CHALLENGES

©2015 AKAMAI | FASTER FORWARDTM
Home
Traditional Delivery
Data center
Transit Network
ISP
ISP
ISP
Mobile
Enterprise
1 or more data centers Connect to 1 or more transit providers Connect directly or indirectly to a myriad of ISPs

©2015 AKAMAI | FASTER FORWARDTM
Home
Problems with Traditional Delivery
Data center
ISP
$$
Mobile
Enterprise
Bad for application owners Bad for users Bad for ISPs
Transit Network
ISP
ISP X
$$
$$

©2015 AKAMAI | FASTER FORWARDTM
Data center Home
The Akamai Way
Transit Network
ISP
ISP
ISP
Mobile
Enterprise Bypass middle mile
Directly deployed in a myriad of ISPs

©2015 AKAMAI | FASTER FORWARDTM
ISP
ISP
ISP
Home
Solving Problems the Akamai Way
Mobile
Good for application owners Good for users Good for ISPs
Transit Network
Enterprise
$$
Data center

©2015 AKAMAI | FASTER FORWARDTM
ISP
ISP
ISP
Home
Mobile
Enterprise
Data center
Transit Network
Solving Problems the Akamai Way

©2015 AKAMAI | FASTER FORWARDTM
Defending Against Attacks the Traditional Way
Data center
Transit Network
ISP
ISP
ISP

©2015 AKAMAI | FASTER FORWARDTM
Defending Against Attacks the Traditional Way
Data center
Transit Network
ISP
ISP
ISP

©2015 AKAMAI | FASTER FORWARDTM
ISP
ISP
ISP
Defending Against Attacks the Akamai Way
Transit Network
Data center

©2015 AKAMAI | FASTER FORWARDTM
Grow revenue opportunities with fast, personalized web experiences and manage complexity from peak demand, mobile devices and data collection.
Global Platform with Enormous Scale
2014
1,300+ Networks
100+ Countries 90
1,200 2013
2,700+ Locations 2,300

©2015 AKAMAI | FASTER FORWARDTM
Managing Costs
2009 2014
Traffic Energy Servers

©2015 AKAMAI | FASTER FORWARDTM
Avoid data theft and downtime by extending the security perimeter outside the data-center and protect from increasing frequency, scale and sophistication of web attacks.
Traffic Servers
Ports
Racks
Energy
Server CapEx
Colo COGS
Energy COGS
Bandwidth COGS
Drivers of Cost

©2015 AKAMAI | FASTER FORWARDTM
Grow revenue opportunities with fast, personalized web experiences and manage complexity from peak demand, mobile devices and data collection.
Every line is an OPPORTUNITY for optimization.

©2015 AKAMAI | FASTER FORWARDTM
Avoid data theft and downtime by extending the security perimeter outside the data-center and protect from increasing frequency, scale and sophistication of web attacks.
Server CapEx
Colo COGS
Energy COGS
Bandwidth COGS
Traffic Servers
Ports
Racks
Energy
Opportunities for Optimization
Colo migration
Metered power buying
Server CapEx
Colo COGS
Energy COGS
Bandwidth COGS
Servers
Ports
Racks
Energy
Vendor management
ISP partnerships
Port optimization
Deployment optimization
Power optimization
Hardware and software optimization
Port optimization

©2015 AKAMAI | FASTER FORWARDTM
Avoid data theft and downtime by extending the security perimeter outside the data-center and protect from increasing frequency, scale and sophistication of web attacks.
Transit Network
Traditional Traffic Redirection Via BGP
Course-grain decisions Slow to change Little control
Data center
Data center

©2015 AKAMAI | FASTER FORWARDTM
Avoid data theft and downtime by extending the security perimeter outside the data-center and protect from increasing frequency, scale and sophistication of web attacks.
Transit Network
Akamai Traffic Redirection Via Mapper
Fine-grain decisions Rapid response Highly controllable
Data center
Data center

©2015 AKAMAI | FASTER FORWARDTM
Grow revenue opportunities with fast, personalized web experiences and manage complexity from peak demand, mobile devices and data collection.
Traffic Redirection the Akamai Way
• Understands latency and loss
• Monitors capacity • Gracefully deals with down
nodes or links • Highly flexible and extendable • Can prioritize different traffic types • Is aware of contractual details

©2015 AKAMAI | FASTER FORWARDTM
Grow revenue opportunities with fast, personalized web experiences and manage complexity from peak demand, mobile devices and data collection.
Why is this so Hard to Replicate?
• Deep network relationships • Hardware efficiency • Software innovation • Global request routing, failover, load balancing • Global system management • Multiple use cases

©2015 AKAMAI | FASTER FORWARDTM
Grow revenue opportunities with fast, personalized web experiences and manage complexity from peak demand, mobile devices and data collection.
SUMMARY A global platform with enormous scale
Opportunity for continued cost savings through optimization
Distributed architecture provides competitive advantage

©2015 AKAMAI | FASTER FORWARDTM
Grow revenue opportunities with fast, personalized web experiences and manage complexity from peak demand, mobile devices and data collection.
QUESTIONS? Please raise your hand & wait for microphone

©2014 AKAMAI | FASTER FORWARDTM
10-MIN
BREAK WiFi Name: Hyatt Meeting

©2015 AKAMAI | FASTER FORWARDTM
Product Vision & Strategy Rick McConnell — President, Products & Development

©2015 AKAMAI | FASTER FORWARDTM
Grow revenue opportunities with fast, personalized web experiences and manage complexity from peak demand, mobile devices and data collection.
Ion Standard & Cloudlets
Akamai Connect
Growth in Traffic
2014 YEAR IN REVIEW Emerging Mobile BU
Integrated Prolexic
New Carrier Partnerships

©2015 AKAMAI | FASTER FORWARDTM
Grow revenue opportunities with fast, personalized web experiences and manage complexity from peak demand, mobile devices and data collection.
OUR VISION To transform experiences in a hyperconnected world

©2015 AKAMAI | FASTER FORWARDTM
Grow revenue opportunities with fast, personalized web experiences and manage complexity from peak demand, mobile devices and data collection.
GLOBALIZATION Akamai
Everywhere
SIMPLIFICATION It’s Your Akamai
INNOVATION Any Experience, Any Device,
Anywhere
Carrier & Mobile Networks Inside the Enterprise & Home
On & In the Device
Luna User Experience Property Manager
Open APIs
Instant to Any Device Media Quality at Scale
Cloud Security & Networking

©2015 AKAMAI | FASTER FORWARDTM
Grow revenue opportunities with fast, personalized web experiences and manage complexity from peak demand, mobile devices and data collection.
Globalization
Development Centers Of Excellence
Cambridge, MA Westford, MA Web, Media, Cloud Networking, Security, Carrier, Portal
Ottawa, Canada Web
Santa Clara, CA San Francisco, CA Web, Media, Cloud Networking, Security, Portal
San Diego, CA Pasadena, CA Media Fort Lauderdale, FL
Security
Israel Web, Security, Cloud Networking
India Cloud Networking, Media, Portal, Security
Prague Media
Poland Portal
DEVELOPER HEADCOUNT INCREASED BY 30%

©2015 AKAMAI | FASTER FORWARDTM
Grow revenue opportunities with fast, personalized web experiences and manage complexity from peak demand, mobile devices and data collection. Carriers | Enterprises | Homes | Devices
Extending the Akamai Edge

©2015 AKAMAI | FASTER FORWARDTM
Grow revenue opportunities with fast, personalized web experiences and manage complexity from peak demand, mobile devices and data collection.
Simplified Product Catalog
Simpler for Partners: NAP 2.0
Easier to Sell, Price, Bundle
Simplification 70%+ REDUCTION IN SKUS
©2015 AKAMAI | FASTER FORWARDTM
Grow revenue opportunities with fast, personalized web experiences and manage complexity from peak demand, mobile devices and data collection.
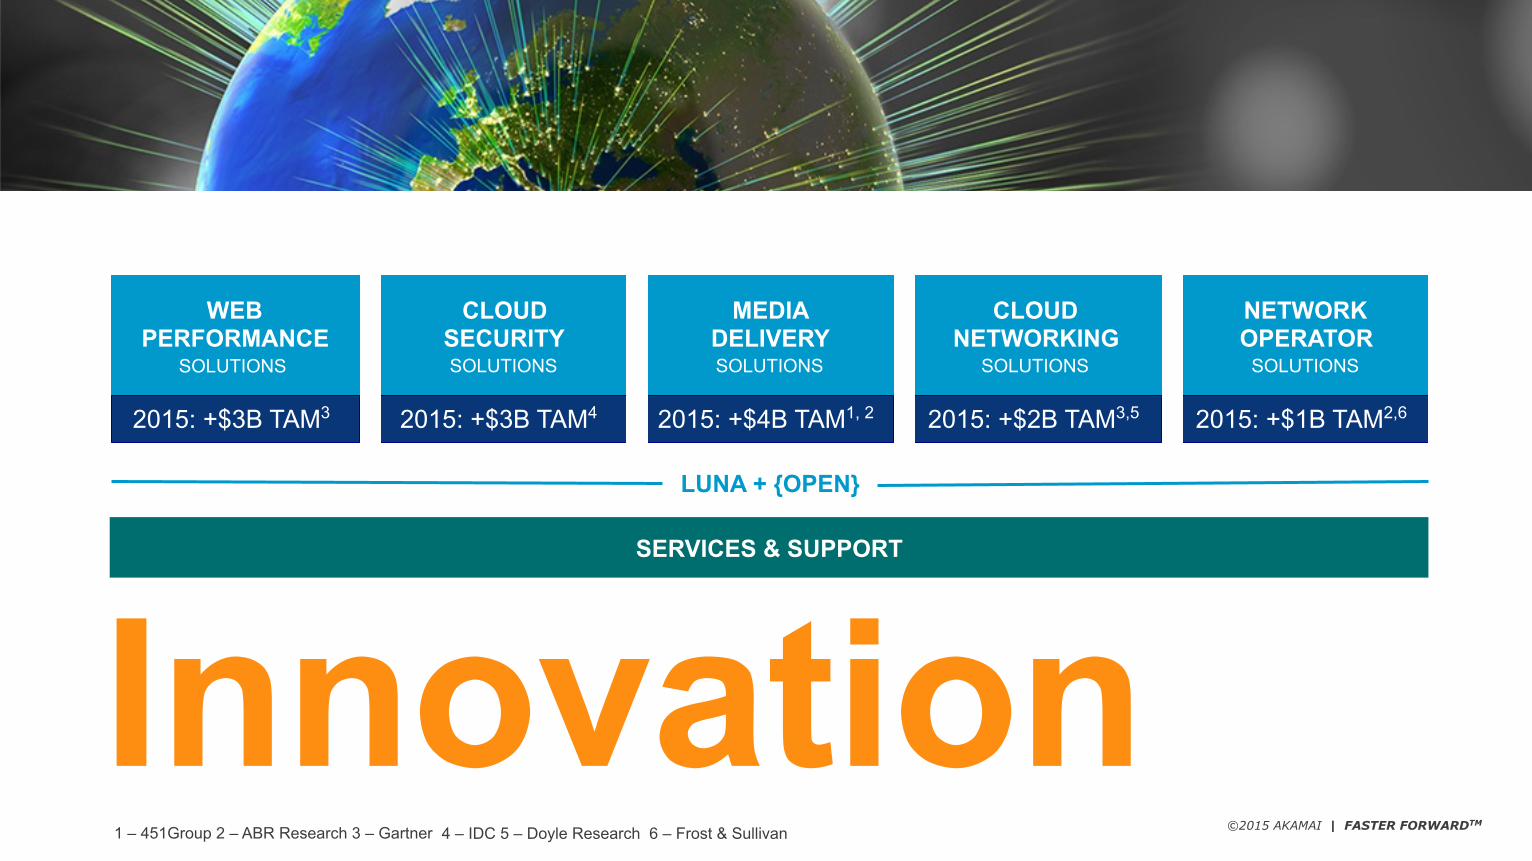
SERVICES & SUPPORT
LUNA + {OPEN}
Innovation 4 – IDC 5 – Doyle Research 6 – Frost & Sullivan 1 – 451Group 2 – ABR Research 3 – Gartner
WEB PERFORMANCE
SOLUTIONS
CLOUD SECURITY SOLUTIONS
MEDIA DELIVERY SOLUTIONS
CLOUD NETWORKING
SOLUTIONS
NETWORK OPERATOR
SOLUTIONS
2015: +$4B TAM1, 2 2015: +$3B TAM4 2015: +$3B TAM3 2015: +$2B TAM3,5 2015: +$1B TAM2,6

©2015 AKAMAI | FASTER FORWARDTM
Grow revenue opportunities with fast, personalized web experiences and manage complexity from peak demand, mobile devices and data collection.
Accelerating to Instant: Fastest over Desktop Broadband Fastest over Cellular Fastest over Tablet Wifi
Beyond Performance:
Web Performance
Open APIs Products: Cloudlets & Image Management

©2015 AKAMAI | FASTER FORWARDTM
Grow revenue opportunities with fast, personalized web experiences and manage complexity from peak demand, mobile devices and data collection.
Ion Premier Maximum Performance
Ion Standard Industry Leading Performance
DSA Dynamic Acceleration
Performance Driven
Price Driven
China CDN (Now) Cloudlets (New) Saas Provider Option (New) Image Management (Q3)
Web Performance

©2015 AKAMAI | FASTER FORWARDTM
Responsive Web Design (a.k.a. "RWD")
• Magento 1.9 • RWD Skin • Sample Data
Desktop Mobile (LTE)

©2015 AKAMAI | FASTER FORWARDTM
RWD with Ion Premier + Image Converter + Design for Performance
• RESS Design • Device
Characteristics • Image Converter • FEO Premier • Fast DNS • Adaptive Image
Compression • Dynamic Page
Caching 73% improvement Origin: 6.7s
80% improvement Origin: 9.0s

©2015 AKAMAI | FASTER FORWARDTM
Grow revenue opportunities with fast, personalized web experiences and manage complexity from peak demand, mobile devices and data collection.
COMPREHENSIVE SECURITY Kona + Prolexic People + Products
THREAT INTELLIGENCE Client Reputation Bot Management
Cloud Security

©2015 AKAMAI | FASTER FORWARDTM
Grow revenue opportunities with fast, personalized web experiences and manage complexity from peak demand, mobile devices and data collection.
Kona Site Defender (Managed) Integrated DDoS & WAF
Kona Site Defender (Self-Service) Integrated DDoS & WAF
Kona DDoS Defender DDoS, some managed
Price Driven
Prolexic Routed DDoS, fully managed multi-protocol
Client Reputation (Q1) Private Origin (H2) Bot Management (H2)
Cloud Security

©2015 AKAMAI | FASTER FORWARDTM
Grow revenue opportunities with fast, personalized web experiences and manage complexity from peak demand, mobile devices and data collection.
Number of DDoS Attacks PROTECTED
2010 2011 2012 2013 2014
991
Average: 13 Gbps Max: 320 Gbps
1317
2002
2936
4316
Add Client Reputation TO PROTECT AGAINST REPEAT ATTACKERS

©2015 AKAMAI | FASTER FORWARDTM
Grow revenue opportunities with fast, personalized web experiences and manage complexity from peak demand, mobile devices and data collection.
QUALITY AT SCALE Delivering the highest quality Economies of scale Distributed cloud storage
SIMPLICITY OF WORKFLOW Live and on demand media services One asset, all devices QoS and audience analytics
Media Delivery

©2015 AKAMAI | FASTER FORWARDTM
Grow revenue opportunities with fast, personalized web experiences and manage complexity from peak demand, mobile devices and data collection.
Media Analytics NetStorage
ANALYZE
Media Services Live & On-Demand
STORE DELIVER PREPARE
Adaptive Media Delivery – video
Download Delivery – software Object Delivery – small objects Dynamic Site Delivery – web sites
Media Delivery

©2015 AKAMAI | FASTER FORWARDTM
Grow revenue opportunities with fast, personalized web experiences and manage complexity from peak demand, mobile devices and data collection.
Today’s Peak is Tomorrow’s Normal
8X MORE TRAFFIC THAN WORLD CUP 2010
HUGE AUDIENCES 5.3 million unique online viewers for Belgium/USA in the USA ALONE
HIGH ENGAGEMENT 47.8 average online minutes viewed for Germany vs Portugal on WatchESPN
220PB

©2015 AKAMAI | FASTER FORWARDTM
Grow revenue opportunities with fast, personalized web experiences and manage complexity from peak demand, mobile devices and data collection.
BRANCH OF TODAY WAN performance and offload Integrated solution
BRANCH OF THE FUTURE Akamai for WAN transport Next Generation Enterprise Network
Cisco Intelligent WAN with Akamai Connect
Cloud Networking

©2015 AKAMAI | FASTER FORWARDTM
Grow revenue opportunities with fast, personalized web experiences and manage complexity from peak demand, mobile devices and data collection.
Optimize Network Traffic, Enable New Revenue Streams & Control Costs
Akamai Interconnect
Managed Operator CDN suite to deploy a highly scalable,
turnkey CDN
Aura Managed CDN Licensed suite of Operator CDN
solutions to enable next generation IP video services delivered to any device
Aura Licensed CDN
Akamai Platform
Network Operator: Carrier Products

©2015 AKAMAI | FASTER FORWARDTM
62% of configuration pushes now done by customers
©2015 AKAMAI | FASTER FORWARDTM
Grow revenue opportunities with fast, personalized web experiences and manage complexity from peak demand, mobile devices and data collection.
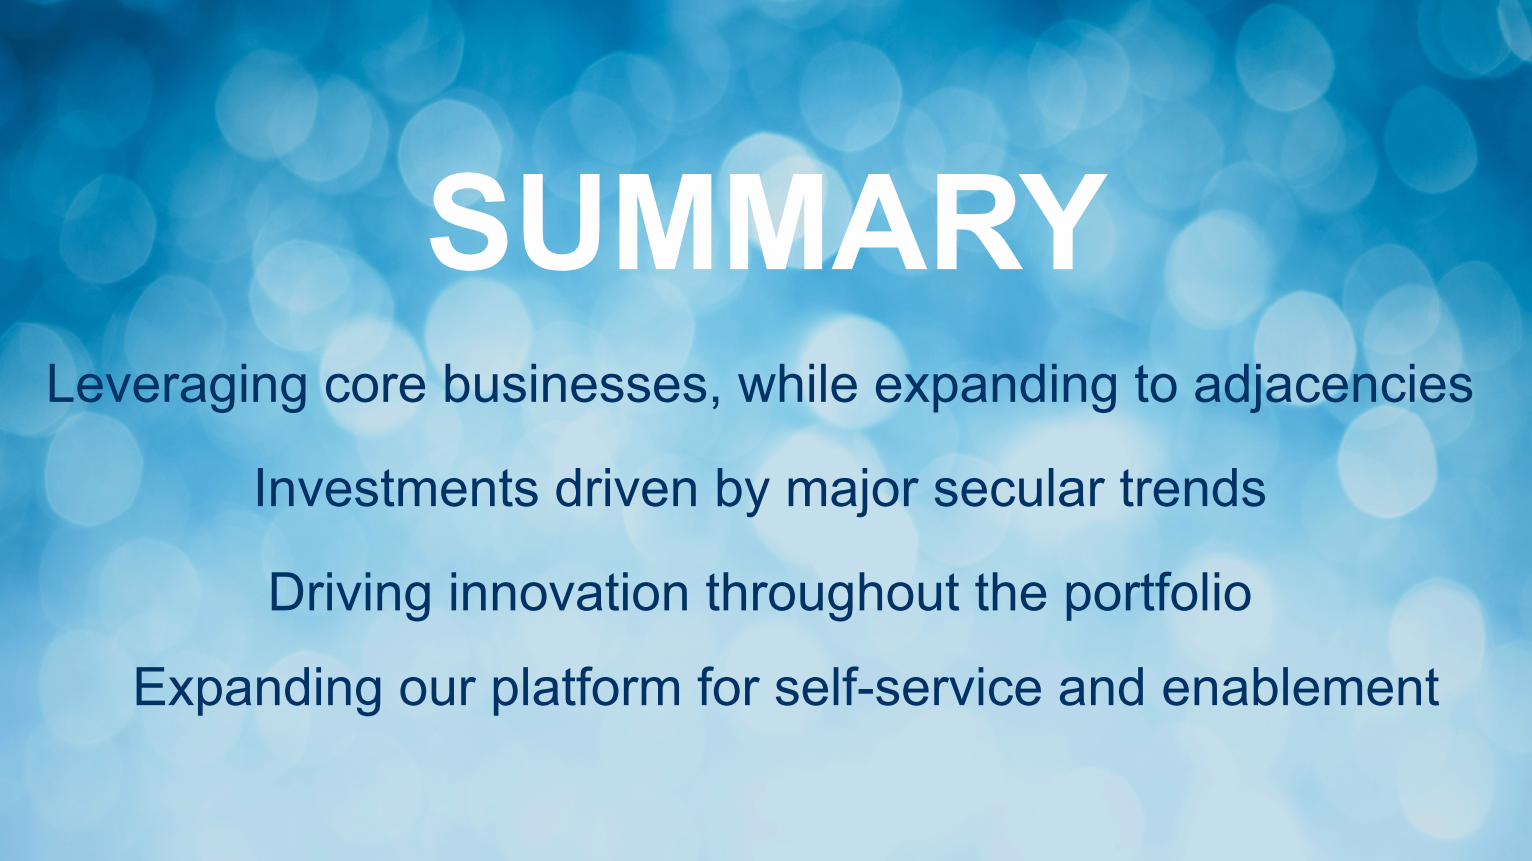
SUMMARY Leveraging core businesses, while expanding to adjacencies
Investments driven by major secular trends
Driving innovation throughout the portfolio
Expanding our platform for self-service and enablement

Go-to-Market Strategy Bob Hughes — President, Worldwide Operations

©2015 AKAMAI | FASTER FORWARDTM
Grow revenue opportunities with fast, personalized web experiences and manage complexity from peak demand, mobile devices and data collection.
PRODUCTS Upsell installed base & new customers
MARKETS New verticals & global expansion
SALES CAPACITY Direct & indirect
2014 CORE
GROWTH DRIVERS

©2015 AKAMAI | FASTER FORWARDTM
Grow revenue opportunities with fast, personalized web experiences and manage complexity from peak demand, mobile devices and data collection.
Achieved hiring plan
New rep & partner productivity improving
Over delivered on revenue plan
Strong growth across all solution categories/geographies
2014 RESULTS

©2015 AKAMAI | FASTER FORWARDTM
Grow revenue opportunities with fast, personalized web experiences and manage complexity from peak demand, mobile devices and data collection.
PRODUCTS Significant opportunity to go deep & wide
MARKETS Focus on target verticals & global expansion
SALES CAPACITY Continued investment in direct, indirect, enablement & specialization
2015 CORE
GROWTH DRIVERS

©2015 AKAMAI | FASTER FORWARDTM
Grow revenue opportunities with fast, personalized web experiences and manage complexity from peak demand, mobile devices and data collection.
Drivers of Revenue Growth
Right customers, maximize share of traffic
media delivery
Traffic Upsell installed base &
penetrate new customers
performance & security
Transactions
Direct, Indirect, Specialization Sales Capacity
SERVICES & SUPPORT

©2015 AKAMAI | FASTER FORWARDTM
Grow revenue opportunities with fast, personalized web experiences and manage complexity from peak demand, mobile devices and data collection.
Supporting Investments in Sales Enablement
Onboarding/product training Partner enablement Sales specialists Forecasting tools Marketing automation Supporting GTM resources Intelligent territory assignment

©2015 AKAMAI | FASTER FORWARDTM
SALES VOLUME
SALES VOLUME BY GEO
HEADQUARTERS
OR SUBSIDIARY DIVISION
EMPLOYEES EMPLOYEES
BY GEO
INDUSTRY
AKAMAI NETWORK TRAFFIC
PRIVATE
OR PUBLIC
33,000 COMPANIES TO GO AFTER GLOBALLY

©2015 AKAMAI | FASTER FORWARDTM
Significant Opportunity to go WIDE with New Customers
Fortune 500: Largest 500 corporations in the U.S. by revenue (2014) Fortune Global 1000: Largest 1000 global corporations by revenue (2014)
of Fortune 500 (U.S.) are customers today
48% of Fortune Global 1000
are customers today
38%

©2015 AKAMAI | FASTER FORWARDTM
Avoid data theft and downtime by extending the security perimeter outside the data-center and protect from increasing frequency, scale and sophistication of web attacks.
Significant Opportunity to go DEEP within the Install Base
buy only 1 solution
44% buy
security
30% buy
services
27%

©2015 AKAMAI | FASTER FORWARDTM
Services & Support Continues to Drive Installed Base Adoption
Product Adoption Revenue Growth
reduced churn rate
Customer Loyalty
50% higher MRR
2.4x more likely to upgrade
1.5x

©2015 AKAMAI | FASTER FORWARDTM
Avoid data theft and downtime by extending the security perimeter outside the data-center and protect from increasing frequency, scale and sophistication of web attacks.
Leveraging Over 400 Partners to Extend Global Footprint
Performance Partners Media Partners Tech./OEM Partners Carrier Partners
global
regional

©2015 AKAMAI | FASTER FORWARDTM
2013
2014
Strategic Carrier Partnerships
+86% Carrier Reseller Revenue Growth

©2015 AKAMAI | FASTER FORWARDTM
Grow revenue opportunities with fast, personalized web experiences and manage complexity from peak demand, mobile devices and data collection.
customers spending over $1M annually
359

©2015 AKAMAI | FASTER FORWARDTM
Grow revenue opportunities with fast, personalized web experiences and manage complexity from peak demand, mobile devices and data collection.
SUMMARY Continued focus on deep & wide
Secular trends in our favor
Portfolio provides a complete solution

©2015 AKAMAI | FASTER FORWARDTM
10-MIN
BREAK WiFi Name: Hyatt Meeting

Financial Update Jim Benson — EVP and Chief Financial Officer

©2015 AKAMAI | FASTER FORWARDTM
Grow revenue opportunities with fast, personalized web experiences and manage complexity from peak demand, mobile devices and data collection.
2014 Year In Review
Solution Category Review
Looking Forward
AGENDA

©2015 AKAMAI | FASTER FORWARDTM
Grow revenue opportunities with fast, personalized web experiences and manage complexity from peak demand, mobile devices and data collection.
2014 Year In Review
Solution Category Review
Looking Forward
AGENDA

©2015 AKAMAI | FASTER FORWARDTM
2012 2013 2014
($MM / % revenue)
Adjusted EBITDA
44% 43%
45% $697
$853
$615
(1)Revenue growth rates exclude the impact of foreign currency exchange rate changes and revenue from our divested ADS business.
Refer to the Appendix for definitions of our non-GAAP metrics and a reconciliation to the closest GAAP metric.
2012 2013 2014
($MM / Y/Y % growth1)
Revenue
20%
25%
20%
$1,578
$1,964
$1,374
2012 2013 2014
($MM / % revenue)
Operational Free Cash Flow
28% 26%
29%
$439 $513
$395
2014: Another Year of Strong Operational Execution

©2015 AKAMAI | FASTER FORWARDTM
2012 2013 2014
($MM / Y/Y % growth1)
Performance & Security
19%
28%
23% $691
$879
$584
(1)Revenue growth rates exclude the impact of foreign currency exchange rate changes and revenue from our divested ADS business.
Continued Strong Revenue Growth Across All Solutions
2012 2013 2014
($MM / Y/Y % growth1)
Services & Support
38%
36%
37% $128
$173
$94
2012 2013 2014
($MM / Y/Y % growth1)
Media Delivery
17% 21%
17% $757
$912
$653

©2015 AKAMAI | FASTER FORWARDTM
($MM / Y/Y% of growth1)
U.S. Revenue
2012 2013 2014
19%
25%
21% $1,142
$1,432
$960
($MM / Y/Y% of growth1)
International Revenue
2012 2013 2014
22% 25%
21%
$252 $304
$216
32% Y/Y APJ
20% Y/Y
EMEA
$181 $228
$153
Continued Strong Revenue Growth Across All Theaters
(1)Revenue growth rates exclude the impact of foreign currency exchange rate changes and revenue from our divested ADS business.

©2015 AKAMAI | FASTER FORWARDTM
($MM / Y/Y% of growth1)
Direct
2012 2013 2014
19%
19%
17% $1,249
$1,477
$1,053
($MM / Y/Y% of growth1)
Indirect
2012 2013 2014
19% 49%
26% $327
$487
$277
Continued Strong Revenue Growth Across All Channels
(1)Revenue growth rates exclude the impact of foreign currency exchange rate changes and revenue from our divested ADS business.

©2015 AKAMAI | FASTER FORWARDTM
Third Consecutive Year of Gross Margin Expansion
Refer to the Appendix for definitions of our non-GAAP metrics and a reconciliation to the closest GAAP metric.
Continued Network Scaling Through: • Hardware optimization • Software innovation • Deeper network relationships
2011
73.2%
2012
74.1%
2013
76.9%
2014
78.4%
Cash Gross Margins (% of Revenue)
©2015 AKAMAI | FASTER FORWARDTM
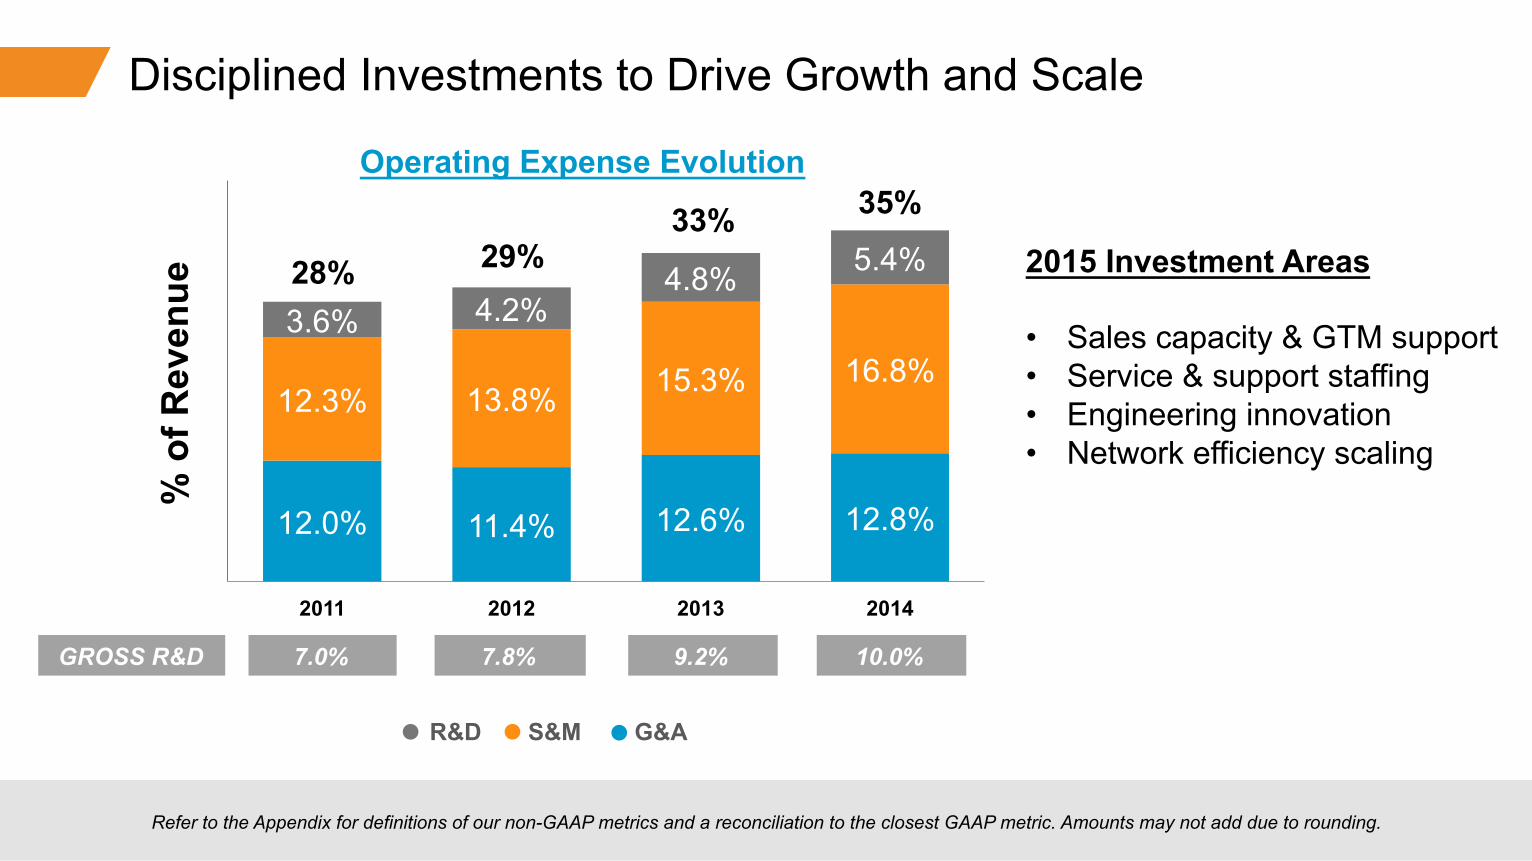
12.0% 11.4% 12.6% 12.8%
12.3% 13.8% 15.3% 16.8% 3.6% 4.2%
4.8% 5.4% 28% 29% 33% 35%
2011 2012 2013 2014
% o
f Rev
enue
R&D S&M G&A
Operating Expense Evolution
9.2% 7.8% 7.0% GROSS R&D 10.0%
Disciplined Investments to Drive Growth and Scale
Refer to the Appendix for definitions of our non-GAAP metrics and a reconciliation to the closest GAAP metric. Amounts may not add due to rounding.
2015 Investment Areas • Sales capacity & GTM support • Service & support staffing • Engineering innovation • Network efficiency scaling

©2015 AKAMAI | FASTER FORWARDTM
12.0% 11.4% 12.6% 12.8%
12.3% 13.8% 15.3% 16.8% 3.6% 4.2%
4.8% 5.4% 28% 29% 33% 35%
2011 2012 2013 2014
% o
f Rev
enue
R&D S&M G&A
Operating Expense Evolution
9.2% 7.8% 7.0% GROSS R&D 10.0%
Disciplined Investments to Drive Growth and Scale
4.9%
7.7%
4.5%
6.9%
Infrastructure Global Functions
5.0%
7.8%
4.8%
7.3%
Refer to the Appendix for definitions of our non-GAAP metrics and a reconciliation to the closest GAAP metric. Amounts may not add due to rounding.
2015 Investment Areas • Sales capacity & GTM support • Service & support staffing • Engineering innovation • Network efficiency scaling • Infrastructure scaling

©2015 AKAMAI | FASTER FORWARDTM
Capex Profile Shifting More to R&D Innovation
10.0% 8.3% 8.0%
3.9% 4.8% 5.9%
2.0% 3.3% 3.4% 16% 16% 17%
2012 2013 2014
% o
f Rev
enue
Capital Expenditure Evolution
Facilities/IT/Other
Capitalized Software Development Network
2015 Capex Drivers: • Capitalized software
• R&D hiring • Accelerating
innovation pipeline • Real estate build-out • IT infrastructure
Refer to the Appendix for definitions of our non-GAAP metrics and a reconciliation to the closest GAAP metric. Amounts may not add due to rounding.
©2015 AKAMAI | FASTER FORWARDTM
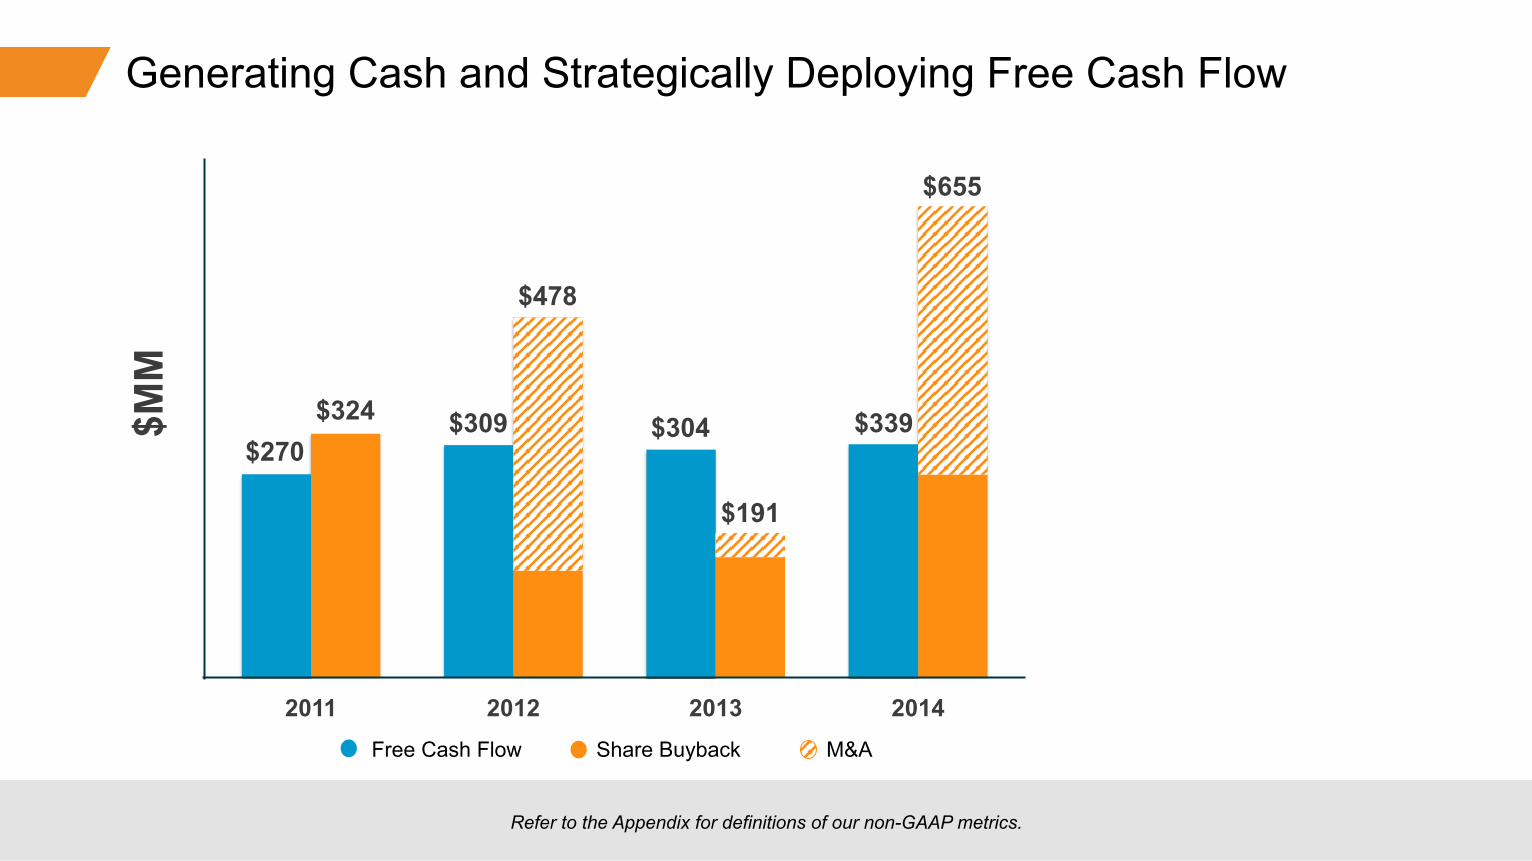
0
100
200
300
400
500
600
700
2011 2012 2013 2014 Axis Title
$478
$309 $324 $270
$304
$191
$339
$655
Generating Cash and Strategically Deploying Free Cash Flow
$MM
Refer to the Appendix for definitions of our non-GAAP metrics.
Free Cash Flow Share Buyback M&A
©2015 AKAMAI | FASTER FORWARDTM
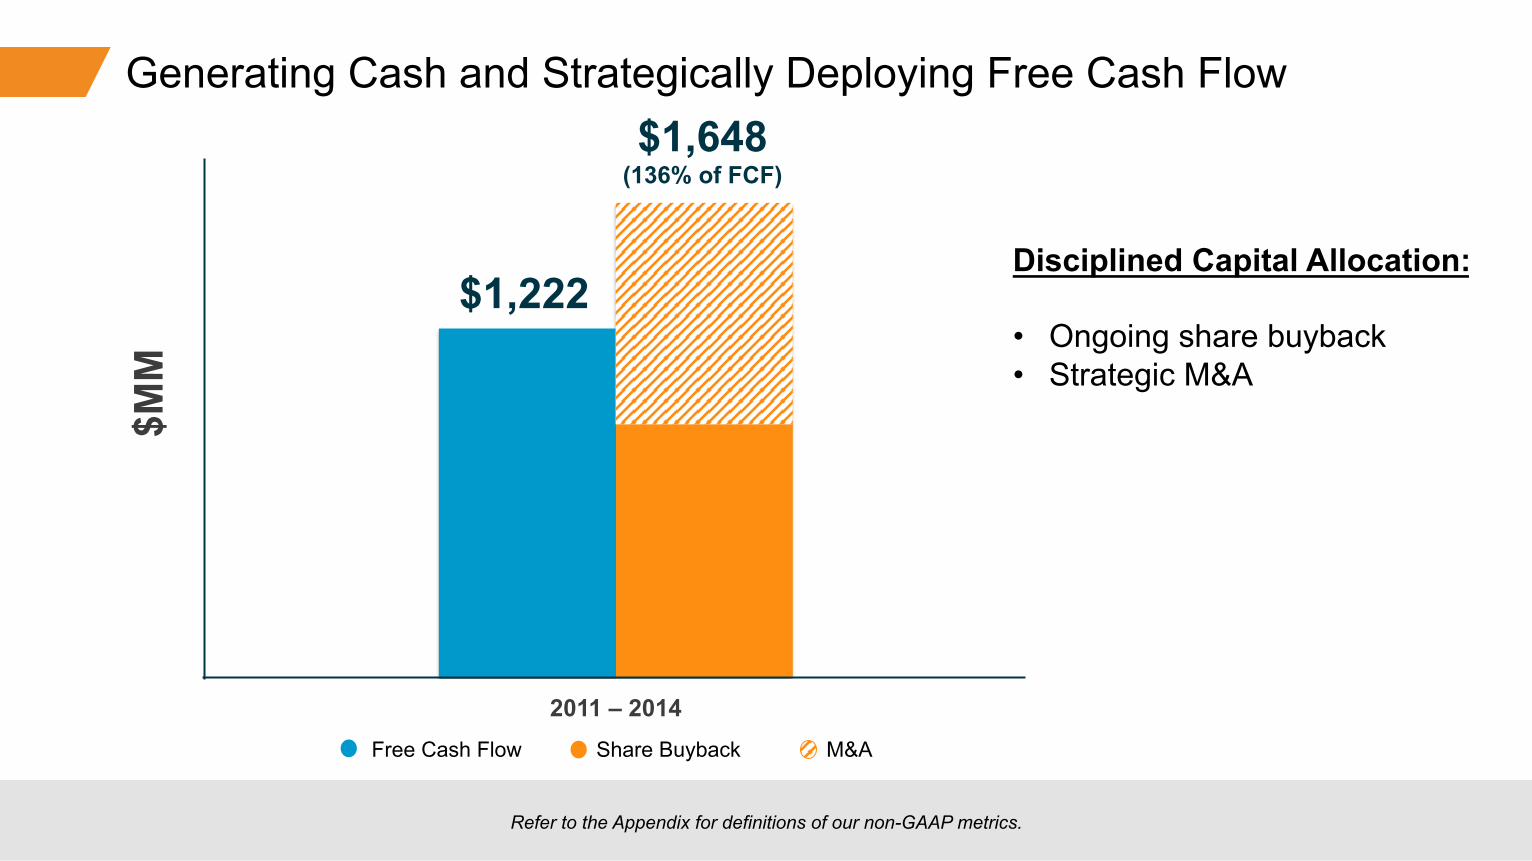
0
200
400
600
800
1000
1200
1400
1600
1800
2011 – 2014 Axis Title
$1,222
$1,648 (136% of FCF)
Generating Cash and Strategically Deploying Free Cash Flow
Disciplined Capital Allocation: • Ongoing share buyback • Strategic M&A
$MM
Refer to the Appendix for definitions of our non-GAAP metrics.
Free Cash Flow Share Buyback M&A

©2015 AKAMAI | FASTER FORWARDTM
Grow revenue opportunities with fast, personalized web experiences and manage complexity from peak demand, mobile devices and data collection.
AGENDA
2014 Year In Review
Solution Category Review
Looking Forward

©2015 AKAMAI | FASTER FORWARDTM
2012 2013 2014
($MM / Y/Y % growth1)
Performance & Security
19%
28%
23% $691
$879
$584
2012 2013 2014
($MM / Y/Y % growth1)
Services & Support
38%
36%
37% $128
$173
$94
2012 2013 2014
($MM / Y/Y % growth1)
Media Delivery
17% 21%
17% $757
$912
$653
9%
46% 45%
Services & Support Performance & Security Media Delivery
9%
46% 45%
Services & Support Performance & Security Media Delivery
Akamai Solution Portfolio Review
Performance & Security
Established • Web Performance • Custom Government Emerging • Cloud Security • Network Operator • Cloud Networking
Services & Support
• Support Services • Professional Services
Media Delivery
Delivery • Video, Software, Site Workflow • Media Services

©2015 AKAMAI | FASTER FORWARDTM
46% 45%
2014 Revenue Highlights • Revenue $912M
• 21% Y/Y growth(1) • 46% of total revenue
• Strong traffic growth (accelerating through the year) • Especially among largest, most strategic customers
• Pricing environment remains highly competitive • Price declines within historic norms
• ARPU ~$22K (up from $19K) 2015 Business Drivers • Online adoption of video, social media,
gaming & software downloads • Cost reduction, quality, reliability & scale
Services & Support
Performance & Security
Media Delivery
Performance & Security Services & Support Media Delivery
(1)Revenue growth rates exclude the impact of foreign currency exchange rate changes.
9%
Media Delivery Solutions

©2015 AKAMAI | FASTER FORWARDTM
Cash GMs
Cash Opex
Adj. EBITDA
Capex
Operational FCF
2014 P&L*
72%
22%
50%
19%
31%
Y/Y Δ
*expressed as % of revenue (estimated)
Performance & Security Services & Support Media Delivery
Investment Areas: • Scale, quality, reliability,
cost, end-to-end workflow • Next generation delivery
platform
% of Total Revenue: 46% 2014 Revenue: $912M Y/Y Growth: 21%(1)
Target Model
Low 70s
Low 20s
High 40s
High Teens
High 20s / Low 30s
Refer to the Appendix for definitions of our non-GAAP metrics. (1)Revenue growth rates exclude the impact of foreign currency exchange rate changes.
Financial Model Update: Media Delivery Solutions

©2015 AKAMAI | FASTER FORWARDTM
Performance & Security Solutions (Established & Emerging)
Product Categories Established
• Web Performance • Custom Government
Emerging • Cloud Security • Network Operator • Cloud Networking
46%
Services & Support
Performance & Security
Media Delivery
Performance & Security Services & Support Media Delivery
37%
Emerging
Established
8% 9%

©2015 AKAMAI | FASTER FORWARDTM
Established: Web Performance Solutions
2014 Revenue Highlights • Revenue: $688M
• 15% Y/Y growth(1) • 36% of total revenue
• Base penetration: 51% of total customers • Multi-product penetration: 17% • ARPU ~$22K (up from $20K) 2015 Business Drivers • Cloud computing and
eCommerce megatrends • Mobile adoption
46% 44%
Services & Support
Performance & Security
Media Delivery
Performance & Security Services & Support Media Delivery
37% Established
9%
(1)Revenue growth rates exclude the impact of foreign currency exchange rate changes.
8%

©2015 AKAMAI | FASTER FORWARDTM
2014 Revenue Highlights • Revenue: $26M
• -9% Y/Y growth(1) • Innovation engine
• Funded new product development 2015 Business Drivers • Government needs to solve challenges for:
• Performance • Security • Scalability
Performance & Security Services & Support Media Delivery
(1)Revenue growth rates exclude the impact of foreign currency exchange rate changes.
Established: Custom Government Solutions
46% 44%
Services & Support
Performance & Security
Media Delivery
37% Established
9% 8%

©2015 AKAMAI | FASTER FORWARDTM
2014 Revenue Highlights • Revenue: $146M
• 191% Y/Y growth(1) • 7% of total revenue (and growing)
• Fastest growing solution in Akamai • Base penetration: 30% of total customers • ARPU ~$10K (up from $7K)
• KSD and Prolexic ARPU ~$13K
2015 Business Drivers • Data and assets moving to the cloud • Attack frequency & sophistication • Enhanced portfolio & capabilities
Performance & Security Services & Support Media Delivery
(1)Revenue growth rates exclude the impact of foreign currency exchange rate changes.
46%
Services & Support
Performance & Security
Media Delivery
37% Established
Emerging
9%
Emerging: Cloud Security Solutions
8%

©2015 AKAMAI | FASTER FORWARDTM
2014 Revenue Highlights • Revenue: $17M
• 76% Y/Y growth(1) • Traction in strategic carrier partnerships:
• Deeper network deployments • Improved carrier quality & costs • Akamai cost savings
• Fastest growing reseller channel (86% Y/Y) • Managed and licensed software sale
2015 Business Drivers • Carrier efforts to reduce cost & monetize traffic • Migration of video to IP
Performance & Security Services & Support Media Delivery
(1)Revenue growth rates exclude the impact of foreign currency exchange rate changes.
Emerging: Network Operator Solutions
46%
Services & Support
Performance & Security
Media Delivery
37% Established
Emerging
9% 8%

©2015 AKAMAI | FASTER FORWARDTM
2014 Revenue Highlights • Revenue: $1M • Cisco partnership launch (still early) • R&D Innovation
• Significant performance improvements 2015 Business Drivers • SaaS and IaaS breaking traditional networks • Lack of bandwidth to the branch inhibits innovation • Current network cost prohibits growth • Agile IT requires and agile network
Performance & Security Services & Support Media Delivery
Emerging: Cloud Networking Solutions
46%
Services & Support
Performance & Security
Media Delivery
37% Established
Emerging
9% 8%
©2015 AKAMAI | FASTER FORWARDTM
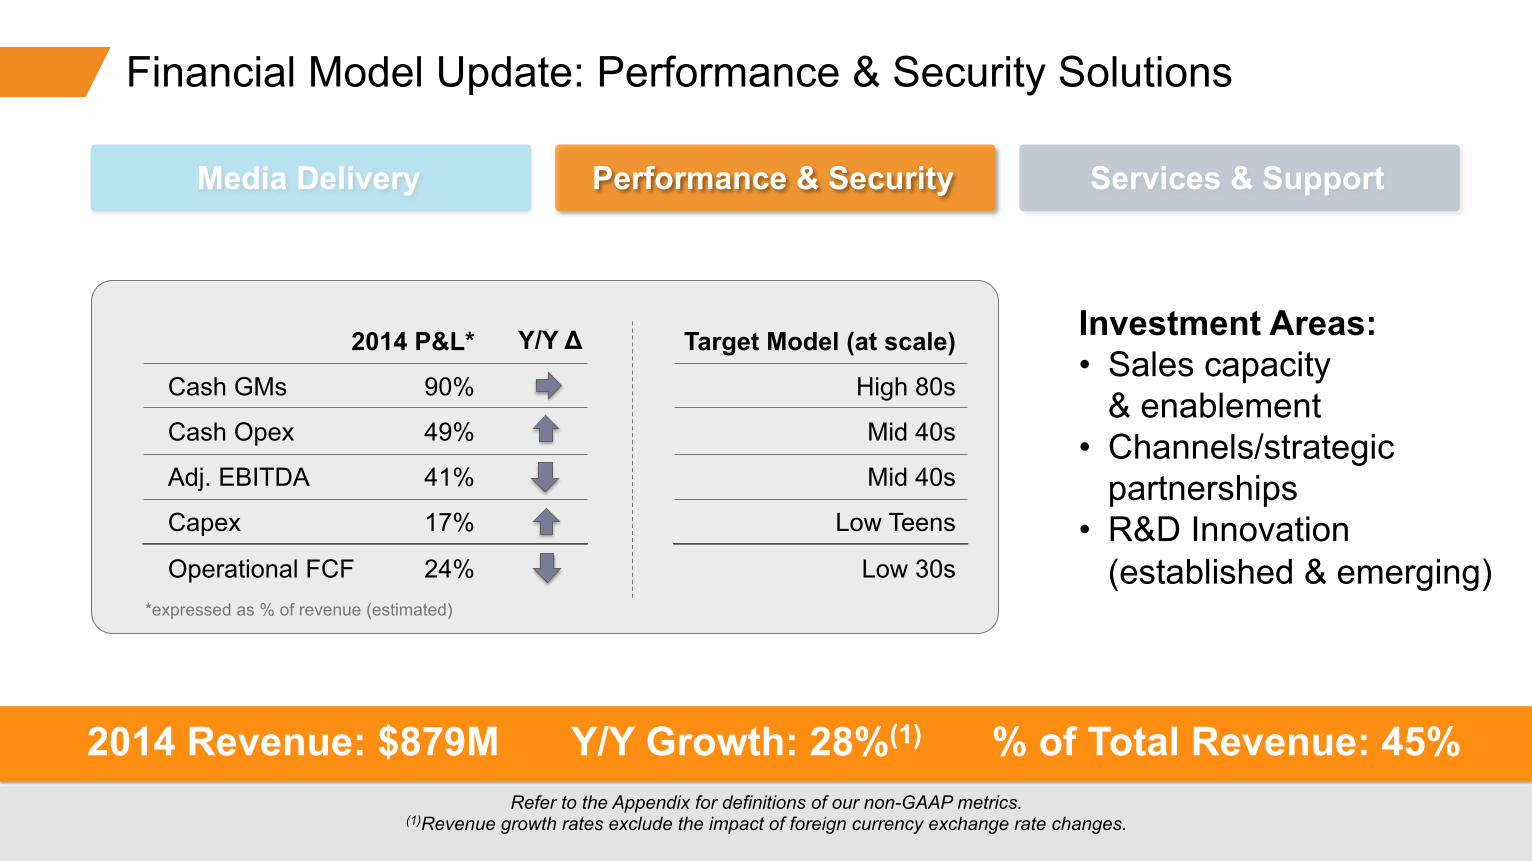
Cash GMs
Cash Opex
Adj. EBITDA
Capex
Operational FCF
2014 P&L*
90%
49%
41%
17%
24% *expressed as % of revenue (estimated)
Y/Y Δ
Financial Model Update: Performance & Security Solutions
Investment Areas: • Sales capacity
& enablement • Channels/strategic
partnerships • R&D Innovation
(established & emerging)
% of Total Revenue: 45% 2014 Revenue: $879M Y/Y Growth: 28%(1)
*Excludes ADS
Target Model (at scale)
High 80s
Mid 40s
Mid 40s
Low Teens
Low 30s
Performance & Security Services & Support Media Delivery
Refer to the Appendix for definitions of our non-GAAP metrics. (1)Revenue growth rates exclude the impact of foreign currency exchange rate changes.

©2015 AKAMAI | FASTER FORWARDTM
Services & Support Solutions
9%
46% 45%
2014 Revenue Highlights • Revenue: $173M
• 36% Y/Y growth(1)
• 9% of total revenue • Base penetration*: 27% of total customers • New customer attach rate: 31% • ARPU ~$8K (consistent with 2013) 2015 Business Drivers • Enabling customers to better leverage
Akamai core services • Customers looking to Akamai for technical expertise
Performance & Security Services & Support Media Delivery
Services & Support
Performance & Security
Media Delivery
(1)Revenue growth rates exclude the impact of foreign currency exchange rate changes. *Customers purchasing a monthly recurring revenue contract (excludes one-time integration fees).

©2015 AKAMAI | FASTER FORWARDTM
Cash GMs
Cash Opex
Adj. EBITDA
Capex
Operational FCF
2014 P&L*
55%
34%
21%
9%
12% *expressed as % of revenue (estimated)
Y/Y Δ
Financial Model Update: Services & Support Solutions
Investment Areas: • Service delivery capacity • Innovation to drive efficiency & channel enablement
• Self-service tools
% of Total Revenue: 9% 2014 Revenue: $173M Y/Y Growth: 36%(1)
*Excludes ADS
Target Model
Low / Mid 50s
Low 30s
Low 20s
Single Digits
Mid-Teens
Performance & Security Services & Support Media Delivery
Refer to the Appendix for definitions of our non-GAAP metrics. (1)Revenue growth rates exclude the impact of foreign currency exchange rate changes.

©2015 AKAMAI | FASTER FORWARDTM
Grow revenue opportunities with fast, personalized web experiences and manage complexity from peak demand, mobile devices and data collection.
2014 Year In Review
Solution Category Review
Looking Forward
AGENDA

©2015 AKAMAI | FASTER FORWARDTM
Media Delivery
Performance & Security
Services & Support
Total Akamai
2014 $M
$912
$879
$173
$1,964
2014 Y/Y%*
21%
28%
36%
25%
AS REPORTED
A reconciliation of as-reported by solution category is available on the IR section of our website. Amounts may not add due to rounding. *Revenue growth rates exclude the impact of foreign currency exchange rate changes.
Product-Specific
Services Shift
$6
$21
($27)
$0
+
+
–
2014 $M
$917
$901
$146
$1,964
AS REVISED
=
=
=
2014 Y/Y%*
21%
29%
25%
25%
Housekeeping: 2015 Revenue Reporting Adjustments (Product-Specific Services)

©2015 AKAMAI | FASTER FORWARDTM
2010 2011 2012 2013
$5B
$4B
$3B
$2B
$1B
19% 11% 20%
20%
$5 Billion Goal
Annual Revenue
2014 2015 2016 2017 2018 2019 2020
25%
Revenue growth rates exclude the impact of foreign currency exchange rate changes and revenue from our divested ADS business.

©2015 AKAMAI | FASTER FORWARDTM
2010 2011 2012 2013
$5B
$4B
$3B
$2B
$1B
19% 11% 20%
20%
$5 Billion Goal
Annual Revenue
2014 2015 2016 2017 2018 2019 2020
International & Channel Expansion
Multiple Growth Levers
Continued Investment in S&M and R&D
Media Volumes
Execution with Emerging Businesses
Continued Traction in Performance & Security
Strategic M&A
25%
Revenue growth rates exclude the impact of foreign currency exchange rate changes and revenue from our divested ADS business.

©2015 AKAMAI | FASTER FORWARDTM
Akamai Financial Model: A Blend of Businesses at Differing Levels of Maturity & Scale
Expressed as a percentage of revenue, except for Non-GAAP Tax Rate, which is expressed as a percentage of non-GAAP pre-tax income. Refer to the Appendix for definitions of our non-GAAP metrics.
Company Model
Cash Gross Margin
Cash Opex
Adj. EBITDA
Capex
Operational FCF
Non-GAAP Tax Rate
77 – 79%
36 – 37%
40 – 43%
16 – 18%
22 – 27%
29 – 32%

©2015 AKAMAI | FASTER FORWARDTM
SUMMARY Akamai is poised to capitalize on significant megatrends
The fundamentals of the business remain strong
Established and Emerging solutions have demonstrated traction
Current/planned investments focused on growth & scale
Continuing the strategy outlined in 2013/2014

©2015 AKAMAI | FASTER FORWARDTM
Grow revenue opportunities with fast, personalized web experiences and manage complexity from peak demand, mobile devices and data collection.
THANK YOU!

©2015 AKAMAI | FASTER FORWARDTM
Grow revenue opportunities with fast, personalized web experiences and manage complexity from peak demand, mobile devices and data collection.
QUESTIONS? Please raise your hand & wait for microphone

©2015 AKAMAI | FASTER FORWARDTM 168
LUNCH WiFi Name: Hyatt Meeting

Investor Relations Summit Tuesday, February 24, 2015
WiFi Name: Hyatt Meeting

Reconciliation of Non-GAAP Metrics and Definitions

©2015 AKAMAI | FASTER FORWARDTM
Avoid data theft and downtime by extending the security perimeter outside the data-center and protect from increasing frequency, scale and sophistication of web attacks.
• Adjusted EBITDA – GAAP net income excluding the following items: interest income; income taxes; depreciation and amortization of tangible and intangible assets; stock-based compensation; amortization of capitalized stock-based compensation; restructuring charges; acquisition-related costs; certain gains and losses on investments; benefit from adoption of software development activities, gains and other activity related to divestiture of a business; foreign exchange gains and losses; loss on early extinguishment of debt, amortization of debt discount and issuance costs; amortization of capitalized interest expense; gains and losses on legal settlements and other non-recurring or unusual items that may arise from time to time.
• Adjusted EBITDA margin – Adjusted EBITDA stated as a percentage of revenue.
• Capital expenditures – Purchases of property and equipment, capitalization of internal-use software development costs, capitalization of stock-based compensation and capitalization of interest expense.
• Cash cost of revenue – GAAP cost of revenue, excluding stock-based compensation and depreciation and amortization.
• Cash operating expenses – GAAP operating expenses (consisting of research and development, sales and marketing, general and administrative, amortization of acquired intangible assets and restructuring charges), excluding stock-based compensation, amortization of acquired intangible assets, depreciation and amortization, restructuring charges, acquisition-related costs, legal settlements, benefit from adoption of software development activities and gains from other activity related to divestiture of a business.
• Free cash flow – Cash flows from operations less purchases of property and equipment and capitalization of internal-use software development costs included in the statement of cash flows.
• Cash gross margin – Revenue less cash cost of revenue.
• Cash gross profit – Revenue less GAAP cost of revenue, excluding stock-based compensation and depreciation and amortization, as a percentage of revenue. cash cost of revenue.
• Cash operating expenses – GAAP operating expenses (consisting of research and development, sales and marketing, general and administrative, amortization of acquired intangible assets, depreciation and amortization, and restructuring charges), excluding stock-based compensation, amortization of acquired intangible assets, depreciation and amortization, restructuring charges, acquisition-related costs, legal settlements, benefit from adoption of software development activities and gains and other activity related to divestiture of a business.
• Gross R&D – GAAP research and development expenses, plus salaries and payroll-related costs (excluding stock-based compensation) of research and development employees and consultants who devote time to the development of internal-use software projects and whose costs have been capitalized during the period.
• Impact of Foreign Currency Exchange Rates on Revenue – Revenue from international operations has historically been an important contributor to Akamai’s total revenue. Consequently, Akamai’s revenue results have been impacted, and management expects they will continue to be impacted, by fluctuations in foreign currency exchange rates. For example, when the local currencies of Akamai’s foreign subsidiaries weaken, consolidated results stated in U.S. dollars are negatively impacted. Because exchange rates are an meaningful factor in understanding period-to-period comparisons, management believes the presentation of the impact of foreign currency exchanges rates on revenue enhances the understanding of revenue results and evaluation of its performance in comparison to prior periods. The information presented is calculated by translating current period results using the same average foreign currency exchange rates per month from the comparative period.
• Non-GAAP Tax Rate – GAAP tax rate excluding the tax effect of non-GAAP adjustments and certain discrete tax items.
• Operational free cash flow – Adjusted EBITDA less capital expenditures, excluding stock-based compensation.
• Revenue, adjusted for ADS divestiture – Revenue excluding the impact of Akamai's Advertising Decision Solutions (ADS) divestiture.
Definitions of Non-GAAP Financial Measures
For a full list and definitions of all our non-GAAP measures, refer to the Investor Relations section of our website.

©2015 AKAMAI | FASTER FORWARDTM
Avoid data theft and downtime by extending the security perimeter outside the data-center and protect from increasing frequency, scale and sophistication of web attacks.
Net income $201 $204 $293 $334 Interest income (11) (6) (6) (8) Provision for income taxes 106 118 126 146 Depreciation and amortization 144 176 155 205 Amortization of capitalized stock-based compensation 7 8 8 10 Amortization of capitalized interest — — — — Amortization of acquired intangible assets 17 21 22 32 Stock-based compensation 61 91 96 112 Restructuring charges 5 0 2 1 Acquisition-related costs 1 6 2 5 Gain from divestiture of a business — — (1) — Legal settlements (8) — — — Benefit from adoption of software development activities — — — (3) Loss on investments 1 — — — Amortization of debt discount and issuance costs 5 5 — 15 Other expense (income), net 2 (1) — 2 Adjusted EBITDA $525 $615 $697 $853 Adjusted EBITDA margin 45% 45% 44% 43%
Adjusted EBITDA ($MM)
Amounts may not add due to rounding.
2011 2012 2013 2014
Reconciliation of GAAP to Non-GAAP Metrics

©2015 AKAMAI | FASTER FORWARDTM
Avoid data theft and downtime by extending the security perimeter outside the data-center and protect from increasing frequency, scale and sophistication of web attacks.
Cash costs of revenue ($MM)
GAAP cost of revenue $454 $530 $511 $611 Less:
Stock-based compensation 10 11 11 12
Depreciation and amortization 134 163 136 175 Cash cost of revenue $310 $355 $364 $424
Revenue $1,159 $1,374 $1,578 $1,964 Less: Cash cost of revenue 310 355 364 424 Cash gross profit $848 $1,019 $1,214 $1,540 Cash gross margin 73.2% 74.1% 76.9% 78.4%
Cash gross profit ($MM)
Amounts may not add due to rounding.
Reconciliation of GAAP to Non-GAAP Metrics 2011 2012 2013 2014
2011 2012 2013 2014

©2015 AKAMAI | FASTER FORWARDTM
Avoid data theft and downtime by extending the security perimeter outside the data-center and protect from increasing frequency, scale and sophistication of web attacks.
Revenue adjusted for ADS divestiture ($MM)
Revenue $1,159 $1,374 $1,578 $1,964 Less: ADS revenue (43) (44) (3) — Revenue adjusted for ADS divestiture $1,116 $1,330 $1,575 $1,964
Amounts may not add due to rounding.
Free Cash Flow ($MM) Cash provided by operating activities $446 $530 $564 $658 Less: Purchases of property and equipment 133 167 188 207 Capitalization of internal-use software
development costs 43 54 72 111
Free cash flow $270 $309 $304 $339
Reconciliation of GAAP to Non-GAAP Metrics
2011 2012 2013 2014
2011 2012 2013 2014

©2015 AKAMAI | FASTER FORWARDTM
Avoid data theft and downtime by extending the security perimeter outside the data-center and protect from increasing frequency, scale and sophistication of web attacks.
Cash operating expenses ($MM)
GAAP Operating Expense $414 $530 $653 $863 Less: Stock-based compensation (52) (79) (85) (100) Amortization of acquired intangible assets (17) (21) (22) (32) Depreciation and amortization (17) (20) (27) (40) Restructuring charges (5) (0) (2) (1) Acquisition related costs (1) (6) (2) (5) Gain from divestiture of a business — — 1 — Legal settlement — — — — Benefit from adoption of software development activities — — — 3
Cash operating expense $323 $403 $517 $688 Percent of revenue 27.9% 29.3% 32.8% 35.0%
Amounts may not add due to rounding.
Reconciliation of GAAP to Non-GAAP Metrics 2011 2012 2013 2014


