32
2015 ANNUAL REFLECTION & LEADER COLLEGE APPLICATION WORKSHEET

2015
ANNUAL REFLECTION
& LEADER COLLEGE
APPLICATION
WORKSHEET

2015 Annual Reflection | 1
Introduction
All Achieving the Dream institutions (except for the 2014 Cohort, which must submit an Implementation
Plan) are required to submit an Annual Reflection. The Annual Reflection is an opportunity to consider
your institution’s student success work over the past year and to plan for the coming year. Your
institution’s reflection helps inform Achieving the Dream’s work as we collect data, identify common
themes, and build our knowledge of the institutional change process.
Instructions for Completing the 2015 Annual Reflection Narrative
Principles Assessment Survey
Certain questions posed in the Annual Reflection require a summary of your institution’s Principles
Assessment Survey responses. Your Core Team Leader(s) will have received a link to access your
institution’s updated summary report. To learn more, visit the Achieving the Dream website.
Annual Reflection Narrative
To complete the Annual Reflection Narrative, your institution should engage a representative group of
stakeholders to review and discuss the institution’s student success and equity work, the results of the
Principles Assessment Survey, and the outcomes data that you plan to submit along with the Annual
Reflection.. This discussion will be helpful as you complete the Annual Reflection Narrative. Please use this
worksheet to draft your responses.
Leader College Application (if relevant)
Institutions submitting Annual Reflections have the
option of applying for initial Leader College status
or Leader College recertification by completing the
Leader College Application at the end of the
Annual Reflection. Leader College applicants must
also submit student success outcomes data using
the ATD Data Template. More information about
the Leader College Application can be found here.
Submitting the Annual Reflection
When you have completed this worksheet and are ready to submit, please visit the Annual Reflection URL
sent to your Core Team Leader(s) and copy and paste your answers directly into the online form. You will
be asked to upload your data template (section 4) as well.
Questions
For more information about the Annual College Progress process, see the Achieving the Dream website.
Please send an email to [email protected] if you have any questions.
Instructions, worksheets, and
further information about the
Annual College Progress are
available on the Achieving the
Dream website.

2015 Annual Reflection | 2
ANNUAL REFLECTION NARRATIVE WORKSHEET Please use this document to draft your responses before completing the online
Annual Reflection form.
Note that the period covered by this Annual Reflection is May 2014 - April 2015. Please
reflect on activities during this time period throughout the narrative.
Institution Name: Lone Star College
1) CONTRIBUTORS TO THE ANNUAL REFLECTION
Achieving the Dream suggests that your institution engage a representative group of stakeholders to
review and discuss the institution’s student success and equity work, the results of the Principles
Assessment, and data for the five Achieving the Dream student success measures (as described in section
4 below). Please identify the stakeholders who contributed to the 2015 Annual Reflection.
Name Title
Austin Lane Executive Vice Chancellor, Academic & Student Affairs
Jamie Posey Associate Vice Chancellor, Office of Completion
Wendell Williams Associate Vice Chancellor, Student Success
Amy Welch Executive Director, Texas Completes
Kristin Lue King Executive Director, Expanded Learning
Deseree Probasco Lead Analyst, Analytics & Institutional Reporting
Jason Kot Analyst, Analytics & Institutional Reporting
Chris Tkach Executive Director, Strategic Planning & Assessment
2) PROGRESS STATEMENT
Please describe your institution’s progress in improving student success and completion over the past
academic year. Please consider both the positive factors and challenges affecting the student success
efforts at your institution. This summary may include aspects related to the institution’s culture and
environment such as leadership changes, building a culture of inquiry, engagement of full- and part-time
faculty, staff additions or transitions, state or federal influences, budget reductions, and reaffirmation of
accreditation efforts. [Limit to 750 words.]

2015 Annual Reflection | 3
As the 2014-2015 Achieving the Dream (ATD) Annual Reflection period began in May 2014,
Lone Star College (LSC) was in the midst of a search for a new chancellor. Dr. Richard
Carpenter announced his retirement in February 2014. On July 1, 2014, Dr. Stephen Head,
former LSC-North Harris President, was named as the new Chancellor of LSC.
Leadership changes at the CEO level created an opportunity for LSC to provide structural
clarity and improve efficiencies. Under Dr. Head’s charge, organizational changes were made
to prioritize student success and completion, and to advance an evidenced-based culture of
inquiry and improvement. The Office of Completion was moved under the new office of the
Executive Vice Chancellor, which oversees Academic and Student Affairs. Accountability,
transparency, and communication has been enhanced with the creation of three new
councils: Chancellors’ Cabinet, the Presidents’ Council, and the Vice Presidents’ Council.
These three councils, along with the Faculty Senate Presidents, ensure academic and student
success is at the forefront of efforts across the district, while also fostering broader
engagement system-wide.
The new council structure creates a framework for all major decision making layered on a
foundation of data review and analysis. The increased institutional utilization of data
prompted a division of the former Office of Research & Institutional Effectiveness into the
Office of Analytics and Institutional Reporting (AIR) and the Office of Strategic Planning and
Assessment. In addition to the traditional static data reports, AIR also provides a central
repository for data with dashboards reflecting student progress in real time. Predictive
analytics to better understand and forecast student needs is underway for the 2015-2016
academic year.
The Office of Strategic Planning and Assessment is working with LSC leadership to develop
the goals that will lead our strategic planning focus for 2015-2020. All future college
initiatives will connect to one of five priority areas:
Student Success: Promote student success through excellence in teaching and
learning, and the provision of student-centered support services.
Financial Responsibility and Accountability: Ensure sound financial practices that
are accountable to taxpayers and fairly allocate budget and resources.
Academic & Workforce Program Quality: Provide high quality academic and
workforce programs that enhance the student learning experience and prepare them
for the 21st century workforce.
Partnership: Build strong partnerships with local ISDs, civic, charitable, higher
education, industry and business organizations to promote student and community
success.
Culture: LSC nurtures a culture that values and respects all employees and
encourages collaboration.

2015 Annual Reflection | 4
The reorganization and commitment to these five goals has provided additional focus and
support to sustain and scale efforts to provide a common Lone Star College student
experience across all six colleges. The commitment from campus leadership to facilitate
campus stakeholders’ participation in system-wide committees and work teams to ensure
broad engagement has been key as we advance initiatives.
Over the past academic year, Lone Star College has significantly improved the level of broad
engagement and buy-in for faculty, staff and administration around critical student success
initiatives. The LSC Completion Plan, created in 2013, is a formalized written plan that
synthesized all of the student success efforts across the System. Accomplishments,
challenges and status updates regarding stages of implementation were discussed with
system-wide administrative and faculty leadership at a one-day Completion Reengagement
Summit Meeting on February 27, 2015. Additionally, college and system office teams were
provided with location-specific data for the first phase of assessment for seven of the 18 LSC
Completion Plan strategies. The remaining strategies will be assessed in phase 2, which will
be conducted in July 2015.
Since implementation of the first Completion Plan strategy in Fall 2011 to Fall 2014, the LSC
credit population of students grew by 8.6%. The ATD cohort of students also grew, from
12,214 to 16,706 (26.9%). It should be noted that enrollment did not decline even with
implementation of mandatory orientation and the student success course. Growth has
presented an opportunity to examine business process development, explore more efficient
support structures for students/staff, and reinforce the need for continuous training.
Growth has also created challenges with regards to implementing at scale, a best practice
LSC strives to execute.
3) PRINCIPLES ASSESSMENT SURVEY RESULTS
Use the results of the Principles Assessment to analyze your institution’s progress for each principle
below. Be sure to include successes and areas for improvement for each principle; in particular, how will
your institution strengthen areas with low-scoring results? [Limit to 1-2 paragraphs per principle.]
Principle 1:
Committed
Leadership
Eighty-eight percent of the respondents to the 2015 Principles Assessment
indicated that the Chancellor and the leadership team at LSC are actively
promoting increases in student learning and completion, not just increases in
student enrollment numbers. The same percentage, 88%, also endorsed the
statement that senior leaders demonstrate a willingness to support changes in
policy, procedures, and resource allocation for the purpose of improving student
success. These two survey items elicited the strongest positive and most certain
responses for their categories (1.1 Vision and Values, 1.2 Commitment). Examples
of this high level of commitment from leadership include: a) a decision, and
commitment of resources, to implement a mandatory first year Student Success
Course (EDUC 1300) and a mandatory new student orientation for first time

2015 Annual Reflection | 5
college students, b) the recent redesign of system-wide leadership committee
work into four distinct leadership councils: Chancellors’ Cabinet, the Presidents’
Council, the Vice Presidents’ Council, and the Faculty Senate Presidents’ Council;
and c) the reorganization to strategically link Academic and Student Affairs for
the purpose of strengthening linkages between organizational units and
departments to better serve the colleges.
Although the majority of responses relating to leadership commitment were
positive, some questions showed higher levels of uncertainty than others,
indicating areas where communication of expectations, plans, and results may be
improved. While the total percentage of uncertain responses was low, it does
indicate room for improvement based on the demographic group who
completed the survey (predominantly administration). For example, 7% of
respondents expressed uncertainty around the Board of Trustees expectations
for regular reporting on student success improvement efforts. Additionally, 14%
were not certain or indicated less favorably when asked of their awareness of the
existence of explicit policies to achieve equity of student outcomes across
racial/ethnic and income groups. The LSC Strategic Planning process, which will
broadly engage all faculty and staff across the system, places student success as
a core element supported at the highest levels of the organization. Additionally,
the reaffirmation of the Completion Plan, and a new initiative to collaborate with
the Aspen Institute, will provide opportunities for LSC leadership to clarify LSC
Board involvement, identify specific measurable goals regarding student
success/completion; and assess (on a regular, and defined, time interval) the
specific progress being made to achieving those goals/targets.
Principle 2:
Use of Evidence
to Improve
Policies,
Programs, and
Services
Eighty percent of survey participants were certain that LSC regularly
disaggregates student data by a variety of factors to identify gaps in student
achievement. The high level of certainty on this question may be due to the
visibility of internal reports and community report cards that share information
about student demographics and student success. Such reports are frequently
viewed and discussed at college leadership meetings, curriculum committee
meetings, and by many system-wide work groups.
Certainty around the use of data faltered slightly on the question about the
regularity of tracking cohorts of students, with only 66% of survey participants
indicating this happens on a regular basis. This question and the others in survey
section 2.2 (Process for Identifying Achievement Gaps) represent an area for
improvement for LSC, as many of the participants were divided in how well they
understood what data is collected and how positive they felt about the processes
involved when collecting and sharing information. Regarding the latter issue,
several questions in this section elicited strong responses (20% - 44%)
supporting the belief that progress in this area is increasing. The recent division
of the former Office of Research & Institutional Effectiveness has separated work

2015 Annual Reflection | 6
more effectively and has clarified accountability by establishing the Office of
Analytics and Institutional Reporting (AIR) and the Office of Strategic Planning
and Assessment. The LSC Completion Plan was reaffirmed system-wide in
February 2015, and includes 18 strategies, each with their own key performance
indicators (KPIs), which will be regularly assessed to ensure implementation and
continuity of progress. Lone Star College is also collaborating with Civitas
Learning to begin using predictive analytics and forecasting to better understand
and plan for the challenges and opportunities that college students face today.
These efforts are just a few examples of how the use of data to impact decision-
making at Lone Star College is becoming the cultural norm.
Principle 3:
Broad
Engagement
Broad engagement has been conducted on multiple levels at LSC over the past
year. When working on Completion Plan strategies that have a system-wide
scope of impact, system-wide implementation teams were created to develop
the business processes, create the job aids/supporting materials, provide insight
on potential barriers to success, and make recommendations on continued
improvement based on quantitative data and qualitative feedback. Examples of
these implementation teams include the Mandatory Orientation Committee, the
Student Success Advisory Council, and the Core Curriculum Redesign Committee.
Implementation teams were created to provide a voice for each stakeholder
group relevant to the work of the committee and while some became permanent
work groups, others served their purpose and then disbanded with data
monitoring and effectiveness being assessed through the regular IE process.
With the newly designed leadership structure mentioned in Principle 1 on
Committed Leadership, communication and true engagement across the various
stakeholder groups are now more closely connected with transparent
accountability and resource allocation.
The 2015 deployment of this survey resulted in more than double the number of
responses that were collected in 2014. While this increase is positive, the
methodology for whom the survey is deployed to will need to be revised in the
future, in order to ensure an equal representation of staff, faculty, students, and
administration. The lack of faculty, staff and student respondents being polled
may have contributed to higher levels of uncertainty (5%-22%) in this section,
compared to other survey sections. Responses were divided across all choices on
questions related to faculty review of course and program outcomes and
teaching strategies, the involvement of adjunct faculty in institutional efforts to
improve student success, alignment of student success and academic efforts, and
the use of current research practices to assess student success strategies. This
section of the data may not be as accurate as desired due to the lack of
representation needed among survey recipients.

2015 Annual Reflection | 7
Principle 4:
Systemic
Institutional
Improvement
The reorganizations and councils noted previously, as well as the high
percentage of administrators responding to the Principles Assessment Survey,
positively influenced this section of the survey, with 61% to 78% of participants
responding favorably to eight out of the 11 questions relating to Systemic
Institutional Improvement. The Strategic Planning process at LSC is clearly a
strength. Seventy-eight percent of survey participants supported the statement
that there is an established process and that it relies on data to set student
success goals and to measure achievements. The use of a limited number of
student success focused priorities per year allows employees and faculty
members to understand the goals and measure progress annually. LSC
developed a brand of “LSC Success - Learn. Succeed. Complete.” in an effort to
focus efforts related to student success, reduce initiative fatigue and provide
recognition of top priorities.
Survey responses (71%) indicated that budget allocations are based on program
effectiveness and linked to plans to increase rates of student success.
Communication about the budget allocation process, and a significant effort to
increase transparency in the College’s finances, are priorities the Chancellor has
implemented since August 2014. Fifteen percent of participants expressed
uncertainty around how financial decisions are made. The new strategic planning
process will emphasize the importance of this issue, with Student Success and
Finance as two of the Top 5 Goals outlined by the Chancellor. More importantly,
each department and unit will be required to indicate how their work contributes
to the Top 5 Goals. Employees and faculty will be involved in a number of
discussions, surveys, and focus groups as this process occurs over the next eight
months.
Principle 5:
Equity
At the institutional level, survey respondents indicated that the college
demonstrates a commitment to equity for all students (83%). In the classroom,
66% of respondents supported the statement that faculty and administrators
have the experience and knowledge necessary to work with and be sensitive to
students from a variety of different backgrounds. Upon reflecting on the
demographics of survey respondents, the lack of both faculty and students
surveyed, contributes to an incomplete assessment of institutional equity in the
classroom. In order to accurately assess this principle in the future, it is
imperative their voice is included. Institutionally, LSC provides individualized
support to meet students where they are when they enter the college. All FTIC
students are provided an individualized plan through the mandatory Student
Success Course, which is designed to meet their specific needs. For Harris and
Montgomery counties, females comprise slightly more than 50% of the total
population. However, at LSC for the fall 2014 term, females comprise 60% of the
population. While there is a shortcoming in access for males attending LSC, the
gap is not as great as national levels. The system has adopted strategies and has

2015 Annual Reflection | 8
increased its efforts to attract more male students by implementing special
programming, workshops, events, organizations, and targeted recruitment efforts
to recruit and retain male populations. The focus on expanding workforce
programs and adding target instructional sites in both rural and urban areas has
also made positive impacts on the male student population. LSC continues to
develop programs and services to meet the needs of emerging diverse
populations.
Also noteworthy is the fact that Lone Star College has continued to grow--even
during times when other colleges and universities have suffered enrollment
losses. As the largest institution of higher education in the Houston area and
one of the fastest-growing community colleges in the nation, LSC has a unique
opportunity to hire qualified and experienced professionals. However, growing
from a system that served 69,339 credit students in 2010 to one that served
82,818 in the Fall 2014 semester comes with its own challenges. In January 2015,
Forbes Magazine named Houston as the fastest growing city in the United States.
It is also one of the most diverse cities. Therefore, staffing such a large institution
with employees who reflect the demographic composition of the district requires
diligent effort. Survey responses revealed that 32% of respondents believe that
the institution’s staffing increasingly reflects the demographic composition of
Lone Star College’s service area populations with an additional 53% positively
reporting the College’s reflection of its area’s population. The LSC Organizational
Development department is coordinating efforts to begin a system-wide work
group that will assess and recommend improvements to the organizational
culture. Culture is amongst the Top 5 Goals for LSC that are driving the creation
of the 2015-2020 Strategic Plan. The recently initiated collaboration with the
Aspen Institute also brings a focused lens to equity issues around the system. All
of these efforts reflect a sincere, coordinated, and determined effort by the LSC
Board of Trustees, Chancellor, and senior leadership to make LSC a place that
values equity for all employees and students.
4) STUDENT SUCCESS DATA TRENDS
This question and data submission is optional for colleges applying for Leader College
Initial Certification and Recertification.
Please choose one of the following student success outcome measures for which to analyze your
institution’s performance and upload a data table that disaggregates the student data by all students in
the ATD cohort, race/ethnicity, gender, and income status. We encourage you to use the ATD Data
Template (you will upload the data template at the end of the online form). More information on the
student success data specifications can be found in Appendix A at the end of this document. Your
narrative response should include:

2015 Annual Reflection | 9
a. A description of your institution’s performance in comparison with the previous year’s outcomes
b. An explanation of your institution’s progress in closing achievement gaps among the
disaggregated groups
c. A description of your institution’s plan to sustain/build increases, address decreases, and close
achievement gaps
Measure 1:
Successfully complete
developmental instruction
and advance to credit-
bearing courses
Enter Answers Here
Measure 2:
Enroll in and successfully
complete college-level or
Gateway courses (math
and/or English)
Enter Answers Here
Measure 3:
Persist from term-to-term or
year-to-year
Enter Answers Here
Measure 4:
Attain a credential Enter Answers Here

2015 Annual Reflection | 10
5) GOALS AND PLANS FOR 2015-2016
Based on the analysis of your progress over the past year, including your student success data and
stakeholder input, please identify up to three goals for your institution’s student success work, 2-3 action
steps you will take to move towards these goals in the 2015-16 academic year, and any desired resources
from Achieving the Dream that may assist you in reaching this goal.
Goal Action Steps Desired ATD resources to
assist you with this goal
1) Assess the effectiveness
of the LSC Completion
Plan strategies based on
implementation status
and set data targets for
improvement on key
performance indicators
Institutionally formalize the
definition of student
success
Finalize the analysis on the
baseline data for all Key
Performance Indicators for
the 18 strategies on the
Completion Plan and
establish baseline data
targets for each KPI that is
based on a clearly defined
methodology
Develop a review cycle as
well as a process for
additions, revisions, and
continuous improvement
monitoring for the
Completion Plan and align
system resources in
accordance with the
Chancellor’s Top 5 priorities
Utilize LSC ATD leadership
coach in institutionalizing
broader stakeholder
engagement targeted for
specific student success
goals/outcomes
Work closely with LSC ATD
data coach on the method
for selecting targets for
improvement and
facilitated discussion
around data analysis
2) Enhance leadership
impact state-wide
Leverage role as Texas
Completes cadre leader to
drive state-wide change
initiatives
Conduct Pathways Institute
with other peer colleges to
facilitate development of

2015 Annual Reflection | 11
implementation plan for
expanded pathways for
students
As the Texas Reverse
Transfer Initiative lead
college, facilitate proposal
submission for 1 - Adding
Reverse Transfer graduates
to Texas State Reporting
requirements and 2 –
Drafting THECB rule
clarification regarding opt-
out guidelines
3) Maximize national
participation in best
practice sharing
Document the LSC journey
and model for
organizational change
Present at national
conferences on lessons
learned, best practices, and
data conclusions
6) SHARING
Is there any additional information you would like to share with ATD in this reflection? [Optional]
Enter Answers Here
Submitting the Annual Reflection Narrative
Congratulations! You have completed the Annual Reflection worksheet. If you are not completing the
Leader College Application, follow these next steps:
Using the link sent to your Core Team Leader(s), copy and paste your responses into the online
Annual Reflection form. You will be asked to upload your data template (section 4) in the form as
well.
If you have not done so, enter your planned interventions in the Interventions Showcase. Your
Core Team Leader(s) will have received instructions to enter the Interventions Showcase in mid-
April.

2015 Annual Reflection | 12
Leader College Application Worksheet Please read the Leader College Application
Guidelines before proceeding.
Please use this document to draft your responses before completing the online
Leader College Application form if your college wishes to apply for Leader College
initial status or recertification.
Institution Name: Lone Star College System
Year Joined ATD: 2006
Application Type: Initial.
Recertification. If applying for recertification, in
what year did your college initially receive Leader
College status? 2012
Certification of Conversation with Coaches (Initial Applicants Only)
All institutions applying for initial Leader College status must have conversations with their assigned
Achieving the Dream Leadership and Data Coaches regarding this application. The discussion should
address the institution’s readiness to apply for Leader College status, keeping in mind the required criteria
for both practice and performance, and the roles and responsibilities of Leader Colleges in the Achieving
the Dream National Reform Network. Initial applicants must complete this table.
Coach Type Coach Name Date of Conversation
Regarding Application
Leadership Coach Mary FiField N/A
Data Coach Rene Garcia April 6, April 25
Certification of Conversation with President/CEO/Chancellor (All Applicants)
All institutions applying for initial or recertification Leader College status must have conversations with
their college president/CEO/chancellor regarding this application. The president/CEO/chancellor will be
the primary contact for notification of Leader College status, which will occur in fall 2015.
President/CEO/Chancellor Name Date of Conversation Regarding Application
Stephen C. Head / Chancellor Enter Answers Here
Main Contact for Application Questions
Name: Jamie Posey
Title: Associate Vice Chancellor, Office of Completion

2015 Annual Reflection | 13
Email: [email protected]
Phone Number: 832-813-6776
1) STUDENT SUCCESS DATA
a. On what measure would your institution like to be considered for Leader College status?
These selections must correspond to the data presented in the accompanying Achieving the Dream Data
Template. Initial applicants must select one. Recertification applicants must select two.
Measure 1: Successfully complete developmental instruction and advance to credit-bearing
courses
X Measure 2: Enroll in and successfully complete the initial college-level or Gateway courses (math
and/or English)
X Measure 3: Persist from term-to-term or year-to-year
Measure 4: Attain a credential
b. Describe the increase(s) shown in the student outcome data.
To be considered for Leader College status, the institution should ideally show a general trend upward in
student achievement for the measure(s) identified in subsection a (one measure for initial applicants; two
measures for recertification applicants). Achieving the Dream realizes that there may not be a constant
increase in student achievement from year to year. However, any fluctuations or downward trends must
be thoroughly explained. Also, provide any additional information about the data that may be relevant
(e.g., external influences, trends in cohort sizes, definitions, etc.).
Through ATD and Completion by Design, LSC has transitioned from focusing on
individual interventions to a systemic approach to improving student success through a
culture of evidence and evaluation. Gateway Math, Math 1314, (transfer level math) is one of
the largest barriers to student completion and has been a focus of LSC efforts to improve
student success. The college has made great progress in addressing this barrier. As reflected
in Table 1 below, with the exception of the 2012 cohort (which remained flat), LSC has
continued to improve the percentage of students completing their gateway Math course
within 1 year of entering the college since 2010. An 8% increase was observed for the Fall
2013 cohort for students enrolling in their college level math course within first year,
indicating that more students are taking their gateway math upon entrance to the college
instead of delaying. Additionally, a significant increase was observed for the Fall 2013
cohort, with an improvement of 7% over the 2012 cohort in regards to successful completion
of college level math within 1 year. This may indeed confirm that students completing their
math courses sooner in their academic pathway are more successful.

2015 Annual Reflection | 14
Table 1: First Time In College (FTIC) Students Who Placed into College Level Math
Cohort
#
Students
in
Cohort
FTIC Students Who Placed into College Level Math
#
Students
Who
Placed
College
Level
%
Enrolled
in the
First
Year
Successfully
Completed
MATH 1314
in
1 Year
Successfully
Completed
MATH 1314
in
2 Years
Successfully
Completed
MATH 1314
in
3 Years
# % # % # %
Fall
2008
Cohort 5,913 841 63% 306 36% 347 41% 370 44%
Fall
2009
Cohort 8,740 1,191 58% 438 37% 503 42% 525 44%
Fall
2010
Cohort 10,242 1,367 63% 548 40% 614 45% 652 48%
Fall
2011
Cohort 10,369 1,529 66% 649 42% 758 50% 793 52%
Fall
2012
Cohort 10,544 1,657 64% 699 42% 783 47%
Fall
2013
Cohort 10,835 2,118 72% 1,031 49%
Lone Star College was awarded Leader College status in 2012. At the time of that application,
new initiatives had just been implemented, which included a mandatory first year experience
for entering students. Since 2012, LSC has refined the process of truly implementing
“mandatory.” A registration hold is placed on all FTIC students until they complete their
mandatory new student orientation and have registered for the student success course –
EDUC 1300. The registration hold did not negatively impact enrollment and the data in
Table 1 supports that conclusion. Additionally, business processes have been developed,
formally documented, and communicated to all stakeholders in order to ensure all
stakeholders understand the policy and the mechanics to sustaining these critical efforts.
Research shows that a defined pathway, individualized for a student’s specific needs, is a key
factor in completion. The mandatory new student orientation provides each FTIC student

2015 Annual Reflection | 15
with advising to help ensure they get their best start in college. Students are advised to take
their gateway math course their first semester and beginning in Fall 2013, orientation was
switched to a predominantly face-to-face delivery in lieu of online. The data in Table 1
reflects that beginning in 2011, LSC began the journey of implementing the first year
experience to help guide students to the right pathways. Fall 2013 shows a significant
increase, as that is the first semester where the registration hold was implemented and
compliance with the policy was enforced. Weekly data reports to senior administration were
also implemented and are now a part of the data driven culture at LSC.
Research on student persistence indicates the largest proportion of institutional leaving
occurs during the first year and prior to the second year. As part of the first year experience,
all FTIC students are required to take a student success course – EDUC 1300. This course is
designed to empower students, help them excel in the classroom, connect them to college
resources, and adjust to college life. Students are also assigned an academic advisor through
their student success course who provides an additional layer of intentional support through
intrusive academic advising. In Table 2 below, the data shows that persistence rates
predominantly increased in almost every category since Fall 2012. Interestingly, Hispanic
students persist at higher rates than both White and Black students. The data also reflects
that LSC has more work to do in addressing persistence rates for Black students, as their
persistence rates are significantly less than all other populations and have remained constant
over the past 2 years when all other subgroups increased. This indicates commonality with
the national data but is an area LSC will be addressing more systemically in the coming
academic year as part of our completion agenda.
Table 2: First Time In College (FTIC) Students Persistence Rates by Race/Ethnicity
Cohort Race/
Ethnicity
#
Students
in
Cohort
Persistence to First
Spring
Persistence to First
Fall
# % # %
Fall
2010
Cohort
White 3,913 2,876 73% 2,067 53%
Black 1,662 1,254 75% 868 52%
Hispanic 3,373 2,593 77% 2,053 61%
Fall
2011
Cohort
White 3,503 2,678 76% 1,887 54%
Black 2,143 1,601 75% 969 45%
Hispanic 3,699 2,864 77% 2,176 59%
Fall
2012
Cohort
White 3,275 2,452 75% 1,766 54%
Black 2,123 1,616 76% 846 40%

2015 Annual Reflection | 16
Hispanic 4,052 3,141 78% 2,454 61%
Fall
2013
Cohort
White 3,050 2,383 78% 1,720 56%
Black 2,329 1,783 77% 932 40%
Hispanic 4,237 3,398 80% 2,659 63%
c. Describe any achievement gaps shown in the data and how the institution has addressed and/or
plans to address these.
Lone Star College has identified an achievement gap with our Black student population.
While all other subgroup persistence rates have increased since Fall 2012, our Black student
persistence rates have remained flat over the past 2 years. In the table below, the data shows
that while our Black student enrollment has continued to increase, our persistence rates for
those students has not – despite the FTIC interventions for the first year experience. Looking
back to the Fall 2010 cohort, it does appear that LSC has been able to slow the downward
trend, but has not yet been successful at redirecting it upward.
Table 1: First Time In College (FTIC) Students Persistence Rates by Race/Ethnicity
Cohort Race/
Ethnicity
#
Students
in
Cohort
Persistence to First
Spring
Persistence to First
Fall
# % # %
Fall
2010
Cohort
White 3,913 2,876 73% 2,067 53%
Black 1,662 1,254 75% 868 52%
Hispanic 3,373 2,593 77% 2,053 61%
Fall
2011
Cohort
White 3,503 2,678 76% 1,887 54%
Black 2,143 1,601 75% 969 45%
Hispanic 3,699 2,864 77% 2,176 59%
Fall
2012
Cohort
White 3,275 2,452 75% 1,766 54%
Black 2,123 1,616 76% 846 40%
Hispanic 4,052 3,141 78% 2,454 61%
Fall
2013
Cohort
White 3,050 2,383 78% 1,720 56%
Black 2,329 1,783 77% 932 40%

2015 Annual Reflection | 17
Hispanic 4,237 3,398 80% 2,659 63%
In reviewing successful completion of gateway math courses for students placing at college-
level, the data shows that LSC is improving success in the classroom for this student
population. The table below highlights the percentage of Black students successfully
completing their gateway math course within 1 year has increased every year since 2011.
This can be attributed to the Math department implementing several innovative practices
which have resulted in successful completion of college-level math. LSC developed and
implemented some innovative practices that include: New Mathways courses; Math
emporium-style learning (modularized instruction based on individual student needs); and
Non-Course Based Remediation Options (NCBO’s) or short courses targeting different
student populations and individualized based on student need.
Table 2: First Time In College (FTIC) Students Who Placed into College Level Math by
Race/Ethnicity
Cohort Race/
Ethnicity
#
Students
in Cohort
Students Who Placed into College Level Math
# of
Students
Who Placed
into College
Level Math
Successfully
Completed
MATH 1314 in
1 Year
Successfully
Completed
MATH 1314 in
2 Years
Successfully
Completed
MATH 1314
in
3 Years
# % # % # %
Fall 2010
Cohort
White 3,913 704 272 39% 308 44% 324 46%
Black 1,662 69 23 33% 24 35% 25 36%
Hispanic 3,373 378 163 43% 186 49% 196 52%
Fall 2011
Cohort
White 3,503 735 305 41% 353 48% 364 50%
Black 2,143 77 24 31% 26 34% 28 36%
Hispanic 3,699 507 233 46% 279 55% 296 58%
Fall 2012
Cohort
White 3,275 677 287 42% 318 47%
Black 2,123 101 36 36% 40 40%
Hispanic 4,052 613 267 44% 306 50%
Fall 2013
Cohort
White 3,050 763 363 48%
Black 2,329 138 49 36%
Hispanic 4,237 848 450 53%
LSC is committed to improving student success and completion for all students. Specific
strategies designed to serve Black students are being implemented across the System and aim
to increase persistence, graduation and transfer rates. Examples of some of the strategies
include: 1) LSC-CyFair’s Men of Honor program provides mentoring, advising, tutoring,

2015 Annual Reflection | 18
assistance with employment, and opportunities to connect to student life for multi-ethnic men;
2) LSC-North Harris has the Multicultural Academic Support for Students (MASS) Academic
Coaching Program that was created in response to concerns in achievement for Black males and
supports students/mentees by coaching them on self-advocacy, goal clarification, motivation,
time management, and study skills; and 3) LSC-Kingwood has created a Men’s Center with a
mission to recruit, engage and equip male students with essential life and social skills necessary
to begin and complete their degree as well as a Intercultural Center that implements
programming to address awareness, inclusion, and equity around multicultural issues.
2) INTERVENTIONS
a. Provide three years of data for one of the interventions submitted to the Interventions
Showcase.
Ideally, this should be an intervention for which your institution is able to demonstrate scaling (reaching at
least “more” of the target population). A target population is defined as a general cohort and not as a
group of students that has received the benefit of a specific intervention. Use the following formulas when
calculating percentages for this chart.
Students in Intervention as % of Target Population = Number of students served by intervention /
total number of students in the target population
Students in Intervention as % of Total Enrollment = Number of students served by intervention
/ total number of students enrolled
If you do not have data for the most recent academic year, be sure to explain why in the comment box
below. If your intervention is not currently reaching at least more (25.1-60%) of the target student
population, please explain why and describe how your institution is working to remedy any barriers or
challenges it faces to scaling.
Intervention Name: Mandatory Student Success Course – EDUC 1300 Learning Framework
Intervention Summary (100 words or less):
LSC designed a first year experience to increase persistence. Significant resources were required
in order to achieve scale, so an implementation plan and business process were developed.
The key element of the FYE is a mandatory student success course. The SSC includes a system-
wide curriculum coupled with each student being assigned an advisor. In 2012, the SSC was
required for students who placed into two or more developmental education classes. In 2013,
the requirement was scaled to students placing into one or more DE classes and in the fall of
2014, the class became mandatory for the entire FTIC cohort.

2015 Annual Reflection | 19
Target Population: FTIC Students (0 Credit Hours prior to Enrollment at LSC)
Academic Year Number of Students
Served by Intervention
Students in
Intervention as % of
Target Population
Students in
Intervention as % of
Total Enrollment
Fall 2012 5,150 48.6% 8.0%
Fall 2013 7,554 69.8% 11.6%
Fall 2014 9,804 85.4% 14.0%
Comments: N/A
b. Describe how your institution has worked to scale the intervention over the years. Describe any
plans your institution may have to further scale the intervention.
The institutional requirement of a mandatory student success course began in 2011. Over
the first year of implementation, LSC developed more effective business processes to enforce
compliance. These processes include a registration hold, a mandatory new student
orientation, and intrusive advising support offered along the pathway of a student’s
connection, entry and progress toward completion. Throughout the development of these
processes, it became clear that significant institutional resources would be required in order
to truly implement “mandatory.” Technological support was required to initiate the
registration hold and then subsequently continue to assess whether students remained
enrolled during the registration period until classes start. Compliance reports were created
that are distributed to senior level administration at each location on a weekly basis. An
advisory committee, comprised of both faculty and student service personnel, was created in
order to develop curriculum, address challenges/barriers, and make recommendations to
ensure compliance and effectiveness of the requirement. Additional human resources were
required in order to ensure enough faculty and advisors were on board to serve the required
populations.
A scale plan was developed to address these institutional needs, as resource allocation would
take time to bring fully to fruition. LSC established 3 steps to scale:
1. 2012 – all FTIC students who placed into 2 or more developmental education courses
2. 2013 – all FTIC students who placed into 1 one or more developmental education
courses
3. 2014 – all FTIC students (regardless of placement level)
This intervention is now in the continuous improvement cycle and an important element on
the LSC Completion Plan. Key Performance Indicators that are monitored and assessed for
this intervention include: successful course completion rates (both for LSC and as a part of

2015 Annual Reflection | 20
the Texas Completes cadre of colleges), persistence rates (all variations – fall to spring, fall to
fall, fall to second fall, spring to fall, and spring to spring), FYE completed checklist items that
include multiple student success outcomes, and the weekly compliance reports previously
mentioned. Institutionally, LSC is assessing the student success course effectiveness and
analyzing how to increase its impact on the student population. By recently reaching full
FTIC scale in Fall 2014, more data is needed in order to truly assess the SSC effectiveness
over time. Discussions are underway on how to best serve specific target populations such
as Veteran students, International/ESOL students or students in workforce programs. Fall
2015 brings a pilot to offer SSC sections specific to Honors students, which is offered at all of
the LSC locations and could expand past beyond the FTIC population. Additionally, the SSC
is being considered by the General Education Committee as an addition to the LSC core
curriculum. This too would expand the reach of benefit beyond the FTIC cohort. Last, LSC is
in the process of offering students specific pathways to completion of their educational
goals. As that work unfolds, consideration is also being given to the notion of having more
than one SSC option for students based on their specific pathway. This may include creation
of a 1 or 2 credit hour option for certain pathways where the 3 credit hour option is not
appropriate.
3) ABILITY TO LEAD
a. Explain your institution’s contributions to the larger Achieving the Dream network.
Initial applicants should describe how, as a Leader College, your institution will contribute to the larger
Achieving the Dream effort in terms of sharing and supporting replication of successful, scalable, and
sustainable innovations from your campus. Recertification applicants should describe how, as a Leader
College, your institution has contributed to the larger Achieving the Dream effort in terms of sharing and
supporting replication of successful, scalable, and sustainable innovations from your campus.
Lone Star College (LSC) continues to serve as the cadre lead for Texas Completes, a collaboration of
eight Texas college systems and over 35 community colleges (an Educate Texas initiative). Educate
Texas is a public-private alliance focused on one goal: strengthening the public education system so
that every Texas student is prepared for success in school, in the workforce, and in life (www.edtx.org).
Educate Texas has been nationally recognized for tapping into a bold and collaborative approach for
creating transformational change for Texas students. Lone Star College and the other institutions of
higher education in the cadre serve 43% of community colleges in the State of Texas. As a cadre, they
strive to achieve deep student success reform (www.texascompletes.com), through leveraging their
resources to: identify and share best practices; better understand the challenges facing Texas
community colleges today; and promote policy changes that support student completion and other
priority change areas. As a member of Texas Completes, LSC participates on the Texas Student Success
Council, a group comprised of state and field stakeholders representing K-16 education, business, and
non-profits. Lone Star College has been an active member of the Council, additionally providing panel
members at the 2014 Pathways to Progress Institute.
2015 Annual Reflection | 21
Lone Star College also leads a multi-partner, grant-funded project called the Texas Reverse Transfer
Initiative (TRTI). TRTI was developed as a response to state legislation that now requires the
identification of students who transferred from a Texas community college to a university without
receiving an associate’s degree, for the purpose of assessing that students’ eligibility to receive a
degree. More than 20 2-year and 4-year postsecondary institutions across the state participate in this
initiative, along with Educate Texas, the Texas Association of Community Colleges, the National
Student Clearinghouse (NSC) and many other partners. Although this collaboration began as a way to
address a Texas completion agenda item, progress among the partners has resulted in a national
platform that could ultimately break down state boundary challenges to completion. With the
powerful online capabilities of the National Student Clearinghouse (NSC), summer 2015 will bring the
opportunity for students anywhere in the country to benefit from reverse transfer efforts of this
partnership.
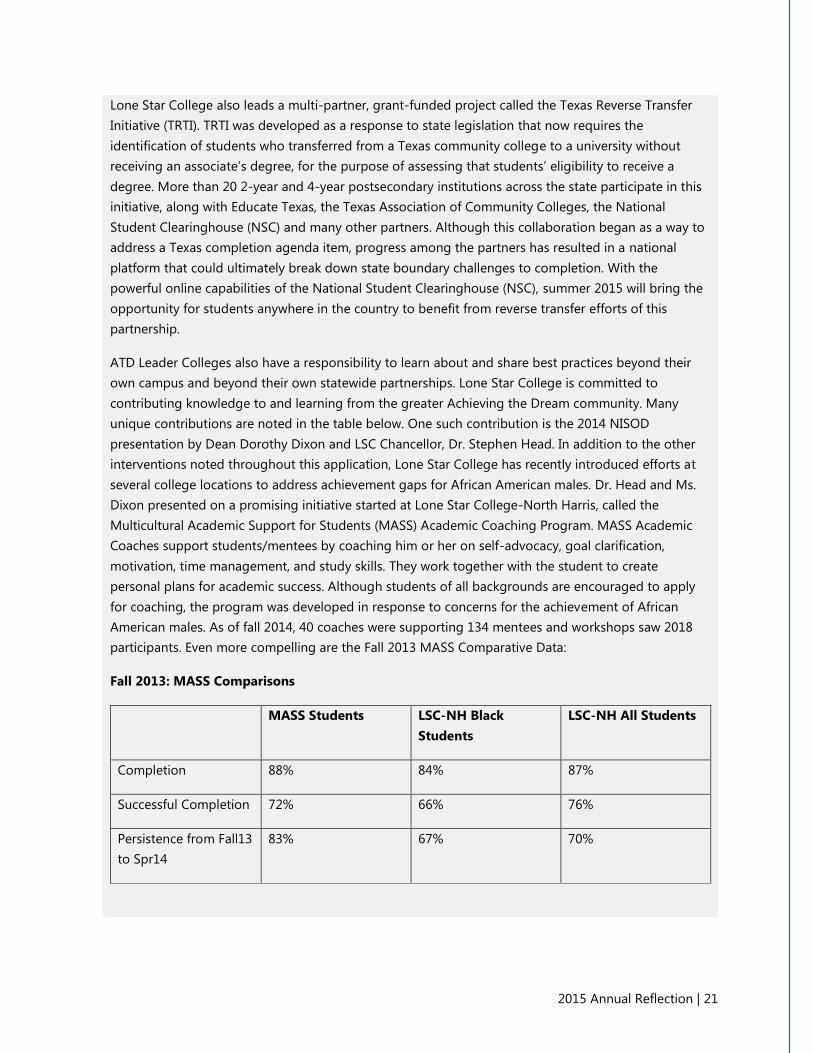
ATD Leader Colleges also have a responsibility to learn about and share best practices beyond their
own campus and beyond their own statewide partnerships. Lone Star College is committed to
contributing knowledge to and learning from the greater Achieving the Dream community. Many
unique contributions are noted in the table below. One such contribution is the 2014 NISOD
presentation by Dean Dorothy Dixon and LSC Chancellor, Dr. Stephen Head. In addition to the other
interventions noted throughout this application, Lone Star College has recently introduced efforts at
several college locations to address achievement gaps for African American males. Dr. Head and Ms.
Dixon presented on a promising initiative started at Lone Star College-North Harris, called the
Multicultural Academic Support for Students (MASS) Academic Coaching Program. MASS Academic
Coaches support students/mentees by coaching him or her on self-advocacy, goal clarification,
motivation, time management, and study skills. They work together with the student to create
personal plans for academic success. Although students of all backgrounds are encouraged to apply
for coaching, the program was developed in response to concerns for the achievement of African
American males. As of fall 2014, 40 coaches were supporting 134 mentees and workshops saw 2018
participants. Even more compelling are the Fall 2013 MASS Comparative Data:
Fall 2013: MASS Comparisons
MASS Students LSC-NH Black
Students
LSC-NH All Students
Completion 88% 84% 87%
Successful Completion 72% 66% 76%
Persistence from Fall13
to Spr14
83% 67% 70%

2015 Annual Reflection | 22
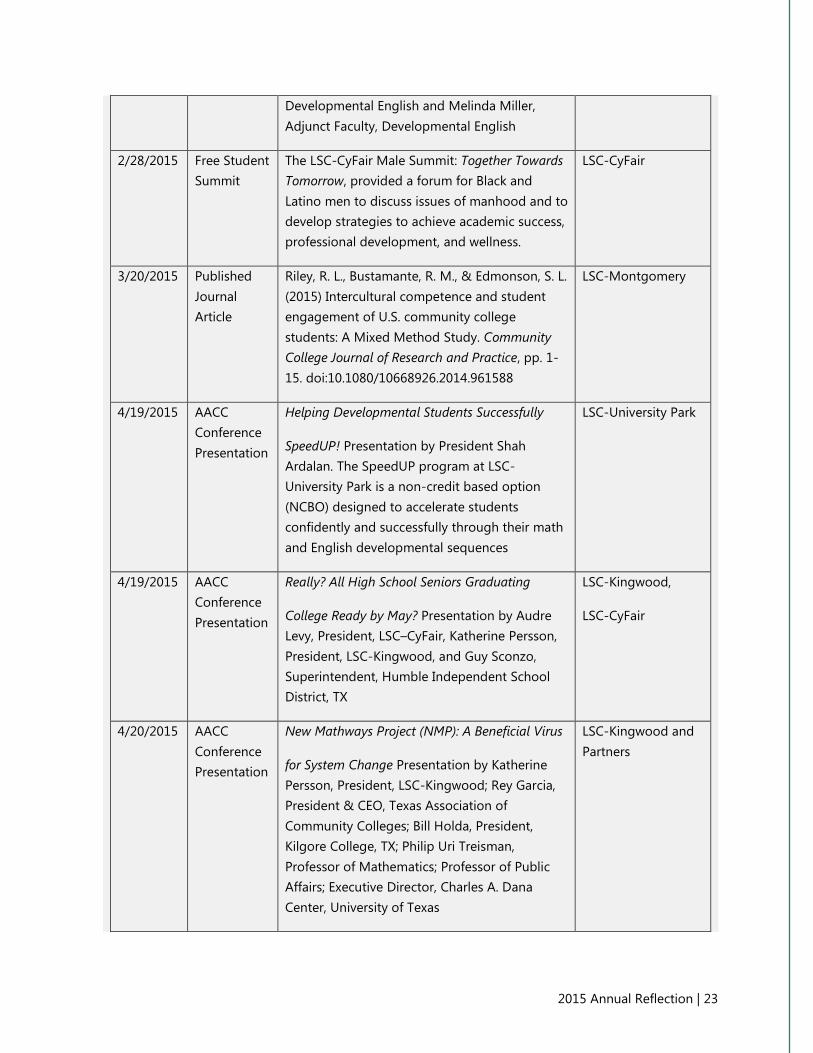
Lone Star College continues to provide a national presence and peer leadership both through
publications and conference participation/presence. The table below provides some highlights from
the past academic year.
Selective Highlights: LSC Ability to Lead
When: Type: What: Who:
3/3/2014 League of
Innovations
Conference
Presentation
Fear! Horror! Technology! A Faculty-Driven
Focus on Student Success. Presentation by Jared
Cootz, Professor, Sociology; Deirdre Hayes-
Cootz, Director, DEDP Grant; Becky Duncan-
Ramirez, Director, Lone Star College - Conroe
Center
LSC-Montgomery
5/12/2014 Published
Journal
Article
Ardalan, S. & Sevanthinathan, N. (2014).
Community colleges: The perfect enterprise for
the 21st century. Community College Week,
26(20), 4-5.
LSC-University Park
5/25/2014 NISOD
Conference
Presentation
Multicultural Academic Support for Students
(MASS): A Game Changing Program for African
American Students. Presentation by Dorothy B.
Dixon, Dean of Academic Success Initiatives and
former LSC-NH President, Dr. Steven Head.
LSC-North Harris
7/14/2014 Published
Journal
Article
Harrell, I. L. (2014). Community college student
success: From boardrooms to classrooms.
Edited by V.S. Morest. Community College
Journal Of Research and Practice, 38(12), 1203-
1205. doi:10.1080/10668926.2014.916149
LSC-CyFair
9/21/2014 Statewide
Conference
Texas Success Center (TSC) 2014 Pathways to
Progress Institute. Hosted by Texas Completes
and the Texas Success Center. Panelists from
LSC included Dr. Stephen Head, Chancellor, and
Jamie Posey, Associate Vice Chancellor, the
Office of Completion.
Lone Star College is
a leader college for
the Texas
Completes Cadre of
Colleges
11/1/2014 ALERS
Conference
Presentation
Reflections of African American High School
Students’ Literacy Education Experiences After
Brown v. Board of Education. Presentation by
Brenda H. Bryant, Associate Professor of
LSC-North Harris
2015 Annual Reflection | 23
Developmental English and Melinda Miller,
Adjunct Faculty, Developmental English
2/28/2015 Free Student
Summit
The LSC-CyFair Male Summit: Together Towards
Tomorrow, provided a forum for Black and
Latino men to discuss issues of manhood and to
develop strategies to achieve academic success,
professional development, and wellness.
LSC-CyFair
3/20/2015 Published
Journal
Article
Riley, R. L., Bustamante, R. M., & Edmonson, S. L.
(2015) Intercultural competence and student
engagement of U.S. community college
students: A Mixed Method Study. Community
College Journal of Research and Practice, pp. 1-
15. doi:10.1080/10668926.2014.961588
LSC-Montgomery
4/19/2015 AACC
Conference
Presentation
Helping Developmental Students Successfully
SpeedUP! Presentation by President Shah
Ardalan. The SpeedUP program at LSC-
University Park is a non-credit based option
(NCBO) designed to accelerate students
confidently and successfully through their math
and English developmental sequences
LSC-University Park
4/19/2015 AACC
Conference
Presentation
Really? All High School Seniors Graduating
College Ready by May? Presentation by Audre
Levy, President, LSC–CyFair, Katherine Persson,
President, LSC-Kingwood, and Guy Sconzo,
Superintendent, Humble Independent School
District, TX
LSC-Kingwood,
LSC-CyFair
4/20/2015 AACC
Conference
Presentation
New Mathways Project (NMP): A Beneficial Virus
for System Change Presentation by Katherine
Persson, President, LSC-Kingwood; Rey Garcia,
President & CEO, Texas Association of
Community Colleges; Bill Holda, President,
Kilgore College, TX; Philip Uri Treisman,
Professor of Mathematics; Professor of Public
Affairs; Executive Director, Charles A. Dana
Center, University of Texas
LSC-Kingwood and
Partners

2015 Annual Reflection | 24
Submitting the Annual Reflection and Leader College Application
Congratulations! You have completed the Annual Reflection and Leader College Application worksheet.
When you are ready, follow the next steps:
Using the link sent to your Core Team Leader(s), copy and paste your responses into the online
Annual Reflection and Leader College Application form. You will be asked to upload your data at
the end of the online form.
If you have not done so, enter your planned interventions in the Interventions Showcase. Your
Core Team Leader(s) will have received instructions to enter the Interventions Showcase in mid-
April.

2015 Annual Reflection | 25
APPENDIX A
ACHIEVING THE DREAM STUDENT
SUCCESS MEASURES & DEFINITIONS
General Student Success Data Specifications
Achieving the Dream recommends:
That each institution analyze at least four years of disaggregated data for its student success
measure.
We realize that some of the newer Achieving the Dream institutions may not have four
years of disaggregated data available for each measure. If your institution is not able to
analyze at least four years of data for a measure, we ask that you simply indicate this in
your narrative response.
That data be disaggregated on at least three levels:
Ethnicity/race, gender, and income status
Defining Cohorts
Below are three possible ways that your college may choose to define student cohorts when analyzing
data for the Annual Reflection. Colleges should disaggregate data on at least three levels: race/ethnicity,
gender, and income status.
The ATD Cohort includes all students who are first-time degree- or certificate-seeking students
new to your institution during the fall term, including students who were previously enrolled as
dual-enrollment high school students.
First Time in College (FTIC) and refers to any students who are in college for the first time (any
college)
First-Time to Institution refers to any students who are new to attending your institution
Student Success Measures
Measure 1: Successfully complete developmental instruction and advance to credit-
bearing courses
Definition: Number and percentage of students successfully completing developmental course
requirements in two years
Institution may define the developmental education course one of three ways:
(1) Math

2015 Annual Reflection | 26
(2) English
(3) Math and English
Cohort Definition Options: Institutions should define the cohort of students that they track in this
measure by choosing one of the following cohorts:
All students in the ATD Cohort (referred)
All FTIC students (referred)
All First Time to Institution students (referred)
Measure 2: Enroll in and successfully complete college-level or Gateway courses (math
and/or English)
Definition: Number and percentage of students successfully completing gateway courses within three
years
Institution may define the developmental education course one of three ways:
(1) Math
(2) English
(3) Math and English
Cohort Definition Options: Institutions should define the cohort of students that they track in this
measure by choosing one of the following cohorts:
All students in the ATD Cohort
All FTIC students
All First Time to Institution students
All students
Measure 3: Persist from term-to-term or year-to-year
Definition: Number and percentage of students persisting from term-to-term or year-to-year
Institution may define persistence in one of two ways:
Term-to-term: first enrollment term to next major term (e.g. fall to spring)
Year-to-year: (e.g. fall to fall)
Cohort Definition Options: Institutions should define the cohort of students that they track in this
measure by choosing one of the following cohorts:
All students in the ATD Cohort
All FTIC students

2015 Annual Reflection | 27
All First Time to Institution students
All students except those graduating or transferring
Measure 4: Attain a credential
Definition: Number and percentage of students attaining a degree or credential within four years
Cohort Definition Options: Institutions should define the cohort of students that they track in this
measure by choosing one of the following cohorts:
All students in the ATD Cohort
All FTIC students
All First Time to Institution students
All students

2015 Annual Reflection | 28
APPENDIX B
DATA TEMPLATE
Persistence: Fall to Spring
Persistence Fall to Fall
FTIC Completion of College Level Math

2015 Annual Reflection | 29
Institution Name:
Define the Persistence (Fall to
Fall/Fall to Spring
N # Persisting % Persisting N # Persisting % Persisting N # Persisting % Persisting N # Persisting % Persisting
All 10,242 7,630 74% 10,369 7,944 77% 10,544 8,069 77% 10,835 8,566 79%
Hispanic 3,411 2,593 76% 3,702 2,864 77% 4,053 3,141 77% 4,237 3,398 80%
Black 1,680 1,254 75% 2,143 1,601 75% 2,122 1,616 76% 2,329 1,783 77%
White 3,934 2,876 73% 3,508 2,678 76% 3,275 2,452 75% 3,051 2,383 78%
Male 4,712 3,360 71% 4,713 3,468 74% 4,698 3,419 73% 4,926 3,737 76%
Female 5,530 4,270 77% 5,656 4,476 79% 5,846 4,650 80% 5,909 4,829 82%
Pell 3,695 3,100 84% 5,063 4,171 82% 4,982 4,075 82% 5,363 4,460 83%
Non-Pell 6,547 4,530 69% 5,306 3,773 71% 5,562 3,994 72% 5,472 4,106 75%
Total System unduped Headcount
Cell B10 represents 17% of total enrollment 60,280 17%
Cell E10 represents 16% of total enrollment 63,359 16%
Cell H10 represents 16% of total enrollment 64,617 16%
Cell K10 represents 17% of total enrollment 65,362 17%
Lone Star College
Persist from Term-to-Term or Year-to-Year
All FTIC Students
Fall 2014Fall 2010 Fall 2011 Fall 2012 Fall 2013
Fall to Spring

2015 Annual Reflection | 30
Institution Name:
Define the Persistence (Fall to
Fall/Fall to Spring
N # Persisting % Persisting N # Persisting % Persisting N # Persisting % Persisting N # Persisting % Persisting
All 10,242 5,710 56% 10,369 5,655 55% 10,544 5,734 54% 10,835 6,093 56%
Hispanic 3,411 2,053 60% 3,702 2,176 59% 4,053 2,454 61% 4,237 2,659 63%
Black 1,680 868 52% 2,143 969 45% 2,122 846 40% 2,329 932 40%
White 3,934 2,067 53% 3,508 1,887 54% 3,275 1,766 54% 3,051 1,720 56%
Male 4,712 2,454 52% 4,713 2,416 51% 4,698 2,419 51% 4,927 2,669 54%
Female 5,530 3,256 59% 5,654 3,239 57% 5,844 3,315 57% 5,908 3,424 58%
Pell 3,695 2,209 60% 5,063 2,737 54% 4,983 2,581 52% 5,363 2,818 53%
Non-Pell 6,547 3,501 53% 5,304 2,918 55% 5,559 3,153 57% 5,472 3,275 60%
Total System unduped Headcount
Cell B10 represents 17% of total enrollment 60,280 17%
Cell E10 represents 16% of total enrollment 63,359 16%
Cell H10 represents 16% of total enrollment 64,617 16%
Cell K10 represents 17% of total enrollment 65,362 17%
Fall 2014Fall 2010 Fall 2011 Fall 2012 Fall 2013
Lone Star College
Persist from Term-to-Term or Year-to-Year
Fall to Fall
All FTIC Students

2015 Annual Reflection | 31
Institution Name:
Define Measure
N # Successful % Successful N # Successful % Successful N # Successful % Successful N # Successful % Successful
All 1,367 548 40% 1,529 649 42% 1,657 699 42% 2,118 1,031 49%
Hispanic 378 163 43% 507 233 46% 613 267 44% 848 450 53%
Black 69 23 33% 77 24 31% 101 36 36% 138 49 36%
White 704 272 39% 735 305 41% 677 287 42% 763 363 48%
Male 832 303 36% 917 357 39% 969 366 38% 1,215 531 44%
Female 535 245 46% 612 292 48% 688 333 48% 903 500 55%
Pell 322 148 46% 452 207 46% 551 225 41% 762 360 47%
Non-Pell 1,045 400 38% 1,077 442 41% 1,106 474 43% 1,356 671 49%
Total System unduped Headcount
Cell B10 represents 2% of total enrollment 60,280 2%
Cell E10 represents 2% of total enrollment 63,359 2%
Cell H10 represents 3% of total enrollment 64,617 3%
Cell K10 represents 3% of total enrollment 65,362 3%
Fall 2014Fall 2010 Fall 2011 Fall 2012 Fall 2013
Lone Star College
FTIC Students Who Placed into College Level Math and Successfully
Completed MATH 1314 in 1 Year
FTIC Students Who Placed into College Level Math


