96
2015 ANNUAL REPORT
2015 AnnuAl RepoRt
2Annual Report 2015
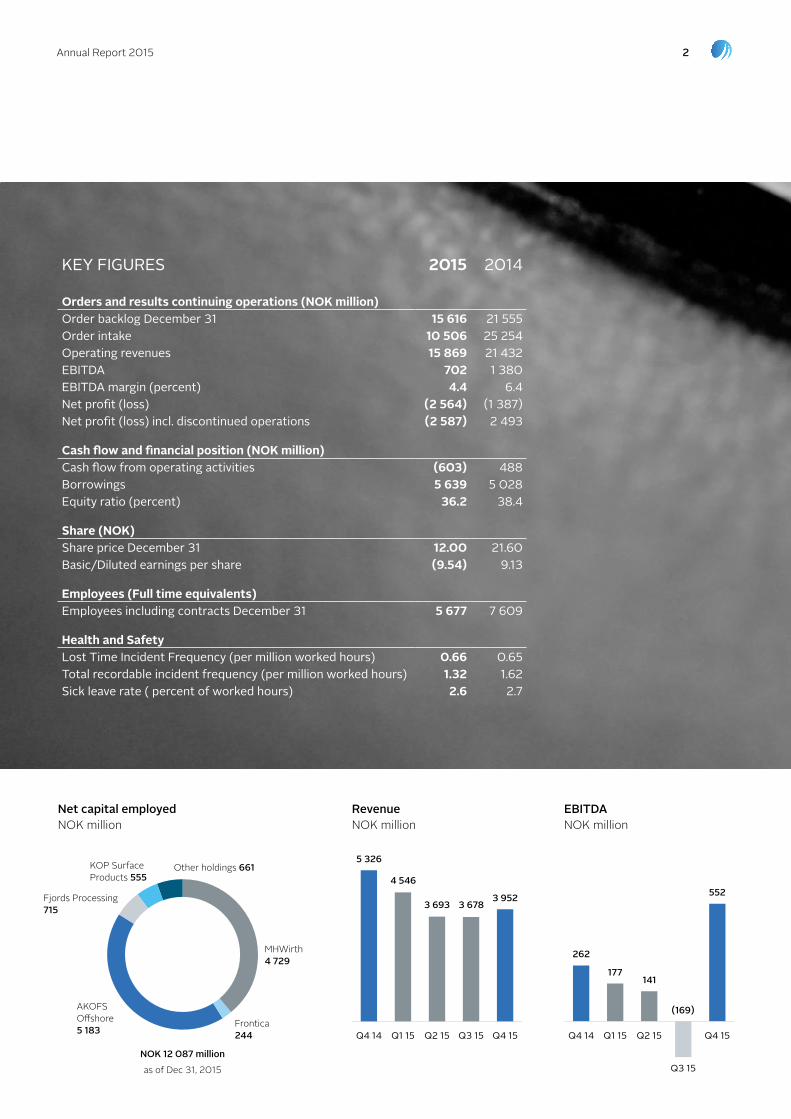
Net capital employednoK million
MHWirth 4 729
Fjords processing 715
other holdings 661
Frontica 244
Kop Surface products 555
AKoFS offshore 5 183
RevenuenoK million
Q4 14
5 326
4 546
3 693 3 6783 952
Q1 15 Q2 15 Q3 15 Q4 15
EBITDAnoK million
552
262
177141
(169)
Q4 14 Q1 15 Q2 15
Q3 15
Q4 15
Key figures 2015 2014
Orders and results continuing operations (NOK million)Order backlog December 31 15 616 21 555 Order intake 10 506 25 254 Operating revenues 15 869 21 432 eBiTDA 702 1 380 eBiTDA margin (percent) 4.4 6.4 Net profit (loss) (2 564) (1 387) Net profit (loss) incl. discontinued operations (2 587) 2 493
Cash flow and financial position (NOK million)Cash flow from operating activities (603) 488Borrowings 5 639 5 028 equity ratio (percent) 36.2 38.4
Share (NOK)share price December 31 12.00 21.60Basic/Diluted earnings per share (9.54) 9.13
Employees (Full time equivalents)employees including contracts December 31 5 677 7 609
Health and SafetyLost Time incident frequency (per million worked hours) 0.66 0.65Total recordable incident frequency (per million worked hours) 1.32 1.62sick leave rate ( percent of worked hours) 2.6 2.7
NOK 12 087 million as of Dec 31, 2015
3Annual Report 2015
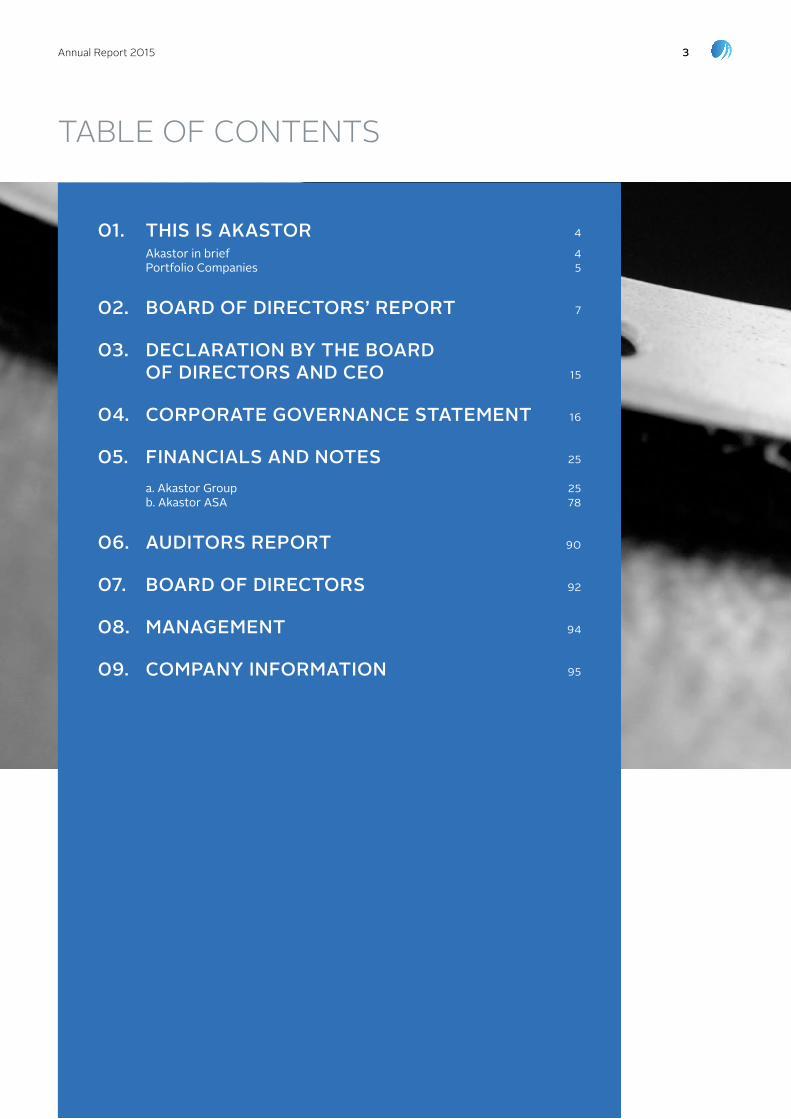
tAble oF ContentS
01. ThIs Is AKAsTOR 4
Akastor in brief 4Portfolio Companies 5
02. BOARD Of DIREcTORs’ REpORT 7
03. DEclARATION By ThE BOARD Of DIREcTORs AND cEO 15
04. cORpORATE gOvERNANcE sTATEmENT 16
05. fINANcIAls AND NOTEs 25
a. Akastor group 25b. Akastor AsA 78
06. AuDITORs REpORT 90
07. BOARD Of DIREcTORs 92
08. mANAgEmENT 94
09. cOmpANy INfORmATION 95
4Annual Report 2015 | This is Akastor
AKAsTOr iN Brief
Akastor is a norway-based oil-services investment company with a portfolio of industrial holdings and other investments. the company has a flexible mandate for active ownership and long-term value creation.
the portfolio comprises: drilling systems and lifecycle services supplier MHWirth; vessel-based subsea well construction and intervention services provider AKoFS offshore; process systems and services supplier Fjords processing; surface oil and gas equipment supplier Kop Surface products; corporate services provider Frontica; and other smaller sized holdings. the portfolio businesses are developed as stand-alone entities under the Akastor umbrella and represent the Company’s six reporting segments. Akastor operates globally and has a number of subsidiaries located in Australia, Canada, China, Germany, Indonesia, Malaysia, the netherlands, norway, Singapore, the united Kingdom, the united Arab emirates, and the united States, among others.
Akastor has a range of strategic, operational and financial value-creating measures at its disposal, including operational improvements and organic growth, acquisitions and divestments, and financial measures. our aim is to maximize the value potential of each entity by clarifying the portfolio companies’ business models, capitalize on their market positions, and strengthen underdeveloped areas of value creation.
Aker Kværner Holding AS, which is owned by Aker ASA and the norwegian government, is the largest shareholder of Akastor owning 40.27 percent of the shares. the Akastor shares are traded on the oslo Stock exchange under the ticker AKA.
Akastor’s portfolio companies generated 2015 revenues of noK 15.9 billion, ebItDA of noK 702 million and employ 5 677 people worldwide. Akastor operates a lean corporate centre with 23 employees situated at Fornebu, bærum, norway.
01. tHIS IS AKAStoR
This
is A
kast
or

5Annual Report 2015 | This is Akastor
POrTfOLiO COmPANies
MHWirth is a leading global provider of first-class drilling solutions and services designed to offer its customers with the safer, more efficient and reliable alternative. the company vision drives a commitment to quality and economic advantages to its customers and stakeholders.
With a legacy founded more than a century ago, MHWirth has transformed into a brand reflective of the company strategy and ambitions. the company’s reputation is preserved through a combination of values, people and innovative technologies, proven by a strong track record and customer success stories.
MHWirth has a global reach covering five continents with offices in more than 16 countries. Drawing upon global market experience, the company continues to seize opportunities through the established regional presence in the Americas, europe, Asia and West Africa. the company has 3 005 employees. MHWirth had revenues of noK 6.7 billion and a negative ebItDA of noK 176 million in 2015.
Frontica is a leading provider of key corporate services re-quired for business growth. Frontica operates through two distinct business areas; Frontica Advantage offering compre-hensive staffing, recruitment and global mobility solutions, and Frontica business Solutions providing solutions within the It operations and business process outsourcing segments, hereunder information technology, procurement, finance, pay-roll, business consulting and administrative services. With 983 employees located in Asia, brazil, europe and north America, Frontica had revenues of noK 4.9 billion and ebItDA of noK 260 million in 2015.
AKOFS Offshore is a provider of vessel-based subsea well construction and intervention services to the oil and gas industry. the company has a highly competent and diverse organization, covering all phases from conceptual development to project execution and offshore operations.
the company currently operates three state-of-the-art vessels, the AKoFS Seafarer, the Skandi Santos and the Aker Wayfarer, which are designed to perform operations in up to 3 000 meters (9 800 feet) of water. the Skandi Santos began operating in 2010, the Aker Wayfarer in 2011 and the AKoFS Seafarer in 2013, making AKoFS offshore’s fleet one of the most modern of its kind.
AKoFS offshore has the competence and equipment needed to provide superior offshore oilfield services to leading oil and gas producers and subsea service providers around the globe. AKoFS offshore had revenues of noK 718 million, ebItDA of noK 104 million in 2015 and employs approximately 90 people.
Fjords Processing provides wellstream world-class processing technology, systems and services to the upstream oil and gas industry. the company delivers market-leading solutions for separation and treatment of oil and gas, based on innovative technology and extensive competence accumulated over the last 40 years. Fjords processing is one of the few companies in the industry that can offer complete processing systems for both onshore and offshore installations.
With a comprehensive product portfolio, Fjords processing delivers unique solutions across all oil, gas and water treatment segments. the product range includes fluid stream separation, oil and gas processing, and water treatment. Market leading technology and expertise are combined to create tailored solutions to meet customer specifications and on-site conditions within this product range.
Fjords processing is headquartered at Fornebu in norway and the company has 545 employees represented in 17 countries. Hence, Fjords processing is a global provider with local presence in the key oil and gas centres around the world. Fjords had revenues of noK 1.9 billion and ebItDA of 104 million in 2015.
KOP Surface Products is a leading global supplier of surface wellheads, trees, valves and actuators to the oil and gas industry. Kop provides full life-of-field support to customers, including installation, maintenance, rental and refurbishment services. the client list includes some of the biggest names in the industry and the products and quality programs comply with the highest international standards.
Revenue and ebItDA of Kop Surface products was 1.1 billion and 242 million (respectively) employing 682 people at year-end 2015.
Real Estate and other holdings In addition to the portfolio companies, Akastor has invested in other smaller sized holdings which include 100 percent ownership of First Geo, a 76 percent stake in Step oiltools, 50 percent stake in DoF Deepwater and a 7.4 percent stake in ezra.
Akastor Real estate divested eight properties to Aker in 2015 for a total value of noK 1.2 billion. Akastor Real estate also divested its 17 percent stake in a property in the oslo area for noK 30 million the first quarter of 2015. In addition, Akastor Real estate managed a subletting portfolio and a few development projects during 2015.
Akastor Real estate and other holdings reported revenues of noK 1.2 billion and ebIDtA of noK 168 million in 2015.

6Annual Report 2015 | cEO letter

Annual Report 2015 | BOD Report 7
Akastor ASA (hereinafter referred to as Akastor) is an investment company based in norway with a portfolio of companies in the oilfield services sector. Aker Kværner Holding AS, which is owned by Aker ASA and the norwegian government, is the largest shareholder of Akastor with a shareholding of 40.27 percent. the shares of Akastor are traded on the oslo Stock exchange under the ticker AKA. the Akastor portfolio of companies had a total capital employed of noK 12.1 billion at the end of 2015.
Akastor’s total revenue in 2015 decreased by 26 percent, whilst ebItDA was down 49 percent, mainly due to tougher market conditions for all portfolio companies during 2015. the order backlog amounted to noK 15.6 billion at the end of 2015 compared to noK 21.6 billion a year earlier. the order intake for 2015 was noK 10.5 billion.
Company Overview
Akastor, in its present form is a result of the split of the oilfield services company, now known as Aker Solutions ASA in 2014. In September 2014, the former Aker Solutions group was demerged, and Akastor and Aker Solutions became two separately listed entities.
Akastor is primarily focused on the oilfield services sector. the portfolio in 2015 covers a range of industrial holdings in this sector, all in varying stages of maturity, including:
�� MHWirth which provides drilling systems and lifecycle services
�� Frontica, global provider of corporate and staffing services
�� AKoFS offshore, a vessel-based subsea well installation and intervention services provider
�� Fjords processing, which provides wellstream processing technology and services
�� Kop Surface products, which delivers surface oil and gas equipment
�� Step oiltools, a drilling waste management company, of which Akastor owns 76 percent
�� First Geo, which delivers subsurface advice and products to e&p companies
Akastor Real estate divested all properties in 4Q 2015, as described in the section “the Akastor portfolio.”
In addition, Akastor owns some financial investments such as shares in ezra Holdings ltd and DoF Deepwater AS. each Akastor portfolio company is organized as an independent business with its own dedicated management teams, fully responsible for all aspects of its operations. All portfolio
02. boARD oF DIReCtoRS’ RepoRt companies have separate boards, which consist of dedicated Akastor investment managers, and in some of the boards, external board representatives and employee representatives. this lays the foundation for close cooperation between Akastor, the portfolio companies and their employees.
Akastor is based in norway, at Fornebu, just outside oslo, with a core team of 23 employees, working closely with the boards and management of its portfolio companies.
Akastor’s portfolio companies have a total of 5 677 employees with presence in 35 countries by the end of 2015.
strategy
Akastor is an investment company, based on a similar business philosophy as companies in the private equity sphere, advocating an independent approach for each portfolio company to optimize its development potential. Akastor aims to create long-term value for its shareholders through an active development of its portfolio companies as stand-alone businesses, while maintaining the flexibility to be opportunistic. Akastor works closely with the companies management to make decisions on business development, acquisitions and divestments to maximize the value of each company. each portfolio business develops and executes independent value creation plans in close cooperation with the Akastor investment team. As an owner, Akastor emphasizes understanding the portfolio companies markets and challenges in depth, in order to evaluate current valuation versus future potential.
Akastor seeks to maximize value by combining strategic, operational and financial measures. Akastor plans to establish separate financing for each operational unit to increase the portfolio companies’ flexibility and independence.
the business models of the portfolio companies are decentralized, but as part of the Akastor portfolio, all companies share a common foundation based on Akastor’s values and compliance structure.
Akastor owns companies at varying stages of maturity, and will have to base future M&A decisions on independent plans for each company, developed in close cooperation with each company’s board of directors and management.
Akastor will continue to own portfolio companies as long as Akastor can create additional value from its ownership. Capital discipline is a key focus. Akastor will only pursue new investments generating returns above the cost of equity. Akastor will either return excess cash to shareholders, or re-invest into its current portfolio, if such an investment can speed up the delivery of the value creation plans for the portfolio. Bo
ard
of D
irect
ors’
repo
rt
Annual Report 2015 | BOD Report 8
market Outlook
Akastor’s portfolio companies all operate within the oilfield services industry. the market outlook for 2016 is affected by the sharp decline in oil prices seen last year. e&p companies’ increased focus on capital discipline and reduction of upstream investments are expected to persist throughout 2016. the oil and gas services segment observed significant delays and re-tendering through 2015, and the e&p companies are likely to postpone new developments and thus further prolong the current market downturn beyond 2016.
Akastor’s order backlog was down 28 percent, or noK 5.9 billion by the end of 2015 compared to 2014. Akastor still expects the market conditions to be demanding for all its portfolio companies in 2016.
Akastor has a strong liquidity buffer, giving the opportunity to provide support to the portfolio companies in case it is needed in periods with challenging markets. As an active owner, Akastor will in the near-term focus on adjusting its businesses to the current market conditions. In a longer-term perspective, the oilfield services market is expected to improve, and Akastor will work closely with the portfolio companies to position them for growth in current and new markets.
group financial Performance
Akastor presents its consolidated financial statements in accordance with the International Financial Reporting Standards (IFRS) as adopted by the european union. All amounts below refer to the consolidated financial statements for the group, unless otherwise stated.
the main portfolio companies included in Akastor’s consolidated financial statements are the following: MHWirth, Frontica, AKoFS offshore, Fjords processing and Kop Surface products. In addition, Akastor has 100 percent ownership of First Geo AS, 76 percent shareholding in Step oiltools, 50 percent stake in DoF Deepwater AS and 7.4 percent shareholding in ezra Holdings ltd which are reported in the reporting segment Real estate and other holdings.
income statement
operating revenue and other income for 2015 decreased by 26 percent to noK 15.9 billion due to lower activity and weaker market conditions in the oil service industry in general, and in the offshore drilling market in particular. earnings before interest, tax, depreciation and amortization (ebItDA) decreased by 678 million to noK 702 million. earnings in 2015 were impacted by reduced revenues for MHWirth and low activity for the vessel AKoFS Seafarer in AKoFS offshore. net financial items ended at noK -691 million in 2015 compared to noK -947 million in the previous year.
Depreciation and amortization rose by noK 0.2 billion to noK 1.1 billion in the previous year. In addition, impairment losses of noK 1.8 billion were recognized in 2015. the vessel
AKoFS Seafarer was impaired by noK 1 billion triggered by the weak market conditions which are expected to continue in the medium term. Further, an impairment of noK 0.5 billion was recognized related to the Mpo business in MHWirth, as financial performance has been challenging due to current industry conditions.
the group had an operating loss of noK 2.2 billion, mainly due to the above-mentioned impairments. Several other non-recurring items impacted the results, including provisions related to onerous offices leases, gain from realization of the real estate portfolio in Real estate and other holdings, and restructuring costs in MHWirth. the pre-tax loss for the year was noK -2.9 billion, compared to a loss of noK -1.7 billion the previous year.
the income tax benefit for 2015 was noK 286 million, on the same level as in 2014. the effective tax rate is influenced by several one-off items, such as impairment of deferred tax assets, mix of revenue generated in various jurisdictions, as well as tax effects from currency fluctuations in entities that are taxable in a currency other than the functional currency.
earnings per share for continuing operations were negative noK 9.46 in 2015, compared with negative noK 5.09 a year earlier.
the board of directors has resolved to propose to the annual general meeting that no dividend is distributed for 2015, in line with Akastor’s dividend policy.
financial Position
total assets of Akastor amounted to noK 20.5 billion as of December 31, 2015, compared with noK 24.4 billion at year-end 2014. the decrease reflects reduction in current operating assets of noK 1.6 billion, impairments of noK 1.8 billion as well as the disposal of real estate portfolio of noK 1.0 billion.
total operating liabilities in the portfolio companies decreased by noK 1.8 billion, mainly explained by decreased activity level. Gross debt increased by noK 0.6 billion, which reflects net increased borrowings of noK 0.2 billion and exchange rate fluctuations in uSD. As of December 31, 2015, the interest coverage ratio was below the minimum level as defined in the loan agreement. borrowings of noK 3.6 billion, with maturity in 2017 and 2019, are therefore presented as current borrowings.
on March 11, 2016, Akastor signed a new agreement with its bank syndicate on main terms and conditions to amend and extend its financing structure, including new covenant levels.
total equity amounted to noK 7.4 billion by the end of 2015, compared to noK 9.4 billion the year before. the equity ratio was 36 percent as of December 31, 2015, reduced from 38 percent in 2014.
Annual Report 2015 | BOD Report 9
large projects activity level which was impacted by the current downcycle in the offshore drilling market. ebItDA dropped from noK 941 million in 2014 to negative noK 176 million in 2015 which was driven by the reduction in activity level for large projects, restructuring cost and Managed pressure operations (Mpo) which had had a negative ebItDA of noK 219 million. An impairment related to Mpo of noK 488 million was charged to the results in 2015 as financial performance has been challenging due to current industry and operational conditions. MHWirth is currently evaluating strategic alternatives for Mpo. the Drilling lifecycle Services business continued with a high activity level throughout 2015 and only saw a modest reduction from 2014 activity levels. Activity levels were driven by a high level of spare parts sales and overhaul related work to operating rigs.
Working capital (nCoA) ended at the same level as year-end 2014. A significant part of the noK 2.3 billion of working capital is tied up in the large projects business.
the offshore drilling market slowed down significantly in 2015 resulting in a number of prospects and tenders being cancelled or delayed. no newbuild orders for high-end floaters were placed in 2015. this slow-down impacted MHWirth’s order intake, which ended down by 49 percent compared to 2014. the order backlog was reduced by 40 percent during the year. A significant portion of MHWirth’s backlog is for delivery of seven drilling packages to Jurong Shipyard in Singapore, for operations in brazil. Due to the financial uncertainty of Jurong’s client, Sete brazil, the reduced pace of progress will continue until a conclusion is reached on the brazil situation.
In response to the market slowdown, MHWirth has throughout 2015, and into 2016, adjusted organizational capacity and has announced aggregated personnel reductions of approximately 2 300 people, corresponding to a reduction of around 54 percent compared to year-end 2014. the cost base is expected to be reduced by around noK 1.7 billion, with restructuring costs of noK 235 million recognized in 2015. MHWirth will continue to make necessary adjustments to its cost base in accordance with market conditions to ensure profitability of the company at lower activity levels.
While making the adjustments necessary to face the current challenging market, MHWirth has also continued in 2015 to launch and progress a number of initiatives to increase efficiency and improve its competitive position for when the market picks up. this work includes product standardization, streamlining of processes, targeted strengthening of customer relations and improved organizational effectiveness.
FronticaFrontica is a leading provider of key corporate services with operations in seven countries and business deliveries in over 30 countries around the world. the company operates through two distinct business areas; Frontica Advantage is offering comprehensive staffing, recruitment, outplacement and global mobility solutions. Frontica business Solutions is providing
Cash flow
As of December 31, 2015, Akastor had cash of noK 0.6 billion, a reduction from noK 1.1 billion in 2014. the net cash flow from operating activities was noK -0.6 billion, and reflects an increase in working capital, cash out flow on hedges and interest costs.
net cash flow from investing activities was by noK -0.2 billion compared to noK 4.5 billion in 2014. Disposals of business in 2015 were noK 1.2 billion, compared to noK 5.9 billion in 2014. the disposals in 2015 related to disposal of Akastor’s real estate portfolio. Investing activities also include capex investments of noK 1.6 billion compared to noK 1.9 billion in 2014. the capex investments in 2015 included the purchase of AKoFS Seafar-er vessel of uSD 122.5 million. no new business acquisitions were carried out in 2015, however noK 11 million was paid in deferred consideration on acquisitions in prior periods.
net cash flow from financing activities amounted to noK 0.2 billion and reflected additional borrowings in 2015.
going Concern
As per December 31 2015, the interest covenant ratio was below the minimum level of 4.0 as defined in the loan agreements with its bank syndicate. on March 11 2016 new loan agreements were signed with the same banks, setting the interest covenant ratio on lower levels for the period Q4 2015 – Q1 2017. the board of directors confirms that the company is a going concern and that the 2015 financial statements have been prepared on a going concern basis.
The Akastor Portfolio
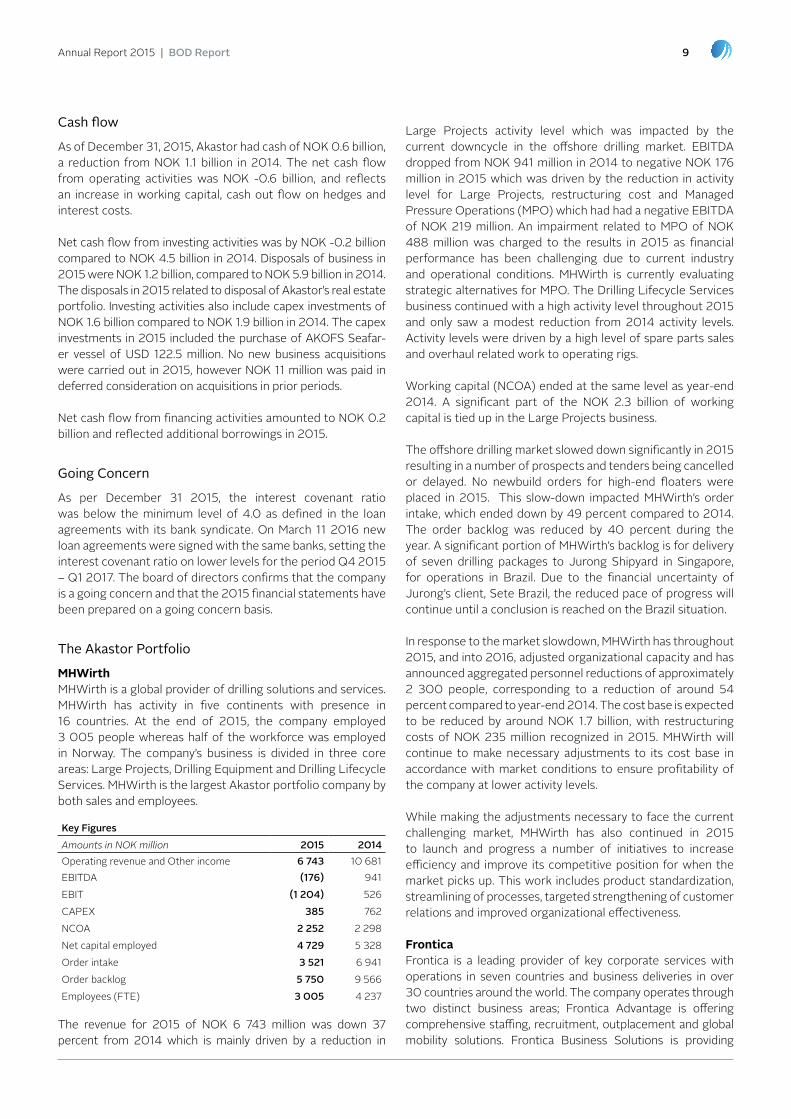
MHWirthMHWirth is a global provider of drilling solutions and services. MHWirth has activity in five continents with presence in 16 countries. At the end of 2015, the company employed 3 005 people whereas half of the workforce was employed in norway. the company’s business is divided in three core areas: large projects, Drilling equipment and Drilling lifecycle Services. MHWirth is the largest Akastor portfolio company by both sales and employees.
the revenue for 2015 of noK 6 743 million was down 37 percent from 2014 which is mainly driven by a reduction in
Key figuresAmounts in NOK million 2015 2014operating revenue and other income 6 743 10 681ebItDA (176) 941ebIt (1 204) 526CApeX 385 762nCoA 2 252 2 298net capital employed 4 729 5 328order intake 3 521 6 941order backlog 5 750 9 566employees (Fte) 3 005 4 237

Annual Report 2015 | BOD Report 10
in dry-dock, from early March until mid-April 2015, the vessel then embarked on this extension period. the vessel has operated at close to full utilisation since the dry-dock period and continues to build on its strong track record in brazil.
Aker Wayfarer worked for the first ten months of 2015 off the coast of Germany and experienced full utilisation for the period.
A new five-year contract (plus a five-year option) for Aker Wayfarer with petrobras was signed in 2014 with the vessel expected to be in operation from third quarter 2016. As with Skandi Santos, the vessel will perform subsea installation work offshore brazil, installing and testing of deepwater subsea X-mas trees and other production equipment. Following completion of the work offshore Germany, the Aker Wayfarer mobilised to a shipyard in norway for the first five years classing and preparation for the petrobras contract. the classing and conversion is currently being executed in accordance with the planned time and budget.
the Wayfarer conversion investment of around noK 600 million is being financed through the vessel owner ocean Yield. In addition, investments of around noK 260 million will be made in order to prepare the vessel for the contract with petrobras.
the company’s results reflect that AKoFS Seafarer was idle most of 2015. the AKoFS Seafarer vessel was purchased by AKoFS offshore from DoF Subsea in February 2015 for uSD 122.5 million. However, in a period of challenging market conditions, further work has not been secured. In the third quarter a decision was made to reduce operating preparedness and thereby expenses to less than uSD 10 000 per day from the end of 2015. An impairment loss for the vessel of noK 1 billion was recognised in the third quarter due to the deterioration in market outlook. the vessel is currently lying idle in norway and will continue to be actively marketed for work in the subsea construction and service market as well as light Well Intervention.
AKoFS offshore had an order intake of noK 0.3 billion for the full year of 2015, compared to noK 6.1 billion in 2014. this is mainly explained by the five-year extension of the contract with petrobras for Skandi Santos, and the new five-year contract for Aker Wayfarer with the same client in 2014 while 2015 order intake was mainly related to Aker Wayfarer extensions for its work off the coast of Germany.
solutions within It and business processes outsourcing, including information technology, procurement, finance, payroll, business consulting and administrative services.
Frontica had revenues of noK 4 919 million in 2015, down from noK 5 753 million in 2014 due to lower activity level within all service areas, with most significant effect within temporary staffing (Frontica Advantage). the ebItDA of noK 260 million is down noK 55 million compared with 2014. the ebItDA margin is 5.3 percent compared with 5.5 percent in 2014. the order backlog of noK 1.8 billion represents the estimated value of the fixed contracts and frame agreements for Frontica. In February 2016, Frontica signed a five-years contract with Aker Solutions, which will be included in the order backlog in the first of quarter 2016.
Frontica is a strong contender in the corporate services industry and a market-leading staffing company in the oil and gas sector. through Frontica’s predictable and strong service platform, the company drives cost optimization and business improvements in key areas for its customers and enable them to focus on their core business. Due to the challenging market situation, Frontica will continue its effort to optimize costs and streamline service offerings in order to strengthen the company’s competitive position.
AKOFS OffshoreAKoFS offshore is a provider of vessel-based subsea well installation and intervention services to the oil and gas industry. the company has a competent and diverse organization, covering all phases of the value chain from conceptual development to project execution and offshore operations. AKoFS offshore operates three specialized offshore vessels, Skandi Santos, Aker Wayfarer and AKoFS Seafarer, employing 91 people.
the company’s revenue decreased by 49 percent in 2015 to noK 781 million, and ebItDA decreased by noK 71 million to noK 104 million, mainly due to one vessel being idle most of the year. In addition to other cost saving measures, overall headcount in AKoFS has been reduced by over 20 percent since the end of 2014 in order to reduce cost.
In 2015, Skandi Santos completed its first five-year contract with petrobras in brazil, and commenced the five-year extension of the contract with petrobras which was agreed in 2014. Following the execution of the first five year classing,
Key figuresAmounts in NOK million 2015 2014operating revenue and other income 4 919 5 753ebItDA 260 315ebIt 147 218CApeX 43 110nCoA (303) (237)net capital employed 244 374order intake 4 384 8 196order backlog 1 754 2 620employees (Fte) 983 1 356
Key figuresAmounts in NOK million 2015 2014operating revenue and other income 781 1 542ebItDA 104 175ebIt (1 288) (1 117)CApeX 1 057 5nCo 69 63net capital employed 5 183 4 374order intake 305 6 140order backlog 6 430 6 186employees (Fte) 91 115
Annual Report 2015 | BOD Report 11
Fjords processing is neither aware of, nor has been accused of any wrongful doings. nevertheless, the company, in cooperation with external advisors and Akastor, has initiated an internal investigation.
KOP Surface ProductsKop Surface products is a leading global supplier of surface wellheads and trees, providing engineering, manufacturing, installation and life-of-field support services to the oil and gas industry.
As a one-stop solution provider, Kop Surface products develops solutions in cooperation with its customers, with focus not only on cost efficient products and tools, but also on optimization of jacket designs, drilling and operational cost.
Kop Surface products offers a complete range of surface well-heads, x-mas trees, gate valves, actuators, casing heads, hangers and spools, tubing hangers, spools and adaptors, bushing and annulus seal, tees and crosses, tree caps and other miscellane-ous equipment and tools required for surface well completions.
Kop Surface products has its headquarters in Singapore and its main manufacturing facility in batam, Indonesia which is comprised of a manufacturing plant, warehouse and office complex.
Globally, Kop Surface products employed 682 people at year-end 2015.
Worldwide installation and operational assistance for all Kop’s products are supported through its network of global service centres, located in Singapore, Malaysia, India, Indonesia, thailand, united Arab emirates, Vietnam and nigeria.
As Kop Surface products has their functional currency in uSD, the foreign currency exchange development affects the finan-cial results in noK. In uSD terms revenue declined by 20 per cent in 2015, whereas ebItDA increased by 22 percent to an all-time high ebItDA and margin of uSD 30.1 million and 21.4 percent respectively. the margin expansion from 13.9 percent in 2014 was driven by improved execution and cost cutting in the supply chain and lowering of overhead costs by 15 percent. order intake was noK 553 million in 2015, giving a backlog of noK 149 million at the end of the year. Kop Surface products is exposed to the cyclicality in the oil and energy sector, seeing
looking ahead, due to the current weak market conditions in the e&p sector, both the subsea construction fleet and offshore drill-ing segment are in structural oversupply. AKoFS offshore sees petrobras’ activity level declining in brazil, however installation of X-mas trees as well as related subsea production equipment will continue to be essential to brazilian oil and gas production.
Market conditions can be affected by actions taken by petrobras, as a consequence of ongoing corruption investigations in brazil with respect to “lava Jato” as well as their planned reduction in offshore activity in the medium term.
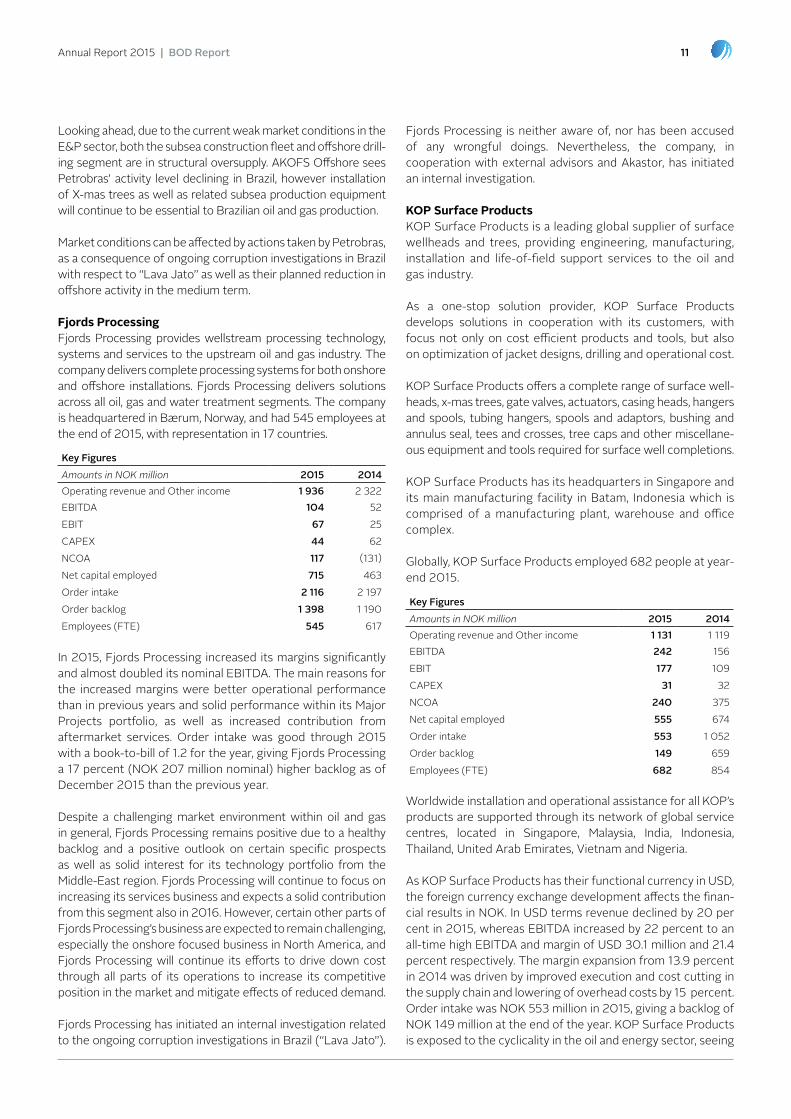
Fjords ProcessingFjords processing provides wellstream processing technology, systems and services to the upstream oil and gas industry. the company delivers complete processing systems for both onshore and offshore installations. Fjords processing delivers solutions across all oil, gas and water treatment segments. the company is headquartered in bærum, norway, and had 545 employees at the end of 2015, with representation in 17 countries.
In 2015, Fjords processing increased its margins significantly and almost doubled its nominal ebItDA. the main reasons for the increased margins were better operational performance than in previous years and solid performance within its Major projects portfolio, as well as increased contribution from aftermarket services. order intake was good through 2015 with a book-to-bill of 1.2 for the year, giving Fjords processing a 17 percent (noK 207 million nominal) higher backlog as of December 2015 than the previous year.
Despite a challenging market environment within oil and gas in general, Fjords processing remains positive due to a healthy backlog and a positive outlook on certain specific prospects as well as solid interest for its technology portfolio from the Middle-east region. Fjords processing will continue to focus on increasing its services business and expects a solid contribution from this segment also in 2016. However, certain other parts of Fjords processing’s business are expected to remain challenging, especially the onshore focused business in north America, and Fjords processing will continue its efforts to drive down cost through all parts of its operations to increase its competitive position in the market and mitigate effects of reduced demand.
Fjords processing has initiated an internal investigation related to the ongoing corruption investigations in brazil (“lava Jato”).
Key figuresAmounts in NOK million 2015 2014operating revenue and other income 1 936 2 322ebItDA 104 52ebIt 67 25CApeX 44 62nCoA 117 (131)net capital employed 715 463order intake 2 116 2 197order backlog 1 398 1 190employees (Fte) 545 617
Key figuresAmounts in NOK million 2015 2014operating revenue and other income 1 131 1 119ebItDA 242 156ebIt 177 109CApeX 31 32nCoA 240 375net capital employed 555 674order intake 553 1 052order backlog 149 659employees (Fte) 682 854
Annual Report 2015 | BOD Report 12
softening in demand and increased competition and will need to have a continued strong focus on cost reduction in 2016, in order to maintain its competitive position.
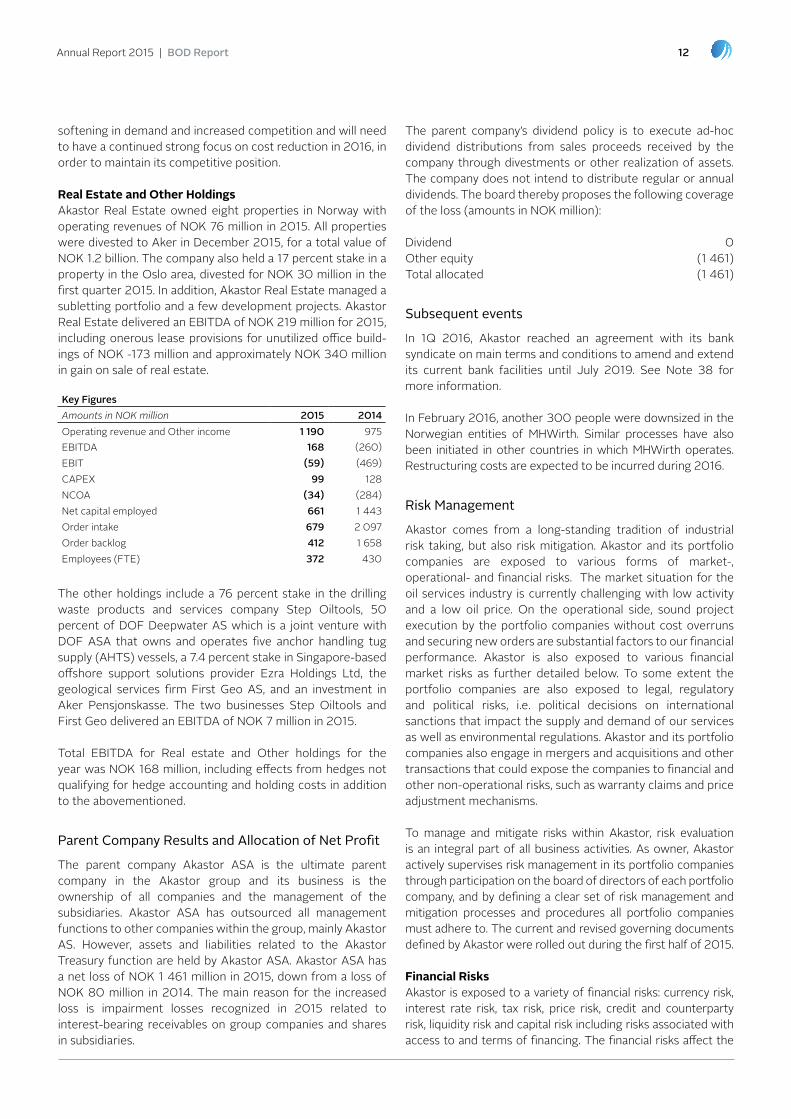
Real Estate and Other Holdings Akastor Real estate owned eight properties in norway with operating revenues of noK 76 million in 2015. All properties were divested to Aker in December 2015, for a total value of noK 1.2 billion. the company also held a 17 percent stake in a property in the oslo area, divested for noK 30 million in the first quarter 2015. In addition, Akastor Real estate managed a subletting portfolio and a few development projects. Akastor Real estate delivered an ebItDA of noK 219 million for 2015, including onerous lease provisions for unutilized office build-ings of noK -173 million and approximately noK 340 million in gain on sale of real estate.
the other holdings include a 76 percent stake in the drilling waste products and services company Step oiltools, 50 percent of DoF Deepwater AS which is a joint venture with DoF ASA that owns and operates five anchor handling tug supply (AHtS) vessels, a 7.4 percent stake in Singapore-based offshore support solutions provider ezra Holdings ltd, the geological services firm First Geo AS, and an investment in Aker pensjonskasse. the two businesses Step oiltools and First Geo delivered an ebItDA of noK 7 million in 2015.
total ebItDA for Real estate and other holdings for the year was noK 168 million, including effects from hedges not qualifying for hedge accounting and holding costs in addition to the abovementioned.
Parent Company results and Allocation of Net Profit
the parent company Akastor ASA is the ultimate parent company in the Akastor group and its business is the ownership of all companies and the management of the subsidiaries. Akastor ASA has outsourced all management functions to other companies within the group, mainly Akastor AS. However, assets and liabilities related to the Akastor treasury function are held by Akastor ASA. Akastor ASA has a net loss of noK 1 461 million in 2015, down from a loss of noK 80 million in 2014. the main reason for the increased loss is impairment losses recognized in 2015 related to interest-bearing receivables on group companies and shares in subsidiaries.
Key figuresAmounts in NOK million 2015 2014operating revenue and other income 1 190 975ebItDA 168 (260)ebIt (59) (469)CApeX 99 128nCoA (34) (284)net capital employed 661 1 443order intake 679 2 097order backlog 412 1 658employees (Fte) 372 430
the parent company’s dividend policy is to execute ad-hoc dividend distributions from sales proceeds received by the company through divestments or other realization of assets. the company does not intend to distribute regular or annual dividends. the board thereby proposes the following coverage of the loss (amounts in noK million):
Dividend 0 other equity (1 461) total allocated (1 461)
subsequent events
In 1Q 2016, Akastor reached an agreement with its bank syndicate on main terms and conditions to amend and extend its current bank facilities until July 2019. See note 38 for more information.
In February 2016, another 300 people were downsized in the norwegian entities of MHWirth. Similar processes have also been initiated in other countries in which MHWirth operates. Restructuring costs are expected to be incurred during 2016.
risk management
Akastor comes from a long-standing tradition of industrial risk taking, but also risk mitigation. Akastor and its portfolio companies are exposed to various forms of market-, operational- and financial risks. the market situation for the oil services industry is currently challenging with low activity and a low oil price. on the operational side, sound project execution by the portfolio companies without cost overruns and securing new orders are substantial factors to our financial performance. Akastor is also exposed to various financial market risks as further detailed below. to some extent the portfolio companies are also exposed to legal, regulatory and political risks, i.e. political decisions on international sanctions that impact the supply and demand of our services as well as environmental regulations. Akastor and its portfolio companies also engage in mergers and acquisitions and other transactions that could expose the companies to financial and other non-operational risks, such as warranty claims and price adjustment mechanisms.
to manage and mitigate risks within Akastor, risk evaluation is an integral part of all business activities. As owner, Akastor actively supervises risk management in its portfolio companies through participation on the board of directors of each portfolio company, and by defining a clear set of risk management and mitigation processes and procedures all portfolio companies must adhere to. the current and revised governing documents defined by Akastor were rolled out during the first half of 2015.
Financial Risks Akastor is exposed to a variety of financial risks: currency risk, interest rate risk, tax risk, price risk, credit and counterparty risk, liquidity risk and capital risk including risks associated with access to and terms of financing. the financial risks affect the
Annual Report 2015 | BOD Report 13
have proven to be one of the success criteria in developing the company over the years. this work will thus continue in Akastor going forward.
Akastor’s corporate responsibility strategy is based on four main priorities:
�� Working against Corruption
�� Respecting Human Rights
�� Caring for Health & Safety
�� Minimizing Impact on the environment
All the portfolio companies are responsible for working systematically with these priorities and defining their own corporate responsibility strategies encompassing these priorities. the task for Akastor going forward is therefore to ensure the systematic implementation and integration of the priorities of the corporate responsibility strategy, Code of Conduct and Integrity policy across all the portfolio companies. For in-depth reporting on each portfolio company’s corporate responsibility work, including their HSe work, refer to the Akastor Corporate Responsibility Report for 2015. the full report is available on our website www.akastor.com.
Akastor’s commitment to corporate responsibility is aligned with the international principles of the un Global Compact, the universal Declaration of Human Rights, the implementation framework of the un Guiding principles for business and Human Rights, as well as the Ilo Declaration on Fundamental principles and Rights at Work. these international principles guide our company Code of Conduct and Integrity policy and provide the overall framework for our work with corporate responsibility.
research, innovation and Technology Development
noK 176 million was capitalized in 2015, compared to noK 640 million in 2014, related to development activities. In addition, research and development costs of noK 60 million were expensed during the year because the criteria for capitalization were not met (noK 112 million in 2014).
All research, innovation and development initiatives are performed by the Akastor portfolio companies. Akastor ASA and Akastor AS performed no such activity in 2015.
People and teams
Akastor AS had a total of 23 employees as of December 31, 2015, where 46 percent of the employees are women. Akastor is committed to equal opportunity and non-discrimination. this commitment is described in Akastors Code of Conduct, as well as Akastor’s policies and agreements, and builds on a frame agreement signed with national and international trade unions in 2008. this agreement was renewed in 2014 and sets out fundamental labor rights and standards for general employment terms and employee relations, with specific focus
group’s income or the value of financial instruments held. the objective of financial risk management is to manage and control financial risk exposures and thereby increase the predictability of earnings and minimize potential adverse effects on Akastor’s financial performance. Akastor and its portfolio companies use financial derivative instruments to hedge certain risk exposures and aims to apply hedge accounting whenever possible in order to reduce the volatility resulting from the periodic market-to-market revaluation of financial instruments in the income statement. Risk management is performed in every project. It is the responsibility of the project managers, in cooperation with Akastor treasury, to identify, evaluate and hedge financial risks under policies approved by the board of directors. Akastor has well-established principles for overall risk management, as well as policies for the use of derivatives and financial instruments.
Integrity risks All Akastor portfolio companies use education and awareness training to manage and mitigate integrity risks. All new employees must complete a Code of Conduct e-learning program. All Akastor managers and office-based staff are required to participate in classroom based integrity training. Hired-ins in high risk roles are also required to undertake integrity training, just as third party representatives receive integrity training specially prepared for them. the requirement for all portfolio companies is to complete and report on the training within six months from employment or publication of a new training session. In 2015, the business ethics classroom training was updated and rolled-out and a complete set of e-learning modules on the Code of Conduct was published.
Akastor has established a whistleblowing system in line with the company’s Governance policy. the whistleblowing channel is open for all external and internal stakeholders who wish to report a breach of the Code of Conduct, other internal guidelines or governing policies. Akastor employees are required to report breaches of the Code of Conduct, and Akastor encourages reporting of any concerns pertaining to compliance with law or ethical standards.
Corporate responsibility
Akastor’s operating model reflects the fact that each of the portfolio companies are independent companies who operate different business models and therefore face different corporate responsibility risks and expectations from stakeholders. As a holding company, Akastor is responsible for setting the overall corporate responsibility priorities and providing the appropriate risk management framework and policies applicable for all holdings in the portfolio. In turn, each portfolio company is responsible for defining their own corporate responsibility strategy with relevant activities and where necessary supporting policies.
Akastor is also responsible for the maintenance and development of industrial relations and collaboration with unions. Historically, good industrial relations has played an important role, and maintaining these strong relations

Annual Report 2015 | BOD Report 14
in any of the portfolio companies, and the total recordable incident frequency was low. See figure below for details.
Corporate governance
Corporate governance is a framework of values, responsibilities and governing documents to control the business and ensure sustainable value creation for shareholders over time. It is the responsibility of the board of directors of Akastor to ensure that the company implements sound corporate governance. the audit committee supports the board of directors in safeguarding that the company has internal procedures and systems in place to ensure that corporate governance processes are effective. Akastor’s corporate governance principles are based on the norwegian Code of practice for Corporate Governance and are included in this annual report and available on the company’s website www.akastor.com.
on non-discrimination. equal opportunities are fundamental for Akastor and its portfolio companies.
Akastor and the portfolio companies had a total 5 677 people as of December 31 2015. the male/female ratio in the portfolio companies were as follows:
Whilst the male/female ratio is more balanced in Frontica, the other portfolio companies have a predominantly male workforce. this is mainly due to reasons linked to history and industry tradition. each portfolio company promotes equal opportunities by setting specific requirements for diversity in recruitment and people development, and by supporting programs dedicated to equal opportunity. Akastor ASA fulfils the requirements of the norwegian Companies Act with regards to gender representation on the board of directors, as four out of eight directors are women.
Sick leave in Akastor AS as amounted to 1.5 percent of total working hours in 2015. Aggregated sick leave in the Akastor portfolio companies was 2.6 percent. there were no fatal injuries
mhWirth frontica fjords KOp AKOfsFemale 18% 61% 29% 15% 14%Male 82% 39% 71% 85% 86%
Fornebu, March 15, 2016 | board of Directors of Akastor ASA
Kristian Monsen Røkke | Ceo
Frank o. Reite | Chairman
Kathryn M. baker | Director
Stig Faraas | Director
lone Fønss Schrøder | Deputy Chairman
Sarah Ryan | Director
Asbjørn Michailoff pettersen | Director
Øyvind eriksen | Director
Jannicke Sommer-ekelund | Director
Health and Safety mhWirth frontica fjords KOp AKOfslost time Incident Frequency (ltIF) incl. sub-contractors *)
1.2 - 1.3 - -
total Recordable Incident Frequency (tRIF) incl. subcontractors *)
1.8 - 1.5 1.7 -
Fatalities incl. subcontractors - - - - -
Sick leave (percent) 3.1 4 1.8 1.2 1.5
* per million hours worked

15Annual Report 2015 | Declaration by the Board of Directors and cEO
03. DeClARAtIon bY tHe boARD oF DIReCtoRS AnD Ceo
the board and Ceo have today considered and approved the annual report and financial statements for the Akastor group and its parent company Akastor ASA for the year ended on December 31, 2015. the board has based this declaration on reports and statements from the group’s Ceo and/or on the results of the group’s activities, as well as other information that is essential to assess the group’s position which has been provided to the board of directors.
to the best of our knowledge:
�� the financial statements for 2015 for the Akastor group and its parent company have been prepared in accordance with all applicable accounting standards;
�� the information provided in the financial statements gives a true and fair portrayal of the group and parent company’s assets, liabilities, profit and overall financial position as of December 31, 2015;
�� the annual report provides a true and fair overview of the development, profit and financial position of the Akastor group and its parent company, as well as the most significant risks and uncertainties facing the group and the parent company.
Dec
lara
tion
by th
e Bo
ard
of D
irect
ors’
and
CeO
Fornebu, March 15, 2016 | board of Directors of Akastor ASA
Kristian Monsen Røkke | Ceo
Frank o. Reite | Chairman
Kathryn M. baker | Director
Stig Faraas | Director
lone Fønss Schrøder | Deputy Chairman
Sarah Ryan | Director
Asbjørn Michailoff pettersen | Director
Øyvind eriksen | Director
Jannicke Sommer-ekelund | Director

Annual Report 2015 | Corporate Governance Statement 16
04. CoRpoRAte GoVeRnAnCe StAteMent
Corporate governance is a framework of values, responsibilities and governing documents to control the business and ensure sustainable value creation for shareholders over time. Sound corporate governance shall ensure that appropriate goals and strategies are adopted, that the strategies are implemented in a good manner and that the results achieved are subject to measurement and follow-up.
1. The Corporate governance report
Basis for this Reportthe corporate governance principles of the group are laid down by the board of directors of Akastor ASA. the principles are based on the norwegian Code of practice for Corporate Governance dated october 30, 2014 (the «Code of practice»), the regulations set out in the Continuing obligations of stock exchange listed companies from oslo børs (the stock exchange in oslo) and the relevant norwegian background law such as the norwegian Accounting Act and the norwegian public limited liability Companies Act. the Code of practice may be found at www.nues.no and the Continuing obligations of stock exchange listed companies may be found at www.oslobors.no. norwegian laws and regulations are available at www.lovdata.no.
this report outlines how Akastor has implemented the Code of practice. Deviations from the Code of practice are addressed under the relevant sections. In general, the Akastor board only approves deviations that the board believes contributes to value creation for its stakeholders.
In addition to the Code of practice, the norwegian Accounting Act section 3-3b stipulates that companies must provide a report on their policies and practices for corporate governance
either in the annual report or in a document referred to in the annual report. Such report is integrated in the below corporate governance statement.1)
Governance StructureAkastor is an oil-services investment company with a portfolio of companies in the oilfield services industry, with a total capital employed value of approximately noK 12.1 billion. the company has a flexible mandate for active ownership and long-term value creation. MHWirth is a leading supplier of drilling systems and drilling lifecycle services globally. Frontica provides cost efficient corporate services. AKoFS offshore is a global provider of vessel based subsea well construction and intervention services to the oil and gas industry. Fjords processing provides world-class well-stream processing technology, equipment and expertise to the oil and gas industry. Kop Surface products offers a complete range of products for offshore and land-based surface production, including surface wellheads, x-mas trees, valves and actuators. other holdings include the norwegian operation and wellsite geology services company First Geo AS, 76 percent of the shares in Step oiltools, 50 percent of DoF Deepwater and 7.4 percent of the shares in ezra Holdings ltd.
It is the responsibility of the board of directors of Akastor ASA to ensure that Akastor and its portfolio of companies implements sound corporate governance. the board of directors evaluates this corporate governance statement on an annual basis. the board’s audit committee also evaluates the corporate governance statement as well as other key policies and procedures pertaining to compliance and governance. Compliance with, and implementation of these corporate governance guidelines are continuously evaluated by the
below, the items in respect of which information must be disclosed according to section 3-3b of the norwegian Accounting Act are specified, together with references to where such required information may be found:
1. “A statement of the recommendations and regulations concerning corporate governance that the enterprise is subject to or otherwise chooses to comply with” can be found in the introduction section of this corporate governance statement.2. “Information on where the recommendations and regulations mentioned in no. 1 are available to the public” can be found in the introduction section of this corporate governance statement.3. “The reason for any non-conformance with recommendations and regulations mentioned in no. 1”. The non-conformances are described in the relevant section where there are non-conformances, which are sections 6 and 14 respectively.4. “A description of the main elements in the enterprise’s, and for entities that prepare consolidated financial statements, if relevant also the Group’s internal control and risk management systems linked to the financial reporting process” can be found in Section 10 of this corporate governance statement.5. “Articles of Association which entirely or partly expand or depart from provisions of Chapter 5 of the Public Limited Liability Companies Act” can be found in Section 6 of this corporate governance statement.6. “The composition of the board of directors, the corporate assembly, the committee of shareholders’ representatives and the control committee and any working committees related to these bodies, as well as a description of the main instructions and guidelines that apply to the work of the bodies and any committees” can be found in Section 8 and 9 of this corporate governance statement.7. “Articles of Association governing the appointment and replacement of directors” can be found in Section 8 of this corporate governance statement.8. “Articles of Association and authorizations empowering the board of directors to decide that the enterprise is to buy back or issue its own shares or equity certificates” can be found in Section 3 of this corporate governance statement.
1)
Corp
orat
e g
over
nanc
e st
atem
ent
Annual Report 2015 | Corporate Governance Statement 17
board and said committee; inter alia by way of the board being the decisive body for the company’s defined management and reporting structure, which include regular reporting.
Policies and ProceduresAkastor has a total of ten corporate policies providing business practice guidance within a number of key areas, all of which were revised and re-issued during the first half of 2015. these policy documents express the overall position of the group with regard to for instance compliance, integrity and governance,. the policies provide instructions and guidelines that apply to the portfolio companies as such and to individual employees in order to ensure that the group’s operations are in compliance with internal and external regulatory framework. In addition, the portfolio companies are requested to implement their own policies specific to their business within areas like project execution, HSe and tendering.
Values and Code of ConductAkastor aims to develop and refine its portfolio of companies as stand-alone enterprises, with the goal of maximizing the value potential of each entity. the company works to clarify the business models of the portfolio companies, capitalize on their market positions and promote aftersales services for the equipment and systems delivered. the investment strategy is focused on the oilfield services sector and the current portfolio. Akastor has an opportunistic approach and will continue to own the portfolio companies as long as Akastor creates more value than alternative owners.
Akastor wishes to contribute to sustainable social development through responsible business practices. the company’s Code of Conduct is a handbook that applies to all employees and provides guiding on what Akastor considers to be responsible ethical conduct. the Code of conduct gives a framework for what is acceptable behaviour that shall be reflected in every aspect of how business is conducted. the ethical guidelines and other policy documents of the group have been drafted on the basis of these basic corporate values.
Corporate Responsibility Akastor takes an active approach to corporate responsibility. Corporate responsibility in Akastor is about making good business decisions, with minimum risk to reputation, brand and the future sustainability of our business. the main focus of corporate responsibility activities in Akastor, defined in our group-wide integrity policy, is to work against corruption, to respect human rights and to care for health, safety and the environment. All our portfolio companies are expected to ensure strong corporate responsibility in their operations.
Akastor is a member of trace International, which supports our work against corruption. Akastor is also committed to follow the Global Framework Agreement (GFA) entered into by Aker with the trade unions Fellesforbundet, IndustriAll Global union, nIto and tekna on 17 December 2012. the GFA builds on and continues the commitment from the previous framework agreements signed in 2008 and 2010,
and outlines key responsibilities in relation to human and trade union rights. the parties commit themselves to achieving continuous improvements within the areas of working conditions, industrial relations with the employees of the Aker group of companies, health and safety standards at the workplace and environmental performance.
Further information in respect of the corporate social responsibility work of Akastor and its portfolio of companies can be found in the separate Corporate Responsibility report published simultaneously as the company’s annual report for 2015.
2. Business
the objectives of the company, as defined in its articles of association, are «to own or carry out industrial and other associated businesses, management of capital, and other functions for the group, and to participate in or acquire other businesses». the articles of association are available at www.akastor.com.
the principal strategies of the group are presented in the annual report. each year, the board of directors evaluates the existing strategy and approves any significant changes to such, as well as goals and guidelines of the company, through a designated strategy process. Information concerning the financial position and principal strategies of the company, and any changes thereto is disclosed to the market in the context of the company’s quarterly reporting and in designated market presentations as well as on www.akastor.com.
3. equity and Dividends
Equitythe management and the board regularly monitor that the group’s equity and liquidity are appropriate for its objectives, strategy and risk profile. the book equity of the group as per December 31, 2015 is noK 7 386 million, which represents an equity ratio of 36 percent. the management of financial risk is further described in the board of directors’ report.
Dividend Policythe board proposes the level of dividend payment to the general meeting who in turn is the decisive corporate body for dividend decisions.
over time, Akastor’s shareholders will receive a competitive return on their investment through a combination of cash dividends and increases in the share price. the ambition of the board of directors is to execute ad-hoc dividend distributions from sales proceeds received by the company through divestments or other realizations of assets. the company does not intend to distribute regular or annual dividends, but will consider dividends on an ongoing basis taking into consideration the company’s M&A activities, expected cash flow, capital expenditure plans, financing requirements and appropriate financial flexibility.
Annual Report 2015 | Corporate Governance Statement 18
Authorizations for the board of directorsproposals from the board of directors for future authorisations for share capital increases, share buy-backs or similar shall be for defined purposes, such as share purchase programmes and acquisitions of companies, and shall remain in effect until the next annual general meeting.
the company’s annual general meeting on April 8, 2015 resolved to authorize the board to purchase treasury shares for four purposes for utilization, all of which were subject to separate voting under the general meeting: (i) purchase of treasury shares to be used as transaction currency in connection with acquisitions, mergers, demergers and other transfers of business, (ii) purchase of treasury shares to be sold and/or transferred to employees and directors under share purchase programs (iii) purchase of treasury shares for the purpose of subsequent deletion of such shares and (iv) for the purpose of buy-back programs and initiatives for the company’s shares or for future investments within the company’s scope of operations. the authorizations (i), (ii) and (iv) were limited to ten percent of the share capital, while authorization (iii) were limited to twenty percent of the share capital, however so that the restrictions set out in the public limited liability Companies Act section 9-2 applies. the board’s authorizations to purchase treasury shares are valid for the period until the date of the annual general meeting of 2016, however in no circumstances beyond June 30, 2016. no shares were bought by the company in 2015 pursuant to the authorizations to the board of directors. As of December 31, 2015, the company holds 2 776 376 own shares.
In addition, the annual general meeting in 2015 granted the board of directors the mandate to approve the distribution of dividends based on the company’s annual accounts for 2014 as set out in the public limited liability Companies Act § 8-2, second paragraph. the mandate is valid for the period until the date of the annual general meeting of 2016.
there are no current provisions in the Articles of Association of the company or power of attorney from the general meeting which grant the board of directors the mandate to issue or buy back in the company for the purposes of capital increases.
Share Purchase Programsthe board of directors has resolved that going forward, share purchase programs will include Akastor ASA and Akastor AS only, and not the portfolio companies. the company has not carried out any standard share purchase programs for employees of Akastor ASA or Akastor AS in 2015.
As announced in a stock exchange release on July 16, 2015, the board of directors of Akastor ASA resolved that Kristian Røkke, Chief executive officer of Akastor ASA (either personally or through his wholly-owned subsidiaries) could purchase up to 200 000 treasury shares yearly from the company under the regular share purchase program of Akastor. However, as there were no share purchase program in Akastor ASA or Akastor AS in 2015, no such share purchase was completed.
Furthermore, the board resolved that Mr. Røkke could purchase up to 200 000 additional treasury shares on or about after 20 trading days following his employment in Akastor. the shares were bought by Mr. Røkke’s wholly owned subsidiary Riverrun Capital Management AS on September 7, 2015, at the price of 10.8055 noK per share (equivalent with the average share price for the first 20 days of trading following his first day of employment on August 10, 2015, less a discount of 20 percent. the shares are subject to a three-year lock-up period under which the acquired shares may not be sold or otherwise disposed of. the sale of shares to Mr. Røkke were realized from treasury shares held by Akastor ASA.
4. equal Treatment of shareholders and Transactions
with related Parties
the company has only one class of shares, and all shares car-ry equal rights. existing shareholders shall have pre-emptive rights to subscribe for shares in the event of share capital in-creases, unless otherwise indicated by special circumstances. If the pre-emptive rights of existing shareholders are waived in respect of a share capital increase, the reasons for such waiver shall be explained by the board of directors. transactions in own shares are effected via oslo børs.
As of December 31, 2015, Aker ASA holds 70 percent of the shares of Aker Kværner Holding AS which holds 40.27 per-cent of the shares of Akastor. As per the same date, Aker ASA directly held 23 331 762 shares of Akastor, equivalent to ~8.5 percent of the shares. proposition no. 88 (2006–2007) to Stortinget (the norwegian parliament) contains more detailed information concerning the establishment of Aker Kværner Holding AS and the agreement between Aker ASA and the other shareholder of Aker Kværner Holding AS.
the board of directors is of the view that it is positive for Akas-tor that Aker ASA assumes the role of an active owner and is actively involved in matters of importance to Akastor and to all shareholders. the cooperation with Aker ASA offers Akas-tor access to special know-how and resources within strategy, transactions and funding. Moreover, Aker ASA offers network and negotiation resources from which Akastor benefits in vari-ous contexts. this complements and strengthens Akastor with-out curtailing the autonomy of the group. It may be necessary to offer Aker ASA special access to commercial information in connection with such cooperation. Any information disclosed to Aker ASA’s representatives in such a context will be disclosed in compliance with applicable laws.
Applicable accounting standards and regulations require Aker ASA to prepare its consolidated financial statements to in-clude accounting information of Akastor. As of January 1, 2014, Aker ASA is deemed to have control of Akastor pursu-ant to the revised accounting standard IFRS 10. Akastor is thus consolidated as a subsidiary in Aker ASA’s accounts from this date. Subsequently, Aker Solutions ASA and Kværner ASA are deemed as related parties to Akastor for accounting purposes. In order to comply with these accounting standards, Aker ASA

Annual Report 2015 | Corporate Governance Statement 19
has in the past received, and will going forward receive, unpub-lished accounting information of Akastor. Such distribution of unpublished accounting information from Akastor to Aker ASA is executed under strict confidentiality and in accordance with applicable regulations on handling of inside information.
Aker ASA, Kværner ASA and Aker Solutions ASA (or their sub-sidiaries) are however not deemed, within the meaning of the public limited liability Companies Act, to be a related party of Akastor. the board of directors and the executive manage-ment team of Akastor are nevertheless conscious that all rela-tions with these companies shall be premised on commercial terms and structured in line with arm’s length principles.
In the event of any material transactions between the com-pany and shareholders, directors, senior executives, or related parties thereof, which do not form part of the ordinary course of the company’s business, the board of directors shall arrange for an independent assessment. the same shall, generally speaking, apply to the relationship between Akastor and Aker ASA related companies.
Akastor has prepared guidelines as part of its rules of proce-dure for the Chief executive officer and board of directors en-suring that directors and the Chief executive officer notify the board of directors if they have any material direct or indirect personal interest in any agreement concluded by the group. the guidelines stipulate that the directors and the Chief exec-utive officer shall not participate in the preparation, delibera-tion, or resolution of any matters that are of such special im-portance to themselves, or any of their related parties, so that the person in question must be deemed to have a prominent personal or financial interest in such matters. the relevant board member or the Chief executive officer shall raise the issue of his or her competence whenever there may be cause to question it, and are the primary responsible for adopting the correct decision as to whether he or she should step down from participating in the discussion of the matter at hand.
In general, as further stipulated in Akastor’s principles for relat-ed party transactions, directors of Akastor should be cautious in participating in the consideration of issues where a potential conflict of interest or conflict of role may arise, undermining the confidence in the decision process. Such person may not participate in board discussions of more than one company that is part of the same agreement, unless the companies have common interests. these assessments will be carried out on a case-by-case basis; in most events, and as a starting point, by the relevant directors themselves, but often also in cooperation with internal and/or external legal counsel.
the above principles will normally also be applied if Akastor contracts with other companies in which said board members hold direct or indirect ownership interests that exceed, in rela-tive terms, their ownership interests in Akastor.
If grounds for legal incapacity is concluded, the relevant board member will, as a ground rule, prior to the relevant director, not
be granted access to any documentation prepared to the board of directors for the deliberation of the agenda item in question.
In general, Akastor applies a strict norm as far as competence assessments are concerned. In cases where the chairman of the board of directors does not participate in the deliberations, the deputy chairman of the board of directors chairs the meeting.
As far as the other officers and employees of Akastor are concerned, transactions with related parties and conflicts of interest are comprehensively addressed and regulated in the group’s Code of Conduct.
the «Related parties» note to the consolidated financial state-ments contains information on the most significant transactions between Akastor and companies within the Aker ASA group.
5. freely Negotiable shares
the shares are listed on the oslo børs and are freely transferable. no transferability restrictions are laid down in the articles of association.
6. general meetings
Attendance, Agenda and Votingthe company encourages shareholders to attend the general meetings. It is also the intention to have representatives of the board of directors as well as the chairman of the nomination committee and the company’s auditor to attend the general meetings. notices convening general meetings, including comprehensive documentation relating to the items on the agenda, including the recommendation of the nomination committee, are made available on the company’s website no later than 21 days prior to the general meeting. the articles of association of the company stipulate that documents pertaining to matters to be deliberated by the general meeting shall only be made available on the company’s website, and not normally be sent physically by post to the shareholders unless required by statute.
the following matters are typically decided at the annual general meeting, in accordance with the articles of association of Akastor ASA and norwegian background law:
�� election of the nomination committee and stipulation of the nomination committee’s fees;
�� election of shareholder representatives to the board of directors as well as stipulation of fees to the board of directors;
�� election of the external auditor and stipulation of the auditor’s fee;
�� Approval of the annual accounts and the board of directors’ report, including distribution of dividend.
�� other matters which, by law or under the articles of association, are the business of the annual general meeting.
Annual Report 2015 | Corporate Governance Statement 20
the deadline for registering intended attendance is as close to the general meeting as possible, but not shorter than two days before the meeting. Shareholders who are unable to attend may vote by proxy. Moreover, information concerning both the registration procedure and the filing of proxies is included in the notice convening the general meeting and on the registration form. the company also aims to structure, to the extent practicable, the proxy form such as to enable the shareholders to vote on each individual item on the agenda.
Chairmanthe articles of association stipulate that the general meetings shall be chaired by the chairman of the board of directors or a person appointed by said chairman. According to the Code of practice the board should however «make arrangements to ensure an independent chairman for the general meeting». thus, the articles of Akastor ASA deviate from the Code of practice in this respect. this has its background in a long-lasting tradition in Akastor. Having the chairman of the board chairing the general meeting also simplifies the preparations for the general meetings significantly.
Election of DirectorsIt is a priority for the nomination committee that the board of directors shall work in the best possible manner as a team, and that the background and competence of the directors shall complement each other. As a consequence, the nomination committee will propose that the shareholders are invited to vote on the full board composition proposed by the nomination committee as a group, and not on each director separately. Hence, Akastor deviates from the Code of practice stipulating that one should make «appropriate arrangements for the general meeting to vote separately on each candidate nominated for election to the company’s corporate bodies».
Physical Attendance and Electronic VotingIt is a priority for the general meeting to be conducted in a sound manner, with all shareholder votes to be cast, to the extent possible, on the basis of the same information. the company has thus far not deemed it advisable to recommend the introduction of an electronic attendance, i.e. arranging for general meetings to be held as physical meetings with online coverage allowing for shareholders to participate via web. the company will contemplate the introduction of such arrangements on an on-going basis in view of; inter alia, the security and ease of use offered by available systems. Shareholders will have the opportunity to cast votes electronically in advance of general meetings (however, not during the meeting).
MinutesMinutes of general meetings will be published as soon as practicable on the announcement system of the oslo børs, www.newsweb.no (ticker: AKA), and on www.akastor.com.
7. Nomination Committee
the articles of association stipulate that the company shall
have a nomination committee. the nomination committee shall have no less than three members, who shall normally serve for a term of two years. the current members of the nomination committee are leif-Arne langøy (chairman), Gerhard Heiberg, Arild S. Frick and Georg Fr. Rabl. the members leif-Arne langøy, Arild S. Frick and Georg Fr. Rabl are elected up until the annual general meeting 2017, while Gerhard Heiberg is elected up until the annual general meeting 2016. langøy is deputy chairman of the board in tRG Holding AS and the Resource Group tRG AS, as well as chairman of the board of Kværner ASA. Arild S. Frick is General Counsel of Aker ASA and managing director of Aker Kværner Holding AS. no members of the nomination committee are employed by, or directors of, Akastor. the majority of the members of the nomination committee are independent of both Akastor’s board of directors and the executive management of the company.
the committee’s recommendations (relating to particularly the board of directors and their remuneration) shall address how the new board candidates will attend to the interests of the shareholders in general and fill the requirements of the company, including with respect to competence, capacity and independence.
the composition of the nomination committee shall reflect the interests of all shareholders and ensure independence from the board of directors and the executive management. the members and the chairman of the nomination committee are appointed by the general meeting, which also determines the remuneration of the committee.
the annual general meeting 2010 adopted guidelines governing the duties of the nomination committee. According to these guidelines, the committee shall emphasize that candidates for the board have the necessary experience, competence, and capacity to perform their duties in a satisfactory manner. A reasonable representation with regard to gender and background should also be emphasized.
the chairman of the nomination committee has the overall responsibility for the work of the committee. In the exercise of its duties, the nomination committee may contact, among others, shareholders, the board, management, and external advisors. the nomination committee shall also ensure that its recommendations are endorsed by the largest shareholders.
Information concerning the nomination committee and deadlines for making suggestions or proposing candidates for directorships will be made available on the company’s website, www.akastor.com when there are candidates up for election.
8. Composition and independence of the
Board of Directors
CompositionIt has been agreed with the employees that the company shall have no corporate assembly. Hence, the board appoints
Annual Report 2015 | Corporate Governance Statement 21
its own chairman, cf. the public limited liability Companies Act section 6-1(2), unless the chairman is appointed by the general meeting. the proposal of the nomination committee will normally include a proposed candidate for appointment as chairman of the board of directors. the board of directors appoints its own deputy chairman. According to the public limited liability Companies Act, the directors are appointed for a term of two years at a time unless otherwise stated in the company’s articles of association. the articles of association of Akastor ASA stipulate that directors may be elected for a period of one to three years.
the right of the employees to be represented and participate in decision making is safeguarded through expanded employee representation on the board of directors of both Akastor ASA and in a number of the group’s portfolio companies.
the articles of association stipulate that the board of directors shall comprise six to twelve persons, one third of whom shall be elected by and amongst the employees of the group. In addition, up to three shareholder-appointed alternates may be appointed. As per December 31, 2015, the board of directors comprised eight directors, five of whom were elected by the shareholders and three of whom were elected by and amongst the employees. the company encourages the directors to hold shares in the company. the shareholdings of the directors as of December, 31 2015 is set out in note 37 to the consolidated annual statements in the annual report for 2015. In addition to Øyvind eriksen’s indirect ownership of shares in the company through Aker ASA, also the directors Frank o. Reite, lone Fønss Schrøder, Kathryn M. baker, Jannicke Sommer-ekelund and Asbjørn Michailoff pettersen are currently shareholders in Akastor ASA. the board composition, including the board meeting attendance and information about the directors’ background and expertise is detailed in the annual report for 2015.
the appointment of employee representatives to the board of directors is conducted as prescribed by the public limited liability Companies Act and the Representation Regulations. the board of directors has appointed a designated election committee charged with implementing the appointment of such employee representatives.
IndependenceA majority of the directors elected by the shareholders are independent of the executive personnel and important business associates of Akastor ASA. none of the executive personnel of the company are members of the board of directors.
the composition of the board of directors aims to ensure that the interests of all shareholders are attended to, and that the company has the know-how, resources, and diversity it needs at its disposal. Among the five shareholder-elected directors, the majority are deemed independent from the company’s largest indirect shareholder, Aker ASA.
9. The Work of the Board of DirectorsProceduresthe board adopts an annual plan for its work. Furthermore, there are rules of procedure for the board of directors and Chief executive officer, which govern areas of responsibility, duties and the distribution of roles between the board of directors, the chairman of the board of directors and the Chief executive officer. the rules of procedure for the board of directors also include provisions on convening and chairing board meetings, decision making, the duty and right of the Chief executive officer to disclose information to the board of directors, the duty of confidentiality, etc. According to the company’s articles of association, each of the directors elected by the shareholders will serve for a period of one to three years pursuant to further decision by the general meeting. this to provide the nomination committee with the flexibility to propose varying terms of service for the candidates.
Meetingsthe board of directors will hold board meetings whenever needed, but normally six to twelve times a year. the need for extraordinary board meetings may typically arise because the internal authorization structure of the company requires the board of directors to deliberate and approve material tenders to be submitted by the company. Whilst the deadlines for such submission often change, it is difficult to fit this into the calendar of ordinary board meetings.
the board of directors held eight ordinary board meetings in 2015, and in addition, two extraordinary board meetings were held.
The Matters Discussed in the boardthe Chief executive officer prepares cases for deliberation by the board of directors in cooperation with the chairman of the board. Weight is attached to having matters prepared and presented in such a way that the board of directors is provided with an adequate basis for its deliberations. the board of directors has overall responsibility for the management of Akastor and shall, through the Chief executive officer, ensure that its activities are organized in a sound manner. the board of directors shall adopt plans and budgets for the business, and keep itself informed of the financial position of, and development within, the company. this encompasses the annual planning process of Akastor, with the adoption of overall goals and strategic choices for the group, as well as financial plans, budgets, and forecasts for the group and the portfolio companies. the board of directors performs annual evaluations of its work and its know-how.
Audit CommitteeAkastor will have an audit committee comprising two to four of the directors. the audit committee currently comprise the directors lone Fønss Schrøder (chairman), Kathryn M. baker and Asbjørn Michailoff pettersen. the audit committee is independent from the management.
Annual Report 2015 | Corporate Governance Statement 22
At least one of the members of the audit committee shall have either formal qualifications within accounting or auditing, or relevant experience and skills within the same. both members Fønss Schrøder and baker have such relevant experience and skills. the audit committee has a mandate and a working method that complies with statutory requirements. the audit committee mandate forms an integrated part of the rules of procedures for the board of directors. the committee will participate, on behalf of the board of directors, in the quality assurance of guidelines, policies, and other governing instruments in Akastor. the audit committee performs a qualitative review of the quarterly and annual reports of Akastor. Significant judgment calls (uncertain estimates) made in the financial statements in the quarter are reviewed by the audit committee. the audit committee further supports the board of directors in safeguarding that the company has sound risk management and internal controls. the audit committee reviews the status on internal controls on an annual basis. In order to safeguard appropriate processes and assessments, the board’s audit committee shall also review major M&A transactions as well as related party transactions which are not part of the company’s ordinary course of business, unless such related party transactions are immaterial.
Akastor currently has no remuneration committee as the experiences from having such showed more merit in discussing matters comprised by this committee’s mandate with all directors present. As of December 31, 2015, there are no other board committees than the audit committee. the board does not envisage appointing any further board committees in 2016.
10. risk management and internal Control
Governing principlesthe board of directors shall ensure that Akastor has sound internal control and systems for risk management that are appropriate in relation to the extent and nature of the company’s activities. the audit committee supports the board of directors in safeguarding that the company has internal procedures and systems that ensure good corporate governance, effective internal controls and proper risk management, particularly in relation to financial reporting. the Chief Financial officer reports directly to the audit committee on matters relating to financial reporting, financial risks and internal controls.
Akastor has implemented an internal system for reporting serious matters such as breaches of ethical guidelines and violations of the law, which is also available to external parties on www.akastor.com.
Risk Managementthe board of directors carries out an annual review of the company’s most important areas of exposure to risk and its internal control arrangements.
Akastor employs a decentralised model for allocating managerial responsibility under which the portfolio companies
are required to establish their own risk management and internal control systems. Akastor’s representatives on boards of directors in the portfolio companies seek to ensure that the portfolio companies follow the principles of sound corporate governance.
Akastor manages risk through an internal framework both on a corporate and portfolio company level comprising guidelines, policies and procedures intended to ensure good business operations and provide unified and reliable financial reporting. the board of directors has adopted an authorisation matrix that forms part of its governing documents where authority is delegated to the Akastor Chief executive officer. Furthermore, authorization matrices are adopted for each of the group’s portfolio companies, pursuant to which the Akastor Chief executive officer delegates authority to the boards and Ceos of the respective portfolio companies, which again adopts authorization matrices for the portfolio organizations. Special expenditure approval procedures have also been developed.
the board receives and reviews risk reports prepared by the management. the management’s risk reporting is based on the total level of insight obtained through regular reporting and the close cooperation that Akastor has with the portfolio companies, including from Akastor’s investment directors and board representatives. the management of operational risk primarily occurs in the underlying portfolio companies, although Akastor acts as an active driver through its involvement in the boards.
Akastor’s management holds review meetings with the management of the different portfolio companies. the purpose of the meetings is to conduct an in-depth review of the development of each portfolio company, focusing on operations, risk management, market conditions, the competitive situation and strategic issues. these meetings provide a solid foundation for Akastor’s assessment of its overall financial and operational risk.
prior to the board’s review of risk reporting, the audit committee reviews the reported risks and associated risk-reducing measures. the audit committee also reviews the company’s in-house reporting systems and internal control and risk management, and prepares the board’s review of financial reporting.
Financial Reportingthe Akastor financial reporting division reports to the Chief Financial officer and is responsible for the external reporting process and the internal management financial reporting process. this also includes assessing financial reporting risks and internal controls over financial reporting in the group.
the consolidated external financial statements are prepared in accordance with IFRS and IAS standards as approved by the eu. the existing policies and standards governing the annual and quarterly financial reporting in the group, including the

Annual Report 2015 | Corporate Governance Statement 23
Akastor accounting principles, are available on the Akastor intranet for Akastor employees.
Clearing meetings are held with the management teams of the portfolio companies in connection with the annual closing of accounts and may also be held in connection with quarterly financial reporting. For the 2015 financial year, a clearing meeting was held in october 2015and January 2016. the main purpose is to ensure high-quality financial reporting. Such meetings focus on important items involving estimation and judgment, non-balance-sheet items, accounting for significant transactions, new or modified accounting principles and other topics relevant to the respective portfolio companies. the external auditor is present in the clearing meetings.
Other ReportingIn addition to the abovementioned financial reporting, there are regular business review and board meetings in the portfolio companies which ensure timely and high-quality reporting from the portfolio companies to the corporate management.
Regular reports for Akastor ASA and the portfolio companies are submitted to the board of directors. the quarterly business update contains key financial numbers, M&A updates, financing, status of value creation plans, compliance, risk management and share price information for the Akastor group. Further, it contains key financial numbers, key operational topics, status on value drivers as well as key market information for the main portfolio companies. the monthly business update contain high level financial and operational information for the Akastor group, as well as key highlights for the main portfolio companies.
11. remuneration of the Board of Directors
the remuneration of the board of directors will reflect its responsibilities, know-how and time commitment, as well as the complexity of the business. the remuneration will be proposed by the nomination committee, and is not performance-related or linked to options in Akastor. More detailed information about the remuneration of individual directors is provided in the note 37 to the consolidated financial statements for the group in the annual report for 2015. neither the directors, nor companies with whom they are affiliated, should accept specific paid duties for Akastor beyond their directorships. If they nevertheless do so, the board of directors shall be informed and the remuneration shall be approved by the board of directors. no remuneration shall be accepted from anyone other than the company or the relevant group company in connection with such duties.
12. remuneration of executive Personnel
the board of directors has adopted designated guidelines for the remuneration of executive management pursuant to the provisions of Section 6-16a of the public limited liability
Companies Act. the guidelines were adopted by the general meeting April 8, 2015. the board of director’s statement on the remuneration of executive personnel for 2015/2016 will be a separate item on the agenda for the annual general meeting on April 12, 2016.
Akastor has no option schemes or option programs for the allotment of shares to employees. the Chief executive officer determines the remuneration of executive management on the basis of the guidelines laid down by the board of directors. All performance-related remuneration within the group will be made subject to a cap.
13. information and Communication
the company has adopted a designated communications and investor relations policy which covers, among other things, guidelines for the company’s contact with shareholders other than through general meetings.
the company’s reporting of financial and other information is based on openness and the equal treatment of all securities market players. the long-term purpose of the investor relations function is to ensure access for the company to capital on competitive terms, whilst at the same time ensuring that the shareholders are provided with the most correct pricing of the shares that can be achieved. this shall take place through the correct and timely distribution of price-sensitive information, whilst ensuring, at the same time, that the company is in compliance with applicable rules and market practices. Reference is also made to the above discussion concerning the flow of information between Akastor and Aker ASA in connection with their cooperation within, inter alia, strategy, transactions, and funding.
All stock exchange announcements and press releases are made available on the company’s website, and stock exchange announcements are also available on www.newsweb.no. All information sent to the shareholders is posted on the company’s website at the same point of time. the company holds open presentations in connection with the reporting of financial performance, and these presentations are broadcasted live via the internet. the financial calendar of the company is available on www.akastor.com.
14. Take-overs
the overriding principle for Akastor is equal treatment of shareholders. In a bid situation, the board of directors and management have an independent responsibility to help ensure that shareholders are treated equally, and that the company’s business actitivities are not disrupted unnecessarily. In a take-over situation, the board will have a particular responsibility to ensure that shareholders are given sufficient information and time to form a view of the offer.
Aker ASA has undertaken to retain control of Aker Kværner Holding AS for a minimum of ten years from June 2007.

Annual Report 2015 | Corporate Governance Statement 24
the board of directors has not deemed it appropriate to adopt specific guidelines for takeover situations for as long as the ownership cooperation context within Aker Kværner Holding AS remains intact. this is a deviation from the Code of practice.
15. Auditors
the external auditor annually presents a plan for the performance of the audit work to the audit committee. In addition, the auditor provides the board of directors with a written confirmation to the effect that the independence requirement is met annually. the auditor attends all audit committee meetings, and the auditor has reviewed any material changes to the accounting principles of the company, or to the internal controls of the company, with the audit committee. the external auditor also attends the board meeting where the annual financial statements are reviewed and approved, normally in March. the board of directors holds a minimum
of one annual meeting with the auditor without any executive personnel being in attendance.
the board’s audit committee stipulates guidelines on the scope for using the auditor for services other than auditing, and makes recommendations to the board of directors concerning the appointment of the external auditor and the approval of the auditor’s fees. Fees payable to the auditor, separated into those relating to auditing and those relating to other services, are specified in the «other operating expenses» note to the consolidated financial statements for the group. For the approval of the auditor’s fees by the annual general meeting, the fees are specified into those relating to auditing and those relating to other services in the proposed resolutions to the general meeting.
the external auditor has issued a statement to the chair of the audit committee confirming their independence.
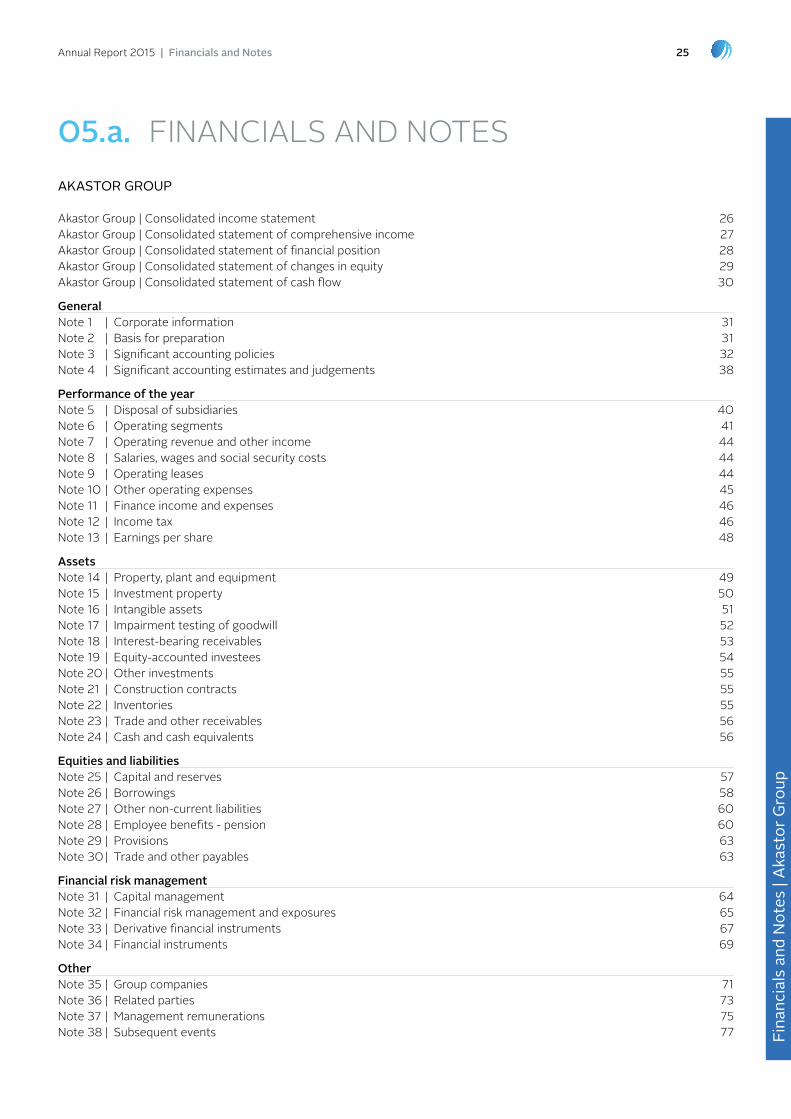
Annual Report 2015 | Financials and Notes 25
AKAsTOr grOuP
fina
ncia
ls a
nd N
otes
| Ak
asto
r gro
up
Akastor Group | Consolidated income statement 26Akastor Group | Consolidated statement of comprehensive income 27Akastor Group | Consolidated statement of financial position 28Akastor Group | Consolidated statement of changes in equity 29Akastor Group | Consolidated statement of cash flow 30
general note 1 | Corporate information 31note 2 | basis for preparation 31note 3 | Significant accounting policies 32note 4 | Significant accounting estimates and judgements 38
performance of the year note 5 | Disposal of subsidiaries 40note 6 | operating segments 41note 7 | operating revenue and other income 44note 8 | Salaries, wages and social security costs 44note 9 | operating leases 44note 10 | other operating expenses 45note 11 | Finance income and expenses 46note 12 | Income tax 46note 13 | earnings per share 48
Assets note 14 | property, plant and equipment 49note 15 | Investment property 50note 16 | Intangible assets 51note 17 | Impairment testing of goodwill 52note 18 | Interest-bearing receivables 53note 19 | equity-accounted investees 54note 20 | other investments 55note 21 | Construction contracts 55note 22 | Inventories 55note 23 | trade and other receivables 56note 24 | Cash and cash equivalents 56
Equities and liabilities note 25 | Capital and reserves 57note 26 | borrowings 58note 27 | other non-current liabilities 60note 28 | employee benefits - pension 60note 29 | provisions 63note 30 | trade and other payables 63
financial risk management note 31 | Capital management 64note 32 | Financial risk management and exposures 65note 33 | Derivative financial instruments 67note 34 | Financial instruments 69
Other note 35 | Group companies 71note 36 | Related parties 73note 37 | Management remunerations 75note 38 | Subsequent events 77
05. FInAnCIAlS AnD noteSa.
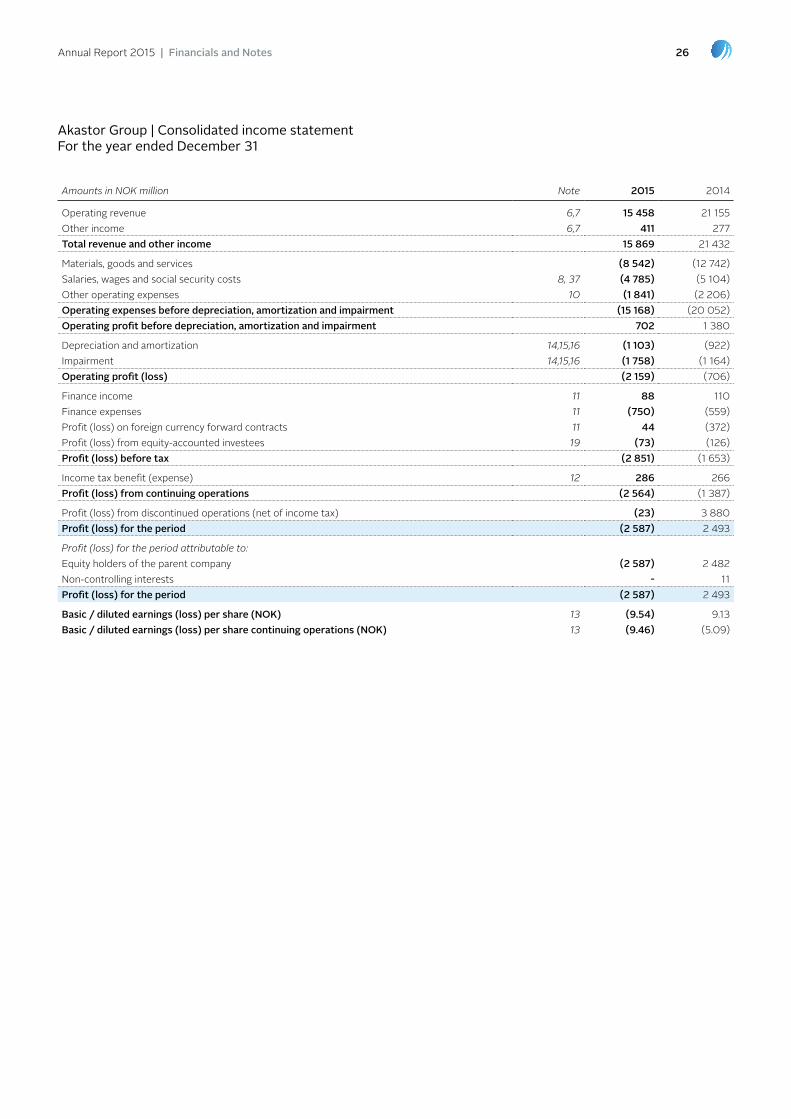
Annual Report 2015 | Financials and Notes 26
Amounts in NOK million Note 2015 2014
operating revenue 6,7 15 458 21 155 other income 6,7 411 277 Total revenue and other income 15 869 21 432
Materials, goods and services (8 542) (12 742)Salaries, wages and social security costs 8, 37 (4 785) (5 104)other operating expenses 10 (1 841) (2 206)Operating expenses before depreciation, amortization and impairment (15 168) (20 052)Operating profit before depreciation, amortization and impairment 702 1 380
Depreciation and amortization 14,15,16 (1 103) (922)Impairment 14,15,16 (1 758) (1 164)Operating profit (loss) (2 159) (706)
Finance income 11 88 110 Finance expenses 11 (750) (559)profit (loss) on foreign currency forward contracts 11 44 (372)profit (loss) from equity-accounted investees 19 (73) (126)profit (loss) before tax (2 851) (1 653)
Income tax benefit (expense) 12 286 266 profit (loss) from continuing operations (2 564) (1 387)
profit (loss) from discontinued operations (net of income tax) (23) 3 880 profit (loss) for the period (2 587) 2 493
Profit (loss) for the period attributable to:equity holders of the parent company (2 587) 2 482 non-controlling interests - 11 profit (loss) for the period (2 587) 2 493
Basic / diluted earnings (loss) per share (NOK) 13 (9.54) 9.13Basic / diluted earnings (loss) per share continuing operations (NOK) 13 (9.46) (5.09)
Akastor group | Consolidated income statementfor the year ended December 31

Annual Report 2015 | Financials and Notes 27
Amounts in NOK million Note 2015 2014
profit (loss) for the period (2 587) 2 493
Other comprehensive incomeCash flow hedges, effective portion of changes in fair value (172) (942)Deferred tax of cash flow hedges, effective portion of changes in fair value 59 254 Cash flow hedges, reclassification to income statement 58 345 Deferred tax of cash flow hedges, reclassification to income statement (20) (99)total change in hedging reserve, net of tax (75) (442)Change in fair value reserve 20 - (168)Currency translation differences - foreign operations 640 939 Deferred tax of monetary items as part of net investment 10 -Total items that may be reclassified subsequently to profit or loss, net of tax 575 329
Remeasurement gain (loss) net defined benefit liability 28 25 (70)Deferred tax of remeasurement gain (loss) net defined benefit liability (8) 19 Total items that will not be reclassified to profit or loss, net of tax 18 (51)
Total other comprehensive income, net of tax 593 278
Total comprehensive income (loss) for the period, net of tax (1 994) 2 771 Attributable to:equity holders of the parent company (1 994) 2 750 non-controlling interests - 21 Total comprehensive income (loss) for the period (1 994) 2 771
Akastor group | Consolidated statement of comprehensive incomefor the year ended December 31
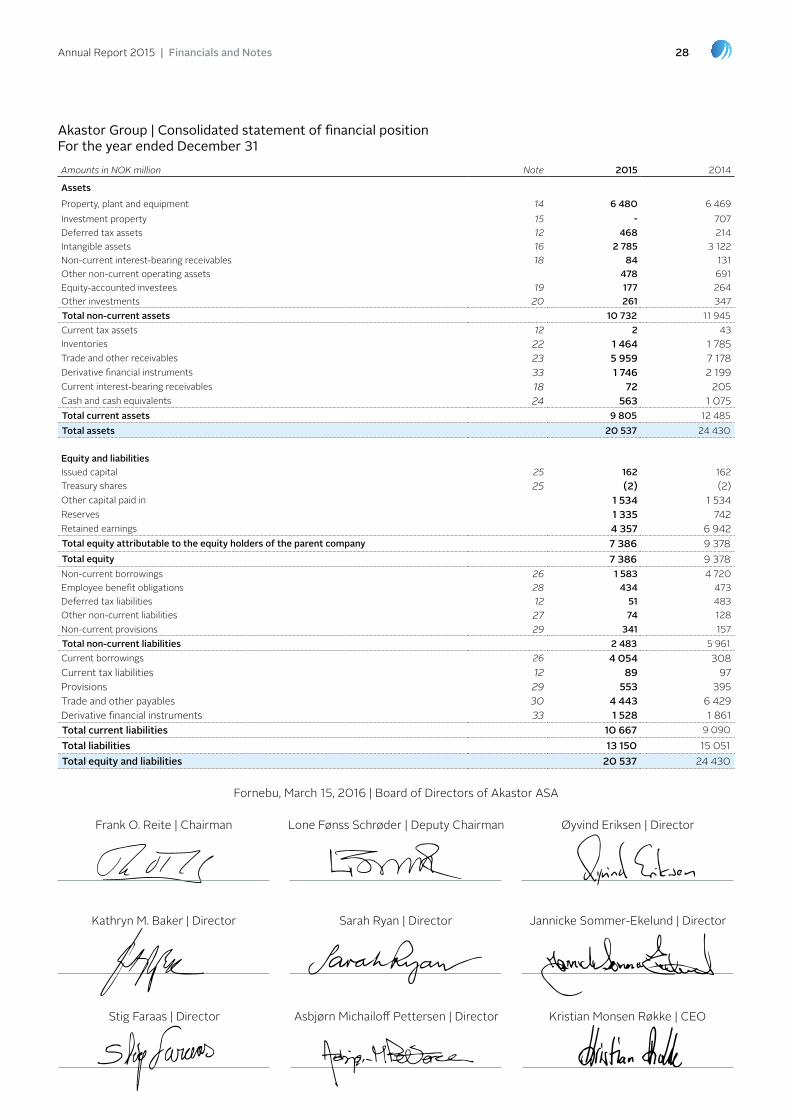
Annual Report 2015 | Financials and Notes 28
Amounts in NOK million Note 2015 2014
Assetsproperty, plant and equipment 14 6 480 6 469 Investment property 15 - 707 Deferred tax assets 12 468 214 Intangible assets 16 2 785 3 122 non-current interest-bearing receivables 18 84 131 other non-current operating assets 478 691 equity-accounted investees 19 177 264 other investments 20 261 347 Total non-current assets 10 732 11 945 Current tax assets 12 2 43 Inventories 22 1 464 1 785 trade and other receivables 23 5 959 7 178 Derivative financial instruments 33 1 746 2 199 Current interest-bearing receivables 18 72 205 Cash and cash equivalents 24 563 1 075 Total current assets 9 805 12 485 Total assets 20 537 24 430
Equity and liabilitiesIssued capital 25 162 162 treasury shares 25 (2) (2)other capital paid in 1 534 1 534 Reserves 1 335 742 Retained earnings 4 357 6 942 Total equity attributable to the equity holders of the parent company 7 386 9 378Total equity 7 386 9 378 non-current borrowings 26 1 583 4 720 employee benefit obligations 28 434 473 Deferred tax liabilities 12 51 483 other non-current liabilities 27 74 128 non-current provisions 29 341 157Total non-current liabilities 2 483 5 961 Current borrowings 26 4 054 308 Current tax liabilities 12 89 97 provisions 29 553 395 trade and other payables 30 4 443 6 429 Derivative financial instruments 33 1 528 1 861 Total current liabilities 10 667 9 090Total liabilities 13 150 15 051 Total equity and liabilities 20 537 24 430
Akastor group | Consolidated statement of financial positionfor the year ended December 31
Fornebu, March 15, 2016 | board of Directors of Akastor ASA
Kristian Monsen Røkke | Ceo
Frank o. Reite | Chairman
Kathryn M. baker | Director
Stig Faraas | Director
lone Fønss Schrøder | Deputy Chairman
Sarah Ryan | Director
Asbjørn Michailoff pettersen | Director
Øyvind eriksen | Director
Jannicke Sommer-ekelund | Director
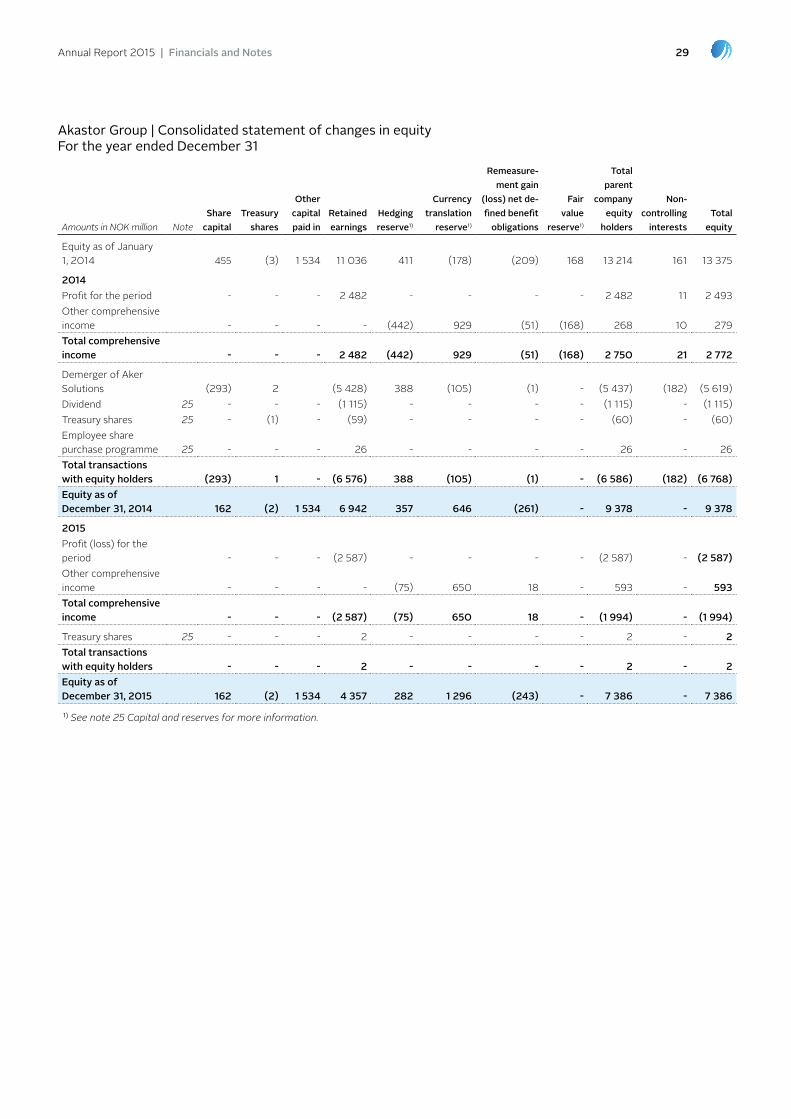
Annual Report 2015 | Financials and Notes 29
Amounts in NOK million Noteshare
capitalTreasury
shares
Other capital paid in
Retained earnings
hedging reserve1)
currency translation
reserve1)
Remeasure-ment gain
(loss) net de-fined benefit
obligations
fair value
reserve1)
Total parent
company equity
holders
Non-controlling
interestsTotal
equity
equity as of January 1, 2014 455 (3) 1 534 11 036 411 (178) (209)
168 13 214 161 13 375
2014profit for the period - - - 2 482 - - - - 2 482 11 2 493 other comprehensive income - - - - (442) 929 (51) (168) 268 10 279 Total comprehensive income - - - 2 482 (442) 929 (51) (168) 2 750 21 2 772
Demerger of Aker Solutions
(293)
2 (5 428) 388 (105) (1) - (5 437) (182) (5 619)
Dividend 25 - - - (1 115) - - - - (1 115) - (1 115)treasury shares 25 - (1) - (59) - - - - (60) - (60)employee share purchase programme 25 - - -
26 - - - -
26 -
26
Total transactions with equity holders (293) 1 - (6 576) 388 (105) (1) - (6 586) (182) (6 768)Equity as of December 31, 2014 162 (2) 1 534 6 942 357 646 (261) -
9 378 -
9 378
2015profit (loss) for the period - - -
(2 587) - - - -
(2 587) -
(2 587)
other comprehensive income - - - -
(75)
650 18
-
593 -
593
Total comprehensive income
-
-
-
(2 587)
(75)
650 18
-
(1 994) -
(1 994)
treasury shares 25 - - - 2 - - - - 2 - 2 Total transactions with equity holders - - - 2 - - - - 2 - 2 Equity as of December 31, 2015 162 (2) 1 534 4 357 282 1 296 (243)
- 7 386 -
7 386
1) See note 25 Capital and reserves for more information.
Akastor group | Consolidated statement of changes in equityfor the year ended December 31
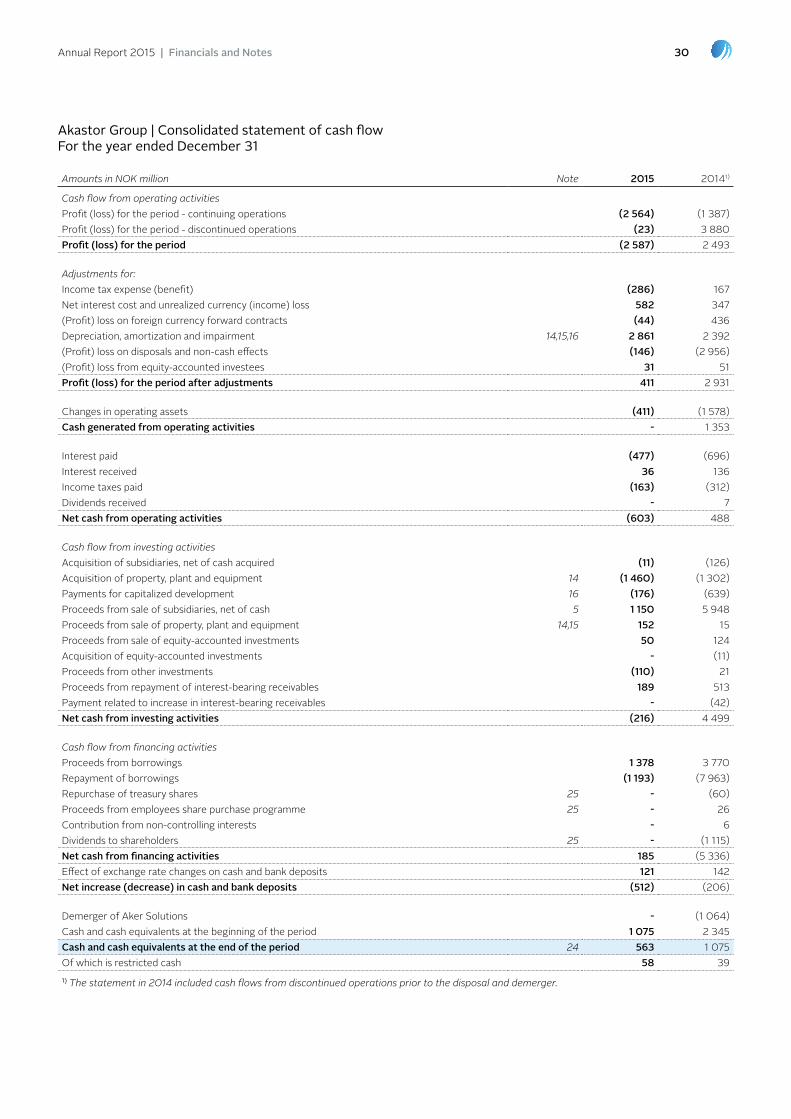
Annual Report 2015 | Financials and Notes 30
Akastor group | Consolidated statement of cash flowfor the year ended December 31
Amounts in NOK million Note 2015 20141)
Cash flow from operating activitiesprofit (loss) for the period - continuing operations (2 564) (1 387)profit (loss) for the period - discontinued operations (23) 3 880 profit (loss) for the period (2 587) 2 493
Adjustments for:Income tax expense (benefit) (286) 167 net interest cost and unrealized currency (income) loss 582 347 (profit) loss on foreign currency forward contracts (44) 436 Depreciation, amortization and impairment 14,15,16 2 861 2 392 (profit) loss on disposals and non-cash effects (146) (2 956)(profit) loss from equity-accounted investees 31 51 profit (loss) for the period after adjustments 411 2 931
Changes in operating assets (411) (1 578)cash generated from operating activities - 1 353
Interest paid (477) (696)Interest received 36 136 Income taxes paid (163) (312)Dividends received - 7 Net cash from operating activities (603) 488
Cash flow from investing activitiesAcquisition of subsidiaries, net of cash acquired (11) (126)Acquisition of property, plant and equipment 14 (1 460) (1 302)payments for capitalized development 16 (176) (639)proceeds from sale of subsidiaries, net of cash 5 1 150 5 948 proceeds from sale of property, plant and equipment 14,15 152 15 proceeds from sale of equity-accounted investments 50 124 Acquisition of equity-accounted investments - (11)proceeds from other investments (110) 21 proceeds from repayment of interest-bearing receivables 189 513 payment related to increase in interest-bearing receivables - (42)Net cash from investing activities (216) 4 499
Cash flow from financing activitiesproceeds from borrowings 1 378 3 770 Repayment of borrowings (1 193) (7 963)Repurchase of treasury shares 25 - (60)proceeds from employees share purchase programme 25 - 26 Contribution from non-controlling interests - 6 Dividends to shareholders 25 - (1 115)Net cash from financing activities 185 (5 336)effect of exchange rate changes on cash and bank deposits 121 142 Net increase (decrease) in cash and bank deposits (512) (206)
Demerger of Aker Solutions - (1 064)Cash and cash equivalents at the beginning of the period 1 075 2 345 cash and cash equivalents at the end of the period 24 563 1 075 of which is restricted cash 58 39 1) The statement in 2014 included cash flows from discontinued operations prior to the disposal and demerger.
Annual Report 2015 | Financials and Notes 31
Akastor ASA is a limited liability company incorporated and domiciled in norway and whose shares are publicly traded. the registered office is located at oksenøyveien 10, bærum. the largest shareholder is Aker Kværner Holding AS and the ultimate parent company is the Resource Group tRG AS.
on September 26, 2014, the demerger of Akastor was completed and Aker Solutions Holding ASA (“Aker Solutions”), a subsidiary of Akastor ASA established for the purposes of the demerger, was listed on the oslo Stock exchange on September 29, 2014. At the same time Aker Solutions ASA changed name to Akastor ASA.
the consolidated financial statements of Akastor ASA and its subsidiaries (collectively referred as Akastor or the group, and separately as group companies) for the year ended December 31, 2015 were approved by the board of directors and Ceo on March 15, 2016. the consolidated financial statements will be authorized by the Annual General Meeting on April 12, 2016.
the group is an oil-services investment company with a portfolio of industrial holdings and other investments. Akastor is listed on the oslo Stock exchange under the ticker AKA. Information on the group’s structure is provided in note 35 Group companies. Information on other related party relationships of the group is provided in note 36 Related parties.
Note 1 | Corporate information
Note 2 | Basis for preparation
Basis of accountingthe consolidated financial statements have been prepared in accordance with International Financial Reporting Standards (IFRS) as approved by the european union, their interpretations adopted by the International Accounting Standards board (IASb) and the additional requirements of the norwegian Accounting Act as of December 31, 2015.
Going concern basis of accountingthe consolidated financial statements have been prepared on a going concern basis, which assumes that the group will be able to meet the mandatory terms and conditions of the banking facilities as disclosed in note 26 borrowings.
Akastor’s financing agreement with its bank syndicate had a covenant that Interest ratio coverage (ICR) should not be less than 4.0 calculated from the consolidated ebItDA to consolidated net Finance Cost. As of December 31, 2015, the ICR level was below 4.0. on March 11, 2016, Akastor signed an agreement with its bank syndicate to amend and extend its financing structure, including new ICR ratios from Q4 2015. Management believes that the group will be able to meet its new funding requirements and to refinance or to repay its banking facilities as they fall due. As of December 31, 2015, the group has a liquidity buffer of noK 2.6 billion, comprised by cash and cash equivalents of noK 0.6 billion and undrawn committed bank revolving credit facilities of noK 2 billion.
Basis of measurementthe consolidated financial statements have been prepared on the historical cost basis except for the following material items, which are measured on an alternative basis on each reporting date:
�� Derivative financial instruments are measured at fair value.
�� Available-for-sale financial assets are measured at fair value.
�� Contingent consideration assumed in business combinations are measured at fair value.
�� net defined benefit (asset) liability is recognized at fair value of plan assets less the present value of the defined benefit obligation.
Functional and presentation currencythe consolidated financial statements are presented in noK, which is
Akastor ASA’s functional currency. All financial information presented in noK has been rounded to the nearest million (noK million), except when otherwise stated. the subtotals and totals in some of the tables in these consolidated financial statements may not equal the sum of the amounts shown due to rounding.
When the functional currency in a reporting unit is changed, the effect of the change is accounted for prospectively.
Use of estimates and judgementsthe preparation of financial statements in conformity with IFRS requires management to make judgements, estimates and assumptions that affect the application of policies and reported amounts of assets and liabilities, income and expenses. Although management believes these assumptions to be reasonable, given historical experience, actual amounts and results could differ from these estimates. the items involving a higher degree of judgement or complexity, and items where assumptions and estimates are material to the consolidated financial statements, are disclosed in note 4 Significant accounting estimates and judgements.
the estimates and underlying assumptions are reviewed on an ongoing basis. Revisions to accounting estimates are recognized in the period in which the estimate is revised and in any future periods affected.
Adoption of new and revised standards and interpretationsthe accounting policies adopted are consistent with those of the previous financial year. the following standards and interpretations were adopted with effect from January 1, 2015, with no implementation impact on the Group’s consolidated financial statements:
�� IFRIC Interpretation 21 levies
�� Improvements to IFRSs – 2011-2013 cycle
�� Amendments to IAS 19 Defined benefit plans: employee Contributions ( eu effective from February 1, 2015)
�� Improvements to IFRSs – 2010-2012 cycle (eu effective from February 1, 2015)
At the date of authorization of the group’s consolidated financial statements, the following standards and interpretations were issued but not effective and could affect the Group:

Annual Report 2015 | Financials and Notes 32
IFRS 15 Revenue from Contracts with Customers (effective from January 1, 2018, but not approved by the EU)the standard will supersede the current revenue recognition guidance including IAS 18 Revenue, IAS 11 Construction contracts and the related interpretations when it becomes effective. IFRS 15 introduces a new five-step model that apples to revenue arising from contracts with customers. the analysis of the application of IFRS 15 is still ongoing, but the group does not anticipate significant impacts on its consolidated financial statements. based on preliminary assessments, the group has identified the following main impact of implementing IFRS 15:
�� Constraint of variable considerations: to include variable considerations in the estimated contract revenue, the entity has to conclude that it is highly probably that a significant revenue reversal will not occur when the uncertainties related to the variability are resolved. the threshold of including variable considerations in revenue recognition is higher than the requirements under current standards.
�� provision for loss making projects: the requirement in IAS 37 for onerous contract will apply to all contracts in the scope of IFRS 15, including construction contracts which are currently in scope of IAS 11.
�� Disclosures: IFRS 15 requires more comprehensive disclosure than the current disclosure required by IAS 18 and IAS 11.
IFRS 9 Financial Instruments (effective from January 1, 2018, but not approved by the EU)the standard will replace IAS 39. the new standard for financial instruments is not expected to significantly change the reported figures of the group. the following changes are expected to impact the reported figures upon transition to IFRS 9:
�� Around 80 percent of the group’s foreign currency hedges qualify for hedge accounting under the current IAS 39 standard. the percentage of qualifying hedges is expected to increase under IFRS 9 as the hedge accounting model is more aligned with risk management, including prospective testing and less restrictive requirements on qualifying hedging instruments. this is expected to result in less foreign currency effects reported under financial items.
�� the effect of classification of financial instruments and the expected credit loss principle are not expected to have material impact on the financial reporting, but will be assessed further.
IFRS 16 Leases (effective from January 1, 2019, but not approved by the EU)the standard was issued in January 2016 and replaces IAS 17. the new standard requires companies to bring most of leases on-balance sheet, recognizing new assets and liabilities. the potential impacts on the financial positions of Akastor are under evaluation.
Note 3 | significant accounting policies
Summary of significant accounting policiesthe principal accounting policies applied in the preparation of these consolidated financial statements are set out below. these policies have been consistently applied to all the years presented, unless otherwise stated.
Basis of consolidationSubsidiariesSubsidiaries are entities controlled by the group. the group controls an entity when it is exposed to, or has rights to, variable returns from its involvement with the entity and has the ability affect those returns through its power over the entity. the financial statements of subsidiaries are included in the consolidated financial statements from the date on which control commences until the date of which control ceases.
Business combinationsbusiness combinations are accounted for using the acquisition method as of the acquisition date, which is the date when control is transferred to the group.
the group measures goodwill at the acquisition date as:�� the fair value of the consideration transferred, plus
�� the recognized amount of any non-controlling interests in the acquiree, plus
�� if the business combination is achieved in stages, the fair value of the pre-existing equity interest in the acquiree, less
�� the net recognized amount (generally at fair value) of the identifiable assets acquired and liabilities assumed.
When the excess is negative, a bargain purchase gain is recognized immediately in the income statement. transaction costs, other than those associated with the issue of debt or equity securities incurred in connection with a business combination are expensed as incurred.
Any contingent consideration payable is measured at fair value at the acquisition date. Changes in the fair value of the contingent consideration from acquisition of a subsidiary or non-controlling interest for transactions will be recognized in other income as gain or loss, except for the obligation that is classified as equity.
When the group has entered into put options with non-controlling shareholders on their shares in that subsidiary, the anticipated acquisition method is used. the agreement is accounted for as if the put option had already been exercised. If the put option expires unexercised, then the liability is derecognized and the non-controlling interest is recognized.
Acquisitions of non-controlling interestsAcquisitions of non-controlling interests are accounted for as transactions with owners in their capacity as owners and therefore no goodwill is recognized as a result. Adjustments to non-controlling interests arising from transactions that do not involve the loss of control are based on a proportionate amount of the net assets of the subsidiary.
Loss of controlon the loss of control, the group derecognizes the assets and liabilities of the subsidiary, any non-controlling interests and the other components of equity. Any resulting gain or loss is recognized in the income statement.
Annual Report 2015 | Financials and Notes 33
Any interest retained in the former subsidiary is measured at fair value when control is lost. Subsequently it is accounted for as an equity-accounted investee or as an available for sale financial asset depending on the level of influence retained.
Investments in associates and joint venturesthe group’s interests in equity-accounted investees comprise interests in associates and joint ventures.
Associates are those entities in which the group has significant influence, but not control or joint control, over the financial and operating policies. Significant influence is presumed to exist when the group holds between 20 and 50 percent of the voting power of another entity. A joint venture is an arrangement in which the group has joint control, whereby the group has rights to the net assets of the arrangement, rather to its assets and obligations for its liabilities. Joint control is established by contractual agreement requiring unanimous consent of the ventures for strategic, financial and operating decisions.
Interests in associates and joint ventures are accounted for using the equity method. they are initially recognized at cost, which includes transaction costs. Subsequent to initial recognition, the consolidated financial statements include the group’s share of the profit and loss and other comprehensive income of the equity-accounted investees. the group’s investment includes goodwill identified on acquisition, net of any accumulated impairment losses. When the group’s share of losses exceeds its interest in an equity-accounted investee, the carrying amount of that interest, including any long-term investments, is reduced to zero, and further losses are not recognized except to the extent that the group incurs legal or constructive obligations or has made payments on behalf of the investee.
the purpose of the investment determines the presentation of the group’s share of profits and losses of the equity-accounted investee in the income statement. When the entity is established to share risk in executing a project or is closely related to Akastor’s operating activities, the share of profit or loss is reported as part of other income in operating profit. Share of the profit or loss of a financial investment is reported as part of Finance income and expenses.
Transactions eliminated on consolidationIntra-group balances and transactions, and any unrealized gains and losses or income and expenses arising from intra-group transactions, are eliminated in preparing the consolidated financial statements. unrealized gains arising from transactions with associates and joint ventures are eliminated to the extent of the group’s interest in the entity. unrealized losses are eliminated in the same way as unrealized gains, but only to the extent that there is no evidence of impairment.
Assets held for sale or distributionnon-current assets, or disposal groups comprising assets and liabilities, that are expected to be recovered primarily through sale or distribution rather than through continuing use, are classified as held for sale or distribution. this condition is regarded as met only when the sale is highly probable and the asset or disposal group is available for immediate sale or distribution in its present condition. Management must be committed to the sale or distribution, which should be expected to qualify for recognition as a completed sale or distribution within one year from the date of classification.
non-current assets and disposal groups classified as held for sale or distribution are measured at the lower of their carrying amount and fair value less costs to sell. property, plant and equipment and intangible assets once classified as held for sale or distribution are not depreciated or amortized, but are considered in the overall impairment testing of the disposal group.
no reclassifications are made for years prior to the year non-current assets or disposal groups are first classified as a held for sale or distribution.
Discontinued operationsA discontinued operation is a component of the group’s business that represents a separate major line of business or geographical area of operations that has been disposed of or is held for sale or distribution, or is a subsidiary acquired exclusively with a view to resale. Classification as a discontinued operation occurs upon disposal or when the operation meets the criteria to be classified as held for sale, if earlier.
In the consolidated income statement, income and expenses from discontinued operations are reported separately from income and expenses from continuing operations, down to the level of profit after taxes. When an operation is classified as a discontinued operation, the comparative income statement is restated as if the operation had been discontinued from the start of the comparative year.
the statement of cash flow includes the cash flow from discontinued operations. Cash flows attributable to the operating, investing and financing activities of discontinued operations are presented in the notes to the extent these represent cash flows with third parties.
Foreign currencyForeign currency transactions and balancestransactions in foreign currencies are translated at the exchange rate at the date of the transaction. Monetary assets and liabilities denominated in foreign currencies at the reporting date are translated to the functional currency at the exchange rate on that date. Foreign exchange differences arising on translation are recognized in the income statement. non-monetary assets and liabilities measured in terms of historical cost in a foreign currency are translated using the exchange rate on the date of the transaction. non-monetary assets and liabilities denominated in foreign currencies that are measured at fair value are translated to the functional currency at the exchange rates on the date the fair value is determined.
Investments in foreign operationsItems included in the financial statements of each of the group’s entities are measured using the currency of the primary economic environment in which the entity operates. the results and financial position of all the group entities that have a functional currency different from the group’s presentation currency are translated into the presentation currency as follows:
�� Assets and liabilities, including goodwill and fair value adjustments, are translated at the closing exchange rate at the reporting date.
�� Income statements are translated at average exchange rate for the year, calculated on the basis of 12 monthly rates.
exchange differences arising from the translation of the net investment in foreign operations, and of related hedges, are included in other comprehensive income as currency translation reserve. these translation
Annual Report 2015 | Financials and Notes 34
differences are reclassified to the income statement upon disposal of the related operations or when settlement is likely to occur in the near future.
Monetary items that are receivable from or payable to a foreign operation are considered as part of the net investment in that foreign operation, when the settlement is neither planned nor likely to occur in the foreseeable future. exchange differences arising from these monetary items are recognized in other comprehensive income.
Current/non-current classificationAn asset is classified as current when it is expected to be realized or is intended for sale or consumption in the group’s normal operating cycle, it is held primarily for the purpose of being traded, or it is expected/due to be realized or settled within twelve months after the reporting date. other assets are classified as non-current.
A liability is classified as current when it is expected to be settled in the group’s normal operating cycle, is held primarily for the purpose of being traded, the liability is due to be settled within twelve months after the reporting period, or if the group does not have an unconditional right to defer settlement of the liability for at least twelve months after the reporting period. All other liabilities are classified as non-current.
Financial assets, financial liabilities and equityFinancial assets and liabilities in the group consist of investments in other companies, trade and other receivables, interest-bearing receivables, cash and cash equivalents, trade and other payables and interest-bearing borrowing.
the group initially recognizes borrowings and receivables on the date when they are originated. All other financial assets and financial liabilities are initially recognized on the trade date.
Other investmentsother investments include equity securities where the group has neither control nor significant influence, usually represented by less than 20 percent of the voting power. the investments are categorized as available-for-sale financial assets and are recognized initially at fair value. Subsequent to initial recognition, they are measured at fair value and changes therein, other than impairment losses, are recognized in other comprehensive income and presented as part of fair value reserve. When an investment is derecognized, the gain or loss accumulated in other comprehensive income is reclassified to profit and loss. Impairment losses are recognized in the income statement when the decrease in fair value is significant or prolonged.
Trade and other receivablestrade receivables are recognized at the original invoiced amount, less an allowance made for doubtful receivables. other receivables are recognized initially at fair value. trade and other receivables are valued at amortized cost using the effective interest rate method. the interest rate element is disregarded if insignificant, which is the case for the majority of the group’s trade receivables.
Current interest-bearing receivablesCurrent interest bearing receivables include bonds, securities and mutual funds with short-term maturity. these assets are designated upon initial recognition as at fair value through profit and loss.
Non-current interest-bearing receivablesInterest bearing receivables include loans to related parties and other receivables with fixed or determinable payments that are not quoted in an active market. Such financial assets are recognized initially at fair value and subsequent measurement at amortized cost using the effective interest method, less any impairment losses.
Cash and cash equivalentsCash and cash equivalents include cash on hand, demand deposits held at banks and other short-term highly liquid investments with original maturity of three months or less.
Trade and other payablestrade payables are recognized at the original invoiced amount. other payables are recognized initially at fair value. trade and other payables are valued at amortized cost using the effective interest rate method. the interest rate element is disregarded if it is insignificant, which is the case for the majority of the group’s trade payables.
Interest-bearing borrowingsInterest-bearing borrowings are recognized initially at fair value less attributable transaction costs. Subsequent to initial recognition, interest-bearing borrowings are measured at amortized cost with any difference between cost and redemption value being recognized in the income statement over the period of the borrowings on an effective interest basis.
Share capitalordinary shares are classified as equity. Repurchase of share capital is recognized as a reduction in equity and is classified as treasury shares.
Derivative financial instrumentsthe group uses derivative financial instruments such as currency forward contracts and currency swaps to hedge its exposure to foreign exchange risks arising from operational, financial and investment activities. these derivative financial instruments are accounted for as cash flow hedges since future highly probable cash flows are hedged (rather than committed revenues and expenses). the group also has embedded foreign exchange derivatives which have been separated from their ordinary commercial contracts. Derivative financial instruments are recognized initially at fair value. Derivatives are subsequently measured at fair value, and changes in fair value are accounted for as described below.
Cash flow hedgeHedging of the exposure to variability in cash flows that is attributable to a particular risk or a highly probable future cash flow is defined as a cash flow hedge. the effective portion of changes in the fair value is recognized in other comprehensive income as a hedge reserve. All foreign exchange exposure is hedged, of which about 80 percent qualifies for hedge accounting. the gain or loss relating to the ineffective portion of derivative hedging instruments is recognized immediately in the income statement as finance income or expense. Amounts accumulated in hedge reserves are reclassified to the income statement in the periods when the hedged item is recognized in the income statement.
Hedge accounting is discontinued when the hedge no longer qualifies for hedge accounting. Disqualification occurs when the hedging instrument expires, is sold, terminated or exercised, or when a forecast transaction is no longer expected or the hedge is no longer effective. When a hedge is disqualified, the cumulative gain or loss that was recognized in the

Annual Report 2015 | Financials and Notes 35
hedge reserve is recognized immediately in the income statement unless it relates to a future cash flow that is likely to occur, but don’t qualify for hedge accounting, in which the accumulated hedge reserve remains in other comprehensive income until the hedged cash flow is recognized in income statement.
Net investment hedgeHedge of net investment in a foreign operation is accounted for similarly to cash flow hedges. Gains or losses arising from the hedging instruments relating to the effective portions of the net investment hedge are recognized in other comprehensive income as currency translation reserves. these translation reserves are reclassified to the income statement upon disposal of the hedged net investments, offsetting the translation differences from these net investments. Any ineffective portion is recognized immediately in the income statement as finance income or expenses. Gains and losses accumulated in other comprehensive income are reclassified to the income statement when the foreign operation is partially disposed of or sold.
Embedded derivativesAn embedded derivative is any contract embedded in a host contract which meets the definition of a derivative. under certain conditions the embedded derivative must be separated from its host contract and the derivative is then to be recognized and measured as any other derivative in the financial statements. embedded derivatives must be separated when the settlement for a commercial contract is denominated in a currency different from any of the major contract parties’ own functional currency, or that the contract currency is not considered to be commonly used for the relevant economic environment defined as the countries involved in the cross-border transaction. Changes in the fair value of separated embedded derivatives are recognized immediately in the income statement. All foreign currency exposure is hedged, so the hedging instrument to the embedded derivative will also have corresponding opposite fair value changes in the income statement.
Finance income and expenseFinance income and expense includes interest income and expense on financial assets and liabilities, foreign exchange gains and losses, dividend income and gains and losses on derivatives. Interest income and expenses include calculated interest using the effective interest method, in addition to discounting effects from assets and liabilities measured at fair value. Gains and losses on derivatives include effects from derivatives that do not qualify for hedge accounting and embedded derivatives, in addition to the ineffective portion of qualifying hedges.
Revenue recognitionConstruction contractsConstruction contract revenues are recognized using the percentage of completion method. Stage of completion is determined by the method that measures reliably the work performed. Depending on the nature of the contract, the two main methods used by Akastor to assess stage of completion are:
�� technical completion, or
�� Contract costs incurred to date compared to estimated total contract costs.
When the final outcome of a contract cannot be reliably estimated, contract revenue is recognized only to the extent of costs incurred that
are expected to be recoverable. the revenue recognized in one period will be the revenues attributable to the period’s progress and adjustments related to changes in the estimated final outcome, if any. losses on contracts are fully recognized when identified.
Contract revenues include variation orders and incentive bonuses when it is probable that they will result in revenue that can be measured reliably. Disputed amounts and claims are only recognized when negotiations have reached an advanced stage, customer acceptance is highly likely and the amounts can be measured reliably. options for additional assets are included in the contract when exercised by the buyer. In the rare circumstances where the option is a loss contract, the full loss is recognized when it is probable that the options will be exercised.
See note 4 Significant accounting estimates and judgements for further description of recognition of construction contract revenue.
Goods sold and services renderedRevenue from the sale of goods is recognized in the income statement when the significant risks and rewards of ownership have been transferred to the buyer, which is usually when goods are delivered to customers. Revenue from services rendered is recognized in the income statement in proportion to the stage of completion of the transaction at the reporting date or is invoiced based on hours performed at agreed rates. the stage of completion is normally assessed based on the proportion of costs incurred for work performed to date compared to the estimated total contract costs. no revenue is recognized if there is significant uncertainty regarding recovery of consideration due.
Lease incomelease revenue from time charters and bareboat charters are recognized daily over the term of the charter. the company does not recognize revenue during days when the vessel is off-hire. other lease income from operating leases, mainly related to investment properties and office leases, is recognized as revenue on a straight-line basis over the term of the relevant lease. lease income is in included in operating revenue as service revenue.
Other incomeGains and losses resulting from acquisition and disposal of businesses which do not represent discontinued operations are included in other income. Such gains may result from the remeasurement of a previously held interest in the acquired entity. Changes in the fair value of the contingent consideration from acquisition of a subsidiary or non-controlling interest are recognized as part of other income.
Share of profit and loss from associated companies and joint ventures, to the extent that these investments are related to the group’s operating activities, are included in other income, as well as gains and losses related to the sale of operating assets.
ExpensesConstruction contractsContract costs include costs that relate directly to the specific contract and allocated costs that are attributable to general contract activity. Costs that cannot be attributed to contract activity are expensed. tender costs are capitalized when it is probable that the company will obtain the contract. All other bidding costs are expensed as incurred. See note 4 Significant accounting estimates and judgements for further description of recognition of construction contract costs.

Annual Report 2015 | Financials and Notes 36
Lease paymentslease payments made under operating leases are recognized in the income statement on a straight-line basis over the term of the lease. Any lease incentives received are recognized as an integral part of the total lease expense, over the term of the lease.
Income taxIncome tax recognized in the income statement comprises current and deferred tax. Income tax is recognized in the income statement except to the extent that it relates to items recognized directly in equity or other comprehensive income.
Current tax is the expected tax payable or receivable on the taxable income or loss for the year, using tax rates enacted or substantially enacted at the reporting date, and any adjustment to tax payable in respect of previous years. Current tax payable also includes any tax liability arising from the declaration of dividends, recognized at the same time as the liability to pay the related dividend.
Deferred tax is recognized in respect of temporary differences between the carrying amounts of assets and liabilities for financial reporting and the amounts used for taxation purposes. Deferred tax is not recognized for:
�� Goodwill not deductible for tax purposes
�� the initial recognition of assets or liabilities that affects neither accounting nor taxable profit
�� temporary differences relating to investments in subsidiaries to the extent that they will not reverse in the foreseeable future.
Deferred tax is measured at the tax rates that are expected to be applied to temporary differences when they reverse, based on the laws that have been enacted or substantively enacted by the reporting date.
Deferred tax assets and liabilities are offset if there is a legally enforceable right to offset current tax liabilities and assets, and they relate to income taxes levied by the same tax authority on the same taxable entity, or on different taxable entities which intend either to settle current tax liabilities and assets on a net basis, or to realize the tax assets and settle the liabilities simultaneously.
Deferred tax assets are recognized for unused tax losses, tax credits and deductible temporary differences, to the extent that it is probable that future taxable profits will be available against which they can be utilized. Measurement of deferred tax assets are reviewed at each reporting date.
Construction work in progressConstruction work in progress represents the aggregate amount of costs incurred and recognized profits, less the sum of recognized losses and progress billings. the presentation of construction work in progress in the statement of financial position depends on the financial status of the individual projects. All projects with net amounts due from customers are summarized and presented as an asset, and all projects with net amounts due to customers are summarized and presented as a liability in the statement of financial position. Advances are presented separately as such advances represent payments from customers in excess of the work performed.
InventoriesInventories are stated at the lower of cost or net realizable value. net
realizable value is the estimated selling price in the ordinary course of business, less the estimated costs of completion and selling expenses.
the cost of inventories is based on the first-in first-out principle and includes expenditures incurred in acquiring the inventories and bringing them to their present location and condition. In the case of manufactured inventories and work in progress, cost includes an appropriate share of overheads based on normal operating capacity.
ImpairmentTrade and other receivablesprovision of doubtful debt is made when there is objective evidence that the group will be unable to recover receivables in full. Receivables are impaired when the probability of recovery is assessed as being remote. the impairment is recognized in financial items to the extent that impairment is caused by the insolvency of the customer.
Available-for-sale financial assetsequity investments classified as available-for-sale are considered to be impaired when there is a significant (more than 20 percent) or prolonged (more than 6 months) decline in fair value of the investment below its cost. Any subsequent increase in value on available-for-sale assets is considered to be a revaluation and is recognized in other comprehensive income.
Other financial assetsthe recoverable amounts of receivables carried at amortized cost are calculated as the present value of estimated future cash flows, discounted at the original effective interest rate (the effective interest rate computed at initial recognition of the financial assets). Impairment losses are recognized only if there is objective evidence of impairment as a result of one or more events that occur after the initial recognition of the asset (a loss event) and the loss event has an impact on the estimated future cash flows of the financial assets that can be reliably estimated.
Non-financial assetsthe carrying amounts of the group’s assets, other than employee benefit assets, inventories, deferred tax assets and derivatives are reviewed at the end of each reporting period to determine whether there is any indication of impairment. If an indication of impairment exists, the asset’s recoverable amount is estimated. Cash-generating units (CGu) containing goodwill, intangible assets with an indefinite useful life and intangible assets that are not yet available for use are tested for impairment annually.
the recoverable amount is the greater of fair value less costs to sell and value in use. In assessing value in use, the estimated future cash flows are discounted to their present value using a pre-tax discount rate that reflects current market assessments of the time value of money and the risks specific to the asset. For an asset that does not generate largely independent cash inflows, the recoverable amount is determined for the CGu to which the asset belongs.
An impairment loss is recognized whenever the carrying amount of an asset or a CGu exceeds its recoverable amount. Impairment losses are recognized in the income statement.
An impairment loss recognized in respect of CGu (or a group of CGus) containing goodwill is allocated first to goodwill and then to the other assets in the CGu(s) on a pro rata basis.

Annual Report 2015 | Financials and Notes 37
An impairment loss on goodwill is not reversed. An impairment loss on other assets is reversed if there has been a change in the estimates used to determine the recoverable amount, and the change can be objectively related to an event occurring after the impairment is recognized. An impairment loss is reversed only to the extent that the asset’s carrying amount does not exceed the carrying amount that would have been determined, net of depreciation or amortization, if no impairment loss had been recognized.
ProvisionsA provision is recognized when the group has a present obligation as a result of a past event that can be estimated reliably and it is probable that the group will be required to settle the obligation. If the effect is material, provisions are determined by discounting the expected future cash flows at a market based pre-tax rate that reflects current market assessments of the time value of money and, where appropriate, the liability-specific risks. the unwinding of the discount is recognized as a finance cost.
Warrantiesprovision for warranties is recognized when the underlying products or services are sold. the provision is based on historical warranty data and a weighting of all possible outcomes against their associated probabilities.
Onerous contractsprovision for onerous contracts is recognized when the expected benefits to be derived by the group from a contract are lower than the unavoidable costs of meeting the obligations under the contract. the provision is measured at the lower of the expected cost of terminating the contract and the expected net cost of continuing with the contract. before a provision is recognized, the group recognizes any impairment loss on the assets associated with the contract.
RestructuringA restructuring provision is recognized when the group has developed a detailed formal plan for the restructuring and has raised a valid expectation in those affected that the entity will carry out the restructuring by starting to implement the plan or announcing its main features to those affected by it. the measurement of a restructuring provision includes only the direct expenditures arising from the restructuring, which are those amounts that are both necessarily entailed by the restructuring and not associated with the ongoing activities of the entity.
Property, plant and equipmentproperty, plant and equipment are measured at cost less accumulated depreciation and impairment losses. the cost of self-constructed assets includes the cost of materials, direct labour, borrowing costs on qualifying assets, production overheads and the estimated costs of dismantling and removing the assets and restoring the site on which they are located.
If the components of property, plant and equipment have different useful lives, they are accounted for as separate components.
Subsequent coststhe group capitalizes the cost of a replacement part or a component of property, plant and equipment when that cost is incurred if it is probable that the future economic benefits embodied with the item will flow to the group and the cost of the item can be measured reliably. All other costs are expensed as incurred.
DepreciationDepreciation is normally recognized on a straight-line basis over the estimated useful lives of property, plant and equipment. the production unit method is used for depreciation in limited circumstances when appropriate.
Investment propertyInvestment properties are properties held either to earn rental income or for capital appreciation, or for both. these properties are not used in production, deliveries of goods and services, or for administrative purposes. Investment properties are measured at cost applying the same principles as for property, plant and equipment (see description above).
Finance leasesleases where the group assumes substantially all the risks and rewards of ownership are classified as finance leases. At the beginning of the leasing period, finance leases are recognized at the lower of the fair value of the leased asset and the present value of the minimum lease payments. the corresponding liability to the lessor is included in the statement of financial position as other non-current liabilities except for first year instalment which is recognized as current liabilities. lease payments are apportioned between finance charges and reduction of the lease obligation so as to achieve a constant rate of interest of the remaining balance of the liability. leased assets are depreciated over the shorter of the lease term and their useful lives unless it is reasonably certain that the group will obtain ownership by the end of the lease term.
Intangible assetsGoodwillGoodwill that arises from the acquisition of subsidiaries is presented as intangible asset. For the measurement of goodwill at initial recognition, see business combinations.
Goodwill is measured at cost less accumulated impairment losses. In respect of equity-accounted investees, the carrying amount of goodwill is included in the carrying amount of the investment, and any impairment loss is allocated to the carrying amount of the equity-accounted investee as a whole.
When the group disposes of an operation within a CGu or group of CGus to which goodwill has been allocated, a portion of the goodwill is included in the carrying amount of the operation when determining the gain or loss on disposal. the portion of the goodwill allocated is measured based on the relative values of the operation disposed of and the portion of the CGu retained at the date of partial disposal, unless it can be demonstrated that another method better reflects the goodwill associated with the operation disposed of. the same principle is used for allocation of goodwill when the group reorganizes its businesses.
Research and developmentexpenditures on research activities undertaken with the prospect of obtaining new scientific or technical knowledge and understanding is recognized in the income statement as incurred.
Development activities involve a plan or design for the production of new or substantially improved products or processes. Development expenditure is capitalized only if development costs can be measured reliably, the product or process is technically and commercially feasible, future economic benefits are probable and the group intends to and has sufficient resources to complete development and to use or sell
Annual Report 2015 | Financials and Notes 38
Note 4 | significant accounting estimates and judgements
estimates and judgements are continually reviewed and are based on historical experiences and expectations of future events. the resulting accounting estimates will, by definition, seldom accurately match actual results, but are based on the best estimate at the time. estimates and assumptions that have a significant risk of causing material adjustments to the carrying amounts of assets and liabilities within the next financial year are discussed below.
Revenue recognitionthe percentage-of-completion method is used to account for construction contracts. this method requires estimates of the final revenue and costs of the contract, as well as measurement of progress achieved to date as a proportion of the total work to be performed.
the main uncertainty when assessing contract revenue is related to recoverable amounts from variation orders, claims and incentive payments which are recognized when, in the group’s judgement, it is probable that they will result in revenue and are measurable. this assessment is adjusted by management’s evaluation of liquidated damages to be imposed by customers typically relating to contractual delivery terms. In many projects, there are frequent changes in scope of work resulting in a number of variation orders. normally the contracts with customers include procedures for presentation of and agreement of variation orders. At any point in time, there will be unapproved variation orders and claims included in the project revenue where recovery is assessed as probable and other criteria are
met. even though management has extensive experience in assessing the outcome of such negotiations, uncertainties exist.
Remaining project costs depend on productivity factors and the cost of inputs. Weather conditions, the performance of subcontractors and others with an impact on schedules, commodity prices and currency rates can affect cost estimates. experience, systematic use of the project execution model and focus on core competencies reduce, but do not eliminate, the risk that estimates may change significantly. A risk contingency is included in project cost based on the risk register that is prepared for every project.
progress measurement based on costs has an inherent risk related to the cost estimate as described above. In situations where cost does not seem to properly reflect actual progress, alternative measures such as hours or physical progress are used to achieve more precise revenue recognition. the estimation uncertainty during the early stages of a contract is mitigated by a policy of normally not recognizing revenue in excess of costs on large lump sum projects before the contract reaches 20 percent of completion. However, management can on a project-by-project basis give approval of earlier recognition if cost estimates are certain, typically in situations of repeat projects, proven technology or proven execution model.
WarrantiesA provision is made for expected warranty expenditures. the warranty period is normally two years as one operating cycle. based on experience,
the asset. the capitalized expenditure includes cost of materials, direct labour overhead costs that are directly attributable to preparing the asset for it intended use and capitalized interest on qualifying assets. other development expenditures are recognized in the income statement as an expense as incurred.
Capitalized development expenditure is measured at cost less accumulated amortization and accumulated impairment losses.
Other intangible assetsAcquired intangible assets are measured at cost less accumulated amortization and impairment losses.
Subsequent expendituresSubsequent expenditures on intangible assets are capitalized only when they increase the future economic benefits embodied in the specific asset to which they relate. All other expenditures are expensed as incurred.
AmortizationAmortization is recognized in the income statement on a straight-line basis over the estimated useful lives of intangible assets unless such useful lives are indefinite. Intangible assets are amortized from the date they are available for use.
Employee benefitsDefined contribution plansobligations for contributions to defined contribution pension plans are recognized as an expense in the income statement as incurred.
Defined benefit plansthe group’s net obligation in respect of defined benefit pension plans is calculated separately for each plan by estimating the amount of future benefit that employees have earned in the current and prior periods; discounting that amount and deducting the fair value of any plan assets.
the calculation of defined benefit obligations is performed annually by a qualified actuary using the projected unit credit method. the discount rate is the yield at the reporting date on government bonds or high-quality corporate bonds with maturities consistent with the terms of the obligations.
Remeasurement of the net defined benefit liability, which comprises actuarial gains and losses, the return on plan assets (excluding interest) and the effect of the asset ceiling (if any, excluding interest), are recognized immediately in other comprehensive income. the group determines the net interest expense (income) on the net defined benefit liability (asset) for the period by applying the discount rate used to measure the defined benefit obligation at the beginning of the annual period to the then-net defined benefit liability (asset), taking into account any changes in the net defined benefit liability (asset) during the period as a result of contributions and benefit payments. net interest expense and other expenses related to defined benefit plans are recognized in the income statement.
When the benefits of a plan are changed or when a plan is curtailed, the resulting change in benefit that relates to past service or the gain or loss on curtailment is recognized immediately in the income statement. the group recognizes gains and losses on the settlement of a defined benefit plan when the settlement occurs.

Annual Report 2015 | Financials and Notes 39
the provision is often estimated at one percent of the contract value, but can also be a higher or lower amount following a specific evaluation of the actual circumstances for each contract. both the general one percent provision and the evaluation of project specific circumstances are based on experience from earlier projects. Factors that could affect the estimated warranty cost include the group’s quality initiatives and project execution model. Reference is made to note 29 provisions for further information about provisions for warranty expenditures on delivered projects.
Leasesthe determination of whether an arrangement is (or contains) a lease is based on the substance of the arrangement at the inception date. the arrangement is assessed for whether fulfilment of the arrangement is dependent on the use of a specific asset or assets or the arrangement conveys a right to use the asset or assets, even if that right is not explicitly specified in an arrangement.
leases are classified as finance leases when the terms of the lease transfer substantially all the risks and rewards incidental to ownership to the lessee. All other leases are classified as operating leases. the assessment for the classification of leases is based on the substance of the transactions and requires judgement.
Impairment of non-financial assetsProperty, plant and equipment and intangible assetsthe group has significant non-current assets recognized in the consolidated statement of financial position related to property, plant and equipment and intangible assts. the value in use of some of these assets can be significantly impacted by changes of market conditions. the group considers whether there are indications of impairment on the carrying amounts of such non-current assets. If such indications exist, an impairment test is performed to assess whether or not the assets should be impaired. the valuations, often determined by value-in-use calculations, will often have to be performed based on estimates of future cash flows discounted by an appropriate discount rate. Significant estimates and judgments have to be made by the management, including determining appropriated cash-generating units and discount rate, projections for future cash flows and assumptions of future market conditions. References are made to note 14 property, plant and equipment and note 16 Intangible assets.
Goodwillthe group performs impairment testing of goodwill annually or more frequently if any impairment indicators are identified. the recoverable amounts of cash-generating units to which goodwill is allocated have been determined based on value-in-use calculations. these calculations require management to estimate future cash flows expected to arise from these cash-generating units and an appropriate discount rate to reflect the time value of the money. Key assumptions made by the management include also assumptions for future market conditions, which require a high degree of judgment. Further details about goodwill allocation and impairment testing are included in note 17 Impairment testing of goodwill.
Income taxesthe group is subject to income taxes in numerous jurisdictions. Significant judgement is required to determine the worldwide provision for income taxes. there are many transactions and calculations for which the ultimate tax determination is uncertain during the ordinary course of business. provisions for anticipated tax audit issues are based on estimates of eventual additional taxes.
Income tax expense is calculated based on reported income in the different legal entities. Deferred income tax expense is calculated based on the differences between the assets’ carrying amount for financial reporting purposes and their respective tax basis that are considered temporary in nature. the total amount of income tax expense and allocation between current and deferred income tax requires management’s interpretation of complex tax laws and regulations in the many tax jurisdictions where the group operates.
Valuation of deferred tax assets is dependent on management’s assessment of future recoverability of the deferred tax benefit. expected recoverability may result from expected taxable income in the near future, planned transactions or planned tax optimizing measures. economic conditions may change and lead to a different conclusion regarding recoverability, and such change may affect the results for each future reporting period.
tax authorities in different jurisdictions may challenge calculation of income taxes from prior periods. Such processes may lead to changes to prior periods’ taxable income, resulting in changes to income tax expense in the period of change. During the period when tax authorities challenge income tax calculations, management is required to make estimates of the probability and size of possible tax adjustments. Such estimates may change as additional information becomes known. Further details about income taxes are included in note 12 Income tax.
Onerous contractsthe group has entered into several non-cancellable lease contracts for office premises which may result in vacant leased space. the group recognizes a provision for such lease contracts when the leased property is or will be vacant during the non-cancellable lease period. the provision is made for the discounted future lease payments, net of expected sublease income, if any. Key assumptions in determining the provisions are primarily related to expected sublease income, length of vacancy periods and appropriate discount rates. Further information about provision for onerous contracts is included in note 29 provisions.
Pension benefitsthe present value of the pension obligations depends on a number of factors determined on the basis of actuarial assumptions. these assumptions include financial factors such as the discount rate, expected salary growth, inflation and return on assets as well as demographical factors concerning mortality, employee turnover, disability and early retirement. Assumptions about all these factors are based on the situation at the time the assessment is made. However, it is reasonably certain that such factors will change over the very long periods for which pension calculations are made. Any changes in these assumptions will affect the calculated pension obligations with immediate recognition in other comprehensive income. Further information about the pension obligations and the assumptions used are included in note 28 employee benefits - pension.
Legal claimsGiven the scope of the group’s worldwide operations, group companies are inevitably involved in legal disputes in the course of their business activities. provisions have been made to cover the expected outcome of the disputes to the extent negative outcomes are likely and reliable estimates can be made. However, the final outcome of these cases is subject to uncertainties, and resulting liabilities may exceed provisions recognized.
Annual Report 2015 | Financials and Notes 40
Amounts in NOK million 2015property, plant and equipment (314)Investment property (696)Intangible assets (16)trade and other receivables (30)Cash and cash equivalents (6)Deferred tax liabilities 144 other non-current liabilities 20 trade and other payables 13 other current liabilities 32 Net assets and liabilities (854) Consideration received, satisfied in cash 1 156 Cash and cash equivalents disposed of (6)cash inflows from disposal of subsidiaries, net of cash disposed of 1 150
Note 5 | Disposal of subsidiaries
In July 2015, Akastor sold its shareholding in pusnes eiendom Invest AS and in December 2015, Akastor sold its entire real estate portfolio comprising of eight properties to Aker Maritime Finance AS, a subsidiary of Aker ASA. the total consideration received was noK 1 156 million and resulted in a gain of noK 303 million recognized in other income. See also note 36 Related parties.
the table below shows the effects on the consolidated statement of financial position from disposals of subsidiaries during 2015:
Disposals and demerger of subsidiaries in 2014 Disposal of Mooring and Loading systems businesson october 30, 2013, Akastor agreed to sell its mooring and loading systems business (MlS) to Cargotec. the unit, known for the pusnes brand name, provides mooring equipment, loading and offloading systems, as well as deck machinery for the global offshore and shipping markets. the division employs about 370 people in europe, Asia and the Americas and has its main office in Arendal, norway. the transaction was completed on January 30, 2014. the amounts in the income statement were presented as discontinued operations in 2014.
Disposal of Well-Intervention Services businesseson november 22, 2013, Akastor agreed to sell its well intervention services businesses (WIS) to eQt. the business provided services that optimize flows from oil reservoirs and its main markets were in the uK and norway. the division had about 1,500 employees in europe, Asia, the uS and the Middle east. the transaction was completed on January 9, 2014. the amounts in the income statement were presented as discontinued operations in 2014.
the agreement includes an earn-out provision where Akastor will receive 25 percent of any internal rate of return exceeding 12 percent a year on eQt’s equity investment.
Demerger of Aker Solutionson September 26, 2014, the demerger of Aker Solutions was completed and on September 29, 2014, Aker Solutions Holding ASA (“Aker Solutions”), a subsidiary of Akastor ASA established for the purposes of the demerger, was listed on the oslo Stock exchange. Aker Solutions includes activities in the following areas of operation: Subsea, umbilicals, Maintenance, Modifications and operations (MMo) and engineering.
Aker Solutions was presented as discontinued operations and held for distribution from July 16, 2014. According to IFRS 5, no depreciation and amortization was recognized from the time when held-for-sale criteria were met. no gain was recognized upon disposal as this was a transaction under common control and accounted for at book values.
Disposal of K2 Hotellbygg ASon June 4, 2014, Akastor sold the 93 percent shareholding in K2 Hotellbygg AS. the consideration was noK 175 million and resulted in a gain of noK 113 million recognized in other income.
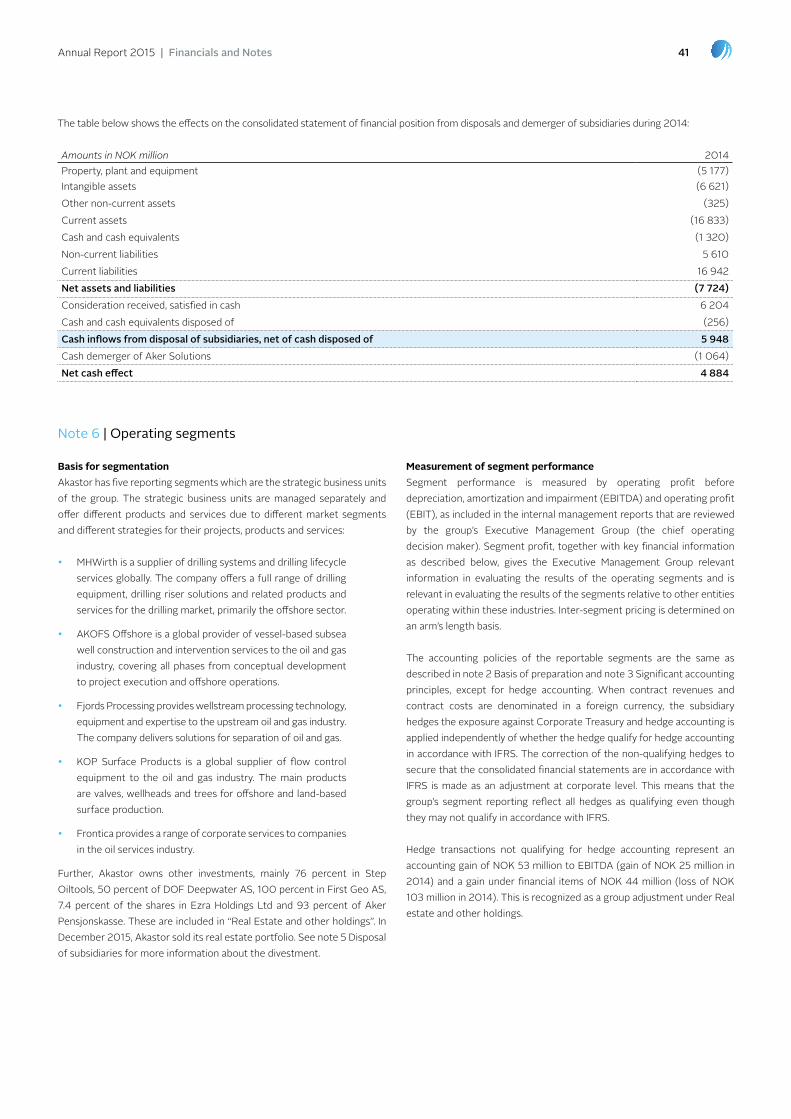
Annual Report 2015 | Financials and Notes 41
Amounts in NOK million 2014property, plant and equipment (5 177)Intangible assets (6 621)other non-current assets (325)Current assets (16 833)Cash and cash equivalents (1 320)non-current liabilities 5 610 Current liabilities 16 942 Net assets and liabilities (7 724) Consideration received, satisfied in cash 6 204 Cash and cash equivalents disposed of (256)cash inflows from disposal of subsidiaries, net of cash disposed of 5 948 Cash demerger of Aker Solutions (1 064)Net cash effect 4 884
Basis for segmentationAkastor has five reporting segments which are the strategic business units of the group. the strategic business units are managed separately and offer different products and services due to different market segments and different strategies for their projects, products and services:
�� MHWirth is a supplier of drilling systems and drilling lifecycle services globally. the company offers a full range of drilling equipment, drilling riser solutions and related products and services for the drilling market, primarily the offshore sector.
�� AKoFS offshore is a global provider of vessel-based subsea well construction and intervention services to the oil and gas industry, covering all phases from conceptual development to project execution and offshore operations.
�� Fjords processing provides wellstream processing technology, equipment and expertise to the upstream oil and gas industry. the company delivers solutions for separation of oil and gas.
�� Kop Surface products is a global supplier of flow control equipment to the oil and gas industry. the main products are valves, wellheads and trees for offshore and land-based surface production.
�� Frontica provides a range of corporate services to companies in the oil services industry.
Further, Akastor owns other investments, mainly 76 percent in Step oiltools, 50 percent of DoF Deepwater AS, 100 percent in First Geo AS, 7.4 percent of the shares in ezra Holdings ltd and 93 percent of Aker pensjonskasse. these are included in “Real estate and other holdings”. In December 2015, Akastor sold its real estate portfolio. See note 5 Disposal of subsidiaries for more information about the divestment.
Measurement of segment performanceSegment performance is measured by operating profit before depreciation, amortization and impairment (ebItDA) and operating profit (ebIt), as included in the internal management reports that are reviewed by the group’s executive Management Group (the chief operating decision maker). Segment profit, together with key financial information as described below, gives the executive Management Group relevant information in evaluating the results of the operating segments and is relevant in evaluating the results of the segments relative to other entities operating within these industries. Inter-segment pricing is determined on an arm’s length basis.
the accounting policies of the reportable segments are the same as described in note 2 basis of preparation and note 3 Significant accounting principles, except for hedge accounting. When contract revenues and contract costs are denominated in a foreign currency, the subsidiary hedges the exposure against Corporate treasury and hedge accounting is applied independently of whether the hedge qualify for hedge accounting in accordance with IFRS. the correction of the non-qualifying hedges to secure that the consolidated financial statements are in accordance with IFRS is made as an adjustment at corporate level. this means that the group’s segment reporting reflect all hedges as qualifying even though they may not qualify in accordance with IFRS.
Hedge transactions not qualifying for hedge accounting represent an accounting gain of noK 53 million to ebItDA (gain of noK 25 million in 2014) and a gain under financial items of noK 44 million (loss of noK 103 million in 2014). this is recognized as a group adjustment under Real estate and other holdings.
Note 6 | Operating segments
the table below shows the effects on the consolidated statement of financial position from disposals and demerger of subsidiaries during 2014:
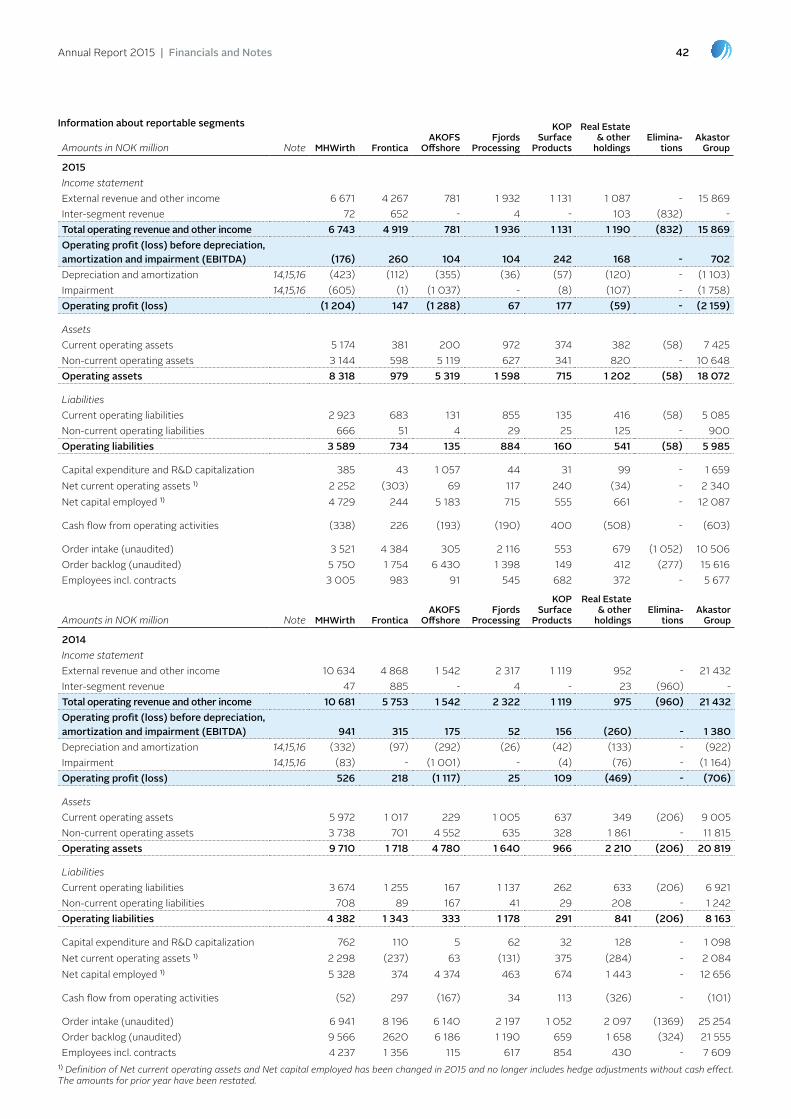
Annual Report 2015 | Financials and Notes 42
Amounts in NOK million Note mhWirth fronticaAKOfs
Offshorefjords
processing
KOp surface
products
Real Estate & other
holdingsElimina-
tionsAkastor
group
2015Income statementexternal revenue and other income 6 671 4 267 781 1 932 1 131 1 087 - 15 869 Inter-segment revenue 72 652 - 4 - 103 (832) - Total operating revenue and other income 6 743 4 919 781 1 936 1 131 1 190 (832) 15 869 Operating profit (loss) before depreciation, amortization and impairment (EBITDA) (176) 260 104 104 242 168 - 702 Depreciation and amortization 14,15,16 (423) (112) (355) (36) (57) (120) - (1 103)Impairment 14,15,16 (605) (1) (1 037) - (8) (107) - (1 758)Operating profit (loss) (1 204) 147 (1 288) 67 177 (59) - (2 159)
AssetsCurrent operating assets 5 174 381 200 972 374 382 (58) 7 425 non-current operating assets 3 144 598 5 119 627 341 820 - 10 648 Operating assets 8 318 979 5 319 1 598 715 1 202 (58) 18 072
LiabilitiesCurrent operating liabilities 2 923 683 131 855 135 416 (58) 5 085 non-current operating liabilities 666 51 4 29 25 125 - 900 Operating liabilities 3 589 734 135 884 160 541 (58) 5 985
Capital expenditure and R&D capitalization 385 43 1 057 44 31 99 - 1 659net current operating assets 1) 2 252 (303) 69 117 240 (34) - 2 340 net capital employed 1) 4 729 244 5 183 715 555 661 - 12 087
Cash flow from operating activities (338) 226 (193) (190) 400 (508) - (603)
order intake (unaudited) 3 521 4 384 305 2 116 553 679 (1 052) 10 506 order backlog (unaudited) 5 750 1 754 6 430 1 398 149 412 (277) 15 616 employees incl. contracts 3 005 983 91 545 682 372 - 5 677
Amounts in NOK million Note mhWirth fronticaAKOfs
Offshorefjords
processing
KOp surface
products
Real Estate & other
holdingsElimina-
tionsAkastor
group
2014Income statementexternal revenue and other income 10 634 4 868 1 542 2 317 1 119 952 - 21 432 Inter-segment revenue 47 885 - 4 - 23 (960) - Total operating revenue and other income 10 681 5 753 1 542 2 322 1 119 975 (960) 21 432 Operating profit (loss) before depreciation, amortization and impairment (EBITDA) 941 315 175 52 156 (260) - 1 380 Depreciation and amortization 14,15,16 (332) (97) (292) (26) (42) (133) - (922)Impairment 14,15,16 (83) - (1 001) - (4) (76) - (1 164)Operating profit (loss) 526 218 (1 117) 25 109 (469) - (706)
AssetsCurrent operating assets 5 972 1 017 229 1 005 637 349 (206) 9 005 non-current operating assets 3 738 701 4 552 635 328 1 861 - 11 815 Operating assets 9 710 1 718 4 780 1 640 966 2 210 (206) 20 819
LiabilitiesCurrent operating liabilities 3 674 1 255 167 1 137 262 633 (206) 6 921 non-current operating liabilities 708 89 167 41 29 208 - 1 242 Operating liabilities 4 382 1 343 333 1 178 291 841 (206) 8 163
Capital expenditure and R&D capitalization 762 110 5 62 32 128 - 1 098net current operating assets 1) 2 298 (237) 63 (131) 375 (284) - 2 084 net capital employed 1) 5 328 374 4 374 463 674 1 443 - 12 656
Cash flow from operating activities (52) 297 (167) 34 113 (326) - (101)
order intake (unaudited) 6 941 8 196 6 140 2 197 1 052 2 097 (1369) 25 254 order backlog (unaudited) 9 566 2620 6 186 1 190 659 1 658 (324) 21 555 employees incl. contracts 4 237 1 356 115 617 854 430 - 7 609
1) Definition of Net current operating assets and Net capital employed has been changed in 2015 and no longer includes hedge adjustments without cash effect. The amounts for prior year have been restated.
Information about reportable segments

Annual Report 2015 | Financials and Notes 43
Reconciliations of information on reportable segments to IfRs measures
Amounts in NOK million Note 2015 2014
Assetstotal segment assets 18 130 21 025 Derivative financial instruments 1 746 2 199 Cash and cash equivalents 24 563 1 075 Current interest-bearing receivables 18 72 205 non-current interest-bearing receivables 18 84 131 elimination of intra-group assets (58) (206)consolidated assets 20 537 24 430
Liabilitiestotal segment liabilities 6 043 8 369 Derivative financial instruments 1 528 1 861 Current borrowings 26 4 054 308 non-current borrowings 26 1 583 4 720 elimination of intra-group liabilities (58) (206)consolidated liabilities 13 150 15 051
Major customersRevenue from one customer to all segments represents approximately noK 3.9 billion (noK 4.2 billion in 2014) of the group's total revenue.
Geographical informationGeographical revenue is presented on the basis of geographical location of the group companies selling to the customers. non-current segment assets and capital expenditures are based on the geographical location of the assets. norway and uK have revenues or non-current assets higher than 10 percent of the group.
Operating revenue and other income
Non-current assets excluding deferred tax assets and financial instruments
Amounts in NOK million 2015 2014 2015 2014
norway 8 010 13 705 6 451 7 511uK 2 039 1 906 317 309other europe 1 062 1 334 1 168 1 254north America 1 202 1 145 514 465South America 440 502 579 513Asia 1 991 1 866 802 1 124Australia 936 879 57 25Middle east 168 64 29 11other 22 32 2 - Total 15 869 21 432 9 919 11 211
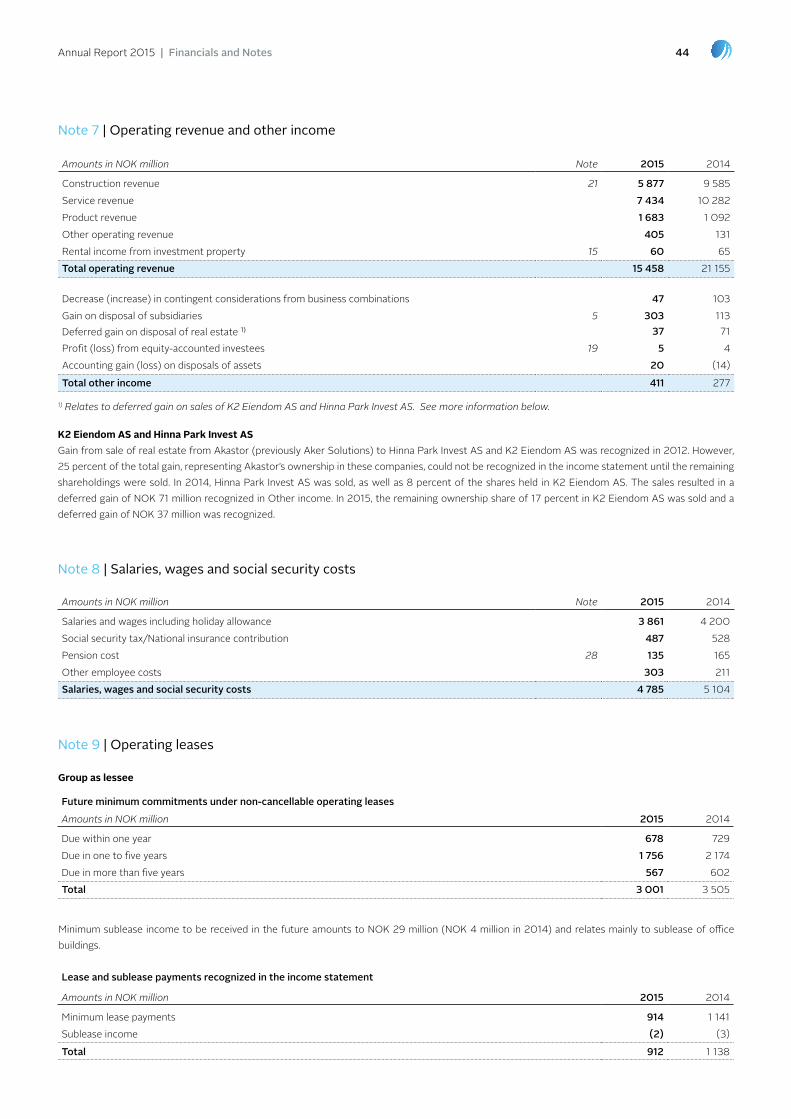
Annual Report 2015 | Financials and Notes 44
Note 7 | Operating revenue and other income
Note 8 | salaries, wages and social security costs
Amounts in NOK million Note 2015 2014
Construction revenue 21 5 877 9 585 Service revenue 7 434 10 282 product revenue 1 683 1 092 other operating revenue 405 131 Rental income from investment property 15 60 65 Total operating revenue 15 458 21 155
Decrease (increase) in contingent considerations from business combinations 47 103 Gain on disposal of subsidiaries 5 303 113 Deferred gain on disposal of real estate 1) 37 71 profit (loss) from equity-accounted investees 19 5 4 Accounting gain (loss) on disposals of assets 20 (14)
Total other income 411 277
1) Relates to deferred gain on sales of K2 Eiendom AS and Hinna Park Invest AS. See more information below.
Amounts in NOK million Note 2015 2014
Salaries and wages including holiday allowance 3 861 4 200 Social security tax/national insurance contribution 487 528 pension cost 28 135 165 other employee costs 303 211 salaries, wages and social security costs 4 785 5 104
Note 9 | Operating leases
future minimum commitments under non-cancellable operating leases
Amounts in NOK million 2015 2014
Due within one year 678 729 Due in one to five years 1 756 2 174 Due in more than five years 567 602 Total 3 001 3 505
lease and sublease payments recognized in the income statement
Amounts in NOK million 2015 2014
Minimum lease payments 914 1 141 Sublease income (2) (3)
Total 912 1 138
Group as lessee
K2 Eiendom AS and Hinna Park Invest AS Gain from sale of real estate from Akastor (previously Aker Solutions) to Hinna park Invest AS and K2 eiendom AS was recognized in 2012. However, 25 percent of the total gain, representing Akastor’s ownership in these companies, could not be recognized in the income statement until the remaining shareholdings were sold. In 2014, Hinna park Invest AS was sold, as well as 8 percent of the shares held in K2 eiendom AS. the sales resulted in a deferred gain of noK 71 million recognized in other income. In 2015, the remaining ownership share of 17 percent in K2 eiendom AS was sold and a deferred gain of noK 37 million was recognized.
Minimum sublease income to be received in the future amounts to noK 29 million (noK 4 million in 2014) and relates mainly to sublease of office buildings.

Annual Report 2015 | Financials and Notes 45
the group has operating lease costs for buildings on a large number of locations worldwide. the leases typically run for a period of 12-15 years, with an option to renew the lease at market conditions.
Vessel lease costs relate to operations in AKoFS offshore and include rental for Skandi Santos vessel in 2015. the Skandi Santos lease contract runs for a period of 5 years, with an option to renew five times of one year
each. the contract is in its second year of option. the AKoFS Seafarer vessel was acquired in February 2015 and Aker Wayfarer vessel was recognized as finance lease as of September 2014.
the group has also operating lease costs related to It equipment, cars and inventory. these leases have an average lease period of 3-5 years with no renewal options included in the contracts.
future minimum lease income commitments under non-cancellable operating leases
Amounts in NOK million 2015 2014
Due within one year 965 799 Due in one to five years 4 903 2 928 Due in more than five years 403 1 958
Total 6 272 5 685
Group as lessor
Lease income recognized in the income statementoperating lease income relates mainly to the vessels Skandi Santos and Aker Wayfarer, investment properties, offices leases to Aker Solutions and to the rental business in Step oiltools. operating lease income of noK 1 218 million is recognized in the income statement in 2015.
Akastor AsA subsidiaries TotalAmounts in NOK million 2015 2014 2015 2014 2015 2014
Audit 2 4 14 12 16 16 other assurance services1) - 18 2 1 2 19 tax services - - 1 1 1 1 other non-audit services - 1 1 1 - 2 Total 2 23 18 15 19 39 1) In 2014, NOK 18 million related to services provided during the demerger of the group. The amount was recharged to Aker Solutions.
Note 10 | Other operating expenses
other operating expenses amount to noK 1.8 billion in 2015 (noK 2.2 billion in 2014). the expenses include operating lease costs ( see note 9 operating leases), travel expenses, audit fees and other expenses mainly related to premises, electricity and maintenance.
Fees to the auditorsthe table below summarizes audit fees, as well as fees for audit related services, tax services and other services incurred by the group during 2015 and 2014.
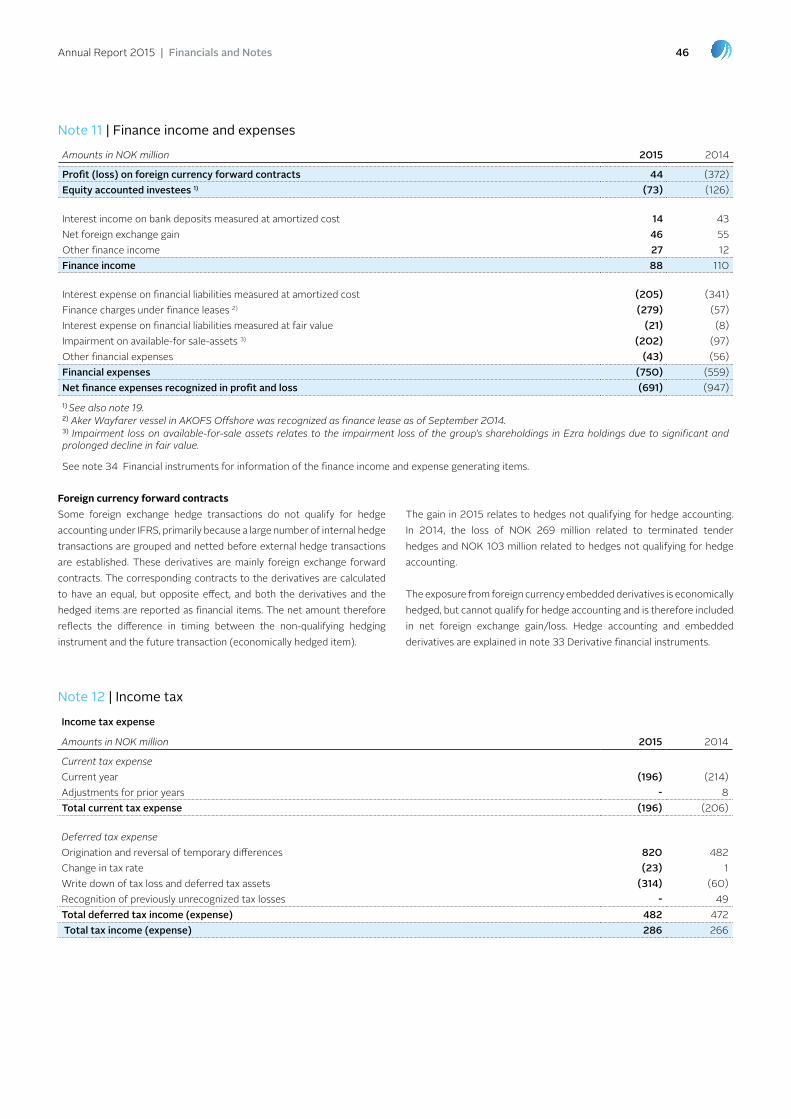
Annual Report 2015 | Financials and Notes 46
Foreign currency forward contractsSome foreign exchange hedge transactions do not qualify for hedge accounting under IFRS, primarily because a large number of internal hedge transactions are grouped and netted before external hedge transactions are established. these derivatives are mainly foreign exchange forward contracts. the corresponding contracts to the derivatives are calculated to have an equal, but opposite effect, and both the derivatives and the hedged items are reported as financial items. the net amount therefore reflects the difference in timing between the non-qualifying hedging instrument and the future transaction (economically hedged item).
the gain in 2015 relates to hedges not qualifying for hedge accounting. In 2014, the loss of noK 269 million related to terminated tender hedges and noK 103 million related to hedges not qualifying for hedge accounting.
the exposure from foreign currency embedded derivatives is economically hedged, but cannot qualify for hedge accounting and is therefore included in net foreign exchange gain/loss. Hedge accounting and embedded derivatives are explained in note 33 Derivative financial instruments.
Income tax expense
Amounts in NOK million 2015 2014
Current tax expenseCurrent year (196) (214)Adjustments for prior years - 8 Total current tax expense (196) (206)
Deferred tax expenseorigination and reversal of temporary differences 820 482 Change in tax rate (23) 1 Write down of tax loss and deferred tax assets (314) (60)Recognition of previously unrecognized tax losses - 49 Total deferred tax income (expense) 482 472 Total tax income (expense) 286 266
Note 12 | income tax
Amounts in NOK million 2015 2014
profit (loss) on foreign currency forward contracts 44 (372)Equity accounted investees 1) (73) (126)
Interest income on bank deposits measured at amortized cost 14 43 net foreign exchange gain 46 55 other finance income 27 12 finance income 88 110
Interest expense on financial liabilities measured at amortized cost (205) (341)Finance charges under finance leases 2) (279) (57)Interest expense on financial liabilities measured at fair value (21) (8)Impairment on available-for sale-assets 3) (202) (97)other financial expenses (43) (56)financial expenses (750) (559)Net finance expenses recognized in profit and loss (691) (947)1) See also note 19.2) Aker Wayfarer vessel in AKOFS Offshore was recognized as finance lease as of September 2014.3) Impairment loss on available-for-sale assets relates to the impairment loss of the group’s shareholdings in Ezra holdings due to significant and prolonged decline in fair value.
See note 34 Financial instruments for information of the finance income and expense generating items.
Note 11 | finance income and expenses
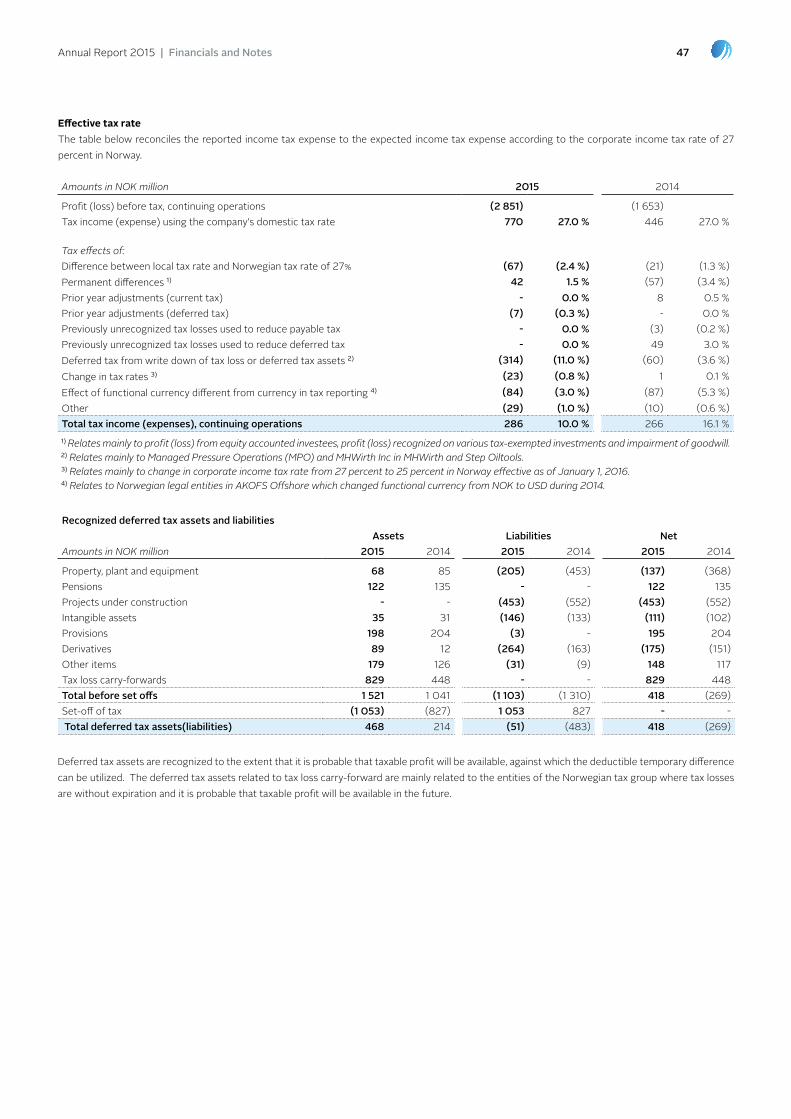
Annual Report 2015 | Financials and Notes 47
Recognized deferred tax assets and liabilities Assets liabilities NetAmounts in NOK million 2015 2014 2015 2014 2015 2014
property, plant and equipment 68 85 (205) (453) (137) (368)pensions 122 135 - - 122 135 projects under construction - - (453) (552) (453) (552)Intangible assets 35 31 (146) (133) (111) (102)provisions 198 204 (3) - 195 204 Derivatives 89 12 (264) (163) (175) (151)other items 179 126 (31) (9) 148 117 tax loss carry-forwards 829 448 - - 829 448 Total before set offs 1 521 1 041 (1 103) (1 310) 418 (269)Set-off of tax (1 053) (827) 1 053 827 - - Total deferred tax assets(liabilities) 468 214 (51) (483) 418 (269)
Amounts in NOK million 2015 2014
profit (loss) before tax, continuing operations (2 851) (1 653)tax income (expense) using the company's domestic tax rate 770 27.0 % 446 27.0 %
Tax effects of:Difference between local tax rate and norwegian tax rate of 27% (67) (2.4 %) (21) (1.3 %)permanent differences 1) 42 1.5 % (57) (3.4 %)prior year adjustments (current tax) - 0.0 % 8 0.5 %prior year adjustments (deferred tax) (7) (0.3 %) - 0.0 %previously unrecognized tax losses used to reduce payable tax - 0.0 % (3) (0.2 %)previously unrecognized tax losses used to reduce deferred tax - 0.0 % 49 3.0 %Deferred tax from write down of tax loss or deferred tax assets 2) (314) (11.0 %) (60) (3.6 %)Change in tax rates 3) (23) (0.8 %) 1 0.1 %effect of functional currency different from currency in tax reporting 4) (84) (3.0 %) (87) (5.3 %)other (29) (1.0 %) (10) (0.6 %)Total tax income (expenses), continuing operations 286 10.0 % 266 16.1 %1) Relates mainly to profit (loss) from equity accounted investees, profit (loss) recognized on various tax-exempted investments and impairment of goodwill.2) Relates mainly to Managed Pressure Operations (MPO) and MHWirth Inc in MHWirth and Step Oiltools.3) Relates mainly to change in corporate income tax rate from 27 percent to 25 percent in Norway effective as of January 1, 2016.4) Relates to Norwegian legal entities in AKOFS Offshore which changed functional currency from NOK to USD during 2014.
Effective tax ratethe table below reconciles the reported income tax expense to the expected income tax expense according to the corporate income tax rate of 27 percent in norway.
Deferred tax assets are recognized to the extent that it is probable that taxable profit will be available, against which the deductible temporary difference can be utilized. the deferred tax assets related to tax loss carry-forward are mainly related to the entities of the norwegian tax group where tax losses are without expiration and it is probable that taxable profit will be available in the future.

Annual Report 2015 | Financials and Notes 48
Amounts in NOK million 2015 2014
expiry in 2018 168 144expiry in 2019 and later 444 138Indefinite 216 113Total 828 395
Amounts in NOK million 2015 2014
profit (loss) attributable to ordinary shares (2 587) 2 482 profit (loss) attributable to ordinary shares from continuing operations (2 564) (1 398)
Note 13 | earnings per share
Akastor ASA holds 2 776 376 treasury shares at year end 2015 (2 976 376 in 2014). treasury shares are not included in the weighted average number of ordinary shares.
unrecognized other deferred tax assets are noK 63 million in 2015 (noK 5 million in 2014).
Basic/ diluted earnings per sharethe calculation of basic/diluted earnings per share is based on the profit (loss) attributable to ordinary shareholders and a weighted average number of ordinary shares outstanding.
2015 2014
Issued ordinary shares as of January 1 274 000 000 274 000 000 Weighted average number of issued ordinary shares for the year adjusted for treasury shares 271 086 638 271 830 726 Basic/ diluted earnings (loss) per share (NOK) (9.54) 9.13Basic/ diluted earnings (loss) per share for continuing operations (NOK) (9.46) (5.09)
Unrecognized tax loss carry-forwards and unrecognized deferred tax assets Deferred tax assets have not been recognized in respect of tax loss carry-forwards or deductible temporary differences when the group evaluates that it is not probable that future taxable profit will be available against which the group can utilize these benefit based on forecasts and realistic expectations.
change in net recognized deferred tax assets and liabilities
Amounts in NOK million
property, plant and
equipment pensions
projects under con-
structionIntangible
assetsprovi-sions Derivatives
Other items
Tax loss carry-
forwards Total
balance as of January 1, 2014 (554) 215 (2 041) (322) 282 (135) 291 807 (1 457)Demerge of Aker Solutions 114 (137) 1 509 202 (204) 75 (97) (704) 758 Disposal of subsidiaries 22 - - - - - - - 22 Recognized in profit and loss 102 (8) (20) 31 87 (67) 50 297 472 Recognized in other comprehensive income (13) 61 - 1 - (38) (1) (1) 9 Currency translation differences (39) 4 - (14) 39 14 (126) 49 (73)Balance as of December 31, 2014 (368) 135 (552) (102) 204 (151) 117 448 (269)Disposal of subsidiaries 130 - - - - - - (2) 128 Recognized in profit and loss 135 (8) 99 5 (4) (63) 7 311 482 Recognized in other comprehensive income - (9) - - - 39 10 - 40 Currency translation differences (34) 3 - (14) (5) 1 12 73 36 Balance as of December 31, 2015 (137) 122 (453) (111) 195 (175) 148 829 418
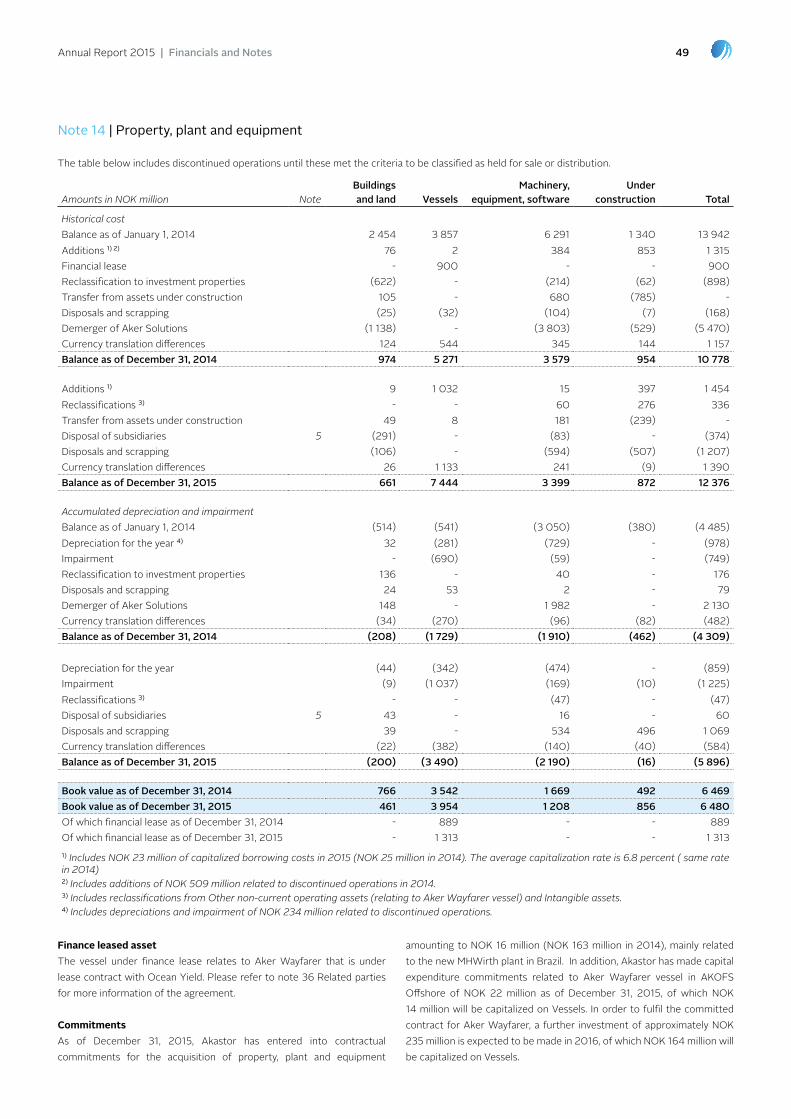
Annual Report 2015 | Financials and Notes 49
Note 14 | Property, plant and equipment
Amounts in NOK million NoteBuildings and land vessels
machinery, equipment, software
under construction Total
Historical costbalance as of January 1, 2014 2 454 3 857 6 291 1 340 13 942 Additions 1) 2) 76 2 384 853 1 315 Financial lease - 900 - - 900 Reclassification to investment properties (622) - (214) (62) (898)transfer from assets under construction 105 - 680 (785) - Disposals and scrapping (25) (32) (104) (7) (168)Demerger of Aker Solutions (1 138) - (3 803) (529) (5 470)Currency translation differences 124 544 345 144 1 157 Balance as of December 31, 2014 974 5 271 3 579 954 10 778
Additions 1) 9 1 032 15 397 1 454 Reclassifications 3) - - 60 276 336 transfer from assets under construction 49 8 181 (239) -Disposal of subsidiaries 5 (291) - (83) - (374)Disposals and scrapping (106) - (594) (507) (1 207)Currency translation differences 26 1 133 241 (9) 1 390 Balance as of December 31, 2015 661 7 444 3 399 872 12 376
Accumulated depreciation and impairmentbalance as of January 1, 2014 (514) (541) (3 050) (380) (4 485)Depreciation for the year 4) 32 (281) (729) - (978)Impairment - (690) (59) - (749)Reclassification to investment properties 136 - 40 - 176 Disposals and scrapping 24 53 2 - 79 Demerger of Aker Solutions 148 - 1 982 - 2 130 Currency translation differences (34) (270) (96) (82) (482)Balance as of December 31, 2014 (208) (1 729) (1 910) (462) (4 309)
Depreciation for the year (44) (342) (474) - (859)Impairment (9) (1 037) (169) (10) (1 225)Reclassifications 3) - - (47) - (47)Disposal of subsidiaries 5 43 - 16 - 60 Disposals and scrapping 39 - 534 496 1 069 Currency translation differences (22) (382) (140) (40) (584)Balance as of December 31, 2015 (200) (3 490) (2 190) (16) (5 896)
Book value as of December 31, 2014 766 3 542 1 669 492 6 469 Book value as of December 31, 2015 461 3 954 1 208 856 6 480 of which financial lease as of December 31, 2014 - 889 - - 889 of which financial lease as of December 31, 2015 - 1 313 - - 1 3131) Includes NOK 23 million of capitalized borrowing costs in 2015 (NOK 25 million in 2014). The average capitalization rate is 6.8 percent ( same rate in 2014)2) Includes additions of NOK 509 million related to discontinued operations in 2014.3) Includes reclassifications from Other non-current operating assets (relating to Aker Wayfarer vessel) and Intangible assets. 4) Includes depreciations and impairment of NOK 234 million related to discontinued operations.
the table below includes discontinued operations until these met the criteria to be classified as held for sale or distribution.
Finance leased assetthe vessel under finance lease relates to Aker Wayfarer that is under lease contract with ocean Yield. please refer to note 36 Related parties for more information of the agreement.
CommitmentsAs of December 31, 2015, Akastor has entered into contractual commitments for the acquisition of property, plant and equipment
amounting to noK 16 million (noK 163 million in 2014), mainly related to the new MHWirth plant in brazil. In addition, Akastor has made capital expenditure commitments related to Aker Wayfarer vessel in AKoFS offshore of noK 22 million as of December 31, 2015, of which noK 14 million will be capitalized on Vessels. In order to fulfil the committed contract for Aker Wayfarer, a further investment of approximately noK 235 million is expected to be made in 2016, of which noK 164 million will be capitalized on Vessels.
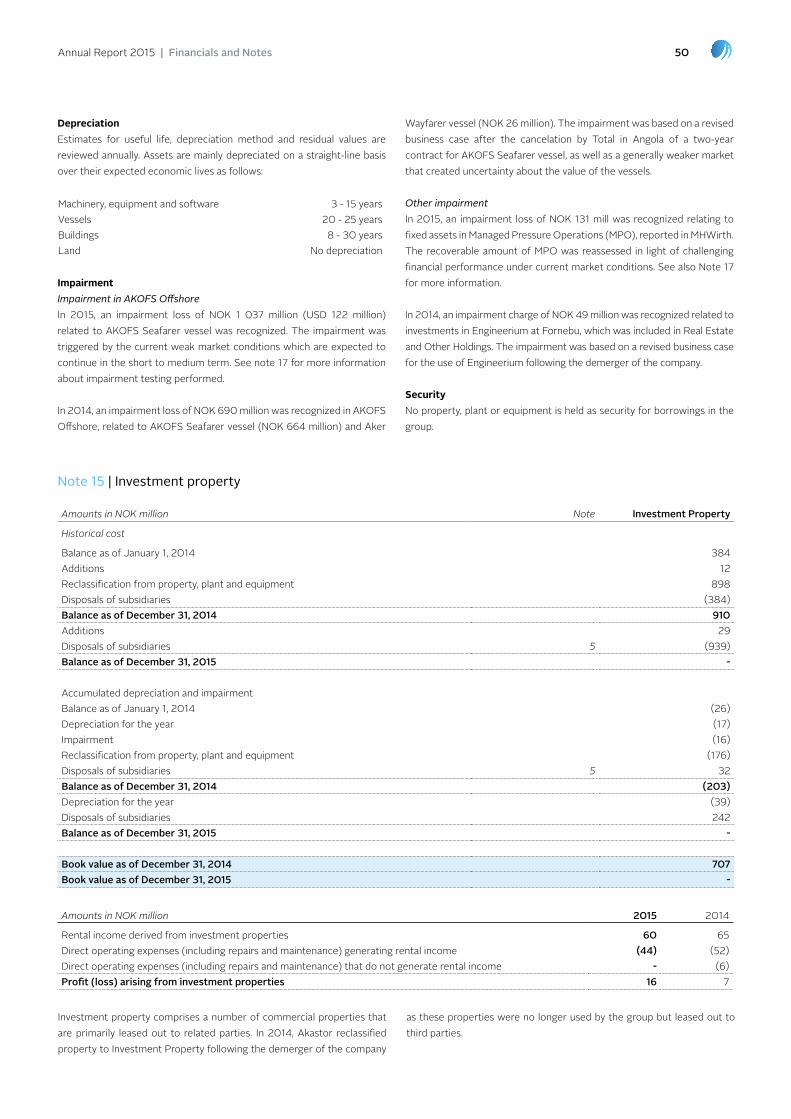
Annual Report 2015 | Financials and Notes 50
Depreciationestimates for useful life, depreciation method and residual values are reviewed annually. Assets are mainly depreciated on a straight-line basis over their expected economic lives as follows:
ImpairmentImpairment in AKOFS OffshoreIn 2015, an impairment loss of noK 1 037 million (uSD 122 million) related to AKoFS Seafarer vessel was recognized. the impairment was triggered by the current weak market conditions which are expected to continue in the short to medium term. See note 17 for more information about impairment testing performed.
In 2014, an impairment loss of noK 690 million was recognized in AKoFS offshore, related to AKoFS Seafarer vessel (noK 664 million) and Aker
Note 15 | investment property
Amounts in NOK million Note Investment property
Historical cost
balance as of January 1, 2014 384 Additions 12Reclassification from property, plant and equipment 898Disposals of subsidiaries (384)Balance as of December 31, 2014 910Additions 29 Disposals of subsidiaries 5 (939)Balance as of December 31, 2015 -
Accumulated depreciation and impairmentbalance as of January 1, 2014 (26)Depreciation for the year (17)Impairment (16)Reclassification from property, plant and equipment (176)Disposals of subsidiaries 5 32Balance as of December 31, 2014 (203)Depreciation for the year (39)Disposals of subsidiaries 242Balance as of December 31, 2015 -
Book value as of December 31, 2014 707Book value as of December 31, 2015 -
Amounts in NOK million 2015 2014
Rental income derived from investment properties 60 65 Direct operating expenses (including repairs and maintenance) generating rental income (44) (52)Direct operating expenses (including repairs and maintenance) that do not generate rental income - (6)profit (loss) arising from investment properties 16 7
Machinery, equipment and software 3 - 15 yearsVessels 20 - 25 yearsbuildings 8 - 30 yearsland no depreciation
Investment property comprises a number of commercial properties that are primarily leased out to related parties. In 2014, Akastor reclassified property to Investment property following the demerger of the company
as these properties were no longer used by the group but leased out to third parties.
Wayfarer vessel (noK 26 million). the impairment was based on a revised business case after the cancelation by total in Angola of a two-year contract for AKoFS Seafarer vessel, as well as a generally weaker market that created uncertainty about the value of the vessels.
Other impairmentIn 2015, an impairment loss of noK 131 mill was recognized relating to fixed assets in Managed pressure operations (Mpo), reported in MHWirth. the recoverable amount of Mpo was reassessed in light of challenging financial performance under current market conditions. See also note 17 for more information.
In 2014, an impairment charge of noK 49 million was recognized related to investments in engineerium at Fornebu, which was included in Real estate and other Holdings. the impairment was based on a revised business case for the use of engineerium following the demerger of the company.
Securityno property, plant or equipment is held as security for borrowings in the group.
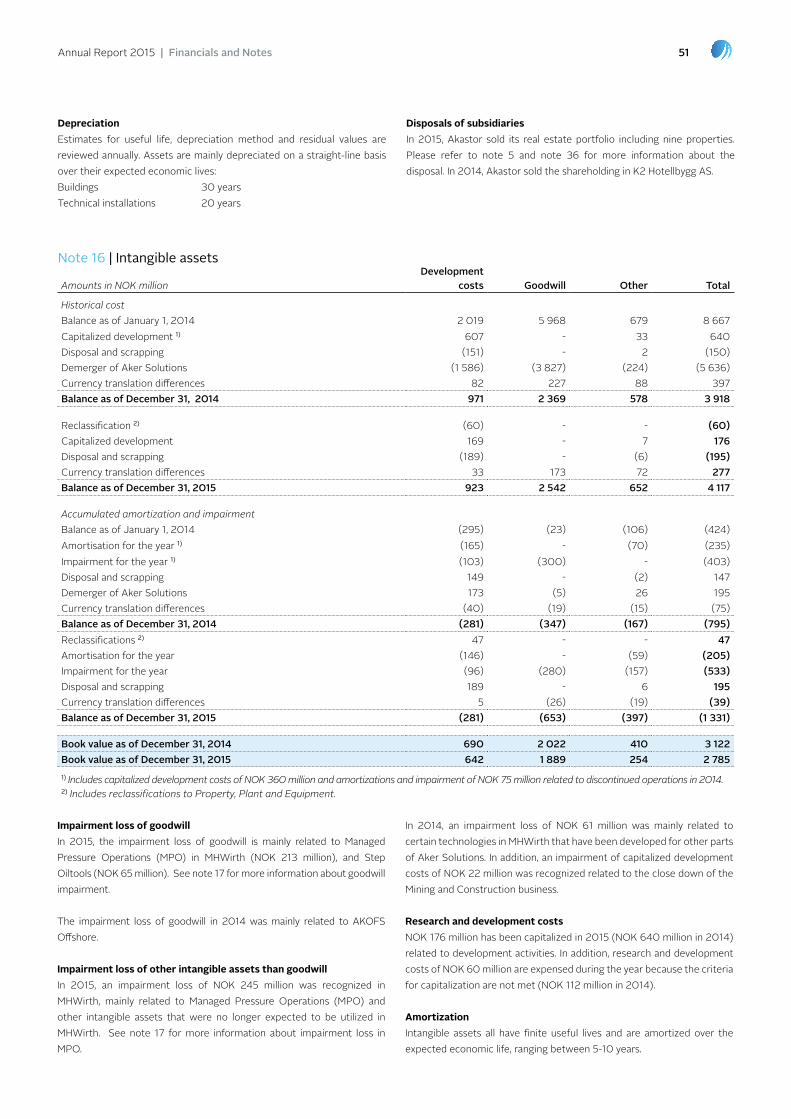
Annual Report 2015 | Financials and Notes 51
Impairment loss of goodwillIn 2015, the impairment loss of goodwill is mainly related to Managed pressure operations (Mpo) in MHWirth (noK 213 million), and Step oiltools (noK 65 million). See note 17 for more information about goodwill impairment.
the impairment loss of goodwill in 2014 was mainly related to AKoFS offshore.
Impairment loss of other intangible assets than goodwillIn 2015, an impairment loss of noK 245 million was recognized in MHWirth, mainly related to Managed pressure operations (Mpo) and other intangible assets that were no longer expected to be utilized in MHWirth. See note 17 for more information about impairment loss in Mpo.
In 2014, an impairment loss of noK 61 million was mainly related to certain technologies in MHWirth that have been developed for other parts of Aker Solutions. In addition, an impairment of capitalized development costs of noK 22 million was recognized related to the close down of the Mining and Construction business.
Research and development costsnoK 176 million has been capitalized in 2015 (noK 640 million in 2014) related to development activities. In addition, research and development costs of noK 60 million are expensed during the year because the criteria for capitalization are not met (noK 112 million in 2014).
AmortizationIntangible assets all have finite useful lives and are amortized over the expected economic life, ranging between 5-10 years.
Amounts in NOK millionDevelopment
costs goodwill Other Total
Historical costbalance as of January 1, 2014 2 019 5 968 679 8 667 Capitalized development 1) 607 - 33 640 Disposal and scrapping (151) - 2 (150)Demerger of Aker Solutions (1 586) (3 827) (224) (5 636)Currency translation differences 82 227 88 397 Balance as of December 31, 2014 971 2 369 578 3 918
Reclassification 2) (60) - - (60)Capitalized development 169 - 7 176 Disposal and scrapping (189) - (6) (195)Currency translation differences 33 173 72 277 Balance as of December 31, 2015 923 2 542 652 4 117
Accumulated amortization and impairmentbalance as of January 1, 2014 (295) (23) (106) (424)Amortisation for the year 1) (165) - (70) (235)Impairment for the year 1) (103) (300) - (403)Disposal and scrapping 149 - (2) 147 Demerger of Aker Solutions 173 (5) 26 195 Currency translation differences (40) (19) (15) (75)Balance as of December 31, 2014 (281) (347) (167) (795)Reclassifications 2) 47 - - 47 Amortisation for the year (146) - (59) (205)Impairment for the year (96) (280) (157) (533)Disposal and scrapping 189 - 6 195 Currency translation differences 5 (26) (19) (39)Balance as of December 31, 2015 (281) (653) (397) (1 331)
Book value as of December 31, 2014 690 2 022 410 3 122 Book value as of December 31, 2015 642 1 889 254 2 785 1) Includes capitalized development costs of NOK 360 million and amortizations and impairment of NOK 75 million related to discontinued operations in 2014. 2) Includes reclassifications to Property, Plant and Equipment.
Depreciationestimates for useful life, depreciation method and residual values are reviewed annually. Assets are mainly depreciated on a straight-line basis over their expected economic lives:buildings 30 yearstechnical installations 20 years
Disposals of subsidiariesIn 2015, Akastor sold its real estate portfolio including nine properties. please refer to note 5 and note 36 for more information about the disposal. In 2014, Akastor sold the shareholding in K2 Hotellbygg AS.
Note 16 | intangible assets

Annual Report 2015 | Financials and Notes 52
Impairment loss recognized in 2015Due to challenging financial performance under current market conditions, goodwill allocated to Mpo and Step oiltools is fully impaired in 2015 after
impairment testing performed. An impairment loss of noK 213 million and noK 65 million is recognized in Mpo and Step oiltools, respectively. Further, a total impairment loss of noK 275 million is recognized in
Amounts in NOK million 2015 2014
MHWirth 1 093 1 207 Managed pressure operations (Mpo) 1) - n/aFrontica 203 179 AKoFS offshore 145 145 Fjords processing 327 313 Kop Surface products 103 98 Step oiltools 1) 2) - 60 First Geo 2) 18 20 Total goodwill 1 889 2 0221) As of December 31, 2015, goodwill allocated to Managed Pressure Operations(MPO) and Step Oiltools was fully impaired.2) This portfolio company is included in Real Estate and Other Holdings in segment reporting.
Goodwill originates from a number of acquisitions. For the purpose of impairment testing, goodwill has been allocated to the group’s CGus (portfolio companies) as shown in the table below, which represents the lowest level at which goodwill is monitored in management reporting.
As of December 31, 2015, goodwill of noK 213 million was reallocated from MHWirth to Managed pressure operations (Mpo), as a result of the change of the level at which goodwill was monitored by the management.
Impairment testing for cash-generating units containing significant goodwill the recoverable amounts of cash-generating units (portfolio companies) are determined based on value-in-use calculations. Discounted cash flow models are applied to determine the value in use for the portfolio companies with goodwill. For all portfolio companies except for AKoFS offshore, management has made cash flow projections based on budget and strategic forecast for the periods 2016-2020. beyond the explicit forecast period of five years, the cash flows are extrapolated using a constant growth rate. For AKoFS offshore, the cash flow projections are made for the periods equal to estimated useful life of the vessels.
Key assumptions used in the calculation of value in use are discussed below. the values assigned to the key assumptions represent management’s assessment of future trends in the relevant industries and have been based on historical data from both external and internal sources.
EBITDA used in the value-in-use calculations represents the operating earnings before depreciation and amortization and is estimated based on the expected future performance of the existing businesses in their main markets. Assumptions are made regarding future market development and conditions, which requires a high degree of judgement.
growth rate the group uses a constant growth rate not exceeding 2% (including inflation) for periods beyond the management’s forecast period of five years. the growth rates used do not exceed the growth rates for the industry in which the portfolio company operates.
vessel-specific day rate For AKoFS offshore, the cash flow projections reflect vessel-specific rates as reflected in charter-agreements and, for periods when the vessels are operating in the spot market, rates achieved in most recent charter agreements.
Discount rates are estimated based on Weighted Average Cost of Capital (WACC) for the industry in which the portfolio company operates. the risk free interest rates used in the discount rates are based on the 10 year state treasury bond rate at the time of the impairment testing. optimal debt leverage is estimated for each portfolio company. the discount rates are further adjusted to reflect any additional short to medium term market risk considering current industry conditions.
Note 17 | impairment testing of goodwill
Discount rate after tax Discount rate before taxDiscount rate assumptions used in impairment testing 2015 2014 2015 2014
MHWirth 9.3 % 8.2 % 11.1 % 9.4 %
Managed pressure operations (Mpo) 1) 10.5 % n/a 11.8 % n/aFrontica 8.5 % 6.1 % 11.1% 7.4 %AKoFS offshore 2) 7.8 % 7.1 % 7.8 % 7.1 %Fjords processing 9.6 % 8.1 % 12.3% 8.7 %Kop Surface products 10.4 % 9.3 % 11,9 % 10.1 %Step oiltools 11.0 % 8.2 % 12.1 % 9.2 %
1) MPO is part of the reportable segment MHWirth and the testing was performed at MHWirth in 2014.2) Discount rate pre tax and Discount rate after tax for AKOFS Offshore are equal due to the assumption that both AKOFS Seafarer and Skandi Santos will enter the tonnage tax regime in Norway in the near future.
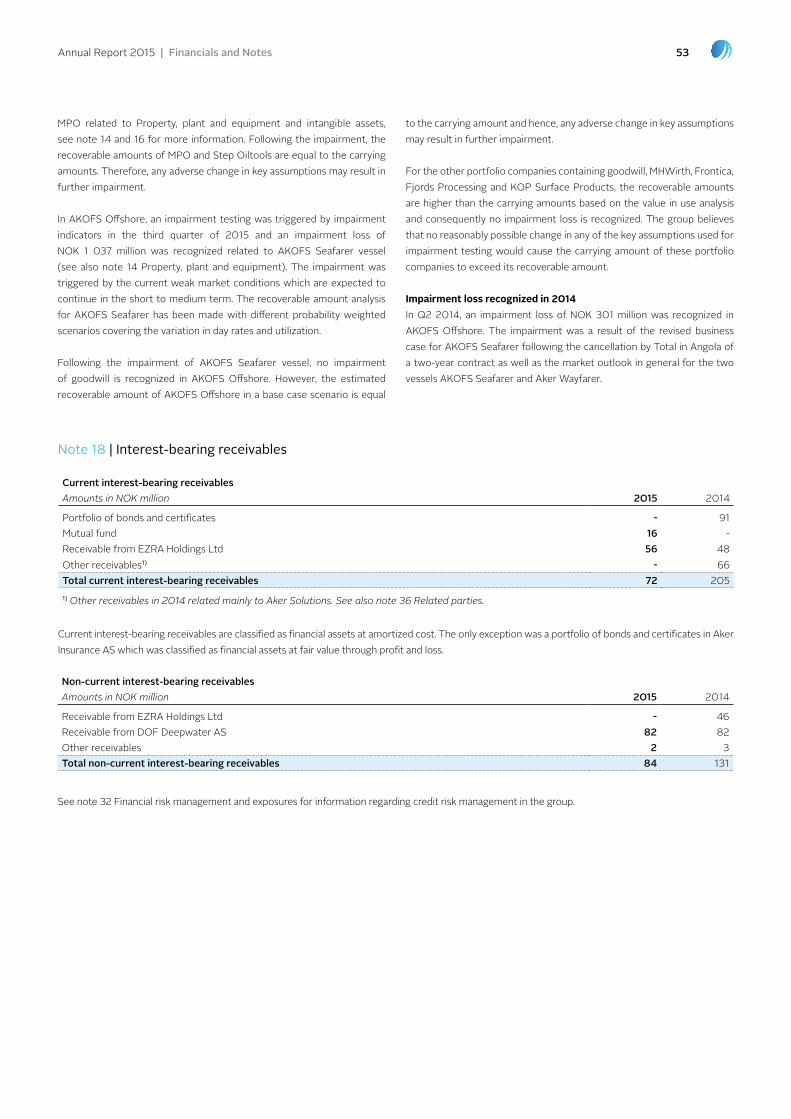
Annual Report 2015 | Financials and Notes 53
current interest-bearing receivablesAmounts in NOK million 2015 2014
portfolio of bonds and certificates - 91Mutual fund 16 -Receivable from eZRA Holdings ltd 56 48other receivables1) - 66Total current interest-bearing receivables 72 2051) Other receivables in 2014 related mainly to Aker Solutions. See also note 36 Related parties.
Non-current interest-bearing receivablesAmounts in NOK million 2015 2014
Receivable from eZRA Holdings ltd - 46Receivable from DoF Deepwater AS 82 82other receivables 2 3Total non-current interest-bearing receivables 84 131
Current interest-bearing receivables are classified as financial assets at amortized cost. the only exception was a portfolio of bonds and certificates in Aker Insurance AS which was classified as financial assets at fair value through profit and loss.
See note 32 Financial risk management and exposures for information regarding credit risk management in the group.
Mpo related to property, plant and equipment and intangible assets, see note 14 and 16 for more information. Following the impairment, the recoverable amounts of Mpo and Step oiltools are equal to the carrying amounts. therefore, any adverse change in key assumptions may result in further impairment.
In AKoFS offshore, an impairment testing was triggered by impairment indicators in the third quarter of 2015 and an impairment loss of noK 1 037 million was recognized related to AKoFS Seafarer vessel (see also note 14 property, plant and equipment). the impairment was triggered by the current weak market conditions which are expected to continue in the short to medium term. the recoverable amount analysis for AKoFS Seafarer has been made with different probability weighted scenarios covering the variation in day rates and utilization.
Following the impairment of AKoFS Seafarer vessel, no impairment of goodwill is recognized in AKoFS offshore. However, the estimated recoverable amount of AKoFS offshore in a base case scenario is equal
to the carrying amount and hence, any adverse change in key assumptions may result in further impairment.
For the other portfolio companies containing goodwill, MHWirth, Frontica, Fjords processing and Kop Surface products, the recoverable amounts are higher than the carrying amounts based on the value in use analysis and consequently no impairment loss is recognized. the group believes that no reasonably possible change in any of the key assumptions used for impairment testing would cause the carrying amount of these portfolio companies to exceed its recoverable amount.
Impairment loss recognized in 2014In Q2 2014, an impairment loss of noK 301 million was recognized in AKoFS offshore. the impairment was a result of the revised business case for AKoFS Seafarer following the cancellation by total in Angola of a two-year contract as well as the market outlook in general for the two vessels AKoFS Seafarer and Aker Wayfarer.
Note 18 | interest-bearing receivables
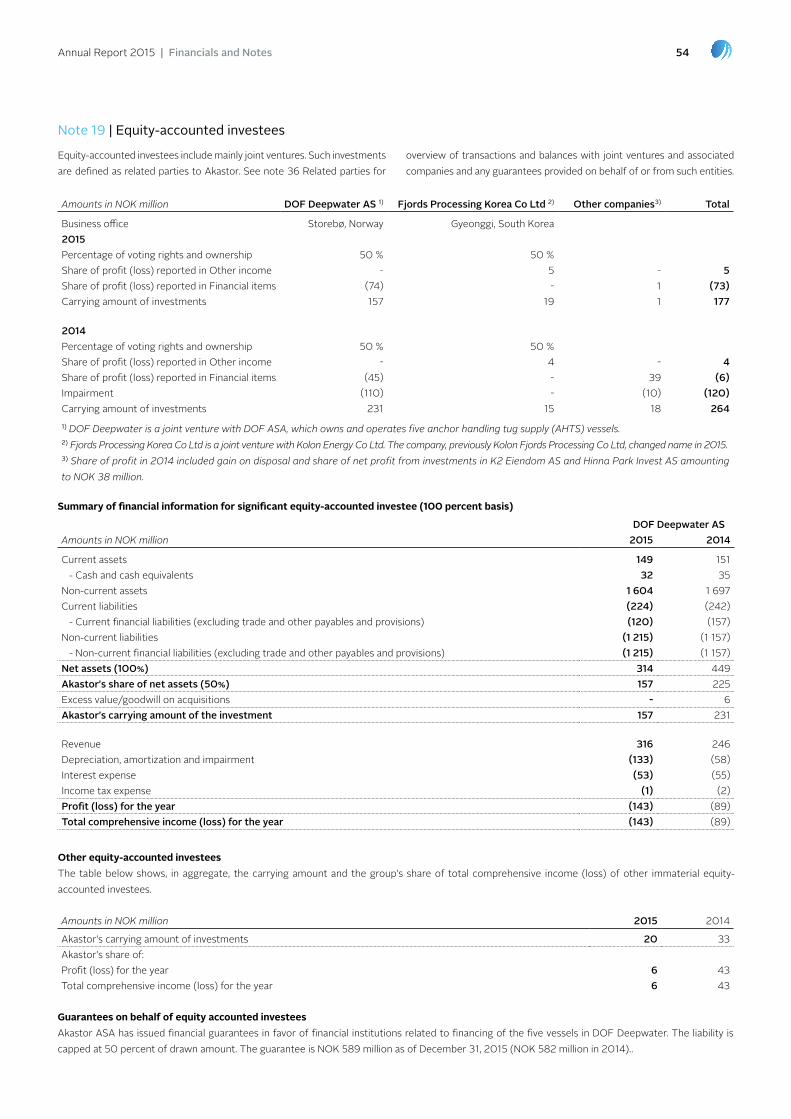
Annual Report 2015 | Financials and Notes 54
Amounts in NOK million DOf Deepwater As 1) fjords processing Korea co ltd 2) Other companies3) Total
business office Storebø, norway Gyeonggi, South Korea2015percentage of voting rights and ownership 50 % 50 %Share of profit (loss) reported in other income - 5 - 5Share of profit (loss) reported in Financial items (74) - 1 (73)Carrying amount of investments 157 19 1 177
2014percentage of voting rights and ownership 50 % 50 %Share of profit (loss) reported in other income - 4 - 4Share of profit (loss) reported in Financial items (45) - 39 (6)Impairment (110) - (10) (120)Carrying amount of investments 231 15 18 2641) DOF Deepwater is a joint venture with DOF ASA, which owns and operates five anchor handling tug supply (AHTS) vessels.2) Fjords Processing Korea Co Ltd is a joint venture with Kolon Energy Co Ltd. The company, previously Kolon Fjords Processing Co Ltd, changed name in 2015.3) Share of profit in 2014 included gain on disposal and share of net profit from investments in K2 Eiendom AS and Hinna Park Invest AS amounting to NOK 38 million.
DOf Deepwater AsAmounts in NOK million 2015 2014
Current assets 149 151 - Cash and cash equivalents 32 35non-current assets 1 604 1 697Current liabilities (224) (242) - Current financial liabilities (excluding trade and other payables and provisions) (120) (157)non-current liabilities (1 215) (1 157) - non-current financial liabilities (excluding trade and other payables and provisions) (1 215) (1 157)Net assets (100%) 314 449Akastor's share of net assets (50%) 157 225excess value/goodwill on acquisitions - 6Akastor's carrying amount of the investment 157 231
Revenue 316 246Depreciation, amortization and impairment (133) (58)Interest expense (53) (55)Income tax expense (1) (2)profit (loss) for the year (143) (89)Total comprehensive income (loss) for the year (143) (89)
Note 19 | equity-accounted investees
equity-accounted investees include mainly joint ventures. Such investments are defined as related parties to Akastor. See note 36 Related parties for
overview of transactions and balances with joint ventures and associated companies and any guarantees provided on behalf of or from such entities.
Summary of financial information for significant equity-accounted investee (100 percent basis)
Guarantees on behalf of equity accounted investeesAkastor ASA has issued financial guarantees in favor of financial institutions related to financing of the five vessels in DoF Deepwater. the liability is capped at 50 percent of drawn amount. the guarantee is noK 589 million as of December 31, 2015 (noK 582 million in 2014)..
Amounts in NOK million 2015 2014
Akastor's carrying amount of investments 20 33Akastor's share of:profit (loss) for the year 6 43total comprehensive income (loss) for the year 6 43
Other equity-accounted investees the table below shows, in aggregate, the carrying amount and the group's share of total comprehensive income (loss) of other immaterial equity-accounted investees.
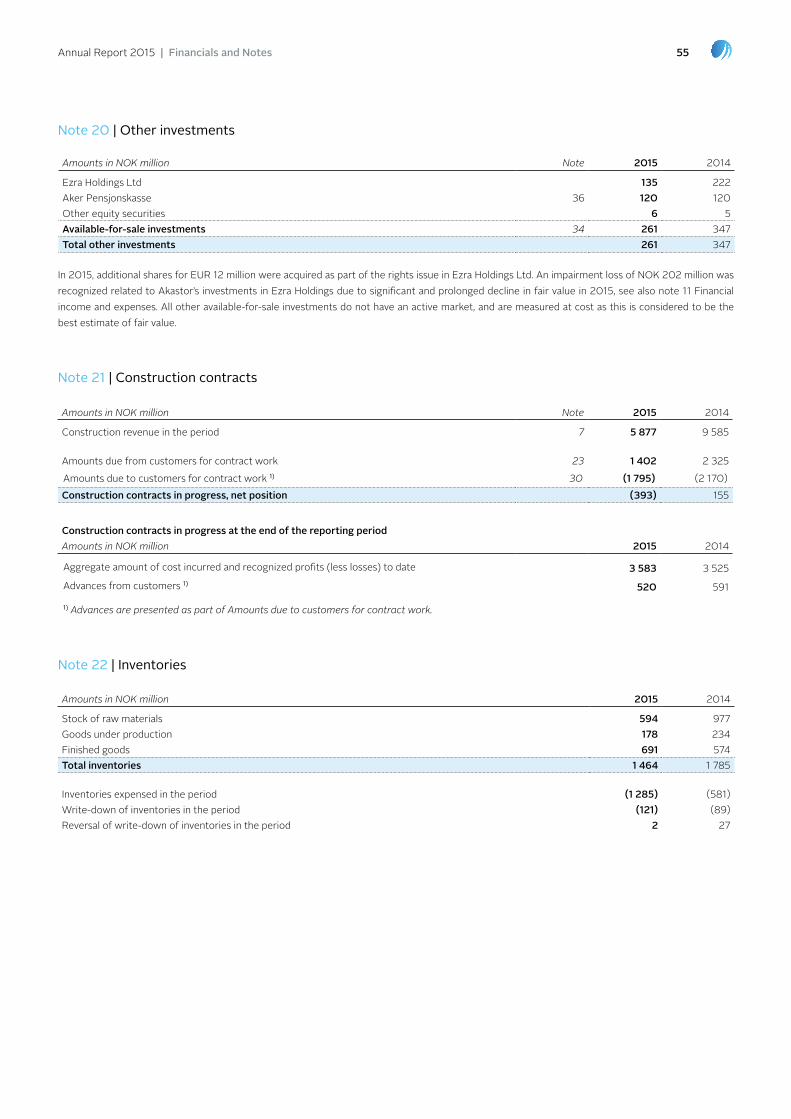
Annual Report 2015 | Financials and Notes 55
Note 20 | Other investments
In 2015, additional shares for euR 12 million were acquired as part of the rights issue in ezra Holdings ltd. An impairment loss of noK 202 million was recognized related to Akastor’s investments in ezra Holdings due to significant and prolonged decline in fair value in 2015, see also note 11 Financial income and expenses. All other available-for-sale investments do not have an active market, and are measured at cost as this is considered to be the best estimate of fair value.
Amounts in NOK million Note 2015 2014
ezra Holdings ltd 135 222 Aker pensjonskasse 36 120 120 other equity securities 6 5 Available-for-sale investments 34 261 347Total other investments 261 347
Note 21 | Construction contracts
Amounts in NOK million Note 2015 2014
Construction revenue in the period 7 5 877 9 585
Amounts due from customers for contract work 23 1 402 2 325
Amounts due to customers for contract work 1) 30 (1 795) (2 170)construction contracts in progress, net position (393) 155
construction contracts in progress at the end of the reporting periodAmounts in NOK million 2015 2014
Aggregate amount of cost incurred and recognized profits (less losses) to date 3 583 3 525
Advances from customers 1) 520 591
1) Advances are presented as part of Amounts due to customers for contract work.
Note 22 | inventories
Amounts in NOK million 2015 2014
Stock of raw materials 594 977 Goods under production 178 234 Finished goods 691 574 Total inventories 1 464 1 785
Inventories expensed in the period (1 285) (581) Write-down of inventories in the period (121) (89) Reversal of write-down of inventories in the period 2 27

Annual Report 2015 | Financials and Notes 56
Note 23 | Trade and other receivables
Amounts in NOK million Note 2015 2014
trade receivables1) 3 169 3 116 less provision for impairment of receivables (120) (118)Trade receivables, net of provision 3 049 2 998 Advances to suppliers 203 226 Amount due to from customers for construction work 21 1 402 2 325 prepaid expenses 178 371 Accrued revenue 377 576other receivables 751 683 Total trade and other receivables 5 959 7 1781) Trade receivables are financial instruments and an impairment loss of NOK 45 million (NOK 57 million in 2014) was recognized in operating expenses.
book value of trade and other receivables is approximately equal to fair value.
Aging of trade receivablesAmounts in NOK million 2015 2014
not overdue 1 440 1 804 past due 0-30 days 509 509 past due 31-90 days 397 348 past due 91 days 823 455 Total trade receivables past due 3 169 3 116
As of December 31, 2015, trade receivables of an initial value of noK 120 million (noK 118 million in 2014) are impaired and fully provided for. See below for the movements in the provision for impairment of receivables.
Amounts in NOK million 2015 2014
balance as of January 1 118 124Demerger of Aker Solutions - (35)new provisions 45 57 utilized (47) (29)unused amounts reversed (8) (17)Currency translation differences 13 18 Balance as of December 31 120 118
Additional undrawn committed current bank revolving credit facilities amount to noK 2 billion, that together with cash and cash equivalents gives a total liquidity buffer of noK 2.6 billion as of December 31, 2015. See also note 26 borrowings.
Note 24 | Cash and cash equivalents
Amounts in NOK million 2015 2014
Restricted cash 58 39 Cash pool 195 499 Interest-bearing deposits 311 537 Total cash and cash equivalents 563 1 075
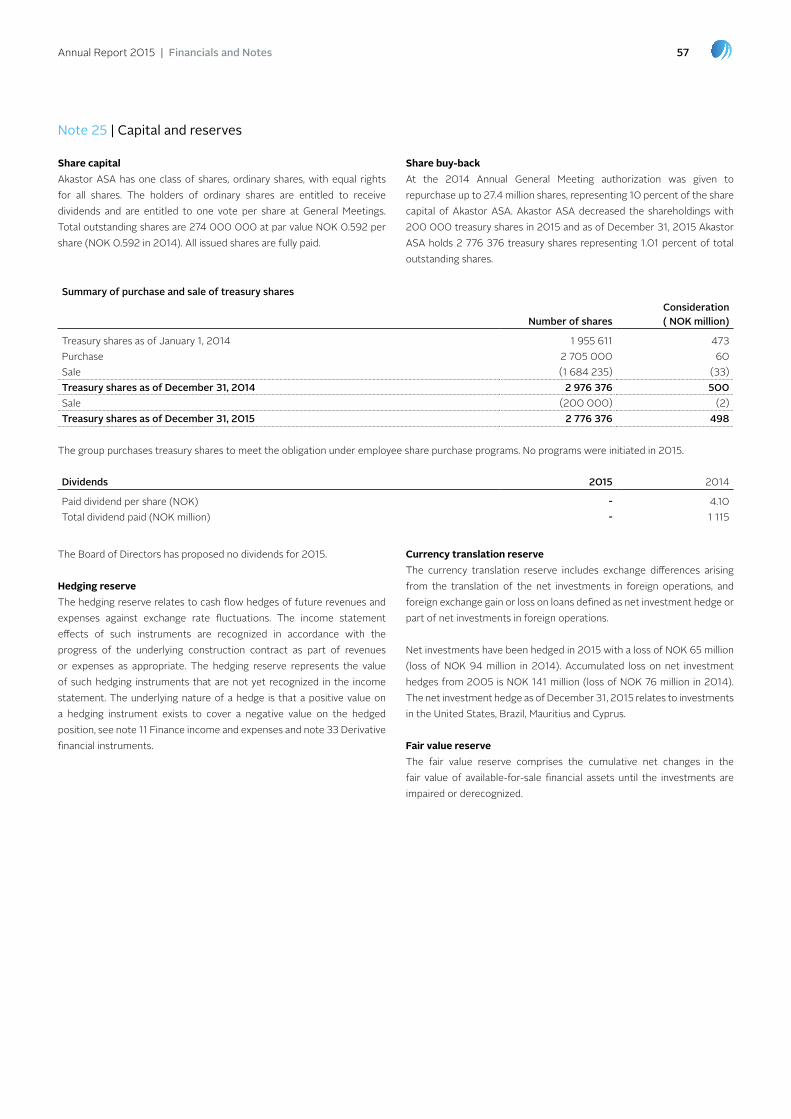
Annual Report 2015 | Financials and Notes 57
summary of purchase and sale of treasury shares
Number of sharesconsideration ( NOK million)
treasury shares as of January 1, 2014 1 955 611 473purchase 2 705 000 60Sale (1 684 235) (33)Treasury shares as of December 31, 2014 2 976 376 500Sale (200 000) (2)Treasury shares as of December 31, 2015 2 776 376 498
the group purchases treasury shares to meet the obligation under employee share purchase programs. no programs were initiated in 2015.
Note 25 | Capital and reserves
Share capitalAkastor ASA has one class of shares, ordinary shares, with equal rights for all shares. the holders of ordinary shares are entitled to receive dividends and are entitled to one vote per share at General Meetings. total outstanding shares are 274 000 000 at par value noK 0.592 per share (noK 0.592 in 2014). All issued shares are fully paid.
Share buy-backAt the 2014 Annual General Meeting authorization was given to repurchase up to 27.4 million shares, representing 10 percent of the share capital of Akastor ASA. Akastor ASA decreased the shareholdings with 200 000 treasury shares in 2015 and as of December 31, 2015 Akastor ASA holds 2 776 376 treasury shares representing 1.01 percent of total outstanding shares.
the board of Directors has proposed no dividends for 2015.
Hedging reservethe hedging reserve relates to cash flow hedges of future revenues and expenses against exchange rate fluctuations. the income statement effects of such instruments are recognized in accordance with the progress of the underlying construction contract as part of revenues or expenses as appropriate. the hedging reserve represents the value of such hedging instruments that are not yet recognized in the income statement. the underlying nature of a hedge is that a positive value on a hedging instrument exists to cover a negative value on the hedged position, see note 11 Finance income and expenses and note 33 Derivative financial instruments.
Currency translation reservethe currency translation reserve includes exchange differences arising from the translation of the net investments in foreign operations, and foreign exchange gain or loss on loans defined as net investment hedge or part of net investments in foreign operations.
net investments have been hedged in 2015 with a loss of noK 65 million (loss of noK 94 million in 2014). Accumulated loss on net investment hedges from 2005 is noK 141 million (loss of noK 76 million in 2014). the net investment hedge as of December 31, 2015 relates to investments in the united States, brazil, Mauritius and Cyprus.
Fair value reservethe fair value reserve comprises the cumulative net changes in the fair value of available-for-sale financial assets until the investments are impaired or derecognized.
Dividends 2015 2014
paid dividend per share (noK) - 4.10 total dividend paid (noK million) - 1 115
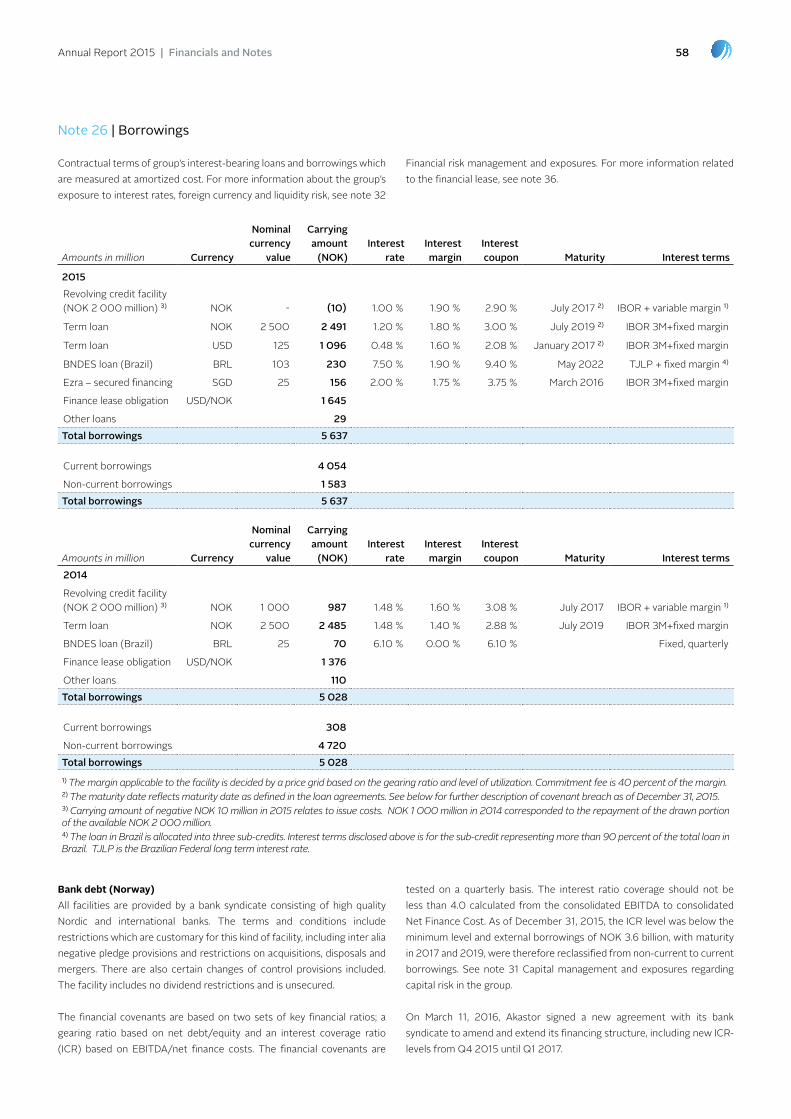
Annual Report 2015 | Financials and Notes 58
Contractual terms of group’s interest-bearing loans and borrowings which are measured at amortized cost. For more information about the group’s exposure to interest rates, foreign currency and liquidity risk, see note 32
Financial risk management and exposures. For more information related to the financial lease, see note 36.
Note 26 | Borrowings
Amounts in million currency
Nominal currency
value
carrying amount
(NOK)Interest
rateInterest margin
Interest coupon maturity Interest terms
2015Revolving credit facility (noK 2 000 million) 3) noK - (10) 1.00 % 1.90 % 2.90 % July 2017 2) IboR + variable margin 1)
term loan noK 2 500 2 491 1.20 % 1.80 % 3.00 % July 2019 2) IboR 3M+fixed margin
term loan uSD 125 1 096 0.48 % 1.60 % 2.08 % January 2017 2) IboR 3M+fixed margin
bnDeS loan (brazil) bRl 103 230 7.50 % 1.90 % 9.40 % May 2022 tJlp + fixed margin 4)
ezra – secured financing SGD 25 156 2.00 % 1.75 % 3.75 % March 2016 IboR 3M+fixed margin
Finance lease obligation uSD/noK 1 645
other loans 29 Total borrowings 5 637
Current borrowings 4 054
non-current borrowings 1 583 Total borrowings 5 637
Amounts in million currency
Nominal currency
value
carrying amount
(NOK)Interest
rateInterest margin
Interest coupon maturity Interest terms
2014
Revolving credit facility (noK 2 000 million) 3) noK 1 000 987 1.48 % 1.60 % 3.08 % July 2017 IboR + variable margin 1)
term loan noK 2 500 2 485 1.48 % 1.40 % 2.88 % July 2019 IboR 3M+fixed margin
bnDeS loan (brazil) bRl 25 70 6.10 % 0.00 % 6.10 % Fixed, quarterly
Finance lease obligation uSD/noK 1 376
other loans 110 Total borrowings 5 028
Current borrowings 308
non-current borrowings 4 720 Total borrowings 5 028 1) The margin applicable to the facility is decided by a price grid based on the gearing ratio and level of utilization. Commitment fee is 40 percent of the margin.2) The maturity date reflects maturity date as defined in the loan agreements. See below for further description of covenant breach as of December 31, 2015. 3) Carrying amount of negative NOK 10 million in 2015 relates to issue costs. NOK 1 000 million in 2014 corresponded to the repayment of the drawn portion of the available NOK 2 000 million. 4) The loan in Brazil is allocated into three sub-credits. Interest terms disclosed above is for the sub-credit representing more than 90 percent of the total loan in Brazil. TJLP is the Brazilian Federal long term interest rate.
Bank debt (Norway)All facilities are provided by a bank syndicate consisting of high quality nordic and international banks. the terms and conditions include restrictions which are customary for this kind of facility, including inter alia negative pledge provisions and restrictions on acquisitions, disposals and mergers. there are also certain changes of control provisions included. the facility includes no dividend restrictions and is unsecured.
the financial covenants are based on two sets of key financial ratios; a gearing ratio based on net debt/equity and an interest coverage ratio (ICR) based on ebItDA/net finance costs. the financial covenants are
tested on a quarterly basis. the interest ratio coverage should not be less than 4.0 calculated from the consolidated ebItDA to consolidated net Finance Cost. As of December 31, 2015, the ICR level was below the minimum level and external borrowings of noK 3.6 billion, with maturity in 2017 and 2019, were therefore reclassified from non-current to current borrowings. See note 31 Capital management and exposures regarding capital risk in the group.
on March 11, 2016, Akastor signed a new agreement with its bank syndicate to amend and extend its financing structure, including new ICR-levels from Q4 2015 until Q1 2017.

Annual Report 2015 | Financials and Notes 59
Finance lease obligationA financial lease obligation was recognized in 2014 following the re¬negotiation of the bareboat charter contract with Aker Ship lease 1 AS. the lease agreement includes purchase option on three different dates. the finance lease liability is payable as follows as of December 31, 2015:
Borrowings under the new agreement:size margin maturity
Revolving credit facility uSD 422.5 million 1.65%-4.50% July 2019 Revolving credit facility noK 2 000 million 1.65%-4.50% July 2019Revolving credit facility noK 362.5 million 1.65%-4.50% June 2017
See also note 38 Subsequent events for more information about the refinancing.
Amounts in NOK millionpresent value of
minimum lease payments Interestfuture minimum lease payments
less than one year 269 28 296 between one and five years 419 1 258 1 677 More than five years 957 577 1 535 Total 1 645 1 863 3 508
Financial liabilities and the period in which they mature
Amounts in NOK millioncarrying amount
Total undiscounted cash flow 1)
6 months and less
6-12 months 1-2 years 2-5 years
more than 5 years
2015
Revolving credit facility (noK 2 000 million)2) (10) - - - - - -
term loan (noK 2 500 million) 2) 2 491 2 512 2 512 - - - -
term loan (uSD 125 million) 2) 1 096 1 103 1 103 - - - -
bnDeS loan (brazil) 230 282 25 25 94 123 14
Dnb - Singapore loan 156 157 157 - - - -
Finance lease obligation 1 645 3 508 119 177 709 967 1 535
other loans 29 32 13 3 8 8 - Total borrowings 5 637 7 594 3 930 206 812 1 098 1 548
2014
Revolving credit facility (noK 2 000 million) 987 1 139 1 015 15 31 77 -
term loan (noK 2 500 million) 2 485 2 680 36 36 72 2 536 -
bnDeS loan (brazil) 70 86 2 2 4 78 -
Finance lease obligation 1 376 2 843 106 106 251 838 1 542
other loans 110 110 33 77 - - - Total borrowings 5 028 6 858 1 193 237 358 3 529 1 542
1) The interest costs are calculated using the last fixing rate known by year end (plus applicable margin).2) Maturity of the term loans in the table reflects that these loans will be refinanced in during Q1 2016.

Annual Report 2015 | Financials and Notes 60
Contingent considerationsAkastor has acquired subsidiaries and non-controlling interests where final consideration is deferred and can depend to a certain degree on future earnings in the acquired companies. the contingent considerations reported in other non-current liabilities as of December 31, 2014 related mainly to the acquisition of Step oiltools in 2011 and was reversed in other income in 2015.
Other liabilitiesother liabilities relate mainly to liabilities related to leasehold improve-ments and welfare fund.
Akastor’s pension costs represent the future pension entitlement earned by employees in the financial year. In a defined contribution plan the company is responsible for paying an agreed contribution to the employee’s pension assets. In such a plan this annual contribution is also the cost. In a defined benefit plan it is the company’s responsibility to provide a certain pension. the measurement of the cost and the pension liability for such arrangements is subject to actuarial valuations. Akastor has over a long time period gradually moved from defined benefit arrangements to defined contribution plans. Consequently, the impact of the remaining defined benefit plans is gradually reduced.
Pension plans in Norwaythe main pension arrangement in norway is a general pension plan organized by the norwegian Government. this arrangement provides the main general pension entitlement of all norwegians. All pension arrangements by employers consequently represent limited additional pension entitlements.
norwegian employers are obliged to provide an employment pension plan, which can be organized as a defined benefit plan or as a defined contribution plan. the norwegian companies in Akastor have closed the earlier defined benefit plans in 2008 and are now providing defined contribution plans for all of their employees under 61 years of age.
Defined contribution planthe annual contribution expensed for the new defined contribution plan was noK 121 million (noK 125 million in 2014). the estimated contributions expected to be paid in 2016 is noK 123 million.
Defined benefit planemployees who were 58 years or older in 2008, when the change took place, are still in the defined benefit plan. this is a funded plan and represents most of the funded pension liability reported in the tables below. the estimated contributions expected to be paid to the norwegian plan during 2016 are noK 14 million.
Compensation planto ensure that the employees were treated fairly on the change over to the new plan the company has introduced a compensation plan. the basis for deciding the compensation amount is the difference between calculated pension capital in the defined benefit plan and the value of the defined benefit plan at the age of 67 years. the compensation amount will be adjusted annually in accordance with the adjustment of the employees’ pensionable income, and accrued interest according to market interest. If the employee leaves the company voluntarily before the age of 67 years, the compensation amount will be reduced.
AFP - early retirement arrangementAFp is an early retirement arrangement organized by norwegian employers, the main labor union organization in norway (lo) and the norwegian Government. the “old AFp” arrangement was established to provide pension between the age of 62 to 67 for employees who retired before the general retirement age of 67. In a recent pension reform individual employees are given a choice of retirement age, but with lower pension with earlier retirement. estimated remaining employer contributions to cover the plan deficit have been provided for.
the AFp scheme which was newly established in 2011 is not considered to be a defined benefit compensation scheme for early retirement, but a lifelong contribution plan. the scheme is classified as a multi-employer benefit scheme. Akastor has taken the position that the information available at the date of the financial statements is not sufficient to reliably measure the allocation of pension cost and net pension liability/asset in accordance with a cost/benefit approach. Akastor has therefore elected to treat the scheme as a defined contribution plan in which the annual paid premiums to the AFp scheme are expensed in the income statement as they are incurred. the total liability is not recognized. based on the current financing model for AFp, the annual premiums are expected to increase. When or if sufficient and reliable data is available and a liability can be reliably measured, the recognized liability could be significant.
Pension plans outside Norwaypension plans outside norway are predominately defined contribution plans.
Amounts in NOK million 2015 2014
Contingent considerations - 44 other liabilities 74 84 Total other non-current liabilities 74 128
Note 27 | Other non-current liabilities
Note 28 | employee benefits - pension
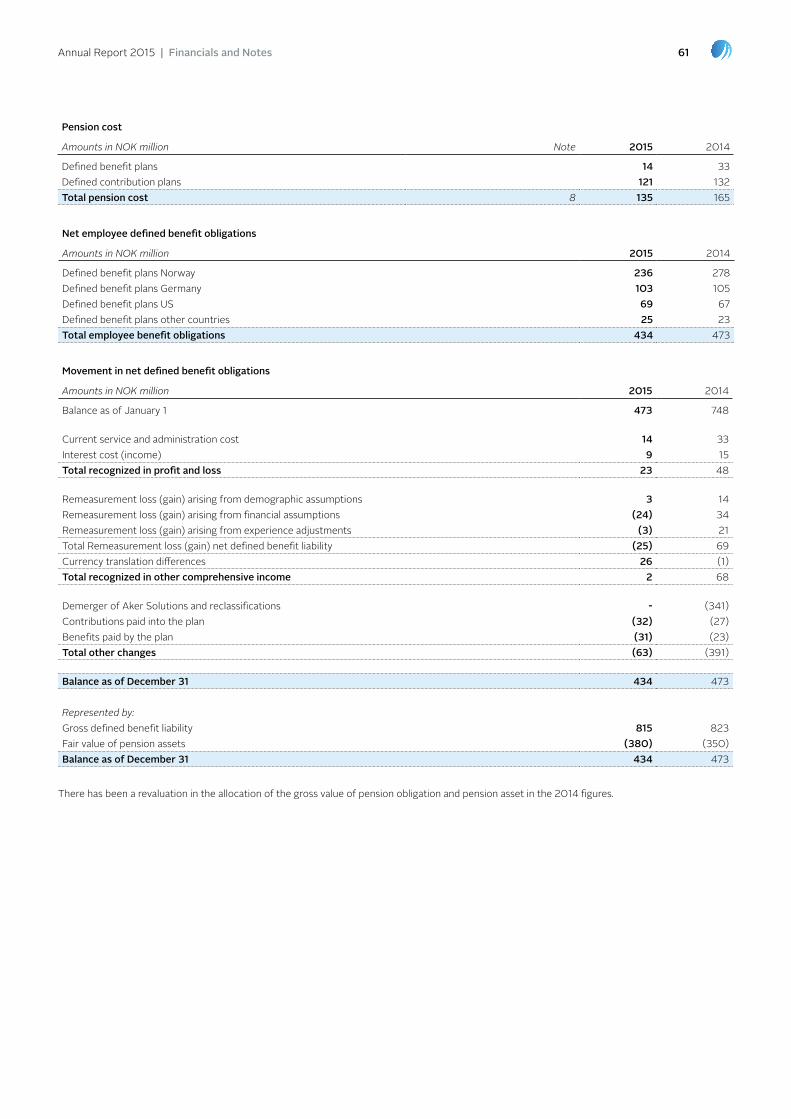
Annual Report 2015 | Financials and Notes 61
pension cost
Amounts in NOK million Note 2015 2014
Defined benefit plans 14 33Defined contribution plans 121 132Total pension cost 8 135 165
Net employee defined benefit obligations
Amounts in NOK million 2015 2014
Defined benefit plans norway 236 278Defined benefit plans Germany 103 105Defined benefit plans uS 69 67Defined benefit plans other countries 25 23Total employee benefit obligations 434 473
movement in net defined benefit obligations
Amounts in NOK million 2015 2014
balance as of January 1 473 748
Current service and administration cost 14 33Interest cost (income) 9 15Total recognized in profit and loss 23 48
Remeasurement loss (gain) arising from demographic assumptions 3 14 Remeasurement loss (gain) arising from financial assumptions (24) 34 Remeasurement loss (gain) arising from experience adjustments (3) 21 total Remeasurement loss (gain) net defined benefit liability (25) 69 Currency translation differences 26 (1)Total recognized in other comprehensive income 2 68
Demerger of Aker Solutions and reclassifications - (341)Contributions paid into the plan (32) (27)benefits paid by the plan (31) (23)Total other changes (63) (391)
Balance as of December 31 434 473
Represented by: Gross defined benefit liability 815 823Fair value of pension assets (380) (350)Balance as of December 31 434 473
there has been a revaluation in the allocation of the gross value of pension obligation and pension asset in the 2014 figures.
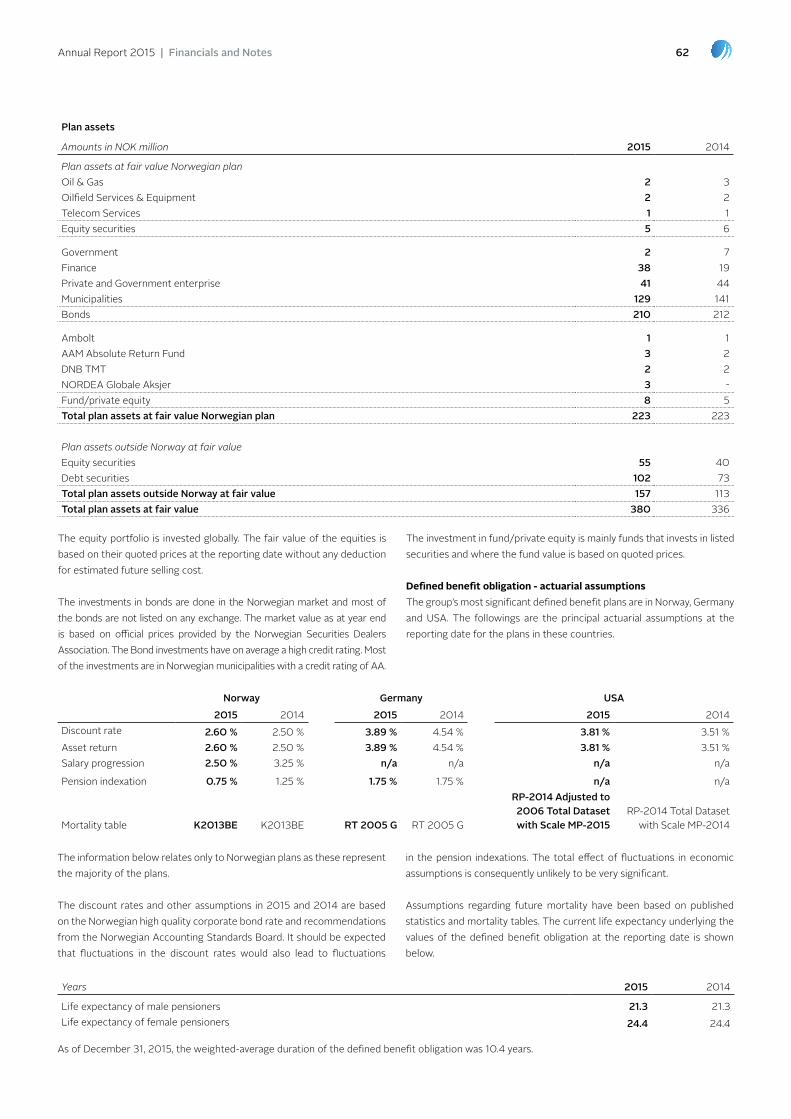
Annual Report 2015 | Financials and Notes 62
plan assets
Amounts in NOK million 2015 2014
Plan assets at fair value Norwegian plan oil & Gas 2 3 oilfield Services & equipment 2 2 telecom Services 1 1 equity securities 5 6
Government 2 7Finance 38 19 private and Government enterprise 41 44 Municipalities 129 141bonds 210 212
Ambolt 1 1 AAM Absolute Return Fund 3 2 Dnb tMt 2 2 noRDeA Globale Aksjer 3 - Fund/private equity 8 5 Total plan assets at fair value Norwegian plan 223 223
Plan assets outside Norway at fair valueequity securities 55 40 Debt securities 102 73 Total plan assets outside Norway at fair value 157 113Total plan assets at fair value 380 336
the information below relates only to norwegian plans as these represent the majority of the plans.
the discount rates and other assumptions in 2015 and 2014 are based on the norwegian high quality corporate bond rate and recommendations from the norwegian Accounting Standards board. It should be expected that fluctuations in the discount rates would also lead to fluctuations
in the pension indexations. the total effect of fluctuations in economic assumptions is consequently unlikely to be very significant.
Assumptions regarding future mortality have been based on published statistics and mortality tables. the current life expectancy underlying the values of the defined benefit obligation at the reporting date is shown below.
Years 2015 2014
life expectancy of male pensioners 21.3 21.3life expectancy of female pensioners 24.4 24.4
Norway germany usA2015 2014 2015 2014 2015 2014
Discount rate 2.60 % 2.50 % 3.89 % 4.54 % 3.81 % 3.51 %Asset return 2.60 % 2.50 % 3.89 % 4.54 % 3.81 % 3.51 %Salary progression 2.50 % 3.25 % n/a n/a n/a n/a
pension indexation 0.75 % 1.25 % 1.75 % 1.75 % n/a n/a
Mortality table K2013BE K2013be RT 2005 g Rt 2005 G
Rp-2014 Adjusted to 2006 Total Dataset with scale mp-2015
Rp-2014 total Dataset with Scale Mp-2014
the equity portfolio is invested globally. the fair value of the equities is based on their quoted prices at the reporting date without any deduction for estimated future selling cost.
the investments in bonds are done in the norwegian market and most of the bonds are not listed on any exchange. the market value as at year end is based on official prices provided by the norwegian Securities Dealers Association. the bond investments have on average a high credit rating. Most of the investments are in norwegian municipalities with a credit rating of AA.
the investment in fund/private equity is mainly funds that invests in listed securities and where the fund value is based on quoted prices.
Defined benefit obligation - actuarial assumptionsthe group’s most significant defined benefit plans are in norway, Germany and uSA. the followings are the principal actuarial assumptions at the reporting date for the plans in these countries.
As of December 31, 2015, the weighted-average duration of the defined benefit obligation was 10.4 years.
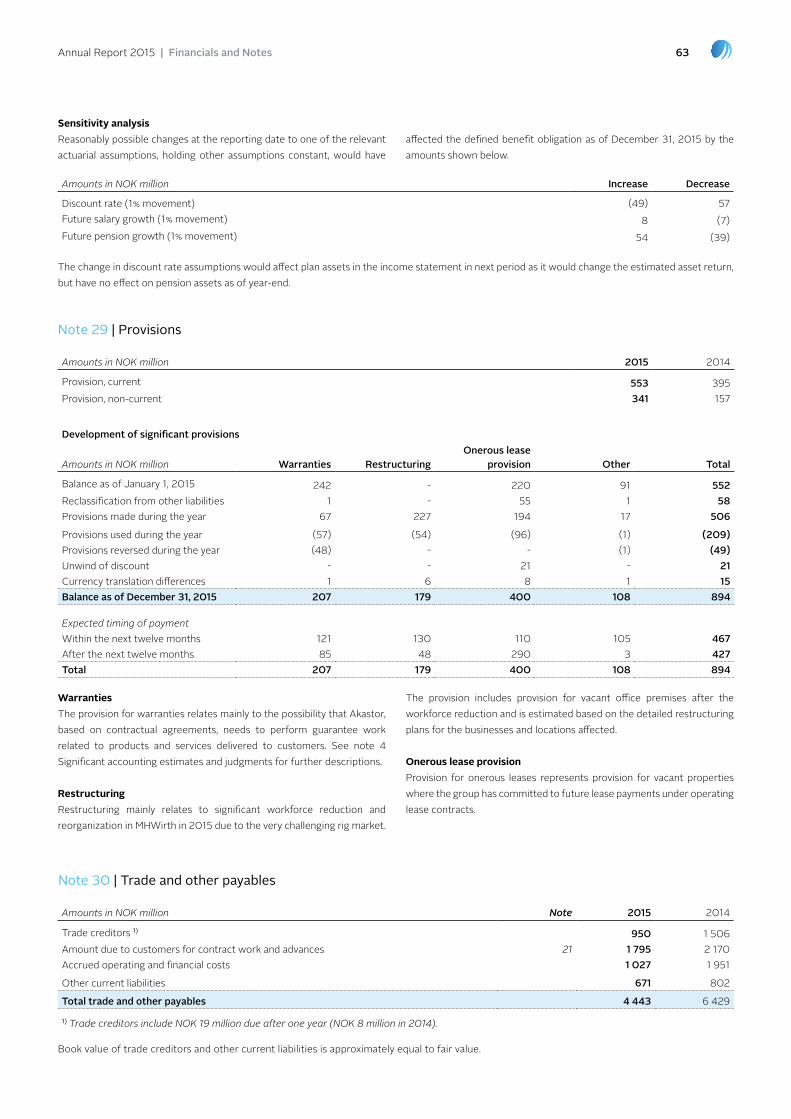
Annual Report 2015 | Financials and Notes 63
Amounts in NOK million Increase Decrease
Discount rate (1% movement) (49) 57 Future salary growth (1% movement) 8 (7)Future pension growth (1% movement) 54 (39)
Sensitivity analysisReasonably possible changes at the reporting date to one of the relevant actuarial assumptions, holding other assumptions constant, would have
affected the defined benefit obligation as of December 31, 2015 by the amounts shown below.
the change in discount rate assumptions would affect plan assets in the income statement in next period as it would change the estimated asset return, but have no effect on pension assets as of year-end.
Warrantiesthe provision for warranties relates mainly to the possibility that Akastor, based on contractual agreements, needs to perform guarantee work related to products and services delivered to customers. See note 4 Significant accounting estimates and judgments for further descriptions.
RestructuringRestructuring mainly relates to significant workforce reduction and reorganization in MHWirth in 2015 due to the very challenging rig market.
the provision includes provision for vacant office premises after the workforce reduction and is estimated based on the detailed restructuring plans for the businesses and locations affected.
Onerous lease provisionprovision for onerous leases represents provision for vacant properties where the group has committed to future lease payments under operating lease contracts.
Note 29 | Provisions
Amounts in NOK million 2015 2014
provision, current 553 395provision, non-current 341 157
Development of significant provisions
Amounts in NOK million Warranties RestructuringOnerous lease
provision Other Total
balance as of January 1, 2015 242 - 220 91 552Reclassification from other liabilities 1 - 55 1 58 provisions made during the year 67 227 194 17 506
provisions used during the year (57) (54) (96) (1) (209)provisions reversed during the year (48) - - (1) (49)unwind of discount - - 21 - 21 Currency translation differences 1 6 8 1 15 Balance as of December 31, 2015 207 179 400 108 894
Expected timing of paymentWithin the next twelve months 121 130 110 105 467 After the next twelve months 85 48 290 3 427 Total 207 179 400 108 894
Note 30 | Trade and other payables
Amounts in NOK million Note 2015 2014
trade creditors 1) 950 1 506 Amount due to customers for contract work and advances 21 1 795 2 170 Accrued operating and financial costs 1 027 1 951
other current liabilities 671 802
Total trade and other payables 4 443 6 429
1) Trade creditors include NOK 19 million due after one year (NOK 8 million in 2014).
book value of trade creditors and other current liabilities is approximately equal to fair value.

Annual Report 2015 | Financials and Notes 64
Note 31 | Capital management
Akastor’s capital management is designed to ensure that the group has sufficient financial flexibility, short-term and long-term. one main objective is to maintain a financial structure that, through solidity and cash flow, secures the group’s strong, long-term creditworthiness, as well maximize value creation for its shareholders through:
�� Investing in projects and business areas which will increase the company’s Return on Capital employed (RoCe) over time.
�� optimizing the company’s capital structure to ensure both sufficient and timely funding over time to finance its activities at the lowest cost.
Investment policyAkastor’s capital management is based on a rigorous investment selection process which considers not only Akastor’s weighted average cost of capital and strategic orientation but also external factors such as market expectations and extrinsic risk factors.
Funding policyLiquidity planningAkastor has a strong focus on its liquidity situation in order to meet its short term working capital needs and to ensure solvency for its financial obligations long term. Akastor had a liquidity reserve per year end 2015 of noK 2.6 billion and was beyond cash and cash equivalents, primarily composed of an undrawn committed credit facility. See also note 26 borrowings and note 38 Subsequent events for more information about refinancing agreed in 2016.
Funding of operationsAkastor’s group funding policy implies that all operations shall meet their funding needs directly via Corporate treasury. this ensures optimal availability and transfer of cash within the group and better control of the company’s overall debt as well as cheaper funding for its operations.
Funding durationAkastor emphasizes financial flexibility and steers its capital structure accordingly to limit its liquidity and refinancing risks. In this perspective, loans and other external borrowings are to be renegotiated well in advance of their due date and generally for periods of 3 to 5 years. See also note 26 borrowings and note 38 Subsequent events for more information about refinancing agreed in 2016.
Funding costAkastor aims to have a diversified selection of funding sources in order to reach the lowest possible cost of capital. these funding sources might include:
�� the use of banks based on syndicated credit facilities.
�� the issue of debt instruments on the norwegian capital market.
�� the issuance of debt in the foreign capital market.
Ratios used in monitoring of capitalAkastor monitors capital on the basis of a gearing ratio (net debt/equity) and interest coverage ratio (ebItDA/net finance costs). these ratios are similar to covenants as defined in loan agreements for revolving credit facility and term loans (see note 26 borrowings for details about these loans) and are shown below. other borrowings in the group have no covenants.
�� the company’s interest coverage ratio (ICR) must not be less than 4.0 times, calculated from the consolidated ebItDA to consolidated net Finance Cost.
�� the company’s gearing ratio shall not exceed 1.0 times and is calculated from the consolidated total borrowings to the consolidated equity.
the ratios are calculated based on net debt including cash and all interest-bearing liabilities as shown in note 34 Financial instruments, ebItDA (earnings before interest, tax, depreciation, amortization and adjusted for certain items as defined in the loan agreement) and net finance costs.
covenants in existing borrowings as of December 31
Amounts in NOK million 2015 2014
Gearing ratio
net debt 4 061 3 155
equity 7 386 9 378
Net debt/Equity 1) 0.55 0.34
Interest coverage ratio
ebItDA 562 1 380
net finance cost 201 167
EBITDA/Net finance cost 1) 2.8 8.21) Net finance cost, net debt and EBITDA are adjusted for certain items as defined in the loan agreement
As shown above, Akastor was below the threshold level of 4.0 for Interest Coverage Ratio (ICR) covenant as of December 31, 2015. on March 11, 2016, Akastor signed an agreement with its bank syndicate to amend and extend its financing structure, including new ICR-levels from Q4 2015 until Q1 2017. the covenants under the new agreements are:
�� the company’s interest coverage ratio (ICR), calculated from the consolidated ebItDA to consolidated net Finance Cost, shall not be lower than 1.5 in Q4 2015, 0.7 in Q1-Q3 2016, 3.0 in Q1 2017 and 4.0 from Q2 2017 onwards.

Annual Report 2015 | Financials and Notes 65
Note 32 | financial risk management and exposures
the group is exposed to a variety of financial risks: currency risk, interest rate risk, price risk, credit risk, liquidity risk and capital risk. the market risks affect the group’s income or the value of financial instruments held. the objective of financial risk management is to manage and control financial risk exposures and thereby increase the predictability of earnings and minimize potential adverse effects on the group’s financial performance. Akastor group uses financial derivative instruments to hedge certain risk exposures and aims to apply hedge accounting whenever possible in order to reduce the volatility resulting from the periodic mark-to-market revaluation of financial instruments in the income statement. Risk management is performed in every project. It is the responsibility of the project managers, in cooperation with the central treasury department (Corporate treasury), to identify, evaluate and hedge financial risks under policies approved by the board of Directors. the group has well-established principles for overall risk management, as well as policies for the use of derivatives and financial investments. there have not been any changes in these policies during the year.
Currency riskthe group operates internationally and is exposed to currency risk on commercial transactions, recognized assets and liabilities and net investments in foreign operations. Commercial transactions and recognized assets and liabilities are subject to currency risk when payments are denominated in a currency other than the respective functional currency of the group company. the group’s exposure to currency risk is primarily to uSD, euR, Gbp and bRl but also several other currencies. Akastor’s policy requires business units to mitigate currency exposure in any project. Corporate treasury manages internal exposures by entering into forward contracts or currency options with the financial
market place. Akastor has a large number of contracts involving foreign currency exposures and the currency risk policy has been well-established for many years.
For segment reporting purposes, each business unit designates all currency hedge contracts with Corporate treasury as cash flow hedge, fair value hedge, net investment hedge or identified and separated as an embedded derivative. external foreign exchange contracts are designated at group level as hedges of currency risk on a gross basis. More than 80 percent of the exposure value either qualify for hedge accounting or are embedded derivatives. non-qualifying hedges are adjusted at group level and included in the “unallocated” part of the segment reporting. See note 33 Derivative financial instruments for information regarding the accounting treatment of hedging and embedded derivatives.
Currency exposures from investments in foreign currencies are only hedged when specifically instructed by management. As of December 31, 2015, the group has one active net investment hedge related to its subsidiary Frontica Global employment limited.
Exposure to currency riskestimated forecasted receipts and payments in the table below are calculated based on the group’s hedge transactions through the Corporate treasury department. these are considered to be the best estimate of the currency exposure. the net exposure is managed by the Corporate treasury department that is allowed to hold positions within an approved trading mandate. this mandate is closely monitored and reported on a daily basis to the management.
�� the company’s gearing ratio shall not exceed 1.0 times and is calculated from the consolidated net debt to the consolidated equity.
�� Minimum liquidity level shall exceed noK 750 million.
the covenants are monitored on a regular basis by the treasury department to ensure compliance with the loan agreements. on the basis of the new covenants and its forecasts, management believes that the risk of the new covenant being breached is low and that the group will continue as a going concern for the foreseeable future. See note 26 borrowings and note 38 Subsequent events for further information.
2015 2014Amounts in million usD EuR gBp BRl uSD euR Gbp bRl
bank (106) (23) (27) - (83) (56) (17) - Intercompany loans 571 (41) (15) 136 406 (13) (11) 160 external loans (125) - - - - - - - Balance sheet exposure 341 (63) (42) 136 323 (70) (28) 160 estimated forecast receipts from customers 1 086 22 3 365 1 669 75 3 459 estimated forecast payments to vendors (471) (72) (12) (15) (700) (191) (14) (137)cash flow exposure 615 (50) (9) 350 969 (116) (11) 323 forward exchange contracts (952) 113 50 (350) (1 291) 186 39 (483)Net exposure 4 - - 136 1 - - -
Sensitivity analysisA strengthening of euR, uSD, Gbp and bRl against noK as of December 31 would have affected the measurement of financial instruments denominated in a foreign currency and increased (decreased) equity and income statement by the amounts shown below. this analysis is based on foreign currency exchange rate variances that the group considered
to be reasonably possible at the end of the reporting period. the analysis assumes that all other variables, in particular interest rates, remain constant and ignores any impact of forecast sales and purchases. Figures in the table below only include the effect in income statement and equity for change in currency regarding financial instruments and do not include effect from operating cost and revenue.
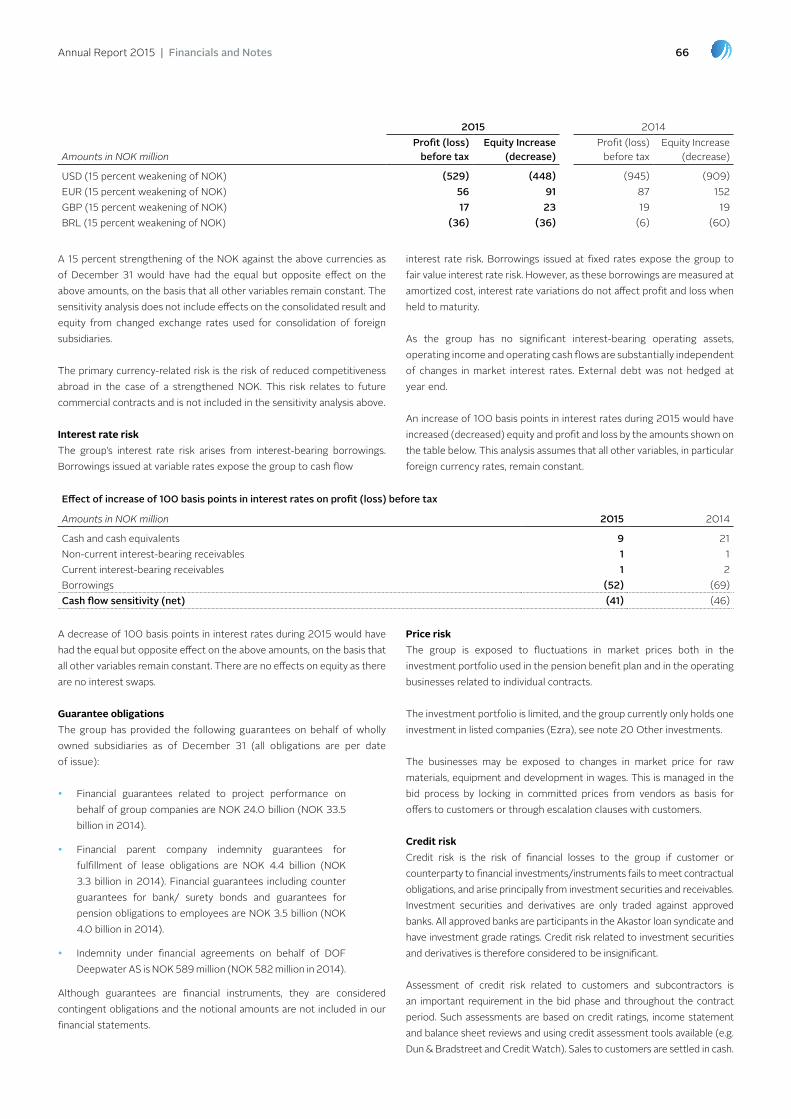
Annual Report 2015 | Financials and Notes 66
2015 2014
Amounts in NOK millionprofit (loss)
before taxEquity Increase
(decrease)profit (loss)
before taxequity Increase
(decrease)
uSD (15 percent weakening of noK) (529) (448) (945) (909)euR (15 percent weakening of noK) 56 91 87 152 Gbp (15 percent weakening of noK) 17 23 19 19 bRl (15 percent weakening of noK) (36) (36) (6) (60)
Effect of increase of 100 basis points in interest rates on profit (loss) before tax
Amounts in NOK million 2015 2014
Cash and cash equivalents 9 21 non-current interest-bearing receivables 1 1 Current interest-bearing receivables 1 2 borrowings (52) (69)cash flow sensitivity (net) (41) (46)
A decrease of 100 basis points in interest rates during 2015 would have had the equal but opposite effect on the above amounts, on the basis that all other variables remain constant. there are no effects on equity as there are no interest swaps.
Guarantee obligationsthe group has provided the following guarantees on behalf of wholly owned subsidiaries as of December 31 (all obligations are per date of issue):
�� Financial guarantees related to project performance on behalf of group companies are noK 24.0 billion (noK 33.5 billion in 2014).
�� Financial parent company indemnity guarantees for fulfillment of lease obligations are noK 4.4 billion (noK 3.3 billion in 2014). Financial guarantees including counter guarantees for bank/ surety bonds and guarantees for pension obligations to employees are noK 3.5 billion (noK 4.0 billion in 2014).
�� Indemnity under financial agreements on behalf of DoF Deepwater AS is noK 589 million (noK 582 million in 2014).
Although guarantees are financial instruments, they are considered contingent obligations and the notional amounts are not included in our financial statements.
Price riskthe group is exposed to fluctuations in market prices both in the investment portfolio used in the pension benefit plan and in the operating businesses related to individual contracts.
the investment portfolio is limited, and the group currently only holds one investment in listed companies (ezra), see note 20 other investments.
the businesses may be exposed to changes in market price for raw materials, equipment and development in wages. this is managed in the bid process by locking in committed prices from vendors as basis for offers to customers or through escalation clauses with customers.
Credit riskCredit risk is the risk of financial losses to the group if customer or counterparty to financial investments/instruments fails to meet contractual obligations, and arise principally from investment securities and receivables. Investment securities and derivatives are only traded against approved banks. All approved banks are participants in the Akastor loan syndicate and have investment grade ratings. Credit risk related to investment securities and derivatives is therefore considered to be insignificant.
Assessment of credit risk related to customers and subcontractors is an important requirement in the bid phase and throughout the contract period. Such assessments are based on credit ratings, income statement and balance sheet reviews and using credit assessment tools available (e.g. Dun & bradstreet and Credit Watch). Sales to customers are settled in cash.
A 15 percent strengthening of the noK against the above currencies as of December 31 would have had the equal but opposite effect on the above amounts, on the basis that all other variables remain constant. the sensitivity analysis does not include effects on the consolidated result and equity from changed exchange rates used for consolidation of foreign subsidiaries.
the primary currency-related risk is the risk of reduced competitiveness abroad in the case of a strengthened noK. this risk relates to future commercial contracts and is not included in the sensitivity analysis above.
Interest rate riskthe group’s interest rate risk arises from interest-bearing borrowings. borrowings issued at variable rates expose the group to cash flow
interest rate risk. borrowings issued at fixed rates expose the group to fair value interest rate risk. However, as these borrowings are measured at amortized cost, interest rate variations do not affect profit and loss when held to maturity.
As the group has no significant interest-bearing operating assets, operating income and operating cash flows are substantially independent of changes in market interest rates. external debt was not hedged at year end.
An increase of 100 basis points in interest rates during 2015 would have increased (decreased) equity and profit and loss by the amounts shown on the table below. this analysis assumes that all other variables, in particular foreign currency rates, remain constant.
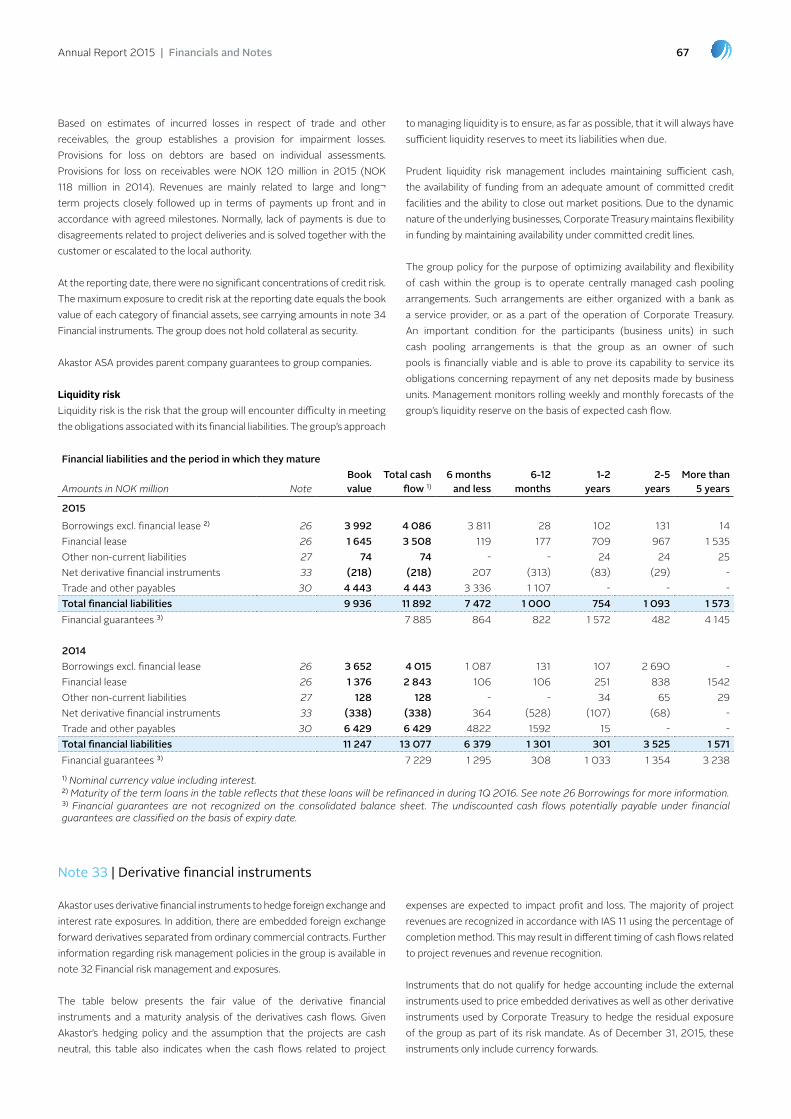
Annual Report 2015 | Financials and Notes 67
based on estimates of incurred losses in respect of trade and other receivables, the group establishes a provision for impairment losses. provisions for loss on debtors are based on individual assessments. provisions for loss on receivables were noK 120 million in 2015 (noK 118 million in 2014). Revenues are mainly related to large and long¬ term projects closely followed up in terms of payments up front and in accordance with agreed milestones. normally, lack of payments is due to disagreements related to project deliveries and is solved together with the customer or escalated to the local authority.
At the reporting date, there were no significant concentrations of credit risk. the maximum exposure to credit risk at the reporting date equals the book value of each category of financial assets, see carrying amounts in note 34 Financial instruments. the group does not hold collateral as security.
Akastor ASA provides parent company guarantees to group companies.
Liquidity riskliquidity risk is the risk that the group will encounter difficulty in meeting the obligations associated with its financial liabilities. the group’s approach
to managing liquidity is to ensure, as far as possible, that it will always have sufficient liquidity reserves to meet its liabilities when due.
prudent liquidity risk management includes maintaining sufficient cash, the availability of funding from an adequate amount of committed credit facilities and the ability to close out market positions. Due to the dynamic nature of the underlying businesses, Corporate treasury maintains flexibility in funding by maintaining availability under committed credit lines.
the group policy for the purpose of optimizing availability and flexibility of cash within the group is to operate centrally managed cash pooling arrangements. Such arrangements are either organized with a bank as a service provider, or as a part of the operation of Corporate treasury. An important condition for the participants (business units) in such cash pooling arrangements is that the group as an owner of such pools is financially viable and is able to prove its capability to service its obligations concerning repayment of any net deposits made by business units. Management monitors rolling weekly and monthly forecasts of the group’s liquidity reserve on the basis of expected cash flow.
financial liabilities and the period in which they mature
Amounts in NOK million NoteBook value
Total cash flow 1)
6 months and less
6-12 months
1-2 years
2-5 years
more than 5 years
2015
borrowings excl. financial lease 2) 26 3 992 4 086 3 811 28 102 131 14 Financial lease 26 1 645 3 508 119 177 709 967 1 535 other non-current liabilities 27 74 74 - - 24 24 25 net derivative financial instruments 33 (218) (218) 207 (313) (83) (29) - trade and other payables 30 4 443 4 443 3 336 1 107 - - - Total financial liabilities 9 936 11 892 7 472 1 000 754 1 093 1 573 Financial guarantees 3) 7 885 864 822 1 572 482 4 145
2014borrowings excl. financial lease 26 3 652 4 015 1 087 131 107 2 690 -Financial lease 26 1 376 2 843 106 106 251 838 1542other non-current liabilities 27 128 128 - - 34 65 29net derivative financial instruments 33 (338) (338) 364 (528) (107) (68) -trade and other payables 30 6 429 6 429 4822 1592 15 - -Total financial liabilities 11 247 13 077 6 379 1 301 301 3 525 1 571 Financial guarantees 3) 7 229 1 295 308 1 033 1 354 3 238 1) Nominal currency value including interest.2) Maturity of the term loans in the table reflects that these loans will be refinanced in during 1Q 2016. See note 26 Borrowings for more information.3) Financial guarantees are not recognized on the consolidated balance sheet. The undiscounted cash flows potentially payable under financial guarantees are classified on the basis of expiry date.
Akastor uses derivative financial instruments to hedge foreign exchange and interest rate exposures. In addition, there are embedded foreign exchange forward derivatives separated from ordinary commercial contracts. Further information regarding risk management policies in the group is available in note 32 Financial risk management and exposures.
the table below presents the fair value of the derivative financial instruments and a maturity analysis of the derivatives cash flows. Given Akastor’s hedging policy and the assumption that the projects are cash neutral, this table also indicates when the cash flows related to project
expenses are expected to impact profit and loss. the majority of project revenues are recognized in accordance with IAS 11 using the percentage of completion method. this may result in different timing of cash flows related to project revenues and revenue recognition.
Instruments that do not qualify for hedge accounting include the external instruments used to price embedded derivatives as well as other derivative instruments used by Corporate treasury to hedge the residual exposure of the group as part of its risk mandate. As of December 31, 2015, these instruments only include currency forwards.
Note 33 | Derivative financial instruments
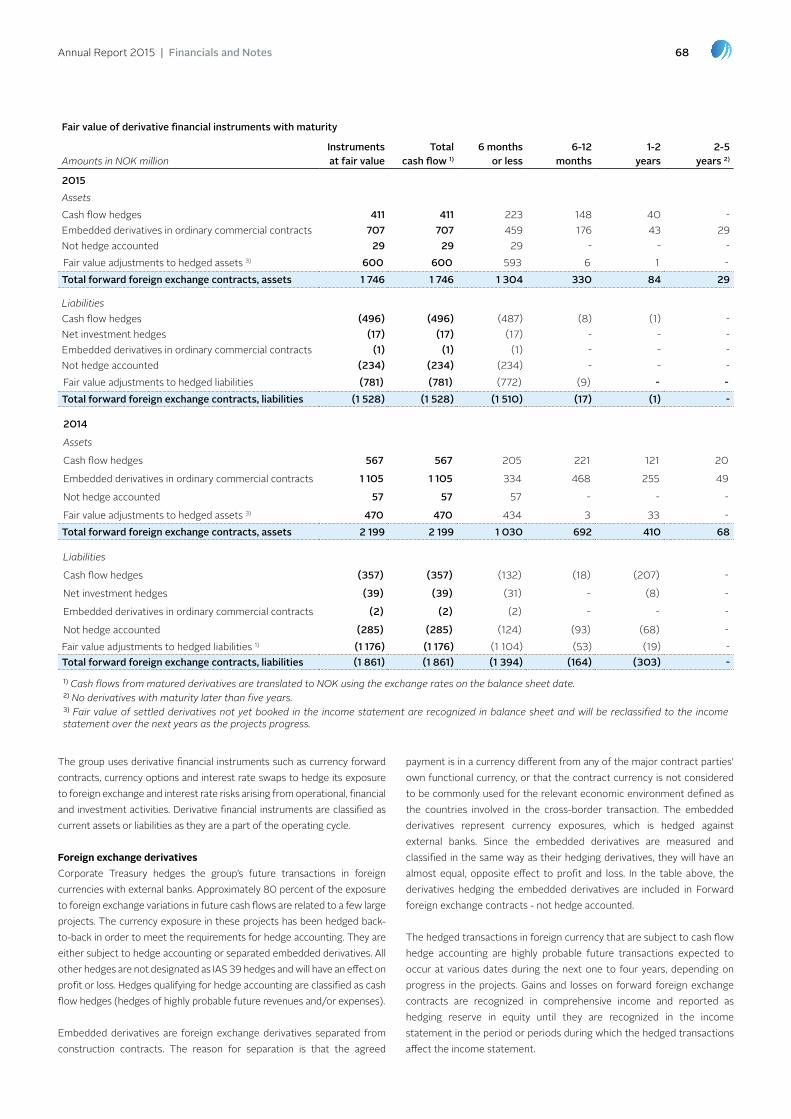
Annual Report 2015 | Financials and Notes 68
fair value of derivative financial instruments with maturity
Amounts in NOK millionInstruments at fair value
Total cash flow 1)
6 months or less
6-12 months
1-2 years
2-5 years 2)
2015AssetsCash flow hedges 411 411 223 148 40 - embedded derivatives in ordinary commercial contracts 707 707 459 176 43 29 not hedge accounted 29 29 29 - - - Fair value adjustments to hedged assets 3) 600 600 593 6 1 - Total forward foreign exchange contracts, assets 1 746 1 746 1 304 330 84 29
LiabilitiesCash flow hedges (496) (496) (487) (8) (1) - net investment hedges (17) (17) (17) - - - embedded derivatives in ordinary commercial contracts (1) (1) (1) - - - not hedge accounted (234) (234) (234) - - - Fair value adjustments to hedged liabilities (781) (781) (772) (9) - - Total forward foreign exchange contracts, liabilities (1 528) (1 528) (1 510) (17) (1) -
2014
Assets
Cash flow hedges 567 567 205 221 121 20
embedded derivatives in ordinary commercial contracts 1 105 1 105 334 468 255 49
not hedge accounted 57 57 57 - - -
Fair value adjustments to hedged assets 3) 470 470 434 3 33 - Total forward foreign exchange contracts, assets 2 199 2 199 1 030 692 410 68
Liabilities
Cash flow hedges (357) (357) (132) (18) (207) -
net investment hedges (39) (39) (31) - (8) -
embedded derivatives in ordinary commercial contracts (2) (2) (2) - - -
not hedge accounted (285) (285) (124) (93) (68) - Fair value adjustments to hedged liabilities 1) (1 176) (1 176) (1 104) (53) (19) - Total forward foreign exchange contracts, liabilities (1 861) (1 861) (1 394) (164) (303) -
1) Cash flows from matured derivatives are translated to NOK using the exchange rates on the balance sheet date.2) No derivatives with maturity later than five years.3) Fair value of settled derivatives not yet booked in the income statement are recognized in balance sheet and will be reclassified to the income statement over the next years as the projects progress.
the group uses derivative financial instruments such as currency forward contracts, currency options and interest rate swaps to hedge its exposure to foreign exchange and interest rate risks arising from operational, financial and investment activities. Derivative financial instruments are classified as current assets or liabilities as they are a part of the operating cycle.
Foreign exchange derivativesCorporate treasury hedges the group’s future transactions in foreign currencies with external banks. Approximately 80 percent of the exposure to foreign exchange variations in future cash flows are related to a few large projects. the currency exposure in these projects has been hedged back-to-back in order to meet the requirements for hedge accounting. they are either subject to hedge accounting or separated embedded derivatives. All other hedges are not designated as IAS 39 hedges and will have an effect on profit or loss. Hedges qualifying for hedge accounting are classified as cash flow hedges (hedges of highly probable future revenues and/or expenses).
embedded derivatives are foreign exchange derivatives separated from construction contracts. the reason for separation is that the agreed
payment is in a currency different from any of the major contract parties’ own functional currency, or that the contract currency is not considered to be commonly used for the relevant economic environment defined as the countries involved in the cross-border transaction. the embedded derivatives represent currency exposures, which is hedged against external banks. Since the embedded derivatives are measured and classified in the same way as their hedging derivatives, they will have an almost equal, opposite effect to profit and loss. In the table above, the derivatives hedging the embedded derivatives are included in Forward foreign exchange contracts - not hedge accounted.
the hedged transactions in foreign currency that are subject to cash flow hedge accounting are highly probable future transactions expected to occur at various dates during the next one to four years, depending on progress in the projects. Gains and losses on forward foreign exchange contracts are recognized in comprehensive income and reported as hedging reserve in equity until they are recognized in the income statement in the period or periods during which the hedged transactions affect the income statement.

Annual Report 2015 | Financials and Notes 69
Amounts in NOK million Type of instrument Book valuelevel in fair
value hierarchyfinancial instruments
measured at fair value
2015Cash and cash equivalents loans and receivables 563 other investments - equity securities: - Available-for-sale Shares ezra Holding ltd 1) Available for sale 141 level 1 141- Available-for-sale other 1) Available for sale 120 level 3 120 Derivative financial instruments Fair value - hedging instruments 1 746 level 2 1 746 non-current interest-bearing receivables loans and receivables 84 other non-current operating assets: - Contingent and deferred consideration Fair value through p&l 67 level 3 67 - other non-current operating assets loans and receivables 411 trade and other receivables loans and receivables 5 959 Current interest-bearing receivables loans and receivables 72 Total financial assets 9 162 2 074
Derivative financial instruments Fair value - hedging instruments (1 528) level 2 (1 528)non-current borrowings 2) other financial liabilities (1 583) level 2 (1 583)other non-current liabilities other financial liabilities (74) Current borrowings 3) other financial liabilities (4 054) level 2 (4 076)other current liabilities:- trade and other payables other financial liabilities (4 429) - Deferred consideration other financial liabilities (8) - Contingent consideration Fair value through p&l (6) level 3 (6)Total financial liabilities (11 682) (7 193)
unsettled cash flow hedges’ impact on profit and loss and equity (not adjusted for tax)
2015 2014
Amounts in NOK million
fair value of all hedging
instrumentsRecognized in profit and loss
Deferred in equity (the
hedge reserve)
Fair value of all hedging
instrumentsRecognized in profit and loss
Deferred in equity (the
hedge reserve)
Forward exchange contracts (cash flow hedges) (85) (104) 19 210 100 110
the value of the hedge reserve is before tax to allow comparison with the value of the hedging derivatives; this value does not include deferred settlements related to matured instruments.
the purpose of the hedging instrument is to secure a situation where the hedged item and the hedging instrument together represent a predetermined value independent of fluctuations of exchange rates. Revenue and expense on the underlying construction contracts are
recognized in the income statement in accordance with progress. Consequently, negative noK 104 million (positive noK 100 million in 2014) of the value of the forward contracts have already affected the income statement indirectly as revenues and expenses are recognized based on updated forecasts and progress. the positive noK 19 million (positive noK 110 million in 2014) that are currently recorded directly in the hedging reserve, will be reclassified to income statement over the next years.
Note 34 | financial instruments
the table below lists the group’s financial instruments, both assets and liabilities. Financial instruments measured at fair value are classified by the levels in the fair value hierarchy. All other financial instruments are classified by the main group of instruments as defined in IAS 39. It does not include fair value information for financial assets and financial liabilities not measured at fair value if the carrying amounts are a reasonable approximation of fair value. For financial instruments measured at fair value, the levels in the fair value hierarchy are as shown below.
level 1 - fair values are based on prices quoted in an active market for identical assets or liabilities.
level 2 - fair values are based on price inputs other than quoted prices derived from observable market transactions in an active market for identical assets or liabilities. level 2 includes currency or interest derivatives and interest bonds, typically when the group uses forward prices on foreign exchange rates or interest rates as inputs to valuation models.
level 3 - Fair values are based on unobservable inputs, mainly based on internal assumptions used in the absence of quoted prices from an active market or other observable price inputs.

Annual Report 2015 | Financials and Notes 70
Amounts in NOK million Type of instrument Book valuelevel in fair
value hierarchyfinancial instruments
measured at fair value
2014Cash and cash equivalents loans and receivables 1 075 other investments - equity securities: - Available-for-sale Shares ezra Holding ltd 1) Available for sale 222 level 1 222 - Available-for-sale other 1) Available for sale 125 level 3 125 Derivative financial instruments Fair value - hedging instruments 2 199 level 2 2 199 non-current interest-bearing receivables loans and receivables 131 other non-current operating assets - Contingent and deferred consideration Fair value through p&l 90 level 3 90 - other non-current operating assets loans and receivables 601 trade and other receivables loans and receivables 7 178 Current interest-bearing receivables - bonds and certificates 3) Fair value - hedging instruments 91 level 2 91 - Receivables loans and receivables 114 Total financial assets 11 826 2 727
Derivative financial instruments Fair value - hedging instruments (1 861) level 2 (1 861)non-current borrowings 2) other financial liabilities (4 720) level 2 (4 748)other non-current liabilities - Contingent consideration Fair value through p&l (37) level 3 (37) - other liabilities other financial liabilities (91) - Current borrowings 3) other financial liabilities (308) level 2 (308)other current liabilities - trade and other payables other financial liabilities (6 402) - - Deferred consideration other financial liabilities (7) - - Contingent consideration Fair value through p&l (20) level 3 (20)Total financial liabilities (13 446) (6 974)
1) Investments in level 3 in the hierarchy relate to equity securities with no active market. These investments are measured at cost since this is considered to be the best estimate of fair value. All available for sale investments are designated as such upon initial recognition.2) For credit facilities and other short-term loans with floating interest, notional amounts are used as approximation of fair values.3) Portfolio of bonds, obligations and certificates derived from observable market transactions in an active market for identical assets.
there are no financial assets or liabilities held for trading.
the assets and liabilities reported as level 3 in the fair value hierarchy relate to contingent considerations from business acquisitions and disposals where the final amounts to be paid or received depend on future earnings in the acquired and disposed companies. the recognized amounts are determined based on recent forecasts and strategy figures for these entities, thus the final realized values are sensitive to the above inputs as driven by market conditions.
the credit exposure on the level 3 asset is limited to the amount recognized and due to the nature of the arrangement the credit risk is not considered to be significant.
Reconciliation of level 3 assets and liabilities
Amounts in NOK million Assets liabilities
balance as of January 1, 2014 - (143)net gain (loss) in the income statement - 87Assumed in disposal of business 90 -Balance as of December 31, 2014 90 (56)
Settlements - 4
net gain (loss) in the income statement (23) 47Balance as of December 31, 2015 67 (6)

Annual Report 2015 | Financials and Notes 71
Note 35 | group companies
this note gives an overview of entities that are consolidated into Akastor group. For information about other investments in the group, refer to note 19 equity-accounted investees and note 20 other investments. If not stated otherwise, ownership equals share of voting rights.
group companies as of December 31 Ownership (%)
company location country 2015 2014
Akastor AsA Fornebu norway
mhWirthMHWirth pty ltd Argenton Australia 100 100Mpo Austria Holding GmbH Vienna Austria 100 100Mpo Austria Services GmbH 1) Vienna Austria - 100MHWirth Canada Inc newfoundland Canada 100 100MHWirth offshore petroleum engineering (Shanghai) Co ltd Shanghai China 100 100Managed pressure operations International limited (Cyprus) limassol Cyprus 100 100MHWirth GmbH erkelenz Germany 100 100MHWirth (India) pvt ltd Mumbai India 100 100pt Managed pressure operations (Indonesia) Jakarta Indonesia 100 100MHWirth Sdn bhd Kuala lumpur Malaysia 100 100Drilltech AS Kristiansand norway 100 100Managed pressure operations International AS Kristiansand norway 100 100Maritime promeco AS Kristiansand norway 100 100MHWirth AS Kristiansand norway 100 100MHWirth St. petersburg llC 1) St petersburg Russia - 100Managed pressure operations pte ltd (Singapore) Singapore Singapore 100 100MHWirth (Singapore) pte ltd Singapore Singapore 100 100Mpo Research technologies pte ltd Singapore Singapore 100 100MHWirth uK ltd Aberdeen uK 100 100MHWirth FZe Dubai uAe 100 100Managed pressure operations FZe (Dubai) Dubai uAe 100 100MHWirth Inc Houston uSA 100 100Managed pressure operations llC (uSA - tX) Houston uSA 100 100MHWirth Gas & oil- Field equipment & Services llC 13) Abu Dhabi uAe 49 49
fronticaFrontica Advantage pty ltd 2) Melbourne Australia 100 100Frontica Global employment ltd limassol Cyprus 100 100Frontica business Solutions Sdn bhd Kuala lumpur Malaysia 100 100Frontica Group AS 3) Fornebu norway 100 100 Frontica business Solutions AS Fornebu norway 100 100Frontica Advantage AS bergen norway 100 100Frontica Advantage Group AS Fornebu norway 100 100Frontica Advantage ltd london uK 100 100Frontica business Solutions ltd london uK 100 100Frontica DC trustees ltd london uK 100 100Frontica Advantage Inc Houston uSA 100 100Frontica business Solutions Inc Houston uSA 100 100
AKOfs OffshoreAKoFS 1 AS oslo norway 100 100AKoFS 2 AS oslo norway 100 100AKoFS 3 AS oslo norway 100 100AKoFS 2 Services AS oslo norway 100 100AKoFS offshore AS oslo norway 100 100AKoFS offshore operations AS oslo norway 100 100AKoFS 4 AS oslo norway 100 100AKoFS Wayfarer AS Fornebu norway 100 100AKoFS Angola limited luanda Angola 100 100
fjords processingFjords process Australia pty ltd 5) Welshpool Australia 100 100Fjords processing Canada Inc newfoundland Canada 100 100Aker Cool Sorption (beijing) technology Co ltd beijing China 100 100Aker Midsund engineering s.r.o prague Czech Republic 98 98Cool Sorption A/S Glostrup Denmark 100 100Fjords processing France SAS Vincennes Cedex France 100 100Fjords processing 1 AS 6) Fornebu norway 100 -Fjords processing AS Fornebu norway 100 100Fjords processing International AS Fornebu norway 100 100Midsund bruk 1 AS Midsund norway 100 0Midsund bruk AS Midsund norway 100 100Aker Cool Sorption Siam ltd Rayong thailand 100 100Fjords process uK ltd 7) Aberdeen uK 100 100

Annual Report 2015 | Financials and Notes 72
1) Liquidated in 20152) Changed name from Advantage Frontica Pty Ltd3) Changed name from Frontica AS4) Changed name from AKOFS Offshore Servicos de Petroleo e Gas do Brazil Ltda. The company includes businesses in MHWirth, Frontica Business Solutions, Fjords Processing and AKOFS Offshore5) Changed name from Fjords Process Systems Pty Ltd6) New companies in 20157) Changed name from Aker Process Systems Ltd8) Changed name from KOP Surface Products Pte Ltd9) Sold in 201510) No non-controlling interest is recognized due to applying the anticipated acquisition method11) Changed name from Aker Solutions Belgium NV/SA12) Changed name from Aker Process BV13) Share of voting rights is 100%
group companies as of December 31 (cont.) Ownership (%)
company location country 2015 2014opus Maxim ltd Guildford uK 100 100opus plus ltd orkney uK 100 100Fjords processing Inc Houston uSA 100 100pt Aker Solution e & C Indonesia Jakarta Indonesia 100 100Fjords processing Columbia SAS 6) bogota Columbia 100 -
KOp surface productspt Kop Surface products Jakarta Indonesia 100 100Kop Surface products Sdn bhd Kuala lumpur Malaysia 100 100Kop Surface products nigeria ltd Ikoyi - lagos nigeria 100 100Kop Surface products Singapore pte ltd 8) Singapore Singapore 100 100Kop Surface products (Services) pte ltd Singapore Singapore 100 100Kop Surface products (Services) uK ltd 6) Aberdeen uK 100 -
Real Estate and other holdingsAkastor Real estate AS Fornebu norway 100 100borgeskogen 69 AS 9) Fornebu norway - 100Dvergsnestangen eiendom Invest AS 9) Fornebu norway - 100egersund eiendom Invest AS 9) Fornebu norway - 100Grunnavågen eiendom Invest AS 9) Fornebu norway - 100pusnes eiendom AS 9) Fornebu norway - 100Strendene eiendom AS 9) Fornebu norway - 100tranby eiendom Invest AS 9) Fornebu norway - 100tromsøruffen AS Fornebu norway 100 100Ågotnes eiendom Invest AS 9) Fornebu norway - 100
first geoFirst Geo AS Stavanger norway 100 100
step Oiltools 10)
Step oiltools (Australia) pty ltd perth Australia 76 76Step oiltools limited Grand Cayman Cayman Islands 76 76Step oiltools GmbH bad Fallingbostel Germany 76 76pt Step oiltools Jakarta Indonesia 76 76Step oiltools llp Aktau Kazakhstan 76 76Step oiltools bV Amsterdam netherlands 76 76Step oiltools AS Stavanger norway 76 76Step oiltools (Myanmar) ltd Yangon Myanmar 76 76Step oiltools Services llC Muscat oman 51 51Step oiltools (M) Sdn bhd Kuala lumpur Malaysia 76 76Step oiltools llC Moscow Russia 76 76Step oiltools pte ltd Singapore Singapore 76 76Step oiltools (thailand) ltd bangkok thailand 76 76Step oiltools (uK) ltd Aberdeen uK 76 76Step oiltools FZe Dubai uAe 76 76
Other companiesZoetermeer process belgium nV/SA 11) Antwerp belgium 100 100Akastor Mauritius ltd port louis Mauritius 100 100AK operações do brasil ltda 4) Rio de Janeiro brazil 100 100Zoetermeer process bV 12) Zoetermeer netherlands 100 100Aker operations ApS 1) Glostrup Denmark - 100Akastor AS Fornebu norway 100 100Aker Insurance AS 1) Fornebu norway - 100btA technology AS Fornebu norway 100 100AK pharmaceuticals llC Houston uSA 100 100AK Willfab Inc Williamsport uSA 100 100

Annual Report 2015 | Financials and Notes 73
Note 36 | related parties
Related party relationships are those involving control (either direct or indirect), joint control or significant influence. Related parties are in a position to enter into transactions with the company that would not be undertaken between unrelated parties. All transactions with related parties in Akastor have been based on arm’s length terms.
Akastor ASA is a parent company with control of around 90 companies around the world. these subsidiaries are listed in note 35 Group companies. Any transactions between the parent company and the subsidiaries are shown line by line in the separate financial statements of the parent company, and are eliminated in the consolidated financial statements.
Joint ventures and associates are consolidated using the equity method, see note 19 equity-accounted investees. transactions between the group and these entities are shown in the table below.
Remunerations and transactions with directors and executive officers are summarized in note 37 Management remunerations.
the largest shareholder of Akastor, Aker Kværner Holding AS, is controlled by Aker ASA (70 percent) which in turn is controlled by Kjell Inge Røkke and his family through tRG Holding AS and the Resource Group tRG AS. the Chief executive officer of Akastor, Kristian Monsen Røkke, is a board member of tRG Holding AS. Aker ASA also holds 8.5 percent of the shares in Akastor ASA directly. All entities controlled by Aker ASA are considered related parties to Akastor, referred as “Aker entities”.
After implementation of IFRS 10, Kvaerner is considered to be a related party of Akastor as part of “Aker entities”. For the same reason Aker Solutions is also considered to be a related party as part of “Aker entities” from the time of the demerger in September 2014.
summary of transactions and balances with related parties
2015 2014
Amounts in NOK millionAker
entitiesJoint
ventures Total Aker entities
Joint ventures and
Associates total
Income statementoperating revenues 4 222 - 4 222 4 596 - 4 596 other income 310 - 310 - - - operating costs (288) - (288) (488) (82) (570)net financial items (279) 4 (275) (62) 5 (57)
Assets (liabilities)trade receivables 154 - 154 530 - 530 Interest-bearing receivables - 82 82 63 84 147 ppe under finance lease ( Aker Wayfarer) 1 313 - 1 313 890 - 890 non-current assets under finance lease (Aker Wayfarer) 410 - 410 600 - 600 trade payables (51) - (51) (137) (19) (156)Financial lease liability (Aker Wayfarer) (1 645) - (1 645) (1 376) - (1 376)Interest-bearing liability - - - (82) - (82)
below are descriptions of significant related party transactions in 2015.
Related party transactions with Aker entitiesAker SolutionsAkastor has entered into a number of agreements and arrangements with Aker Solutions, including:
�� Agreements for the provision of shared services from Frontica to subsidiaries of Aker Solutions as well as agreements for real estate and lease agreements from Akastor Real estate AS to subsidiaries of Aker Solutions. the amount charged for these services are noK 3.6 billion (noK 4.0 billion in 2014).
�� In February 2016, Frontica signed a five year contract with Aker Solutions to deliver staffing services, It services and consultancy projects as well as business support services within HR, finance and procurement. the contract value of outsourcing services (Ito and bpo) is estimated to be between noK 1-1.25 billion annually and staffing services with an estimated value of additional noK 1 billion annually (depending on volume).
�� An agreement concerning ownership and licensing rights to intellectual property and know-how as well as several bilateral license agreements between Aker Solutions and Akastor entities based on the principles and allocation of technology set out in the technology Agreement.
�� A main separation agreement addressing various separation issues between Aker Solutions and Akastor following the completion of the demerger in 2014.
�� An agreement for provisioning of transitional services to and from Aker Solutions following the demerger in 2014, which are not covered by Frontica’s agreements.
�� Various agreements addressing commercial separation issues between subsidiaries of Aker Solutions and Akastor, for example in relation to joint and shared initiatives, on-going, committed or contemplated projects, non-project specific cooperation and shared frame agreements as well as disputes. these agreements include an agreement between

Annual Report 2015 | Financials and Notes 74
entities within the Subsea reporting segment of Aker Solutions and entities within Fjords processing of Akastor regarding development of certain process technologies and an agreement between Subsea and MHWirth regarding the use and development of well control technologies.
�� Guarantee obligations: If an obligation that arose prior to the completion of the demerger is not satisfied by the party to which the obligation has been allocated under the demerger plan, be it Akastor or Aker Solutions, the other party will have secondary joint liability for such obligation. this statutory liability is unlimited in time, but is limited in amount to the net value allocated to the non-defaulting party in the demerger. A guarantee commission will only be charged in the event that a guarantee cannot be effectively transferred or novated to Aker Solutions.
KvaernerFrontica is a supplier of services to Kvaerner (shared services, recruitment and supply of technical and project administrative personnel). the amount charged for these services are noK 312 million (noK 392 million in 2014).
Akastor has provided parent company guarantees on behalf of Kvaerner entities of noK 12.2 billion related to guarantees that were not transferred in connection with the demerger in 2011. the amount reflects obligations per date of issue of the guarantees. Kvaerner pays a guarantee commission on market terms and is liable to indemnify Akastor for any rightful claim under the guarantee.
Aker Maritime Finance ASIn December 2015, Akastor sold its real estate portfolio comprising of eight properties to Aker Maritime Finance AS, a wholly owned subsidiary of Aker ASA. the consideration was noK 1 174 million and a gain of noK 310 million was recognized as other income. Following the divestment, MHWirth AS and Midsund bruk AS, wholly owned subsidiaries of Akastor, entered into long-term lease agreements with subsidiaries of Aker Maritime Finance AS for properties in Dvergsnestangen and Midsund. the lease period is 19 years starting october 1, 2015, with options for renewal.
AK Wilfab Inc, a wholly owned subsidiary of Akastor, is together with Aker Solutions Inc and Aker Maritime Finance AS sponsoring the uS pension plan named the Kvaerner Consolidated Retirement plan. Aker Maritime Finance AS holds two thirds of the liability of the sponsors for the underfunded element of the plan, while the ultimate liability for the remaining one third lies with Akastor.
Fornebuporten AS on January 30, 2015, Akastor entered into a long-term lease agreement with Fornebuporten AS, an associate of Aker ASA, starting August 31, 2015 for headquarter offices at Fornebu. the duration of the contract is 10 years, with two additional five-year options.
Aker Ship Lease 1 AS (Ocean Yield)In 2009 Aker Ship lease 1 AS and AKoFS offshore entered into a 10 year bareboat charter contract for vessel Aker Wayfarer. In September 2014, AKoFS offshore was awarded a five year contract with petrobras to provide subsea intervention services offshore in brazil for the Aker Wayfarer vessel with a start in Q4 2016 with a five-year option extension. the vessel will be converted to a deepwater subsea equipment support vessel. the vessel contract with Aker Shiplease 1 AS was renegotiated to include an extension of current bareboat contract by 7 years, financing of the topside and subsea equipment, and new purchase options on 3 different dates. As a result of this re-negotiation, the vessel contract is recognized as a finance lease and the finance lease obligation as of December 31, 2015 amounts to noK 1 645 million, of which noK 269 million is presented as current liability, representing the lease payment to Aker Ship lease 1 AS in the next twelve months. Vessel under finance lease amounts to noK 1 313 million as of December 31, 2015 and an additional noK 410 million is recognized in other non-current assets and represents the capex obligation in the contract. the increase of carrying amounts of finance lease assets and liabilities is due to the change of functional currency of Aker Wayfarer from noK to uSD as of January 1, 2015.
Related party transactions with joint venturesDOF Deepwater ASA loan of noK 82 million (noK 84 million in 2014) is given to the joint venture DoF Deepwater (nIboR 12 months + 1.5 percent). Akastor ASA has issued financial guarantees in favor of financial institutions related to financing of the five vessels in DoF Deepwater, refer to note 19.
Other related partiesAker Pensjonskasse Aker pensjonskasse was established by Aker ASA to manage the retirement plan for employees and retirees in Akastor as well as related Aker companies. Akastor holds 93.4 percent of the paid-in capital in Aker pensjonskasse and Akastor’s share of paid-in equity was noK 120 million at the end of 2015 (unchanged from 2014). Akastor’s premium paid to Aker pensjonskasse amounts to noK 15 million in 2015 (noK 14 million in 2014).
even though Akastor owns 93.4 percent in Aker pensjonskasse, the ownership does not constitute control since Akastor does not have the power to govern the financial and operating policies so as to obtain benefits from the activities in this entity.
Grants to employee representative’s collective fundAker ASA has signed an agreement with employee representatives that regulate use of grants from Akastor ASA for activities related to professional development. the grant in 2015 was noK 595 000 (noK 335 000 in 2014).

Annual Report 2015 | Financials and Notes 75
Note 37 | management remunerations
Board of directorsthe board of directors did not receive any other fees than those listed in the table below in 2015 or 2014, except for employee representatives who had market based salaries. the members of the board of directors have no agreements that entitle them to any extraordinary remuneration.
the fees in the table below represent what is recognized as expenses in the income statement based on assumptions about fees to be approved at the general assembly in 2015 for 2014 rather than what has been paid in the year.
Amounts in NOK Board meeting
attendance Extraordinary board meeting attendance
Audit committee attendance
Audit committee
Board fees
2015Kjell Inge Røkke 2 of 6 255 000 Frank ove Reite 2 of 2 1 of 2 150 000 Øyvind eriksen 7 of 8 1 of 2 535 000 lone Fønss Schrøder 8 of 8 1 of 2 7 of 7 205 000 440 000 Kathryn baker 8 of 8 2 of 2 7 of 7 115 000 340 000 Sarah Ryan 1) 8 of 8 2 of 2 445 600 Jannicke Sommer-ekelund 8 of 8 2 of 2 170 000 Stig Faraas 8 of 8 2 of 2 170 000 Asbjørn Michailoff pettersen 8 of 8 2 of 2 7 of 7 115 000 170 000 Total 435 000 2 675 600
Aker solutions Akastor
Amounts in NOK
Board meeting
attendance
Extraordi-nary board
meeting attendance
Board Risk committee
Audit committee
Board fees
Board meeting
attendanceAudit
committee Board
fees
2014Øyvind eriksen 7 of 7 2 of 2 3 000 000 3 of 3 300 000lone Fønss Schrøder 7 of 7 2 of 2 63 750 255 000 2 of 3 38 750 85 000Kjell Inge Røkke 6 of 7 1 of 2 255 000 3 of 3 85 000Kathryn baker - 3 of 3 21 250 85 000Sarah Ryan 1) 7 of 7 1 of 2 255 000 3 of 3 85 000Jannicke Sommer-ekelund 3 of 3 42 500Stig Faraas 3 of 3 42 500Asbjørn Michailoff pettersen 3 of 3 21 250 42 500Anne Drinkwater1) 7 of 7 2 of 2 15 000 116 250 255 000Atle teigland 6 of 7 2 of 2 63 750 127 500Åsmund Knutsen 7 of 7 2 of 2 15 000 127 500Arild Håvik 5 of 7 2 of 2 127 500Hilde Karlsen 5 of 7 2 of 2 127 500Stuart Ferguson1) 7 of 7 2 of 2 26 250 330 000Koosum parsotam Kalyan1) 7 of 7 2 of 2 15 000 255 000Total 71 250 243 750 5 115 000 81 250 767 500
1) Board fees in 2015 and 2014 includes an allowance of NOK 12 500 per meeting per physical attendance for board members residing outside the Nordic countries
According to policy in Aker, fees to directors employed in Aker companies are paid to the Aker companies, not to the directors in person. therefore, board fees for Øyvind eriksen were paid to Aker ASA. board fee for Kjell Inge Røkke was paid to the Resource Group AS. the board fee for Øyvind eriksen up until July 1, 2014 includes fee for his role as executive Chairman.
Audit CommitteeAkastor has an audit committee comprising three of the directors, which held 7 meetings in 2015. As of December 31, 2015, the audit committee comprises lone Fønss Schrøder (chairman), Kathryn M. baker and Asbjørn Michailoff pettersen.
Guidelines for remuneration to the members of the executive management of Akastorthe main purpose of the executive remuneration is to encourage a strong and sustainable performance-based culture, which supports growth in shareholder value. As of December 31, 2015, the executive management of Akastor comprises the company’s Ceo, Kristian Monsen Røkke, CFo leif H. borge, Investment Director paal e. Johnsen and Investment Director Karl erik Kjelstad. the company practices standard employment contracts and standard terms and conditions regarding notice period and severance pay for the Akastor management. Kristian Monsen Røkke and paal e. Johnsen have three months’ notice period as a part of their employment contracts, while borge and Kjelstad both have six months’ notice periods.
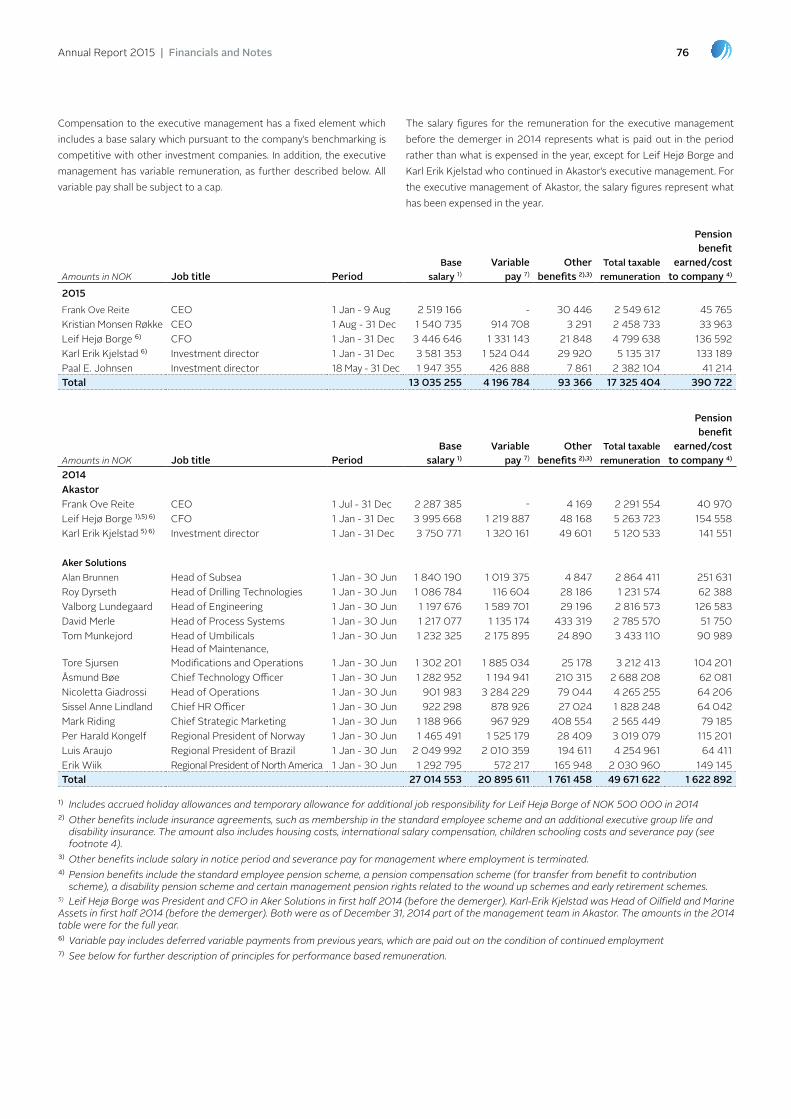
Annual Report 2015 | Financials and Notes 76
Amounts in NOK Job title periodBase
salary 1)variable
pay 7)Other
benefits 2),3)
Total taxable remuneration
pension benefit
earned/cost to company 4)
2015Frank ove Reite Ceo 1 Jan - 9 Aug 2 519 166 - 30 446 2 549 612 45 765 Kristian Monsen Røkke Ceo 1 Aug - 31 Dec 1 540 735 914 708 3 291 2 458 733 33 963 leif Hejø borge 6) CFo 1 Jan - 31 Dec 3 446 646 1 331 143 21 848 4 799 638 136 592 Karl erik Kjelstad 6) Investment director 1 Jan - 31 Dec 3 581 353 1 524 044 29 920 5 135 317 133 189 paal e. Johnsen Investment director 18 May - 31 Dec 1 947 355 426 888 7 861 2 382 104 41 214 Total 13 035 255 4 196 784 93 366 17 325 404 390 722
Amounts in NOK Job title periodBase
salary 1)
variable pay 7)
Other benefits 2),3)
Total taxable remuneration
pension benefit
earned/cost to company 4)
2014Akastor Frank ove Reite Ceo 1 Jul - 31 Dec 2 287 385 - 4 169 2 291 554 40 970 leif Hejø borge 1),5) 6) CFo 1 Jan - 31 Dec 3 995 668 1 219 887 48 168 5 263 723 154 558 Karl erik Kjelstad 5) 6) Investment director 1 Jan - 31 Dec 3 750 771 1 320 161 49 601 5 120 533 141 551
Aker solutionsAlan brunnen Head of Subsea 1 Jan - 30 Jun 1 840 190 1 019 375 4 847 2 864 411 251 631 Roy Dyrseth Head of Drilling technologies 1 Jan - 30 Jun 1 086 784 116 604 28 186 1 231 574 62 388 Valborg lundegaard Head of engineering 1 Jan - 30 Jun 1 197 676 1 589 701 29 196 2 816 573 126 583 David Merle Head of process Systems 1 Jan - 30 Jun 1 217 077 1 135 174 433 319 2 785 570 51 750 tom Munkejord Head of umbilicals 1 Jan - 30 Jun 1 232 325 2 175 895 24 890 3 433 110 90 989
tore SjursenHead of Maintenance, Modifications and operations 1 Jan - 30 Jun 1 302 201 1 885 034 25 178 3 212 413 104 201
Åsmund bøe Chief technology officer 1 Jan - 30 Jun 1 282 952 1 194 941 210 315 2 688 208 62 081 nicoletta Giadrossi Head of operations 1 Jan - 30 Jun 901 983 3 284 229 79 044 4 265 255 64 206 Sissel Anne lindland Chief HR officer 1 Jan - 30 Jun 922 298 878 926 27 024 1 828 248 64 042 Mark Riding Chief Strategic Marketing 1 Jan - 30 Jun 1 188 966 967 929 408 554 2 565 449 79 185 per Harald Kongelf Regional president of norway 1 Jan - 30 Jun 1 465 491 1 525 179 28 409 3 019 079 115 201 luis Araujo Regional president of brazil 1 Jan - 30 Jun 2 049 992 2 010 359 194 611 4 254 961 64 411 erik Wiik Regional president of north America 1 Jan - 30 Jun 1 292 795 572 217 165 948 2 030 960 149 145 Total 27 014 553 20 895 611 1 761 458 49 671 622 1 622 892
1) Includes accrued holiday allowances and temporary allowance for additional job responsibility for Leif Hejø Borge of NOK 500 000 in 2014 2) Other benefits include insurance agreements, such as membership in the standard employee scheme and an additional executive group life and disability insurance. The amount also includes housing costs, international salary compensation, children schooling costs and severance pay (see footnote 4). 3) Other benefits include salary in notice period and severance pay for management where employment is terminated.4) Pension benefits include the standard employee pension scheme, a pension compensation scheme (for transfer from benefit to contribution scheme), a disability pension scheme and certain management pension rights related to the wound up schemes and early retirement schemes.5) Leif Hejø Borge was President and CFO in Aker Solutions in first half 2014 (before the demerger). Karl-Erik Kjelstad was Head of Oilfield and Marine Assets in first half 2014 (before the demerger). Both were as of December 31, 2014 part of the management team in Akastor. The amounts in the 2014 table were for the full year.6) Variable pay includes deferred variable payments from previous years, which are paid out on the condition of continued employment7) See below for further description of principles for performance based remuneration.
Compensation to the executive management has a fixed element which includes a base salary which pursuant to the company’s benchmarking is competitive with other investment companies. In addition, the executive management has variable remuneration, as further described below. All variable pay shall be subject to a cap.
the salary figures for the remuneration for the executive management before the demerger in 2014 represents what is paid out in the period rather than what is expensed in the year, except for leif Hejø borge and Karl erik Kjelstad who continued in Akastor’s executive management. For the executive management of Akastor, the salary figures represent what has been expensed in the year.
Annual Report 2015 | Financials and Notes 77
Benefitsthe executive management participates in the standard employee, pension and insurance plan applicable to all employees in the company. no executive personnel in Akastor has performance based pension plans and there are no current loans, prepayments or other forms of credit from the company to its executive management. no members of the executive management are part of any option- or incentive programs other than what is described in this declaration.
Performance based remunerationIn addition to the fixed compensation set out above, the executive management participates in a variable pay program. the objective of the program is to incentivize the management to contribute to sound financial results for the company as well as executing leadership in accordance with the company’s values and business ethics. the variable pay program potential is maximized to 100 percent of the annual base salary. the payments under the variable pay program are determined based on three components:
�� Development of Akastor ASA’s share price
�� Delivery of certain key financial and operational targets for Akastor
�� Delivery of personal performance objectives during the year
For the Ceo, payments under the variable pay program are determined based on development of Akastor ASA’s share price alone. Since the variable pay program for the executive management is partly linked to the
development of the Akastor ASA share price, it requires approval by the general meeting and the guidelines will thereafter be binding.
Further, the executive management may be offered additional variable pay arrangements going forward which differs from the ordinary variable pay program described above. the variable pay arrangements offered to the executive management may in its entirety be linked to the development of the company’s share price. the executive management may from time to time be granted a discretionary variable pay. there was no discretionary pay expense in 2014 or 2015.
Share purchase program for Akastor’s executive management team the company has not carried out any standard share purchase programs for employees in 2015. However, the board resolved that Mr. Røkke could purchase up to 200 000 additional treasury shares on or about after 20 trading days following his employment in Akastor. the shares were bought by Mr. Røkke’s wholly owned subsidiary Riverrun Capital Management AS on September 7, 2015, at the price of noK 10.8055 per share (equivalent with the average share price for the first 20 days of trading following his first day of employment on August 10, 2015, less a discount of 20 percent). the shares are subject to a three-year lock-up period under which the acquired shares may not be sold or otherwise disposed of.
Directors’ and executive management’s shareholdingthe following number of shares is owned by the directors and the members of the executive management (and their related parties) as of December 31:
Job title 2015 2014
Kristian Monsen Røkke Ceo 200 000 -leif Hejø borge CFo 142 775 142 775Karl erik Kjelstad Investment Director 123 074 123 074paal e. Johnsen Investment Director - -Frank ove Reite Chairman 200 000 200 000lone Fønss Schrøder Deputy Chairman 4 400 4 400Kathryn baker Director - -Sarah Ryan Director - -Jannicke Sommer-ekelund Director 839 252Stig Faraas Director - -Asbjørn Michailoff pettersen Director 3 050 3 050
the overview includes only direct ownership of Akastor shares and does not include Øyvind eriksen and Kjell Inge Røkke’s indirect ownership through their ownership in Aker ASA.
Note 38 | subsequent events
Refinancingon March 11, 2016, Akastor ASA signed an agreement with its bank syndicate to amend and extend its current bank facilities until July 2019. the existing bank facilities, maturing 2017, will be replaced by a uSD 422.5 million reducing revolver facility (Facility A), maturing in July 2019. In addition, Akastor has reached an agreement with Dnb, nordea and Seb for a new noK 362.5 million revolving facility (Facility C) to mature in June 2017. the existing noK 2.0 billion revolving facility (Facility b) is still maturing on July 2019.
RestructuringIn February 2016, another 300 people were downsized in the norwegian entities of MHWirth. Similar processes have also been initiated in other countries in which MHWirth operates. Restructuring costs are expected to be incurred during 2016.
Annual Report 2015 | Financials and Notes 78
05.b. FInAnCIAlS AnD noteS
AKAsTOr AsA
Akastor ASA | Income statement 79Akastor ASA | Statement of financial position 80Akastor ASA | Statement of cash flow 81
note 1 | Accounting principles 82note 2 | operating revenue and expenses 83note 3 | net financial items 83note 4 | tax 84note 5 | Investments in group companies 84note 6 | Shareholders’ equity 84note 7 | Receivables and borrowings from group companies 85note 8 | other non-current interest-bearing receivables 85note 9 | borrowings 86note 10 | Guarantees 87note 11 | Financial risk management and financial instruments 88note 12 | Related parties 88note 13 | Shareholders 89note 14 | Subsequent events 89
fina
ncia
ls a
nd N
otes
| Ak
asto
r AsA

Annual Report 2015 | Financials and Notes 79
Amounts in NOK million Note 2015 2014
operating revenue 2 16 27operating expenses 2 (67) (109)Operating profit (loss) (52) (82)net financial items 3 (1 386) (38)profit (loss) before tax (1 437) (120)Income tax benefit (expense) 4 (23) 40profit (loss) for the period (1 461) (80)
Profit (loss) for the period distributed as followsother equity (1 461) (80)profit (loss) for the period (1 461) (80)
Akastor AsA | income statementfor the year ended December 31
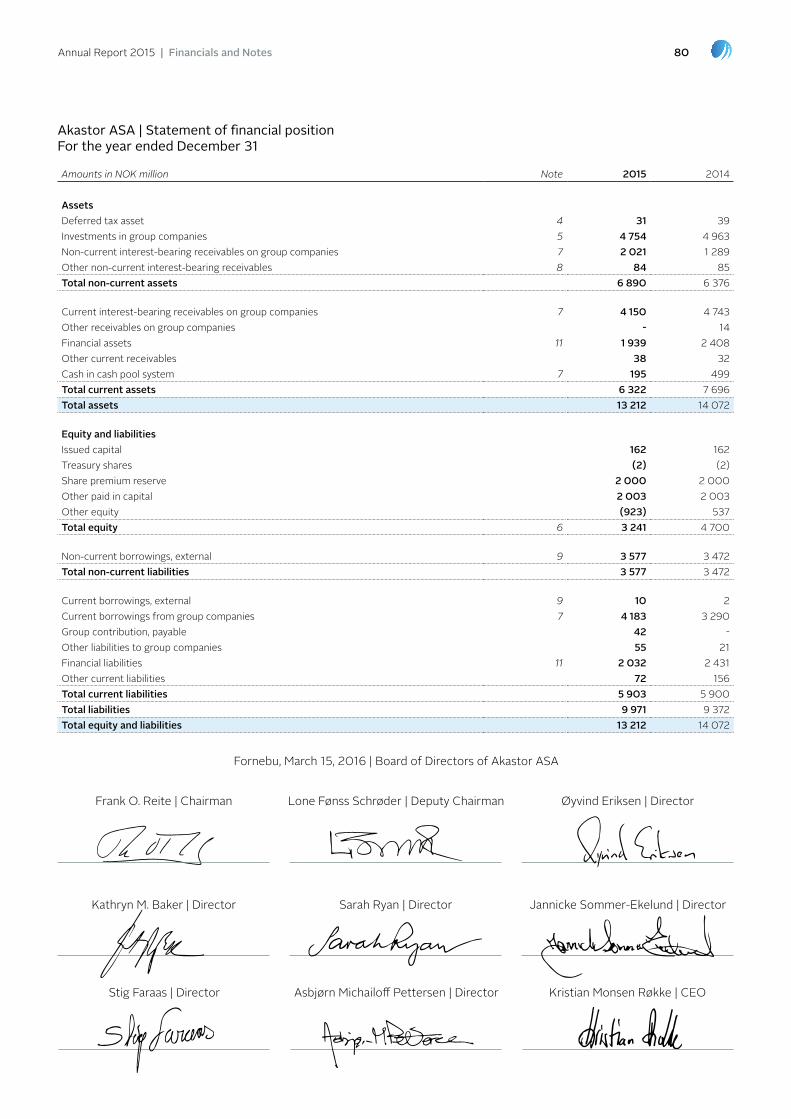
Annual Report 2015 | Financials and Notes 80
Amounts in NOK million Note 2015 2014
AssetsDeferred tax asset 4 31 39 Investments in group companies 5 4 754 4 963 non-current interest-bearing receivables on group companies 7 2 021 1 289 other non-current interest-bearing receivables 8 84 85 Total non-current assets 6 890 6 376
Current interest-bearing receivables on group companies 7 4 150 4 743 other receivables on group companies - 14 Financial assets 11 1 939 2 408 other current receivables 38 32 Cash in cash pool system 7 195 499 Total current assets 6 322 7 696 Total assets 13 212 14 072
Equity and liabilitiesIssued capital 162 162 treasury shares (2) (2)Share premium reserve 2 000 2 000 other paid in capital 2 003 2 003 other equity (923) 537 Total equity 6 3 241 4 700
non-current borrowings, external 9 3 577 3 472 Total non-current liabilities 3 577 3 472
Current borrowings, external 9 10 2 Current borrowings from group companies 7 4 183 3 290 Group contribution, payable 42 - other liabilities to group companies 55 21 Financial liabilities 11 2 032 2 431 other current liabilities 72 156 Total current liabilities 5 903 5 900 Total liabilities 9 971 9 372 Total equity and liabilities 13 212 14 072
Akastor AsA | statement of financial positionfor the year ended December 31
Fornebu, March 15, 2016 | board of Directors of Akastor ASA
Kristian Monsen Røkke | Ceo
Frank o. Reite | Chairman
Kathryn M. baker | Director
Stig Faraas | Director
lone Fønss Schrøder | Deputy Chairman
Sarah Ryan | Director
Asbjørn Michailoff pettersen | Director
Øyvind eriksen | Director
Jannicke Sommer-ekelund | Director
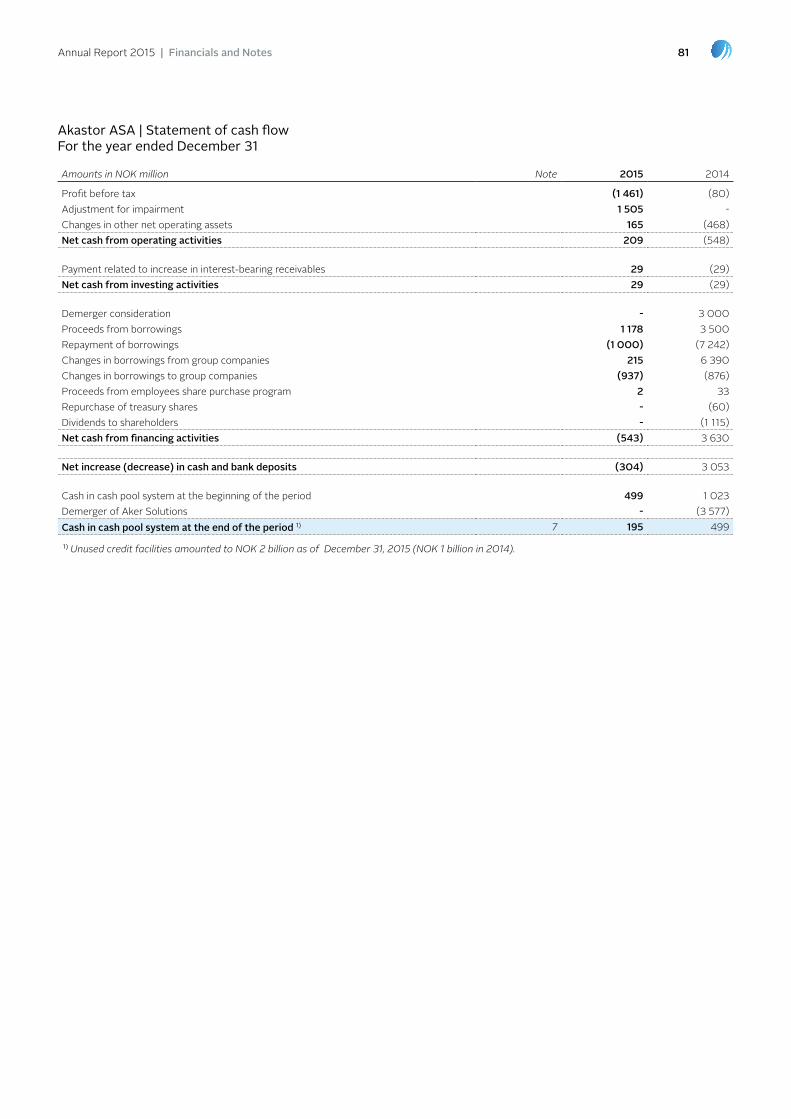
Annual Report 2015 | Financials and Notes 81
Amounts in NOK million Note 2015 2014
profit before tax (1 461) (80)Adjustment for impairment 1 505 -Changes in other net operating assets 165 (468)Net cash from operating activities 209 (548)
payment related to increase in interest-bearing receivables 29 (29)Net cash from investing activities 29 (29)
Demerger consideration - 3 000 proceeds from borrowings 1 178 3 500 Repayment of borrowings (1 000) (7 242)Changes in borrowings from group companies 215 6 390 Changes in borrowings to group companies (937) (876)proceeds from employees share purchase program 2 33 Repurchase of treasury shares - (60)Dividends to shareholders - (1 115)Net cash from financing activities (543) 3 630
Net increase (decrease) in cash and bank deposits (304) 3 053
Cash in cash pool system at the beginning of the period 499 1 023 Demerger of Aker Solutions - (3 577)cash in cash pool system at the end of the period 1) 7 195 499
1) Unused credit facilities amounted to NOK 2 billion as of December 31, 2015 (NOK 1 billion in 2014).
Akastor AsA | statement of cash flowfor the year ended December 31
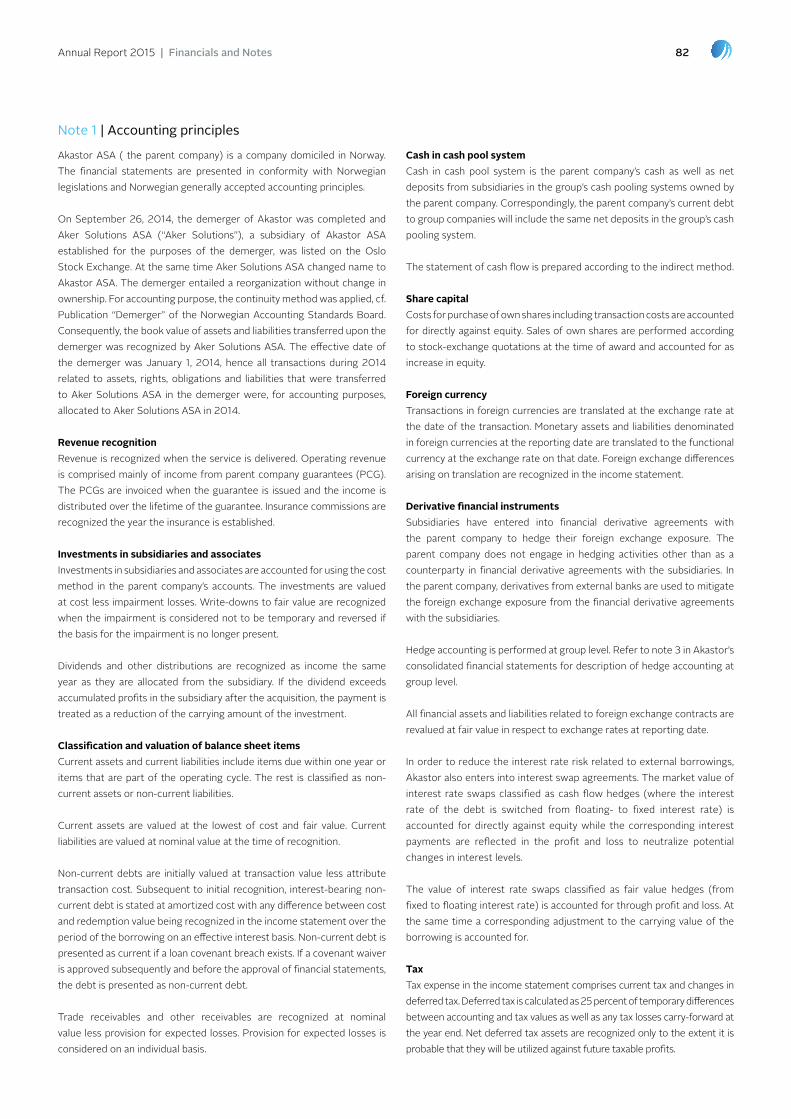
Annual Report 2015 | Financials and Notes 82
Akastor ASA ( the parent company) is a company domiciled in norway. the financial statements are presented in conformity with norwegian legislations and norwegian generally accepted accounting principles.
on September 26, 2014, the demerger of Akastor was completed and Aker Solutions ASA (“Aker Solutions”), a subsidiary of Akastor ASA established for the purposes of the demerger, was listed on the oslo Stock exchange. At the same time Aker Solutions ASA changed name to Akastor ASA. the demerger entailed a reorganization without change in ownership. For accounting purpose, the continuity method was applied, cf. publication “Demerger” of the norwegian Accounting Standards board. Consequently, the book value of assets and liabilities transferred upon the demerger was recognized by Aker Solutions ASA. the effective date of the demerger was January 1, 2014, hence all transactions during 2014 related to assets, rights, obligations and liabilities that were transferred to Aker Solutions ASA in the demerger were, for accounting purposes, allocated to Aker Solutions ASA in 2014.
Revenue recognitionRevenue is recognized when the service is delivered. operating revenue is comprised mainly of income from parent company guarantees (pCG). the pCGs are invoiced when the guarantee is issued and the income is distributed over the lifetime of the guarantee. Insurance commissions are recognized the year the insurance is established.
Investments in subsidiaries and associatesInvestments in subsidiaries and associates are accounted for using the cost method in the parent company’s accounts. the investments are valued at cost less impairment losses. Write-downs to fair value are recognized when the impairment is considered not to be temporary and reversed if the basis for the impairment is no longer present.
Dividends and other distributions are recognized as income the same year as they are allocated from the subsidiary. If the dividend exceeds accumulated profits in the subsidiary after the acquisition, the payment is treated as a reduction of the carrying amount of the investment.
Classification and valuation of balance sheet itemsCurrent assets and current liabilities include items due within one year or items that are part of the operating cycle. the rest is classified as non-current assets or non-current liabilities.
Current assets are valued at the lowest of cost and fair value. Current liabilities are valued at nominal value at the time of recognition.
non-current debts are initially valued at transaction value less attribute transaction cost. Subsequent to initial recognition, interest-bearing non-current debt is stated at amortized cost with any difference between cost and redemption value being recognized in the income statement over the period of the borrowing on an effective interest basis. non-current debt is presented as current if a loan covenant breach exists. If a covenant waiver is approved subsequently and before the approval of financial statements, the debt is presented as non-current debt.
trade receivables and other receivables are recognized at nominal value less provision for expected losses. provision for expected losses is considered on an individual basis.
Cash in cash pool systemCash in cash pool system is the parent company’s cash as well as net deposits from subsidiaries in the group’s cash pooling systems owned by the parent company. Correspondingly, the parent company’s current debt to group companies will include the same net deposits in the group’s cash pooling system.
the statement of cash flow is prepared according to the indirect method.
Share capitalCosts for purchase of own shares including transaction costs are accounted for directly against equity. Sales of own shares are performed according to stock-exchange quotations at the time of award and accounted for as increase in equity.
Foreign currencytransactions in foreign currencies are translated at the exchange rate at the date of the transaction. Monetary assets and liabilities denominated in foreign currencies at the reporting date are translated to the functional currency at the exchange rate on that date. Foreign exchange differences arising on translation are recognized in the income statement.
Derivative financial instrumentsSubsidiaries have entered into financial derivative agreements with the parent company to hedge their foreign exchange exposure. the parent company does not engage in hedging activities other than as a counterparty in financial derivative agreements with the subsidiaries. In the parent company, derivatives from external banks are used to mitigate the foreign exchange exposure from the financial derivative agreements with the subsidiaries.
Hedge accounting is performed at group level. Refer to note 3 in Akastor’s consolidated financial statements for description of hedge accounting at group level.
All financial assets and liabilities related to foreign exchange contracts are revalued at fair value in respect to exchange rates at reporting date.
In order to reduce the interest rate risk related to external borrowings, Akastor also enters into interest swap agreements. the market value of interest rate swaps classified as cash flow hedges (where the interest rate of the debt is switched from floating- to fixed interest rate) is accounted for directly against equity while the corresponding interest payments are reflected in the profit and loss to neutralize potential changes in interest levels.
the value of interest rate swaps classified as fair value hedges (from fixed to floating interest rate) is accounted for through profit and loss. At the same time a corresponding adjustment to the carrying value of the borrowing is accounted for.
Taxtax expense in the income statement comprises current tax and changes in deferred tax. Deferred tax is calculated as 25 percent of temporary differences between accounting and tax values as well as any tax losses carry-forward at the year end. net deferred tax assets are recognized only to the extent it is probable that they will be utilized against future taxable profits.
Note 1 | Accounting principles

Annual Report 2015 | Financials and Notes 83
Note 2 | Operating revenue and expenses
Note 3 | Net financial items
operating revenue comprises mainly noK 12 million in income from parent company guarantees (noK 18 million in 2014) and noK 4 million in insurance commissions from group companies (noK 9 million in 2014). Income from parent company guarantees includes noK 0.1 million from external companies (noK 8 million in 2014).
there are no employees in Akastor ASA and hence no salary or pension related costs and also no loan or guarantees related to the executive management team. Group management and corporate staff are employed by other Akastor companies and costs for their services as well as other parent company costs are charged to Akastor ASA. Remuneration to and shareholding of managing director is described in note 37 Management remunerations in Akastor’s consolidated financial statements.
Amounts in NOK million Note 2015 2014
Interest income from group companies 336 255 Interest expense to group companies (8) (27)Net interest group companies 328 228
Interest income from related parties 4 5Net interest related parties 4 5
Interest income 12 27 Interest expense (211) (298)Net interest external (199) (271)
Impairment of loans to group companies 7 (1 265) - Impairment of shares 5 (240) -other financial income 19 - other financial expense (1) (12)Foreign exchange gain 261 324 Foreign exchange loss (294) (312)Net other financial items (1 519) - Net financial items (1 386) (38)
fees to the auditorsAmounts in NOK million 2015 2014
Audit 2 4other assurance services 1) - 18other non-audit services - 1Total 2 231) NOK 18 million in 2014 related to services provided related to the demerger of the group. The amount was recharged to Aker Solutions.
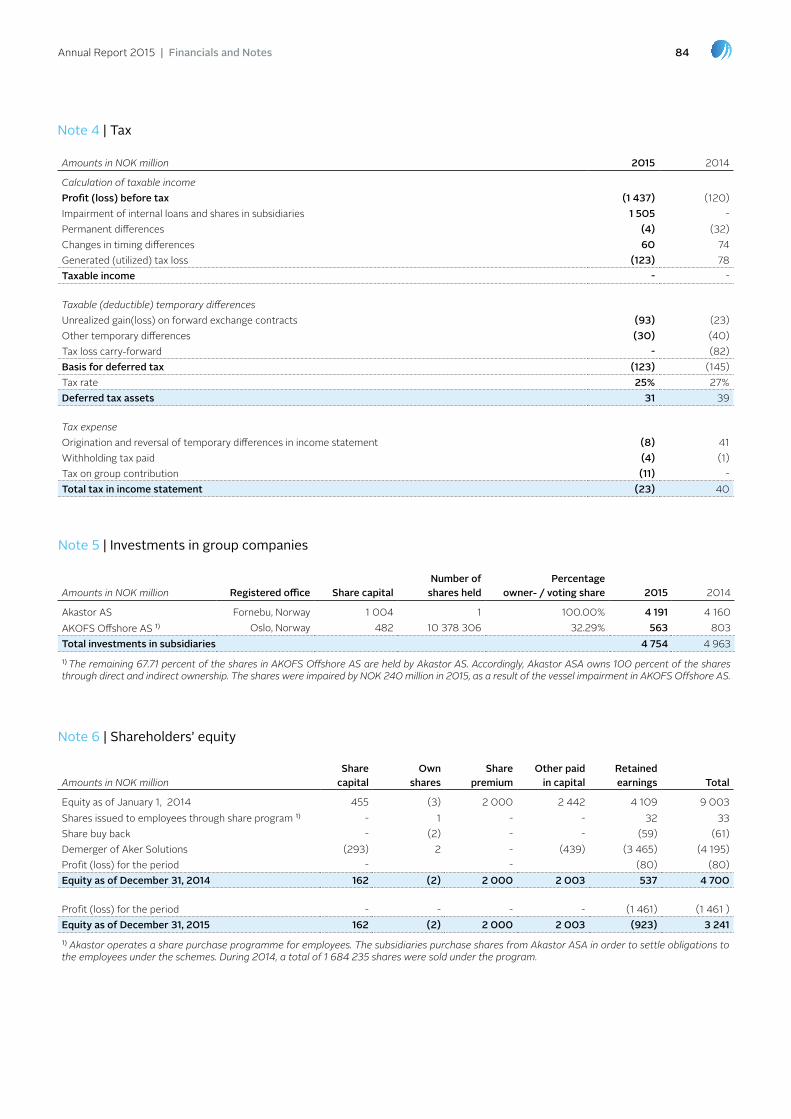
Annual Report 2015 | Financials and Notes 84
Note 4 | Tax
Amounts in NOK million 2015 2014
Calculation of taxable incomeprofit (loss) before tax (1 437) (120)Impairment of internal loans and shares in subsidiaries 1 505 - permanent differences (4) (32)Changes in timing differences 60 74 Generated (utilized) tax loss (123) 78Taxable income - -
Taxable (deductible) temporary differencesunrealized gain(loss) on forward exchange contracts (93) (23)other temporary differences (30) (40)tax loss carry-forward - (82)Basis for deferred tax (123) (145)tax rate 25% 27%Deferred tax assets 31 39
Tax expenseorigination and reversal of temporary differences in income statement (8) 41Withholding tax paid (4) (1)tax on group contribution (11) - Total tax in income statement (23) 40
Note 5 | investments in group companies
Amounts in NOK million Registered office share capitalNumber of
shares heldpercentage
owner- / voting share 2015 2014
Akastor AS Fornebu, norway 1 004 1 100.00% 4 191 4 160AKoFS offshore AS 1) oslo, norway 482 10 378 306 32.29% 563 803Total investments in subsidiaries 4 754 4 963 1) The remaining 67.71 percent of the shares in AKOFS Offshore AS are held by Akastor AS. Accordingly, Akastor ASA owns 100 percent of the shares through direct and indirect ownership. The shares were impaired by NOK 240 million in 2015, as a result of the vessel impairment in AKOFS Offshore AS.
Note 6 | shareholders’ equity
Amounts in NOK millionshare
capitalOwn
sharesshare
premiumOther paid
in capitalRetained earnings Total
equity as of January 1, 2014 455 (3) 2 000 2 442 4 109 9 003 Shares issued to employees through share program 1) - 1 - - 32 33 Share buy back - (2) - - (59) (61) Demerger of Aker Solutions (293) 2 - (439) (3 465) (4 195) profit (loss) for the period - - (80) (80) Equity as of December 31, 2014 162 (2) 2 000 2 003 537 4 700
profit (loss) for the period - - - - (1 461) (1 461 )Equity as of December 31, 2015 162 (2) 2 000 2 003 (923) 3 241 1) Akastor operates a share purchase programme for employees. The subsidiaries purchase shares from Akastor ASA in order to settle obligations to the employees under the schemes. During 2014, a total of 1 684 235 shares were sold under the program.

Annual Report 2015 | Financials and Notes 85
Note 7 | receivables and borrowings from group companies
Amounts in NOK million 2015 2014
Group companies deposits in the cash pool system 3 102 2 760
Group companies borrowings in the cash pool system (410) (280)
Akastor ASA's net borrowings in the cash pool system (2 497) (1 981)
cash in cash pool system 195 499
Current interest-bearing receivables on group companies 4 150 4 743
non-current interest-bearing receivables on group companies 2 021 1 289
Current borrowings from group companies (4 183) (3 290)
Net interest-bearing receivables on group companies 1 988 2 742
Interest-bearing receivables on and borrowings from group companiesAkastor ASA is the group’s central treasury function and enters into borrowings and deposit agreements with group companies. Deposits and borrowings are done at market terms and are dependent of the group companies’ credit rating and the duration of the borrowings.
In 2015, an impairment of noK 1.3 billion is recognized related to interest-bearing receivables on group companies. the impairment is mainly related to receivables on Step oiltools, MHWirth Inc and Mpo.
All current receivables and borrowings are due within one year.
Akastor ASA has an obligation to fund Step oiltools b.V with an amount up to uSD 107 million (out of which uSD 95 million was drawn by end of 2015). Any loans under this agreement shall be repaid no later than December 31, 2017.
Cash pool arrangementAkastor ASA is the owner of the cash pool system arrangements with Dnb, nordea and the Royal bank of Scotland. the cash pool systems cover a majority of the group geographically and assure good control and access to the group’s cash. participation in the cash pool is vested in the group’s policy and decided by each company’s board of directors and confirmed by a statement of participation. the participants in the cash pool system are jointly and severally liable and it is therefore important that Akastor as a group is financially viable and can repay deposits and carry out transactions. Any debit balance on a sub account can be set-off against any credit balance. A debit balance does hence represent a claim on Akastor ASA and a credit balance a borrowing from Akastor ASA.
the cash pool systems were showing a net balance of noK 195 million per December 31, 2015. this amount is reported in Akastor ASA’s accounts as short term borrowings from group companies and as cash in cash pool system.
on September 28, 2014, the demerger of Akastor was completed, refer to note 1 Accounting principles. An allocation of the share capital was determined, after deducting the value of Akastor’s treasury shares, such that 35 percent of the share capital was allocated to Akastor and 65 percent was allocated to Aker Solutions giving a split ratio of 35:65 percent. Following the demerger, Aker Solutions ASA issued pro rata consideration shares to Akastor’s shareholders and was listed on the oslo Stock exchange on September 29, 2014.
the share capital of Akastor ASA is divided into 274 000 000 shares with a nominal value of noK 0.592. the shares can be freely traded. An overview of the company’s largest shareholders is to be found in note 13 Shareholders.
the number of own shares held by the end of 2015 are 2 776 376 and are held for the purpose of being used for future awards under any share purchase program for employees, as settlement in future corporate acquisitions or for other purpose as decided by the board of directors.
Note 8 | Other non-current interest-bearing receivables
Amounts in NOK million 2015 2014
loan to DoF Deepwater AS (related party to Akastor) 82 83
Stiftelsen Akastor Kompensasjonsordning 2 2
Total other non-current interest-bearing receivables 84 85

Annual Report 2015 | Financials and Notes 86
Note 9 | Borrowings
Amounts in million currency
Nominal currency
value
carrying amount
(NOK)Interest
rateInterest margin
Interest coupon maturity Interest terms
2015Revolving credit facility (noK 2 000 million) 3) noK - (10) 1.00 % 1.90 % 2.90 % July 2017 2) IboR + variable margin 1)
term loan noK 2 500 2 491 1.20 % 1.80 % 3.00 % July 2019 2) IboR 3M+fixed margin
term loan uSD 125 1 096 0.48 % 1.60 % 2.08 % January 2017 2) IboR 3M+fixed margin
Accrued interest 10
Total borrowings 3 587
Current borrowings 10
non-current borrowings 3 577
Total borrowings 3 587
Amounts in million currency
Nominal currency
value
carrying amount
(NOK)Interest
rateInterest margin
Interest coupon maturity Interest terms
2014
Revolving credit facility (noK 2 000 million)3) noK 1 000 987 1.48% 1.60% 3.08% July 2017 IboR + variable margin 1)
term loan noK 2 500 2 485 1.48% 1.40% 2.88% July 2019 IboR 3M+fixed margin
Accrued interest 2
Total borrowings 3 474
Current borrowings 2
non-current borrowings 3 472
Total borrowings 3 474
1) The margin applicable to the facility is decided by a price grid based on the gearing ratio and level of utilization. Commitment fee is 40 percent of the margin.2) The maturity date reflects maturity date as defined in the loan agreements. See below for further description of covenant breach as of December 31, 2015. 3) Carrying amount of negative NOK 10 million in 2015 relates to issue costs. NOK 1 000 million in 2014 corresponds to the repayment of the drawn portion of the available NOK 2 000 million.
Borrowings under the new agreement:
size margin maturity
Revolving credit facility uSD 422.5 million 1.65%-4.50% July 2019
Revolving credit facility noK 2 000 million 1.65%-4.50% July 2019
Revolving credit facility noK 362.5 million 1.65%-4.50% June 2017
All facilities are provided by a bank syndicate consisting of high quality nordic and international banks. the terms and conditions include restrictions which are customary for this kind of facility, including inter alia negative pledge provisions and restrictions on acquisitions, disposals and mergers. there are also certain changes of control provisions included. the facility includes no dividend restrictions and is unsecured.
the financial covenants are based on two sets of key financial ratios; a gearing ratio based on net debt/equity and an interest coverage ratio
(ICR) based on ebItDA/net finance costs. the financial covenants are tested on a quarterly basis. the gearing ratio should not be higher than 1 and the interest ratio coverage should not be less than 4.0 calculated from the consolidated ebItDA to consolidated net Finance Cost. As of December 31, 2015, the ICR level was below the minimum level. on March 11, 2016, Akastor signed an agreement with its bank syndicate to amend and extend its financing structure, including new ICR-levels from Q4 2015 until Q1 2017.
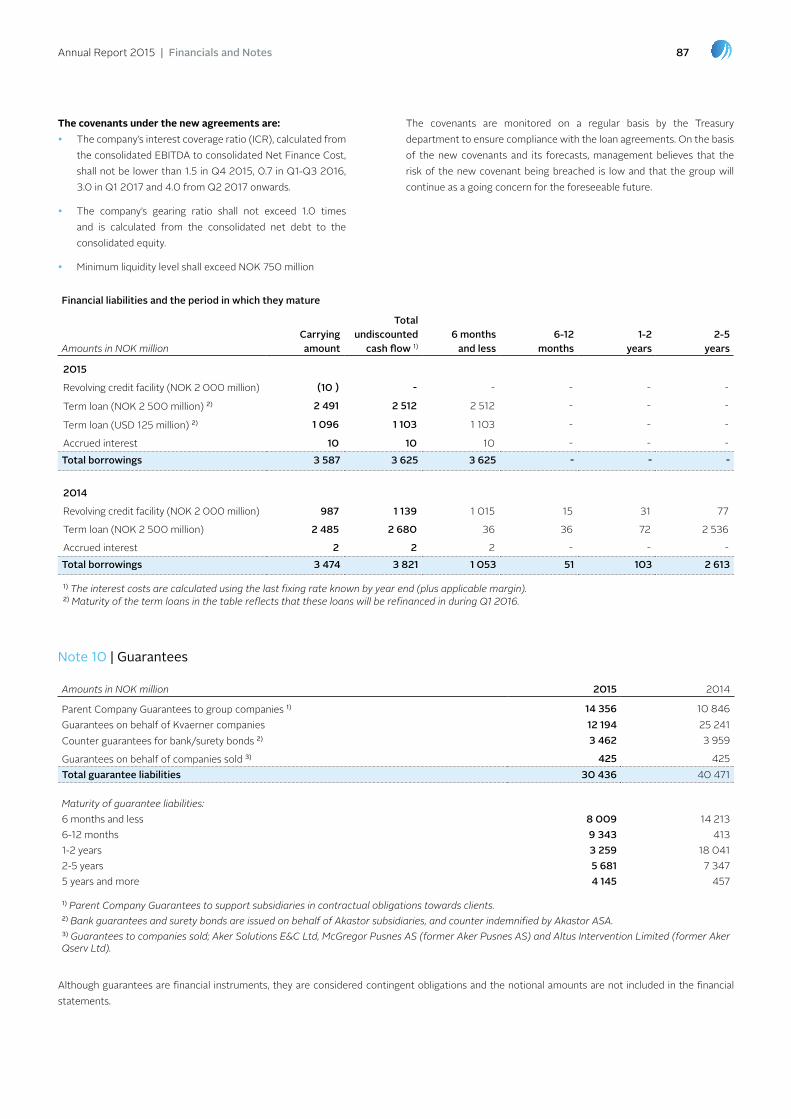
Annual Report 2015 | Financials and Notes 87
financial liabilities and the period in which they mature
Amounts in NOK millioncarrying amount
Total undiscounted
cash flow 1)6 months
and less6-12
months1-2
years2-5
years
2015
Revolving credit facility (noK 2 000 million) (10 ) - - - - -
term loan (noK 2 500 million) 2) 2 491 2 512 2 512 - - -
term loan (uSD 125 million) 2) 1 096 1 103 1 103 - - -
Accrued interest 10 10 10 - - - Total borrowings 3 587 3 625 3 625 - - -
2014
Revolving credit facility (noK 2 000 million) 987 1 139 1 015 15 31 77
term loan (noK 2 500 million) 2 485 2 680 36 36 72 2 536
Accrued interest 2 2 2 - - - Total borrowings 3 474 3 821 1 053 51 103 2 613
1) The interest costs are calculated using the last fixing rate known by year end (plus applicable margin).2) Maturity of the term loans in the table reflects that these loans will be refinanced in during Q1 2016.
The covenants under the new agreements are:�� the company’s interest coverage ratio (ICR), calculated from
the consolidated ebItDA to consolidated net Finance Cost, shall not be lower than 1.5 in Q4 2015, 0.7 in Q1-Q3 2016, 3.0 in Q1 2017 and 4.0 from Q2 2017 onwards.
�� the company’s gearing ratio shall not exceed 1.0 times and is calculated from the consolidated net debt to the consolidated equity.
�� Minimum liquidity level shall exceed noK 750 million
the covenants are monitored on a regular basis by the treasury department to ensure compliance with the loan agreements. on the basis of the new covenants and its forecasts, management believes that the risk of the new covenant being breached is low and that the group will continue as a going concern for the foreseeable future.
Amounts in NOK million 2015 2014
parent Company Guarantees to group companies 1) 14 356 10 846 Guarantees on behalf of Kvaerner companies 12 194 25 241 Counter guarantees for bank/surety bonds 2) 3 462 3 959
Guarantees on behalf of companies sold 3) 425 425 Total guarantee liabilities 30 436 40 471
Maturity of guarantee liabilities:6 months and less 8 009 14 213 6-12 months 9 343 413 1-2 years 3 259 18 041 2-5 years 5 681 7 347 5 years and more 4 145 457
1) Parent Company Guarantees to support subsidiaries in contractual obligations towards clients.2) Bank guarantees and surety bonds are issued on behalf of Akastor subsidiaries, and counter indemnified by Akastor ASA.3) Guarantees to companies sold; Aker Solutions E&C Ltd, McGregor Pusnes AS (former Aker Pusnes AS) and Altus Intervention Limited (former Aker Qserv Ltd).
Note 10 | guarantees
Although guarantees are financial instruments, they are considered contingent obligations and the notional amounts are not included in the financial statements.
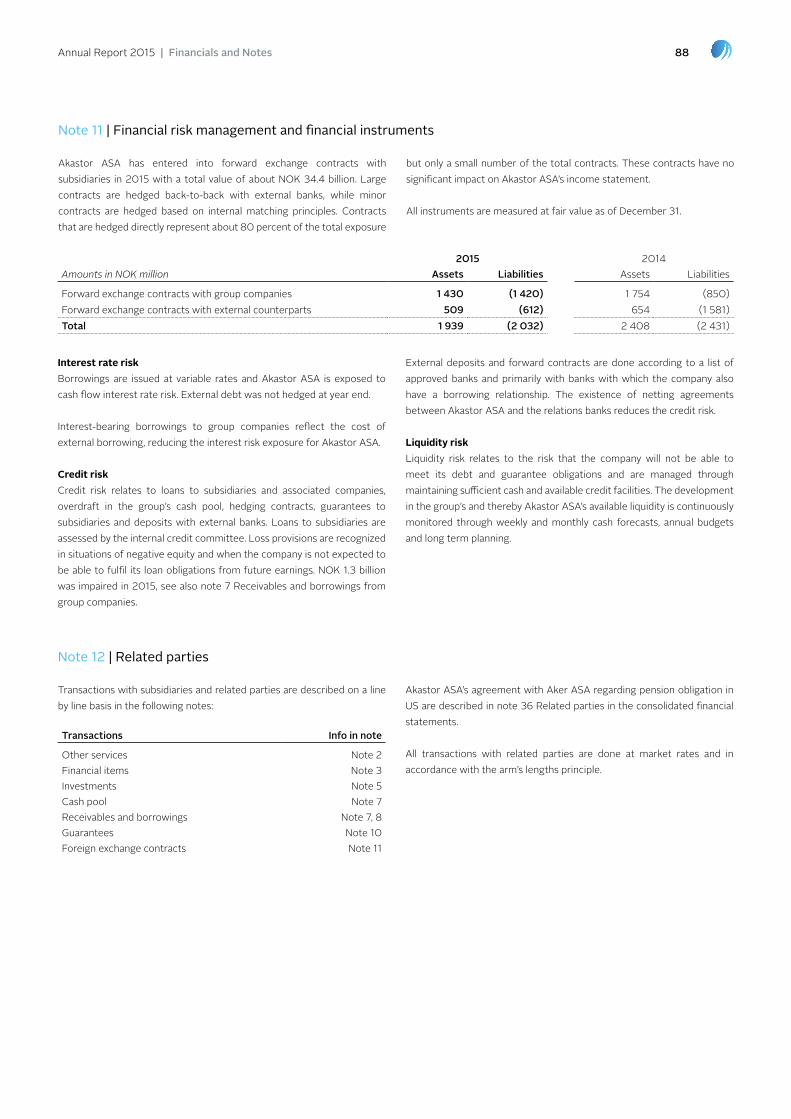
Annual Report 2015 | Financials and Notes 88
Transactions Info in note
other services note 2Financial items note 3Investments note 5Cash pool note 7Receivables and borrowings note 7, 8Guarantees note 10Foreign exchange contracts note 11
2015 2014Amounts in NOK million Assets liabilities Assets liabilities
Forward exchange contracts with group companies 1 430 (1 420) 1 754 (850)Forward exchange contracts with external counterparts 509 (612) 654 (1 581)Total 1 939 (2 032) 2 408 (2 431)
Note 12 | related parties
Akastor ASA has entered into forward exchange contracts with subsidiaries in 2015 with a total value of about noK 34.4 billion. large contracts are hedged back-to-back with external banks, while minor contracts are hedged based on internal matching principles. Contracts that are hedged directly represent about 80 percent of the total exposure
but only a small number of the total contracts. these contracts have no significant impact on Akastor ASA’s income statement.
All instruments are measured at fair value as of December 31.
Interest rate riskborrowings are issued at variable rates and Akastor ASA is exposed to cash flow interest rate risk. external debt was not hedged at year end.
Interest-bearing borrowings to group companies reflect the cost of external borrowing, reducing the interest risk exposure for Akastor ASA.
Credit riskCredit risk relates to loans to subsidiaries and associated companies, overdraft in the group’s cash pool, hedging contracts, guarantees to subsidiaries and deposits with external banks. loans to subsidiaries are assessed by the internal credit committee. loss provisions are recognized in situations of negative equity and when the company is not expected to be able to fulfil its loan obligations from future earnings. noK 1.3 billion was impaired in 2015, see also note 7 Receivables and borrowings from group companies.
external deposits and forward contracts are done according to a list of approved banks and primarily with banks with which the company also have a borrowing relationship. the existence of netting agreements between Akastor ASA and the relations banks reduces the credit risk.
Liquidity riskliquidity risk relates to the risk that the company will not be able to meet its debt and guarantee obligations and are managed through maintaining sufficient cash and available credit facilities. the development in the group’s and thereby Akastor ASA’s available liquidity is continuously monitored through weekly and monthly cash forecasts, annual budgets and long term planning.
Akastor ASA’s agreement with Aker ASA regarding pension obligation in uS are described in note 36 Related parties in the consolidated financial statements.
All transactions with related parties are done at market rates and in accordance with the arm’s lengths principle.
transactions with subsidiaries and related parties are described on a line by line basis in the following notes:
Note 11 | financial risk management and financial instruments
Annual Report 2015 | Financials and Notes 89
Refinancingon March 11, 2016, Akastor ASA signed an agreement with its bank syndicate to amend and extend its current bank facilities until July 2019. See note 9 borrowings for more information about the terms under the new agreement.
shareholders with more than 1 percent shareholding
company Note Nominee Number of shares held Ownership
2015Aker Kværner Holding AS 110 333 615 40.27 %Goldman Sachs & Co X 54 603 407 19.93 %euroclear bank S.A./n.V.('bA') X 30 067 853 10.97 %Aker ASA 23 331 762 8.52 %oDIn norge 7 840 060 2.86 %Morgan Stanley & Co X 4 830 268 1.76 %SIX SIS AG X 3 691 900 1.35 %Akastor ASA 6 2 776 376 1.01 %
2014Aker Kværner Holding AS 110 333 615 40.27%euroclear bank S.A./n.V.('bA') X 29 298 800 10.69%Goldman Sachs & Co X 23 800 654 8.69%Aker ASA 17 331 762 6.33%State Street bank & trust Co. X 15 251 004 5.57%JpMorgan Clearing Corp. X 5 614 319 2.05%Clearstream banking S.A. X 5 369 997 1.96%Folketrygdfondet 3 992 444 1.46%State Street bank & trust Co. X 3 774 066 1.38%SIX SIS AG X 3 697 815 1.35%oDIn norge 3 333 506 1.22%Akastor ASA 6 2 976 376 1.09%
Note 13 | shareholders
Note 14 | subsequent events
90Annual Report 2015 | Auditors report
06. AuDItoRS RepoRt
Audi
tors
repo
rt

91Annual Report 2015 | Auditors report
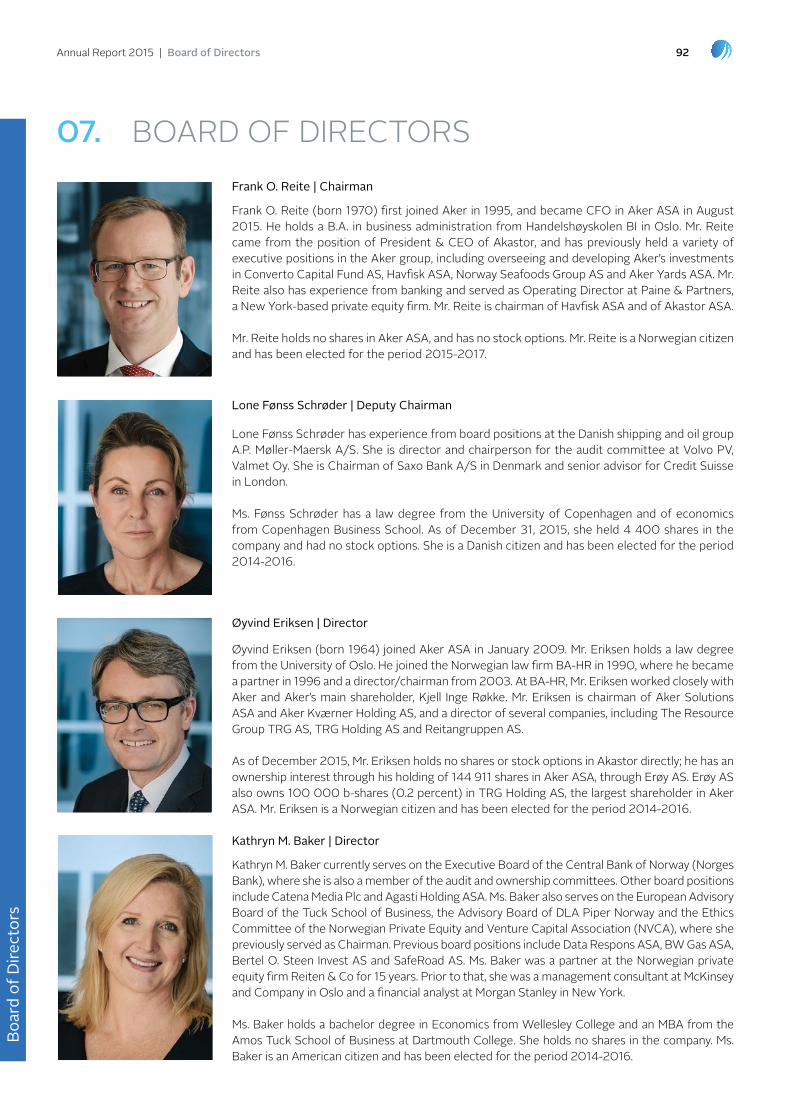
92
Øyvind eriksen | Director
Øyvind eriksen (born 1964) joined Aker ASA in January 2009. Mr. eriksen holds a law degree from the university of oslo. He joined the norwegian law firm bA-HR in 1990, where he became a partner in 1996 and a director/chairman from 2003. At bA-HR, Mr. eriksen worked closely with Aker and Aker’s main shareholder, Kjell Inge Røkke. Mr. eriksen is chairman of Aker Solutions ASA and Aker Kværner Holding AS, and a director of several companies, including the Resource Group tRG AS, tRG Holding AS and Reitangruppen AS.
As of December 2015, Mr. eriksen holds no shares or stock options in Akastor directly; he has an ownership interest through his holding of 144 911 shares in Aker ASA, through erøy AS. erøy AS also owns 100 000 b-shares (0.2 percent) in tRG Holding AS, the largest shareholder in Aker ASA. Mr. eriksen is a norwegian citizen and has been elected for the period 2014-2016.
Lone fønss schrøder | Deputy Chairman
lone Fønss Schrøder has experience from board positions at the Danish shipping and oil group A.p. Møller-Maersk A/S. She is director and chairperson for the audit committee at Volvo pV, Valmet oy. She is Chairman of Saxo bank A/S in Denmark and senior advisor for Credit Suisse in london.
Ms. Fønss Schrøder has a law degree from the university of Copenhagen and of economics from Copenhagen business School. As of December 31, 2015, she held 4 400 shares in the company and had no stock options. She is a Danish citizen and has been elected for the period 2014-2016.
Annual Report 2015 | Board of Directors
07. boARD oF DIReCtoRSfrank O. reite | Chairman
Frank o. Reite (born 1970) first joined Aker in 1995, and became CFo in Aker ASA in August 2015. He holds a b.A. in business administration from Handelshøyskolen bI in oslo. Mr. Reite came from the position of president & Ceo of Akastor, and has previously held a variety of executive positions in the Aker group, including overseeing and developing Aker’s investments in Converto Capital Fund AS, Havfisk ASA, norway Seafoods Group AS and Aker Yards ASA. Mr. Reite also has experience from banking and served as operating Director at paine & partners, a new York-based private equity firm. Mr. Reite is chairman of Havfisk ASA and of Akastor ASA.
Mr. Reite holds no shares in Aker ASA, and has no stock options. Mr. Reite is a norwegian citizen and has been elected for the period 2015-2017.
Kathryn m. Baker | Director
Kathryn M. baker currently serves on the executive board of the Central bank of norway (norges bank), where she is also a member of the audit and ownership committees. other board positions include Catena Media plc and Agasti Holding ASA. Ms. baker also serves on the european Advisory board of the tuck School of business, the Advisory board of DlA piper norway and the ethics Committee of the norwegian private equity and Venture Capital Association (nVCA), where she previously served as Chairman. previous board positions include Data Respons ASA, bW Gas ASA, bertel o. Steen Invest AS and SafeRoad AS. Ms. baker was a partner at the norwegian private equity firm Reiten & Co for 15 years. prior to that, she was a management consultant at McKinsey and Company in oslo and a financial analyst at Morgan Stanley in new York.
Ms. baker holds a bachelor degree in economics from Wellesley College and an MbA from the Amos tuck School of business at Dartmouth College. She holds no shares in the company. Ms. baker is an American citizen and has been elected for the period 2014-2016.
Boar
d of
Dire
ctor
s

93Annual Report 2015 | Board of Directors
sarah ryan | Director
Sarah Ryan is energy Advisor to earnest partners, a uS investment management firm, and a non-executive director of Woodside petroleum. Dr Ryan was investment director and equity analyst with earnest partners, and previous to that held various senior management, technical and operational roles with Schlumberger. Dr Ryan was also non-executive director of Aker Solutions.
Ms. Ryan holds a bSc in geology from the university of Melbourne, a bSc (Hons) in geophysics and a phD in petroleum geology and geophysics from the university of Adelaide. As of December 31, 2015, she held no shares in the company and had no stock options. Ms. Ryan is an Australian citizen. She has been elected for the period 2014-2016.
Jannicke sommer-ekelund | Director
Jannicke Sommer-ekelund is Senior Consultant and lead Auditor for supply chain support at MHWirth. Ms. Sommer-ekelund joined Aker Solutions in 2006 and worked as a senior consultant in procurement until 2012 when she moved to her current role. She holds exams in Mechanical engineering and personnel Management and organizational Development from the technology Agder Maritime College. Her background is from mechanical engineering, fabrication and supply chain in marine industry, onshore and offshore. Jannicke was a crew member on board the Mt/ polytrader in 1980 when the second cargo from the Statfjord A loading buoy was picked up and delivered to Mongstad.
As of December 31, 2015, she holds 839 shares in the company and no stock options. Ms. Sommer-ekelund is a norwegian citizen. She has been elected for the period 2014-2016.
stig faraas | Director
Stig Faraas works as SAp Masterdata Administrator at Frontica. He joined Aker Solutions in 1992. Mr. Faraas holds a certificate of apprenticeship in office and administration, Surface treatment and Security and Safety. As of December 31, 2015, he held no shares in the company and had no stock options. Mr. Faraas is a norwegian citizen. He has been elected for the period 2014-2017.
Asbjørn michailoff Pettersen | Director
Asbjørn pettersen currently works as package Responsible engineer in global projects at MHWirth. He began his career with the Aker group in 1983 when he joined Aker engineering where he held various positions until 1997. He joined Aker MH in 2007 after engagements with the Abb environment, including as project leader for one of the first steam power plants in the norwegian sector of the north Sea, and at Ge Healthcare’s lindesnes plant. Mr. pettersen holds a bSc in mechanical engineering from trondheim College of engineering. As of December 31, 2015, he held 3 050 shares in the company and had no stock options. Mr. pettersen is a norwegian citizen. He has been elected for the period 2014-2016.
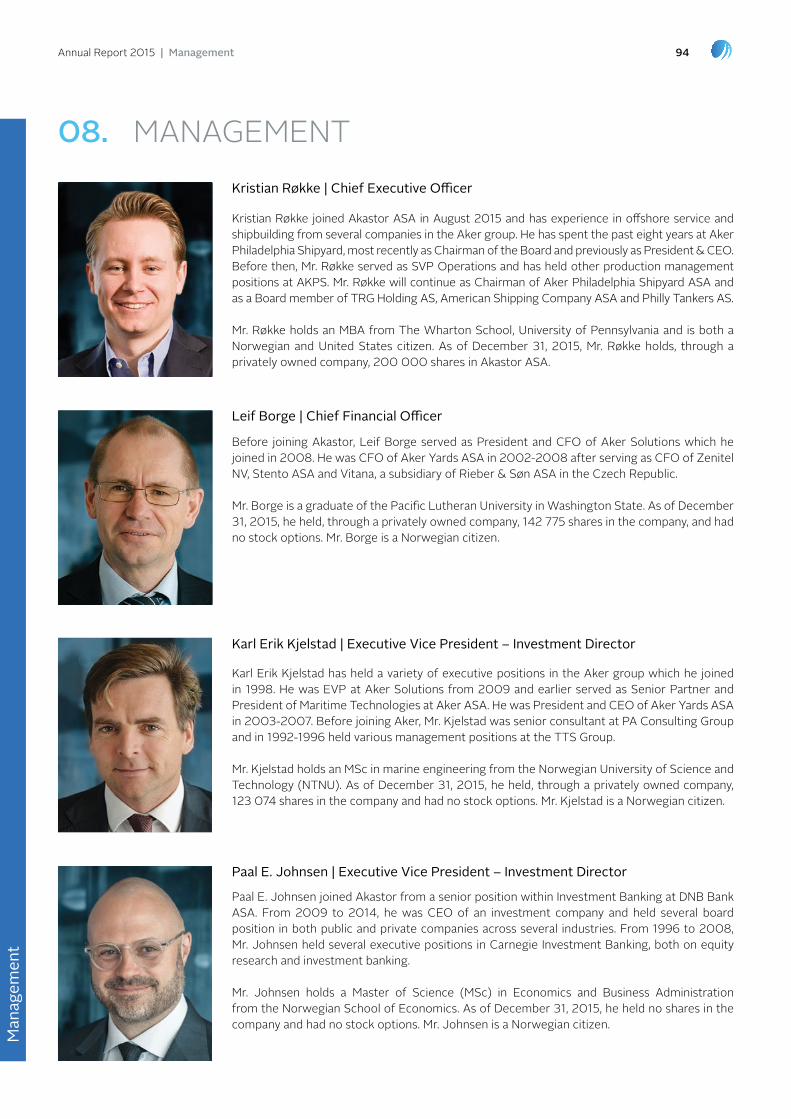
94Annual Report 2015 | management
08. MAnAGeMent
man
agem
ent
Karl erik Kjelstad | executive Vice President – investment Director
Karl erik Kjelstad has held a variety of executive positions in the Aker group which he joined in 1998. He was eVp at Aker Solutions from 2009 and earlier served as Senior partner and president of Maritime technologies at Aker ASA. He was president and Ceo of Aker Yards ASA in 2003-2007. before joining Aker, Mr. Kjelstad was senior consultant at pA Consulting Group and in 1992-1996 held various management positions at the ttS Group.
Mr. Kjelstad holds an MSc in marine engineering from the norwegian university of Science and technology (ntnu). As of December 31, 2015, he held, through a privately owned company, 123 074 shares in the company and had no stock options. Mr. Kjelstad is a norwegian citizen.
Leif Borge | Chief financial Officer
before joining Akastor, leif borge served as president and CFo of Aker Solutions which he joined in 2008. He was CFo of Aker Yards ASA in 2002-2008 after serving as CFo of Zenitel nV, Stento ASA and Vitana, a subsidiary of Rieber & Søn ASA in the Czech Republic.
Mr. borge is a graduate of the pacific lutheran university in Washington State. As of December 31, 2015, he held, through a privately owned company, 142 775 shares in the company, and had no stock options. Mr. borge is a norwegian citizen.
Kristian røkke | Chief executive Officer
Kristian Røkke joined Akastor ASA in August 2015 and has experience in offshore service and shipbuilding from several companies in the Aker group. He has spent the past eight years at Aker philadelphia Shipyard, most recently as Chairman of the board and previously as president & Ceo. before then, Mr. Røkke served as SVp operations and has held other production management positions at AKpS. Mr. Røkke will continue as Chairman of Aker philadelphia Shipyard ASA and as a board member of tRG Holding AS, American Shipping Company ASA and philly tankers AS.
Mr. Røkke holds an MbA from the Wharton School, university of pennsylvania and is both a norwegian and united States citizen. As of December 31, 2015, Mr. Røkke holds, through a privately owned company, 200 000 shares in Akastor ASA.
Paal e. Johnsen | executive Vice President – investment Director
paal e. Johnsen joined Akastor from a senior position within Investment banking at Dnb bank ASA. From 2009 to 2014, he was Ceo of an investment company and held several board position in both public and private companies across several industries. From 1996 to 2008, Mr. Johnsen held several executive positions in Carnegie Investment banking, both on equity research and investment banking.
Mr. Johnsen holds a Master of Science (MSc) in economics and business Administration from the norwegian School of economics. As of December 31, 2015, he held no shares in the company and had no stock options. Mr. Johnsen is a norwegian citizen.
95Annual Report 2015 | company information
09. CoMpAnY InFoRMAtIon
Contact Details
Akastor ASAAkastor ASA oksenøyveien 10, 1366 lysaker, norway po box 124, 1325 lysaker, norway +47 21 52 58 00 akastor.com
MHWirth butangen 20, 4639 Kristiansand, norway po box 413 lundsiden, 4604 Kristiansand, norway +47 38 05 70 00 mhwirth.com
AKOFS OffshoreKarenslyst Allé 57, 0277 oslo, norway po box 244, 0213 oslo, norway +47 23 08 44 00 akofsoffshore.com
FronticaSnarøyveien 36, 1364, Fornebu, norway po box 222, 1326 lysaker, norway +47 67 82 60 00 frontica.com
KOP Surface Products77 Science park Drive #04-01/07 Cintech 3 Singapore Science park, Singapore 118256 +65 68 80 97 40 kopsurfaceproducts.com
Fjords ProcessingSnarøyveien 36, 1364, Fornebu, norway po box 403, 1327 lysaker, norway +47 67 83 77 00 fjordsprocessing.com
First GeoJåttåvågveien 10, 4020 Stavanger, norway po box 289, 4066 Stavanger, norway +47 51 81 23 80 first-geo.com
Step OiltoolsMaskinveien 9, 4033 Stavanger, norway +47 95 72 84 76 stepoiltools.com
reports on the internet
the quarterly and annual reports of Akastor are available on the internet. Akastor encourages its shareholders to subscribe to the company’s annual reports via the electronic delivery system of the norwegian Central securities Depository (VpS). please note that VpS services (VpS Investortjenester) are designed primarily for norwegian shareholders. Subscribers to this service receive annual reports in pDF format by email. VpS distribution takes place at the same time as distribution of the printed version of Akastor’s annual report to shareholders who have requested it. Quarterly reports, which are generally only distributed electronically, are available on the company’s website and other sources. Shareholders who are unable to receive the electronic version of interim reports may subscribe to the printed version by contacting Akastor’s investor relations staff.
Copyright and legal notice
Copyright in all published material including photographs, drawings and images in this publication remains vested in Akastor and third party contributors to this publication as appropriate. Accordingly, neither the whole nor any part of this publication can be reproduced in any form without express prior permission. Articles and opinions appearing in this publication do not necessarily represent the views of Akastor. While all steps have been taken to ensure the accuracy of the published contents, Akastor does not accept any responsibility for any errors or resulting loss or damage whatsoever caused and readers have the responsibility to thoroughly check these aspects for themselves. enquiries about reproduction of content from this publication should be directed to Akastor ASA.
Design and layout: tania Goffredo | Photography: Front/back cover and pages 2&3, Rolf estensen Com
pany
info
rmat
ion