14
The Banking industry: On the move in 2015 North America | 2015
| Date post: | 15-Jul-2015 |
| Category: |
Economy & Finance |
| Upload: | jll |
| View: | 1,626 times |
| Download: | 1 times |

The
Banking
industry:
On the
move in
2015
North America | 2015

FinTech -
driving
growth
FinTech: term used to
describe the growing market
of financial services firms
whose product or service is
built upon technology.
The number of FinTech
companies has grown 26%
year-over-year and global
investment is on track to
reach $8 billion by 2018

Still feeling
the pain
from the
financial
crisis
Seven years later and global
banks are still feeling the pain
from the financial crisis.
In Q4 2014, a $4.4 billion
increase in litigation costs
contributed to a 7.3% decline
in total industry earnings
from the previous year.

An omni-
channel
banking
experience
Contrary to what you may
think, the bank branch is
not obsolete.
In fact, a 2014 survey by the
FDIC showed that 78.8% of
respondents used a bank
teller over the past year.
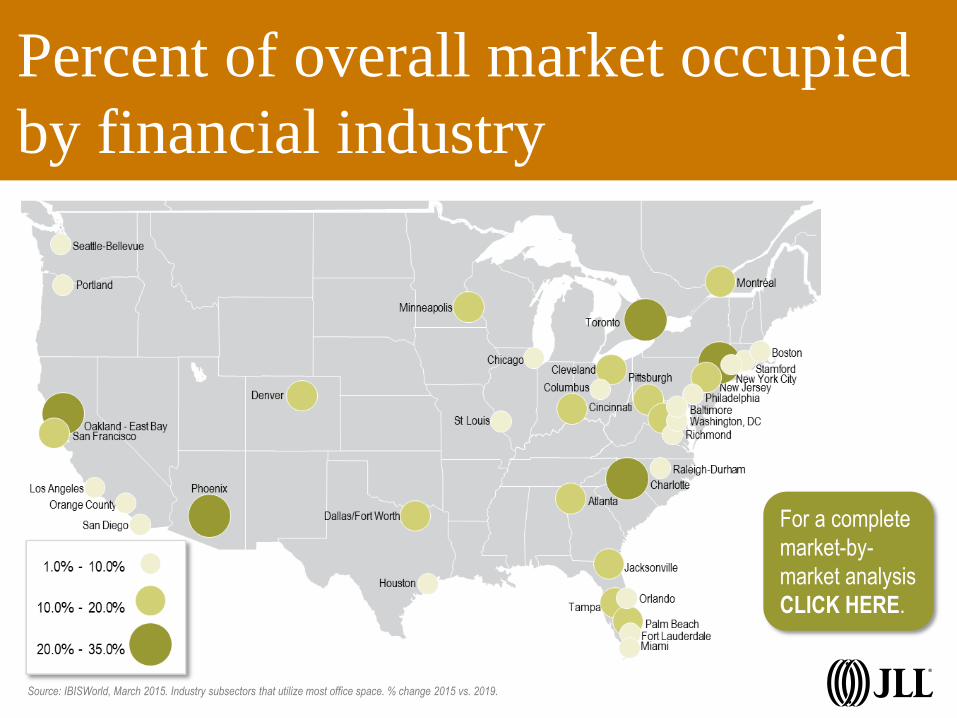
Percent of overall market occupied
by financial industry
Source: IBISWorld, March 2015. Industry subsectors that utilize most office space. % change 2015 vs. 2019.
For a complete
market-by-
market analysis
CLICK HERE.

Employment
picture
Job growth in
financial activities
is up 1.9 %
year-on-year,
3.7 % below
previous peak.
7,000
7,500
8,000
8,500
2005 2010 2015
Fin
anci
al s
ervi
ces
job
s (0
,000
)
Source: JLL Research, Bureau of Labor Statistics

Wage
growth
Since January
2010, financial
activities wages
have grown
43.5% faster
than average.
$600
$700
$800
$900
$1,000
$1,100
$1,200
2007 2008 2009 2010 2011 2012 2013 2014 2015
Ave
rag
e w
eekl
y w
age
Financial activities Total non-farm
+36.4%
Source: JLL Research, Bureau of Labor Statistics

Employment
picture
Salaries for
compliance
officers are
increasing as
demand for these
positions grows.
Mean annual wage for compliance
officers across industries:
$66,770 VS. Mean annual wage for financial
compliance officers:
$88,590-
$91,550 Source: JLL Research, Bureau of Labor Statistics

Financial corporate profits, are
hovering near record highs
-$100
$0
$100
$200
$300
$400
$500
$600
2001 2002 2003 2004 2005 2006 2007 2008 2009 2010 2011 2012 2013 2014
Fin
anci
al c
orp
ora
te p
rofi
ts (
$ b
illio
ns)
Source: JLL Research, Bureau of Economic Analysis

Net income, on the other hand, has
remained largely flat since early 2013
-$40,000
-$30,000
-$20,000
-$10,000
$0
$10,000
$20,000
$30,000
$40,000
$50,000
2001 2002 2003 2004 2005 2006 2007 2008 2009 2010 2011 2012 2013 2014
Ban
k n
et in
com
e ($
mill
ion
s)
Source: JLL Research, FDIC

On the
move
A study of 240
leases signed by
banks and financial
services firms during
the second half of
2014 revealed a shift
away from renewals
with 45.7% of
companies relocating.
RENEWAL
RELOCATION
NEW TO MARKET
EXPANSION
Banks and Financial services are on the move.

Still
shrinking
In 2013, the
average lease size
among banks and
financial services
firms was 52,356
square feet. In
2014, the average
lease was 44,768
square feet. -14.5%

Largest office-using segments of the industry
spend up to five times more on rent and utilities
0.0%
2.0%
4.0%
6.0%
8.0%
10.0%
12.0%
CommercialBanking
Private Equity,Hedge Funds &
InvestmentVehicles
InvestmentBanking
Credit CardIssuing
PortfolioManagement
Real Estate Loans& Collateralized
Debt
% s
pen
d o
n r
ent
and
uti
litie
s
Source: JLL Research, IBIS World
Overall
industry
average: 2.3%

© Copyright 2015 Jones Lang LaSalle
If you enjoyed this preview, may also like to see an interactive map
comparing financial services markets across North America, and
our complete 2015 North American Banking Outlook.
>>> Click here to check them out.
Or, for more information, contact:
Lauren Picariello
Director of Industry Research – Americas
+1 617 531 4208
Thomas Forr
National Research Coordinator – Canada
+1 416 304 6047


