40
| | © Flughafen Zürich AG 2015 FULL YEAR FINANCIAL RESULTS PRESENTATION TO INVESTORS & ANALYSTS Chief Executive Officer Stephan Widrig Chief Financial Officer Daniel Schmucki
| | © Flughafen Zürich AG
03/11/2016 1 2015 full year financial results
2015 FULL YEAR FINANCIAL RESULTS PRESENTATION TO INVESTORS & ANALYSTS
Chief Executive Officer Stephan Widrig
Chief Financial Officer
Daniel Schmucki
| | © Flughafen Zürich AG © Flughafen Zürich AG
1. Overview 2015
2. Financial performance 2015
3. Business outlook
4. Capital management
5. Q&A
SCHEDULE
03/11/2016 2015 full year financial results 2

| | © Flughafen Zürich AG
1. OVERVIEW 2015
3 2015 full year financial results 03/11/2016

| | © Flughafen Zürich AG
TRAFFIC FIGURES 2015
2015 full year financial results 4 03/11/2016
in millionJan-Dec 2015 Jan-Dec 2014
Local passengers 18.7 17.7 ██████ + 6.0%
Transfer passengers 7.5 7.7 -3.3% ███
Transfer share (in %) 28.5 30.3 -5.9% █████
Total passengers 26.3 25.5 ███ + 3.2%
Movements (in 1'000) 265.1 265.0 + 0.0%
whereof line & charter movements 231.1 230.7 + 0.2%
Cargo (in 1'000 tons) 411.8 429.8 -4.2% ████
∆ (in %)

| | © Flughafen Zürich AG
• higher aviation and non-aviation revenue
• strong local passenger development
• stable commercial revenues despite strong CHF
• strict cost control
• increase in profit excluding one-off effects by 4.6%
• three one-off effects to be considered:
• establishment of the co-ownership structure «The
Circle»
+ CHF 34.6 million
• provision for extended sound insulation program
- CHF 97.1 million
• adjustments to the employee benefit plan
+ CHF 17.9 million
SOLID OPERATING PERFORMANCE AND INCREASED OPERATING PROFIT
03/11/2016 2015 full year financial results 5

| | © Flughafen Zürich AG
2. FINANCIAL PERFORMANCE 2015
6 2015 full year financial results 03/11/2016

| | © Flughafen Zürich AG
FINANCIAL KEY FIGURES INCLUDING NOISE
2015 full year financial results 7 03/11/2016
* excluding one-off effects
in million CHF Jan-Dec 2015 Jan-Dec 2015* Jan-Dec 2014
Aviation revenue 597.4 597.4 575.0 ███ + 3.9%
Non-aviation revenue 391.6 391.6 388.5 + 0.8%
Revenue 989.0 989.0 963.5 ██ + 2.6%
EBITDA 502.8 547.5 523.5 ████ + 4.6%
EBITDA margin (in %) 50.8 55.4 54.3
EBIT 274.6 319.3 294.6 ██████ + 8.4%
EBIT margin (in %) 27.8 32.3 30.6
Finance result (net) -37.4 -37.4 -33.8 ███████ + 10.5%
Profit 179.8 215.3 205.9 ████ + 4.6%
Interest-bearing liabilities (net) 174.7 174.7 372.2 n/a
Cash flow from operating activities 456.2 456.2 460.7 -1.0%
CAPEX (incl. Circle) 199.7 199.7 254.1 -21.4% ████████
EpS (in CHF) 29.3 35.1 33.5 ████ + 4.6%
∆ (in %)

| | © Flughafen Zürich AG
FINANCIAL KEY FIGURES EXCLUDING NOISE
2015 full year financial results 8 03/11/2016
* excluding one-off effects
in million CHF Jan-Dec 2015 Jan-Dec 2015* Jan-Dec 2014
Aviation revenue 586.6 586.6 564.8 ███ + 3.9%
Non-aviation revenue 391.6 391.6 388.5 + 0.8%
Revenue 978.2 978.2 953.3 ██ + 2.6%
EBITDA 592.3 539.8 517.2 ████ + 4.4%
EBITDA margin (in %) 60.6 55.2 54.3
EBIT 369.9 317.4 295.8 ███████ + 7.3%
EBIT margin (in %) 37.8 32.4 31.0
Finance result (net) -21.7 -21.7 -28.2 -23.3% ██████
Profit 269.2 227.5 211.4 ███████ + 7.6%
Interest-bearing liabilities (net) 651.2 651.2 871.0 n/a
Cash flow from operating activities 472.5 472.5 468.4 + 0.9%
CAPEX (incl. Circle) 199.7 199.7 254.1 -21.4% █████
EpS (in CHF) 43.8 37.0 34.4 ███████ + 7.6%
∆ (in %)

| | © Flughafen Zürich AG
AVIATION
9 2015 full year financial results 03/11/2016

| | © Flughafen Zürich AG
AVIATION SEGMENT REVENUE BREAKDOWN
2015 full year financial results 10 03/11/2016
1
2
3
higher aircraft noise charges due to the termination of pre-financing by the Canton of Zurich (November 30, 2014) 2
higher passenger & security charges as a result of the favorable passenger mix 1
higher revenue from de-icing (mild winter 2014) 3
in million CHF Jan-Dec 2015 Jan-Dec 2014
Passenger & security charges 399.6 383.2 ████ + 4.3%
PRM charges 11.8 11.4 ███ + 3.1%
Passenger-related noise charges 0.0 2.0 n/a
Landing charges 89.4 87.6 ██ + 2.1%
Aircraft-related noise charges 10.8 8.2 n/a
Emission charges 3.3 3.2 ██ + 2.9%
Parking charges 6.7 6.6 █ + 1.1%
Freight revenue 7.4 7.8 -5.4% █████
Total flight operations charges 528.9 510.0 ███ + 3.7%
Baggage sorting and handling system 31.4 30.4 ███ + 3.1%
Aircraft energy supply system 13.6 13.2 ███ + 3.7%
De-icing 2.7 1.6 n/a
Other fees 17.2 16.6 ███ + 3.6%
Total aviation fees 64.9 61.8 █████ + 5.0%
Total other aviation revenue 3.5 3.2 ███████ + 11.3%
Total aviation revenue 597.4 575.0 ███ + 3.9%
Ø landing charge per movement (in CHF) 674.6 661.0 ██ + 2.1%
∆ (in %)

| | © Flughafen Zürich AG
NON-AVIATION
11 2015 full year financial results 03/11/2016

| | © Flughafen Zürich AG
NON-AVIATION SEGMENT REVENUE BREAKDOWN
2015 full year financial results 12 03/11/2016
1
2
3
higher revenue from car parks because of the higher share of local passengers 2
stable commercial revenue despite lower commercial turnover 1
premature termination of a rental contract (one-off payment in 2014) 3
4
increasing revenues from consulting activities (Brazil & Kazakhstan) 4
in million CHF Jan-Dec 2015 Jan-Dec 2014
Retail, tax & duty free 95.4 96.5 -1.1% █
Food & beverage operations 16.1 15.3 █████ + 5.0%
Revenue from multi-storey car parks 74.3 73.4 █ + 1.2%
Other commercial revenue 31.0 29.7 ████ + 4.1%
Total commercial revenue 216.8 215.0 + 0.8%
Revenue from rental and leasing agreements 87.7 94.3 -7.0% ██████
Energy and utility cost allocation 24.5 22.9 ██████ + 6.8%
Cleaning and other service revenue 10.2 6.1 n/a
Revenue from facility management 122.4 123.3 -0.8%
Revenue from services 52.5 50.2 ████ + 4.5%
Total non-aviation revenue 391.6 388.5 + 0.8%
Ø revenue retail, tax & duty free, F&B
per departing PAX (in CHF) 8.5 8.8 -3.4% ███
∆ (in %)

| | © Flughafen Zürich AG
KEY FIGURES COMMERCIAL BUSINESS
2015 full year financial results 13 03/11/2016
44%
56%
spend / dep. PAX
CHF 40.7
total airside commercial area ~14’200sqm total landside commercial area ~19’000sqm

| | © Flughafen Zürich AG
OPEX & OTHER KEY FIGURES
14 2015 full year financial results 03/11/2016

| | © Flughafen Zürich AG
OPERATING EXPENSES
2015 full year financial results 15 03/11/2016
in million CHF Jan-Dec 2015 Jan-Dec 2014
Personnel expenses 167.8 180.9 -7.2% ███████
Police and security 118.6 117.8 + 0.7%
Energy and waste 21.9 20.7 █████ + 5.5%
Maintenance and material 40.8 41.3 -1.2% █
Other operating expenses 51.2 52.9 -3.2% ███
Sales, marketing, administration 35.0 36.8 -5.0% ████
Capitalized expenditure & other income/expenses 50.8 -10.5 n/a
Total operating expenses 486.2 440.0 ███████ + 10.5%
∆ (in %)
like for like
+0.3%

| | © Flughafen Zürich AG
KEY FIGURES
2015 full year financial results 16 03/11/2016
* excluding one-off effects
in million CHF Jan-Dec 2015* Jan-Dec 2014 Jan-Dec 2015* Jan-Dec 2014
EBITDA 547.5 523.5 539.8 517.2
EBITDA margin (in %) 55.4 54.3 55.2 54.3
Depreciation and amortization -228.2 -228.9 -222.4 -221.4
EBIT 319.3 294.6 317.4 295.8
EBIT margin (in %) 32.3 30.6 32.4 31.0
Finance result (net) -37.4 -33.8 -21.7 -28.2
Associated companies -3.9 -1.4 -3.9 -1.4
Income tax expense -62.6 -53.5 -64.3 -54.8
Profit 215.3 205.9 227.5 211.4
Net financial debt / EBITDA 0.35x 0.71x 1.1x 1.68x
Net financial debt 174.7 372.2 651.2 871.0
ROIC (in %) 7.9 7.1 8.4 7.7
Return on equity (in %) 9.9 9.8 11.4 11.3
Equity ratio (in %) 54.7 53.6 61.3 57.9
Cashflow from operating activites 456.2 460.7 472.5 468.4
Investments in property 224.5 249.5 224.5 249.5
Free cashflow 231.7 211.2 248.1 218.9
excl. noiseincl. noise

| | © Flughafen Zürich AG
SEGMENT REPORT (IN MILLION CHF) TOTAL ROIC (EXCL. NOISE AND ONE-OFFS): 8.4%
2015 full year financial results 17 03/11/2016
Regulated business Non-regulated business
based on results of the 12-month period preceding the reporting date
ROIC 2015 excl. one-off effects: 13.7%

| | © Flughafen Zürich AG
OUTLOOK
18 2015 full year financial results 03/11/2016

| | © Flughafen Zürich AG
HOUR PASSION BOUTIQUE (OPERATED BY SWATCH GROUP)
2015 full year financial results 19 03/11/2016

| | © Flughafen Zürich AG
TIMETABLE HIGHLIGHTS
2015 full year financial results 20 03/11/2016
Current winter timetable 2015/2016 (since October 25, 2015)
Warsaw f Polish flag carrier LOT returns to ZRH with a double
daily service (since January 2016)
Toulouse f French regional carrier Twin Jet offers 4 weekly
flights (since January 2016)
Upcoming summer timetable 2016 (as of March 27, 2016)
Rio de Janeiro f New destination, currently not served from ZRH
Madrid f Sky Team carrier Air Europa offers 2 daily flights to
its hub with onward connections to Latin America
Istanbul f Turkish low cost carrier offers a daily flight to
Istanbul’s main airport
Beirut, Vilnius, Split f New destinations, currently not served from ZRH,
with up to 2 flights per week
Hamburg f 4 weekly flights to Hamburg
(currently served by SWISS and Eurowings)
until June 2016: 6x B777-300ER
(replacing 6x A340)
expected as of June 2016: CSeries 100
(replacing Avro RJ100 )

| | © Flughafen Zürich AG
UPDATE ON CHARGES
03/11/2016 2015 full year financial results 21
JAN FEB MAR APR MAI JUN JUL
publication in AIC*
decree (excpected) consultation
appeal period
implementation
application for publication in AIP**
publication AIP**
decree legally binding
** Aeronautical Information Circular
** Aeronautical Information Publication
AUG

| | © Flughafen Zürich AG
INVESTMENTS
2015 full year financial results 22 03/11/2016
Investments per December 31, 2015 (in million CHF)
1 «The Circle» (51%) 39.5
2 Upgrade terminal 2 38.2
3 Various maintenance
projects in real estate 24.0
4 Expansion parking 21.8
5 Redesign curbside lanes 19.6
6 Renovation apron 5.2
7 Implementation of general
drainage plan 4.3
other investments 47.1
Total investments * 199.7
2016 planned investment costs for largest projects
* based on output, incl. capitalized expenditure
Civil engineering CHF ~30 million
«The Circle» CHF ~100 million
Expansion parking CHF ~37 million
Upgrade T2 CHF ~36 million

| | © Flughafen Zürich AG
GUIDANCE 2016
2015 full year financial results 23 03/11/2016
The Guidance 2016 is based on the consolidated income statement 2015 excluding one-off effects.
Implementation of new tariffs assumed in Q3/2016. The reduction in tariffs will be partly offset by
passenger growth.
PAX approx. 3% higher
local disproportionately higher growth
transfer disproportionately lower growth
Revenue slightly lower
aviation lower by CHF 5-10 million
non-aviation slightly higher
OPEX slightly higher
EBITDA margin slightly lower
Depreciation & amortization increase by approx. CHF 10 million
Profit excl. noise slightly lower
CAPEX approx. CHF 250 million, whereof CHF 100 million for «The Circle» (51%)

| | © Flughafen Zürich AG
3. BUSINESS OUTLOOK
24 2015 full year financial results 03/11/2016

| | © Flughafen Zürich AG
STRATEGIC PATH IS CLEAR
2015 full year financial results 25 03/11/2016
premium mid-sized hub leading commercial centers
center for business & lifestyle international business activities

| | © Flughafen Zürich AG
«THE CIRCLE» ON TRACK
2015 full year financial results 26 03/11/2016
Marketing & promotion
• advanced talks and negotiations
• execution of 2nd stage under review
Project work & construction
• construction works in full swing
• overall cost forecast unchanged
Timelines
• completion of construction by end 2018
• grand opening expected in 2019

| | © Flughafen Zürich AG
STRENGTHEN COMMERCIAL AND REAL ESTATE EXPERTISE WITH TWO INDUSTRY LEADERS
2015 full year financial results 27 03/11/2016

| | © Flughafen Zürich AG
KEY CREDIT METRICS HAVE STRENGTHENED BEYOND HISTORIC LEVELS
03/11/2016 2015 full year financial results 28
Key data 2011 – 2015
• surplus cash flows have consequently been used to restructure and reduce debt
• average interest rate on financial debt has steadily decreased
• strong business performance has changed the company’s capital structure
(excluding noise) 2011 2012 2013 2014 2015
Free cashflow (in mCHF) 67.4 218.7 204.7 218.9 248.1
net debt (in mCHF) 1’257.3 1’107.9 994.7 871.0 651.2
net debt / EBITDA 2.9x 3.2x 2.1x 1.7x 1.1x
equity ratio 49.9% 47.8% 52.3% 57.9% 61.3%
S&P Rating A- A A A A+
Av. debt interest rate 5.3% 4.5% 2.8% 1.9% 1.7%

| | © Flughafen Zürich AG
4. CAPITAL MANAGEMENT
29 2015 full year financial results 03/11/2016

| | © Flughafen Zürich AG
SOLID CASH FLOWS ENABLE VALUE CREATING INVESTMENTS
2015 full year financial results 30 03/11/2016
Continued strong business outlook over coming years
• solid performance in the regulated business
clarity on operational charges framework
• outperformance in the non-regulated business
«The Circle» project on track
Focus on value creating investments
• international business development: no change in proven strategic track record
• focus on meaningful investments combined with operating responsibility
• continued discipline leading to mid/long term value creation
• strategic businesses in Zurich (non-regulated)

| | © Flughafen Zürich AG
REDUCTION OF CAPITAL SURPLUS OVER COMING YEARS
2015 full year financial results 31 03/11/2016
Maintain existing dividend policy
• payout ratio of 35-45% of profit excluding the influence of aircraft noise and
excluding one-off effects
Using financial headroom for investments and special distributions to
shareholders
• additional distribution of approx. CHF 100 million p.a. over coming years
• distribution out of the capital contribution reserve (exempt from withholding tax)
• yearly review depending on acquisitions/investments and overall economic
environment
The proposed capital allocation allows pursuing investment opportunities
and still maintaining financial flexibility.
| | © Flughafen Zürich AG
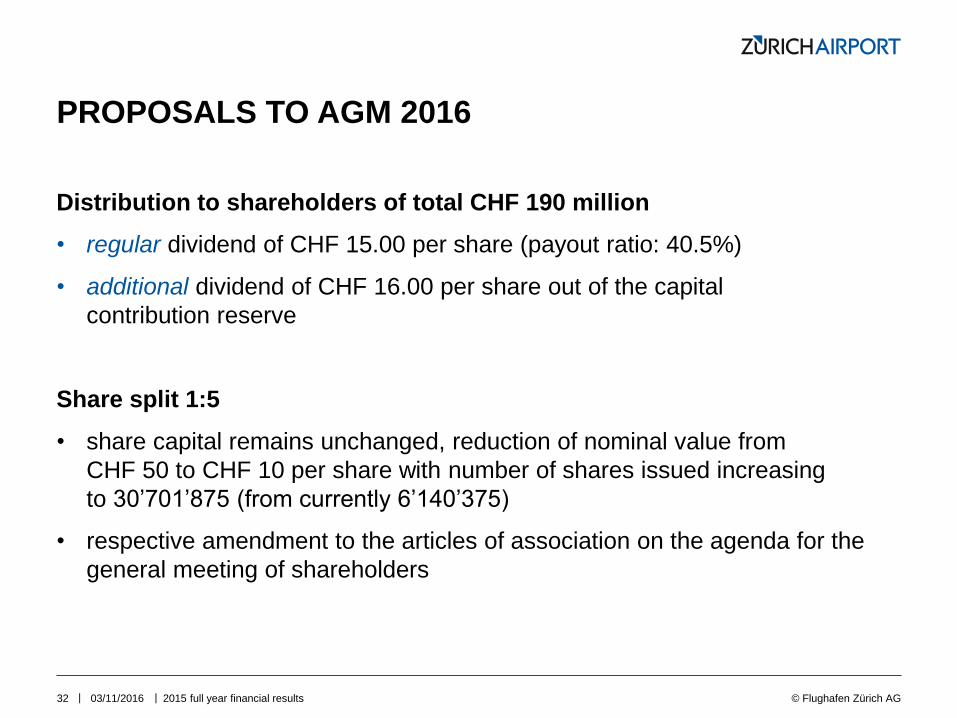
PROPOSALS TO AGM 2016
2015 full year financial results 32 03/11/2016
Distribution to shareholders of total CHF 190 million
• regular dividend of CHF 15.00 per share (payout ratio: 40.5%)
• additional dividend of CHF 16.00 per share out of the capital
contribution reserve
Share split 1:5
• share capital remains unchanged, reduction of nominal value from
CHF 50 to CHF 10 per share with number of shares issued increasing
to 30’701’875 (from currently 6’140’375)
• respective amendment to the articles of association on the agenda for the
general meeting of shareholders

| | © Flughafen Zürich AG
5. Q&A
33 2015 full year financial results 03/11/2016
Neues Bild
Roadshow Frankfurt (Bank Vontobel) Monday, March 14, 2016
Swiss Seminar (Kepler Cheuvreux) Wednesday, March 23, 2016
Roadshow London (MainFirst) Wednesday, April 13, 2016
Roadshow US/Canada (Royal Bank of Canada) April 19 – April 21, 2016
General meeting of shareholders Thursday, April 28, 2016
Summer Conference (Vontobel) Wednesday, June 8, 2016
Publication half year results 2016 Wednesday, August 24, 2016

| | © Flughafen Zürich AG
IR CONTACTS
2015 full year financial results 34 03/11/2016
Stefan Weber
Investor Relations & Treasury
+41 (0)43 816 27 15
Lukas Brosi
Head Financial Services
+41 (0)43 816 72 91

| | © Flughafen Zürich AG
This document has been prepared by Flughafen Zürich AG for use in this presentation.
The information contained in this document has not been independently verified. No representation or
warranty – whether express or implied – is made as to, and no reliance should be placed on, the fairness,
accuracy, completeness or correctness of the information or opinions contained therein. Neither the
company nor any of its affiliates, advisors or representatives shall have any liability whatsoever (in
negligence or otherwise) for any loss arising from any use of this document or its content or otherwise
arising in connection with this document.
This document does not constitute an offer or invitation to purchase or subscribe for any shares and
neither this document nor any part of it shall form the basis of, or be relied upon in connection with, any
contract or commitment whatsoever.
This document contains forward-looking statements that are based on current estimates and assumptions
made by the management of Flughafen Zürich AG to the best of its knowledge. Such forward-looking
statements are subject to risks and uncertainties, the non-occurrence or occurrence of which could cause
the actual results – including the financial condition and profitability of Flughafen Zürich AG – to differ
materially from or be more negative than those expressed or implied by such forward-looking statements.
This also applies to the forward-looking estimates and forecasts derived from third-party studies.
Consequently, neither the Company nor its management can give any assurance regarding the future
accuracy of the opinions set forth in this document or the actual occurrence of the predicted
developments.
By accepting this document, you agree with foregoing.
DISCLAIMER
2015 full year financial results 35 03/11/2016

| | © Flughafen Zürich AG
FINANCIAL LIABILITIES (PER DECEMBER 31, 2015)
2015 full year financial results 36 03/11/2016

| | © Flughafen Zürich AG
PASSENGER DEVELOPMENT
2015 full year financial results 37 03/11/2016
North America 2015
market share ZRH 8.2%
from/to ZRH -0.1%
global market +5.6%
Source: ACI & ZRH data warehouse
Latin America 2015
market share ZRH 0.9%
from/to ZRH +7.3%
global market +5.5%
Europe 2015
market share ZRH 77.0%
from/to ZRH +3.2%
global market +5.0%
Africa 2015
market share ZRH 2.1%
from/to ZRH -10.3%
global market -0.1%
Middle East 2015
market share ZRH 5.1%
from/to ZRH +6.9%
global market +11.3%
Far East 2015
market share ZRH 6.8%
from/to ZRH +8.3%
global market +8.0%
Worldwide 2015
from/to ZRH +3.2%
global market +6.1%
| | © Flughafen Zürich AG
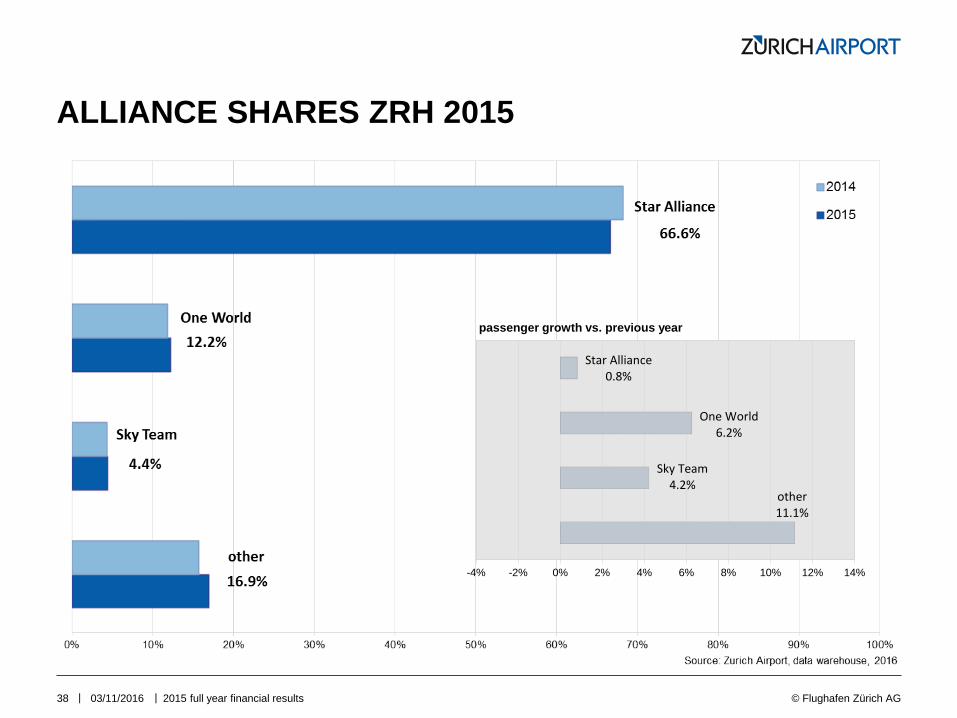
ALLIANCE SHARES ZRH 2015
2015 full year financial results 38 03/11/2016
other 11.1%
Sky Team 4.2%
One World 6.2%
Star Alliance 0.8%
-4% -2% 0% 2% 4% 6% 8% 10% 12% 14%
passenger growth vs. previous year

| | © Flughafen Zürich AG
STAR ALLIANCE HUBS (JAN 2015 – DEC 2015)
2015 full year financial results 39 03/11/2016

| | © Flughafen Zürich AG
KEY INDICATORS
2015 full year financial results 40 03/11/2016


