Russell Investments // Russell Indexes 2015 Global Guidebook Commentary INDEX INSIGHTS Russell Indexes 2015 Global Guidebook Commentary By: Mat Lystra, Senior Research Analyst 1 APRIL 2015 Key points: The Russia-Ukraine crisis moved equity markets in 2014. With economic sanctions from the West, the continued index eligibility of certain Russian stocks was threatened and heavy pressure was placed on the Russian ruble. Sharp declines in global oil prices in the second half of 2014 created a potential economic boost to oil-importing countries and increased the potential for fiscal instability in oil-exporting economies. The approximately US$3T China A-share market is now partially accessible through three foreign investment programs. Each program comes with a different set of rules, and investors experience each program differently. As a result, the need exists for a customized set of solutions to proxy an investor’s exposure to Mainland China equities. This Russell Indexes Global Guidebook Commentary expands on global equity themes noted during the creation of the Russell Indexes Global Guidebook. The guidebook, which is published annually, provides reviews of approximately 90 countries under Russell Indexes’ country classification methodology. A variety of statistics related to the sizes of their economies and equity markets is included, as are measures of market accessibility to investors. In aggregate, much of this information serves as the basis for Russell Indexes’ classification of countries as having developed, emerging or frontier markets. In this commentary we review a 2014 that saw instability in Ukraine draw neighboring Russia into a proxy war over Western influence. The economic sanctions that followed have had ripple effects across equity markets, and in a few cases, even among index constituents. Further escalating Russia’s economic predicament was the falling price of oil, which negatively impacted the economy of other large oil-exporting countries as well. Although low oil prices were a drag on oil- supplying countries’ economies, many other nations’ economies were boosted as a result. We also look at investors’ rapidly expanding options for accessing the China A-share market, and how this might ultimately lead to China’s inclusion in a global equity index. 1 The author wishes to thank Layla Hirschfelt and Tom Goodwin for their editorial contributions; and a special thank you to Ben Van and Jackson Peng for their invaluable contributions to this research.
Transcript
Russell Investments // Russell Indexes 2015 Global Guidebook Commentary
INDEX INSIGHTS
Russell Indexes 2015 Global Guidebook Commentary
By: Mat Lystra, Senior Research Analyst1 APRIL 2015
Key points:
The Russia-Ukraine crisis moved equity markets in 2014. With economic sanctions from the
West, the continued index eligibility of certain Russian stocks was threatened and heavy
pressure was placed on the Russian ruble.
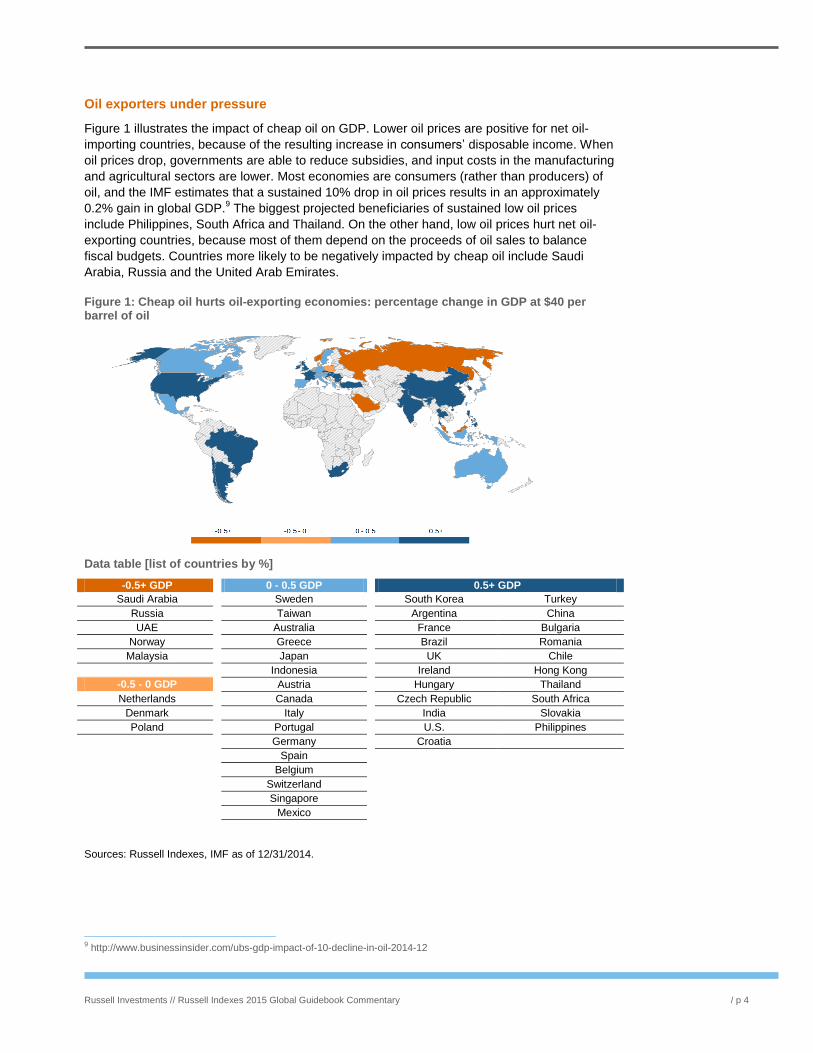
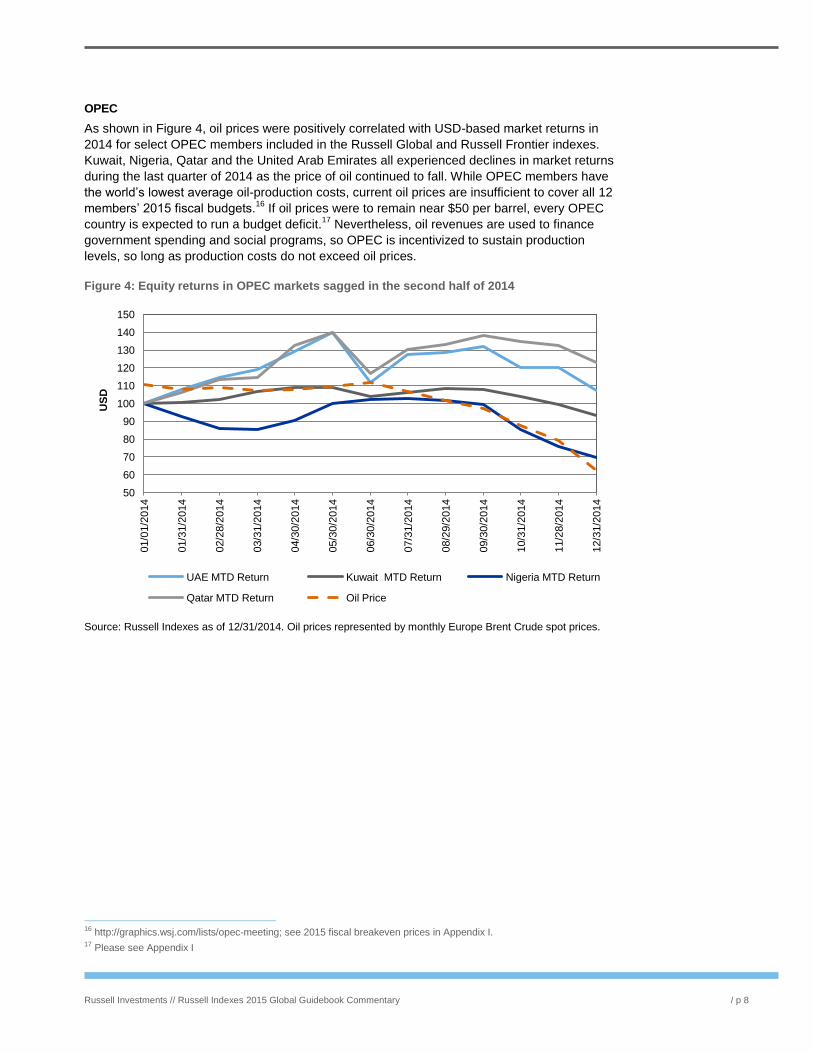
Sharp declines in global oil prices in the second half of 2014 created a potential economic
boost to oil-importing countries and increased the potential for fiscal instability in oil-exporting
economies.
The approximately US$3T China A-share market is now partially accessible through three
foreign investment programs. Each program comes with a different set of rules, and investors
experience each program differently. As a result, the need exists for a customized set of
solutions to proxy an investor’s exposure to Mainland China equities.
This Russell Indexes Global Guidebook Commentary expands on global equity themes noted
during the creation of the Russell Indexes Global Guidebook. The guidebook, which is published
annually, provides reviews of approximately 90 countries under Russell Indexes’ country
classification methodology. A variety of statistics related to the sizes of their economies and equity
markets is included, as are measures of market accessibility to investors. In aggregate, much of
this information serves as the basis for Russell Indexes’ classification of countries as having
developed, emerging or frontier markets.
In this commentary we review a 2014 that saw instability in Ukraine draw neighboring Russia into
a proxy war over Western influence. The economic sanctions that followed have had ripple effects
across equity markets, and in a few cases, even among index constituents. Further escalating
Russia’s economic predicament was the falling price of oil, which negatively impacted the
economy of other large oil-exporting countries as well. Although low oil prices were a drag on oil-
supplying countries’ economies, many other nations’ economies were boosted as a result.
We also look at investors’ rapidly expanding options for accessing the China A-share market, and
how this might ultimately lead to China’s inclusion in a global equity index.
1 The author wishes to thank Layla Hirschfelt and Tom Goodwin for their editorial contributions; and a special thank you to Ben Van and Jackson Peng for their invaluable contributions to this research.
Russell Investments // Russell Indexes 2015 Global Guidebook Commentary / p 2
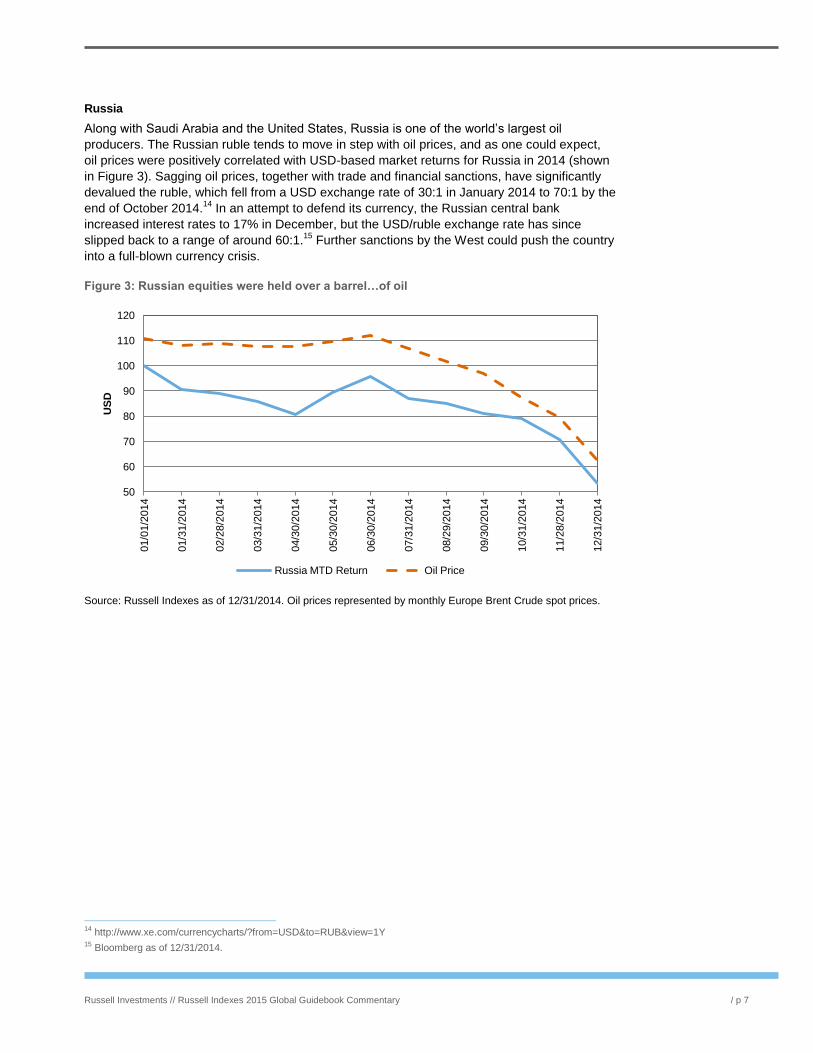
The Russia-Ukraine crisis
Ukraine was roiled by political unrest and violence in 2014, in Ukraine’s national identity struggle
between Russian and Western2 loyalties. Following Russia’s unilateral annexation of Ukraine’s
Crimean peninsula, and again after the downing of a commercial airliner in Ukrainian airspace,
Western countries led by the U.S and European Union (E.U.) enacted a series of economic
sanctions against Russia, which are detailed in Table 1 below. Some of these sanctions impacted
constituents of indexes maintained by Russell Indexes and FTSE, now both wholly-owned
subsidiaries of the London Stock Exchange Group. Index constituents impacted are shown in
Table 1.1.
Sanctions against Russia
The sanctions executed by the West in 2014 targeted the sectors most vital to Russia’s economy,
including oil and gas, defense and banking sectors (which are partially if not completely state
owned) and/or those linked to the crisis. Prohibitions included the financing of new debt, trading in
dual-use goods and technologies for defense companies, and supporting oil exploration and
production.
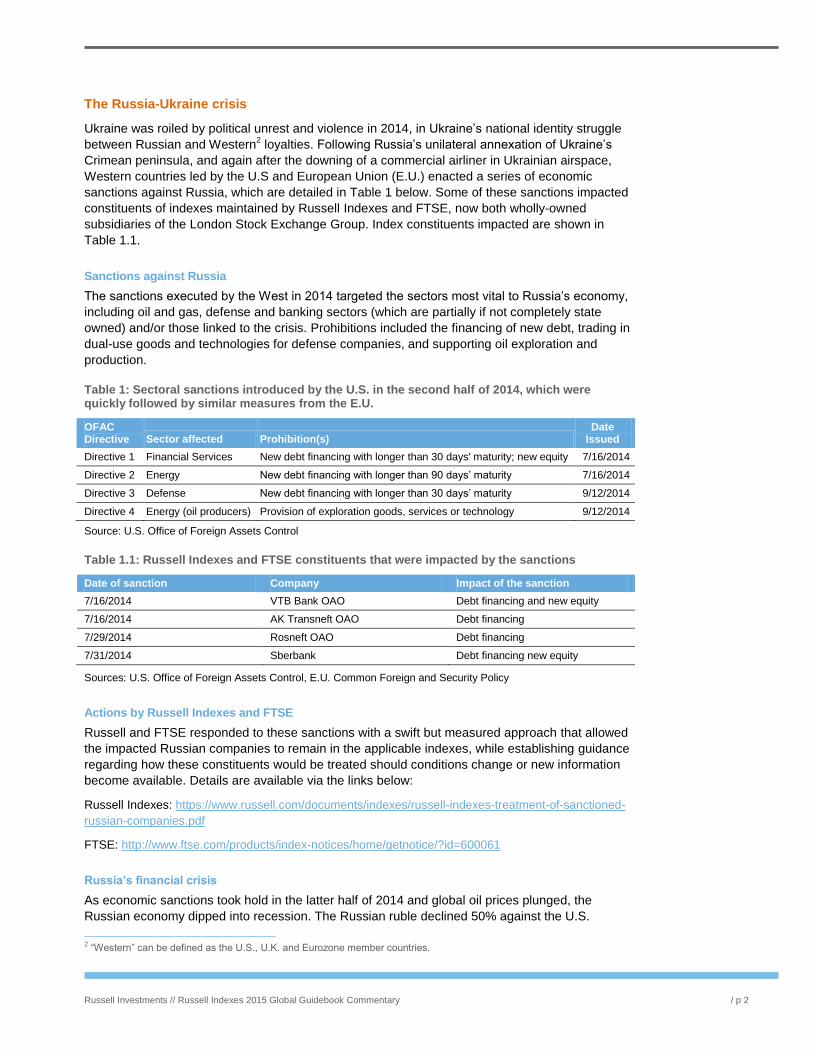
Table 1: Sectoral sanctions introduced by the U.S. in the second half of 2014, which were quickly followed by similar measures from the E.U.
OFAC Directive Sector affected Prohibition(s)
Date Issued
Directive 1 Financial Services New debt financing with longer than 30 days' maturity; new equity 7/16/2014
Directive 2 Energy New debt financing with longer than 90 days’ maturity 7/16/2014
Directive 3 Defense New debt financing with longer than 30 days’ maturity 9/12/2014
Directive 4 Energy (oil producers) Provision of exploration goods, services or technology 9/12/2014
Source: U.S. Office of Foreign Assets Control
Table 1.1: Russell Indexes and FTSE constituents that were impacted by the sanctions
Date of sanction Company Impact of the sanction
7/16/2014 VTB Bank OAO Debt financing and new equity
7/16/2014 AK Transneft OAO Debt financing
7/29/2014 Rosneft OAO Debt financing
7/31/2014 Sberbank Debt financing new equity
Sources: U.S. Office of Foreign Assets Control, E.U. Common Foreign and Security Policy
Actions by Russell Indexes and FTSE
Russell and FTSE responded to these sanctions with a swift but measured approach that allowed
the impacted Russian companies to remain in the applicable indexes, while establishing guidance
regarding how these constituents would be treated should conditions change or new information
become available. Details are available via the links below:
Russell Indexes: https://www.russell.com/documents/indexes/russell-indexes-treatment-of-sanctioned-
Russell Investments // Russell Indexes 2015 Global Guidebook Commentary / p 3
dollar, and the Russian Trading System (RTS) index, denominated in USD, saw an even
steeper decline, of 55%, during the same period. On December 15, the Bank of Russia raised
the country’s key interest rate from 10.5% to 17% in an attempt to slow the ruble’s decline, but
with little effect.
The collapse of the ruble has made foreign debt repayment significantly more expensive for
Russian companies issuing foreign currency–denominated debt. Russian banks currently owe
$170 billion in debt3, and in December 2014, research analysts at Capital Economics predicted
that the banks could suffer as much as $22 billion in losses.4 In addition, in January 2015,
Standard & Poor’s cut Russia’s sovereign debt rating to junk status.5
With Russian companies, including banks, restricted from access to Western capital markets,
the Bank of Russia has been left as the only means of borrowing dollars or euros to repay
foreign debt. This has placed added pressure on Russia’s already declining foreign currency
reserves, which fell from approximately $510 billion at the start of 2014 to $385 billion by year-
end. Through 2015, the country’s reserves continued declining at an average pace of $10 billion
per month. If this rate of decline were to continue, Russia’s currency reserves could become
critically low.6
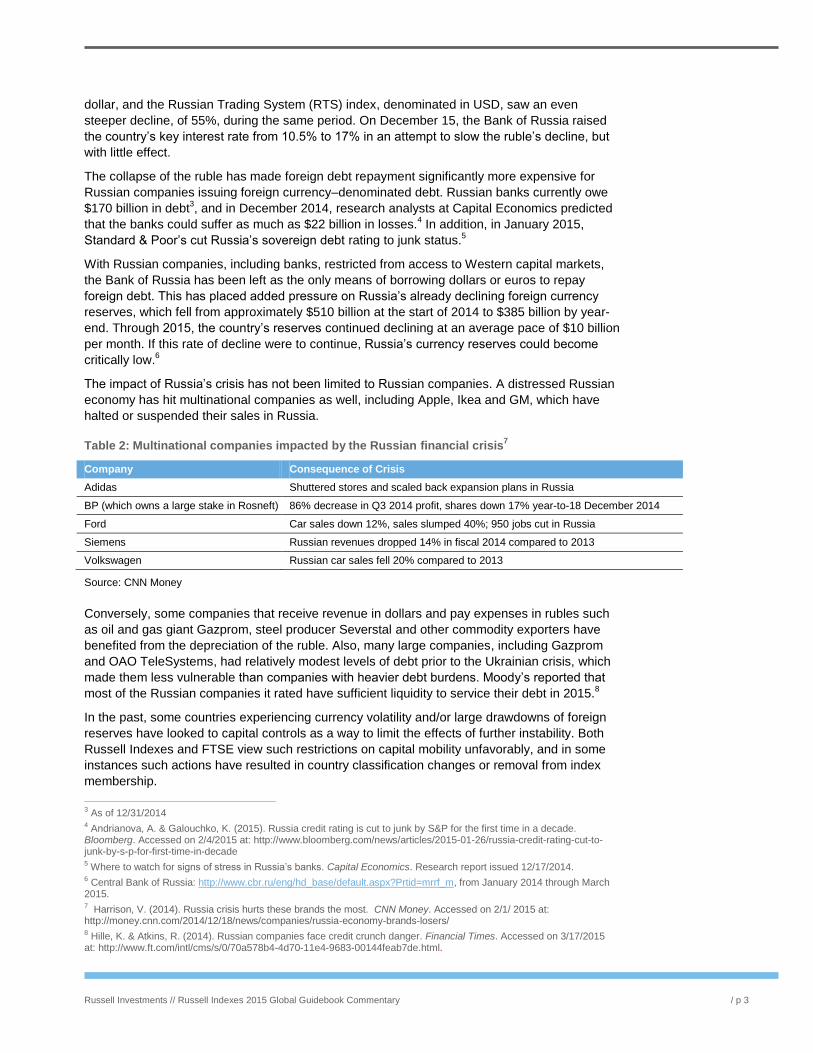
The impact of Russia’s crisis has not been limited to Russian companies. A distressed Russian
economy has hit multinational companies as well, including Apple, Ikea and GM, which have
halted or suspended their sales in Russia.
Table 2: Multinational companies impacted by the Russian financial crisis7
Company Consequence of Crisis
Adidas Shuttered stores and scaled back expansion plans in Russia
BP (which owns a large stake in Rosneft) 86% decrease in Q3 2014 profit, shares down 17% year-to-18 December 2014
Ford Car sales down 12%, sales slumped 40%; 950 jobs cut in Russia
Siemens Russian revenues dropped 14% in fiscal 2014 compared to 2013
Volkswagen Russian car sales fell 20% compared to 2013
Source: CNN Money
Conversely, some companies that receive revenue in dollars and pay expenses in rubles such
as oil and gas giant Gazprom, steel producer Severstal and other commodity exporters have
benefited from the depreciation of the ruble. Also, many large companies, including Gazprom
and OAO TeleSystems, had relatively modest levels of debt prior to the Ukrainian crisis, which
made them less vulnerable than companies with heavier debt burdens. Moody’s reported that
most of the Russian companies it rated have sufficient liquidity to service their debt in 2015.8
In the past, some countries experiencing currency volatility and/or large drawdowns of foreign
reserves have looked to capital controls as a way to limit the effects of further instability. Both
Russell Indexes and FTSE view such restrictions on capital mobility unfavorably, and in some
instances such actions have resulted in country classification changes or removal from index
membership.
3 As of 12/31/2014 4 Andrianova, A. & Galouchko, K. (2015). Russia credit rating is cut to junk by S&P for the first time in a decade. Bloomberg. Accessed on 2/4/2015 at: http://www.bloomberg.com/news/articles/2015-01-26/russia-credit-rating-cut-to-junk-by-s-p-for-first-time-in-decade 5 Where to watch for signs of stress in Russia’s banks. Capital Economics. Research report issued 12/17/2014. 6 Central Bank of Russia: http://www.cbr.ru/eng/hd_base/default.aspx?Prtid=mrrf_m, from January 2014 through March 2015. 7 Harrison, V. (2014). Russia crisis hurts these brands the most. CNN Money. Accessed on 2/1/ 2015 at: http://money.cnn.com/2014/12/18/news/companies/russia-economy-brands-losers/ 8 Hille, K. & Atkins, R. (2014). Russian companies face credit crunch danger. Financial Times. Accessed on 3/17/2015 at: http://www.ft.com/intl/cms/s/0/70a578b4-4d70-11e4-9683-00144feab7de.html.
Russell Investments // Russell Indexes 2015 Global Guidebook Commentary / p 11
challenging. Accordingly, there is a need to create customized index options, in order to
represent the different investor experiences when A-shares are added to global equity
portfolios.20
Russell Indexes has not historically maintained a stand-alone China A-share index, but FTSE
offers a full suite of China A-share indices that serve as the basis for some of the largest A-
share-linked ETFs in the world.21
FTSE offers three different approaches to replicating an A-
share exposure within a global equity or emerging markets equity portfolio:
1. A full free-floated A-share representation with stocks weighted up to the 30%
foreign ownership limit
2. A quota-based weighting of the A-share market based on the available total
across the QFII, RQFII and Stock Connect programs
3. A quota-based weighting using a client’s individually allocated quota
These customized options allow clients choose their A-Share allocation, and in line with their
own target weights for China.
Ultimately, we believe global index providers will take a similarly gradual approach to adding A-
shares to standard equity benchmarks. If the A-share market were added to the standard
equity index today, even after being adjusted for free-float and foreign ownership limits, FTSE
estimates that China’s weight within FTSE’s emerging markets index would jump from ~22% to
~34%!22
The magnitude of such a change could not be implemented over a single rebalance;
rather, it would require a phase-in approach applied over time. Because of the large shifts in
index weight that full inclusion of A-shares would create, an allocation based on the
outstanding QFII, RQFII and Stock Connect quota may more closely approximate the path of
incremental uptake of A-shares that index providers are likely to follow. FTSE estimates that
including A-shares by the allocated quota would increase China’s weight to a more achievable
~24% (from 22%). Finding the right balance in when and how to add A-shares will be one of
the most high-profile, high-impact decisions index providers and their clients make in the
coming years.
20 For more details on each program and FTSE’s approach to the China A-share market, please visit: http://www.ftse.com/products/downloads/Preparing_for_Chinas_Inclusion_in_Global_Benchmarks.pdf 21 For more details on FTSE’s China indices please visit: http://www.ftse.com/products/indices/china 22 Estimates provided in: http://www.ftse.com/products/downloads/Preparing_for_Chinas_Inclusion_in_Global_Benchmarks.pdf