39
GRAYREPORTS Demand for Educational Programs www.GrayAssociates.com Results through March 2015
| Date post: | 06-Aug-2015 |
| Category: |
Education |
| Upload: | gray-associates-inc |
| View: | 77 times |
| Download: | 2 times |

GRAYREPORTS Demand for Educational Programs
www.GrayAssociates.com
Results through March 2015

617.401.7662 www.GrayAssociates.com 2
GRAY For more information please contact Bob Atkins. Email: [email protected]
Who Is Gray?
GrayData
Completions and Enrollments IPEDS
Employment BLS/O*NET
Placement Rates Gray Research
Industry Inquiries GrayReports
Demographics US Census
Job Postings WANTED Analytics
Students Programs Strategy Locations § Demographic
priorities § Geo-priorities § Market share
§ City selection § Location selection § Relocation analysis § Consolidation
§ Program selection § Program development § Curriculum enhancement § Market reports
§ Business strategy § Strategy implementation § Pricing § Outcome improvement
Advanced Analytics Predictive Models
Geo-Analytics
Clients: Higher Education Institutions and Investors
Program Pricing: Coming in 2015

617.401.7662 www.GrayAssociates.com 3
GRAY For more information please contact Bob Atkins. Email: [email protected]
What is GrayReports?
GrayReports tracks demand trends in higher education. § Overall industry trend reports are a free monthly service, which includes these webinars. § Custom reports on trends by market and programs, which we provide to our paid subscribers:
─ Monthly reports for their specific programs and markets ─ On-line access to detailed data for their programs and markets
Over 37 million qualified inquiries January 2012 to the present
Over 930,000 new inquiries in March 2015 Over 185 programs with over 10,000 inquiries
Over 300 cities with over 10,000 inquiries

617.401.7662 www.GrayAssociates.com 4
GRAY For more information please contact Bob Atkins. Email: [email protected]
Agenda
1. National Inquiry Trends
2. Inquiries and Conversions: On-Line vs. On-Ground Programs
3. Views by Program and Segment
4. Geo-Targeting
5. Summary

617.401.7662 www.GrayAssociates.com 5
GRAY For more information please contact Bob Atkins. Email: [email protected]
Overall Student Inquiries
Overall, the “slowdown is slowing:” March inquiries dropped only 5% year-over-year. § January dropped 12%. § February fell 10%. § March was the least-bad month this year.
-5% YOY
-
200,000
400,000
600,000
800,000
1,000,000
1,200,000
Jan Feb Mar Apr May Jun Jul Aug Sep Oct Nov Dec
National Inquiries All Programs and Award Levels 2014 2015

617.401.7662 www.GrayAssociates.com 6
GRAY For more information please contact Bob Atkins. Email: [email protected]
1. Applications are counted in the month in which the inquiry was received (i.e., an inquiry that is received in January and converts in March will be counted as a January inquiry). Typically, the application rate will rise for at least three months after the month in which the inquiries were received.
3.3%
3.1%
3.6%
3.5%
3.5%
3.5%
3.7%
3.3%
3.4%
3.9%
2.9%
2.9%
2.7%
2.1%
1.6%
2.7%
2.3% 1.8%
0.0%
0.5%
1.0%
1.5%
2.0%
2.5%
3.0%
3.5%
4.0%
4.5%
Jan Feb Mar Apr May Jun Jul Aug Sep Oct Nov Dec
Education Industry Inquiry Conversion Rates 2014 2015 Average Immature Conversion Rate
Inquiry to Application: Conversion Rates
The slowdown is slowing for conversion rates, too. § Last year the close rate averaged 3.4%. § December, the most recent mature month, closed at only 2.9%. § January, February and March are at or just below norms for immature months.
Immature Months1
2014 Mature Average: 3.4%
617.401.7662 www.GrayAssociates.com 7
GRAY For more information please contact Bob Atkins. Email: [email protected]
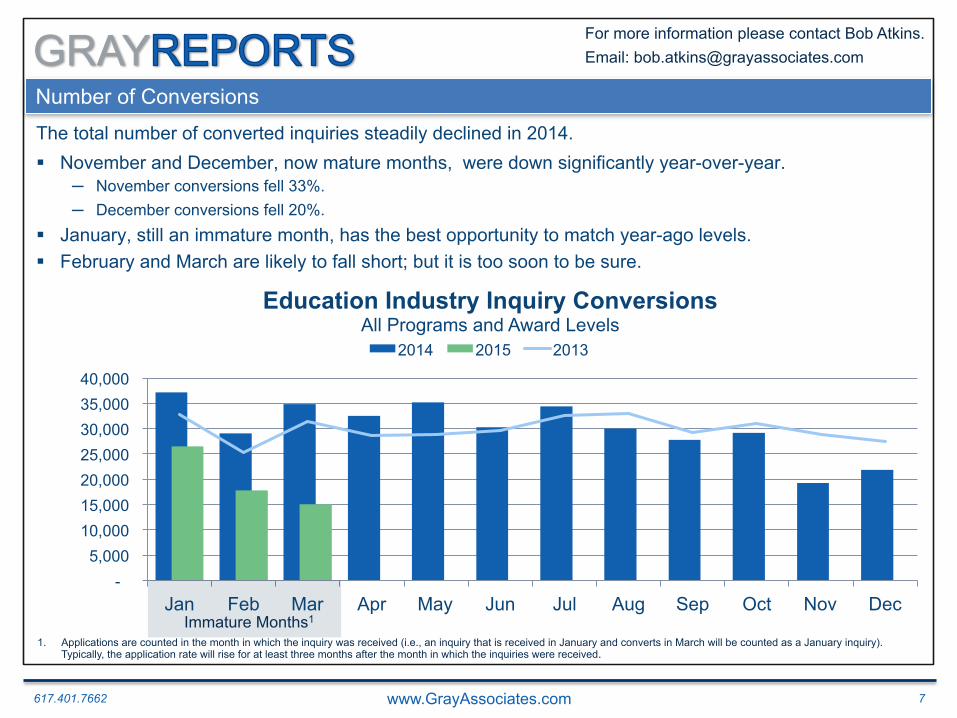
Number of Conversions
The total number of converted inquiries steadily declined in 2014. § November and December, now mature months, were down significantly year-over-year.
─ November conversions fell 33%. ─ December conversions fell 20%.
§ January, still an immature month, has the best opportunity to match year-ago levels. § February and March are likely to fall short; but it is too soon to be sure.
Immature Months1
1. Applications are counted in the month in which the inquiry was received (i.e., an inquiry that is received in January and converts in March will be counted as a January inquiry). Typically, the application rate will rise for at least three months after the month in which the inquiries were received.
- 5,000
10,000 15,000 20,000 25,000 30,000 35,000 40,000
Jan Feb Mar Apr May Jun Jul Aug Sep Oct Nov Dec
Education Industry Inquiry Conversions All Programs and Award Levels
2014 2015 2013
Immature Months1

617.401.7662 www.GrayAssociates.com 8
GRAY For more information please contact Bob Atkins. Email: [email protected]
Average Price for Pay-per-Lead Inquiries
The average price for external inquiries flat-lined in the first quarter of 2015. § The average price settled at slightly above $44. § As in February, inquiry prices were up 5% year-over-year in March.
$44.01 $44.21 $44.33
$42.13 $42.24 $42.13 $42.87 $41.59
$44.97 $44.67 $44.86 $46.15 $46.45 $45.94
$43.11
$30
$32
$34
$36
$38
$40
$42
$44
$46
$48
Jan Feb Mar Apr May Jun Jul Aug Sep Oct Nov Dec
Average Price per Pay-per-Lead Inquiry All Programs and Award Levels
2015 2014
Note: Inquiry price is the average price for pay-per-lead inquiries.

617.401.7662 www.GrayAssociates.com 9
GRAY For more information please contact Bob Atkins. Email: [email protected]
Average Cost Per Converted Inquiry
The cost for a converted inquiry (inquiry-to-application) is likely to stay above $1,400. § The most recent mature month, December closed at $1,464 up 6%. § We estimate that January will mature just under $1,300. § February and March are likely to mature above $1,400.
Jan Feb Mar Apr May Jun Jul Aug Sep Oct Nov Dec 2014 1261.488 1367.238 1184.523 1239.777 1181.089 1279.695 1194.133 1369.375 1364.959 1177.324 1565.561 1464.060 2015 1625.828 2111.399 2747.813 2013 1368.131 1522.057 1327.552 1388.356 1377.617 1136.420 1268.198 1323.551 1456.435 1407.252 1381.354 1379.051
$0
$500
$1,000
$1,500
$2,000
$2,500
$3,000 Cost Per Converted Inquiry All Programs and Award Levels
Immature Months

617.401.7662 www.GrayAssociates.com 10
GRAY For more information please contact Bob Atkins. Email: [email protected]
Agenda
1. National Inquiry Trends
2. Inquiries and Conversions: On-Line vs. On-Ground Programs
3. Views by Program and Segment
4. Geo-Targeting
5. Summary

617.401.7662 www.GrayAssociates.com 11
GRAY For more information please contact Bob Atkins. Email: [email protected]
Inquiries for On-Line Programs Education Industry Inquiries: YOY Percent Change On-line inquiry volumes took a step back in March, falling 8% year-over-year. § Inquiry volumes are down 11% in the first three months of 2015.
─ January was dropped 17%. ─ February fell 5%.
0
50,000
100,000
150,000
200,000
250,000
300,000
350,000
400,000
Jan Feb Mar Apr May Jun Jul Aug Sep Oct Nov Dec
Inquiries
Inquiries for On-Line Programs All Programs and Award Levels
2014 2015
-8% YOY

617.401.7662 www.GrayAssociates.com 12
GRAY For more information please contact Bob Atkins. Email: [email protected]
Student Inquiry Conversions for On-Line Programs
December conversions finished down 33% year-over-year. § With all of 2014 now mature, year-over-year conversions were down 20%. § January and February should mature at or above last year. § March is off to a slow start.
1. Applications are counted in the month in which the inquiry was received (i.e., an inquiry that is received in January and converts in March will be counted as a January inquiry). Typically, the application rate will rise for at least three months after the month in which the inquiries were received.
0
2000
4000
6000
8000
10000
12000
Jan Feb Mar Apr May Jun Jul Aug Sep Oct Nov Dec
Inquiry Conversions for On-Line Programs All Programs and Award Levels
2014 2015 2013
Immature Months1

617.401.7662 www.GrayAssociates.com 13
GRAY For more information please contact Bob Atkins. Email: [email protected]
Inquiries for On-Ground Programs
Inquiries for On-Ground programs almost matched 2014 in February. But, March fell 15%. § Thanks to a healthy start, in the first quarter of 2015, on-ground inquiry volumes were down just 8%.
─ February fell 1%. ─ January fell 7%.
2012
0 50,000
100,000 150,000 200,000 250,000 300,000 350,000 400,000 450,000 500,000
Jan Feb Mar Apr May Jun Jul Aug Sep Oct Nov Dec
Inquiries
Inquiries for On-Ground Programs All Programs and Award Levels
2014 2015
-15% YOY

617.401.7662 www.GrayAssociates.com 14
GRAY For more information please contact Bob Atkins. Email: [email protected]
After October of 2014, conversions for on-ground programs plummeted. § December finished 27% behind 2013.
─ November was 34% behind 2013.
§ This year is off to a slow start. When Q1 matures, it is likely to be down 10% or more.
- 2,000 4,000 6,000 8,000
10,000 12,000 14,000 16,000 18,000 20,000
Jan Feb Mar Apr May Jun Jul Aug Sep Oct Nov Dec
Inquiry Conversions for On-Ground Programs All Programs and Award Levels
2014 2015 2013
Immature Months1
Student Inquiry Conversions for On-Ground Programs
1. Applications are counted in the month in which the inquiry was received (i.e., an inquiry that is received in January and converts in March will be counted as a January inquiry). Typically, the application rate will rise for at least three months after the month in which the inquiries were received.
617.401.7662 www.GrayAssociates.com 15
GRAY For more information please contact Bob Atkins. Email: [email protected]
0
2000
4000
6000
8000
10000
12000
14000
16000
18000
20000
Jan Feb Mar Apr May Jun Jul Aug Sep Oct Nov Dec
Conversions of External Inquiries All Programs and Award Levels
2014 2015 2013
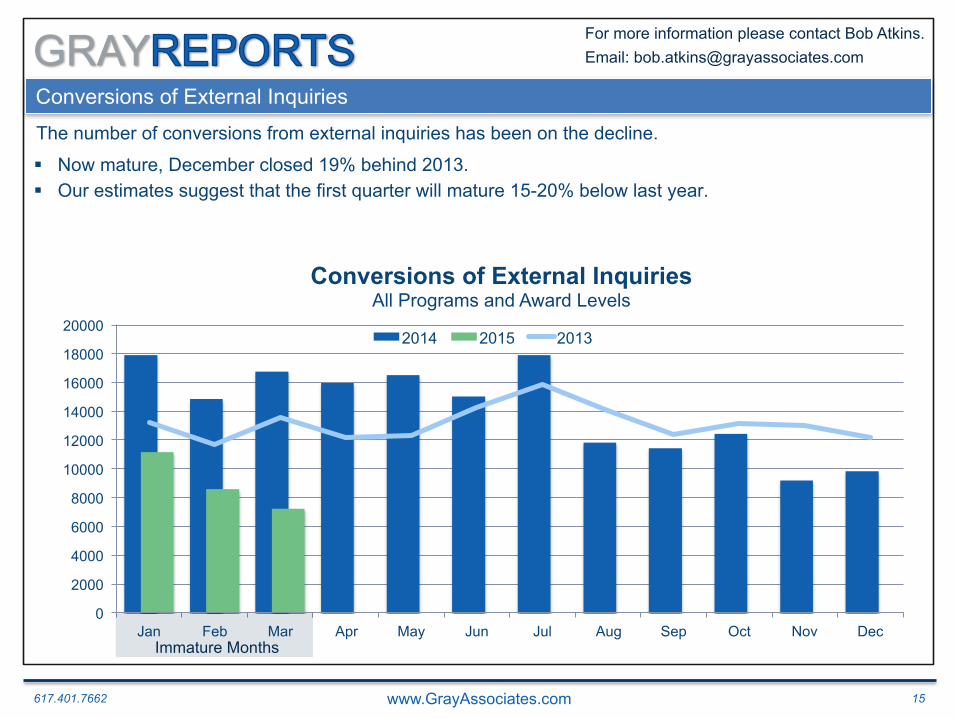
Conversions of External Inquiries
The number of conversions from external inquiries has been on the decline.
§ Now mature, December closed 19% behind 2013. § Our estimates suggest that the first quarter will mature 15-20% below last year.
Immature Months

617.401.7662 www.GrayAssociates.com 16
GRAY For more information please contact Bob Atkins. Email: [email protected]
Conversions of Internal Inquiries
Conversions of internal inquiries held their own in 2104, except in November and December. § November conversion volumes fell 37% while December followed with a 22% decline. § In Q1 2015, the January and February got off to a good start. § March is likely to mature well-below last year.
-
5,000
10,000
15,000
20,000
25,000
Jan Feb Mar Apr May Jun Jul Aug Sep Oct Nov Dec
Conversions of Internal Inquiries All Programs and Award Levels
2014 2015 2013
Immature Months

617.401.7662 www.GrayAssociates.com 17
GRAY For more information please contact Bob Atkins. Email: [email protected]
Agenda
1. National Inquiry Trends
2. Inquiries and Conversions: On-Line vs. On-Ground Programs
3. Views by Program and Segment
4. Geo-Targeting
5. Summary

617.401.7662 www.GrayAssociates.com 18
GRAY For more information please contact Bob Atkins. Email: [email protected]
Largest Programs: March Growth
Three of the five largest programs grew year-over-year.
§ Health Care Administration inquiry volumes jumped 28%. § Accounting and Business Administration were up slightly. § Medical Assisting dropped 17%. § Criminal Justice collapsed, losing 70% year-over-year.
-26% -19%
-5%
2%
-23%
28%
2% 1%
-17%
-72% -80%
-60%
-40%
-20%
0%
20%
40%
Health Care Admin/Management
Accounting Business Admin and Management
Medical Assisting Criminal Justice/Police Science
Year-over-Year Change in March Inquiries Five Largest Programs
2014 YoY % Change 2015 YoY % Change
617.401.7662 www.GrayAssociates.com 19
GRAY For more information please contact Bob Atkins. Email: [email protected]
-52% -47%
33% 38%
-1%
316%
115% 75% 66% 59%
-100%
-50%
0%
50%
100%
150%
200%
250%
300%
350%
Curriculum and Instruction
Educational Leadership and Administration
Welding Tech Registered Nursing Nursing Science
Year-over-Year Change in March Inquiries Five Fastest-Growing Programs
2014 YoY % Change 2015 YoY % Change
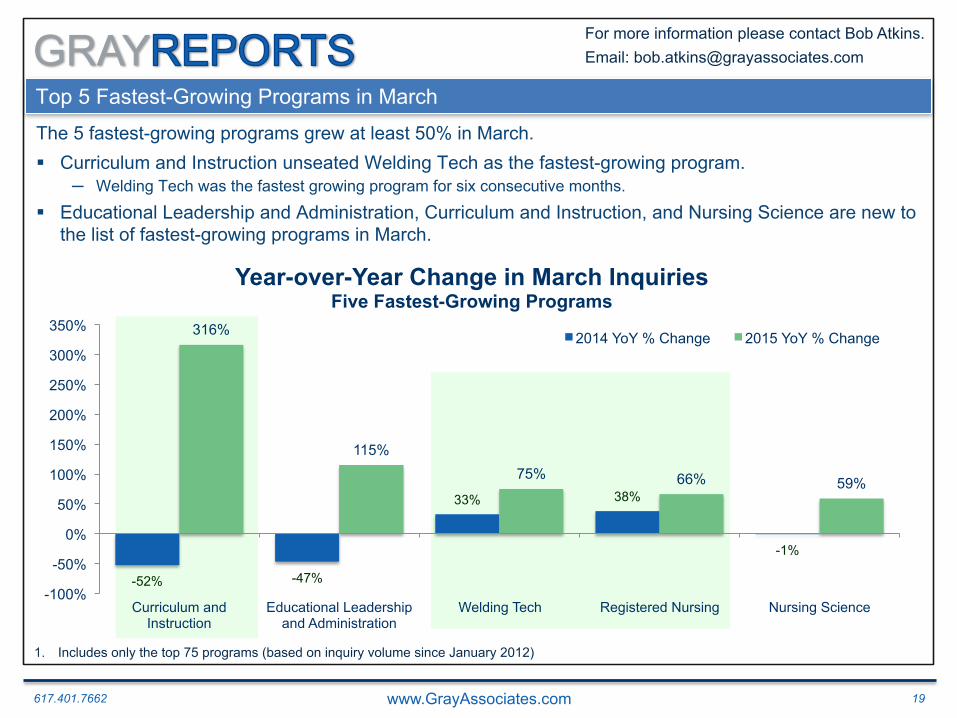
Top 5 Fastest-Growing Programs in March
The 5 fastest-growing programs grew at least 50% in March. § Curriculum and Instruction unseated Welding Tech as the fastest-growing program.
─ Welding Tech was the fastest growing program for six consecutive months.
§ Educational Leadership and Administration, Curriculum and Instruction, and Nursing Science are new to the list of fastest-growing programs in March.
1. Includes only the top 75 programs (based on inquiry volume since January 2012)

617.401.7662 www.GrayAssociates.com 20
GRAY For more information please contact Bob Atkins. Email: [email protected]
Largest Cities for Inquiries
All five of the largest markets experienced a decline in March. § New York and Atlanta declined under 4%. § In March, Los Angeles replaced Chicago as the worst-performing market, declining 26%.
-14% -17%
-13%
-1%
-6% -3%
-4%
-11% -14%
-26% -30%
-25%
-20%
-15%
-10%
-5%
0%
5%
New York Atlanta Chicago Philadelphia Los Angeles
Year-over-Year Change in March Inquiries Top Five Cities for Inquiries
2014 YoY % Change 2015 YoY % Change
Note: The market for each city is defined as a 15-mile radius around the population center of its CBSA.

617.401.7662 www.GrayAssociates.com 21
GRAY For more information please contact Bob Atkins. Email: [email protected]
Fastest-Growing Cities for All Inquiries
Three new cities joined the list of fastest-growers in March. § Oklahoma City followed 35% growth in February with 56% growth in March. § Wichita, KS and Bridgeport, CT are new to the list in March. § Jacksonville, FL and Hartford, CT fell off the list of fastest-growing cities.
-10% -5%
-13% -9% -7%
56%
18% 14% 12% 10%
-15%
-5%
5%
15%
25%
35%
45%
55%
Oklahoma City, OK Wichita, KS Kansas City, MO/KS Bridgeport, CT Indianapolis, IN
Year-over-Year Change in March Inquiries Five Fastest-Growing Cities for All Inquiries
2014 YoY % Change 2015 YoY % Change
1. Includes only the top 75 cities by inquiry volume since January 2012. Data includes a 15-mile radius from the center of the CBSA.

617.401.7662 www.GrayAssociates.com 22
GRAY For more information please contact Bob Atkins. Email: [email protected]
Sustainers vs. Strugglers: Inquiry Volume
The Sustainers grew in March!
-12% -15% -15% -12%
0%
-3% -13% -16%
-31% -44% -46%
-27%
47% 44%
28%
10% 9% 7%
-6% -13%
-7% -7% -11% -9%
-50%
-30%
-10%
10%
30%
50%
Jan Feb Mar Apr May Jun Jul Aug Sep Oct Nov Dec
Sustainers vs. Strugglers Year-over-Year Change in Inquiry Volumes 2014
-15% -11% -8% -6% -8%
2%
-30%
-20%
-10%
0%
10%
Jan Feb Mar Apr May Jun Jul Aug Sep Oct Nov Dec
Year-over-Year Change in Inquiry Volumes 2015
Strugglers
Sustainers

617.401.7662 www.GrayAssociates.com 23
GRAY For more information please contact Bob Atkins. Email: [email protected]
Agenda
1. National Inquiry Trends
2. Inquiries and Conversions: On-Line vs. On-Ground Programs
3. Views by Program and Segment
4. Geo-Targeting
5. Summary

617.401.7662 www.GrayAssociates.com 24
GRAY For more information please contact Bob Atkins. Email: [email protected]
Quarterly Change in Inquiry Volumes by State
The GrayReports service allows you to see where the growth is. § In March, the mid-west, Florida and Massachusetts did well.

617.401.7662 www.GrayAssociates.com 25
GRAY For more information please contact Bob Atkins. Email: [email protected]
% Change in Inquiry Volumes by County
The fastest growth in Massachusetts took place west and south of Boston
617.401.7662 www.GrayAssociates.com 26
GRAY For more information please contact Bob Atkins. Email: [email protected]
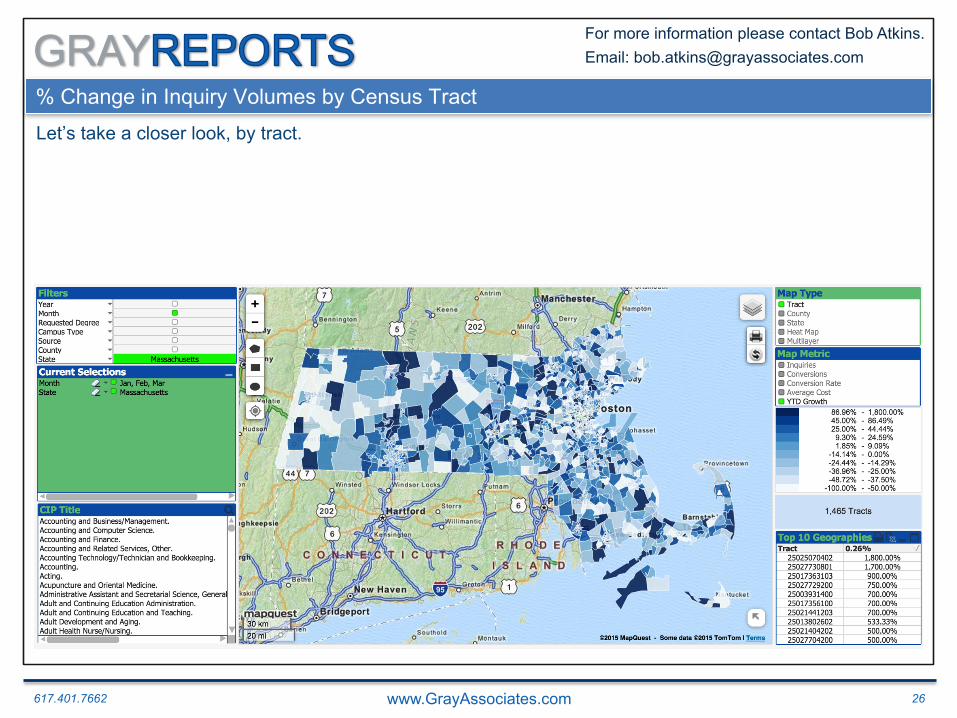
% Change in Inquiry Volumes by Census Tract
Let’s take a closer look, by tract.

617.401.7662 www.GrayAssociates.com 27
GRAY For more information please contact Bob Atkins. Email: [email protected]
% Change in Inquiry Volumes by Census Tract
In Boston, demand was strong just south of the city center

617.401.7662 www.GrayAssociates.com 28
GRAY For more information please contact Bob Atkins. Email: [email protected]
% Change in Inquiry Volumes by Census Tract
While inquiries were strong in this tract, so far in Q1, conversions are not keeping pace.

617.401.7662 www.GrayAssociates.com 29
GRAY For more information please contact Bob Atkins. Email: [email protected]
Agenda
1. National Inquiry Trends
2. Inquiries and Conversions: On-Line vs. On-Ground Programs
3. Views by Program and Segment
4. Geo-Targeting
5. Quarterly Summary

617.401.7662 www.GrayAssociates.com 30
GRAY For more information please contact Bob Atkins. Email: [email protected]
The first quarter of 2015 compared to the first quarter of 2014.
% Change in Inquiry Volumes by Inquiry Source and Campus Type
18.3%
-15.5%
-7.9%
-8.6%
-10.7%
-20.0% -10.0% 0.0% 10.0% 20.0%
Internal
External
Ground Programs
Unknown (CT)
Online Programs Q1 2015 / Q1 2014
All Programs and Award
Levels
617.401.7662 www.GrayAssociates.com 31
GRAY For more information please contact Bob Atkins. Email: [email protected]
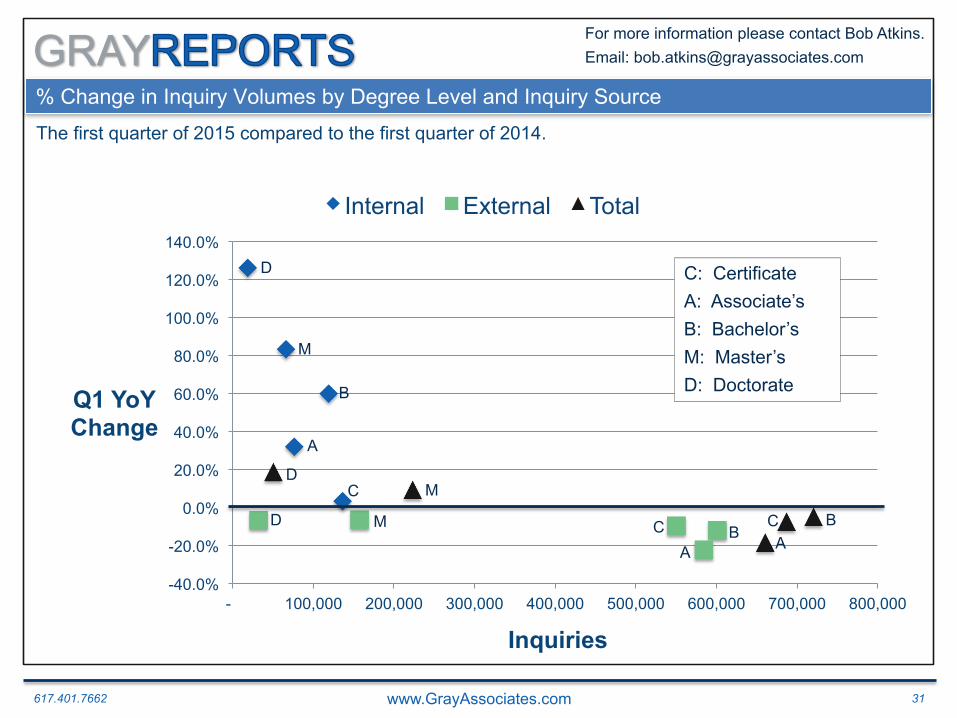
The first quarter of 2015 compared to the first quarter of 2014.
% Change in Inquiry Volumes by Degree Level and Inquiry Source
-40.0%
-20.0%
0.0%
20.0%
40.0%
60.0%
80.0%
100.0%
120.0%
140.0%
- 100,000 200,000 300,000 400,000 500,000 600,000 700,000 800,000
Q1 YoY Change
Inquiries
Internal External Total
C
A
B
D
M
C A
B D M C
A B
D M
C: Certificate A: Associate’s B: Bachelor’s M: Master’s D: Doctorate

617.401.7662 www.GrayAssociates.com 32
GRAY For more information please contact Bob Atkins. Email: [email protected]
Upcoming Gray Associates’ Webinars
Please join us next month!
May Webinar (April Results)
Thursday, May 21st at 1:00 p.m. Eastern Time

Transform Your Staff, Students and Alumni into a Unified Recruitment Team
www.socialhp.com

72% Of High School Students Use Social Media to Research Colleges and Universities Before Applying.
38% Of Students Were Influenced by Social Media When Deciding Where to Enrol.
STUDENTS ARE USING SOCIAL MEDIA TO RESEARCH COLLEGES AND UNIVERSITIES
*
*
*Source: Zinch 2013 Social Media Report
75% Of Students Surveyed Claim That Conversations With Current Students on Social Media Influence Which School They Attend.
*

Creating Your Social Horse Power Account is Super Easy and Takes Minutes.
STEP 1: CREATE YOUR ACCOUNT
HOW CAN WE HELP?
STEP 2: BUILD YOUR TEAM STEP 3: START POSTING

….HOW POWERFUL?

75% Of Students Surveyed Claim That Conversations With Current Students on Social Media Influence Which School They Attend.
*
*Source: Zinch 2013 Social Media Report
WRAPPING IT ALL UP!
www.socialhp.com

We Can Prove It.
Recruit More Students, For Less Money, Faster.
www.socialhp.com

617.401.7662 www.GrayAssociates.com 39
GRAY For more information please contact Bob Atkins. Email: [email protected]
Questions and Contacts
Please feel free to contact:
Bob Atkins CEO
Gray Associates, Inc.
[email protected] 617-366-2836
***
George Kobakov Business Development
SocialHP
[email protected] 416-999-3397


