Subscribe to receive Mining Tax email updates ■ Go to www.revenue.state.mn.us ■ Type Mining in the Search box ■ Click “Mineral Taxes” ■ Click “Subscribe to Mining Tax Information” Our improved website is ready! We’ve redesigned our web pages to better serve you: ■ Comprehensive tax information ■ Timely updates to data and information ■ Data in printer-friendly formats www.revenue.state.mn.us 2015 Mining Tax Guide
Transcript
Subscribe to receive Mining Tax email updates■ Go to www.revenue.state.mn.us■ Type Mining in the Search box■ Click “Mineral Taxes”■ Click “Subscribe to Mining Tax Information”
Our improved website is ready! We’ve redesigned our web pages to better serve you:
■ Comprehensive tax information ■ Timely updates to data and information ■ Data in printer-friendly formats
Ad Valorem Tax on Taconite Railroads27 Taconite Railroad Ad Valorem Tax Assessed . . . . . . . . . . . 35
Ad Valorem Tax on Severed Mineral Interests28 Tax Collection and Distribution . . . . . . . . . . . . . . . . . . . .36
*Indicates that a Microsoft Excel file with this information is available on our website. Go to www.revenue.state.mn.us and type Mining Statistics in the Search Box. Figure 2 is available as a PDF.
i
Minnesota Department of Revenue600 North Robert Street, St. Paul, MN 55101
Peter Clevenstine, Assistant Director 218-231-8443
For publication requests, email [email protected] or call Hibbing Office
Natural Resources Research Institute Toll Free 1-800-234-0054
University of Minnesota, Duluth5013 Miller Trunk Highway, Duluth, MN 55811 218-788-2694
Fax: 218-788-2619Rolf Weberg, Director Larry Zanko, Research Fellow
Coleraine Minerals Research LaboratoryBox 188, One Gayley Ave, Coleraine, MN 55722
Richard Kiesel, Director of Strategic Development 218-667-4201
St. Louis County Inspector of MinesSt. Louis County Garage307 South First St, Virginia, MN 55792 218-742-9840
Fax: 218-471-7270Steve Manninen , Inspector of Mines
The Minnesota Mining Tax Guide is printed on a limited basis by the Minnesota Department of Revenue. It is available on our website at www.revenue.state.mn.us or by calling 218-744-7424. Alternative formats for persons with visual impairments or other disabilities are provided upon request.
Minerals and Mining Agencies
Mining data available on our website!We’ve updated our website to include more mining data. You’ll find:
• Easy-to-understand information about mining taxes• Data charts updated as information becomes available—no need to wait for a paper guide to get the
most recent information• Data available in printer-friendly formats
We think you’ll like this new way of receiving your mining tax information.
We plan to continue to abbreviate the paper guide next year, but for comprehensive information, please visit our website (www.revenue.state.mn.us).
Subscribe for email updates To be notified when new mining data is posted on the website, go www.revenue.state.mn.us and type Mining in the Search box. Click on “Mineral Taxes” then click on “Subscribe to Mining Taxes updates and information.”
1
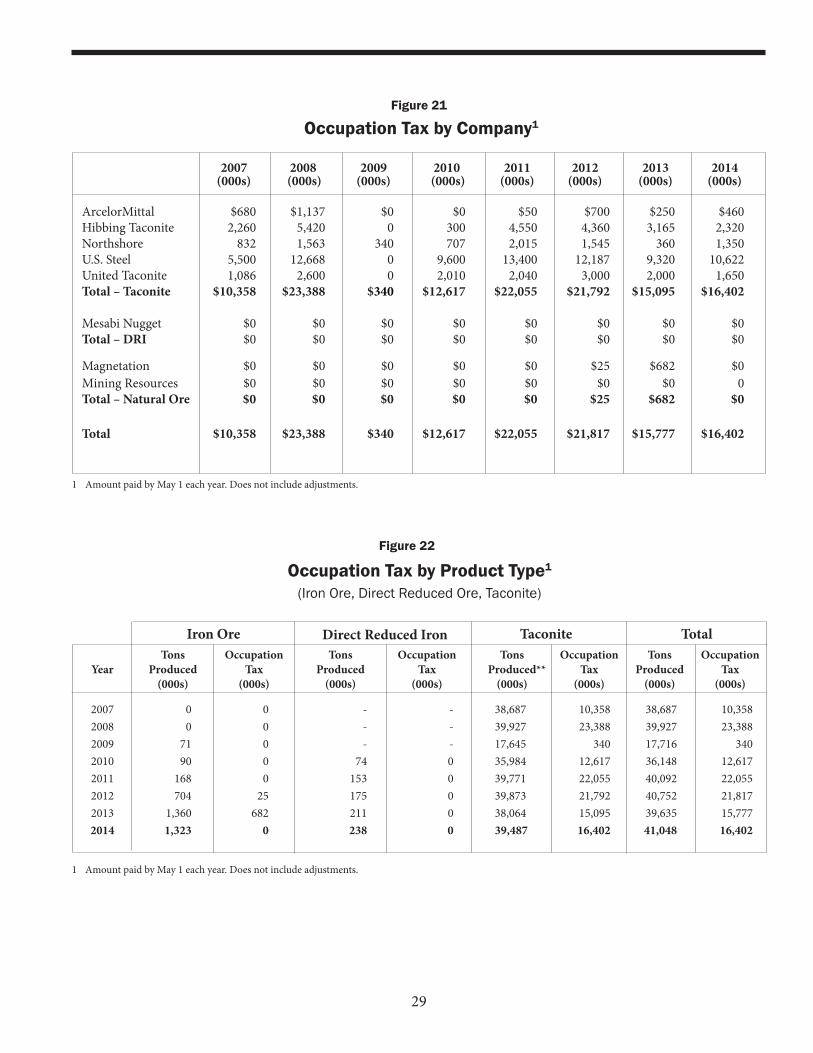
information relating to the Occupation Tax attributable to iron ore and taconite mining is available on pages 27–30.
State Taxes Incidental to Mining Other state taxes impacted by mining include Sales and Use Tax and withholding on royalties. Go to www.revenue.state.mn.us and type Mining in the Search box. Follow the links to Sales Tax Fact Sheet 147 (Taconite and Iron Mining) or Withholding on Mining and Exploration Royalties.
Aggregate Material TaxThis tax is administered at the county level. For more information, go to www.revenue.state.mn.us and type Aggregate in the Search box.
County TaxesOther Taconite and Iron Ore Ad Valorem (Property) taxes are paid directly to the counties. These are Property taxes assessed on auxiliary mining lands, unmined taconite, unmined natural iron ore, taconite railroads and severed mineral interests. More information is available on pages 31–37.
Taxes on Nonferrous MineralsWhile not subject to the Production Tax, nonferrous mining operations are subject to the Net Proceeds Tax and to Ad Valorem Tax. These taxes are explained on page 38.
The Minnesota Mining Tax Guide is published to identify all Minnesota mining-related taxes paid by the mining industry.
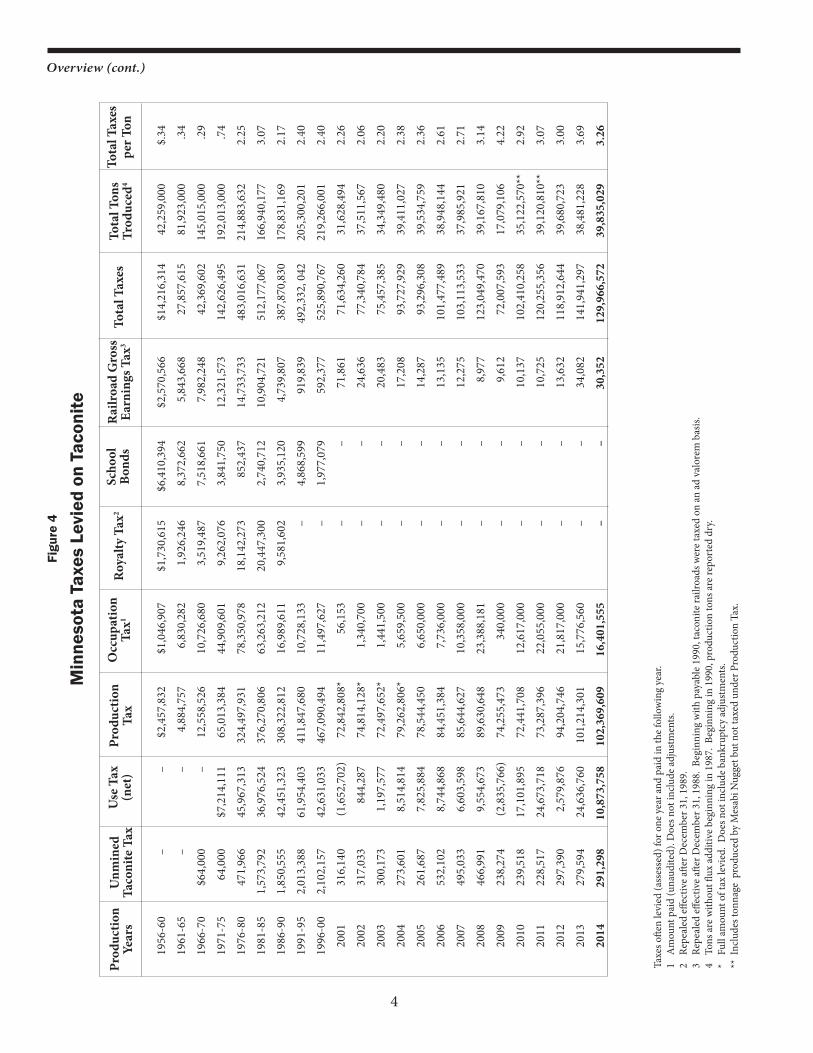
Production TaxThe Production Tax is the largest tax paid by the ferrous mining industry. It is a major source of revenue to the counties, municipalities and school districts within the Taconite Assistance Area. The Production Tax distributed in 2015 is the tax due for the 2014 production year. The tax rate for concentrates and pellets produced in 2014 was $2.597 per taxable ton. An additional tax of three cents per ton is imposed for each 1 percent that the iron content exceeds 72 percent. The taxable tonnage for 2014 is the average tonnage produced in 2012, 2013 and 2014. If this tax is imposed on other iron-bearing material, it is applied to the current-year production.
The inside front cover illustrates how the Production Tax is distributed. It shows both the cents per ton (cpt) distribution and the total amount distributed to various funds. The funds to which the Production Tax are distributed are explained on pages 7–11.
Occupation TaxesMinnesota’s Occupation Tax applies to mining and producing both ferrous minerals, such as taconite and iron ore, and nonferrous minerals, such as silver and copper. To date, only mining of ferrous minerals has occurred in Minnesota. More
Total 40,125,707 187,143,783 262,067,426 86,812,621 323,555,072 187,237,507 320,661,792 544,507,350 1,952,111,258
4
19
56-6
0 –
– $2
,457
,832
$1
,046
,907
$1
,730
,615
$6
,410
,394
$2
,570
,566
$1
4,21
6,31
4 42
,259
,000
$.
34
19
61-6
5 –
– 4,
884,
757
6,83
0,28
2 1,
926,
246
8,37
2,66
2 5,
843,
668
27,8
57,6
15
81,9
23,0
00
.34
19
66-7
0 $6
4,00
0 –
12,5
58,5
26
10,7
26,6
80
3,51
9,48
7 7,
518,
661
7,98
2,24
8 42
,369
,602
14
5,01
5,00
0 .2
9
19
71-7
5 64
,000
$7
,214
,111
65
,013
,384
44
,909
,601
9,
262,
076
3,84
1,75
0 12
,321
,573
14
2,62
6,49
5 19
2,01
3,00
0 .7
4
19
76-8
0 47
1,96
6 45
,967
,313
32
4,49
7,93
1 78
,350
,978
18
,142
,273
85
2,43
7 14
,733
,733
48
3,01
6,63
1 21
4,88
3,63
2 2.
25
19
81-8
5 1,
573,
792
36,9
76,5
24
376,
270,
806
63,2
63,2
12
20,4
47,3
00
2,74
0,71
2 10
,904
,721
51
2,17
7,06
7 16
6,94
0,17
7 3.
07
19
86-9
0 1,
850,
555
42,4
51,3
23
308,
322,
812
16,9
89,6
11
9,58
1,60
2 3,
935,
120
4,73
9,80
7 38
7,87
0,83
0 17
8,83
1,16
9 2.
17
19
91-9
5 2,
013,
388
61,9
54,4
03
411,
847,
680
10,7
28,1
33
– 4,
868,
599
919,
839
492,
332,
042
20
5,30
0,20
1 2.
40
19
96-0
0 2,
102,
157
42,6
31,0
33
467,
090,
494
11,4
97,6
27
– 1,
977,
079
592,
377
525,
890,
767
219,
266,
001
2.40
20
01
316,
140
(1,6
52,7
02)
72,8
42,8
08*
56,1
53
– –
71,8
61
71,6
34,2
60
31,6
28,4
94
2.26
20
02
317,
033
844,
287
74,8
14,1
28*
1,34
0,70
0 –
– 24
,636
77
,340
,784
37
,511
,567
2.
06
20
03
300,
173
1,19
7,57
7 72
,497
,652
* 1,
441,
500
– –
20,4
83
75,4
57,3
85
34,3
49,4
80
2.20
20
04
273,
601
8,51
4,81
4 79
,262
,806
* 5,
659,
500
– –
17,2
08
93,7
27,9
29
39,4
11,0
27
2.38
20
05
261,
687
7,82
5,88
4 78
,544
,450
6,
650,
000
– –
14,2
87
93,2
96,3
08
39,5
34,7
59
2.36
20
06
532,
102
8,74
4,86
8 84
,451
,384
7,
736,
000
– –
13,1
35
101,
477,
489
38,9
48,1
44
2.61
20
07
495,
033
6,60
3,59
8 85
,644
,627
10
,358
,000
–
– 12
,275
10
3,11
3,53
3 37
,985
,921
2.
71
20
08
466,
991
9,55
4,67
3 89
,630
,648
23
,388
,181
–
– 8,
977
123,
049,
470
39,1
67,8
10
3.14
20
09
238,
274
(2,8
35,7
66)
74,2
55,4
73
340,
000
– –
9,61
2 72
,007
,593
17
,079
,106
4.
22
20
10
239,
518
17,1
01,8
95
72,4
41,7
08
12,6
17,0
00
– –
10,1
37
102,
410,
258
35,1
22,5
70**
2.
92
20
11
228,
517
24,6
73,7
18
73,2
87,3
96
22,0
55,0
00
– –
10,7
25
120,
255,
356
39,1
20,8
10**
3.
07
20
12
297,
390
2,57
9,87
6 94
,204
,746
21
,817
,000
–
– 13
,632
11
8,91
2,64
4 39
,680
,723
3.
00
20
13
279,
594
24,6
36,7
60
101,
214,
301
15,7
76,5
60
– –
34,0
82
141,
941,
297
38,4
81,2
28
3.69
20
14
291,
298
10,8
73,7
58
102,
369,
609
16,4
01,5
55
– –
30,3
52
129,
966,
572
39,8
35,0
29
3.26
Taxe
s ofte
n le
vied
(ass
esse
d) fo
r one
yea
r and
pai
d in
the f
ollo
win
g ye
ar.
1 A
mou
nt p
aid
(una
udite
d). D
oes n
ot in
clud
e adj
ustm
ents
.2
Repe
aled
effec
tive a
fter D
ecem
ber 3
1, 1
989.
3 Re
peal
ed eff
ectiv
e afte
r Dec
embe
r 31,
198
8. B
egin
ning
with
pay
able
199
0, ta
coni
te ra
ilroa
ds w
ere t
axed
on
an a
d va
lore
m b
asis.
4 To
ns a
re w
ithou
t flux
add
itive
beg
inni
ng in
198
7. B
egin
ning
in 1
990,
pro
duct
ion
tons
are
repo
rted
dry
.*
Full
amou
nt o
f tax
levi
ed.
Doe
s not
incl
ude b
ankr
uptc
y ad
just
men
ts.
** I
nclu
des t
onna
ge p
rodu
ced
by M
esab
i Nug
get b
ut n
ot ta
xed
unde
r Pro
duct
ion
Tax.
Min
neso
ta T
axes
Lev
ied
on T
acon
iteFi
gure
4
Scho
ol
Bond
sU
se T
ax(n
et)
Prod
uctio
nTa
xO
ccup
atio
nTa
x1R
oyal
ty T
ax2
Tota
l Tax
esTo
tal T
axes
per T
onPr
oduc
tion
Year
sU
nmin
edTa
coni
te T
axR
ailr
oad
Gro
ssEa
rnin
gs T
ax3
Tota
l Ton
sTr
oduc
ed4
Overview (cont.)
5
(M.S. 298.24, 298.27 and 298.28)
Payment Dates and MethodFor taxes payable in 2004 and thereafter, 50 percent of the tax is due on or before February 24 and the remaining 50 percent is due on or before August 24. The Department of Revenue must notify each producer of its tax obligation for the year before February 15.
Each producer must make payments to six counties and the IRRRB on or before the due date. Payments are made to Aitkin, Cook, Crow Wing, Itasca, Lake and St. Louis Counties, and to the IRRRB. The county auditors then make payments to cities, townships, school districts, and other recipients.
Taconite Economic Development Fund (M.S. 298.227) The Taconite Economic Development Fund (TEDF) was first created for production year 1992 at a rate of 10.4 cents per tax-able ton.
No distribution is made under the TEDF in any year in which total industry production falls below 30 million tons. Any portion of the TEDF fund not released within one year of deposit is divided, with two-thirds to the Taconite Environmental Protection Fund and one-third to the Douglas J. Johnson Economic Protection Trust Fund. The 2001 legislature made the TEDF permanent at 30.1 cpt for distributions in 2002 and thereafter. The first 15.4 cents (of the 30.1 cents) did not require a matching investment by the company. A matching expenditure of at least 50 percent is required to qualify for the additional 14.7 cents per ton (above 15.4 cents). Beginning with distributions in 2014, a matching investment of the entire 30.1 cents is required. The legislature reduced the distributions to 25.1 cents beginning with 2015 distributions.
Each producer has two potential sources of TEDF money:
1. Taxable production — The Production Tax amount credited to each producer’s share of the TEDF is 25.1 cpt.
2. Chips, fines and concentrate — An additional amount equal to 50 percent of the tax for chips, fines or concentrate sold not exceeding 5/16-inch, is allocated to each company’s share of the TEDF. The total amount may not exceed $700,000 for all companies. If the total claimed exceeds $700,000, each company’s share will be prorated. The determination of this allocation is based on current production year sales of chips, fines and concentrate—not the three-year average of production. Sales of crushed pellets do not qualify for this credit. [M.S. 298.28, subd. 9a(b).]
Therefore, each company is eligible to receive 25.1 cents per taxable ton plus an additional amount based on current year tons of chips and fines sold.
DefinitionThe Production Tax is a severance tax paid on iron concentrates or pellets produced by the companies. It is paid in lieu of Ad Valorem (Property) taxes on taconite and lands containing taconite. Land and structures used in the production of the products are also excluded from Property Tax, with some exceptions (see pages 31 and 32). Electric power plants principally devoted to the generation of power for taconite mining and concentrating are considered to be used in the production of taconite (or direct reduced ore) and are covered by the in lieu exemption for Property taxes. If part of the power is used for other purposes, that proportion of the power plant is subject to the general Property Tax. The power plant must be owned by a company subject to Production Tax to qualify for the exemptions.
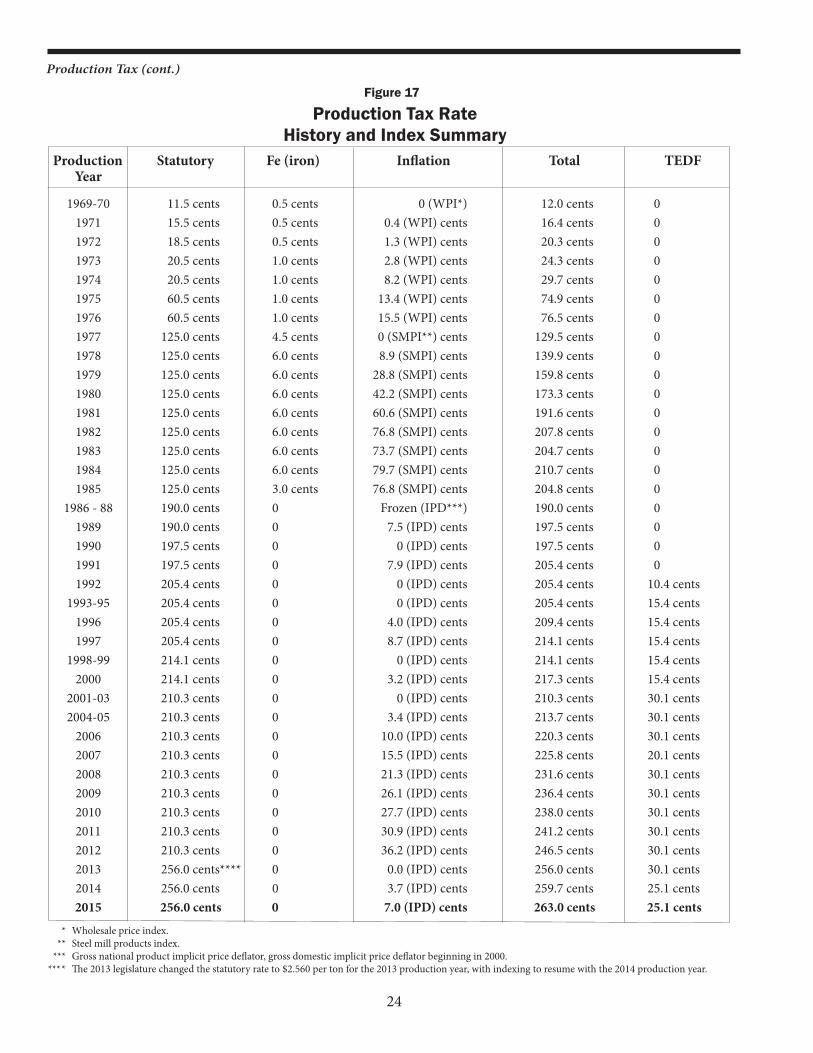
Tax RateThe Production Tax rate for any given year is determined by multiplying the prior year’s rate by the percentage change in the Gross Domestic Product Implicit Price Deflator (GDPIPD) from the fourth quarter of the second preceding year to the fourth quarter of the preceding year. The U.S. Department of Commerce publishes the GDPIPD monthly in Survey of Current Business. This escalator takes effect each year unless the rate is frozen or changed by the Minnesota State Legislature. The tax rate for the 2014 production year was $2.597 per taxable ton. For concentrates produced in 2015, the rate escalated to $2.630 per taxable ton.
Taxable TonsThe Production Tax is levied on taxable tons, which are the average tons produced during the current year and the previous two production years. This eliminates the peaks and valleys of tax payments by the taconite producers and distribution to the tax recipients. The result is a more stable tax base resembling a Property Tax. The tax for a producer of other iron bearing material is based on the current year production.
DistributionUnder Minnesota law, Production Tax revenues are distributed to various cities, townships, counties and school districts within the Taconite Assistance Area. This is an area comprising the present taconite mining areas plus areas where natural ore was formerly mined.
Funds are also allocated to the Iron Range Resources & Rehabilitation Board (IRRRB), which administers the Taconite Environmental Protection Fund (TEPF), the Douglas J. Johnson Economic Protection Trust Fund (DJJ) and the Taconite Economic Development Fund (TEDF) and other programs for the range cities, townships, schools, and the taconite industry. You can find more information about the IRRRB at www.mn.gov/irrrb.
Production Tax
6
Fluxed PelletsFluxed pellets have limestone or other basic flux additives combined with the iron concentrates before pelletizing. Two facilities, ArcelorMittal and Minntac, produce fluxed pellets, although all have experimented with them. United Taconite, Hibbing Taconite, Keewatin Taconite and Northshore are producing a partially fluxed pellet containing a low percentage of limestone additives.
Beginning in 1988 (1987 production year), a flux credit was allowed against Production Tax. M.S. 298.24, subd. 1 (f) allows the weight of flux added to be subtracted from the pellet weight for Production Tax purposes. The taxable weight is the dry weight, less the weight of the flux. The weight of the flux is determined by a metallurgical calculation based on the analyses of the finished pellet, the concentrate and the flux stone. All tables in the Minnesota Mining Tax Guide with production statistics use an equivalent or calculated weight for fluxed pellets.
Occupation Tax is based on iron units and uses the full weight including flux.
Pellet WeighingPellet tonnages are reported on a dry weight basis. This began with the 1990 production year.
Definition of Taconite Tax Relief AreaOne common prerequisite exists for all taconite aids and grants; the recipient must be within the geographic confines of the Taconite Tax Relief Area or the Taconite Assistance Area. This is defined by state laws (M.S. 273.134 and M.S. 273.1341) as follows:
“Taconite Tax Relief Area” means the geographic area contained within the boundaries of a school district that meets the following qualifications:
(1) It is a school district in which the assessed valuation of unmined iron ore on May 1, 1941, was not less than 40 percent of the assessed valuation of all real property and whose boundaries are within 20 miles of a taconite mine or plant; or
(2) It is a school district in which, on Jan. 1, 1977, or the applicable assessment date, there is a taconite concentrating plant or where taconite is mined or quarried or where there is located an electric generating plant which qualifies as a taconite facility.
Definition of Taconite Assistance AreaA “Taconite Assistance Area” means the geographic area that falls within the boundaries of a school district that contains a municipality in which the assessed valuation of unmined iron ore on May 1, 1941, was not less than 40 percent of the assessed valuation of all real property, or contains a municipality in which there was a taconite facility or taconite power plant on January 1, 1977. Any area within the Taconite Tax Relief Area is also considered to be within the Taconite Assistance Area.
State Appropriation (M.S. 298.285)The Department of Revenue determines a state aid amount equal to a tax of 22 cents per taxable ton of iron ore concentrates. It is distributed under M.S. 298.28 as if the aid were Production Tax revenues. The aid is appropriated from the state’s General Fund.
2015 LegislationThe 2015 legislature did not change any provisions of the Production Tax. However, the 2014 legislature made changes to the Production Tax distributions for the following production years:
For 2014 production and forward:(1) The Iron Range School Consolidation and Cooperatively Operated School Account was created and will be administered by the IRRRB. It will receive distributions from the following:• For production years 2014 through 2022, the fund will receive
ten cents per ton from Production Tax. This will be reduced to five cents per ton beginning with the 2023 production year.
• For production years 2014, 2015 and 2016, the fund will receive two-thirds of the amount generated by the increase in the tax rate due to the change in the GDPIPD. This amount is cumulative over the three years.
• Six cents per ton will be annually allocated to the fund from the Occupation Tax by May 15.
(2) For production years 2014, 2015 and 2016, the Douglas J. Johnson Economic Protection Trust Fund will receive the remaining one-third of the amount generated by the increase in the tax rate due to the change in the GDPIPD. This amount is cumulative over the three years.
(3) The escalation factor used for the township fund, 6.5 cent IRRRB fund, Taconite Property Tax Relief Account, and the Douglas J. Johnson Economic Protection Trust fund was frozen for the 2014, 2015 and 2016 production years.
(4) The distribution to the county fund was reduced by five cents per ton to 10.525 cents per ton.
(5) The M.S. 298.225 guarantee distribution to the county fund was reduced by five cents per ton.
(6) The distribution to the Taconite Economic Development Fund was reduced by five cents per ton to 25.1 cents per ton.
For 2016 production and forward, beginning the production year after a taconite school bond receives its last taconite payment, an amount equal to what the bond received from the 2012 (pay 2013) production year distributions will be added to the Iron Range School Consolidation and Cooperatively Operated School Account with the amount being deducted from the same sources as the original bond. (The 2016 production year is the first year this will apply.)
For 2023 production and forward:(1) The distribution to the Iron Range School Consolidation and
Production Tax (cont.)
7
(RAMS) allocation in subd. 8 are subtracted from it. The payment is made on September 15. Each city or township first receives the amount it was entitled to receive in 1975 from the Occupation Tax. The amount is then reduced according to the percentage aid guarantee provisions in M.S. 298.225. For example, if production levels mandate a 90 percent aid guarantee, then the Occupation Tax grandfather amount is also reduced to 90 percent. The remainder of the aid is distributed according to a complex formula using levies, valuation, population and fiscal need factors.
The first step in this formula is to determine the fiscal need factor (FNF). The FNF is a three-year average of the sum of the local government aid (LGA), local levy and Production Tax revenues received by the community. Next, the local effort tax capacity rate equals the fiscal need factor per capita (FNFPC) divided by 17. If the FNFPC is greater than 350, the local effort tax capacity rate (LETCR) is 350 divided by 17 plus the excess over 350 divided by 15. The minimum allowable LETCR is 8.16. The final step in this formula is to compute the distribution index (DI). The DI for a community
equals its FNF minus LETCR times the adjusted net tax capacity divided by 100.
A DI is determined for all eligible communities. A percentage is determined by comparing the DI of a particular community to the total of distribution indexes for all eligible communities. This percentage is then multiplied by the amount of available municipal aid to determine an amount for each community. Prior to this calculation, the Occupation Tax grandfather amounts and special aid for the city of Kinney and township of White are subtracted from the total available to the Taconite Municipal Aid Fund.
The conditions necessary for a municipality to qualify for this aid are identical to the qualifications for the 66 percent Taconite Property Tax Relief listed under subd. 6 (see page 9). The state laws governing Taconite Municipal Aid are M.S. 273.134, 298.28, subd. 1, Clause 2, and 298.282. Distribution detail is shown in Figure 10.
(b) and (c) - Additional money is allocated to cities and townships if more than 75 percent of the city’s assessed valuation consisted of iron ore as of Jan. 2, 1980, or if more than 75 percent of the township’s assessed valuation consisted of
Cooperatively Operated School Account will be reduced from 10 cents per ton to five cents per ton.
(2) The 10.525 cents per ton distribution to the County road and bridge fund will be increased to 15.525 cents per ton.
2015 Distribution of Funds (M.S. 298.28)
Subd. 2 - Cities and Towns Where Mining & Production is located(a) The Taconite Cities and Towns Fund allocates 4.5 cents per
ton to cities and towns where mining and concentrating occur. Fifty percent goes to cities and townships in which mining activity occurs. The remaining 50 percent goes to cities and townships in which concentrating occurs. Note: This is done on a company-by-company basis.
If both mining and concentrating take place in a single taxing district, the entire 4.5 cents is allocated there. If mining occurs in more than one city or town, the revenue (2.25 cpt) is divided based on either a percentage of taconite reserves or a four-year production average. Most taconite mines have mining in two or more areas.
If concentrating is split between two or more cities or towns, the revenue (2.25 cpt) is divided by the percentage of hours worked in each. The primary crusher is considered the first stage of concentration. Distribution detail is shown in Figure 10.
(b) Mining Effects — Four cents per taxable ton is allocated to cities and organized townships affected by mining because their boundaries are within three miles of a taconite mine pit that was actively mined in at least one of the prior three years. If a city or town is located near more than one mine meeting the criteria, it is eligible to receive aid calculated from only the mine producing the largest taxable tonnage. When more than one municipality qualifies for aid based on one company’s production, the aid must be apportioned among the municipalities in proportion to their populations. The money must be used for infrastructure improvement projects.
(c) If there are excess distributions from the 3.43 cent, 24.72 cent, and taconite railroad school funds after covering the levy reduction in M.S. 126C.48, subd. 8, then the excess money must be distributed to the cities and townships within the school district in the proportion that their taxable net tax capacity within the school district bears to the net tax capacity of the school district for Property taxes payable in the year prior to distribution.
Subd. 3 - Taconite Municipal Aid Account(a) The Taconite Municipal Aid is funded at 12.5 cents per
taxable ton. The Kinney-White allocation (par. b and c) and the 0.3 cent Range Association of Municipalities and Schools
If FNFPC < 350, LETCR = FNFPC 17If FNFPC > 350, LETCR* = 350 + (FNFPC- 350) 17 15DI = (FNF minus LETCR*) x Adjusted Net Tax capacity 100* Minimum allowable LETCR = 8.16
8
iron ore on Jan. 2, 1982. The distribution is calculated using certified levies, net tax capacities and population. Currently, only White Township and the city of Kinney qualify.
(d) The Township Fund was funded at 3 cents per ton for townships located entirely within the Taconite Tax Relief Area for 2009 distributions. For distributions in 2010 and subsequent years, the 3 cents is escalated in the same proportion as the Implicit Price Deflator as provided in M.S. 298.24, subd. 1. However, the escalation is frozen for distributions made in 2015 through 2017. The money is distributed to the townships on a per capita basis with a maximum of $50,000 per township. If a township would receive more than $50,000, the portion that exceeds $50,000 is redistributed among the townships under $50,000.
Subd. 4 - School Districts(a) A total of 32.15 cents per taxable ton is allocated under (b)
and (c), plus the amount in paragraph (d).
(b) (i) Taconite School Fund (3.43 cents) A total of 3.43 cents per taxable ton for each producer
is allocated to school districts in which mining and concentrating occurs. If the mining and concentrating take place in separate districts, 50 percent is allocated to the location of mining and 50 percent to concentrating. In addition, if the mining occurs in more than one school district, the 50 percent portion is further split based on either a four-year average of production or a percentage of taconite reserves. If the concentrating function of a company takes place in more than one school district, the 50 percent portion is further split according to hours worked in each district. The primary crusher, tailings basin and power plant owned by a taconite company are considered part of concentrating. When these are in different school districts from the plant, the hours-worked split is used. Distribution detail is shown in Figure 11.
(b) (ii) School Building Maintenance Fund (4 cents) Four cents per taxable ton is allocated to specified school
districts, based on proximity to a taconite facility, to be used for building maintenance and repairs. The money allocated from each taconite facility shall be apportioned between its recipient school districts based on pupil units.
a. Keewatin Taconite proceeds are allocated to the Coleraine and Nashwauk-Keewatin districts.
b. Hibbing Taconite proceeds are allocated to the Chisholm and Hibbing districts.
c. ArcelorMittal and Minntac proceeds are allocated to the Mountain Iron-Buhl, Virginia, Mesabi East and Eveleth-Gilbert districts.
d. Northshore Mining proceeds are allocated to the St. Louis County and Lake Superior districts.
e. United Taconite proceeds are allocated to the St. Louis County and Eveleth-Gilbert districts.
Production Tax (cont.)
This additional money is not subject to the 95 percent levy limitations in M.S. 126C.48, subd. 8.
(c) Regular School Fund (24.72 cents) A total of 24.72 cents per taxable ton is split among the 15
school districts in the Taconite Assistance Area. Each school district receives the amount it was entitled to receive in 1975 from the taconite Occupation Tax (under M.S. 298.32). This amount may be increased or reduced by the percentage aid guarantee provisions of M.S. 298.225. The remaining amount in the fund is distributed using an index based on pupil units and tax capacities. Generally, districts with larger tax capacities per pupil unit tend to receive a proportionately smaller amount of this fund. Eleven cents per ton of this distribution is not subject to the 95% levy limitation in M.S. 126C.48, subd. 8. Distribution detail is shown in Figure 11.
The index is calculated as follows: The pupil units for the prior school year are multiplied by the ratio of the average net tax capacity per pupil unit of all taconite districts to the adjusted net tax capacity per pupil unit of the district. Each district receives the portion of the distribution that its index bears to the sum of the indexes for all taconite school districts.
(d) Taconite Referendum Fund (21.3 cents) The Taconite Referendum Fund (TRF) receives an allocation
of 21.3 cents per taxable ton. Taconite school districts receive money from the fund on July 15 based on two calculations: (1) an additional $175 per pupil unit over and above state aids by passing a special levy referendum equal to 1.8 percent of net tax capacity. The pupil units used in the computation are the greater of the previous year or the 1983-84 school year units. The fund pays the difference between the local levy and $175 per pupil unit. (2) A second calculation equal to 22.5 percent of the amount obtained by subtracting 1.8 percent of the district’s net tax capacity from the district’s 2012 weighted average daily membership times the sum of (A) $415, plus (B) the district’s fiscal year 2013 referendum allowance. If any money remains in the fund, it is distributed to the Taconite Environmental Protection Fund (two-thirds) and the Douglas J. Johnson Economic Protection Trust Fund (one-third). Note: A district receiving money from the TRF must reserve the lesser of $25 or the amount received per pupil unit (of the $175 authorized) for early childhood programs or outcome-based learning programs. Distribution detail is in Figure 11.
(e) Each school district is entitled to receive the amount it received in 1975 under M.S. 298.32 (Occupation Tax Grandfather).
Subd. 5 - Counties(a) The allocation of 21.05 cents per taxable ton to counties
(subject to adjustment by M.S. 298.225) is to be distributed under subd. 5(b) through (d). The amounts listed in (b) and
9
(d) are the statutory amounts prior to any adjustment by M.S. 298.225. Distribution detail is shown in Figure 13.
(b) Taconite Counties with Mining or Concentrating An amount of 10.525 cents per taxable ton is distributed to
the county in which the taconite is mined or quarried or in which the concentrate is produced (split in the same manner as taconite cities and towns), less any amount distributed in subd. 5(c). Distribution detail is shown in Figure 13.
(c) Counties - Electric Power Plant If an electric power plant owned by and providing the
primary source of power for a taconite plant is located in a county other than the county in which the mining and concentrating processes are conducted, one cent per ton (for that company) is distributed to the county in which the power plant is located. This one cent is not escalated but is subject to M.S. 298.225 adjustment with variable guarantee.
Cook County continues to receive aid based on Minnesota Power’s power plant, located in Taconite Harbor, due to the guarantee provided by M.S. 298.225. (Minnesota Power has owned and operated the power plant since purchasing it during LTV’s bankruptcy in 2001.) For the 2014 production year, this amounted to $92,916. The one cent per ton distribution for the 1983 base year was figured on 9,793,639 tons. The current year M.S. 298.225 guarantee percentage is always applied.
$0.01 x 9,793,639 x 94.873930% = $92,916
There is also a transfer of $21,373 ({1983 base of $22,528} x 94.873930%) to the county fund covered in subd. 6(b). Therefore, Cook County receives a total of $114,289 due to the power plant.
(d) Taconite County Road and Bridge Each county receives a portion of the aid that is deposited
in the County Road and Bridge Fund in the same manner as taconite cities and towns. The basic allocation is 10.525 cents per taxable ton and will increase to 15.525 cents per taxable ton beginning with the 2024 distributions. It is subject to adjustment as in M.S. 298.225. Distribution detail is shown in Figure 13.
Subd. 6 - Taconite Property Tax Relief(a) Taconite Property Tax Relief The amount sent to this fund was rebased by the 2013
legislature at 34.8 cents per taxable ton for the 2013 production year. The fund will resume indexing by using the Gross Domestic Product Implicit Price Deflator beginning with the 2017 production year. The qualifications and distribution of Taconite Property Tax Relief are described in the following paragraphs.
The Taconite Homestead Credit reduces the tax paid by owners of certain properties located on the Mesabi and
Vermillion ranges located within the Taconite Tax Relief Area. The properties receiving this credit are owner-occupied homes and owner-occupied farms.
If an owner-occupied home or farm is located in a city or town that contained at least 40 percent of its valuation as iron ore on May 1, 1941, or which had a taconite mine, processing plant, or electric generating facility on January 1, 1977, or currently has a taconite mine, processing plant, or electric generating facility, the taconite credit is 66 percent of the tax, up to a maximum credit of $315.10 for taxes payable in 2015.
If the property is not located in such a city or town, but is located in a school district containing such a city or town, the taconite credit is 57 percent of the tax, up to a maximum credit of $289.80.
The total amount of Taconite Property Tax Relief paid in each county and school district is listed in Figure 7. An example of the calculation is shown in Figure 8.
State laws governing Taconite Property Tax Relief are contained in M.S. 273.134 to M.S. 273.136 and M.S. 298.28, subd. 6. This is guaranteed by the Douglas J. Johnson Economic Protection Trust Fund as stated in M.S. 298.293.
b) Electric Power Plant Aid from Property Tax Relief For any electric power plant located in another county, as
described in 5(c), 0.1875 cent per taxable ton (cpt) from the Taconite Property Tax Relief Account is paid to the county. The distribution is subject to the M.S. 298.225 vari-able guarantee. For the 2014 production year, $21,373 was distributed, with the entire amount coming from the M.S. 298.225 guarantee (calculation details under (c) Counties).
(c) Electric Power Plant Aid from Property Tax Relief This subdivision allocates 0.4541 cent per LTV’s taxable
tonnage to the Cook County school district due to LTV’s power plant in Cook County. The distribution is subject to the M.S. 298.225 guarantee at 31.2 percent or the variable rate, whichever is less. For the 2014 production year, $21,087 was distributed. This is calculated by multiplying the 1983 base of $67,586 x .312 = $21,087.
Subd. 7 — Iron Range Resources & Rehabilitation Board (IRRRB)An amount of 6.5 cents per taxable ton escalated by the Gross National Product Implicit Price Deflator is allocated to the IRRRB (subject to M.S. 298.225 guarantee). However, the escalation is frozen for distributions made in 2015 through 2017. The funds are used by the IRRRB for general operating expenses and community development grants.
Subd. 7a — Iron Range School and Consolidation and Cooperatively Operated School AccountThis account was created by the 2014 legislature and is managed by the IRRRB. It will receive distributions from the following:
10
Subd. 9d — Iron Range Higher Education AccountFive cents per taxable ton must be allocated to the IRRRB to be deposited in the Iron Range Higher Education Account to be used for higher education programs conducted at educational institutions in the Taconite Assistance Area defined in M.S. 273.1341. The Iron Range Higher Education committee under M.S. 298.2214 and the IRRRB must approve all expenditures from the account.
Subd. 10 — IndexingBeginning with distribution in 2000 (1999 production year), the amounts determined under subd. 6, paragraph (a), and subd. 9 are increased in the same proportion as the increase in the implicit price deflator as provided in M.S. 298.24, subd. 1.
Subd. 11— Remainder(a) After calculating the initial distributions to the various funds
and grandfathered amounts including (b) & (c) below, the remainder is distributed two-thirds to the TEPF and one-third to the DJJ. Any interest earned on money on deposit by the counties is sent to the IRRRB to be split into the two funds using the same two-thirds/one-third apportionment.
(b) Taconite Railroad Until 1978, the taconite railroad gross earnings tax was
distributed to local units of government based on a formula of 50 percent to school districts, 22 percent city or town, 22 percent county, and six percent state. The respective shares were further split based on miles of track in each government unit. Beginning in 1978, the distributions were frozen at the 1977 level and funded from Production Tax revenues. The total amount distributed in 2015 was $2,482,454. Taconite railroad aids are not subject to the percentage reduction mandated for other aids by M.S. 298.225 and so remain constant from year to year. Beginning with the 2002 production year, the taconite railroad distribution to schools was reduced to 62 percent of the 1977 amount.
(c) Occupation Tax Grandfather Amount to IRRRBIn 1978 and each year thereafter, the amount distributed to the IRRRB was the same as it received in 1977 from the distribution of the taconite and iron ore Occupation taxes: $1,252,520.
Additional PaymentsIn Minnesota Laws 2013, Chapter 143, Article 11, Section 11, the legislature authorized the commissioner of IRRRB to issue $38,000,000 in revenue bonds to make grants to school districts within the Taconite Assistance Area. The grants are to be used for various building projects with the exception of ISD 2142 which must use the grant for debt service reduction for a bond passed in 2009. The revenue bonds are paid from Production Tax revenues prior to the calculation of the remainder under M.S. 298.28, subd. 11, with a maximum of 10 cents per ton. Any amount above 10 cents per ton will be paid by the DJJ fund.
Production Tax (cont.)
(a) For distribution years 2015 through 2023 it will receive 10 cents per taxable ton. Beginning with distribution year 2023, it will be reduced to 5 cents per ton.
(b) For distribution years 2015, 2016 and 2017, the fund will receive two-thirds of the amount generated by any increase of the tax rate due to change in the implicit price deflator. For distribution year 2015, the calculated amount is the two-thirds of the dollar amount generated due to the tax rate change. For 2016, it is the calculated amount for 2015, plus the amount calculated for 2016. For 2017, it is the amounts calculated for 2015 and 2016, plus the amount calculated for 2017.
(c) Also, beginning the distribution year after a taconite school bond receives its last taconite payment, an amount equal to what the bond received from the 2012 pay 2013 production year distributions will be added to the fund with the money being deducted from the same sources as the original bond. The first bond eligible is Ely with distributions beginning in 2017.
Subd. 8 — Range Association of Municipalities & Schools (RAMS)An amount equal to 0.3 cent per taxable ton (subject to M.S. 298.225 guarantee) is paid to the RAMS to provide an area-wide approach to problems that demand coordinated and cooperative actions. All cities, towns and schools in the taconite and iron ore mining area are included. This amount is subtracted from the Taconite Municipal Aid distribution in subd. 3.
Subd. 9 — Douglas J. Johnson Economic Protection Trust Fund (DJJ)In addition to the amount provided in the remainder after all other distributions are completed, 3.35 cents per taxable ton is allocated to the DJJ. The cents per ton is normally increased in the same proportion as the implicit price deflator as provided in M.S. 294.24, subd 1. However, the escalation for this fund was frozen for distributions in 2015 through 2017.
In addition to the above, for distributions in 2015 through 2017, the DJJ receives one-third of the tax generated due to the increase in the tax rate.
Subd. 9a — Taconite Economic Development FundThis subdivision is explained on page 5.
Subd. 9b — Producer GrantsFive cents per taxable ton must be paid to the Taconite Environ-mental Protection Fund (TEPF) for use under M.S. 298.2961, subd. 4. The fund also receives a fixed amount equal to the increased tax proceeds due to the tax rate change for 2005 dis-tributions, as stated in subd. 10 (b).
Subd. 9c — City of EvelethThe City of Eveleth shall receive 0.20 cents per taxable ton for sup-port of the Hockey Hall of Fame provided that an equal amount of donations have been received. Any amount of the 0.20 cents per ton that exceeds the donations shall be distributed to the IRRRB.
11
Although the following payments are not included in M.S. 298.28 or its subdivisions, they are subtracted after dividing the remainder described in subd. 11.
These payments are listed in detail on page 21 and consist of school bond payments to school districts within the Taconite Tax Relief Area and Taconite Assistance Area. Most are funded 80 percent taconite and 20 percent local efforts.
In Minnesota Laws 2005, Chapter 152, Article 1, Section 39 the legislature authorized the commissioner of IRRRB to issue $15,000,000 in revenue bonds to make grants to school districts in the Taconite Tax Relief Area or Taconite Assistance Area. The bonds are to be used by the school districts to pay for health, safety and maintenance improvements. The bonds are funded in equal shares from the TEPF and the DJJ. Minor amendments were made by the 2006 legislature.
Aid Guarantee (M.S. 298.225)The recipients of the Production Tax, provided in M.S. 298.28, subds. 2 to 5, subd. 6, paragraphs (b) and (c) and subds. 7 and 8, are guaranteed to receive distributions equal to the amount distributed to them with respect to the 1983 production year, provided that production is not less than 42 million taxable tons. If the production is less, the amount distributed from the fund is reduced proportionately by two percent per each 1,000,000 tons by which the taxable tons are less than 42 million tons. For example, if the taxable tonnage (three-year average) is 39.8 million then the proportionate reduction is 4.4 percent. This is calculated by multiplying two percent times 2.2 million tons.
This aid guarantee is funded equally from the initial current year distributions to the TEPF and the DJJ. If the initial distributions are insufficient to fund the difference, the commissioner of the IRRRB makes the payments of any remaining difference from the existing balance of the TEPF and the DJJ in equal proportions.
The commissioner of the Minnesota Department of Revenue determines the amounts. The aid payments covered by this variable guarantee are listed as follows:
1. 4.5 cents—Taconite Cities and Towns Fund (uses 1999 production year as base year)
2. 12.2 cents—Taconite Municipal Aid Account
3. 21.3 cents— Taconite Referendum Fund
4. 6.5 cents—escalated to IRRRB
5. 0.3 cent—RAMS
6. 0.1875 cent—Electric Power Plant Aid is transferred from Taconite Property Tax Relief Account to Cook County
7. 4 cents - Mining Effects Fund (uses 1999 production year as base year)
The following funds are guaranteed at 75 percent or the variable guarantee, whichever is less:
1. 10.525 cents—Taconite County Fund
2. 10.525 cents—Taconite County Road and Bridge Fund
The following funds are guaranteed at 31.2 percent or the variable guarantee, whichever is less:
1. 24.72 cents—Regular School Fund
2. 3.43 cents—Taconite School Fund
3. 0.4541 cent—Electric Power Plant Aid is transferred from Taconite Property Tax Relief Account to School District 166, Cook County
The Taconite Property Tax Relief Account is not covered by M.S. 298.225, but is separately guaranteed by the DJJ, as stated in M.S. 298.293.
12
M.S. 298.28 Payment Recipients Cents per Taxable TonSubd. 2a Taconite cities and towns 4.5 Subd. 2b Taconite cities and towns (mining effects) 4.0 Subd. 3 Taconite Municipal Aid Account 12.2Subd. 3(d) Township Fund 3.0*Subd. 4 School districts
(b)(i) Taconite schools (mining and/or concentrating in the district) 3.43(b)(ii) School Building Maintenance Fund 4.0 (c) Regular School Fund (distributed by formula) 24.72 (d)Taconite Referendum Fund (formula amount–see page 9)
Subd. 5 Counties (b and c) Taconite counties (includes electric power plant) 10.525 (d) Taconite county Road and Bridge 10.525 Counties total 21.05
Subd. 6 Taconite Property Tax Relief(includes .6416 cents for Cook County and Cook County Schools) 34.8*
Subd. 7 IRRRB 6.5*Subd. 7a Iron Range School Consolidation and Cooperatively Operated
School Account 10.0 Subd. 8 Range Association of Municipalities and Schools 0.3 Subd. 9 Douglas J. Johnson Economic Protection Trust Fund 3.35* Subd. 9a Taconite Economic Development Fund 25.1 Subd. 9b Taconite Environmental Fund for use in Producer Grants 5.0**Subd. 9c City of Eveleth (Hockey Hall of Fame) 0.2Subd. 9d Iron Range Higher Education Account 5.0 Subd. 10 Indexing provisions - Subd. 11 Distribution of remainder -
Production Tax Distribution Calculation (M.S. 298.28)The producers make the Production Tax payments directly to six counties (Cook, Lake, St. Louis, Itasca, Crow Wing and Aitkin) and the IRRRB. Each county auditor is responsible for making the taconite aid payments to the various jurisdictions within the county. St. Louis County was designated as fiscal agent for the Taconite Property Tax Relief Account and issues Taconite Property Tax Relief checks to the other counties. The state of Minnesota also makes a payment of 22 cents per taxable ton
(payable 2015). This money was added to the amount available for distribution.
The Minnesota Department of Revenue makes all computations regarding the amount paid by the companies, state and the aid payments due to cities, schools, townships, counties and IRRRB. Interest earnings on undistributed funds are remitted by the counties to the IRRRB.
The proceeds of the 2014 Production Tax (payable 2015) were distributed as follows:
* These funds are escalated using the Gross Domestic Product Implicit Price Deflator. After escalation, the cents per tonfor Township fund was 3.25 cents, Taconite Property Tax Relief was 34.8 cents, IRRRB was 8.75 cents, and the Douglas J.Johnson Economic Protection Trust Fund was 4.44 cents.
** Plus amount of revenue due to tax increase generated in pay 2005.
The full amount distributed, including escalation and M.S. 298.225 guarantees, is listed in Figure 9.
Production Tax (cont.)
13
DJJ and TEPF Fund Balances
Figure 5
Period Ending DJJ Balance TEPF Balance
June 30, 2005 $83,433,221 $15,691,497 June 30, 2006 80,394,959 9,234,489 June 30, 2007 84,478,169 9,659,460 June 30, 2008 88,971,850 8,332,921 June 30, 2009 91,327,362 10,849,252 June 30, 2010 95,098,257 17,047,396 June 30, 2011 83,749,720 16,816,569 June 30, 2012 85,974,981 14,686,541 June 30, 2013 89,788,626 10,802,916 June 30, 2014 $66,697,130 $11,195,092 June 30, 2015 $66,647,375 $9,690,698
DJJ Major Withdrawals
Feb. 2006 $6.49 million Loan to Mesabi Nugget (LTV Lands)May 2009 $6.04 million Mesabi Nugget Loan repayment/transfer (M.S. 298.2931 and 298.223, subd. 1[6])Oct. 2010 $8.7 million Redemption of Giants Ridge Revenue BondsJune 2011 $4 million Loan to PolyMet MiningJune 2012 $250,000 Big Trout Lakes—Chisholm propertyJune 2013 ($2 million) GR Bond Redemption repaymentNov. 2013 $5.04 million Loan to Chisholm/Hibbing AirportApril 2014 $20 million Loan to SegetisJune 2014 $6.19 million Giants Ridge—Event CenterDec. 2014 $6.50 million Magnetation—Direct Loan
Taconite Environmental Protection Fund (TEPF) and Douglas J. Johnson Economic Protection Trust Fund (DJJ) (M.S. 298.223 and 298.291) The TEPF and the DJJ (formerly known as Northeast Minnesota Economic Protection Trust Fund) were established by the 1977 Legislature. These two funds receive the remainder of the Production Tax revenues after all distributions are made according to M.S. 298.28. The remainder is split with one-third to the DJJ and two-thirds going to the TEPF.
The TEPF was created for the purpose of reclaiming, restoring and enhancing those areas of Minnesota that are adversely affected by environmentally damaging operations involved in mining and producing taconite and iron ore concentrate. The scope of activities includes local economic development projects. The IRRRB commissioner administers the fund, and the board and the governor approve projects.
The DJJ is somewhat different in that only interest and dividends earned by the fund may be spent before January 1, 2028. Expenditures from the principal may be made with approval from the IRRRB for economic development projects.
14
Total by School District Total by County Mobile home Real property Mobile home Real property Total
166 - Cook County $1,217 $527,896 (69) St. Louis $12,839 $8,405,910 $8,418,749316 - Coleraine 2,039 848,765 (31) Itasca 2,866 1,249,818 1,252,684319 - Nashwauk-Keewatin 827 401,053 (38) Lake 321 1,135,964 1,136,285381 - Lake Superior 669 1,403,585 (16) Cook 1,217 527,896 529,113695 - Chisholm 152 581,461 (36) Koochiching 0 4,851 4,851696 - Ely 332 554,819 701 - Hibbing 6,068 1,760,367 Total Payable 2014 $17,243 $11,324,439 $11,341,682706 - Virginia 333 1,012,691712 - Mt. Iron-Buhl 2,967 453,120 2142 - St. Louis County 1,473 1,956,0612154 - Eveleth-Gilbert 473 918,9532711 - Mesabi East 693 905,668
Total Payable 2014 $17,243 $11,324,439
Year Payments Interest & Payments Out Balance Payable into Account1 Other (by formula) December 31
Taconite Property Tax ReliefThe taconite homestead credits described on page 9 are administered by the county auditors. Distribution is determined by the formula described on page 15. The amounts do not equal the total Production Tax allocated for Property Tax Relief shown in the tables as collections or payments. The difference is carried
in the Taconite Property Tax Relief Fund balance with St. Louis County as fiscal agent. If the fund balance and Production Tax collections are not sufficient to make the payments, the deficit is made up from the Douglas J. Johnson Economic Protection Trust Fund. The last time this occurred was in 1989.
Figure 6
Figure 7
Taconite Property Tax Relief Fund Balance
2014 Taconite Property Tax Relief Fund Distribution
1 Listed under year payable; for example, 2015 payments result from 2014 production.2 Includes bankruptcy settlements of $49,173 from United Taconite in 2005; $729,423 from LTV in 2006; $1,312,081 from EVTAC in 2008; and $36,324 from EVTAC in 2009.3 Includes $10,887,059 in public works and local economic development projects.4 Includes $4,323,954 in public works and local economic development projects.5 Includes $9,032,845 in public works and local economic development projects.6 Includes $14,826,100 in public works and local economic development projects.7 Includes $7,468,717 in public works and local economic developments projects.
Mobile homes are taxed differently from other real estate in that they are assessed and taxed in the same year.The supplemental Property Tax Relief paid from the State General Fund revenue to the Deer River (Itasca Co.), Floodwood (St. Louis Co.), Aitkin, Crosby-Ironton and Grand Rapids school districts is not included in any of the Production Tax tables.
City and township $1,707,978 $1,706,822 $2,066,752 $2,134,737 $2,125,786 Township Fund 938,421 949,390 1,223,128 1,287,505 1,281,952 Taconite municipal aid 5,234,627 5,223,462 6,355,475 6,633,334 6,589,995 Special City/Township Fund** 93,382 157,055 157,055 157,055 157,055 Mining effects 1,474,603 1,472,299 1,758,238 1,794,389 1,789,718 School district — taconite 1,296,216 1,294,390 1,566,247 1,610,748 1,604,891 School district — regular 5,670,746 5,662,383 6,908,326 10,676,982 10,634,759 School Building Maintenance Fund 1,217,160 1,214,044 1,506,072 1,535,158 1,531,417 Taconite Levy Shortfall Payment 807,218 – – – – Taconite Referendum Fund 2,974,743 3,077,212 3,091,236 6,178,596 6,178,596 County 8,862,567 8,866,377 9,000,065 9,095,093 7,114,672 County road and bridge 3,657,961 3,652,361 4,486,556 4,623,110 4,605,134 Taconite Property Tax Relief 11,846,794 12,801,910 16,493,071 13,783,501 13,724,064 IRRRB ($.065 Indexed) 2,811,548 2,840,686 3,636,468 3,819,425 3,803,209 Range Association of Municipalities and Schools 110,294 110,110 137,802 142,382 142,200 Taconite railroad (fixed) 2,482,454 2,482,454 2,482,454 2,482,454 2,482,454 IRRRB (fixed) 1,252,520 1,252,520 1,252,520 1,252,520 1,252,520 School bond payments 4,021,158 3,542,825 3,363,147 2,631,867 2,608,285 Taconite Environmental Protection Fund 6,386,643 6,897,113 13,318,892 12,938,216 12,993,550 Producer Grant & Loan Fund 2,782,967 2,780,307 3,176,600 3,241,471 3,232,931 Douglas J. Johnson Economic Protection Trust Fund 842,910 1,214,783 5,017,442 5,080,122 5,633,213 IRRRB Educational Revenue Bonds 1,408,725 1,408,525 1,411,925 4,147,804 3,993,464 Iron Range Higher Education Acct 1,521,884 1,519,224 1,915,517 1,980,388 1,971,848 Iron Range School Consolidation...Acct– – – – – 4,916,476 Taconite Economic Development Fund 9,673,605 9,845,732 12,231,412 12,621,936 10,598,678 Hockey Hall of Fame 60,876 – 76,621 79,216 78,874 Excess school levy replacement money*** – (309,725) (1,742,074) (2,313,588) (633,976) Levy replacement money to cities/townships*** – 309,725 1,742,074 2,313,588 633,976
Total $79,138,000 $79,971,984 $102,633,021 $109,928,009 $111,045,741
* The Production Tax is collected and distributed in the year following production. For example, the 2014 Production Tax was collected and distributed during 2015.
** Prior to 2009, this amount was included in the taconite municipal aid amounts.*** If the combined total of the school district fund, regular school fund and taconite railroad exceeds the levy replacement amount, the excess is
transferred to cities & townships within the district.
Production Tax (cont.)
17
Figure 10
2015 Production Tax Distribution to Cities and Townships (Based on 2014 production year tax revenues)
4.5 cent 4.0 cent M.S. 298.28 3.0 cent Taconite Taconite Transferred Total mining mining subd. 3(b) township railroad* municipal from & conc. effects fund aid schools
2015 Production Tax Distribution to Cities and Townships (cont.)
Production Tax (cont.)
4.5 cent 4.0 cent M.S. 298.28 3.0 cent Taconite Taconite Transferred Total mining mining subd. 3(b) township railroad* municipal from & conc. effects fund aid schools
19
(Based on 2014 production year tax revenues)
ST. LOUIS COUNTY Aurora 16,564 79,196 – – – 180,476 8,565 284,801
2015 Production Tax Distribution to Cities and Townships (cont.)
4.5 cent 4.0 cent M.S. 298.28 3.0 cent Taconite Taconite Transferred Total mining mining subd. 3(b) township railroad* municipal from & conc. effects fund aid schools
20
ST. LOUIS COUNTY CONTINUED Kabetogama Township – – – 5,899 – – 1,052 6,951 Kelsey Township – – – 6,173 – – 274 6,447 Kugler Township – – – 8,368 – – 318 8,686
Total $2,125,786 $1,789,718 $157,055 $1,281,952 $591,142 $6,589,995 $633,976 $13,169,624
— Indicates not eligible.* Fixed amount based on 1977 taconite railroad gross earnings tax distributions. 0 Indicates eligible, but no payment at current valuation and production.
(Based on 2014 production year tax revenues)
Figure 10
2015 Production Tax Distribution to Cities and Townships (cont.)
Production Tax (cont.)
4.5 cent 4.0 cent M.S. 298.28 3.0 cent Taconite Taconite Transferred Total mining mining subd. 3(b) township railroad* municipal from & conc. effects fund aid schools
21
School Districts Year Authorized1 Final Payment Payment3 Outstanding Year2 Balance4
166 Cook County5 1996 2016 $463,505 $910,000
316 Greenway 2000 2019 154,425 656,000
381 Lake Superior 2000 2022 383,634 2,459,494
695 Chisholm 2000 2020 282,901 1,681,201
696 Ely 1996 2015 66,560 64,000
706 Virginia 1996 2016 166,406 341,751
712 Mt. Iron-Buhl 1998 2017 284,560 836,000
2154 Eveleth-Gilbert 1996 2017 306,294 915,200
2711 Mesabi East 2008 2016 500,000 Annual Payment6
Total $2,608,285 $7,863,646
1 Legislative year in which taconite funding was enacted.2 Production year from which final bond payment will be deducted.3 Payments made from 2014 pay 2015 tax distribution. 4 Estimated portion of outstanding bond balance to be paid by taconite funds (not including interest). 5 All taconite bonds funded at 80 percent taconite, 20 percent local effort, unless otherwise noted: Cook County – 1996, 70 percent ; Mesabi East – 2008, $500,000.6 Annual payment of $500,000 is authorized under 2008 Session Laws Chapter 154.
* The taxable tonnage is the average production of the current year and previous two years. Magnetation and Mining Resources pay on current-year production only.
* Wholesale price index. ** Steel mill products index. *** Gross national product implicit price deflator, gross domestic implicit price deflator beginning in 2000.*** * The 2013 legislature changed the statutory rate to $2.560 per ton for the 2013 production year, with indexing to resume with the 2014 production year.
Production Statutory Fe (iron) Inflation Total TEDF Year
*The 1977 law was the first to apply the Production Tax rate against taxable tons, the greater of the current year’s production, or the three-year average of production tons. The taxable tonnage for 1984 was the current year only. The taxable tonnage for 1985 was the average tonnage for 1984 and 1985. A three-year average is used for 1986 and beyond, except for other iron-bearing material which uses the current year.
Figure 18
Taconite Produced and Production Tax Collected
26
The Production Tax rate for DRI is the regular rate plus an additional three cents per gross ton for each one percent that the iron content exceeds 72 percent when dried at 212 degrees Fahrenheit. Thus, at a base Production Tax rate for 2015 of $2.630 per ton, the tax rate for 90 percent iron DRI would be $3.170. The rate for 95 percent DRI would be $3.320.
Direct Reduced Iron (DRI)Because it is subject to the Production Tax, a DRI production plant and facilities is exempt from regular ad valorem (Property) taxes. The taxable tonnage is based on a three-year production average. Pig iron is considered DRI for the purpose of Production Tax and incentives.
A steel plant would be subject to ad valorem (Property) taxes as would any other business. If a steel plant were in conjunction with a DRI plant, the DRI portion would be subject to the Production Tax, thus exempt from Ad Valorem (Property) taxes.
Reduced Production Tax Rate for DRIThe first five years of a DRI plant’s commercial production are subject to reduced tax rates if all environmental permits have been obtained and construction has begun before July 2, 2008. Commercial production is defined as more than 50,000 tons.
Years of % of regular Years of % of regular operation rate operation rate 1 0% 4 50% 2 0% 5 75% 3 25% 6 100%
Production Tax (cont.)
Figure 19
World Direct Reduced Iron Production
Met
ric T
ons
(mill
ions
)
Information provided by www.midrex.com
64.33
67.95 70.28
67.12
59.70
56.87
0.95 0.34 0.601.160.680.81
2005
2006
2007
2008
2009
2010
2011
2012
2013
2014
73.21
0.70
8075706560555045
4035
302520
15
1050
0.84
73.14
U.S. and Canada DRI Production
74.92
1.25
74.55
2.85
World DRI Production
27
Minnesota’s Occupation Tax applies to mining and producing both ferrous and nonferrous minerals, including taconite and iron ore, and other minerals such as gold, silver, copper, nickel and titanium.
The Occupation Tax is paid in lieu of the Corporate Franchise Tax on mining activities. Generally, it is determined in the same manner as Minnesota’s Corporate Franchise Tax under M.S. 290.02 but there are a few exceptions:
• The unitary provisions of the Corporate Franchise Tax law do not apply to Occupation Tax.
• Mining companies may use percentage depletion. • The alternative minimum tax (AMT) does not apply.• All sales are Minnesota sales, so 100 percent of net income is
assigned to Minnesota.
• The tax rate is 2.45 percent.
Ferrous MineralsGross income from mining or producing ferrous minerals is based on “mine value;” i.e., the value of the products produced after beneficiation or processing, but prior to any stockpiling, transportation, marketing and marine insurance, loading or unloading costs.
The procedure for determining a company’s mine value was developed by the Minnesota Department of Revenue and representatives from the taconite industry in 1990. The department sets product values each year, which are generally based on the following:
1) Seventy-five percent of the change in the product value is based on the change in the Steel Mill Products Index (SMPI) from June of the previous year to June of the current year; and
2) Twenty-five percent of the change in product value is based on actual transaction prices of products sold in nonequity sales as reported by the mining companies.
When ferrous minerals, such as taconite pellets, chips or
(M.S. 298.01, 298.16 – 298.18)
concentrate, are used by the producer or disposed of or sold in a non-arms-length transaction, the company must use the product values set by the department to determine the mine value for Occupation Tax.
Non-arms-length transactions include, but are not limited to, any sales or shipments to: 1) any steel producer having any ownership interest in the selling or shipping company, or 2) any steel producer affiliated or associated with any firm having any ownership or other financial interest in the selling or shipping company.
For nonequity or arms-length transactions, a company may choose to determine the mine value by using either 1) actual sales prices (f.o.b. mine) or 2) the product values set by the department. It must select one of these options the first time a nonequity sale is made. Once it selects an option, however, it must continue to use that option for all nonequity sales in the future. Requests to change the selected option must receive approval from the department.
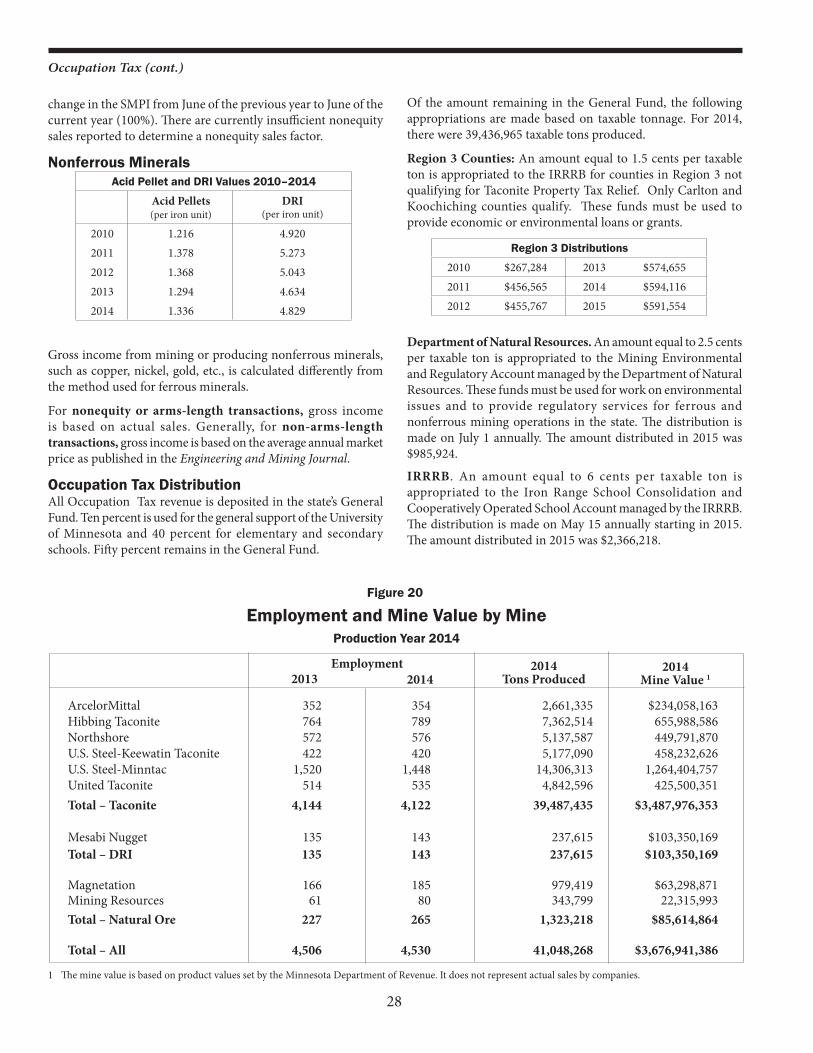
Product ValuesAcid Pellets: The value of acid pellets is based on the change in the SMPI from June of the previous year to June of the current year (75%), and actual sales prices of nonequity sales (25%).
Flux Pellets: The value of flux pellets is based on the acid pellet value, adjusted based on the amount of flux in the finished pellets.• Partial Flux (less than 2 percent flux): Pellets with 1.99 percent
or less flux are valued at $0.015 per Fe (iron) unit higher than the acid pellet value.
• Flux: Pellets with 2 percent or more flux are valued at $0.015 per Fe (iron) unit higher than the acid pellet value per each 1 percent of flux in the finished pellet.
Chips, Fines and Concentrate: Acid chips (fines) and concentrate are valued at 75 percent of the acid pellet value. Flux chips and concentrate are valued at 75 percent of the flux pellet value.
Direct Reduced Iron (DRI): The value of DRI is based on the
Occupation Tax
2014 Product Values per Iron UnitValue per Fe (iron) unit (per dry gross ton) for the period Jan. 1, 2014 – Dec. 31, 2014:
Value Acid pellets $1.336 per iron unit Pellet chips (fines) and concentrate 75% of acid or fluxed pellet price Flux Pellets – partial flux (.1% – 1.99% flux)* $1.336 + $0.015 = $1.351 Flux (2.00% and higher flux) * $1.336 + $0.015 per iron unit for each 1% flux Direct reduced iron (DRI) $4.829 per iron unit
Example: Pellet with 4.8% flux in finished pellet: 4.0 × $0.015 = $0.060Mine value: $1.336 + $0.060 = $1.396
28
change in the SMPI from June of the previous year to June of the current year (100%). There are currently insufficient nonequity sales reported to determine a nonequity sales factor.
Nonferrous Minerals
Gross income from mining or producing nonferrous minerals, such as copper, nickel, gold, etc., is calculated differently from the method used for ferrous minerals.
For nonequity or arms-length transactions, gross income is based on actual sales. Generally, for non-arms-length transactions, gross income is based on the average annual market price as published in the Engineering and Mining Journal.
Occupation Tax DistributionAll Occupation Tax revenue is deposited in the state’s General Fund. Ten percent is used for the general support of the University of Minnesota and 40 percent for elementary and secondary schools. Fifty percent remains in the General Fund.
Of the amount remaining in the General Fund, the following appropriations are made based on taxable tonnage. For 2014, there were 39,436,965 taxable tons produced.
Region 3 Counties: An amount equal to 1.5 cents per taxable ton is appropriated to the IRRRB for counties in Region 3 not qualifying for Taconite Property Tax Relief. Only Carlton and Koochiching counties qualify. These funds must be used to provide economic or environmental loans or grants.
Department of Natural Resources. An amount equal to 2.5 cents per taxable ton is appropriated to the Mining Environmental and Regulatory Account managed by the Department of Natural Resources. These funds must be used for work on environmental issues and to provide regulatory services for ferrous and nonferrous mining operations in the state. The distribution is made on July 1 annually. The amount distributed in 2015 was $985,924.
IRRRB. An amount equal to 6 cents per taxable ton is appropriated to the Iron Range School Consolidation and Cooperatively Operated School Account managed by the IRRRB. The distribution is made on May 15 annually starting in 2015. The amount distributed in 2015 was $2,366,218.
Direct Reduced Iron Taconite TotalIron Ore Tons Occupation Tons Occupation Tons Occupation Tons Occupation Year Produced Tax Produced Tax Produced ** Tax Produced Tax (000s) (000s) (000s) (000s) (000s) (000s) (000s) (000s)
1 Amount paid by May 1 each year. Does not include adjustments.
Figure 22
30
Ye
ar
Tons
Be
nefic
iatio
n Pe
r Be
nefic
iatio
n Pe
r Be
nefic
iatio
n Pe
r Be
nefic
iatio
n To
tal
Prod
uced
La
bor
Ton
Supp
lies
Ton
Dep
r. an
d In
t. To
n M
isc.
Per
Ton
Be
nefic
iatio
n
(0
00s)
(0
00s)
(000
s)
(0
00s)
Pe
r Ton
20
10
35,9
84
145,
487
4.04
76
4,17
3 21
.24
82,2
09
2.28
1.
75
29.3
1
2011
39
,771
15
9,70
7 4.
02
921,
154
23.1
6 78
,669
1.
98
1.86
31
.02
20
12
39,8
73
174,
099
4.37
91
2,60
1 22
.89
61,8
23
1.55
1.
97
30.7
8
2013
38
,064
19
2,82
4 5.
07
911,
656
23.9
5 60
,179
1.
58
2.06
32
.66
20
14
39,4
87
204,
916
5.19
1,
010,
582
25.5
9 68
,438
1.
73
1.98
34
.49
Cos
t of B
enefi
ciat
ion
20
10
35,9
84
94,9
68
2.64
23
4,06
6 6.
50
9.14
1.
26
10.4
0
2011
39
,771
11
1,18
1 2.
80
324,
276
8.15
10
.95
1.32
12
.27
20
12
39,8
73
133,
369
3.34
35
2,35
9 8.
84
12.1
8 1.
13
13.3
1
2013
38
,064
13
4,02
5 3.
52
344,
632
9.05
12
.57
1.00
13
.57
20
14
39,4
87
143,
213
3.63
35
3,53
4 8.
95
12.5
7 1.
04
13.6
2
Cos
t of M
inin
g
Per T
onM
inin
g Su
pplie
s(0
00s)
Cos
t of
Min
ing
Per T
onM
inin
g D
epre
ciat
ion
(per
ton)
Tota
l Min
ing
Cos
ts P
er T
onYe
arTo
ns
Prod
uced
(0
00s)
Min
ing
Labo
r(0
00s)
Occupation Tax (cont.)
1 Th
e av
erag
e va
lue
may
not
mat
ch th
e va
lues
on
Figu
re 2
0 be
caus
e th
is is
an av
erag
e of
all
taco
nite
pro
duce
d (a
cid,
flux
, chi
ps, c
once
ntra
te).
This
info
rmat
ion
is pr
ovid
ed b
y M
inne
sota
min
ing
com
pani
es a
nd is
not
audi
ted
by th
e M
inne
sota
Dep
artm
ent o
f Rev
enue
.
Figu
re 2
3
Occ
upat
ion
Tax
Aver
ages
– T
acon
ite O
nly
Tons
Av
erag
e C
ost o
f C
ost o
f
Taco
nite
&
Sale
s and
A
dmin
.
Taxa
ble
Occ
upat
ion
Yea
r pr
oduc
ed
valu
e1 be
nefic
iatio
n m
inin
g D
evel
opm
ent
prop
erty
us
e ta
x an
d m
isc.
R
oyal
ty
valu
e of
ta
x pa
id
(0
00s)
ta
x pa
id
paid
ex
pens
e
prod
uctio
n
2010
35
,984
80
.31
29.3
1 10
.40
1.54
1.
87
0.22
4.
54
3.31
29
.12
0.35
2011
39
,771
90
.77
31.0
2 12
.27
1.76
1.
94
0.17
4.
60
4.26
34
.76
0.55
2012
39
,873
90
.18
30.7
8 13
.31
1.59
2.
63
0.21
3.
91
3.90
33
.83
0.55
2013
38
,064
85
.38
32.6
6 13
.57
1.64
2.
50
0.27
5.
15
3.73
25
.87
0.40
2014
39
,487
88
.33
34.4
9 13
.62
1.56
2.
39
0.23
5.
72
3.58
26
.73
0.42
31
A. Land within ¼ mile of mining activity $700 Industrial
B. Excess Land 1. Undisturbed Same as other private land Rural Vacant Land or current use 2. Tailings Ponds a. Stockpiles 75% of other private land Rural Vacant Land or current use b. Tailings Ponds 30% of other private land Rural Vacant Land or current use
A. Land within ¼ mile of active pit $1000 Industrial B. Excess land (more than ¼ mile from mining activity or outside 15-year pit limit). 1. Undisturbed Same as other private land Rural Vacant Land or current use 2. Disturbed a. Stockpiles 75% of other private land Rural Vacant Land or current use b. Abandoned Pits 50% of other private land Rural Vacant Land or current use
Lands and structures actively used for taconite production are exempt from the Ad Valorem Tax and are subject to the Production Tax in lieu of Property Tax. Actively used lands include the plant site, mining pit, stockpiles, tailings pond and water reservoirs. Also included are lands stripped and ready for mining, but not lands merely cleared of trees. It is important to note that this exemption applies only to the Ad Valorem Tax on the land and buildings and not to the Unmined Taconite Tax described on the following page. Lands adjacent to these facilities, commonly referred to as auxiliary mining lands, are subject to assessment of Ad Valorem Tax administered by the county.
The county assessor is responsible for estimating the market value of auxiliary mining lands and classifying them into one of several property classifications established by Minnesota law. The two most common property classifications used on auxiliary mining lands are industrial and rural vacant land. In general, lands in close proximity to active taconite operations are assigned the industrial classification while those further away are classified as rural vacant land. The classification of property is covered in M.S. 273.13.
Each property classification has a legislatively set percentage called the class rate that is multiplied by the property’s taxable market value (TMV) to calculate tax capacity. For payable 2014
taxes, the class rate for rural vacant land is 1.00 percent of the estimated market value. For the industrial classification, there are two class rates: 1.50 percent for the first $150,000 of the TMV and 2.0 percent for the value over $150,000.
Property taxes are calculated by multiplying a property’s tax capacity times the tax extension rate for the jurisdiction where it is located. Tax extension rates are determined by county, local government and school district spending. In St. Louis County within the mining area for taxes payable in 2014, they range from a low of approximately 86 percent to a high of approximately 342 percent. In addition, the market value times the referendum rate must be added to the tax determined above if there is a referendum in the taxing district. For industrial class property, the state general tax rate of 52.160 percent applies in addition to the local tax rate.
The following schedule provides for adjustments in both the valuations and classifications of auxiliary mining lands located on the iron formation versus off-formation lands as well as further refinements based on the proximity of these lands to active mining operations. It outlines valuation adjustments to be made on excess lands where they are located as market conditions and/or Minnesota statutes dictate (see below). This schedule was updated based on market conditions for the 2013 assessment.
(M.S. 272.01)
St. Louis County Mining Land Assessment Schedule
1. Iron formation land Value ($/acre) Classification
2. Off-formation land
Ad Valorem Tax on Auxiliary Mining Lands for Taconite Operations
32
A tax not exceeding $15 per acre may be assessed on the taconite or iron sulfides in any 40-acre tract from which the production of iron ore concentrate is less than 1,000 tons.
The heading in the statute is somewhat misleading since it refers to a Tax on Unmined Iron Ore or Iron Sulfides. The tax clearly applies to unmined taconite and has been administered in that manner. The term “iron ore” does not refer to high-grade natural ore in this instance.
The tax, as presently administered, applies to all iron formation lands on the Mesabi Range. The statutory exemption administered by the county assessor provides that in any year in which at least 1,000 tons of iron ore concentrates are produced from a 40-acre tract or government lot, the tract or lot are exempt from the Unmined Taconite Tax. The county assessors have also exempted actual platted townsites that are occupied.
The iron formation lands on the Mesabi Range are divided into two categories by the Minnesota Department of Revenue. This is done through the evaluation of exploration drill hole data submitted by the mining companies.
The categories are:
1) Lands that are underlain by magnetic taconite of sufficient quantity and grade to be currently economic: They are considered to be economic taconite and are given a market value of $500 per acre.
2) Lands either not believed or not known to be underlain by magnetic taconite of current economic quantity, quality and grade: They are considered to be un- economic taconite and are given a market value of $25 per acre.
To be classified as economic taconite, category 1, the taconite must pass the following criteria:
— contain more than 16 percent magnetic iron with the Davis tube test;
— contain less than 10 percent concentrate silica (SiO2) with the Davis tube test;
— have a 15- to 25-foot minimum mining thickness; and
— have a stripping ratio of less than four-to-one (waste/concentrate), calculated as follows:
A) Surface (ft.) x 1.5= Equiv. Ft. Surface
B) Rock (ft.) x 2.25 = Equiv. Ft. Waste
C) Ore (ft.) x 2.5 = Equiv. Ft. 3 Concentrate
Stripping Ratio = A + B C
If the material fails any of the above criteria, then it is considered to be uneconomic taconite and classified as category 2. Some lands may also be considered as uneconomic due to environmental restrictions.
For taxes payable in 2013, the tax is calculated by multiplying the market value for the parcel of land by the 2.00 percent class rate to obtain the tax capacity. The special rate on the first $150,000 of market value that applies to class 3 commercial/industrial property does not apply to class 5 unmined taconite. This is then multiplied by the local tax rate. Note: Call your county auditor for more information.
St. Louis 495,033 466,991 238,274 239,518 228,517 265,107 247,126 259,800
County 2008 2009 2010 2011 2012 2013 2014 2015
Total $495,033 $466,991 $238,274 $239,518 $228,517 $297,390 $279,594 $ 291,298
Unmined Taconite Tax Paid(Year payable)
Figure 24
33
(M.S. 272.03, 273.02, 273.12, 273.13, 273.165, 273.1104)Since 1909, Minnesota’s natural iron ore reserves have been estimated and assessed by the state for Ad Valorem Tax purposes. The actual Ad Valorem Tax levy is set by the county, the school district and the local township or municipality. The county auditor collects the tax levy.
A Minnesota Supreme Court decision in 1936 established the present worth of future profits method for valuing the iron ore reserves. This is accomplished through the use of a complex formula known as the Hoskold Formula. The formula takes into account ore prices and all the various cost factors in determining the value of the unmined ore.
Each year, the Minnesota Department of Revenue uses a five-year average for allowable costs taken from the Occupation Tax report. A five-year average of the Lake Erie iron ore market value is also used. These averages are used to help reduce fluctuation of value due to sudden cost/price changes.
The following expenses are allowed as deductions from the Lake Erie market value on the computation of present worth, which is known as the Hoskold Formula:
These 12 allowable expense items are deducted from the Lake Erie market value to give the estimated future income (per ton). Note that although royalty is allowable as an Occupation Tax deduction, it is not allowable on Minnesota’s Ad Valorem Tax.
The present worth is then determined by multiplying the estimated future income (per ton) by the Hoskold Factor. The Minnesota Department of Revenue presently allows a 12 percent risk rate and six percent safe rate that yields the .33971 Hoskold factor when used with a 20-year life. A 20-year life has been used since 1968 as representative of the remaining life of Minnesota’s natural iron ore reserves. The resulting value is considered the market value by the Minnesota Department of Revenue.
The term “class rate” was introduced for taxes payable in 1990. For 2002 and thereafter, this rate is reduced to 2.0 percent.
The tax capacity is the product of the class rate and the market value. The product of the market value and class rate must then be multiplied by the local tax rate plus the state general Property Tax rate to determine the tax. In addition, the market value times
* Since 1987, Social Security tax has been included under miscellaneous.
1a. Mining, normal costs
1b. Mining, special costs
2. Beneficiation
3. Miscellaneous (Property Tax, medical ins., etc.)
4. Development (future)
5. Plant and equipment (future)
6. Freight and marine insurance
7. Marketing expense
8. Social Security tax*
9. Ad Valorem Tax (by formula)
10. Occupation Tax
11. Federal income tax
12. Interest on development and working capital
the referendum rate must be added if there is a referendum in the taxing district.
Local tax rates are a function of county, local government, and school district spending. In addition, a statewide general Property Tax levy applies to most types of property with the exception of agricultural and homestead properties. For example, for taxes payable in 2015, tax rates ranged from a low of approximately 66 percent to a high of approximately 345 percent (not including the state general Property Tax rate of 50.840 percent) in St. Louis County. The class rate from 2002–2015 has been 2 percent.
The special rate on the first $150,000 of market value that applies to class 3 commercial/industrial property does not apply to unmined iron ore that are class 5 properties.
The Minnesota Department of Revenue has tried to maintain all ores on the tax rolls, including the uneconomic, underground and unavailable classifications. A schedule of minimum rates was established in 1963 and revised in 1974, 1986, 1988, 1992 and 1999. The market values for iron ores that do not show a value with the Hoskold Formula are determined from the schedule of minimum rates. The table on the following page lists the current schedule of minimum rates. Most of the iron ore value remaining today was determined using the schedule of minimum rates.
Open pit ores with too high of a cost to show a value with the Hoskold Formula are assigned minimum values from the open pit classification. Underground and uneconomic ores with stripping ratios exceeding five-to-one are assigned minimum values from underground uneconomic classification.
Beginning with the 1999 assessment, the minimum rates for determining market values in Crow Wing County were reduced by 50 percent. This simply recognizes that the potential for mining iron ore is substantially less in Crow Wing County than on the Mesabi Range in St. Louis or Itasca counties.
A notice of the market value of unmined ore is sent to each person subject to the tax and to each taxing district affected on or before May 1 (M.S. 273.1104).
According to the provisions of M.S. 273.1104, a public hearing to review the valuations of unmined iron ore must be held on the first secular day following May 20. This hearing provides an opportunity for mining company and taxing district representatives to formally protest any of the ore estimates or valuation procedures they believe to be incorrect.
In addition, current conditions and future trends in the iron ore industry are discussed. Iron ore Ad Valorem taxes are expected to continue their long decline as remaining economic deposits are mined or allowed to go tax forfeit. Reserves in old flooded pits converted to recreational use are classified as underground, low-grade recreational.
Beginning with the Jan. 2, 1989 assessment, taconite railroads have been included in the definitions of common carrier railroads and were assessed and taxed on an ad valorem basis according to Minnesota law. LTV and Northshore were the only railroads classified as taconite railroads. Since the 2003 assessment, Northshore Mining is the only operating railroad.
The Minnesota Department of Revenue developed rules governing the valuation of railroad operating property. The rules have been in effect since 1979 when common carrier railroads went off the gross earnings tax. Each railroad is required to file an annual report containing the necessary information.
The valuation process utilizes the unit value concept of appraisal. For taconite railroads, this involves calculating a weighted cost indicator of value allowing for depreciation and obsolescence.
(M.S. 270.80 - 270.88)
Personal property is then deducted from the net cost indicator to yield a Minnesota taxable value.
This value is then apportioned to the various taxing districts where the taconite railroad owns property. The amount of value each taxing district receives is based on an apportionment formula involving three factors: land, miles of track, and the cost of buildings over $10,000.
After the market value is apportioned to each taxing district, the value is equalized with the other commercial and industrial property on a county-wide basis using an estimated median commercial and industrial sales ratio. A commercial and industrial ratio is developed for each county and applied to that county’s taconite railroad market values.
Figure 27
Taconite Railroad Ad Valorem Tax Assessed
36
DefinitionSevered mineral interests are those separately owned from the title to surface interests in real estate. Each year, severed mineral interests are taxed under Minnesota law at 40 cents per acre times the fractional interest owned. The minimum tax on any mineral interest (usually 40-acre tracts or government lots) regardless of the fractional interest owned, is $3.20 per tract. No tax is due on mineral interests taxed under other laws relating to the taxation of minerals, such as unmined taconite or iron ore, or mineral interests exempt from taxation under constitutional or related statutory provisions.
Ownership of a specific mineral or group of minerals, such as energy minerals or precious metals rather than an actual fractional interest of all the minerals, does not constitute a fractional interest. Thus, if one individual reserved all minerals except gas, oil and hydrocarbons, and a second entity reserved the hydrocarbons, each owner would be subject to the full 40 cents per acre tax.
The Severed Mineral Interest Tax is a Property Tax that is levied by local taxing authorities in the same manner as other local Property taxes. Proceeds from the tax are distributed in this manner: 80 percent is returned by the county to local taxing districts where the property is located in the same proportion that the local tax rate of each taxing district bears to the total surface tax rate in the area; and 20 percent to the Indian Business Loan Account in the state treasury for business loans made to Indians by the Department of Employment and Economic Development.
The registration and taxation of severed mineral interests is a county function. Severed mineral interests are registered with the county recorder in the county where the interest is located. The county auditor sends a tax statement similar to any other real estate interest. The tax is normally collected in two increments payable in May and October. If the tax is less than $50, the taxpayer is required to pay in full with the May payment.
Nonpayment Penalty: ForfeitureThe eventual penalty for not paying the tax is forfeiture. Policies vary somewhat among counties. Specific questions about the tax, interest or penalties should be directed to the county recorder and auditor in the county where the minerals are located.
Tax ImposedThe tax on severed mineral interests was enacted in 1973 as part of an act that required owners to file a document with the county recorder where the interests were located describing the mineral interest and asserting an ownership claim to the minerals. The purpose of this requirement was to identify and clarify the obscure and divided ownership conditions of severed mineral interests in the state (M.S. 93.52). Failure to record severed mineral interests within time limits established by the law results in forfeiture to the state (M.S. 93.55).
History of LitigationIn 1979, the Minnesota Supreme Court ruled that the tax, the recording requirements and the penalty of forfeiture for failing to timely record were constitutional, but also ruled that forfeiture procedures were unconstitutional for lack of sufficient notice and opportunity for hearing. This decision is cited as Contos, Burlington Northern, Inc. U.S. Steel, et al. v. Herbst, Commissioner of Natural Resources, Korda, St. Louis County Auditor, Roemer, Commissioner of Revenue, and the Minnesota Chippewa Tribe, et al., 278 N.W. 2d 732 (1979). The U.S. Supreme Court refused to hear an appeal requested by the plaintiffs. Shortly after this decision, the legislature amended the law to require notice to the last owner of record and a court hearing before a forfeiture for failure to timely record becomes complete. Under these requirements, court orders have been obtained by the state in several counties declaring the forfeiture of particular severed mineral interests to be complete and giving title to the state.
In 1988, the legislature amended the law to allow the commissioner of the Minnesota Department of Natural Resources (DNR)to lease unregistered severed mineral interests before entry of the court order determining the forfeiture to be complete. However, mining may not commence under such a lease until the court determines that the forfeiture is complete.
In a 1983 case, the Minnesota Supreme Court ruled that severed mineral interests owned by the Federal Land Bank of St. Paul were exempt from the state Severed Mineral Interest Tax under a federal law exempting Land Bank real estate from local Property taxes. The U.S. Supreme Court denied a petition by the State of Minnesota to review the case.
DNR LeaseIf someone buys a DNR mining lease of 3 or more years duration, the Severed Mineral Interest Tax of 40 cents per acre applies. Contact the DNR, Minerals Division, to determine the status of activities under any state metallic minerals lease.
Indian Business Loan AccountThe 20 percent portion of the Severed Mineral Interest Tax that is allocated to the Indian Loan Program is reported by the county auditors on the Severed Mineral Interest Return (SMI1). Normally, the form is submitted twice each year to correspond with payment of Property taxes.
The money deposited in the Severed Mineral Interest Account is distributed to the Indian Loan Program at the end of each month.
Department of RevenueThe processing and payment of the Severed Mineral Interest Tax is handled by the Special Taxes Division of the Minnesota Department of Revenue, Mail Station 3331, St. Paul, MN 55146-3331. Phone 651-556-4721.
Loan ProgramThe Indian Business Loan Program is administered by the Department of Employment and Economic Development, 1st National Bank Building, 332 Minnesota Street, Suite E-200, St. Paul, MN 55101-1351. Phone: 651-259-7424.
Ad Valorem Tax on Severed Mineral Interests (cont.)
38
Taxes on Nonferrous Minerals
Companies mining or exploring for nonferrous minerals or energy resources are also subject to Minnesota taxes. This includes mining or exploring for:
• Base metals, such as copper, nickel, lead, zinc, titanium, etc;• Precious metals, such as gold, silver and platinum; and• Energy resources, such as coal, oil, gas and uranium.
Companies conducting these activities are subject to the fol-lowing taxes the same as companies that mine ferrous miner-als:• Occupation Tax (see page 27)• Sales and Use Tax (see page 1) • Ad Valorem Tax on severed mineral interests (see page 36)
In addition, they are subject to Ad Valorem Tax (Property Tax) in certain situations and a Net Proceeds Tax.
Ad Valorem Tax (M.S. 272–273)Companies mining or exploring for nonferrous minerals or energy resources are subject to Property Tax the same as other businesses.
For commercial and industrial property, the assessor’s estimated market value is multiplied by a class rate to obtain gross tax capacity. The first $150,000 of market value is taxed at 1.5 percent, while a 2 percent rate applies to market value over $150,000. To determine the tax, the product of the market value and class rate must be multiplied by the local tax rate plus the 50.840 percent state general Property Tax rate for taxes payable in 2015. In St. Louis County, where the majority of Minnesota’s mining industry is located, the local tax rates payable in 2015 varied from a low of 87 percent to a high of approximately 345 percent. If a referendum tax is passed, the referendum rate times the full market value must be added.
If a company is mining minerals or energy resources subject to the Net Proceeds Tax under M.S. 298.015, then the following property is exempt:
• deposits of ores, metals, and minerals and the lands in which they are contained;
• all real and personal property used in mining, quarrying, producing, or refining ores, minerals, or metals, including lands occupied by or used in connection with the mining, quarrying, production, or ore refining facilities;
• and concentrate.
Net Proceeds Tax (M.S. 298.015–298.018)The Net Proceeds Tax applies to the mining or producing of nonferrous minerals and energy resources, i.e., all ores, metals and minerals mined, extracted, produced or refined within Minnesota, except for sand, silica sand, gravel, building stone, crushed rock, limestone, granite, dimension granite, dimension stone, horticultural peat, clay, soil, iron ore and taconite concentrates.
The tax is equal to 2 percent of the net proceeds from mining in Minnesota. Net proceeds are the gross proceeds from mining less allowable deductions. Gross income from mining or producing nonferrous minerals or energy resources is calculated differently from the method used for ferrous minerals.
For non-equity or arms-length transactions, gross income is based on actual sales. Generally, for non-arms-length transactions, gross income is based on the average annual market price as published in the Engineering and Mining Journal.
The Net Proceeds Tax was designed to apply to mining and beneficiation, generally to the point of a saleable product. In the case of some hydrometallurgical processes, the saleable product may be a refined metal.
Deductions from the tax include only those expenses necessary to convert raw materials to marketable quality. Expenses such as transportation, stockpiling, marketing or marine insurance that are incurred after marketable ores are produced are not allowed, unless the expenses are included in gross proceeds.
Distribution of the tax. If the minerals or energy resources are mined outside the Taconite Assistance Area, the tax is deposited in the state’s General Fund. If they are mined or extracted within the Taconite Assistance Area, the tax is distributed to:
• Cities and towns (5%), counties (20%), and school districts (10%) where the minerals or energy resources are mined or extracted, or where the concentrate is produced. If concentrating occurs in a different taxing district from where the mining occurs, 50 percent is distributed to the taxing districts where mined and the remainder to those districts where processed. In addition, counties must pay 1 percent of their proceeds to the Range Association of Municipalities and Schools.
• Regular School Fund (20%)• Taconite Municipal Aid Account (10%).• Taconite Property Tax Relief (20%), using St. Louis County
as fiscal agent.• IRRRB (5%).• Douglas J. Johnson Economic Protection Trust Fund (5%).• Taconite Environmental Protection Fund (5%).
Distributions are made annually on July 15; however, there are currently no companies subject to the Net Proceeds Tax.
39
Acid pellets — Taconite pellets comprised of iron, oxygen and silica held together by a binder such as bentonite (clay) or peridor (organic).
Agglomeration — The term describing the preparation and heat treatment used to prepare iron ore pellets or other iron ore products for shipment and use in a blast furnace.
Arms-length transaction — A sale of iron ore or pellets representing a true free market transaction when the buyer normally does not have an ownership or other special relationship with the seller.
Basic oxygen furnace (BOF) — A steel-making furnace invented in Austria. It replaced open hearth furnaces in the 1960s. It is currently the standard furnace used by the integrated steel producers in the United States.
Beneficiation — The process of improving the grade by removing impurities through concentrating or other preparation for smelting, such as drying, gravity, flotation or magnetic separation. In taconite operations, this includes the first stage of magnetic separation and converting the concentrate into taconite pellets for use in making steel.
Concentrate — The finely ground iron-bearing particles that remain after separation from silica and other impurities.
Douglas J. Johnson Economic Protection Trust Fund (DJJ) — A portion of Production Tax revenues is allocated to this fund with the intent to use the funds to diversify and stabilize the long-range economy of the Iron Range.
Direct reduced iron (DRI) — A relatively pure form of iron (usually 90 percent + Fe), which is produced by heating iron ore in a furnace or kiln with a reducing agent such as certain gases or coal.
Dry weight — The weight of iron ore or pellets excluding moisture. For pellets, the dry weight is normally 1 to 2 percent less than the natural weight.
Electric Arc Furnace (EF or EAF) — A furnace in which an electric current is passed through the charge. These furnaces are much smaller than the conventional BOFs used by the integrated steel producers.
Fe unit — Commonly referred to as an iron unit. An iron unit is a term of measurement denoting one ton containing one percent iron. Iron ore and taconite produced in the United States is measured in long tons (see definition). One long
ton of taconite containing 65 percent iron also contains 65 long ton iron units.
Historically, this measurement was and is used for the selling price quoted in cents per iron unit. One example is a currently published price of acid pellets FOB mine at 37.344 cents per dry gross ton iron unit or $.37344 per iron unit.
Fluxed pellets — Taconite pellets containing limestone or another basic flux additive. Fluxed pellets eliminate the need to add limestone in the blast furnace, improving productivity and quality. Adding flux reduces the iron content of a pellet. Fluxed pellets, as used in this guide, mean pellets containing two percent or more limestone or other flux.
Partially fluxed pellets — Fluxed pellets containing 1.99 percent or less limestone or other flux additive.
Gross Domestic Product Implicit Price Deflator (GDPIPD) — An index maintained by the U.S. Department of Commerce measuring inflation in the overall economy. The Production Tax rate is adjusted annually based on the change in this index.
Integrated steel producer — Term used to describe steel companies that produce steel by starting with raw iron ore, reducing it to molten iron in a blast furnace, and producing steel with a BOF, open hearth, or electric furnace.
Lake Erie value — The traditional and quoted price of iron ore from the earliest days of iron ore mining in Minnesota and Michigan. This price per iron unit included delivery, mainly rail and lake transportation, from the mine to a Lake Erie port.
This was the starting point for Occupation Tax since its 1921 beginning. It was the standard method of pricing domestic iron ore and taconite for Occupation Tax until the mid-1980s (see Mine Value).
Long ton — The standard unit for weighing iron ore and taconite in the United States. A long ton equals 2,240 pounds.
M.S. 298.225 — A Minnesota statute (law) guaranteeing the Production Tax aids received by municipalities, counties, schools and the IRRRB. The aid levels are adjusted according to a sliding scale based on production levels.
Metric ton — Standard unit for weighing iron ore and taconite in most areas of the world. A metric ton equals 1,000 kilograms or 2,204.62 pounds.
Glossary of Terms
40
Mine value — The value of iron or pellets at the mine. This became the starting point for Occupation Tax in 1987. This value per iron unit does not include any rail or lake transportation beyond the mine.
Mini mill — A small steel mill using an electric furnace that produces steel from scrap iron.
Natural ore — Iron ore that can be fed to a blast furnace with less complicated processing than taconite requires. Natural ore typically contains 50 percent +Fe (iron) in its natural state.
Natural weight — The weight of iron ore or pellets including moisture.
Net proceeds tax — A tax equal to two percent of net proceeds from mining. Net proceeds are determined by subtracting certain basic deductions such as labor, equipment, supplies and depreciation from gross proceeds or sales.
Non-equity sales — See Arms-length transaction.
Pellet chip — Broken pellets often cannot be sold as pellets and instead are sold at a reduced price for sinter plants and other uses. For Occupation Tax purposes, chips are defined as individual shipments or stockpiles containing at least 85 percent of pellet chips smaller than one-fourth inch. Such chips cannot be shipped or commingled with regular pellets.
For Occupation Tax purposes, pellet chips are valued at 75 percent of the value of the unbroken pellets.
Percentage depletion — A taxable income deduction in the form of an allowance representing a return on capital investment on a wasting asset subject to a gradual reduction in reserves. This deduction applies to income derived from various mining or oil and gas properties. For iron ore, the deduction is a flat percentage of 15 percent of income from the iron ore only mined on a specific property. This deduction, however, cannot exceed 50 percent of taxable income from the property computed without the depletion deduction.
Range Association of Municipalities and Schools (RAMS) — An association representing Iron Range cities, towns and schools receiving any funding from the Production Tax.
Region 3— Koochiching, Itasca, Aitkin, Carlton, St. Louis, Lake and Cook counties.
Royalty — A share of the product or profit reserved by the owner for permitting another to use the property. A lease by which the owner or lessor grants to the lessee the privilege of exploring, mining and operating the land in consideration of the payment of a certain stipulated royalty on the mineral produced.
Short ton — Standard for weighing many commodities in the United States. It equals 2,000 pounds.
Steel Mill Products Index (SMPI) — A United States government index tracking the actual selling price of all steel products in the United States. This index is published monthly by the U.S. Department of Labor. It is part of the formula used to determine a product value for Occupation Tax purposes each year.
Taconite — Ferruginous chert or ferruginous slate in the form of compact, siliceous rock in which the iron oxide is so finely disseminated that substantially all of the iron-bearing particles are smaller than 20 mesh.
It is not merchantable in its natural state, and it cannot be made merchantable by simple methods of beneficiation involving only crushing, screening, jigging, washing and drying or any combination thereof. (MS 298.001, subd. 4)
Tailing — Small rock particles containing little or no iron, which are separated during various stages of crushing, grinding, and concentration. Most of the separation is done with magnetic separators. Silica is the main mineral constituent of tailings.
Taxable tons — The three-year average of the current and prior two years production. The Production Tax is based on taxable tons. The weight is on a dry basis without any flux additives. For other iron bearing material subject to the Production Tax, only the current year is used.
41
Min
ing
Indu
stry
Tax
Cal
enda
r
Janu
ary
– Ad
Val
orem
Tax
Rep
orts
mai
led
to
com
pani
es–
Ad v
alor
em e
stim
ates
sub
mitt
ed b
y co
mpa
nies
(Jan
uary
- Fe
brua
ry)
14 F
orm
MT-
11, T
acon
ite a
nd S
emi-
Taco
nite
Tax
Rep
ort m
aile
d to
co
mpa
nies
with
mem
oran
dum
Febr
uary
1 Pr
oduc
tion
Tax
Repo
rt d
ue fr
om
com
pani
es14
Pro
duct
ion
Tax
dete
rmin
atio
ns
mai
led
to c
ompa
nies
– Pr
into
ut li
stin
g 50
% P
rodu
ctio
n Ta
x pa
ymen
ts s
ent t
o co
unty
aud
itors
– Sc
hool
bon
d pa
ymen
t sch
edul
e m
aile
d to
Co
ok, I
tasc
a, L
ake
and
St. L
ouis
cou
ntie
s24
Pro
duct
ion
Tax
paym
ent (
50%
) due
in
cou
nty
offic
es b
y el
ectro
nic
fund
s tra
nsfe
r25
Dis
tribu
tion
of P
rodu
ctio
n Ta
x by
co
untie
s (c
olle
cted
Feb
ruar
y 24
)
Mar
ch
1 Ta
coni
te M
unic
ipal
Aid
am
ount
s m
aile
d to
citi
es o
r to
RAM
S–
Occu
patio
n T
ax fo
rms
mai
led
to
co
mpa
nies
April
1 Ow
ner o
r les
see
of m
iner
al ri
ghts
su
bmits
spe
cific
dat
a on
dril
l hol
e lo
gs a
nd la
b te
sts
durin
g pr
evio
us
year
for U
nmin
ed T
acon
ite T
ax
15 A
d Va
lore
m T
ax p
rese
nt w
orth
es
timat
es m
aile
d to
com
pani
es
1 Oc
cupa
tion
Tax
retu
rn (M
30 s
erie
s) a
nd
paym
ent d
ue
15 F
irst h
alf o
f Pro
pert
y Ta
x on
taco
nite
railr
oad
prop
erty
due
to c
ount
ies
20 A
d Va
lore
mTa
x he
arin
g he
ld o
n fir
st
busi
ness
day
afte
r May
20t
h25
Pro
duct
ion
Cost
Sum
mar
y Ta
x Re
port
(M
30-P
) due
May
June
30 A
d Va
lore
m T
ax fi
nal a
djus
tmen
ts to
pr
oper
ty e
qual
izat
ion
shee
ts m
aile
d to
co
unty
ass
esso
rs
July
1 Co
mm
issi
oner
of R
even
ue c
ertifi
es
amou
nt o
f Tac
onite
Mun
icip
al A
id
to m
unic
ipal
ity
15 T
acon
ite re
fere
ndum
dis
tribu
tion
to
sc
hool
dis
trict
s of
Pro
duct
ion
Tax
mad
e by
the
coun
ties
Augu
st
1 Pr
into
ut li
stin
g se
cond
-hal
f Pro
duct
ion
Tax
paym
ents
sen
t to
coun
ties
24 P
rodu
ctio
n Ta
x pa
ymen
t (re
mai
ning
50
%) d
ue in
cou
nty
offic
es
by
ele
ctro
nic
fund
s tra
nsfe
r
25 D
istri
butio
n of
Pro
duct
ion
Tax
by c
ount
ies
(col
lect
ed A
ugus
t 24)
Dec
embe
r
1 Un
min
ed Ta
coni
te Ta
x rep
orts
sub
mitt
ed
to c
ount
y as
sess
ors
1 Pr
oduc
tion
Tax
form
s m
aile
d to
co
mpa
nies
1 Ex
tend
ed O
ccup
atio
n T
ax re
turn
due
Nov
embe
rO
ctob
erSe
ptem
ber
15 T
acon
ite M
unic
ipal
Aid
Acc
ount
fund
s
dist
ribut
ed b
y co
untie
s –
Oc
tobe
r 10t
h es
timat
e fo
rms
mai
led
to
com
pani
es
10 P
rodu
ctio
n Ta
x es
timat
es d
ue fr
om
com
pani
es
15 S
econ
d ha
lf of
Pro
pert
y Ta
x on
taco
nite
ra
ilroa
d pr
oper
ty d
ue to
cou
ntie
s
42
1. Northshore Mining 6.2 Owner: Cliffs Natural Resources, Inc. (100%) 2. ArcelorMittal Minorca Mine 2.8 Owner: ArcelorMittal (100%) 3. U. S. Steel–Minntac 16.0 Owner: USS Corporation (100%) 4. Hibbing Taconite 8.0 Cliffs Natural Resources, Inc., Managing Agent Owners: ArcelorMittal (62.3%) Cliffs Natural Resources, Inc. (23%) U. S. Steel Canada (14.7%) 5. United Taconite LLC 5.4 Owners: Cliffs Natural Resources, Inc. (100%)
Mine Locations and Production Capacity
* Effective capacity is the annual production capacity in natural long tons (including flux) that can be sustained under normal operating conditions.
The ownership percentages shown are the ultimate percentages controlled by parent steel and mining companies. In some instances, various other partnerships and subsidiaries are listed on legal corporate documents.
6. U. S. Steel–Keewatin Taconite 6.0 Owner: USS Corporation (100%) 7. Essar Steel Minnesota LLC (under construction) Unknown Owner: Essar Resources Inc. (100%)
8. Magnetation LLC 3.0 Owners: Magnetation, Inc. (50.1%)