25
2015 NMI Healthy Aging ® Database Sponsored in Part by The Stelter Company

2015 NMI Healthy Aging® Database Sponsored in Part by The Stelter Company

2015 NMI Healthy Aging® Database | p.2
Table of Contents Introduction p. 3
About This Study p. 4
Definitions p. 5
Planned Gifts p. 6
Restricted vs. Unrestricted Gifts p. 7
Donors and Donor Types p. 8
Donor Preferences and Challenges p. 15
Generational Unmet Needs p. 20
Donor Information and Influence Sources p. 21
About The Stelter Company p. 25

2015 NMI Healthy Aging® Database | p.3
Introduction The purpose of this report is to give planned giving professionals a new understanding of the preferences and priorities among donors to nonprofit organizations.
The new data from the Natural Marketing Institute’s 2015 Healthy Aging Database® study can help
shape donor-focused marketing and communications with more precision and insight, leading to
better return on your communication investment. The Stelter Company’s participation in this study
has led to the capture of powerful new data about the next wave of nonprofit donors on a
scale, and with a level of detail, never before seen.
The result is a volume of easy-to-understand data that illustrate the hopes, concerns, priorities
and demographic dynamics among donors to specific nonprofit types. The data segment donor
information into an array of statistical groups, from frequent and infrequent donors, non-donors,
net worth groupings and age categories to charity preferences, depth of sentiment and motivation
to give, even financial and health priorities.
No other planned giving marketing firm has captured this level of comprehensive data about
nonprofit donor communities across the United States. This report provides valuable insight to
create more strategic planned giving marketing communications for your organization.

2015 NMI Healthy Aging® Database | p.4
About This Study
The findings in this report are based on a survey of 3,001 respondents to the 2015 Healthy Aging
Database® study conducted by the Natural Marketing Institute. The Stelter Company acted as a
consultant to the Natural Marketing Institute on core questions regarding charitable giving with
the ability to embed proprietary questions.
The study was conducted in April 2015 of U.S. adults comprised of:
3,001 General Population sample
• 35% Millennials
• 20% Gen X
• 37% Boomers
• 8% Matures
The study was balanced to U.S. Census data across key demographics:
Gender, age, income, education, region and race
The study is statistically significant at the 95% confidence level to +/- 1.5%.
This means that if this survey was repeated using the same questions and the same methodology,
19 times out of 20, the findings would not vary from the percentages shown here by more than
plus or minus 1.5 percentage points.

2015 NMI Healthy Aging® Database | p.5
Definitions
GP: General population of U.S. adults
Donors: U.S. adults who have ever contributed to a charitable organization
Non-donors: U.S. adults who have never contributed to a charitable organization
Caregivers: U.S. adults who indicate they currently provide medical/managed-care assistance
or non-medical assistance for an aging loved one
MillennialsBorn 1977-1998
(ages 18-38)
Gen XBorn 1965-1976
(ages 39-50)
BoomersBorn 1946-1964
(ages 51-69)
MaturesBorn 1900-1945
(ages 70+)

2015 NMI Healthy Aging® Database | p.6
Planned Gifts
Donors who are more likely to leave a gift to a nonprofit at the time of their death
A planned gift at the time of death is “very” or “somewhat likely” for 35% to 48% of donors.
However, very few have already included such a gift in their wills. Education nonprofits rank
higher than other types of organizations for likelihood of receiving a planned gift. Human
Services organizations rank at the bottom of the list.
Percentage of donors indicating how likely they would be to donate a charitable gift
to their preferred organization at the time of their death:
■ Very ■ Somewhat ■ Not very/not at all ■ Already included in will
Arts/Culture
Public/Societal Benefits
Human Services
Faith Based
Medical Research
Health Care
Education
Environmental/Animal Welfare
International Affairs
0% 10% 20% 30% 40% 50% 60% 70% 80% 90%
12% 23% 38% 4%
15% 19% 37% 2%
16% 16% 42% 2%
19% 18% 37% 3%
20% 18% 36% 3%
22% 20% 29% 3%
24% 24% 31% 2%
24% 19% 30% 3%
27% 15% 32% 4%

2015 NMI Healthy Aging® Database | p.7
Restricted vs. Unrestricted Gifts
Large majority of donors give unrestricted gifts across all nonprofit types.
Unrestricted Gifts the Norm
Most donors give unrestricted gifts to the nonprofits of their choice. The highest percentage of
restricted gifts can be found in donations to international affairs organizations. Negative publicity
regarding stolen gifts and misuse of gifts in some unstable parts of the world may be to blame for
higher rates of restricted gift giving.
Inte
rnatio
nal Affa
irs
Arts/C
ulture
Public/S
ocietal B
enefits
Educatio
n
Health C
are
Human Serv
ices
Environm
ental/
Animal W
elfare
Medica
l Rese
arch
Faith
Based
■ Donors who give restricted $ ■ Donors who give unrestricted $
29% 21% 17% 16% 15% 15% 16% 11% 13%
80%
70%
60%
50%
40%
30%
20%
10%
56% 67% 69% 70% 70% 71% 71% 75% 76%
2015 NMI Healthy Aging® Database | p.8
Donors and Donor Types
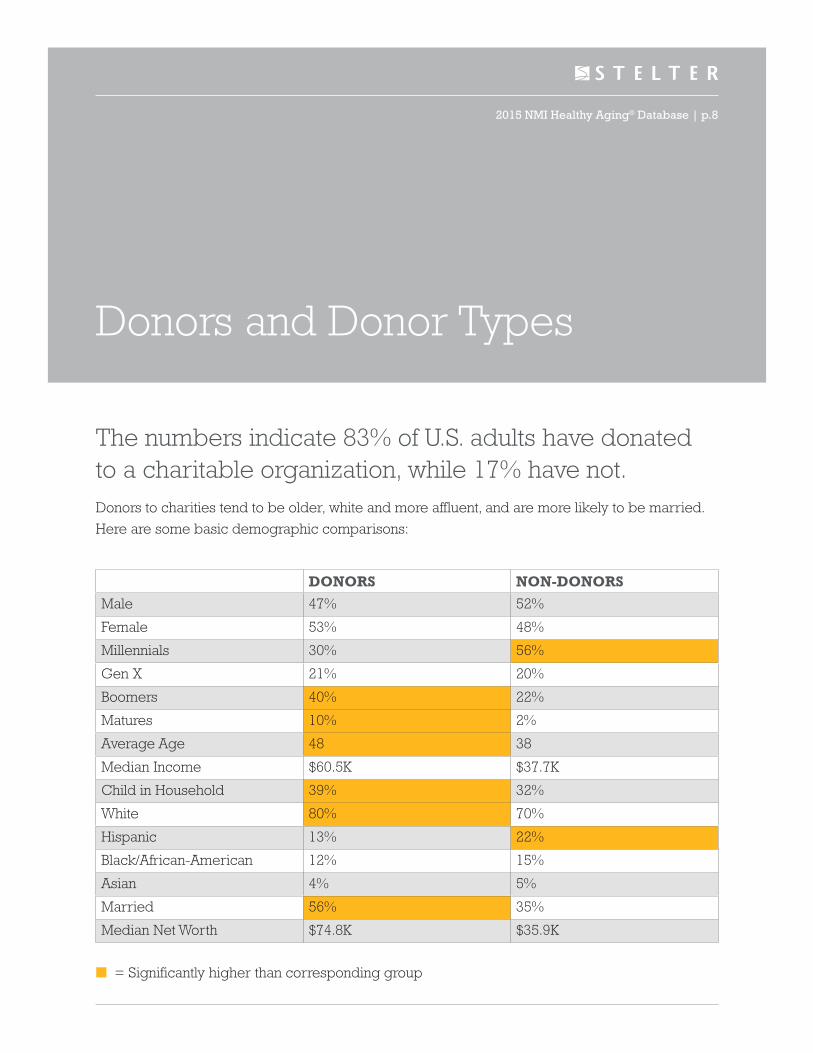
The numbers indicate 83% of U.S. adults have donated to a charitable organization, while 17% have not. Donors to charities tend to be older, white and more affluent, and are more likely to be married.
Here are some basic demographic comparisons:
DONORS NON-DONORSMale 47% 52%
Female 53% 48%
Millennials 30% 56%
Gen X 21% 20%
Boomers 40% 22%
Matures 10% 2%
Average Age 48 38
Median Income $60.5K $37.7K
Child in Household 39% 32%
White 80% 70%
Hispanic 13% 22%
Black/African-American 12% 15%
Asian 4% 5%
Married 56% 35%
Median Net Worth $74.8K $35.9K
■ = Significantly higher than corresponding group

2015 NMI Healthy Aging® Database | p.9
Who Are the Donors?
Donors and Age
More Matures and Boomers say they have donated to a nonprofit than Gen X or Millennials.
However, when looking at donations for the 12 months ending in April 2015, significantly more
Millennials and Gen X donors have donated to Education and International Affairs nonprofits than
older age groups.
Matures Boomers Gen X Millennials
Donors by Age Group
80%
90%
70%
60%
50%
40%
30%
20%
10%
95% 90% 83% 72%

2015 NMI Healthy Aging® Database | p.10
Donors and Ethnicity
Donors can be found in similar proportions across ethnic backgrounds. Some differences
do exist by type of nonprofit, but can be explained by other variables. For example, Asian
populations donated significantly higher to International Affairs nonprofits in 2014-15. This
may be related to the number of natural disasters occurring in Asian countries during the
time period.
Who Are the Donors?
White Black/African-American Asian Hispanic
Donors by Ethnic Group
80%
90%
70%
60%
50%
40%
30%
20%
10%
85% 79% 79% 75%

2015 NMI Healthy Aging® Database | p.11
How Donors and Non-Donors Describe Themselves
Donors and non-donors describe themselves similarly in many areas, but also have unique
characteristics they identify with. (Ranked in order by volume of chosen responses.)
DONORS NON-DONORS
Family Person 1 Loving
Loving 2 Family Person
Independent 3 Independent
Home Body 4 Home Body
Optimistic 5 Stressed
Satisfied With My Life 6 Fun-Seeking
Spiritual 7 Tired
Fun-Seeking 8 Optimistic
Healthy 9 Satisfied With My Life
Social 10 Worrier
■ = Descriptor is unique to the list

2015 NMI Healthy Aging® Database | p.12
Characteristics of Frequent and Infrequent Donors
Certain nonprofit categories appear to attract more repeat donors during a given year, while
others receive funding from a higher proportion of once-a-year donors. For some nonprofits,
focusing on characteristics of frequent donors may lead to identifying better qualified planned
giving prospects earlier in a donation pattern.
Donation Frequency
Arts/C
ulture
Public/S
ocietal B
enefits
Medica
l Rese
arch
Inte
rnatio
nal Affa
irs
Educatio
n
Environm
ental/
Animal W
elfare
Health C
are
Human Serv
ices
Faith
Based
■ Several times a year ■ About once a year
70%
60%
50%
40%
30%
20%
10%
14% 29% 32% 33% 36% 40% 43% 55% 69%
54% 47% 50% 49% 48% 39% 36% 33% 19%

2015 NMI Healthy Aging® Database | p.13
Differences Between Frequent and Infrequent Donors
FREQUENT DONORS INFREQUENT DONORS
Male 45% 50%
Female 55% 50%
Average Age 49 47
Child in Household 44% 34%
Median Income $68.5K $53.2K
Median Net Worth $104.1K $47.6K
College 36% 28%
White 81% 78%
Black/African-American 11% 12%
Hispanic 14% 12%
Asian 3% 4%
Describes Self asExtremely/Very Social 42% 32%
■ = Significantly higher response than corresponding group
Frequent Donors
Compared to infrequent donors, frequent donors are more likely to be female, older, college
educated and affluent; have a child in the household; and describe themselves as “social.”

2015 NMI Healthy Aging® Database | p.14
Frequent Donors Are More Likely to Try New Things
“ I am usually one of the first to try new products and services.”
Percentage of donors who agree with that statement:
For nonprofits launching new planned giving communication programs—or testing new delivery
channels—it may be wise to pay special attention to first responders. Not only are they likely to
continue contributing to your organization, but they also are more likely than other donors to act
as “ambassadors” for your organization through social contacts.
Frequent Donors
Donors
Non-Donors
Infrequent Donors
0% 10% 20% 30% 40% 50%
43%
40%
39%
37%

2015 NMI Healthy Aging® Database | p.15
Donor Preferences and Challenges
More donors give to human service charities than other types of nonprofits.
Percentage of donors indicating which type of organization they have donated money to in the
past year:
Arts/Culture
(Smithsonian, local symphony)
International Affairs
(Save The Children, Doctors Without Borders)
Education
(University foundations, UNCF)
Public/Societal Benefits
(Big Brothers, Boy Scouts)
Faith Based
(Catholic Charities, AJA)
Environmental/Animal Welfare
(Humane Society, Nature Conservancy)
Medical Research
(Cancer Society, American Lung Assn.)
Health Care
(St. Jude’s Children’s Hospital)
Human Services
(Goodwill, Salvation Army)
0% 10% 20% 30% 40% 50% 60%
7%
10%
11%
18%
27%
29%
32%
33%
50%

2015 NMI Healthy Aging® Database | p.16
Donors Prefer to Keep It Local
Donors of all ages, ethnic backgrounds, household income and net worth prefer to give to local
charities over national or global organizations.
= Outline highlights the groups that are high across the types of preferred organizations
■ Local ■ National ■ Global
HHI >$2mil
HHI $500K-$2mil
HHI <$500K
Hispanic
Asian
Black/African-American
White
Infrequent Donors
Frequent Donors
Matures
Boomers
Gen X
Millennials
All Donors
0% 10% 20% 30% 40% 50% 60% 70% 80% 90% 100%
54%
60%
53%
49%
51%
62%
58%
61%
63%
66%
60%
50%
60%
27%
29%
26%
28%
29%
27%
30%
29%
30%
31%
11%
6%
10%
15%
9%
9%
12%
6%
5%
11%
10%30%
19%
33%
34%
23%
21%
67%
35%

2015 NMI Healthy Aging® Database | p.17
All Donors
Frequent D
onors
Infre
quent Donors
Global
Environm
ental/Anim
al Welfa
re
Loca
l
Health C
are
Human Serv
ices
National
Educatio
n
Public/S
ocietal B
enefits
Inte
rnatio
nal
Medica
l Rese
arch
Faith
Based
Arts/C
ulture
■ I donate only to organizations that give 100% of my donation to the actual cause. ■ I trust organizations to put 100% of my donation toward the actual cause.
80%
90%
100%
70%
60%
50%
40%
30%
20%
10%
Donor Challenges:A Trust Gap Exists
Most donors say they donate only to organizations that distribute 100% of their funds directly to an
actual cause. However, only 1 in 5 donors trust an organization to actually do this.
64% 64% 65% 72% 64% 63% 73% 70% 67% 63% 62% 62% 61% 60% 59%
21% 23% 18% 33% 19% 21% 26% 24% 22% 18% 19% 20% 22% 22% 22%

2015 NMI Healthy Aging® Database | p.18
50%
40%
30%
20%
10%
37% 30% 26% 20% 22% 48% 28% 28% 48% 32%
Hispanic
Asian
Black
White
$100K+ HHI
<$100K HHI
Matu
res
Boomers
Gen X
Mill
ennials
Ability to Donate Today:Notable Demographic Segments
One-third of donors are in a better position to donate to charities today than they were 10 years
ago. That is slightly better than the general population (GP).
Percentage of consumers indicating their ability to donate to charities is better today compared
to 10 years ago:
Millennials and those with higher household incomes (HHI) are significantly more likely to
respond positively regarding their ability to donate to charitable organizations.
30%
20%
10%
Donors
32%
GP
29%

2015 NMI Healthy Aging® Database | p.19
Changing Family Dynamics Present a Challenge to Charitable Giving
Providing care and/or financial support for an adult child or adult family member impacts ability to give.
These obligations impact some donors’ ability to give to nonprofits.
Of the 14% of donors financially supporting adult child
Of the 13% of donors in caregiver role
5%
32%55%
8%
■ = Donate the same as before
■ = Donate less than before
■ = Donate more than before
■ = Did not answer/not sure
■ = Donate the same as before
■ = Donate less than before
■ = Donate more than before
■ = Did not answer/not sure
3%
31%56%
10%

2015 NMI Healthy Aging® Database | p.20
Generational Unmet Needs
A number of factors that contribute to quality of life are important across all age groups. At the
same time, many of these important factors are not working to satisfaction levels leaving big gaps
or “unmet needs.” The chart below lists the largest “importance vs. satisfaction” gaps for
each age group. Notice several of these “needs gaps” are common across multiple age groups.
Of particular note are the differences in unmet need rankings between Matures and Boomers with
the latter most concerned with financial issues surrounding retirement from the workforce. These
financial issues may impact the size of future charitable gifts or delay gift-making decisions.
Millennials
Having enough energy to do what I want to do
Mental/brain health
Having enough money to retire
Financial health
Getting enough sleep
Gen X
Having enough money to retire
Financial health
Having enough energy to do what I want to do
Having enough money for health care expenses
Getting enough sleep
Boomers
Having enough money to retire
Having enough energy to do what I want to do
Having enough money for health care expenses
Preventing certain diseases or health conditions
Mental/brain health
Matures
Government programs such as Social Security and Medicare
Having enough energy to do what I want to do
Having enough money to retire
Having enough money for health care expenses
Mental/brain health

2015 NMI Healthy Aging® Database | p.21
Donor Information and Influence Sources
Personal experience, friends/relatives and the Web are top information preferences to learn about a nonprofit.Personal experience with a charity is by far the most influential determinant in motivating donors to donate. People, whether a spouse, friend or relative, are also highly influential.
Politicians
Accountant/Lawyer
Celebrity Spokesperson/Endorsement
Magazine Stories/Ads
Personal Emails
Newspaper Stories/Ads
Children
Direct Mail
Television/Radio Ads
Nonprofit Org. Employee
Spouse/Significant Other
Internet/Websites
Friends/Relatives
Personal Experience
0% 10% 20% 30% 40% 50% 60% 70% 80% 90% 100%
0% 1%
1% 1%
1% 2%
2% 3%
2% 4%
2% 4%
3%
5%
5%
6%
8%
10%
16%
28%
21%
5%
6%
8%
30%
13%
26%
56%
■ Where I prefer to first learn about a nonprofit ■ Has a lot of influence in decision to donate
2015 NMI Healthy Aging® Database | p.22
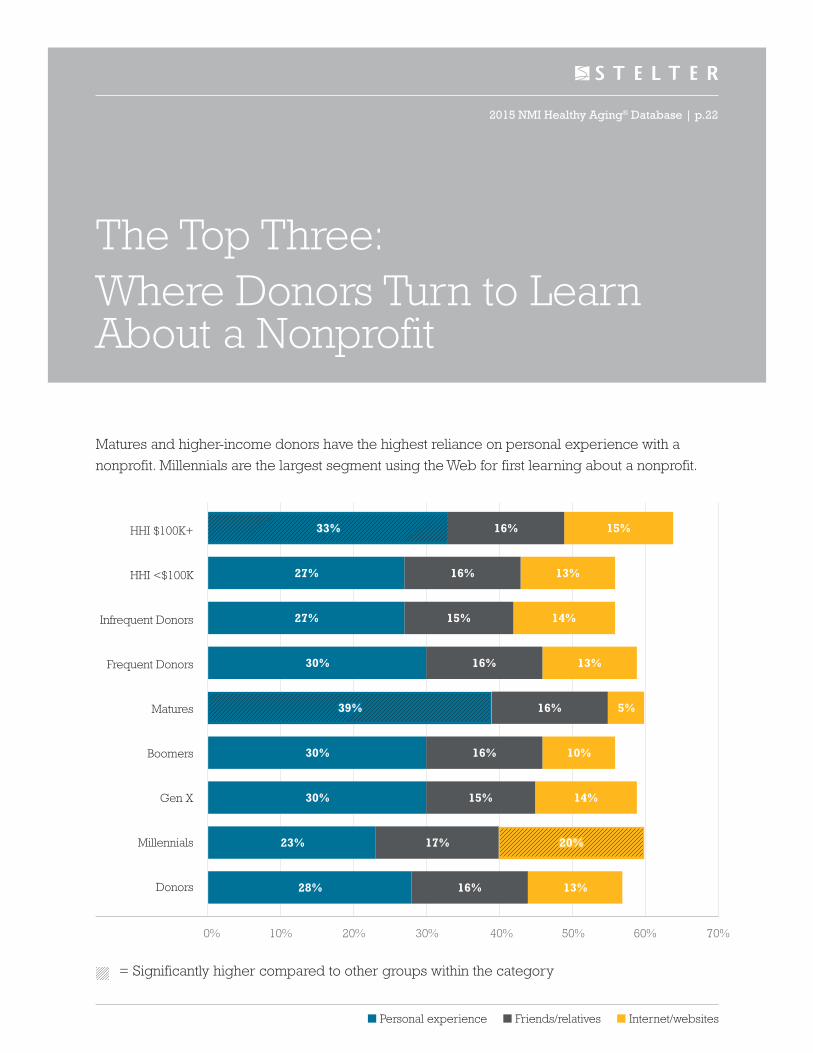
The Top Three:Where Donors Turn to Learn About a Nonprofit
Matures and higher-income donors have the highest reliance on personal experience with a
nonprofit. Millennials are the largest segment using the Web for first learning about a nonprofit.
= Significantly higher compared to other groups within the category
HHI $100K+
HHI <$100K
Infrequent Donors
Frequent Donors
Matures
Boomers
Gen X
Millennials
Donors
0% 10% 20% 30% 40% 50% 60% 70%
■ Personal experience ■ Friends/relatives ■ Internet/websites
28%
23%
30%
30%
30%
27%
27%
16%
17%
15%
16%
16%
16%
15%
16%
16%
13%
14%
10%
5%
13%
14%
13%
15%
20%
39%
33%

2015 NMI Healthy Aging® Database | p.23
Donor Preference Differs for Initial Information Source
Some charities score higher than others for where donors prefer to first learn about an
organization. This is illustrated in the chart below, with an index of 100 representing average
and higher index scores (above 120) highlighted by the gray box.
This simply means that while a certain information source—TV/radio ads, for example—may
rank toward the bottom of the list for some, contributors to international affairs and health care
nonprofits score them as higher than other sources.
Personal Experience 28% 121 116 97 114 93 103 81 106 131
Friends/Family 16% 89 102 83 120 101 109 83 126 98
Websites 13% 113 97 136 68 108 102 157 98 83
Spouse/Significant Other 8% 108 60 108 141 89 99 93 97 127
Nonprofit Org. Employee 6% 128 84 87 58 107 84 101 97 99
TV/Radio Ads 6% 49 62 86 62 117 104 121 86 62
Direct Mail 5% 85 121 104 138 122 109 84 111 67
% D
onors
Arts/C
ulture
Educatio
n
Environm
ental/Anim
al Welfa
re
Faith
Based
Health C
are
Human Serv
ices
Inte
rnatio
nal Affa
irs
Medica
l Rese
arch
Public/S
ocietal B
enefits

2015 NMI Healthy Aging® Database | p.24
Web Use: Donors Are Social, Shop and Seek InformationDonors are active in the digital world and show some tendencies to visit certain websites more
than non-donors. Facebook tops the list of visited sites—a clear opportunity for nonprofits to
integrate social media into their planned giving communication plans.
% Donors who visit
Facebook 68%
Amazon 67%
Google 55%
YouTube 51%
eBay 32%
Wikipedia 31%
The Weather Channel 27%
Yahoo News 25%
Bing 24%
WebMD 21%
Craigslist 20%
Pinterest 20%
Twitter 19%
Pandora 16%
CNN.com 16%
MSN 16%
Food Network 15%
Instagram 14%
Fox (news, sports, etc.) 14%
LinkedIn 12%
AARP 11%
Trip Advisor 9%
The New York Times 6%
MSNBC 5%
Mayoclinic.com 5%
■ = Denotes significantly more donors than non-donors visit the website

2015 NMI Healthy Aging® Database | p.25
About The Stelter Company
In business since 1962, The Stelter Company is the strategic partner that nearly 2,000 leading
nonprofits nationwide depend on most to provide expertise on cultivating valuable, long-term
donor relationships through a unique combination of industry insight, customer focus and creative
services. Our industry-leading print and digital products and services help nonprofits meet their
planned giving goals and provide solutions to tackle the changing communication needs of their
donor base. Stelter provides clients strategic counsel with a dedicated project management team,
regional marketing representative and our in-house technical consultant.
Citation guidelines
This report may be redistributed in it entirety. Portions may be downloaded in its entirety. Portions
may be excerpted using the following credit: 2015 NMI Healthy Aging Database® study.
© 2015 The Stelter Company
This report may be downloaded in its entirety at www.stelter.com/research.


