40
| Date post: | 13-Apr-2017 |
| Category: |
Government & Nonprofit |
| Upload: | chatham-economic-development-corporation |
| View: | 217 times |
| Download: | 2 times |

Presenting sponsorPresenting Sponsor

Presenting sponsorGold Sponsors
Presenting sponsorGold Sponsors

Presenting sponsorGold Sponsors
Presenting sponsor
Aqua NC
Brookwood Farms
Carolina Meadows
Central Carolina Community College
Chandler Concrete
Chatham Park
Duke Energy
Silver Sponsors
Presenting sponsor
Kimley-Horn
McGill Associates
Nelson Mullins / NAI Carolantic Realty
Randolph Electric Membership Corp.
S&ME, Inc.
Stimmel Associates, P.A.
WithersRavenel
Silver Sponsors
Presenting sponsor
Barber & Barber Law, PLLC
BB&T
Chatham Hospital
Coldwell Banker Advantage – The Jacobs Team
Galloway Ridge
Hobbs Architects, P.A.
McKim & Creed
Piedmont Health SeniorCare
Research Triangle Regional Partnership
Taylor & McChesney Commercial Properties
Welford Harris, Inc.
Bronze Sponsors
Presenting sponsor
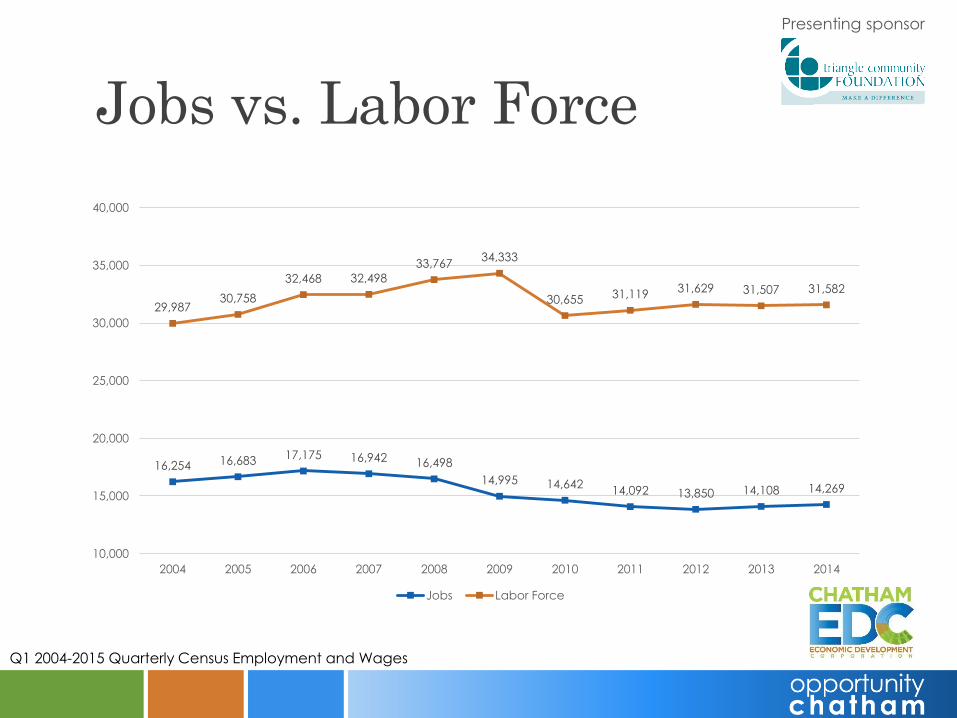
Jobs vs. Labor Force
29,98730,758
32,468 32,498
33,76734,333
30,655 31,11931,629 31,507 31,582
16,254 16,683 17,175 16,942 16,498
14,995 14,64214,092 13,850 14,108 14,269
10,000
15,000
20,000
25,000
30,000
35,000
40,000
2004 2005 2006 2007 2008 2009 2010 2011 2012 2013 2014
Jobs Labor Force
Q1 2004-2015 Quarterly Census Employment and Wages
Presenting sponsor
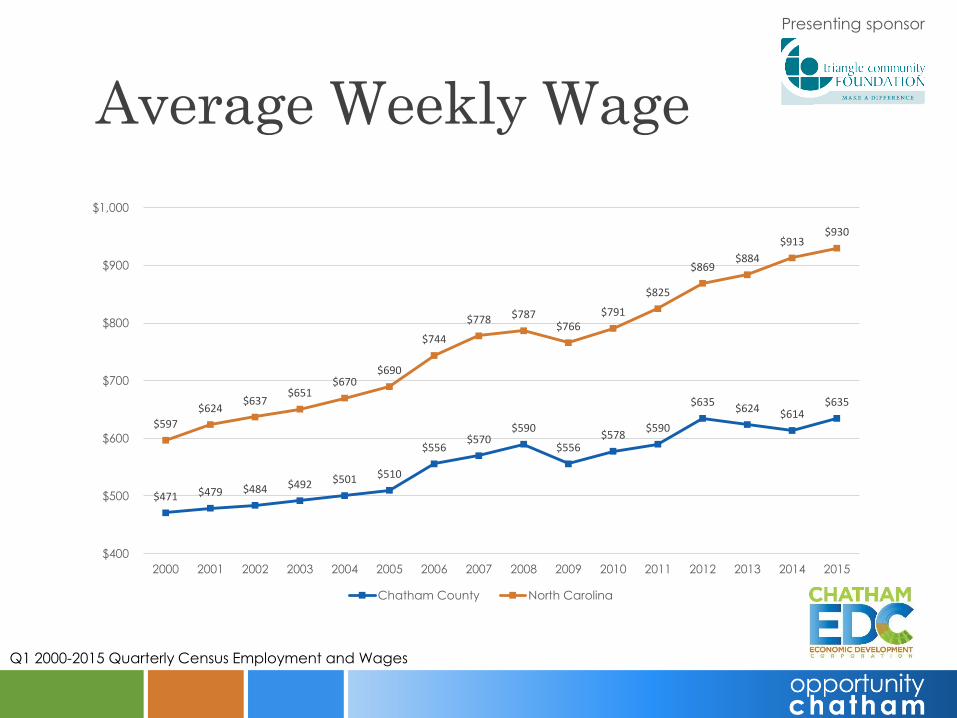
Average Weekly Wage
$597
$624$637
$651$670
$690
$744
$778 $787$766
$791
$825
$869$884
$913$930
$471 $479 $484 $492 $501 $510
$556$570
$590
$556$578
$590
$635$624 $614
$635
$400
$500
$600
$700
$800
$900
$1,000
2000 2001 2002 2003 2004 2005 2006 2007 2008 2009 2010 2011 2012 2013 2014 2015
Chatham County North Carolina
Q1 2000-2015 Quarterly Census Employment and Wages
Presenting sponsor
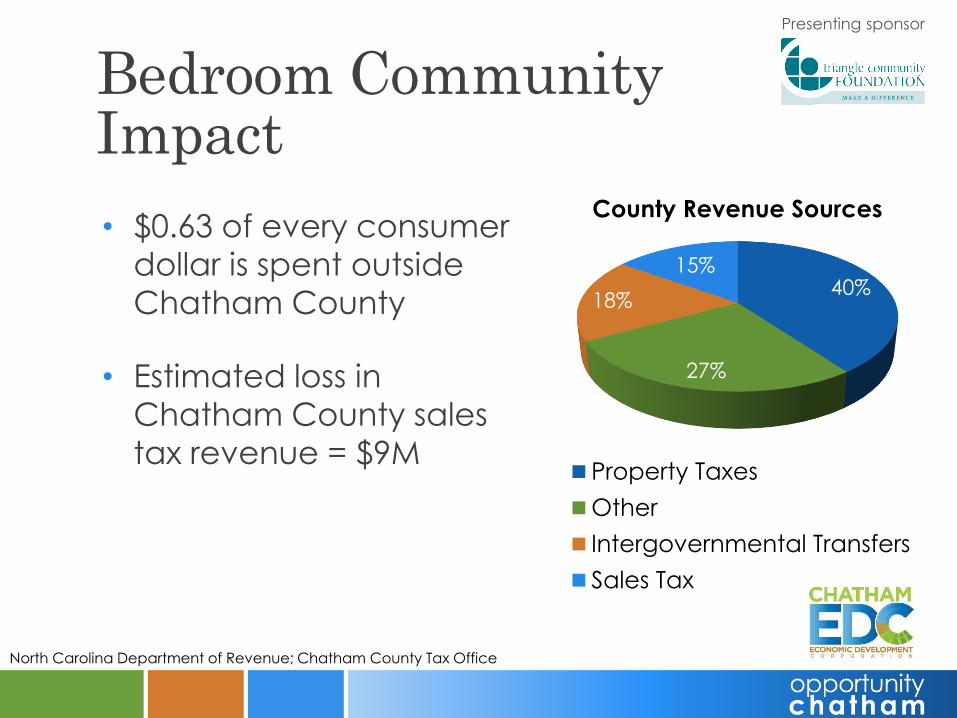
Bedroom Community Impact
• $0.63 of every consumer
dollar is spent outside
Chatham County
• Estimated loss in
Chatham County sales
tax revenue = $9M
40%
27%
18%
15%
County Revenue Sources
Property Taxes
Other
Intergovernmental Transfers
Sales Tax
North Carolina Department of Revenue; Chatham County Tax Office
Presenting sponsor
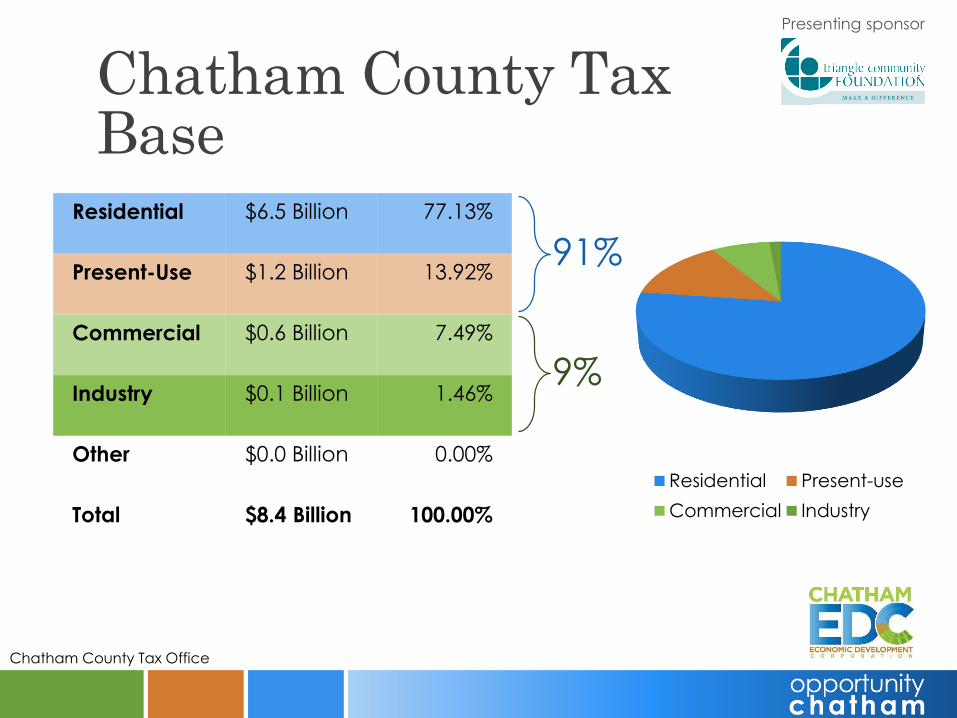
Chatham County Tax Base
Residential $6.5 Billion 77.13%
Present-Use $1.2 Billion 13.92%
Commercial $0.6 Billion 7.49%
Industry $0.1 Billion 1.46%
Other $0.0 Billion 0.00%
Total $8.4 Billion 100.00%
Residential Present-use
Commercial Industry
91%
9%
Chatham County Tax Office

Presenting sponsor
Cost of Community Services
$1.14
$0.33
$0.58
Residential Commercial Farmland
Department of Agricultural and Resource Economics, North Carolina State University, 2007
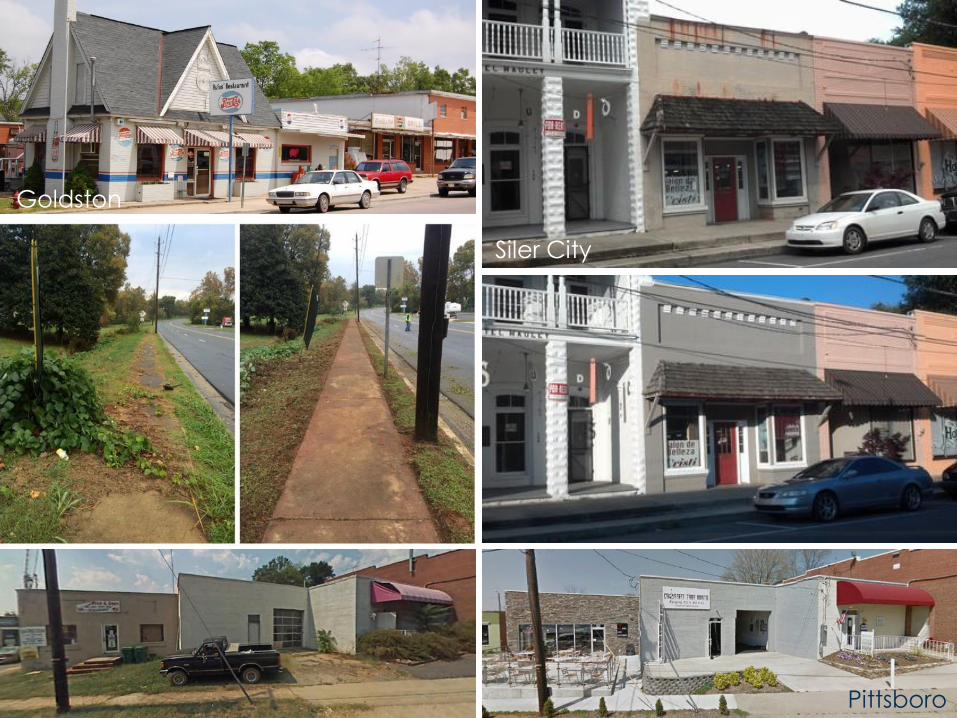
Siler City
Goldston
Pittsboro
Presenting sponsor
Presenting sponsor
Presenting sponsor
Presenting sponsor
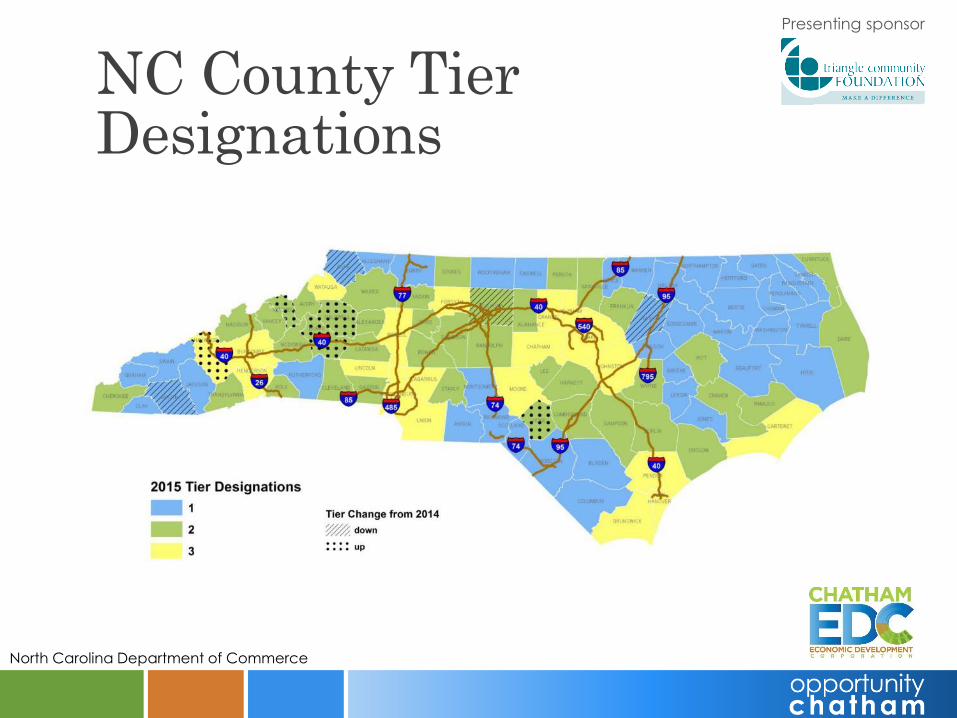
NC County Tier Designations
North Carolina Department of Commerce
Presenting sponsor
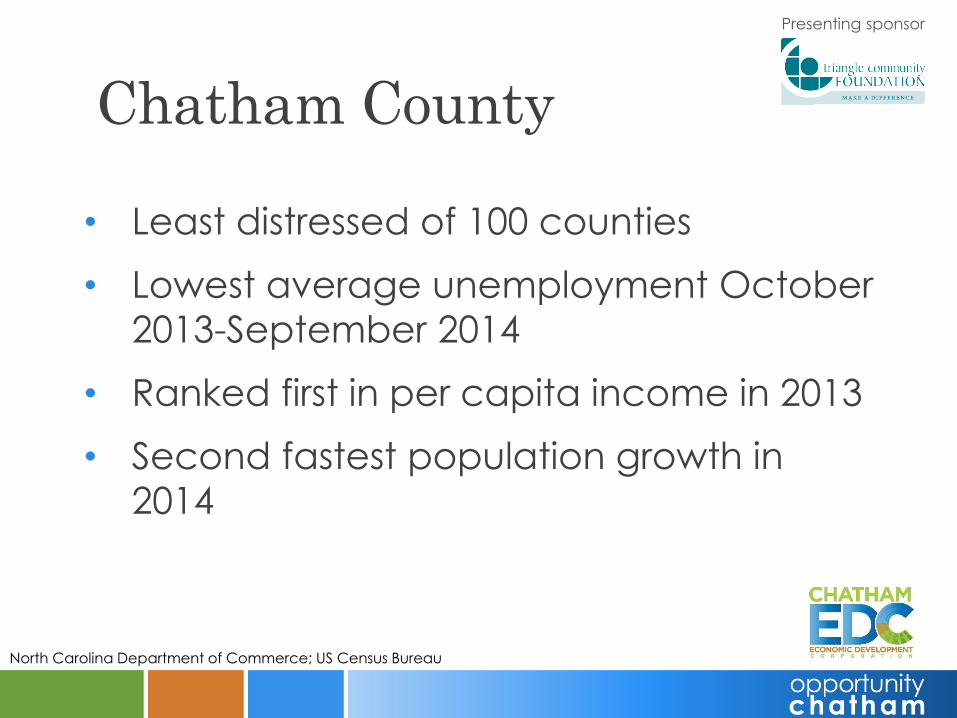
Chatham County
• Least distressed of 100 counties
• Lowest average unemployment October
2013-September 2014
• Ranked first in per capita income in 2013
• Second fastest population growth in
2014
North Carolina Department of Commerce; US Census Bureau
Presenting sponsor
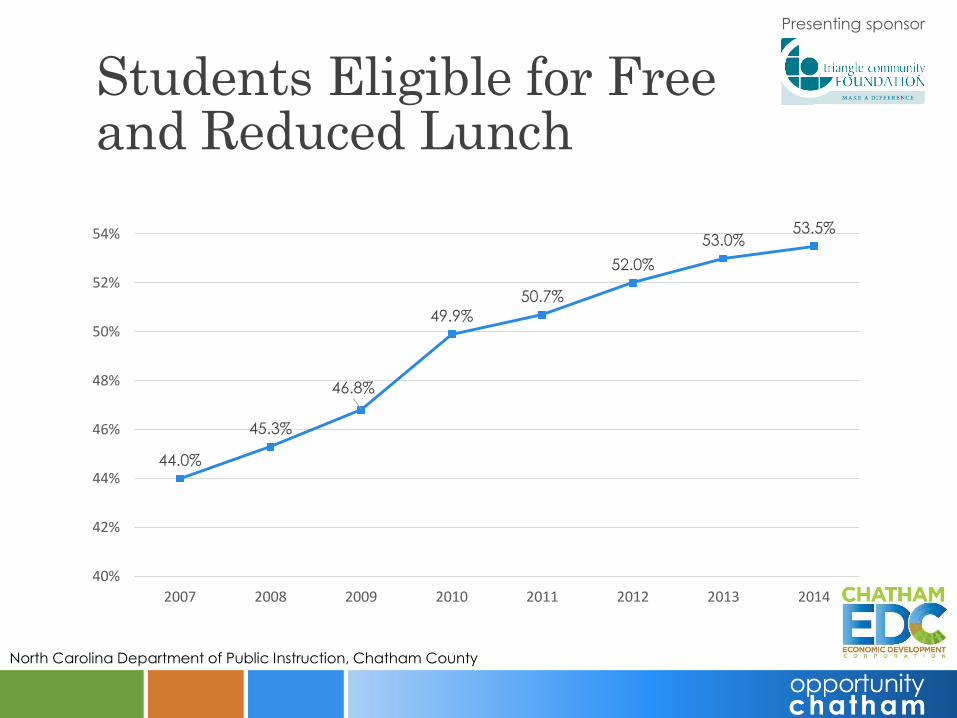
Students Eligible for Free and Reduced Lunch
44.0%
45.3%
46.8%
49.9%
50.7%
52.0%
53.0%53.5%
40%
42%
44%
46%
48%
50%
52%
54%
2007 2008 2009 2010 2011 2012 2013 2014
North Carolina Department of Public Instruction, Chatham County
Presenting sponsor
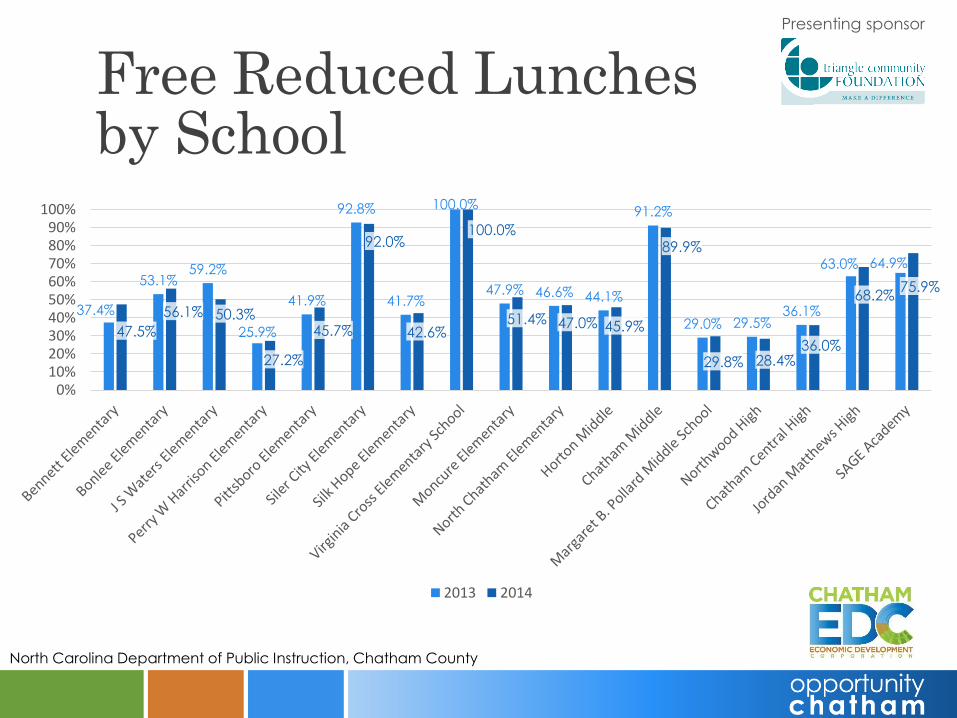
Free Reduced Lunches by School
37.4%
53.1%59.2%
25.9%
41.9%
92.8%
41.7%
100.0%
47.9% 46.6% 44.1%
91.2%
29.0% 29.5%36.1%
63.0% 64.9%
47.5%
56.1% 50.3%
27.2%
45.7%
92.0%
42.6%
100.0%
51.4% 47.0% 45.9%
89.9%
29.8% 28.4%36.0%
68.2%75.9%
0%10%20%30%40%50%60%70%80%90%
100%
2013 2014
North Carolina Department of Public Instruction, Chatham County
Presenting sponsor
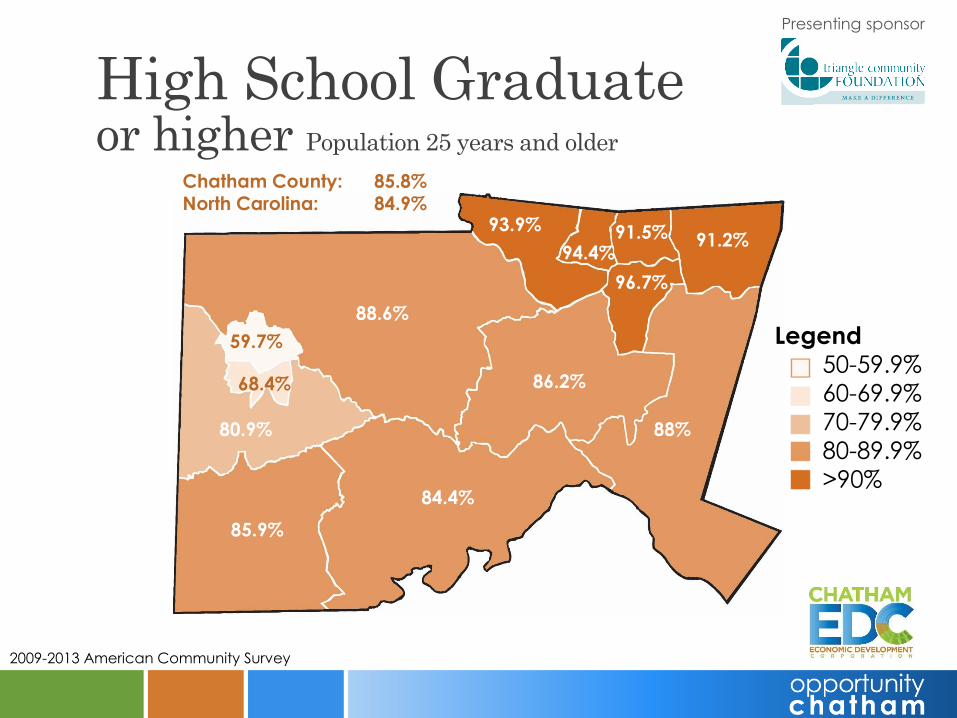
High School Graduateor higher Population 25 years and older
Legend
50-59.9%
60-69.9%
70-79.9%
80-89.9%
>90%
2009-2013 American Community Survey
91.5%
96.7%
91.2%
88%
86.2%
93.9%
88.6%
84.4%
85.9%
80.9%
68.4%
59.7%
94.4%
Chatham County: 85.8%North Carolina: 84.9%
Presenting sponsor
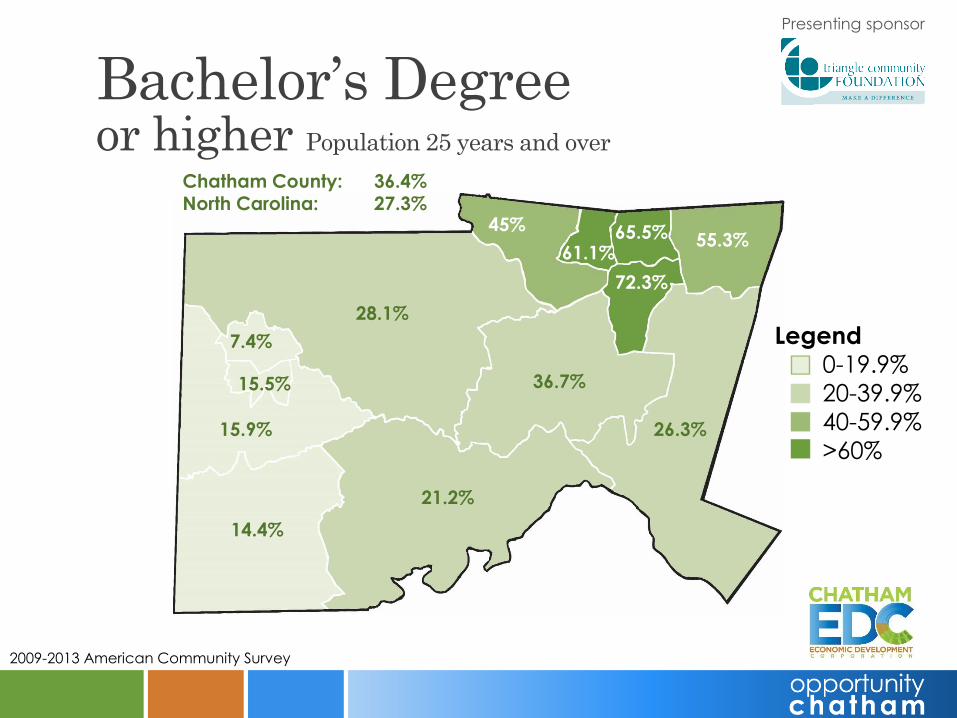
Bachelor’s Degreeor higher Population 25 years and over
Legend
0-19.9%
20-39.9%
40-59.9%
>60%
2009-2013 American Community Survey
65.5%
72.3%
55.3%
26.3%
36.7%
45%
28.1%
21.2%
14.4%
15.9%
15.5%
7.4%
61.1%
Chatham County: 36.4%North Carolina: 27.3%

Presenting sponsor
Poverty - All People
Legend
0-6.9%
7-13.9%
14-20.9%
21-27.9%
>28%
2009-2013 American Community Survey
6.9%
3%
6.9%
9%
14.9%
5.4%
8.8%
14.9%
15.8%
10.2%
18.1%
33.3%
8.7%
Chatham County: 12.4%North Carolina: 17.5%
Presenting sponsor
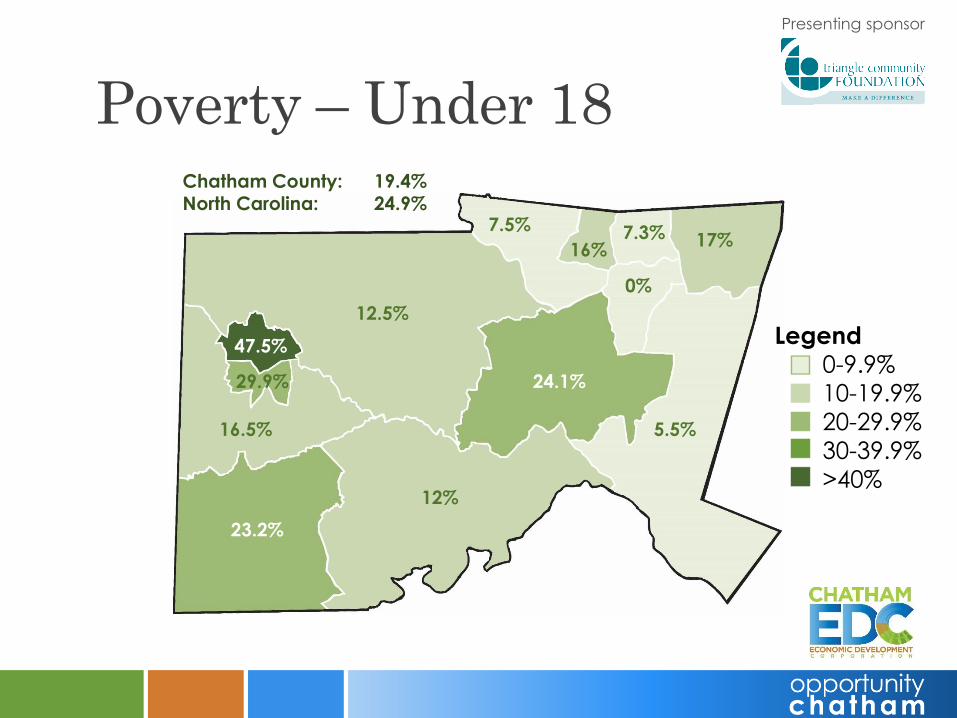
Poverty – Under 18
Legend
0-9.9%
10-19.9%
20-29.9%
30-39.9%
>40%
7.3%
0%
17%
5.5%
24.1%
7.5%
12.5%
12%
23.2%
16.5%
29.9%
47.5%
16%
Chatham County: 19.4%North Carolina: 24.9%
Presenting sponsor
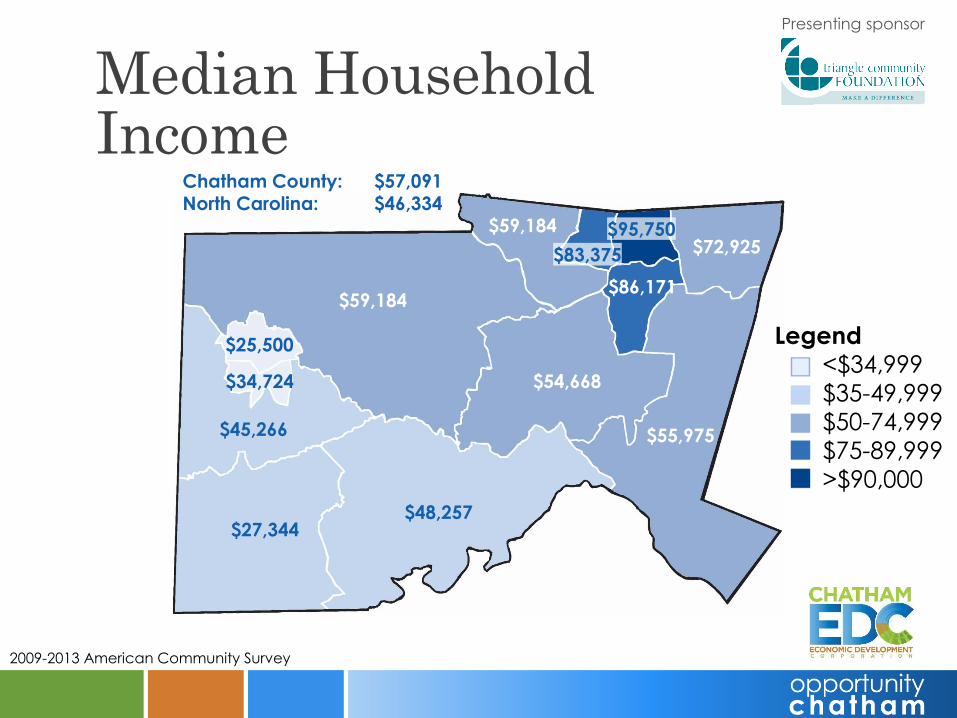
Median Household Income
Legend
<$34,999
$35-49,999
$50-74,999
$75-89,999
>$90,000
2009-2013 American Community Survey
$95,750
$86,171
$72,925
$55,975
$54,668
$59,184
$59,184
$48,257$27,344
$45,266
$34,724
$25,500
$83,375
Chatham County: $57,091North Carolina: $46,334
Presenting sponsor
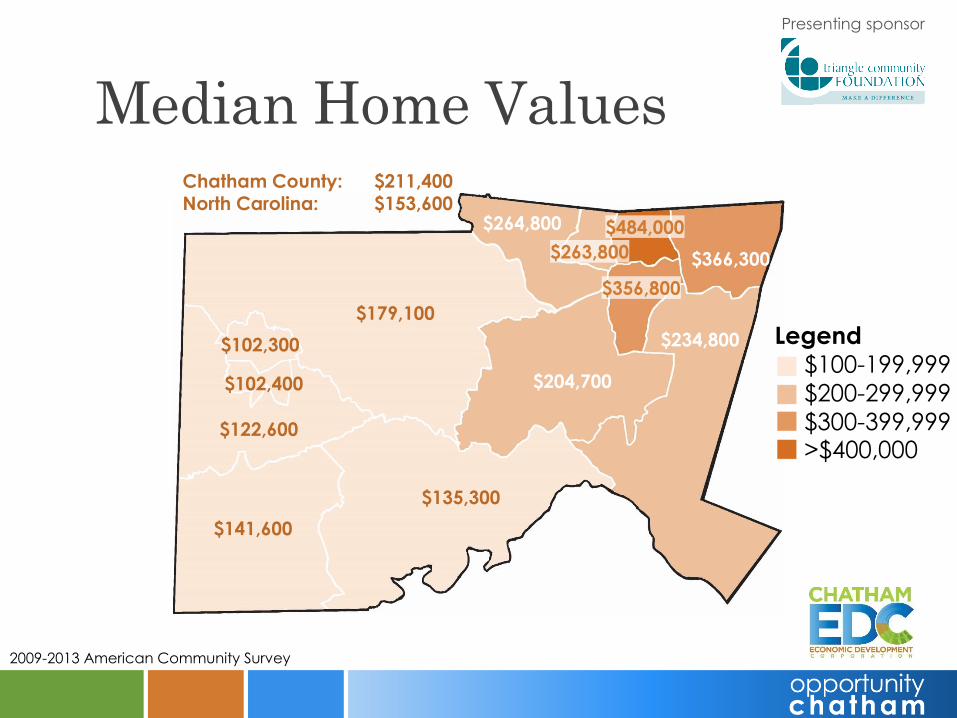
Median Home Values
2009-2013 American Community Survey
Legend
$100-199,999
$200-299,999
$300-399,999>$400,000
$484,000
$356,800
$366,300
$234,800
$204,700
$264,800
$179,100
$135,300
$141,600
$122,600
$102,400
$102,300
$263,800
Chatham County: $211,400North Carolina: $153,600

Presenting sponsor
Households with Monthly Housing Costs 30% or Greater of Income
2009-2013 American Community Survey
Legend
15-19.9%
20-24.9%
25-29.9%
>30%
34.3%
19.1%
26.6%
25.9%
28.6%
31.1%
26.9%
24.3%
32.2%
30.3%
33.3%
38.2%
15.1%
Chatham County: 25.1%North Carolina: 25.9%
Presenting sponsor
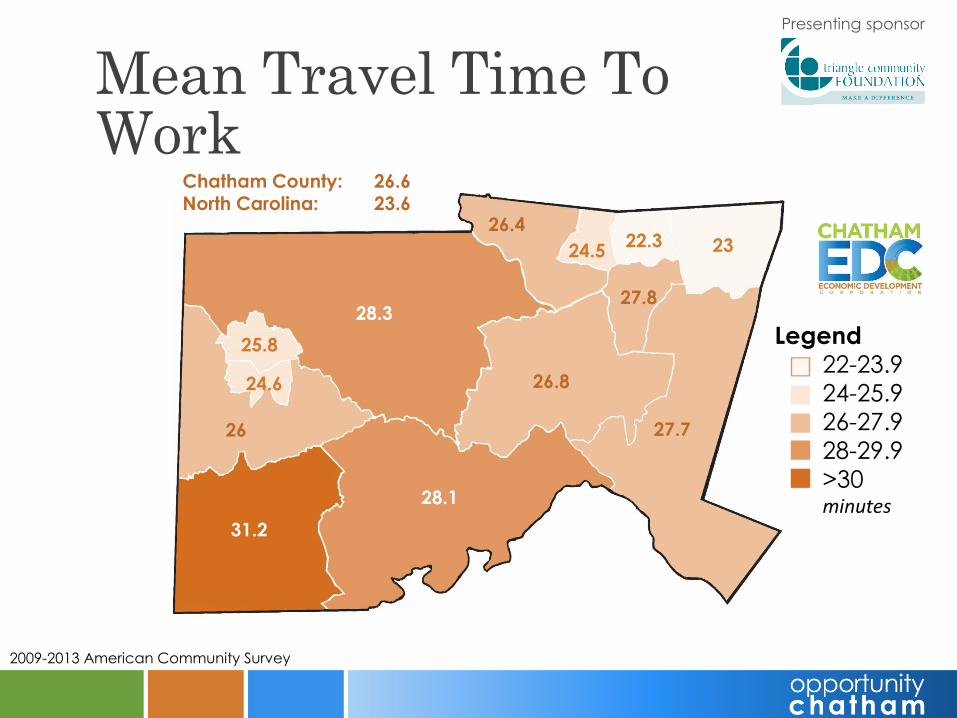
Mean Travel Time To Work
Legend
22-23.9
24-25.9
26-27.9
28-29.9
>30minutes
2009-2013 American Community Survey
22.3
27.8
23
27.7
26.8
26.4
28.3
28.1
31.2
26
24.6
25.8
24.5
Chatham County: 26.6North Carolina: 23.6
Presenting sponsor
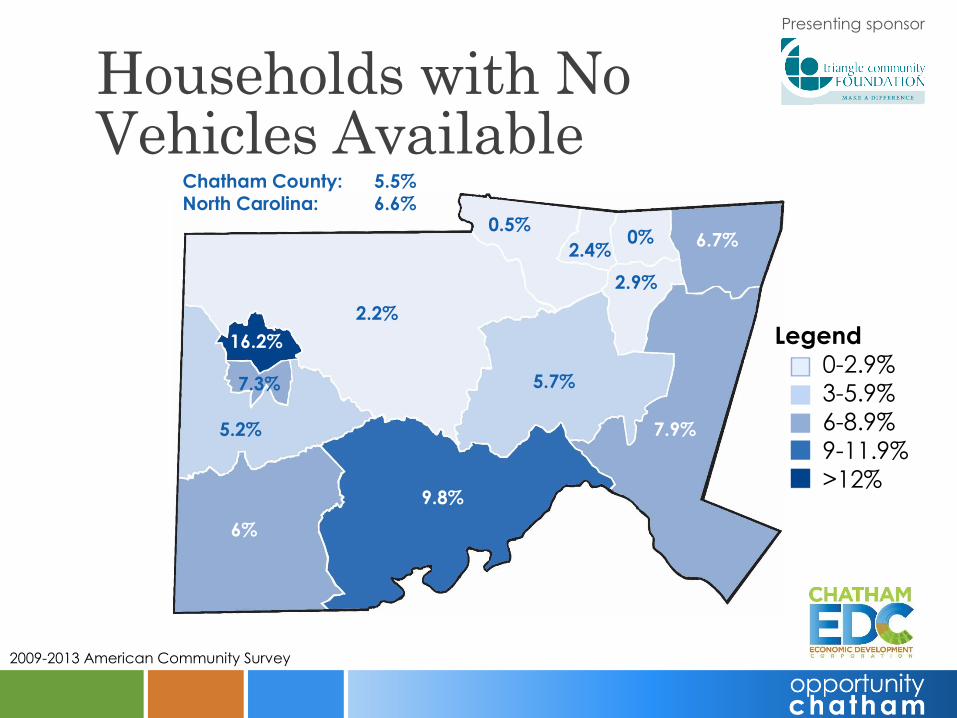
Households with No Vehicles Available
Legend
0-2.9%
3-5.9%
6-8.9%
9-11.9%
>12%
2009-2013 American Community Survey
0%
2.9%
6.7%
7.9%
5.7%
0.5%
2.2%
9.8%
6%
5.2%
7.3%
16.2%
2.4%
Chatham County: 5.5%North Carolina: 6.6%
Presenting sponsor
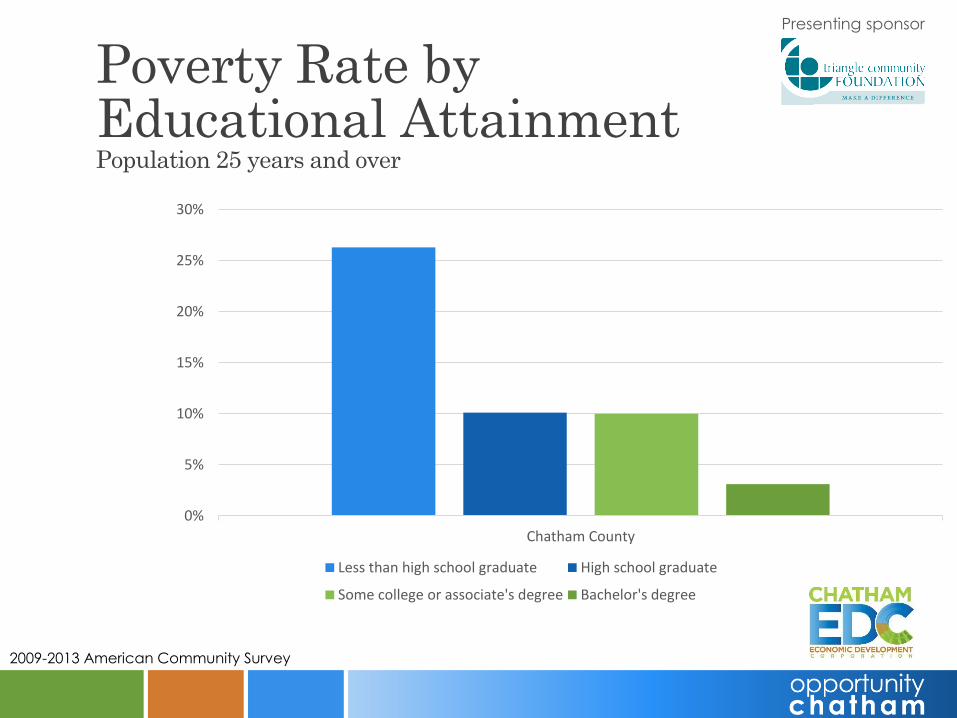
Poverty Rate by Educational AttainmentPopulation 25 years and over
0%
5%
10%
15%
20%
25%
30%
Chatham County
Less than high school graduate High school graduate
Some college or associate's degree Bachelor's degree
2009-2013 American Community Survey
Presenting sponsor

Presenting sponsor
Presenting sponsor
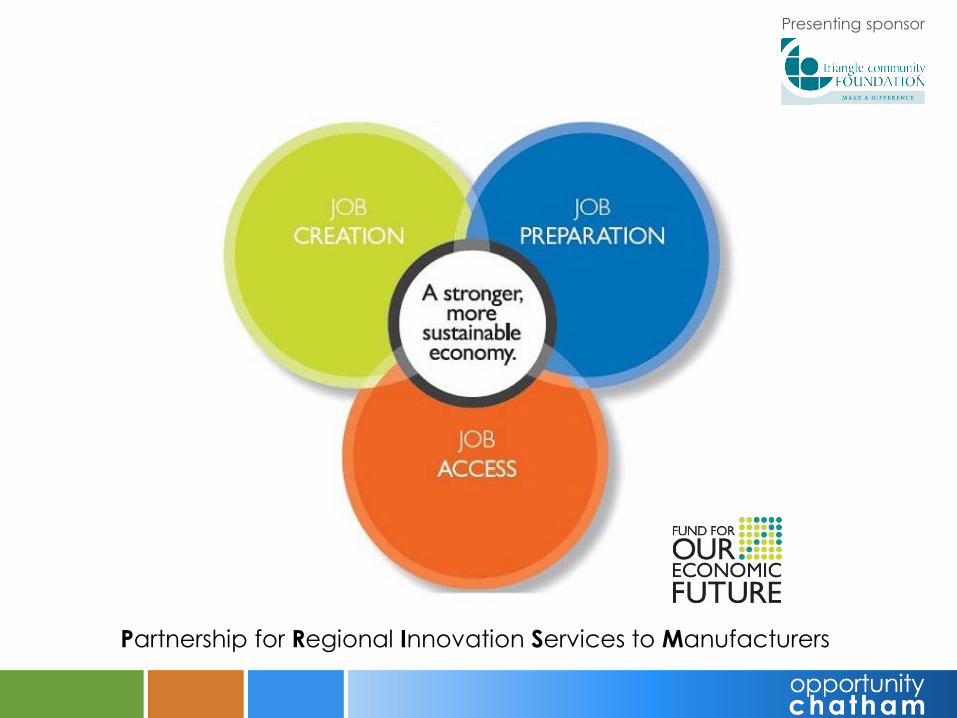
Partnership for Regional Innovation Services to Manufacturers

Presenting sponsor
Community Ventures
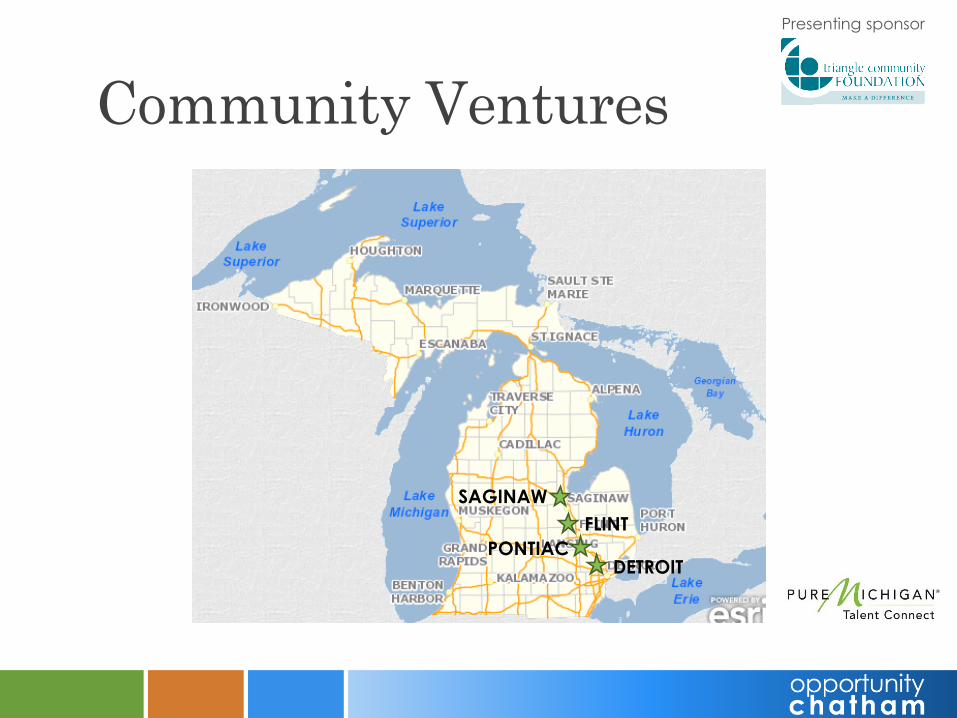
Presenting sponsor
Community Ventures
SAGINAW
FLINT
PONTIACDETROIT

Presenting sponsor
Community Ventures
• 3,600 full-time jobs
• 69% retention rate
• $11.60 per hour
• Reduced crime
• 120 companies
• 14 month return on investment

Presenting sponsor
Community Ventures
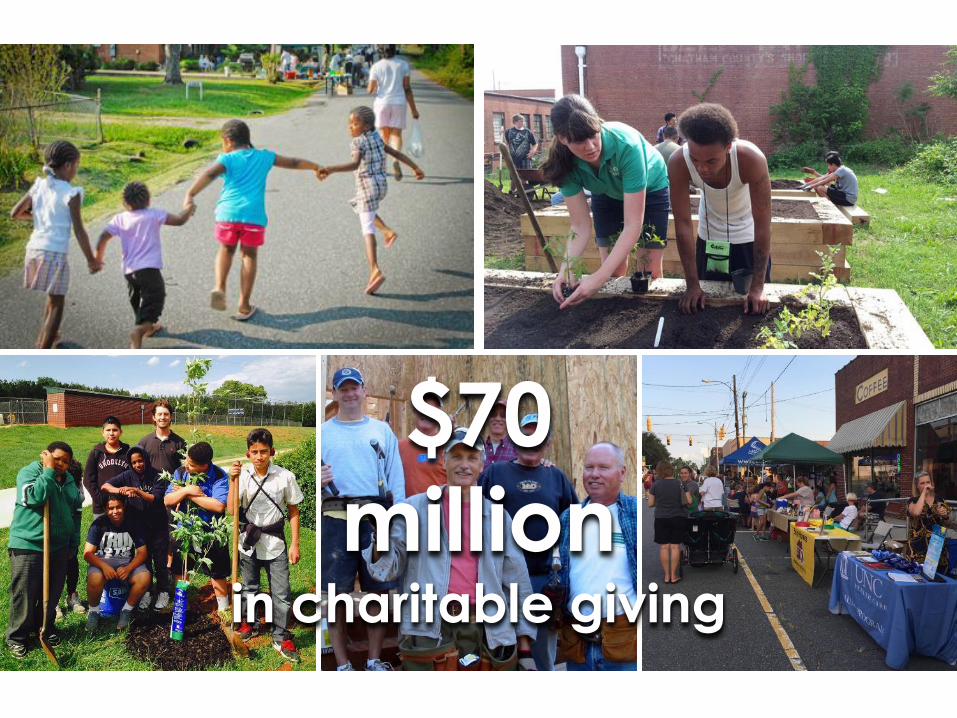
$70
millionin charitable giving


