23
Faroe Petroleum plc 2015 Preliminary Results 29 March 2016

Faroe Petroleum plc
2015 Preliminary Results29 March 2016

Strong production performance and low operating costs Total average economic production1 for 2015 at 10,530 boepd (2014: 9,106 boepd) Average operating cost reduced to $23 per boe (2014: $33 per boe) Acquisition of additional interests in Blane and Enoch oil fields in UK
Significant reserves growth 2P Reserves increased by 88% to 57.4 mmboe (2014: 30.6 mmboe) 2C Contingent Resources decreased to 98.3 mmboe (2014: 109.1 mmboe)
Exploration programme adding 2C & replenishing hopper An oil discovery of 13-31 mmboe (gross) on Boomerang well in September 2015 Skirne East (Shango) well small gas discovery; Portrush, Bister & Kvalross (2016) dry Five APA licences won in Norway in January 2015 plus a further six in January 2016
Financially robust Year-end cash of £91.5m and net cash £68.5m Revenue of £113.0m (excluding hedging gains) EBITDAX of £60.4m Pre-tax E&A write offs £83.5m and pre-tax D&P impairments of £45.1m
1 Economic production in 2015 includes production from the recently acquired interest in the Blane field (12.5%) from 1 January 2015 (the effective date).Accounting production excludes production between the effective date and the date of completion on 5 November 2015. Accounting production in 2015 was 10,252 boepd (2014 6,579 boepd)
2 Adjusted to exclude Kvalross prospective resource
Faroe well capitalised and on track to become leading independent E&P player in the North Sea 2
2015 Final Results SummaryStrong production performance, lowered opex, significant reserves growth & robust cashflow
Converting exploration success and transactions into value
Prospective un-risked resources
2P reserves
2C resources
98.3 mmboe*
30.6 mmboe*
>800mmboe2
* 31 December 2015
57.4 mmboe*
109 mmboe*

3
Outlook – fully-funded well programme and positioned for potential acquisitions Two remaining 2016 exploration wells (benefit from 78% tax rebate) 2016 capex estimates:
E&A £50m pre-tax (£12m post-tax) D&P £20 million
2016 production guidance of 7,000 - 9,000 boepd split 55% liquids and 45% gas
Well positioned to capitalise on market conditions to add value
2015 Final Results SummaryOutlook
Faroe well capitalised and on track to become leading independent E&P player in the North Sea

Exploration and appraisalActive drilling programme: E&A continuing - benefiting from lower costs in 2016
All planned exploration wells are in Norway – benefiting from 78% tax rebate incentive
Further attractive exploration well opportunities under consideration for 2017 via farm-in
Economic robustness is always crucial element of pre-commitment screening work
Very active programme – fully funded with significant upside potential
Prospect EquityQ1 Q2 Q3 Q4 Q1 Q2 Q3 Q4
Kvalross ** 40.0%
Brasse * 50.0%
Njord North Flank * 7.5%
Dazzler* 20.0%
Cassidy 15.0%
Edinburgh*** 8.5%* committed** drilled
*** 8.5% is the estimated paying interest in the cross border Exploration well. Faroe holds 35% of the Norwegian licence.
2016 2017
4

The Brage area (Faroe 14.3% in producing Brage field)
Very prospective area, containing giant Oseberg field, Brage and Veslefrikk
Krafla is a recent exploration success
79 wildcat exploration wells since 1975 - 62% technical success rate (this is high by any measure)
PL740 Brasse prospect
Faroe holds 50% and is operator, Core Energy holds 50%
Transocean Arctic semi-sub contracted to drill in summer 2016 - low day rate secured
Significant undrilled structural prospect located in close proximity to large oil fields
A discovery would be tied back to Brage or Oseberg
Exploration and appraisalBrasse – near field exploration well - expected summer 2016
5Excellent prospect benefiting from low rig rate with near term tie-back potential
Brasse prospect
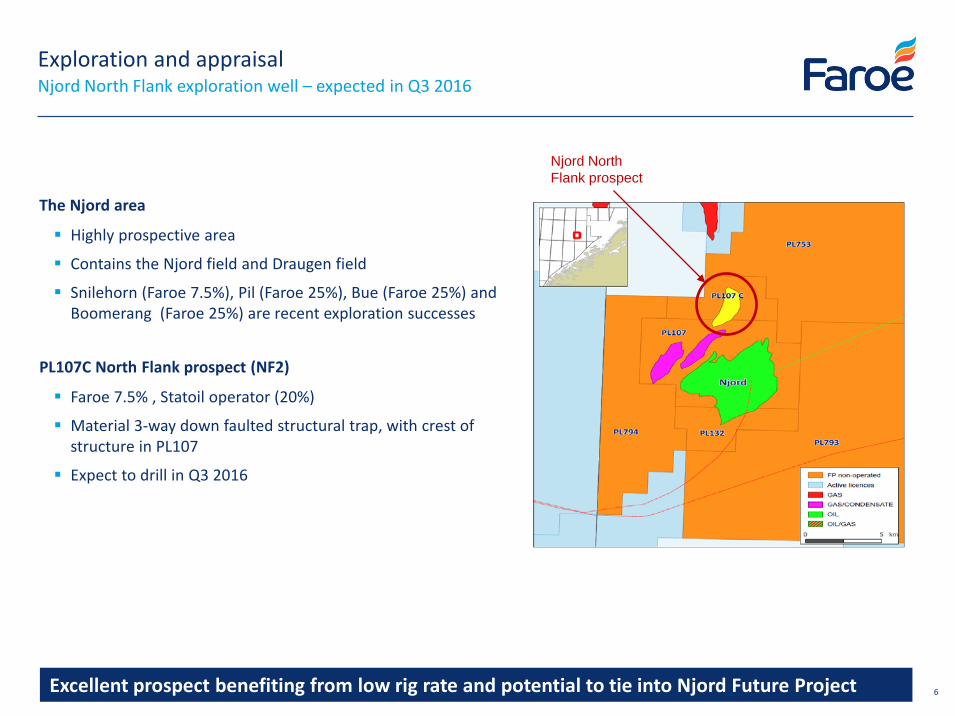
Exploration and appraisalNjord North Flank exploration well – expected in Q3 2016
The Njord area
Highly prospective area
Contains the Njord field and Draugen field
Snilehorn (Faroe 7.5%), Pil (Faroe 25%), Bue (Faroe 25%) and Boomerang (Faroe 25%) are recent exploration successes
PL107C North Flank prospect (NF2)
Faroe 7.5% , Statoil operator (20%)
Material 3-way down faulted structural trap, with crest of structure in PL107
Expect to drill in Q3 2016
6Excellent prospect benefiting from low rig rate and potential to tie into Njord Future Project
Njord North Flank prospect

Production and Development assetsBuilding production base and growing reserves
Diversified production base (50:50 Norway/UK and 50:50 oil/gas) with infill and near-field upside potential to boost production
Lowered opex and long life assets 2P Reserves almost doubled since last year from 30.6 to 57.4mmboe
Strong balanced production, well performing assets, low opex per boe
Brage(Faroe: 14.26%)
Oil field in Norwegian North Sea – Wintershall-operated Two successful infill wells in 2015 – new programme being planned
Butch(Faroe: 15%)
Development project in Norwegian North Sea – Centrica-operated FEED project ongoing - FDP submission planned for end of 2016
Njord/Hyme/ Snilehorn(Faroe: 7.5%)
Oil and gas field in the Norwegian Sea – Statoil-operated Production to be suspended in May - Njord Future project underway
Pil(Faroe: 25%)
Oil and gas field in the Norwegian Sea – VNG-operated Feasibility confirmed for both subsea satellite and stand alone solutions
Ringhorne East(Faroe: 7.8%)
Oilfield in Norwegian North Sea - Exxon-operated Low operating cost, stable production
Blane(Faroe: 30.5%)
Oilfield in Central Graben UK - Repsol-operated Low operating cost, stable production
Schooner & Ketch(Faroe: 60%)
Gas fields in the UK Southern Gas Basin – Faroe-operated Stable gas production – gas sold into the UK market
2P Reserves (1 Jan-16)
Total: 57.4 mmboe
Njord/Hyme/Snilehorn (N)
Schooner/Ketch (UK)
Brage (N)Butch (N)Ringhorne East (N)
Pil (N)
Blane (UK)Others
7
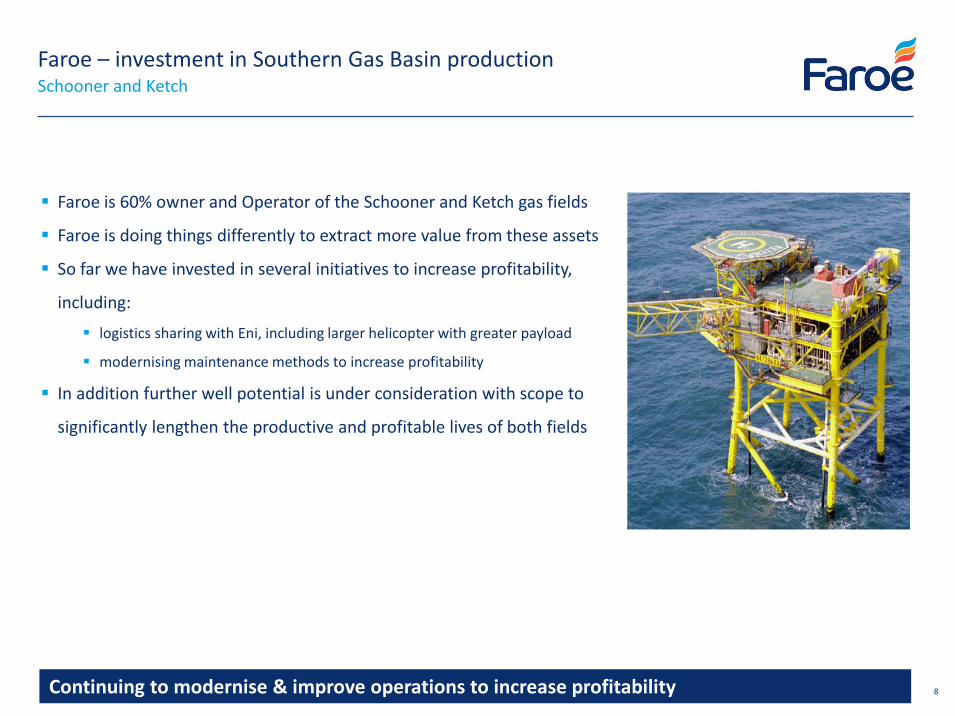
Faroe – investment in Southern Gas Basin productionSchooner and Ketch
8
Faroe is 60% owner and Operator of the Schooner and Ketch gas fields
Faroe is doing things differently to extract more value from these assets
So far we have invested in several initiatives to increase profitability,
including:
logistics sharing with Eni, including larger helicopter with greater payload
modernising maintenance methods to increase profitability
In addition further well potential is under consideration with scope to
significantly lengthen the productive and profitable lives of both fields
Continuing to modernise & improve operations to increase profitability

Butch (Norway) – development plannedExcellent value creation opportunity
Butch oil field (Faroe 15%), operated by Centrica
Southern North Sea, 66m water depth
Close to infrastructure - Ula and Gyda
Excellent quality reservoir, light oil
Development project – planning work ongoing
Project passed concept selection in H2 2015
Selected concept:
Subsea tie-back to Ula via Oselvar
Two production wells and one water injection well
Expected on stream in 2019 - plateau production of approx. 35,000 boepd gross
Front End Engineering and Design project on track
Subsea and drilling costs major part of capex – to benefit from reduced market rates
FDP submission currently planned for end 2016
9Exciting material sub-sea oil field development will benefit from significantly lower capex

Greater Njord Area (Norway)Strategic position
Prolific area with yet to be produced reserves in region of 300mmboe
Njord, Hyme and Snilehorn
Njord & Hyme producing in excess of forecast – declining due to drill stop
Facility needs lifetime extension - tow-to-shore in summer 2016
Njord Future project – FDP early 2017
Njord, Hyme and Snilehorn 2P Reserves in excess of 200 mmboe (gross)*
Pil, Bue and Boomerang – 2014 and 2015 discoveries
Pil gross columns ca 135m oil & 91m gas - flowed at stable rate 6,710 bopd of 37 degree API oil, 56/64” choke
Bue and Boomerang added further volumes
Pil project feasibility confirmed for subsea tie-back and leased FPSO stand alone solutions – project now maturing towards concept selection
Potential for significant further resource additions through exploration
Significant infrastructure in the area
Draugen and Njord – large field developments
Åsgard transportation – gas trunk line to European gas market
Draugen – Shell operated Njord – Statoil operated
10Significant value creation opportunity with material reserves – benefits from reduced costs
* CPR Jan 2016 (Senergy)

Field WI OperatorFaroe Observations
Bue and Boomerang(Norway)
25% VNG 2014 and 2015 discoveries Being matured to concept selection in
combination with Pil
SE Tor(Norway)
85% Faroe 1972 discovery Salt induced structure – large in place
volumes in Tor and Ekofisk formation Both production tested at >4000 bpd
Fogelberg(Norway)
15% Centrica 2010 discovery Proximity to infrastructure Awaiting export capacity
Lowlander / PerthDolphin
(UK)
>50% Faroe / Parkmead 2011 / 2013 acquisitions Technical definition maturing Commercial framework for joint
development being agreed
Rodriguez / Solberg (Norway)
20% Wintershall 2013 / 2014 discoveries Lower Cretaceous Lange Channel system extends across several
licences
Maximise project values through low-cost pre-development activities
2C Resources (1 Jan-16)
Total: 98.3 mmboe
Lowlander/Perth/Dolphin (UK)
Bue and Boomerang (N)
Fogelberg (N)
Rodriguez/Solberg (N)
SE Tor (N)
Others
Contingent ResourcesConverting 2C Contingent Resources to 2P Reserves
11

No. of shares in issue: 269,033,765
Market cap at 24.3.2016: £176.4m
Net cash: £68.5m
Enterprise value: £107.9m
EV/2P: $2.7/boe
EV/(2P+2C): $1.0/boe
EV/boepd: $19.2
12
Shareholder information & key metrics
17.9%
11.0%
10.0%
8.7%3.8%3.6%
3.5%3.4%
3.2%
34.9%
Shareholder analysis | 18 March 2016
Dana Petroleum BlackRock
Fidelity International Aviva Investors
Schroder Investment Management Invesco Perpetual
AXA Framlington Investment Managers Scottish and Southern Energy
NFU Mutual Other
High quality shareholder list, attractive metrics

2015 Final ResultsFinancial highlights and outlook
2015 Results Revenue (excluding hedging) £113.0m (2014: £128.8m) EBITDAX (incl. £9.3m realised hedging gains) £60.4m (2014: £59.1m) Realised boe price of $47 boe including realised hedging gains (2014: $71) £45.1m pre-tax impairments of D&P assets and £83.5m exploration write off Loss after tax £52.9m (2014: £55.0m) Material cost reductions achieved – across drilling, operations and G&A (net G&A charge in Income Statement 44% lower than in 2015 at £3.7m
Production 2015 economic production¹ approximately 10,530 boepd 2016 production expected to be 7-9,000 boepd (approx. 55% liquids and 45% gas)
Liquidity Cash and net cash at 31 Dec-15 of £91.5m and £68.5m respectively (31 Dec 14: £92.6m cash and net cash £69.6) $225m Reserve Based Lending facility (RBL) – approx. £23.0m drawn at 31 Dec-15 Exploration Financing Facility (EFF) of approx. £116m (NOK 1.5bn) 2015 hedging: predominantly puts at $90/bbl for 268kbbls of oil; and 52.6m therms (approx. 835 kboe) 50p/therm puts. Limited oil swaps at $67/bbl
Capex 2015 pre-tax exploration and appraisal programme of approx. £62m (£14.8m post-tax) 2016 pre-tax expected exploration and appraisal programme of approx. £50m (£12m post-tax) 2016 expected development and production capex approx. £20m (2015: £17m)
Tax efficiency Carried forward UK tax losses of £55.6m (31 Dec 15) – boosting cashflow from production Norway: utilisation of 78% exploration tax rebate; EFF funds 75% of net exploration expenditure
Hedging Hedging in place to underpin budget – 80% of 2016 gas production (post tax) at between 45-50p/therm Hedge instruments will continue to be taken out on an opportunistic basis
13Strong balance sheet, low gearing, good hedging, production cash flow
¹ Economic production in 2015 includes production from the recently acquired interest in Blane field (12.5%) from 1 January 2015 (the effective date). Accounting production excludes production between the effective date and date of completion on 5 November 2015. Accounting production in 2015 was 10,252 boepd (2014: 6,579 boepd)

Summary and outlookFinancially robust and operationally strong
Solid and proven business model delivering sustainable value growth, through drill-bit and transactions
Exploration-led strategy continues - underpinned by production and Norwegian tax rebate
Balanced and diversified portfolio - world-class technical team
Financially robust and operationally strong at low commodity prices
Robust balance sheet, prudent financial management; lowering costs further
Production generated cash flow – even at low commodity prices
Forward programme is material yet relatively low cost and benefits from Norwegian State refund
Continuing high potential E&A programme in Norway on track, fully funded: Brasse and Njord North Flank prospects
Relatively modest capex in 2016 – est. £32m post tax:
Progressing Butch and Pil towards development decisions
Progressing Njord Future Project
Planned growth
Strong balance sheet ensures we are positioned to pursue multiple routes to create value
Actively pursuing growth in 2P and value near term through acquisition/consolidation potential opportunities
Strength at low commodity prices, high upside, funded 2016 programme & growth opportunities 14

Differentiators
Excellent asset monetisation track record
Production field operator
Financial strength and prudenceExcellent exploration track record -
multi-well programmeExperienced management
& clear strategy
Strong Norway position
15

Graham StewartChief Executive Officer
• Instrumental in founding Faroe Petroleum in 1998
• Over 25 years’ experience in oil and gas technical and commercial affairs
• Previously finance director and commercial director at Dana Petroleum 1997 to 2002
• Experience with Schlumberger, DNV Technica, Petroleum Science & Technology Institute
• Offshore Engineering degree (Heriot-Watt University) and MBA (University of Edinburgh )
Helge Hammer Chief Operating Officer
• Joined Faroe Petroleum in 2006
• Over 25 years’ technical & business experience, incl. Shell (Norway, Oman, Australia and Holland)
• Managing Director of wholly owned Norwegian subsidiary, Faroe Petroleum Norge AS
• Previously Asset Manager and Deputy Managing Director at Paladin Resources
• Economics degree (Institut Françaisdu Pétrole, Paris)
• Petroleum Engineering degree (NTH University of Trondheim)
Jonathan Cooper Chief Financial Officer
• Joined Faroe Petroleum as Chief Financial Officer in July 2013
• Former Finance Director of Gulf Keystone Petroleum and Sterling Energy and CFO of Lamprell plc
• Former Director of the Oil and Gas Corporate Finance Team of Dresdner Kleinwort Wasserstein
• Broad range of experience from mergers and acquisitions, public offerings and financing
• Chartered accountant by training having qualified with KPMG
• PhD Mechanical Engineering (University of Leeds)
Executive team
16

These materials do not constitute or form any part of any offer or invitation to sell or issue or purchase or subscribe for any shares in Faroe Petroleum plc (the “Company”) nor shall they or any part of them, or the fact of their distribution, form the basis of, or be relied on in connection with, any contract with the Company relating to any securities. Any decision regarding any proposed acquisition of shares in the Company must be made solely on the basis of public information on the Company. These materials arenot intended to be distributed or passed on, directly or indirectly, to any other persons. They are available to you solely for your information and may not be reproduced, forwarded to any other person or published, in whole or in part, for any other purpose. No reliance may be placed for any purpose whatsoever on the information contained in these materials or on their completeness. Any reliance thereon could potentially expose you to a significant risk of losing all of the property invested by you or the incurring by you of additional liability. No representation or warranty, express or implied, is given by the Company, its directors or employees, or their professional advisers as to the accuracy, fairness, sufficiency or completeness of the information, opinions or beliefs contained in these materials. Save in the case of fraud, no liability is accepted for any loss, cost or damage suffered or incurred as a result of the reliance on such information, opinions or beliefs. Certain statements and graphs throughout these materials are “forward-looking statements” and represent the Company’s expectations or beliefs concerning, among other things, future operating results and various components thereof, including financial condition, results of operations, plans, objectives and estimates (including resource estimates), the Company’s anticipated future cash-flow and expenditure and the Company’s future economic performance. These statements, which may contain the words “anticipate”, “believe”, “intend”, “estimate”, “expect” and words of similar meaning, reflect the directors’ beliefs and expectations and involve a number of risks and uncertainties as they relate to events and depend on circumstances that will occur in the future. Forward-looking statements speak only as at the date of these materials and no representation is made that any of these statements or forecasts will come to pass or that any forecast results will be achieved. The Company expressly disclaims any obligation toupdate or revise any forward-looking statements in these materials, whether as a result of new information or future events. If you are considering buying shares in the Company, you should consult a person authorised by the Financial Conduct Authority who specialises in advising on securities of companies such as Faroe Petroleum plc.
Disclaimer
17

Appendices
18

Faroe has developed a geographically focussed exploration-led and production-backed strategy which is delivering exceptional results
Outstanding, diversified full-cycle portfolio of assets High quality large exploration acreage position in Norway Ongoing fully-funded, multi-well, sustainable drilling programme Several significant discoveries maturing towards development Material, well balanced and tax efficient production – generating cash Strategically well positioned
Balance sheet strength Robust balance sheet, with strong cash position, low gearing and
significant debt facility Benefiting significantly from 78% tax refund incentive for Norwegian
exploration
Faroe’s world class sub-surface competence is at the heart of our success
Faroe is robust and well positioned for growth in a low oil price environment
Faroe is well capitalised and on track to become a leading independent E&P player in the North Sea
Faroe overviewIntroduction
19

Maintain significant portfolio of Prospective Resources Participate in Licence Rounds – excellent track record of
awards Proactive approach to farm-ins/farm-outs
Grow 2C Contingent Resources High-graded, high-quality programme of E&A wells Optimum working interests and better than 1 in 3 success rate
Grow 2P Reserves Progress discoveries to FDP sanction Participate prudently in robust development projects Swap 2C contingent for 2P reserves where appropriate
Grow Profitable Production Exploit market opportunities through acquisitions & swaps Invest in our producing fields where appropriate
Prudent financial management Ensure balance sheet strength at all times
Faroe successfully executing its strategy – balance sheet discipline ensures a strong growth platform
Building core value and scale
Faroe’s growth modelBuilding core value and scale
20

Group Income Statement
2015 2014
£000 £000
Revenue 112,980 128,761
Cost of sales (99,838) (102,815)
Asset Impairment (45,108) (38,468)
Gross loss (39,166) (12,522)
Other income 13,867 5,044
Net gain on disposal of property, plant and equipment - 783
Exploration and evaluation expenses (89,537) (139,374)
Administrative expenses (3,718) (6,570)
Operating loss (111,354) (152,639)
Finance revenue 909 650
Finance costs (11,855) (13,807)
Loss on ordinary activities before tax (122,300) (165,796)
Tax credit 69,382 110,815
Loss for the year (52,918) (54,981)
21
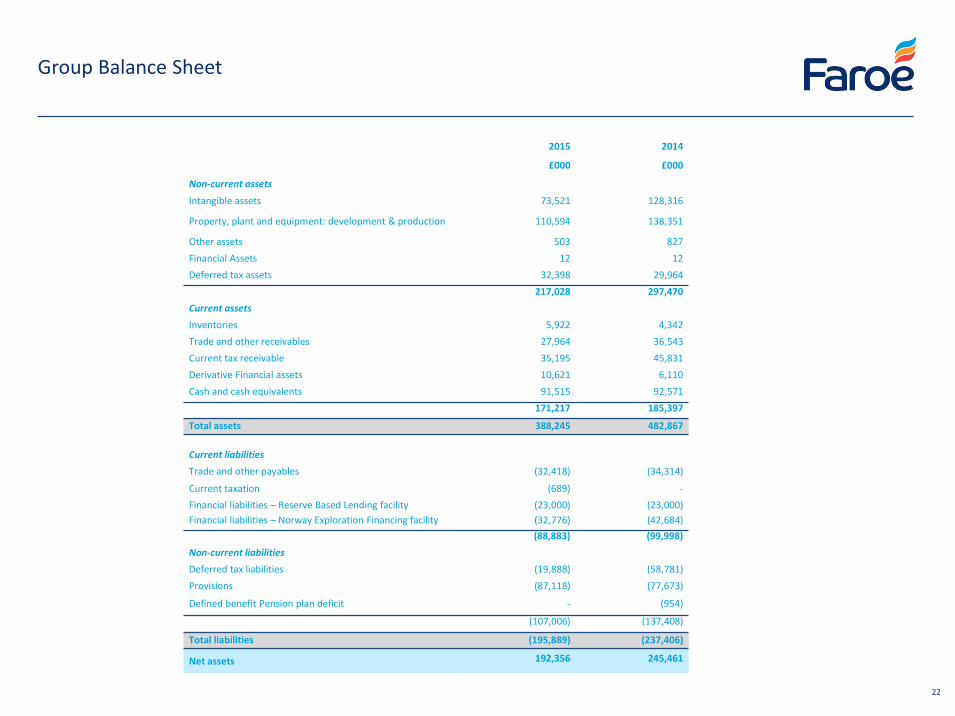
Group Balance Sheet
2015 2014
£000 £000
Non-current assets
Intangible assets 73,521 128,316
Property, plant and equipment: development & production 110,594 138,351
Other assets 503 827Financial Assets 12 12Deferred tax assets 32,398 29,964
217,028 297,470Current assetsInventories 5,922 4,342Trade and other receivables 27,964 36,543Current tax receivable 35,195 45,831Derivative Financial assets 10,621 6,110Cash and cash equivalents 91,515 92,571
171,217 185,397
Total assets 388,245 482,867
Current liabilitiesTrade and other payables (32,418) (34,314)
Current taxation (689) -Financial liabilities – Reserve Based Lending facility (23,000) (23,000)Financial liabilities – Norway Exploration Financing facility (32,776) (42,684)
(88,883) (99,998)Non-current liabilitiesDeferred tax liabilities (19,888) (58,781)Provisions (87,118) (77,673)
Defined benefit Pension plan deficit - (954)
(107,006) (137,408)
Total liabilities (195,889) (237,406)
Net assets 192,356 245,461
22

Group Cash Flow Statement
23
Condensed Group Cash Flow Statement 2015 2014
for the year ended 31 December 2015 £’000 £’000
Loss before tax (122,300) (165,796)Depreciation, depletion and amortisation 38,447 33,108Exploration asset write off 83,569 131,735Unrealised hedging gains (4,580) (4,583)Gain on disposal of asset - (783)Asset impairment 45,108 38,468Fair Value of share based payments 1,916 2,429Movement in trade and other receivables 2,768 19,387Movement in inventories (1,580) 548Movement in trade and other payables (1,896) (18,674)Currency translation adjustments 1,587 4,292Expense recognised in respect of equity settled share based transaction (12) (65)Investment revenue (909) (650)Interest and financing fees paid 10,268 9,515Tax rebate 40,284 22,473
Net cash generated in operating activities 92,615 71,404
Net cash used in investing activities (82,376) (129,669)
Financing activities
Proceeds from issue of equity instruments 138 65,004
Issues costs - (3,502)Net (repayments) / proceeds from borrowings (9,908) 44,691Interest and financing fees paid (5,322) (4,663)
Net cash (used) / provided from financing activities (15,092) 101,530
Net (decrease) / increase in cash and cash equivalents (4,853) 43,265
Cash and cash equivalents at the beginning of year 92,571 40,591Effect of foreign exchange rate changes 3,797 8,715
Cash and cash equivalents at end of the year 91,515 92,571


