1 | Page 2015 Profile of Ho me Buying Activity of International Clients For the Twelve Month Period Ending March 2015 NATIONAL ASSOCIATION OF REAL National Association of REALTORS® Research Division June 2015
Transcript
8/21/2019 2015 Profile of International Home Buying Activity
Lawrence Yun, Senior Vice President & Chief Economist
Jed Smith, Managing Director, Quantitative ResearchGay Cororaton, Research Economist
June 2015
1 The sample of 200,000 potential respondents was random but also included approximately
5,000 REALTORS® who responded to the 2013 and 2014 surveys and provided email addresses.2 The actual number of respondents to each question varied due to non-response or because of
inapplicability of some questions relative to the respondent.
EXECUTIVE SUMMARY AND OVERVIEW ......................................................................................................... 4
I. INTERNATIONAL SALES, 12 MONTHS ENDED MARCH 2015 ................................................................... 5
II. INTERNATIONAL BUYERS: ORIGINS AND PREFERENCES ....................................................................... 10
Countries of Origin ................................................................................................................................ 10
State Preferences of International Buyers............................................................................................ 12
Prices and Financing ............................................................................................................................. 16
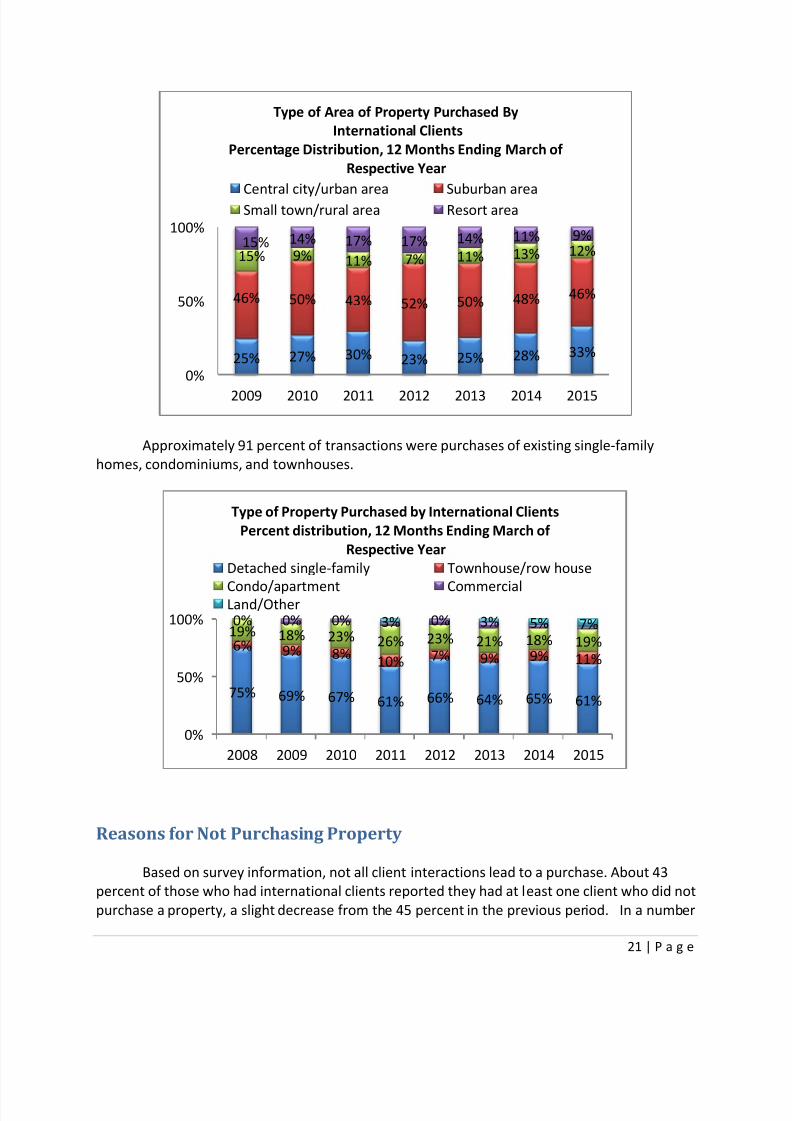
Intended Use and Type of Property ...................................................................................................... 20
Reasons for Not Purchasing Property ................................................................................................... 21
III. PROFILE OF TOP 5 BUYERS .................................................................................................................... 23
China ..................................................................................................................................................... 23
India ...................................................................................................................................................... 30
United Kingdom .................................................................................................................................... 37
IV. REALTOR® EXPERIENCE IN SERVING INTERNATIONAL CLIENTS............................................................ 41
V. CONCLUSIONS ....................................................................................................................................... 46
APPENDIX 1. Methodology for Estimation of International Sales ................................................................ 48
APPENDIX 2. Some Comments from the Respondents................................................................................. 49
APPENDIX 3. International Clients Searching for Properties on Realtor.com .............................................. 50
APPENDIX 4. About NAR’s Commercial & Global Services Group ................................................................ 66
8/21/2019 2015 Profile of International Home Buying Activity
This report is based on a survey of REALTORS® about Existing Home Sales to resident
and non-resident foreigners over the time period April 2014 through March 2015.
Approximately 209,000 houses are estimated to have been sold to foreign buyers over thetime period, approximately 4 percent of total Existing Home Sales.
The total foreign sales dollar volume is estimated at $104 billion, approximately 8 percent of
total Existing Home Sales dollar volume.
Foreign clients are an upscale group of buyers, paying on average nearly $500,000 for a
house, compared to the overall U.S. average house price of about $256,000.
Sales to foreigners are split between resident and non-resident purchasers. Resident
foreigners may be in the U.S. for business, educational, or other purposes. Non-resident
foreigners are typically looking for a vacation or investment property.
Unit sales of homes to foreigners declined by 10 percent in the 2014/15 timeframe, possibly
due to the strengthening of the U.S. dollar in relation to foreign currencies and weakeningforeign economics.
Measured in numbers of houses purchased, Asiana/Oceana accounted for 35 percent of
international purchases, followed by Latin America (including Mexico) at 23 percent and
Europe at 20 percent. Canada accounted for 14 percent. The Middle East and Africa each
accounted for less than 5 percent.
Five countries accounted for 51 percent of purchases by foreigners: Canada, China, Mexico,
India, and the United Kingdom.
Although foreigners purchased property nationwide, four states accounted for 50 percent
of international sales: Florida, California, Texas, and Arizona.
The bulk of purchases by international clients were all-cash, accounting for approximately55 percent of reported foreign transactions. Mortgage financing tends to be a major
problem for non-resident international clients due to financial profiles that are different in
some cases from those normally received by the financial institution from domestic
residents.
The percentage of REALTOR® respondents who reported working with international clients
in the 12 months ending March 2015 increased by 7 percent over the previous year.
Previous client contacts and referrals were the most important source of leads for
REALTORS®, mentioned by 56 percent of REALTORS®. An additional 20 percent mentioned
website/online listings.
8/21/2019 2015 Profile of International Home Buying Activity
Spain, Netherlands, and Norway. North America has 44,922 UHNWI, with approximately 90
percent coming from the United States. Asia has 42,272, mostly coming from Japan, China,
Hong Kong, Singapore, Malaysia, Indonesia, and South Korea.
Knight Frank provides perspective on some of the underlying interest in U.S. real estate.
According to the Knight Frank Survey, about 32 percent of the assets of an Ultra High NetWorth Individual (UHNWI) is invested in a property. Residential property was the preferred
type, according to 81 percent of wealth advisor respondents who reported their clients were
interested in this investment. Roughly 27 percent were also likely to send their children
overseas for schooling. However, in the case of China and Russians, close to half are likely to
send their children overseas for secondary education. The U.K., U.S., and Australia attract most
of these overseas students.
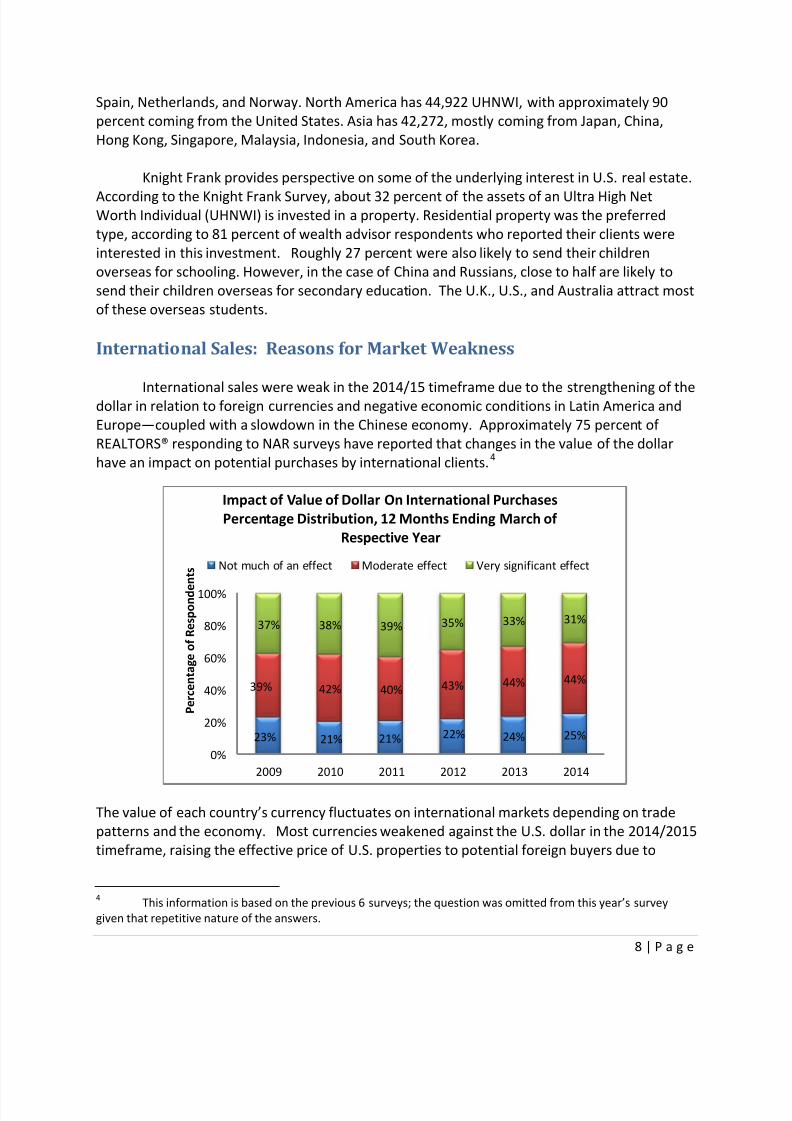
International Sales: Reasons for Market Weakness
International sales were weak in the 2014/15 timeframe due to the strengthening of thedollar in relation to foreign currencies and negative economic conditions in Latin America and
Europe—coupled with a slowdown in the Chinese economy. Approximately 75 percent of
REALTORS® responding to NAR surveys have reported that changes in the value of the dollar
have an impact on potential purchases by international clients.4
The value of each country’s currency fluctuates on international markets depending on trade
patterns and the economy. Most currencies weakened against the U.S. dollar in the 2014/2015
timeframe, raising the effective price of U.S. properties to potential foreign buyers due to
4 This information is based on the previous 6 surveys; the question was omitted from this year’s survey
given that repetitive nature of the answers.
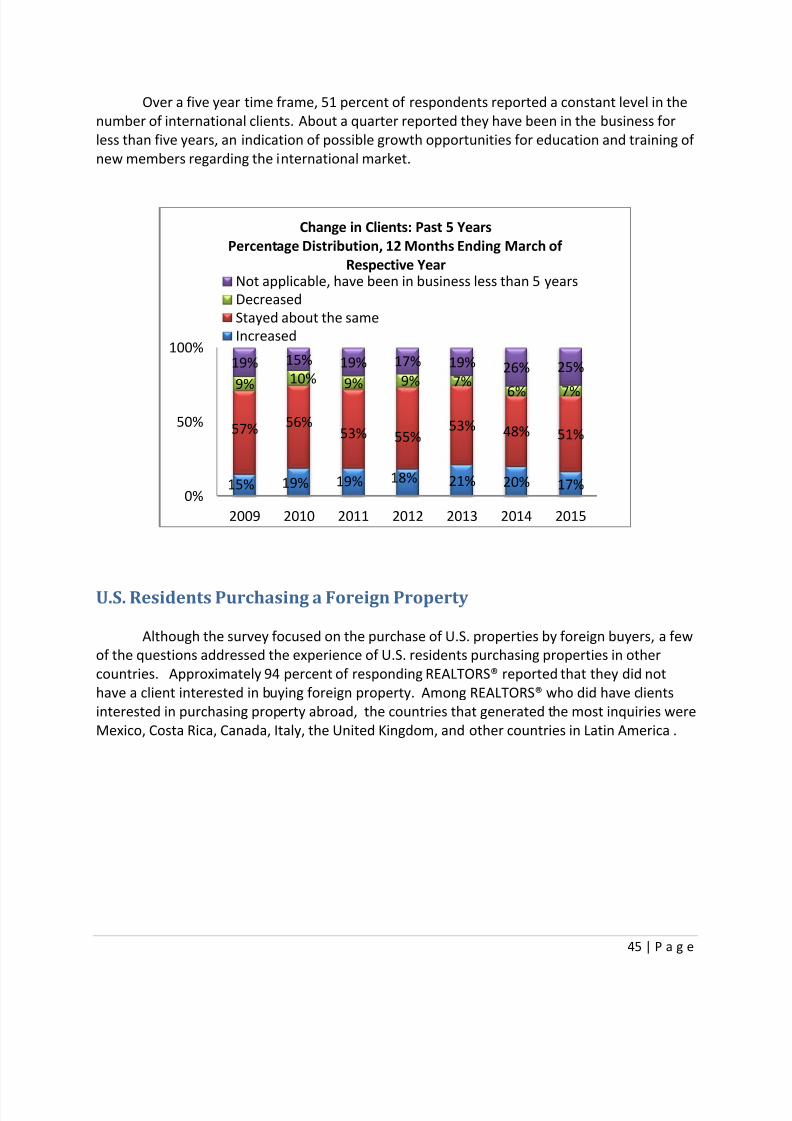
23% 21% 21% 22% 24% 25%
39% 42% 40% 43% 44% 44%
37% 38% 39% 35% 33% 31%
0%
20%
40%
60%
80%
100%
2009 2010 2011 2012 2013 2014
P e r c e n t a g e
o f R e s p o n d e
n t s
Impact of Value of Dollar On International Purchases
Percentage Distribution, 12 Months Ending March of
Respective Year
Not much of an effect Moderate effect Very significant effect
8/21/2019 2015 Profile of International Home Buying Activity
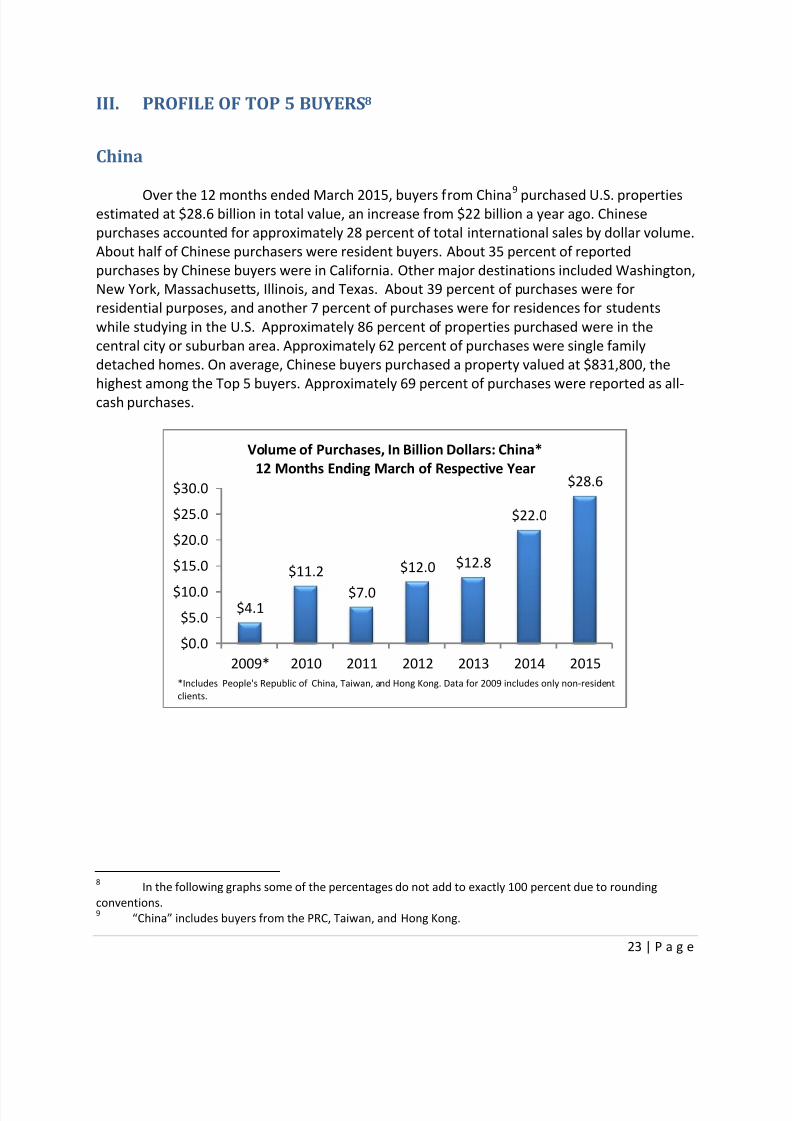
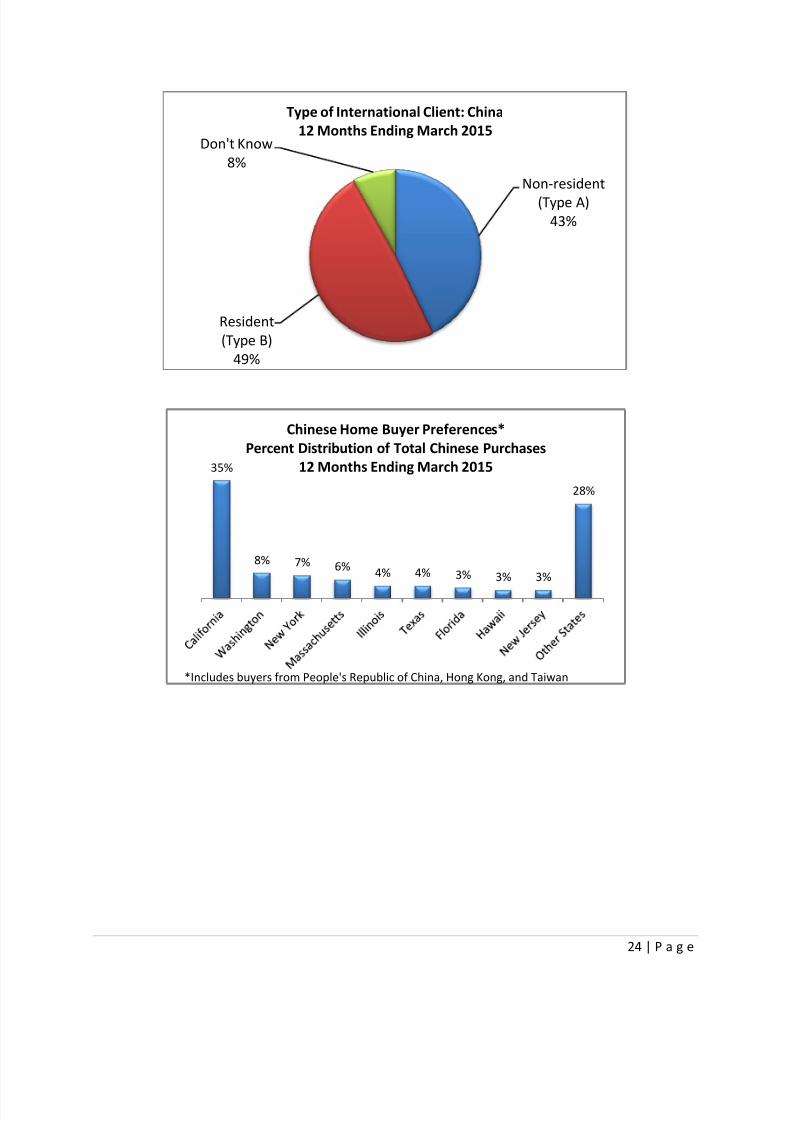
For the first time, international clients from China in the time period 12 months ending
March 2015 exceeded all other buyers in terms of unit purchases and dollar volume, purchasing
$28.6 billion worth of property. Canadian buyers followed at $11.2 billion, Indian buyers at
$7.9 billion, Mexican buyers at $4.9 billion, and buyers from the United Kingdom (U.K.) at $3.8billion. The dollar volume of sales to clients from China, India, and Mexico increased, while the
dollar volume of sales to clients from Canada and the U.K. decreased from the previous period’s
levels.
Countries of Origin
International clients come from across the globe. Measured in terms of numbers of
houses purchased, Asiana/Oceana accounted for 35 percent of international purchases in the
recent study, followed by Latin America (including Mexico) at 23 percent and Europe at 20
percent. Canada accounted for 14 percent. The Middle East and Africa each accounted for less
Proximity to the home country, the presence of relatives, friends and associates, job and
educational opportunities, and climate and location appear to be important considerations toprospective buyers. The next charts show the regions of origin of international clients
purchasing properties in California, Florida, Texas, and Arizona. Europeans and Canadians are
attracted to Florida and Arizona for their warmer climates. California and Texas are favored by
purchasers from Asia/Oceania. Buyers from Latin America, including Mexico, favor states in
close proximity such as Texas and Florida.
Information from realtor.com (Omniture Discover) shows the U.S. cities for which
potential foreign buyers have been most actively searching on-line: New York, Los Angeles,
Miami, Orlando, Las Vegas, Fort Lauderdale, San Diego, San Francisco, Houston, and Naples.
This information is available in greater detail in Appendix 3.
NAR’s yearly Profile of Home Buying Activity of International Clients has collected
information on why foreign buyers are interested in U.S. properties.
Canadians tend to buy in Arizona, Nevada and Florida—apparently seeking winter vacation
opportunities. Cities recently reported by realtor.com include Fort Lauderdale, Orlando, Las
Vegas, Los Angeles, Miami, and Naples.
8/21/2019 2015 Profile of International Home Buying Activity
Chinese buyers are strongly focused on the west coast, which provides geographical
proximity, educational opportunities, and business and trade opportunities, for example,
Los Angeles, San Francisco, Seattle, as well as New York and Houston. Many of the
purchases are for business, educational, and investment purposes, although there is also
interest in vacation homes.
Indians purchase throughout the country, much less concentrated in purchases than othernationalities. Cities mentioned include New York, Los Angeles, San Jose, Dallas, and
Chicago. Given the lack of areas generally mentioned as resort/vacation locales, REALTOR®
comments that many purchases by Indian buyers are business oriented seem to be on
target.
Mexicans are particularly interested in Texas. Cities include San Antonio, Houston, and El
Paso, as well as San Diego and Miami. Investment, proximity, and lifestyle are of interest, as
well as a desire in some cases for vacation homes.
U.K. citizens focus on both vacation and work oriented areas: Los Angeles, New York,
Orlando, Kissimmee, Houston, and San Francisco have featured prominently in recent
searches.
35%
28% 27%
7%
1% 1%
Latin America
(inc. Mexico)
Canada Europe Asia/Oceania Middle East
and Africa
Unknown
Region of Origin of International Clients Purchasing
in Florida
12 Months Ending March 2015
8/21/2019 2015 Profile of International Home Buying Activity
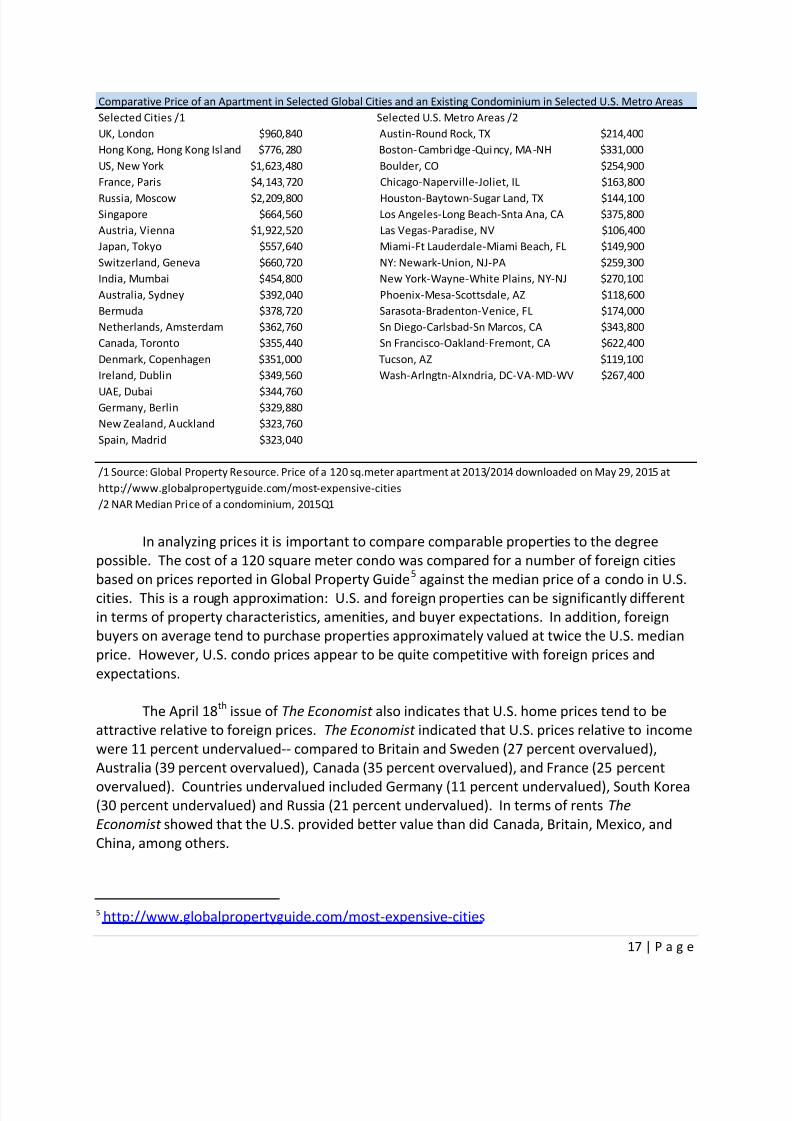
In analyzing prices it is important to compare comparable properties to the degree
possible. The cost of a 120 square meter condo was compared for a number of foreign cities
based on prices reported in Global Property Guide5 against the median price of a condo in U.S.
cities. This is a rough approximation: U.S. and foreign properties can be significantly different
in terms of property characteristics, amenities, and buyer expectations. In addition, foreign
buyers on average tend to purchase properties approximately valued at twice the U.S. median
price. However, U.S. condo prices appear to be quite competitive with foreign prices and
expectations.
The April 18th
issue of The Economist also indicates that U.S. home prices tend to be
attractive relative to foreign prices. The Economist indicated that U.S. prices relative to income
were 11 percent undervalued-- compared to Britain and Sweden (27 percent overvalued),
Australia (39 percent overvalued), Canada (35 percent overvalued), and France (25 percent
overvalued). Countries undervalued included Germany (11 percent undervalued), South Korea(30 percent undervalued) and Russia (21 percent undervalued). In terms of rents The
Economist showed that the U.S. provided better value than did Canada, Britain, Mexico, and
Although a typical foreign buyer probably will not face “sticker shock” when considering
a U.S. purchase, there are aspects of a U.S. house purchase which may be unfamiliar to
foreigners. U.S. property taxes, condo fees, real estate laws and regulations, and ways of doing
business may be substantially different from those with which the potential foreign purchaser is
familiar. Just as U.S. citizens find foreign real estate practices and experiences very different
form their home country, the same is true for foreigners. REALTORS® can provide added valueby educating the foreign buyer in terms of differences between U.S. and foreign real estate
practices and expectations.
The average price of a property purchased by international clients in the 12-month
period ending March 2015 was $499,600, higher than the average price of all existing homes
purchased in the U.S. over the same period of $255,600. On the average, non-resident
international clients paid $548,100 compared to the average purchase price of resident
international clients of $450,700.6
Buyers from China purchased properties that were above the average price. Buyers
from China and India tended to buy in states with relatively high property prices such as
California, Washington, and New York. In contrast, Canadians tended to buy in Florida and
Arizona where properties are not as expensive.
6 NAR focuses on median home prices in reporting the Existing Home Sales market. This approach
integrates market dynamics with the buying power of individuals with median incomes. However, in estimating
the size of the international market, it is necessary to use average price in order to multiply by quantity in reaching
total market size.
$228,400
$396,200 $396,200 $396,200
$255,600
$548,100
$450,700$499,600
$0$100,000
$200,000
$300,000
$400,000
$500,000
$600,000
All Buyers Non-resident Resident International
Comparative Mean Prices :All Buyers vs. International Clients
2014 2015
8/21/2019 2015 Profile of International Home Buying Activity
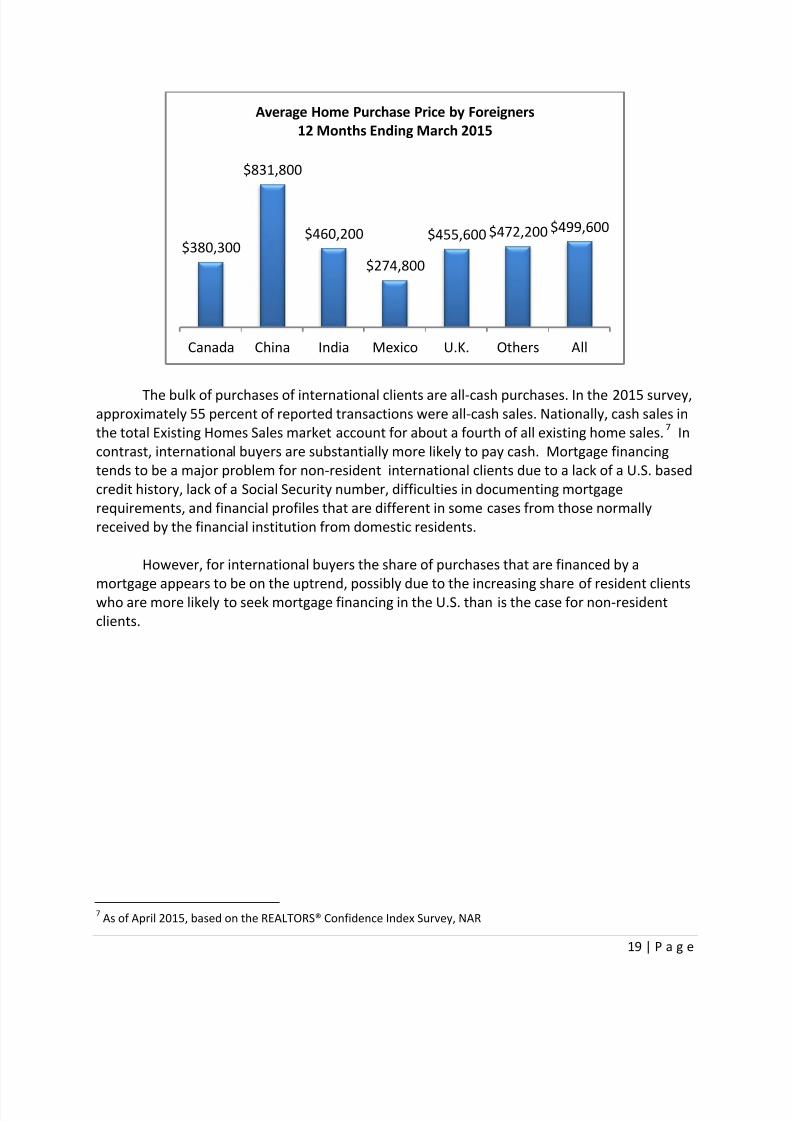
The bulk of purchases of international clients are all-cash purchases. In the 2015 survey,approximately 55 percent of reported transactions were all-cash sales. Nationally, cash sales in
the total Existing Homes Sales market account for about a fourth of all existing home sales.7 In
contrast, international buyers are substantially more likely to pay cash. Mortgage financing
tends to be a major problem for non-resident international clients due to a lack of a U.S. based
credit history, lack of a Social Security number, difficulties in documenting mortgage
requirements, and financial profiles that are different in some cases from those normally
received by the financial institution from domestic residents.
However, for international buyers the share of purchases that are financed by a
mortgage appears to be on the uptrend, possibly due to the increasing share of resident clientswho are more likely to seek mortgage financing in the U.S. than is the case for non-resident
clients.
7 As of April 2015, based on the REALTORS® Confidence Index Survey, NAR
$380,300
$831,800
$460,200
$274,800
$455,600 $472,200 $499,600
Canada China India Mexico U.K. Others All
Average Home Purchase Price by Foreigners
12 Months Ending March 2015
8/21/2019 2015 Profile of International Home Buying Activity
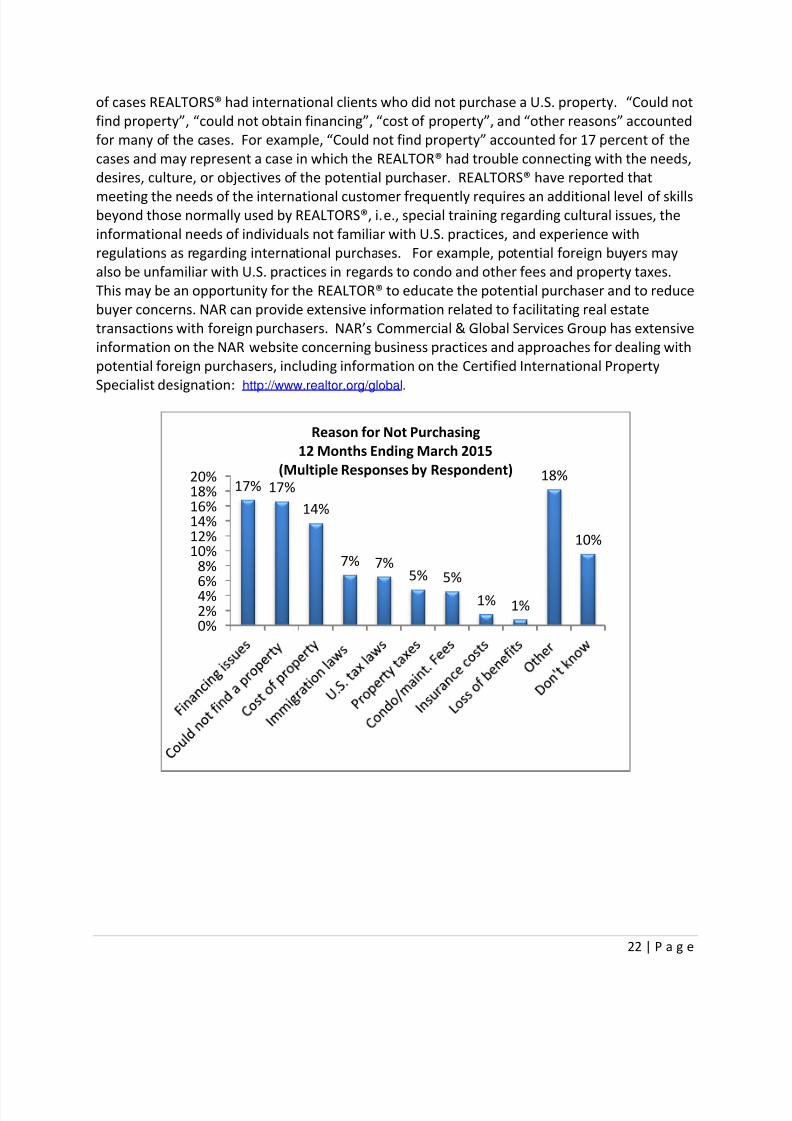
of cases REALTORS® had international clients who did not purchase a U.S. property. “Could not
find property”, “could not obtain financing”, “cost of property”, and “other reasons” accounted
for many of the cases. For example, “Could not find property” accounted for 17 percent of the
cases and may represent a case in which the REALTOR® had trouble connecting with the needs,
desires, culture, or objectives of the potential purchaser. REALTORS® have reported that
meeting the needs of the international customer frequently requires an additional level of skillsbeyond those normally used by REALTORS®, i.e., special training regarding cultural issues, the
informational needs of individuals not familiar with U.S. practices, and experience with
regulations as regarding international purchases. For example, potential foreign buyers may
also be unfamiliar with U.S. practices in regards to condo and other fees and property taxes.
This may be an opportunity for the REALTOR® to educate the potential purchaser and to reduce
buyer concerns. NAR can provide extensive information related to facilitating real estate
transactions with foreign purchasers. NAR’s Commercial & Global Services Group has extensive
information on the NAR website concerning business practices and approaches for dealing with
potential foreign purchasers, including information on the Certified International Property
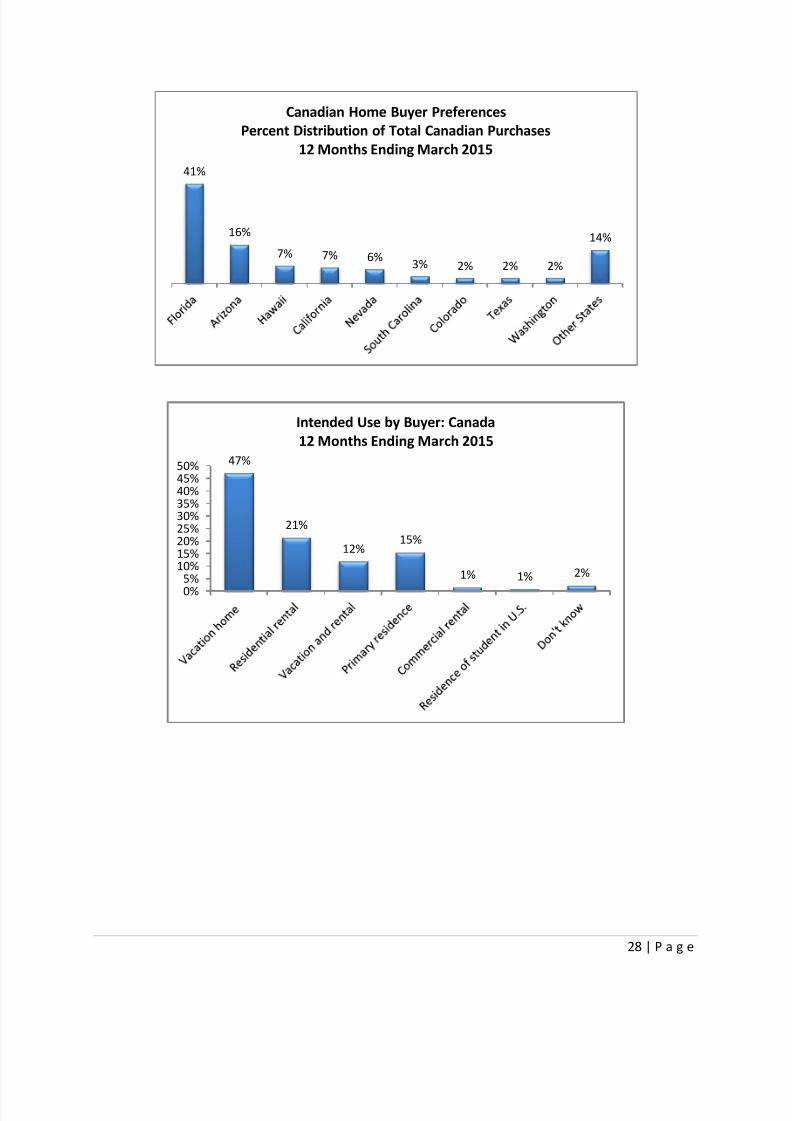
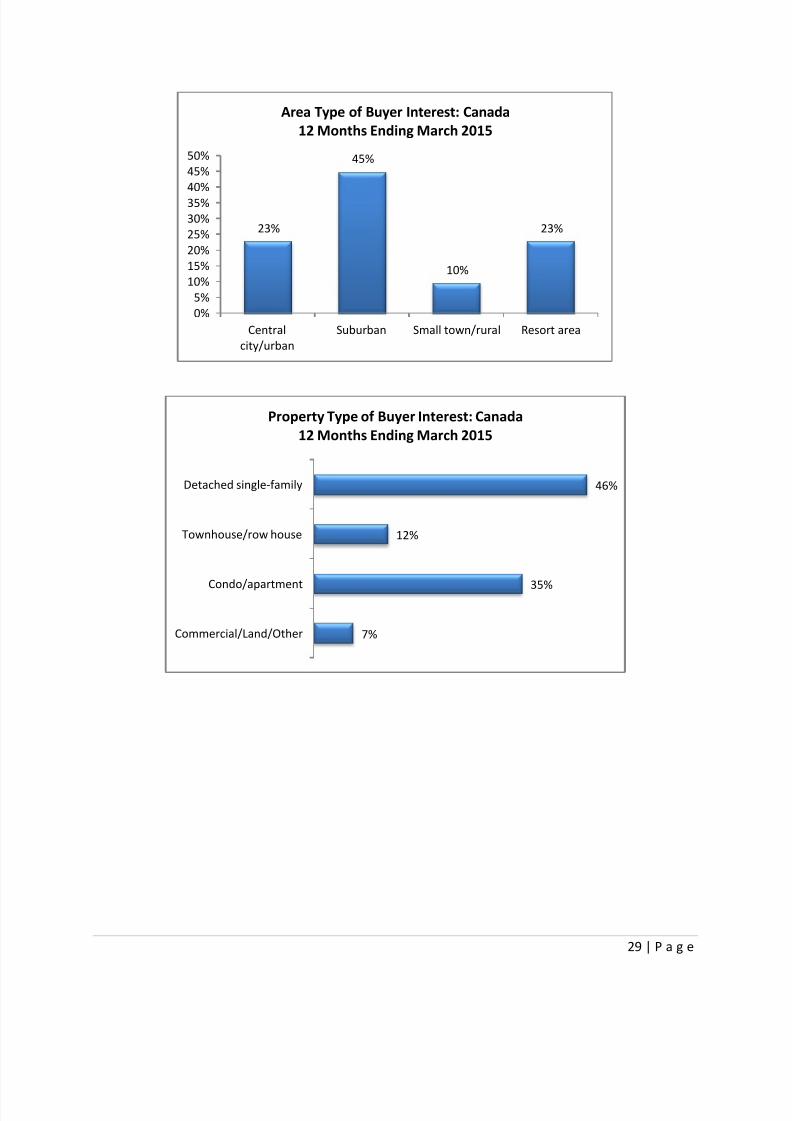
Over the 12 months ended March 2015, Canadians purchased U.S. properties estimated
at $11.2 billion in total value, a decrease from last year’s level of $13.8 billion. Canadian buyers
accounted for approximately 11 percent of total international sales in dollar volume. Close to80 percent were non-resident clients. About 41 percent of purchases were in Florida, and 16
percent were in Arizona, which are preferred destinations for their warm climates. About 47
percent of purchases were for vacation purposes, so Canadians preferred to purchase in
suburban and resort areas. There is almost an even split between single family-detached
homes and condominiums and townhouses combined. On average, Canadian buyers purchased
a property valued at $380,300. About 73 percent of buyers purchased on an all-cash basis.
62%
10%
15%
13%
Detached single-family
Townhouse/row house
Condo/apartment
Commercial/Land/Other
Property Type of Buyer Interest: China
12 Months Ending March 2015
All Cash69%
With mortgage
financing
26%
Other/Don't
Know
5%
Type of Financing: China
12 Months Ending March 2015
8/21/2019 2015 Profile of International Home Buying Activity
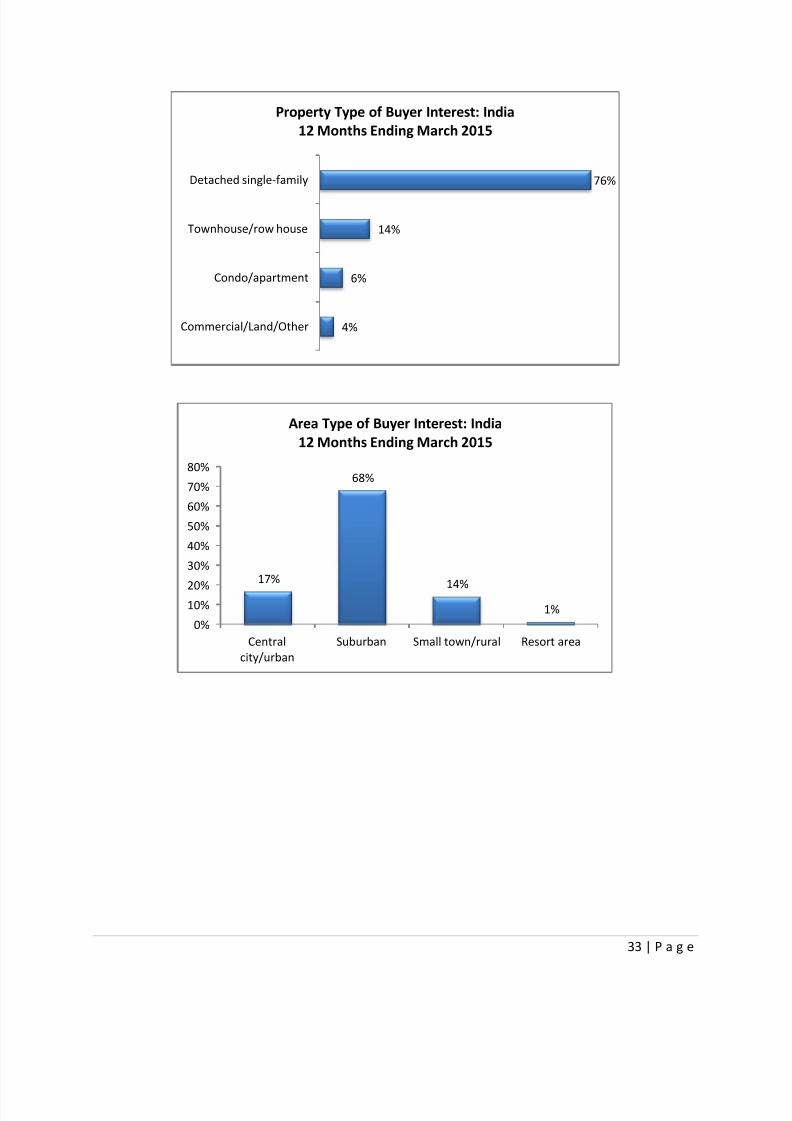
Over the 12 months ended March 2015, buyers from India purchased U.S. properties
estimated at $7.9 billion in total value, an increase from the previous level of $5.8 billion.
Purchases by Indian buyers accounted for approximately 8 percent of total international sales
by dollar volume. Based on data from the survey, Indian purchasers were active throughout the
country. Among the reported destination states for buyers from India, the top states were New
Jersey, Texas, and California. Because most purchasers were resident foreigners, about 79
percent of reported purchases were for primary residence purposes, mostly single familydetached homes located in suburban areas. The average price was $460,200. Because most
buyers are resident clients who are likely to meet the documentation requirements for
obtaining a mortgage, only 16 percent were all-cash sales.
All Cash
73%
With mortgage
financing
23%
Other/Don't
Know
4%
Type of Financing: Canada
12 Months Ending March 2015
8/21/2019 2015 Profile of International Home Buying Activity
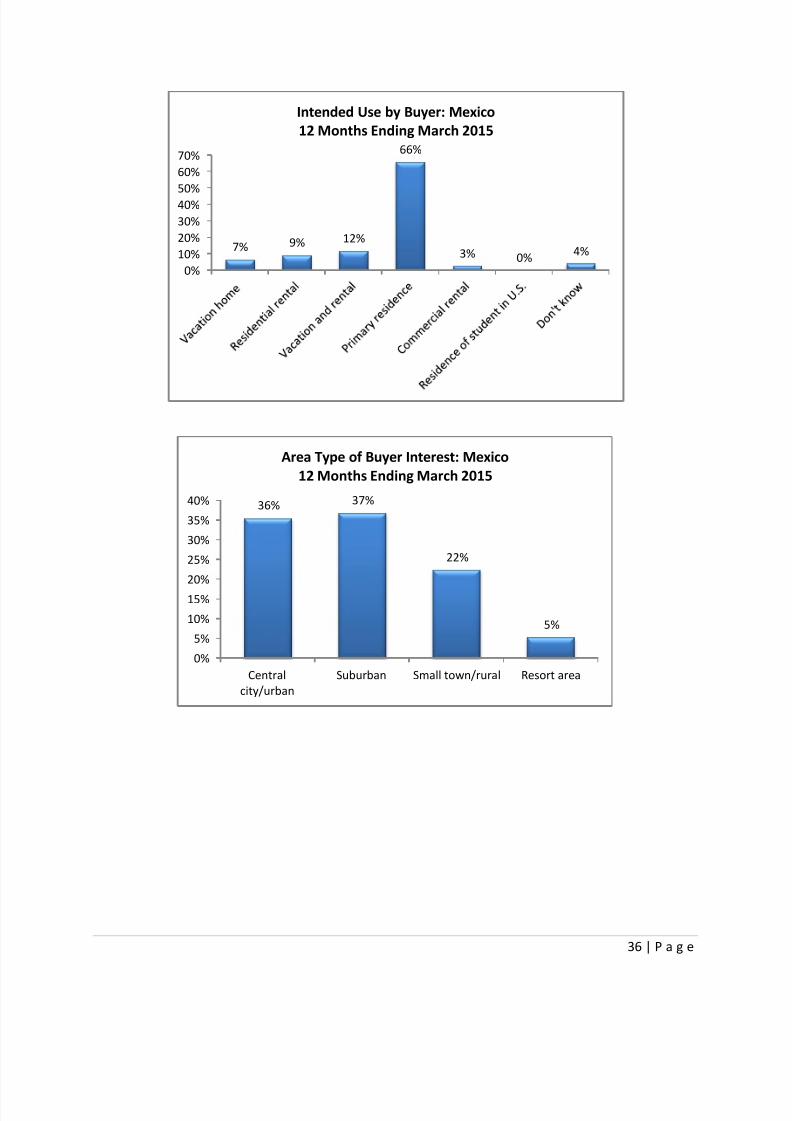
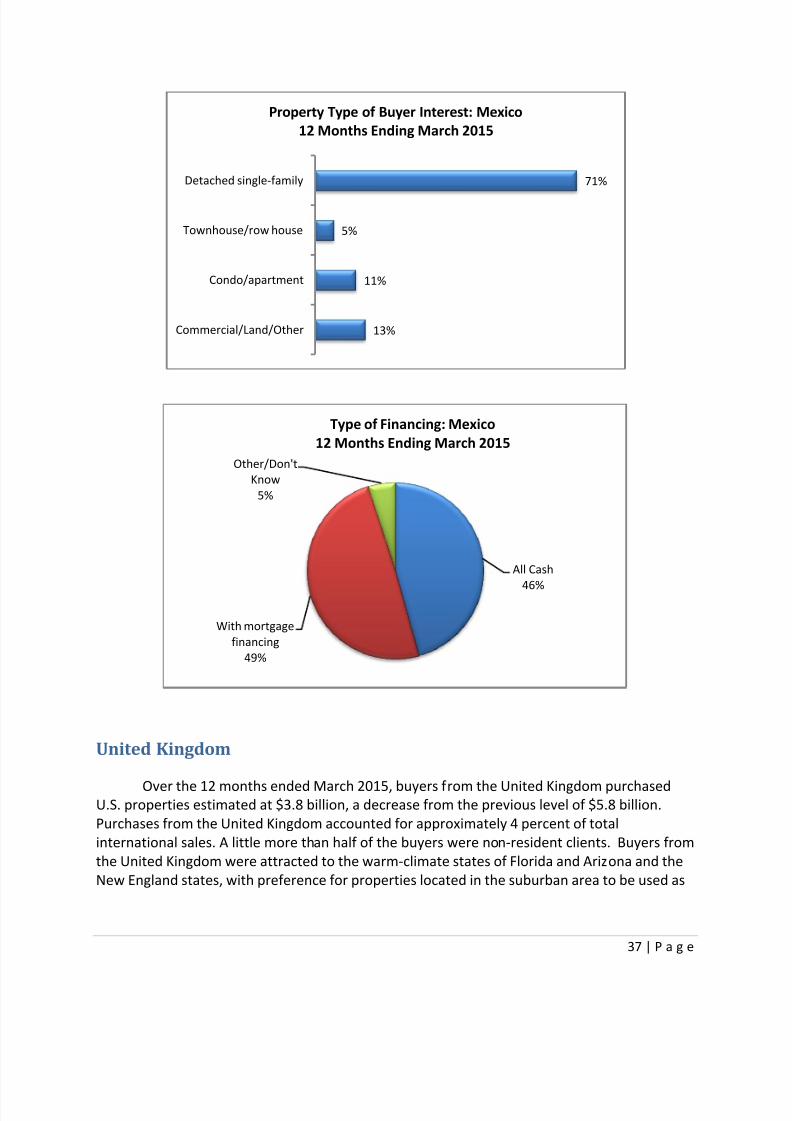
Over the 12 months ended March 2015, buyers from the United Kingdom purchasedU.S. properties estimated at $3.8 billion, a decrease from the previous level of $5.8 billion.
Purchases from the United Kingdom accounted for approximately 4 percent of total
international sales. A little more than half of the buyers were non-resident clients. Buyers from
the United Kingdom were attracted to the warm-climate states of Florida and Arizona and the
New England states, with preference for properties located in the suburban area to be used as
71%
5%
11%
13%
Detached single-family
Townhouse/row house
Condo/apartment
Commercial/Land/Other
Property Type of Buyer Interest: Mexico
12 Months Ending March 2015
All Cash
46%
With mortgage
financing
49%
Other/Don't
Know
5%
Type of Financing: Mexico
12 Months Ending March 2015
8/21/2019 2015 Profile of International Home Buying Activity
sales, the number of sales decreased to 209,000, a 10 percent decrease from the previous
period level of 232,600.
The weakening of many currencies against the dollar and decreases in economic growth
in Latin America and in Europe may have negatively impacted purchases by international
clients. Among those who did purchase a property, the average purchase price rose to$499,600. In comparison, the average purchase price of all buyers of existing homes was
$255,600.
Canada, China, India, Mexico and the United Kingdom remain the major sources of
foreign buyers. For the first time, China is the largest country of origin of international buyers,
both in terms of units of sales and dollar volume of sales. Chinese buyers also purchased more
expensive homes compared to buyers all other buyers.
In terms of location, Florida, California, Arizona, Texas, and New York are the top
preferred locations based on the number of reported purchases. The bulk of international
purchases are predominantly all-cash sales for single-family homes intended to be used for
residential purposes. The buyer’s employment, vacation preferences, family, educational, and
investment objectives affect the choice of location and the type of property desired.
Serving international clients may require specialized knowledge on the part of the
REALTOR®-- relating to immigration, tax, property, financing, and other regulations. Cultural
affinity and knowledge of client preferences may also play an important role in nurturing
relationships with international clients. Personal contacts and referrals are the top sources for
the majority of business opportunities obtained by REALTORS® in serving international clients.
In addition, website/online listings continue to be an increasing source of clients, with the
agent’s own website as a source of online leads.
8/21/2019 2015 Profile of International Home Buying Activity
o Big increase in cash buyers from China in million plus price range - both for personal residence and
investment.
o
Lots of biotech buyers.
o
Canadian business has declined this year.
o
Currently, we do not see many foreign investors/buyers in NE Florida. In Florida, buyers primarily go
to South Florida - SE Coast sees a lot of South and Central Americans, Central and SW Florida see a
lot of Canadians.
o I have agents who refer/work with international clients from Mainly Mexico!
o At the moment 45% of my buyers and sellers are international clients. Predominantly Asian. No one
is from the same country. It's amazing. I am also in an academic environment.
o I am from Brazil and sell to my sphere of influence.
o I'm in Grand Rapids, MI. Growing population of international. In the past, it was strictly from Central
America & Canada but now many are from India, China, Southeast Asia and Europe due to strong
medical facilities presence from research, specialized care, medical college, etc. Also, strong
educational institutions and multiple international companies.
o
Also working with international clients selling property in NC - currently from Netherlands.o
I have customers from Lebanon, Israel, Morocco, France, Argentina, Germany & Russia.
o
I have listings in CA that are being purchased by international clients, China and Middle East. My
clients are locals.
o I see more activity from Chinese.
o In Arizona, we have a number of Canadian citizens that purchase homes in an adult retirement
community for use in the winter months. Their activity is closely tied to the currency exchange
rates.
o Mostly sold small condos in 55+ communities to Canadian clients under 150,000.
o 75% of my business is with Indian, Pakistani and Chinese buyers. Although most of them have their
green cards, they are very difficult buyers to satisfy and take a long time to close.
o
Most of my clients are from the Caribbean or South American Country and are looking for a vacationhome which could turn into a permanent residence at a moment's notice.
o Small town and not very many international clients are around, with the exception of university
faculty nearby.
o All were cash buyers. Taxes, dollar exchange, insurance are huge factors.
o I do not choose to work with international buyers and sellers because they are difficult.
o
International clients have a hard time understanding our laws and our processes.
o
It's not easy for a non-cash foreign investor who wants to purchase an US property. There are hefty
regulations to look up to and obey.
o International clients, paying cash, have had issues moving money from their home country. Longer
process than it once was.
o Many international customers that I have access to are more interested in commercial properties.
There is not sufficient market in the area to meet those needs.
o Most international clients either want rental here or sale abroad of their personal property.
o Most of international clients choose to rent first rather than purchase.
o Most of my business comes from referrals from past clients, repeat clients and Realtors from other
locations.
o It will be great to have more classes about international investment, taxes, laws, options.
o I would like to see a systematic approach based led with sales material, training etc.
o I'd be glad to work with more international buyers, but just haven't had much contact.
8/21/2019 2015 Profile of International Home Buying Activity
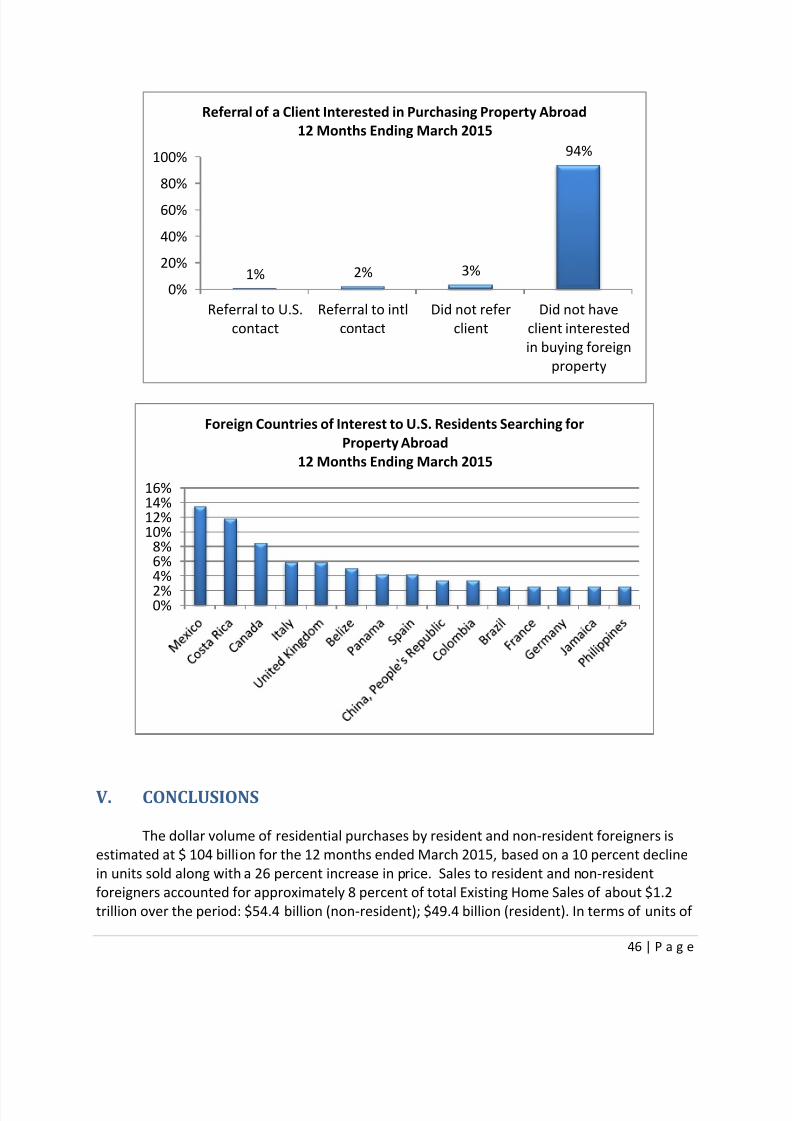
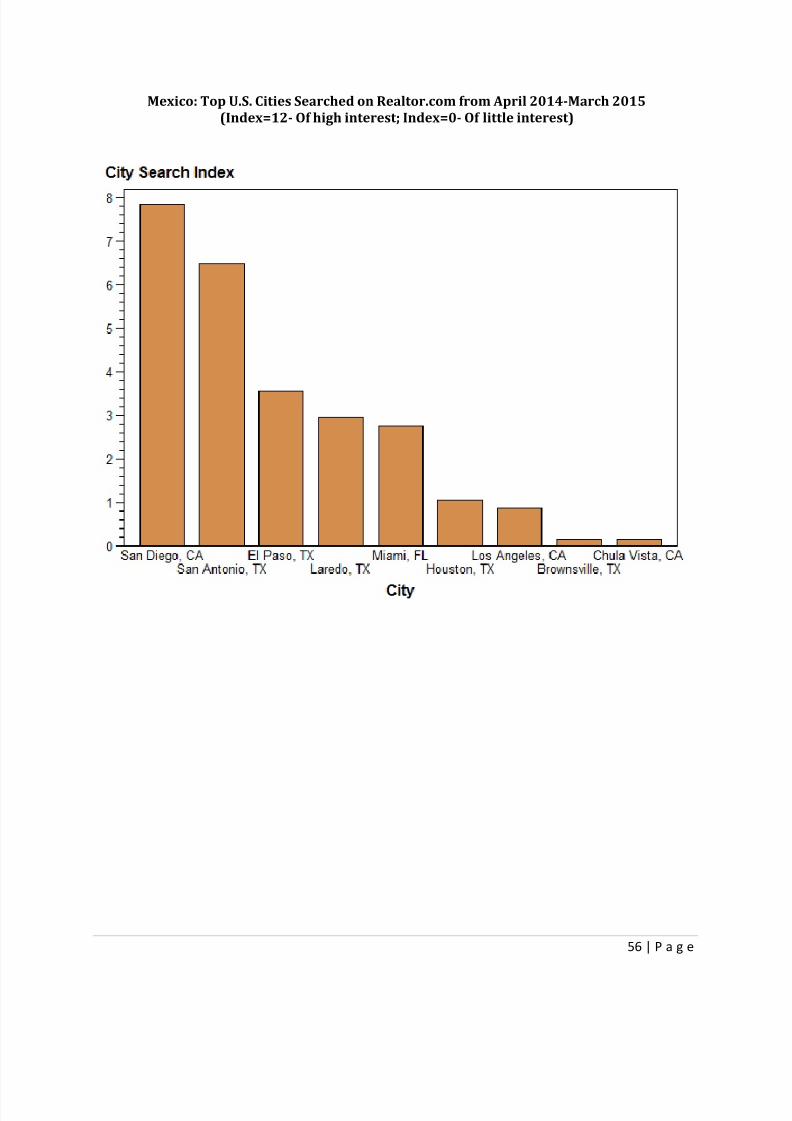
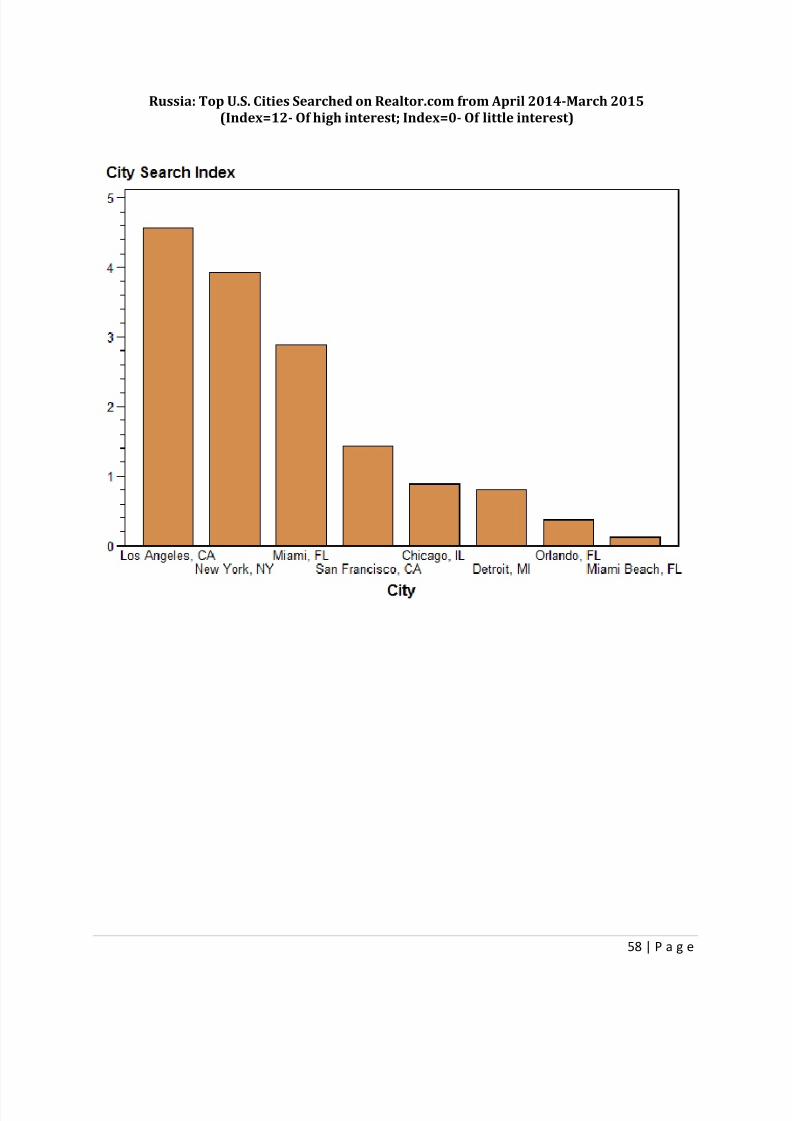
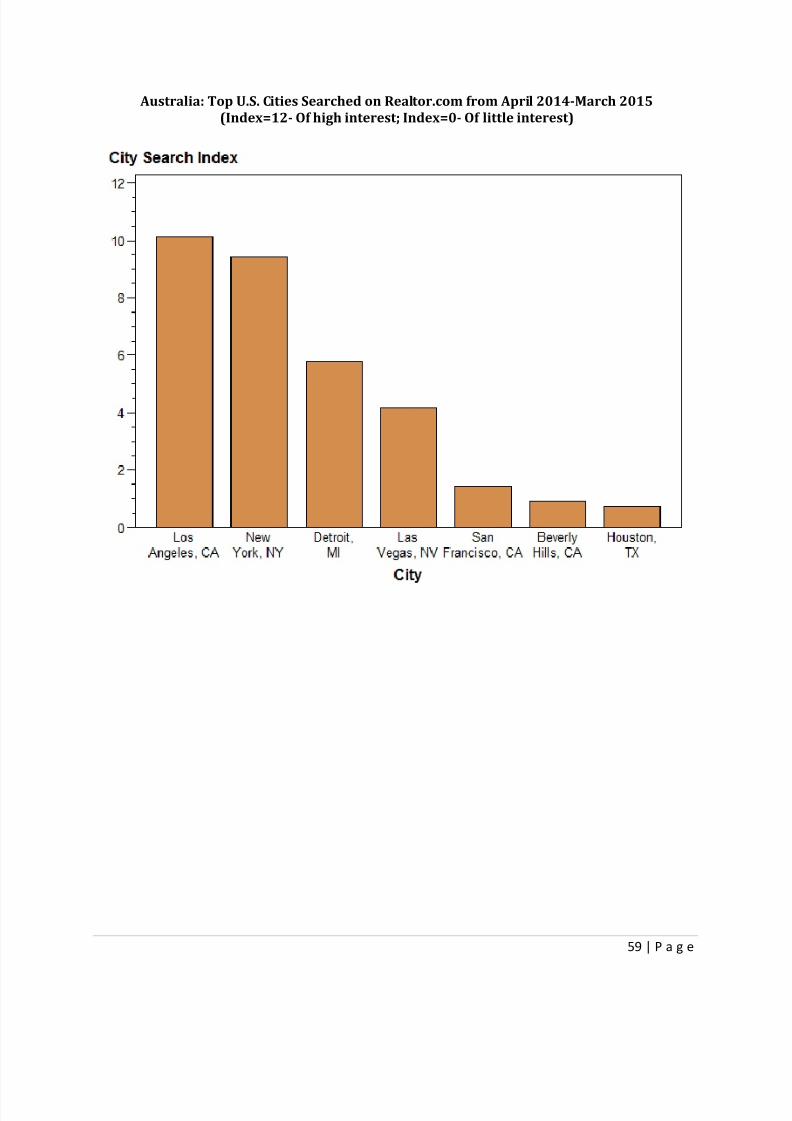
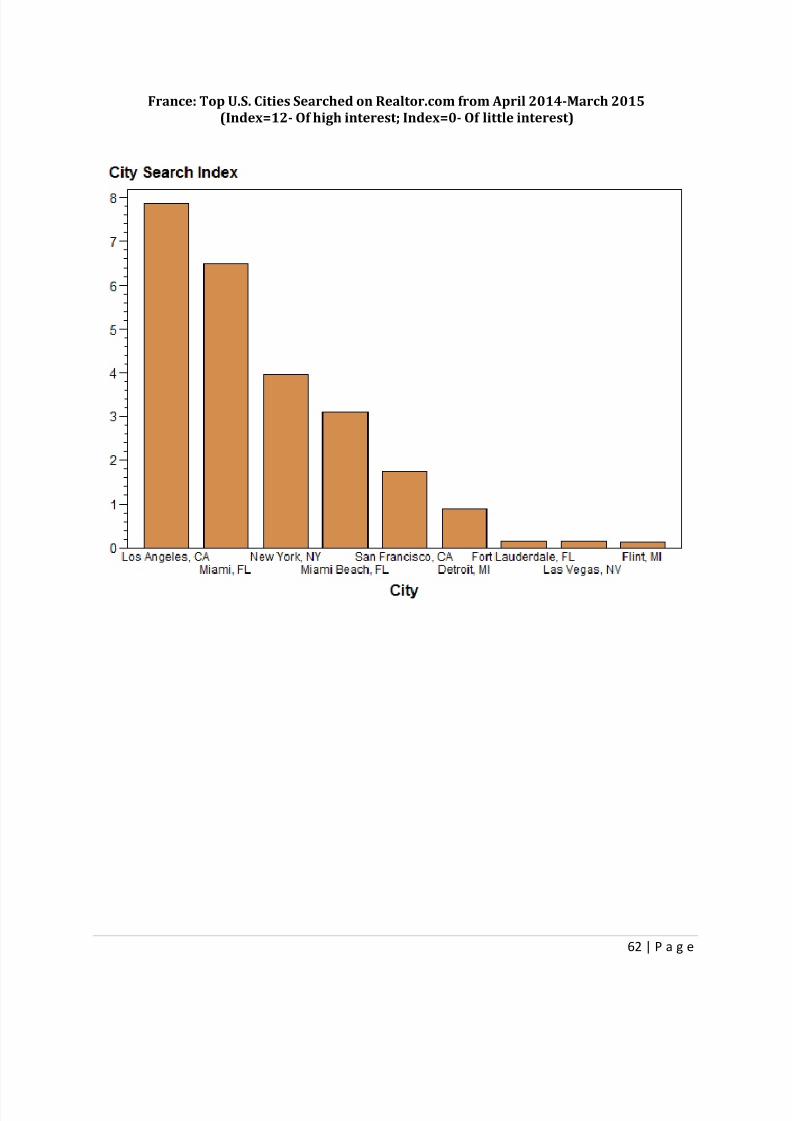
APPENDIX 3. International Clients Searching for Properties on Realtor.com
Realtor.com is a source of information on searches for U.S. properties by foreigners.
This is information about who is searching where; it does not include information on closed
transactions. We obtained information consisting of monthly data listing the top 20 countriesand their top 5 most-searched U.S. cities during April 2014-March 2015. To create a numerical
value or search index corresponding to these rankings which will lend to an aggregation of the
data, we converted the rankings into weights. The higher the index, the higher is the rank of the
country and the city.
The top countries include Canada, United Kingdom, Australia, Germany, Brazil, Mexico,
India, France, Italy, Germany, and Japan. There does not appear to be a lot of searchers on
Realtor.com from China.
The cities of major interest are located in California, Florida, Texas, and Hawaii, and
Washington. These include the cities of Los Angeles, Miami, Orlando, San Diego, Miami Beach,
Houston, Honolulu, and Seattle.
Across major buyers, one revelation is that Canadians were searching in Las Vegas and
Los Angeles.
Below are some charts /graphs depicting the top countries of origin of searchers and
their cities of interest during April 2014 to March 2015.
8/21/2019 2015 Profile of International Home Buying Activity
NAR Methodology Creating a “Search Index” of Top Countries Searching in U.S. Cities on
Realtor.com
Realtor.com has provided NAR with monthly data which lists the top 20 countries and their top 5 most-
searched U.S. cities. To create a numerical value or search index corresponding to these rankings which
will lend to an aggregation of the data, we converted the rankings into weights and then summed up theweights. The higher the index, the higher is the rank of the country and the city.
I. Create weights based on the country ranks (top 20) and city ranks (top 5)
1) Assign weights (wgt1) to the ranks starting with 1.0 and incrementing in a decreasing order by
0.05 (=1/20). So the weights for each country i for each month j () will be 1 (rank 1), 0.95,
…0.05 (rank 20).
2) Assign weights (wgt2) to the ranks of the top 5 cities starting with 1.0 and incrementing in a
decreasing order by 0.20 (=1/5). So the weights for the city rank will be 1 (rank 1), 0.8, 0.6, 0.4,
0.2 (rank 5)
3) To create a city index that takes into account the rank of the country, we multiply the country
rank by the city rank. So city index= wgt1 x wgt2.
II. Country Search Index Over 12 Months
The highest Country Search Index is 12 (1 x 12) means that the country is the #1 searcher in
each of the 12 months while the lowest index is 0.05 which means that the country was ranked
as the #20th searcher for 1 month (0.05x1).
III. Overall U.S. City Search Index
Across all the top 20 countries, the highest Overall City Search Index is 126 (1 + 0.95 + 0.90…+
0.05) x 1 x 12 which means that the city is the #1 searched city of the top 20 countries for the
12 months. The lowest index is 0.01 which means that the city was 5 th ranked by the 20th
country for 1 month (0.2 x 0.05 x 1).
IV. U.S. City Search Index For Each Country Over 12 Months
The highest U.S. City Search Index is 12, indicating that the city is the #1 searched city by the # 1
country searcher in each of the 12 months (1 X 1 X 12). The lowest index is 0.01 which means
that the city was 5th ranked by the 20th country searcher for 1 month (0.2 x 0.05 x 1).
8/21/2019 2015 Profile of International Home Buying Activity
APPENDIX 4. About NAR’s Commercial & Global Services Group
The Commercial & Global Services Group of the NATIONAL ASSOCIATION OF REALTORS® plays
an integral role in opening doors for REALTORS® to compete in the global market place. By
opening markets for business and keeping members informed of the latest developments
occurring around the world, the Commercial & Global Services Group gives REALTORS® thetools they need to succeed in the global market. NAR maintains formal partnerships with over
80 foreign real estate associations in 60 countries. These relationships are formed to advance
the interests of Realtors® worldwide, to uphold the highest standards of commercial practice
and to facilitate international business arrangements in strategic markets for REALTORS® and
non-U.S. real estate practitioners. Additionally, the Certified International Property Specialist
(CIPS) Designation offers specialized education and services to real estate professionals who
aim to profit in the global market.
For more information please visit http://www.realtor.org/research-and-statistics