21
Budget Brief: 2015 Proposed Budget Milwaukee Public Schools May 2014 Study authors: Vanessa Allen, Senior Fiscal Researcher Anne Chapman, Researcher Rob Henken, President
Budget Brief: 2015 Proposed Budget
Milwaukee Public Schools
May 2014
Study authors:
Vanessa Allen, Senior Fiscal Researcher Anne Chapman, Researcher
Rob Henken, President

MPS 2015 Budget Brief Page 2
TABLE OF CONTENTS
INTRODUCTION ..................................................................................................................................................... 3
2015 BUDGET THEMES ...................................................................................................................................... 4
ANALYSIS OF SIGNIFICANT 2014-15 BUDGET CHANGES .................................................................... 5
Major Revenues ........................................................................................................................................ 5
Major Expenditures ................................................................................................................................. 10
Personnel Costs ....................................................................................................................................... 11
Purchased Services.................................................................................................................................. 16
Debt Service ............................................................................................................................................ 17
SCHOOL-BASED INITIATIVES ....................................................................................................................... 18
Teaching Specialists ................................................................................................................................ 18
School Support Teachers ........................................................................................................................ 20
Parent Coordinators ................................................................................................................................ 20
CONCLUSION ....................................................................................................................................................... 21
MPS 2015 Budget Brief Page 3
INTRODUCTION
In December 2012, the Public Policy Forum released a comprehensive analysis of the Milwaukee Public Schools’ fiscal condition. The report – entitled Passing the Test, But Making the Grade? – was designed to explore the severity of MPS’ financial challenges and the extent to which recent efforts to control health care costs, “right-size” operations, and improve operational efficiency had improved the district’s long-term outlook. Our answer was that MPS had made considerable progress in rectifying its near-term budget challenges, but that its financial future remained “unsettled and uncertain.” Eighteen months later, our review of the MPS Superintendent’s proposed budget for the 2014-15 academic year (referred to hereafter as the “2015 proposed budget”) yields a similar conclusion. Health care and pension changes effectuated during the past four years continue to reap substantial budgetary dividends, allowing the district to stave off school-based personnel reductions in 2015. In addition, the departure of more than 4,300 staff (primarily due to retirements) during the past four years – while creating huge programmatic challenges – has allowed the district to realize annual savings in salary expenditures because of the ability to reduce staffing levels and hire new employees at lower levels of existing pay ranges. As a result of these circumstances, the 2015 proposed budget is able to recommend a handful of new initiatives, including the addition of staff for art, music, physical education, school support, and parent coordination. The budget also continues to preach efficiency, with a 5% spending cut in central services that administrators hope to realize by establishing priorities and continuing to implement process improvements. Yet, while the 2015 proposed budget is largely pain-free, the out years continue to look precarious. Even assuming stable enrollment, a freeze in salaries, and modest annual increases in total revenues, the district’s latest five-year forecast projects a $51 million budget gap in 2019. According to MPS officials, this gap – which is caused primarily by projected inflationary health care increases – could require the elimination of 450 teaching positions if not addressed in some other way. In addition, the gap could be greatly exacerbated by enrollment losses, cuts in state aids or revenue limits, or the need to provide salary increases to teachers for retention and recruitment purposes. This points to the fact that the underlying structural budgetary challenges identified in our analysis 18 months ago – while vastly improved – remain daunting. Simply put, MPS lacks the wherewithal to keep up even with inflationary increases in personnel costs without enrollment gains or greater support from the state – two variables that are mostly beyond its control. While redesigned health care benefits have generated substantial near-term savings and allowed the district to alleviate inflationary pressures over the longer term, those pressures still remain and must be addressed in the context of an extremely uncertain revenue picture. In the pages that follow, we provide more detailed analysis of the major changes in revenue and expenditures in the 2015 proposed budget, and the manner in which MPS has responded to recent legislative changes and turbulent workforce challenges. Our objective is to provide an independent assessment of the district’s immediate fiscal circumstances – as well as its long-term outlook – that will encourage informed deliberations on its 2015 budget and fiscal future.

MPS 2015 Budget Brief Page 4
2015 BUDGET THEMES
With its major revenue streams flat or declining in 2015, MPS will continue to try to do more with less. That effort is aided greatly by fringe benefit changes that began in 2010 and that are expected to produce $400 million in annual cost reductions through 2017, as well as a $1.4 billion (50%) reduction in the district’s unfunded retiree health care liability. That expenditure relief is far more than anticipated when first adopted and gives the 2015 budget the capacity to mitigate revenue shortfalls and invest in new initiatives. MPS’ improved financial condition can be illustrated by comparing previous five-year fiscal projections with new projections provided in the 2015 proposed budget. In 2011, budget officials developed fiscal projections that laid out the financial outlook with and without pending proposed changes in fringe benefit levels. Those projections – shown in Figure 1 – reveal the substantial financial improvements that were projected as a result of the policy adjustments. MPS’ newest projections also are displayed, showing that the outlook for 2017 is now even considerably better, though sizable deficits for following years are still forecasted. Figure 1: Comparison of prior budget gap projections for general school operations
Source: MPS November 2011 Status Quo & August 2012 Pro Forma forecasts; school board reports; MPS FY15 Proposed Budget
A prominent theme of the 2015 proposed budget is its use of an improved fringe benefits scenario to accommodate a troublesome revenue picture and even allow for some modest new school-based initiatives. The proposed budget also continues a recent theme of prioritizing expenditure reductions in the area of central services so as to avoid such reductions in school-based operations. Looming above those efforts, however, is an expected return to inflationary fringe benefit increases after 2015, which could produce the need for substantial staffing and/or programmatic reductions in all areas of the MPS budget in the not-too-distant future.
($103)
($41)
($23)
($51)
($120)
($100)
($80)
($60)
($40)
($20)
$0
$20
$40
$60
2014 2015 2016 2017 2018 2019
Mill
ion
s
Projections without benefit changes
Projections with benefit changes
Budgets/current projections
MPS 2015 Budget Brief Page 5
ANALYSIS OF SIGNIFICANT 2014-15 BUDGET CHANGES
This section summarizes the major revenue and expenditure elements in MPS’ 2015 proposed budget, providing greater detail on the themes discussed above.
Major Revenues
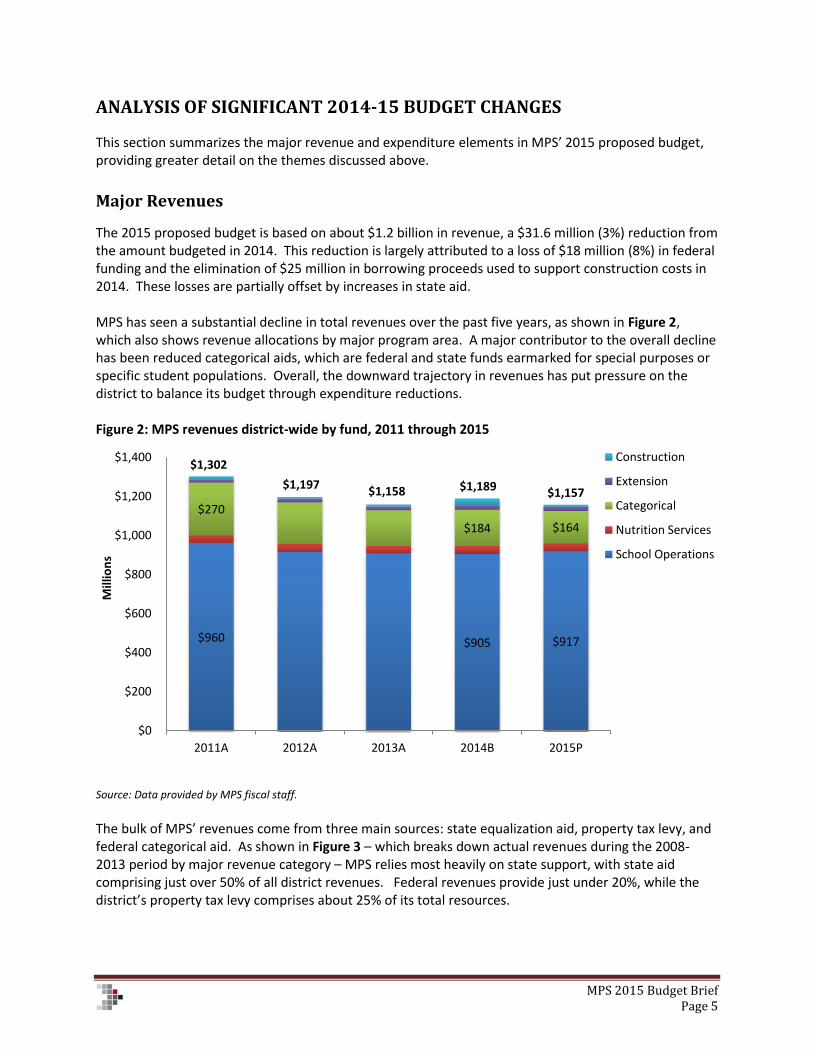
The 2015 proposed budget is based on about $1.2 billion in revenue, a $31.6 million (3%) reduction from the amount budgeted in 2014. This reduction is largely attributed to a loss of $18 million (8%) in federal funding and the elimination of $25 million in borrowing proceeds used to support construction costs in 2014. These losses are partially offset by increases in state aid. MPS has seen a substantial decline in total revenues over the past five years, as shown in Figure 2, which also shows revenue allocations by major program area. A major contributor to the overall decline has been reduced categorical aids, which are federal and state funds earmarked for special purposes or specific student populations. Overall, the downward trajectory in revenues has put pressure on the district to balance its budget through expenditure reductions. Figure 2: MPS revenues district-wide by fund, 2011 through 2015
Source: Data provided by MPS fiscal staff.
The bulk of MPS’ revenues come from three main sources: state equalization aid, property tax levy, and federal categorical aid. As shown in Figure 3 – which breaks down actual revenues during the 2008-2013 period by major revenue category – MPS relies most heavily on state support, with state aid comprising just over 50% of all district revenues. Federal revenues provide just under 20%, while the district’s property tax levy comprises about 25% of its total resources.
$960 $905 $917
$270
$184 $164
$1,302
$1,197 $1,158 $1,189 $1,157
$0
$200
$400
$600
$800
$1,000
$1,200
$1,400
2011A 2012A 2013A 2014B 2015P
Mill
ion
s
Construction
Extension
Categorical
Nutrition Services
School Operations

MPS 2015 Budget Brief Page 6
Figure 3: History of MPS revenues by funding source, 2008 through 2013
Source: Wisconsin Department of Public Instruction, Longitudinal Comparative Revenue Summary Data
Figure 3 also shows that major state and federal fiscal policy initiatives during the past five years have been quite impactful for MPS. The American Recovery and Reinvestment Act (ARRA), for example, provided a surge of federal revenue in the 2009-11 timeframe, which has now diminished. In addition, substantial cuts in state aids enacted in the 2011-13 biennial budget caused state revenues to fall sharply in 2012 and 2013. Table 1 provides a detailed breakdown of local, state, federal, and other revenue sources for general school operations and categorical programs in the 2015 proposed budget, as well as actual and budgeted figures for the previous four years. This breakdown shows a slight growth in combined state funding and property tax levy in 2015 per the state’s 2013-15 biennial budget. The proposed budget also reflects diminished federal funding, however, which is attributed in part to the growth in poverty nationally, which has created greater competition among districts with low-income student populations for already limited federal funds.
$0
$200
$400
$600
$800
$1,000
$1,200
$1,400
State Federal Property tax Other local Total
Mill
ion
s
2008 2009 2010 2011 2012 2013
Act 10 & revenue limit adjustments
Federal ARRA
funding

MPS 2015 Budget Brief Page 7
Table 1: MPS revenue summary by type, 2011 through 2015 (in millions)* 2011 2012 2013 2014 2015 5-year Change ‘14 to ‘15 change
Actual Actual Actual Budget Proposed $ % $ %
Property Tax Levy, Equalization and Integration Aids Property Tax Levy $265.4 $275.8 $274.9 $272.8
$842.9** ($26.3) -3% $4.2 1% General Equalization Aid $603.8 $559.7 $562.2 $565.9 Integration Aid $39.2 $35.2 $34.2 $33.5 $33.5 ($5.6) -14% $0.0 0% Poverty Aid $9.7 $5.8 $5.8 $4.8 $4.8 ($5.0) -51% $0.0 0% Computer Aid $5.8 $5.1 $4.9 $5.7 $5.7 ($0.1) -3% $0.0 0% Deduction for Choice/Charter ($58.8) ($63.0) ($67.7) ($65.5) ($65.5) ($6.6) 11% $0.0 0%
Total $865.1 $818.7 $814.4 $817.2 $821.4 ($43.7) -5% $4.2 1%
Additional State Aids School operations $60.5 $62.7 $64.6 $66.1 $72.5 $12.0 20% $6.4 10% Nutrition $1.0 $0.9 $0.9 $1.0 $1.0 ($0.0) -2% $0.0 0% Categorical $37.6 $29.7 $26.7 $26.6 $26.2 ($11.4) -30% ($0.4) -2%
Total $99.1 $93.4 $92.2 $93.6 $99.7 $0.5 1% $6.0 6%
Federal Aids School operations $16.2 $22.7 $13.3 $15.4 $16.1 ($0.1) -1% $0.6 4% Nutrition $37.6 $37.2 $37.3 $38.8 $39.7 $2.1 6% $0.9 2% Categorical $232.5 $183.5 $155.3 $157.4 $138.1 ($94.5) -41% ($19.4) -12%
Total $286.3 $243.4 $205.9 $211.7 $193.8 ($92.5) -32% ($17.9) -8%
Local Revenues (Non-Property Tax) School operations $17.7 $11.0 $13.9 $6.3 $6.9 ($10.8) -61% $0.7 11% Nutrition $3.2 $2.9 $2.9 $3.0 $3.0 ($0.2) -7% $0.0 0%
Total $20.9 $14.0 $16.8 $9.3 $9.9 ($11.0) -53% $0.7 7%
Other Private categorical $8.9 $7.1 $4.5 $5.7 $4.8 ($4.2) -47% ($0.9) -17% Less indirect categorical ($9.4) ($7.5) ($4.6) ($6.1) ($4.7) $4.7 50% $1.4 -23%
Total ($0.5) ($0.4) ($0.1) ($0.4) $0.1 $0.6 -112% $0.5 -114%
Total revenues $1,271.0 $1,169.0 $1,129.2 $1,131.4 $1,124.9 ($146.1) -12% ($6.5) -1% * This table reflects revenues for the School Operations, Nutrition, and Categorical funds. Construction and Extension funds are not included. ** The 2015 proposed budget shows property tax levy and equalization aid as a combined amount. The figure will be broken down separately in the adopted budget this fall once state aid figures are received and a final property tax levy is adopted. Source: MPS fiscal staff; MPS FY15 Proposed Budget
State aids and property taxes The property tax levy and state aid amounts received by Wisconsin school districts are largely guided by student enrollment and state-imposed per-pupil revenue limits. Per-pupil revenue authority is based on the amount of prior year per-pupil revenue collectively generated by property taxes, equalization aid, and integration aids, with annual per-pupil increases guided by state policy and available funding. Given that revenue limits are established on a per-pupil basis, a district’s overall revenue authority under the law is highly dependent on its student enrollment. MPS has seen its student membership (as defined by the state equalization aid formula) decline from more than 98,000 students in 2004 to less than 82,000 in 2013, though the district saw a slight increase in enrollment in 2014 and anticipates a drop in 2015. The 2015 proposed budget anticipates that MPS will receive $821.4 million in combined property tax levy, equalization and integration aids. As noted above, these revenue sources – which comprise the largest revenue category in MPS’ budget – declined by more than $50 million between 2011 and 2013 before rebounding by $2.8 million in 2014 and an estimated $4.2 million in 2015. The initial decline

MPS 2015 Budget Brief Page 8
resulted from a 5.5% decrease in per-pupil revenue limits that took place in 2012. That cut was accompanied by the adoption of Wisconsin Act 10, which provided districts new flexibility to reduce personnel-related expenditures. Revenue limits increased by $50 per pupil in 2013 and $75 in both 2014 and 2015. In 2015, MPS’ per-pupil revenue limit is estimated at $10,020. As is typically the case, the 2015 budget proposes using all of the available authority under the limit to secure the maximum amount of combined state and local funding permitted under the law. As noted above, the precise mix of property tax levy versus state aid will not be determined until the fall, however. MPS enrollment figures for purposes of calculating the revenue limit do not account for the more than 25,700 students attending voucher schools under the Milwaukee Parental Choice Program (MPCP) and 7,900 students attending charter schools authorized by UW-Milwaukee or the City of Milwaukee. Figure 4 shows the growth in MPCP enrollment since 2005, reflecting changes in state policy that have allowed greater numbers of students to utilize the program. As shown in Table 1 on the previous page, in 2015, approximately $66 million of state aids will be redirected to support MPS’ statutory share of students participating in the MPCP and charter schools outside its purview. In the case of the MPCP deduction, MPS does have the ability to increase its property tax levy to counter the lost state aid.1 Figure 4: MPCP student enrollment, 2011 through 2014
Source: Third Friday student count taken from DPI WISEdash.
MPS’ finances also are impacted by students participating in Open Enrollment, the Chapter 220 integration program, and those attending “non-instrumentality” charter schools that are part of MPS (these charter schools are under the MPS umbrella but are largely staffed by non-MPS employees). For the purpose of calculating state aids, the district’s student membership is not impacted by the loss of those students, but much of the state revenue received by MPS flows to these inter-district and partnering charter schools through certain expenditure transfers. As seen in Figure 5 – which shows total MPS enrollment by school type – a growing proportion of Milwaukee students are being educated through those programs.
1 A provision in the 2013-15 state budget eventually will eliminate the local property tax impact of the MPCP by
phasing in 100% state funding of the program over the next 12-13 years.
20,928 20,996 23,198
24,596 25,734
0
5,000
10,000
15,000
20,000
25,000
30,000
2010 2011 2012 2013 2014
Stu
de
nt
cou
nt

MPS 2015 Budget Brief Page 9
Figure 5: MPS student enrollment by school type, 2011 through 2015
Source: MPS FY14 Adopted Budget narrative; February 2014 FY15 School Budget Kickoff presentation Given the importance of student enrollment counts in terms of garnering state aid and the competitive educational market in which it must compete, MPS includes new marketing initiatives in its 2015 proposal. The budget adds a marketing specialist position that will help define, build, and promote the district’s brand to help recruit and retain Milwaukee students. The district also intends to release a request for proposals for a marketing plan to be developed under the supervision of the new marketing specialist position. Beyond the property tax levied to cover general school operations, MPS also intends to levy $9.6 million to support the Construction Fund and $17.1 million for the Extension Fund (used primarily for community services and recreation). The Construction Fund is subject to the district’s state revenue limit, while the levy amount for the Extension Fund is not but has been capped by the state at the 2013 amount. These property tax levy amounts remain unchanged from the amounts budgeted for 2014. The district’s total property tax levy has grown 2% during the past four years, from $293.5 million in 2011 to $299.5 million in 2014. The state also appropriated an additional $75 per student in general state aid outside of the revenue limit for the 2013-15 biennium, adding another $6.1 million in state revenue in 2015. State categorical funds drop, however, as funds for SAGE, the district’s class size reduction program, fall by $342,000. In total, the 2015 budget realizes an additional $150 in per-pupil revenue generated by increased authority under the revenue limit along with additional state aid. Hence, these critical revenue streams – which account for about 75% of MPS’ total revenues – will increase a little more than 1% above the 2014 level. This highlights one of MPS’ primary fiscal challenges, as it is difficult for MPS to accommodate this level of revenue growth given its severe inflationary cost pressures, which are detailed later in this report.
88% 86% 85% 83% 82%
9% 9% 10% 10% 10%
3% 5% 5% 7% 8%
0
10,000
20,000
30,000
40,000
50,000
60,000
70,000
80,000
90,000
100,000
2011 2012 2013 2014 2015 Projected
Stu
de
nt
cou
nt
MPS schools
MPS Open enrollment/Chapter 220 (suburban)
MPS Non-instrumentality schools
89,414 88,114 86,949 87,019 86,416

MPS 2015 Budget Brief Page 10
Federal funding reductions The federal revenues received by MPS largely support categorical programs designated for specific purposes. This includes $83.5 million from the Title I program (the nation’s largest federal education program, which provides support for high-poverty districts), $22.5 million in IDEA funding for special education, $8.9 in Title II funding for class size reduction and staff development, $7.9 million for Head Start, and $39.7 million for the district’s school meal program. The district anticipates total federal revenue of $193.8 million in 2015, down $17.9 million from 2014. Year-to-year comparisons of federal funding are complicated by the different fiscal years used by the district and the federal government. However, as previously seen in Table 1, federal revenue has declined sharply since the temporary infusion of ARRA funds from 2009 through 2011. The recent federal sequestration process has played a part in this decline, creating cuts in grant funding in 2013 and 2014. According to the district, however, a larger cause of the federal funding decline is the national growth in poverty. Several cities have experienced growth their impoverished populations, meaning that federal resources are spread more thinly over a growing number of school districts.
Major Expenditures
Approximately 80% of MPS’ expenditure budget (for all funds) is directed toward school-based services (70% for classroom-based expenditures and 10% for student meals and transportation, which are budgeted centrally), and the remaining 20% is allocated to central services that include board administration, operations, construction, and debt service.2 Table 2 shows the breakdown of central services for the 2011-2015 timeframe. Table 2: MPS expenditures, 2011 through 2015, all district funds (in millions)
2011 2012 2013 2014 2015 5-Year Change '14 to '15 Change Actual Actual Actual Budget Proposed $ % $ %
School-based expenditures $920.8 $823.7 $822.0 $818.6 $816.1 ($104.7) -11% ($2.6) -0%
Central services expenditures $386.2 $366.2 $362.8 $370.3 $341.2 ($45.0) -12% ($29.1) -8% Board/ Board Governance $3.1 $2.9 $3.0 $3.0 $2.6 ($0.5) -15% ($0.4) -13% Accountability & Efficiency $1.4 $1.3 $1.6 $1.4 $1.4 $0.0 1% ($0.0) -2% Superintendent of Schools $7.0 $15.6 $13.6 $21.0 $15.2 $8.2 116% ($5.8) -28% School Administration $4.5 $5.4 $6.8 $6.2 $6.1 $1.6 34% ($0.1) -2% Academics $73.0 $79.3 $64.2 $63.7 $56.1 ($16.9) -23% ($7.6) -12% Finance $5.3 $5.6 $6.0 $6.6 $6.2 $1.0 19% ($0.3) -5% Operations $87.5 $64.0 $58.8 $55.8 $54.5 ($33.0) -38% ($1.3) -2% Human Capital Services $7.5 $6.7 $7.0 $6.1 $6.2 ($1.2) -17% $0.1 2% Innovation $10.2 $6.5 $3.7 $13.7 $13.3 $3.1 30% ($0.4) -3% Nutrition Services $42.9 $41.8 $42.8 $42.8 $42.7 ($0.3) -1% ($0.1) -0% Transportation $57.7 $56.5 $56.8 $59.0 $60.1 $2.4 4% $1.0 2% Debt Service $18.6 $18.4 $16.5 $14.6 $16.4 ($2.3) -12% $1.8 12% Other Accounts $67.6 $62.3 $81.9 $76.5 $60.5 ($7.1) -11% ($16.0) -21%
TOTAL $1,307.0 $1,190.0 $1,184.7 $1,188.9 $1,157.3 ($149.7) -11% ($31.6) -3% Source: MPS fiscal staff; MPS FY15 Proposed Budget
2 MPS budget documents indicate that 87% of the proposed budget for general school operations consists of
school-based expenditures. This percentage – which is higher than that reflected in the table – simply reflects an alternative breakdown of information. For example, MPS’ estimates include student meals and transportation as school-based expenditures and do not include the Construction Fund in total costs.
MPS 2015 Budget Brief Page 11
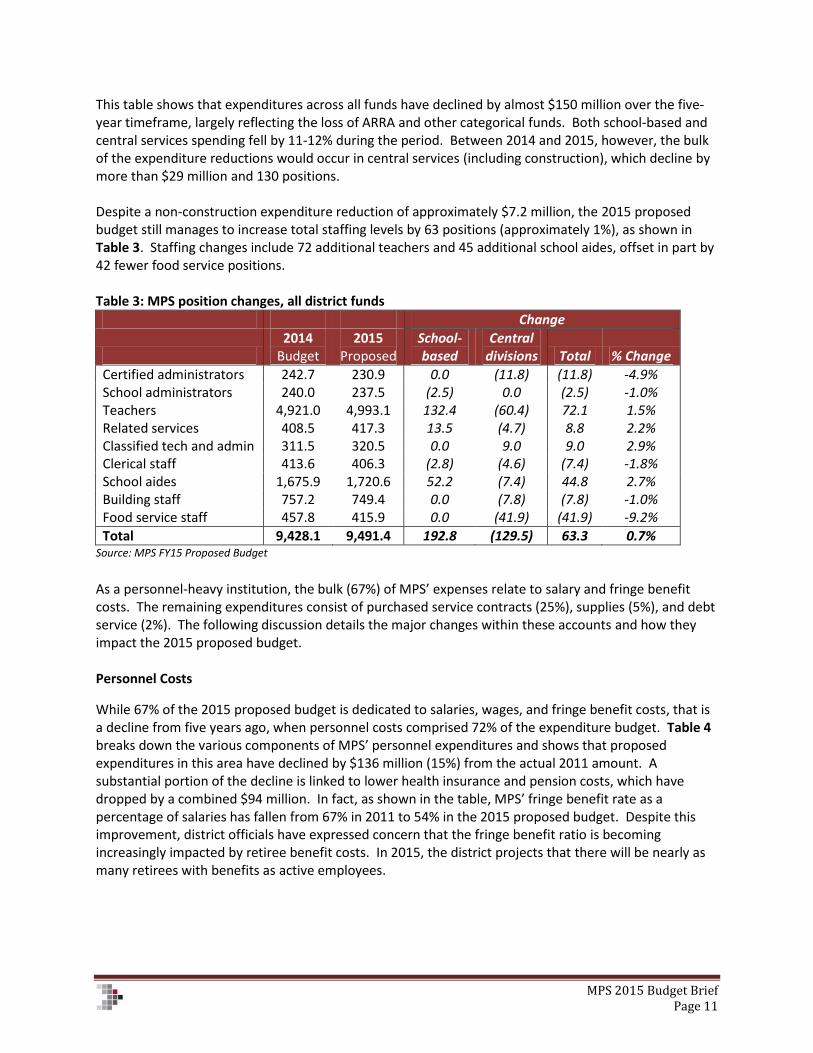
This table shows that expenditures across all funds have declined by almost $150 million over the five-year timeframe, largely reflecting the loss of ARRA and other categorical funds. Both school-based and central services spending fell by 11-12% during the period. Between 2014 and 2015, however, the bulk of the expenditure reductions would occur in central services (including construction), which decline by more than $29 million and 130 positions. Despite a non-construction expenditure reduction of approximately $7.2 million, the 2015 proposed budget still manages to increase total staffing levels by 63 positions (approximately 1%), as shown in Table 3. Staffing changes include 72 additional teachers and 45 additional school aides, offset in part by 42 fewer food service positions. Table 3: MPS position changes, all district funds
Change
2014
Budget 2015
Proposed School-based
Central divisions Total % Change
Certified administrators 242.7 230.9 0.0 (11.8) (11.8) -4.9% School administrators 240.0 237.5 (2.5) 0.0 (2.5) -1.0% Teachers 4,921.0 4,993.1 132.4 (60.4) 72.1 1.5% Related services 408.5 417.3 13.5 (4.7) 8.8 2.2% Classified tech and admin 311.5 320.5 0.0 9.0 9.0 2.9% Clerical staff 413.6 406.3 (2.8) (4.6) (7.4) -1.8% School aides 1,675.9 1,720.6 52.2 (7.4) 44.8 2.7% Building staff 757.2 749.4 0.0 (7.8) (7.8) -1.0% Food service staff 457.8 415.9 0.0 (41.9) (41.9) -9.2%
Total 9,428.1 9,491.4 192.8 (129.5) 63.3 0.7% Source: MPS FY15 Proposed Budget
As a personnel-heavy institution, the bulk (67%) of MPS’ expenses relate to salary and fringe benefit costs. The remaining expenditures consist of purchased service contracts (25%), supplies (5%), and debt service (2%). The following discussion details the major changes within these accounts and how they impact the 2015 proposed budget. Personnel Costs
While 67% of the 2015 proposed budget is dedicated to salaries, wages, and fringe benefit costs, that is a decline from five years ago, when personnel costs comprised 72% of the expenditure budget. Table 4 breaks down the various components of MPS’ personnel expenditures and shows that proposed expenditures in this area have declined by $136 million (15%) from the actual 2011 amount. A substantial portion of the decline is linked to lower health insurance and pension costs, which have dropped by a combined $94 million. In fact, as shown in the table, MPS’ fringe benefit rate as a percentage of salaries has fallen from 67% in 2011 to 54% in the 2015 proposed budget. Despite this improvement, district officials have expressed concern that the fringe benefit ratio is becoming increasingly impacted by retiree benefit costs. In 2015, the district projects that there will be nearly as many retirees with benefits as active employees.

MPS 2015 Budget Brief Page 12
Table 4: MPS personnel costs, all district funds (in millions)
2011 2012 2013 2014 2015 5-Year Change ‘14 to ‘15 Change
Actual Actual Actual Budget Proposed $ % $ %
Salaries & Wages $552.8 $499.7 $508.1 $524.4 $513.5 ($39.3) -7% ($10.9) -2%
Employee medical insurance $155.4 $104.7 $117.5 $106.7 $109.2 ($46.2) -30% $2.5 2% Current retiree medical $69.1 $60.9 $54.8 $51.9 $62.1 ($7.0) -10% $10.2 20% Payments to OPEB liability $7.6 $31.7 $18.8 $17.6 $5.2 ($2.4) -31% ($12.4) -70% Pension $88.1 $72.3 $74.1 $60.6 $50.2 ($37.9) -43% ($10.4) -17% Social Security $42.0 $37.7 $37.9 $39.6 $39.1 ($2.9) -7% ($0.5) -1% Dental Insurance $8.1 $7.8 $8.0 $8.1 $7.3 ($0.8) -10% ($0.8) -10% Life Insurance $1.8 $1.7 $2.9 $2.1 $2.1 $0.3 15% $0.0 0% Other benefits $0.3 $0.3 $0.4 $0.4 $0.4 $0.1 32% $0.0 0%
Total MPS benefit costs $372.4 $317.1 $314.5 $287.0 $275.6 ($96.8) -26% ($11.4) -4%
Total personnel costs $925.2 $816.8 $822.6 $811.4 $789.1 ($136.0) -15% ($22.3) -3%
Benefit to Salary Ratio 67.4% 63.5% 61.9% 54.7% 53.7%
Source: MPS Accountability Office, Archive of Actual MPS Benefit Ratios; MPS fiscal staff
Salaries and wages also have declined significantly during the five-year period (from $553 million in 2011 to $514 million in the 2015 proposed budget), with those reductions attributed largely to reduced staffing levels produced by reduced categorical aids and a substantial increase in retirements. Fringe benefit reductions The biggest driver in the district’s significant personnel expenditure reductions has been the series of changes to employee benefit provisions adopted in recent years. As noted above, the district anticipates that these changes will garner more than $400 million in budgetary savings through 2017, which has and will continue to allow restoration of school-based staff lost in previous years due to resource limitations. MPS’ dramatic reduction in fringe benefit costs is linked both to substantial benefit changes included in a four-year teacher’ union contract adopted in 2010 and a series of additional changes that were unilaterally adopted following the passage of Wisconsin Act 10, which eliminated the district’s need to collectively bargain those changes with employee unions. Figures 6 and 7 illustrate the dramatic plunge in the two largest areas of fringe benefit spending: health care and pension benefits. The district spent $240 million on medical benefits in 2011 along with $88 million in pension costs. Collectively, MPS has seen a 29% decrease in spending in these areas over the last five years.

MPS 2015 Budget Brief Page 13
Figures 6 and 7: Fringe benefit cost trends (all district funds), 2011 through 2015 Health care and dental expenditures Pension expenditures
Source: MPS fiscal staff; MPS FY15 Proposed Budget
The benefit changes have been adopted in four rounds. The first occurred during 2010-11, with several resulting from the district’s last teachers’ union contract. Adjustments included a change in the district’s health care provider, significant plan design changes, heightened employee premiums that encouraged participation in the district’s Exclusive Provider Organization (EPO) as opposed to its costlier Preferred Provider Organization (PPO) plan, and a requirement for employee pension contributions. According to MPS officials, provider network discounts of $29 million were predicted at the outset of the contract, yet the discounts actually realized were closer to $47 million and continue to benefit the district to this day. The next round was adopted through Board actions in 2011 and 2012 and included additional changes to health care plan design, closure of the district’s supplemental teacher pension plan to future participants, an increase in the age and years of service necessary to become eligible for retiree health benefits, and an increase in employee pension contributions to the levels required under Wisconsin Act 10. These changes became effective for some employees at the start of the 2012-13 academic year, while for teachers they became effective the following year after expiration of the existing contract. Taken together, these two rounds of benefit changes not only reduced annual benefit costs, but also drastically reduced the district’s long-term liability for retiree health care (otherwise known as its Other Post-Employment Benefit or OPEB liability), bringing that unfunded liability down from $2.8 to $1.4 billion. The district continues to put aside money annually toward these future liabilities within its OPEB Trust, but the amount required has been dramatically reduced. In 2015, $5.2 million is proposed to pay down future OPEB liabilities. However, as fringe benefit costs begin a more normal rise, it may be increasingly difficult for the district to be able to put aside funds to pay down its long-term liability without hurting student services. The third round of changes increased the minimum threshold for part-time employees to become eligible for district fringe benefits from 20 to 30 hours per week. This change particularly impacted employees in the district’s food services division and produced nearly $4 million in annual savings.
$240
$184 $184
$0
$50
$100
$150
$200
$250
$300
2011 Actual
2012 Actual
2013 Acutal
2014 Budget
2015 Proposed
Mill
ion
s
$88
$61
$50
$0
$20
$40
$60
$80
$100
2011A 2012A 2013A 2014B 2015P
MIl
lion
s

MPS 2015 Budget Brief Page 14
The most recent set of fringe benefit changes became effective in the 2013-14 academic year and entailed a switch in the district’s dental plan provider. The new contract made changes to the provider network and incorporated performance guarantees and preventive care benefits. In addition, the district’s renewed pharmacy contract included improved rebates and discounts, producing additional savings. The positive financial impacts of MPS’ fringe benefits changes can be further appreciated by reviewing the district’s regular re-calibrations of five-year fiscal projections for general school operations. Using general school operations – which do not include categorical expenditures – allows for analysis of benefit changes without the influence of the significant federal funding fluctuations that were experienced throughout the period. As shown in Figure 8, prior to implementing benefit changes, the district projected that fringe benefit costs in the area of general school operations would grow to about $322 million by 2015. The early set of health care and pension benefit changes yielded a new prediction of a 2015 benefit cost of $236 million. The 2015 proposed budget narrative provides a new projection, incorporating not only the full array of changes, but also the greater-than-anticipated savings realized from actual experience. Those new projections anticipate fringe benefit spending of $225 million in 2015, which is a 30% decrease from the projection of what would have occurred had the district left benefits unchanged. Figure 8: Comparison of prior fringe benefit cost projections for general school operations
Note: General school operations includes the School Operations Fund and the Nutrition Fund. Source: MPS November 2011 Status Quo & August 2012 Pro Forma forecasts; school board reports; MPS FY15 Proposed Budget
This figure also shows that the trajectory through 2017 has improved dramatically. It is important to note, however, that MPS’ ability to achieve annual reductions in fringe benefit costs is expected to end in 2015. After next year, fringe benefit costs are projected to take on a more regular annual growth of between 5% and 6% annually. Salary expenditure trends and position changes While the fringe benefit changes discussed above were instrumental in MPS’ efforts to align personnel expenditures with available revenues, they also contributed to a substantial loss of employees from the district. In many cases, employees elected to retire before benefit changes were implemented, thus allowing them to leave district employment with more robust benefit levels.
$322 $378
$236 $268 $266
$309
$225
$249
$0
$100
$200
$300
$400
2007 2008 2009 2010 2011 2012 2013 2014 2015 2016 2017
Mill
ion
s
Projections without benefit changes Projections with benefit changes Experience/current projections

MPS 2015 Budget Brief Page 15
Figure 9 shows MPS retirements and resignations during the past three years. From 2011 through April 2014, 4,330 individuals left district employment. According to district staff, this level of departure is far greater than experienced in previous years. Of that total, 60% included principals, teachers, social workers, and psychologists. The remaining departures reflect positions such as educational assistants, food service workers, and maintenance staff. The district has indicated that an additional surge in retirements may come in June 2015 because of the expiration of sunset provisions for retiree benefit eligibility. Figure 9: MPS employee departures and new hires from 2011 through April 2014
*The figures for 2014 YTD represent staff departures and new hires that took place from July 2013 through the end of April 2014. The district estimates another 120 departures at the end of the school year. Source: MPS fiscal staff
MPS replaced a substantial number of those retired employees but has not filled all vacated positions. As shown above, the district added 3,760 new hires during the 2011 to April 2014 timeframe, which represented 87% of the number who departed. As shown in Figure 10, the net decrease of about 570 employees has helped MPS to hold the line on salary expenditures, which actually decline in the 2015 proposed budget by $3.3 million for general school operations and by $10.9 million overrall. Figure 10: MPS annual salary and wage expenditures, 2011 through 2015
Source: MPS fiscal staff; MPS FY15 Proposed Budget
4,330
3,760
-
500
1,000
1,500
2,000
2,500
3,000
3,500
4,000
4,500
5,000
FY11 FY12 FY13 FY14 YTD* All years total
Po
siti
on
co
un
ts
Retirements/resignations New hires
$553 $500 $508 $524 $514
$439 $412 $423 $435 $432
$0
$100
$200
$300
$400
$500
$600
2011A 2012A 2013A 2014B 2015P
Mill
ion
s
All funds General school operations

MPS 2015 Budget Brief Page 16
The decline in salary expenditures also has been furthered by the replacement of long-tenured employees at the top of pay ranges with newer staff members at lower levels of the same pay range. Figure 11, which shows the decline in average teacher salaries since the heightened exodus of teachers, illustrates this point. It also should be noted that despite this overall decrease in average teacher salaries, MPS was able to accommodate an increase in the starting base salary for teachers. District projections within the 2015 budget assume a salary freeze, however, for at least the next few years. Figure 11: MPS average teacher salaries, 2011 through 2015
Source: Prior year MPS budget documents; MPS FY15 Proposed Budget
MPS officials say the district has made significant progress in achieving its desired number of teaching staff. The district has partnered with various alternative certification programs to hire and place qualified teachers in critical shortage areas, including teachers with experience in special education, bilingual capabilities, and science. They have also indicated that they will be adding positions in certain non-instructional areas, as the Wisconsin Legislature’s elimination of residency requirements has allowed the district to better recruit staff in information technology and related areas. This will allow MPS to eliminate certain purchase of service contracts and instead handle certain functions at a lower cost with district staff. In one other personnel-related change, the 2015 proposed budget would transfer the tasks of recruitment, selection, testing, and job analysis for all classified positions from the City of Milwaukee back to the district. This proposal follows a pilot project in the current year in which MPS staff have demonstrated their ability to conduct these tasks in a far more timely manner. Under this initiative, the district reduced the amount of time from job posting to candidate selection to two months. MPS officials say this adjustment will allow them to more rapidly fill needed positions and will reduce costs associated with hiring contingency staff while the recruitment process plays out. Purchased Services
Purchased services account for 25% of the district’s expenditures and include payments to non-instrumentality charter schools as well as other service contracts that cover items like student transportation and technology. This account amounts to $289.6 million in the proposed 2015 budget, a decrease of $18.4 million from 2014. As shown in Figure 12, while this represents a drop from 2014, purchased services spending during the five-year period has increased by $25.2 million (10%).
$56,500
$62,800
$59,600
$52,000
$54,000
$56,000
$58,000
$60,000
$62,000
$64,000
2011 2012 2013 2014 2015

MPS 2015 Budget Brief Page 17
Figure 12: MPS purchased service expenditures, all district funds
Source: MPS fiscal staff; MPS FY15 Proposed Budget
Funding for non-instrumentality charter schools, totaling $52.9 million, makes up a large portion of the purchased services budget. Another $13.1 million goes to support other MPS partnership schools. With regard to the 2015 increase, the district has indicated that $5.6 million is related to the enrollment shift discussed previously from traditional MPS schools to non-instrumentality charter schools. The increase also reflects a $3.5 million increase to support an expanding student body within the open enrollment program. Other substantial increases include an increase of $2.8 million in the district’s school allocation reserve and a $2 million increase in student transportation costs. These increases are offset by a $3.1 million decline in technology and educational maintenance contracts. Debt Service
Debt service expenditures account for 2% of the district’s expenditures at $26.6 million in the proposed 2015 budget. Figure 13 shows that after dropping sharply from 2011 to 2013, debt service expenditures are again on the rise. In 2014, MPS began the demolition and reconstruction of its aging South Stadium and will soon start work on the former Custer Stadium. The district has borrowing authority of $13 million in 2013 and $25 million in 2014 for these and other capital projects. While that capital expense disappears in 2015, the budget now must incorporate its associated annual debt service. Figure 13: MPS debt service expenditures, all district funds
Source: MPS fiscal staff; MPS FY15 Proposed Budget
$264.4
$308.0 $289.6
$0
$50
$100
$150
$200
$250
$300
$350
2011A 2012A 2013A 2014B 2015P
Mill
ion
s
$33.3
$18.7
$26.0 $26.6
$0
$5
$10
$15
$20
$25
$30
$35
2011A 2012A 2013A 2014B 2015P
Mill
ion
s
MPS 2015 Budget Brief Page 18
SCHOOL-BASED INITIATIVES
Despite limited resources overall, MPS uses a portion of the savings generated from reduced fringe benefit costs to make several school-based investments in the 2015 proposed budget. As noted above, school-based staffing levels increase by 193 positions and include new teaching staff in the areas of arts, music, and physical education; new school support teachers; and new parent coordinator positions within schools. The discussion below highlights these initiatives.
Teaching Specialists
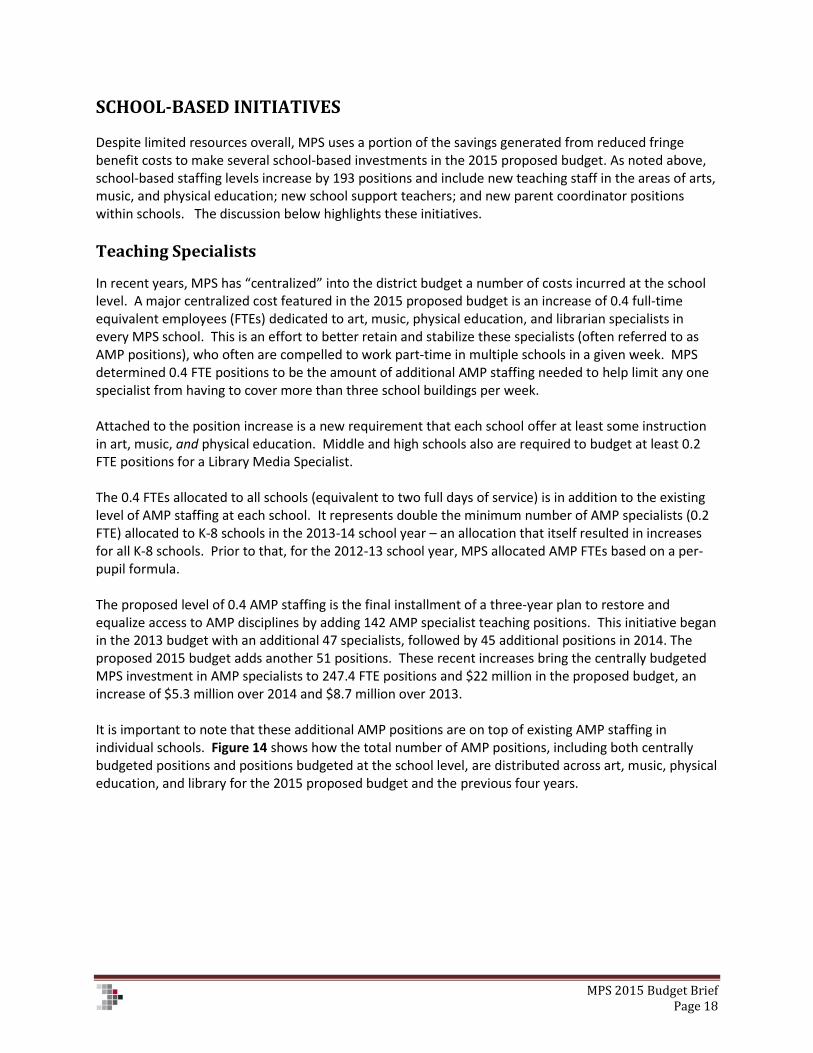
In recent years, MPS has “centralized” into the district budget a number of costs incurred at the school level. A major centralized cost featured in the 2015 proposed budget is an increase of 0.4 full-time equivalent employees (FTEs) dedicated to art, music, physical education, and librarian specialists in every MPS school. This is an effort to better retain and stabilize these specialists (often referred to as AMP positions), who often are compelled to work part-time in multiple schools in a given week. MPS determined 0.4 FTE positions to be the amount of additional AMP staffing needed to help limit any one specialist from having to cover more than three school buildings per week. Attached to the position increase is a new requirement that each school offer at least some instruction in art, music, and physical education. Middle and high schools also are required to budget at least 0.2 FTE positions for a Library Media Specialist. The 0.4 FTEs allocated to all schools (equivalent to two full days of service) is in addition to the existing level of AMP staffing at each school. It represents double the minimum number of AMP specialists (0.2 FTE) allocated to K-8 schools in the 2013-14 school year – an allocation that itself resulted in increases for all K-8 schools. Prior to that, for the 2012-13 school year, MPS allocated AMP FTEs based on a per-pupil formula. The proposed level of 0.4 AMP staffing is the final installment of a three-year plan to restore and equalize access to AMP disciplines by adding 142 AMP specialist teaching positions. This initiative began in the 2013 budget with an additional 47 specialists, followed by 45 additional positions in 2014. The proposed 2015 budget adds another 51 positions. These recent increases bring the centrally budgeted MPS investment in AMP specialists to 247.4 FTE positions and $22 million in the proposed budget, an increase of $5.3 million over 2014 and $8.7 million over 2013. It is important to note that these additional AMP positions are on top of existing AMP staffing in individual schools. Figure 14 shows how the total number of AMP positions, including both centrally budgeted positions and positions budgeted at the school level, are distributed across art, music, physical education, and library for the 2015 proposed budget and the previous four years.
MPS 2015 Budget Brief Page 19
Chart 14: AMP and library positions by discipline and budget year
Source: MPS fiscal staff
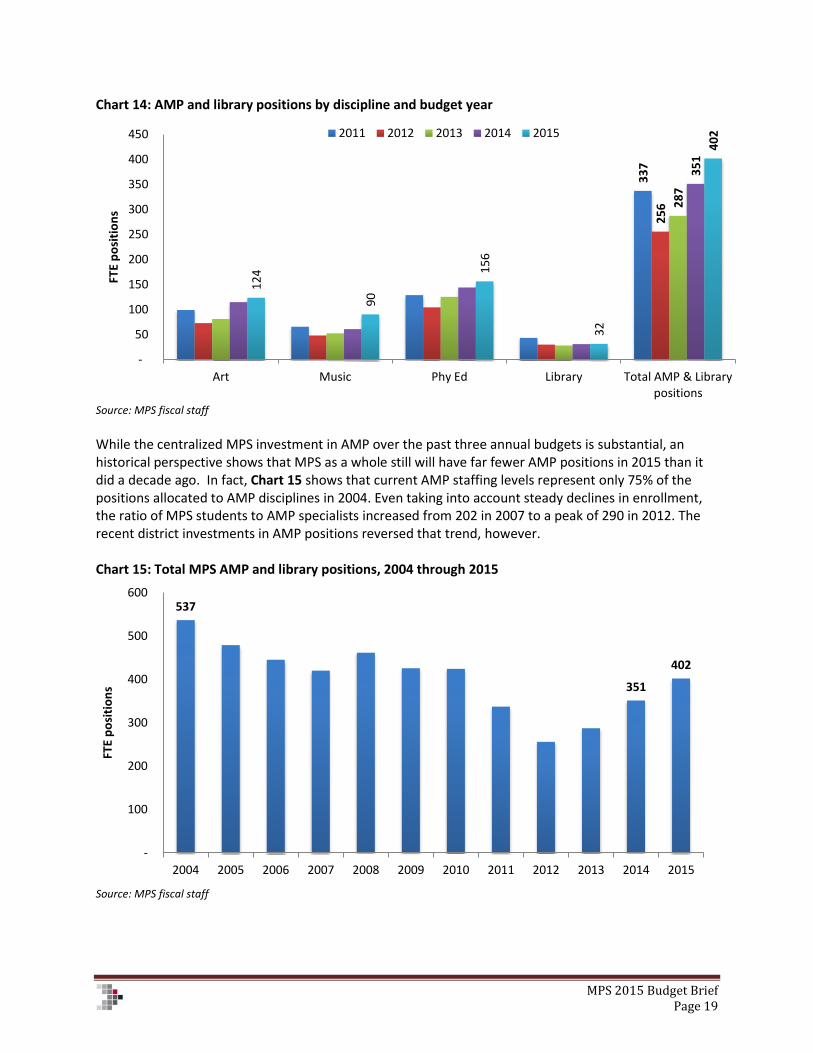
While the centralized MPS investment in AMP over the past three annual budgets is substantial, an historical perspective shows that MPS as a whole still will have far fewer AMP positions in 2015 than it did a decade ago. In fact, Chart 15 shows that current AMP staffing levels represent only 75% of the positions allocated to AMP disciplines in 2004. Even taking into account steady declines in enrollment, the ratio of MPS students to AMP specialists increased from 202 in 2007 to a peak of 290 in 2012. The recent district investments in AMP positions reversed that trend, however. Chart 15: Total MPS AMP and library positions, 2004 through 2015
Source: MPS fiscal staff
33
7
25
6 28
7
35
1
12
4
90
15
6
32
40
2
-
50
100
150
200
250
300
350
400
450
Art Music Phy Ed Library Total AMP & Library positions
FTE
po
siti
on
s
2011 2012 2013 2014 2015
537
351
402
-
100
200
300
400
500
600
2004 2005 2006 2007 2008 2009 2010 2011 2012 2013 2014 2015
FTE
po
siti
on
s

MPS 2015 Budget Brief Page 20
School Support Teachers
The 2015 budget also builds greater support for teachers by placing a school support teacher in every school to help support professional development and identify and enhance teaching expertise. This effort is similar to a much smaller, less direct operation involving district coaches who were centrally located in prior years. The 2015 budget provides 117 FTEs for this purpose, an increase of 40 positions over the previous district coach operation, which is eliminated in 2015. This strategy is intended to address the substantial number of new teachers who have entered district employment in recent years, as those teachers have fewer years of experience than those that recently retired or resigned. In 2015, all schools will receive an additional 0.5 or 1.0 FTE school support teacher position, depending on its student enrollment and student performance. According to the district, schools with student enrollment over 300 students and any school designated by the state as low-performing will receive the 1.0 FTE position. Schools with lower enrollment will receive a 0.5 FTE position.
Parent Coordinators
The proposed budget also puts an enhanced emphasis on parent coordination and involvement, reflecting the district’s assertion that parents are a major partner in improving student achievement. The proposal includes a total of 98 FTE parent coordinator paraprofessional positions (0.75 FTE positions per school) that will work 30 hours per week to build greater relationships between families and their schools. In prior years, MPS relied on two centrally located positions within its Family Services division to provide parent engagement support. The 2015 proposal represents a significant boost in this regard.

MPS 2015 Budget Brief Page 21
CONCLUSION
MPS’ proposed 2015 budget is largely a “good news” document that reflects the district’s astonishing success in reducing fringe benefit costs and that avoids staffing reductions and other cuts in school operations that have detracted from educational quality in the past. In fact, despite the district’s stagnant revenue base, there is also room to invest in quality improvements in areas like the arts and teacher development. Yet, despite another year of relative budget calm, a series of unsettling questions remains. Not the least of those is whether the modest quality improvement initiatives are enough for a school district that continues to struggle with poor academic performance and the huge range of challenges associated with educating students who are predominately low-income and disadvantaged, with a high rate of mobility. This budget brief – as well as our 2012 analysis of MPS’ fiscal condition – shows that in light of the district’s overwhelming dependence on state and federal revenues and policies that are largely beyond its control, identifying resources for strategies aimed at boosting educational services will be exceedingly difficult. Indeed, one need only look at how MPS leaders used the tremendous financial gains realized from the district’s fringe benefit changes to get a sense of that challenge. While those gains were responsibly employed to plug annual structural holes and reduce long-term liabilities – thus placing MPS on much firmer financial ground for the short-term – the district still has faced tight annual budgets that leave little room for new investment. Meanwhile, despite being cut in half, the district’s OPEB liability remains a daunting threat. A key question is whether MPS administrators and school board directors can continue to identify ways to curb fringe benefit spending without sacrificing teacher quality. The district’s five-year projections show that projected inflationary health care increases are likely to eat up any projected increases in revenue, thus precluding the district’s ability to increase teacher salaries or pursue strategies to improve competitiveness and boost enrollment. Finding ways to limit those increases – or somehow enhance enrollment – would appear to be imperative both for future financial stability and quality improvement. Overall, MPS leaders should be proud of their efforts to hold the line on school operations cuts and re-invest in specialty areas and teacher supports in the face of stagnant revenues and huge workforce challenges. The proposed budget continues those efforts and is good news for the next school year, though monumental long-term financial challenges remain.


