2015 YEAR IN REVIEW P U B L I S H E D J A N U A R Y 2 0 1 6
• Office transaction volume came in at $146b in 2015 with volume up 16% yoy. The sale of individual assets however was up only 10% yoy. It was the sale of portfolios and entity-level deals providing the bulk of the lift for 2015. Volume for these mega-deals grew 36% yoy on volume of $40.6b.
• As will be noted in more depth on page 5 of this report, the headline story for 2015 was the growth in foreign buyers. With such investors active in the year, mega-deals almost had to be the thing for the year given the sheer quantity of capital that many of these investors still have on hand to deploy.
• Initial estimates of the Moody’s/RCA CPPITM sug-gest that prices increased 14% yoy. This gain is healthy but growth was stronger in both 2013 and 2014, 19% and 17% respectively. With cap rates for the highest quality assets seeming to hit a floor, price growth is beginning to moderate.
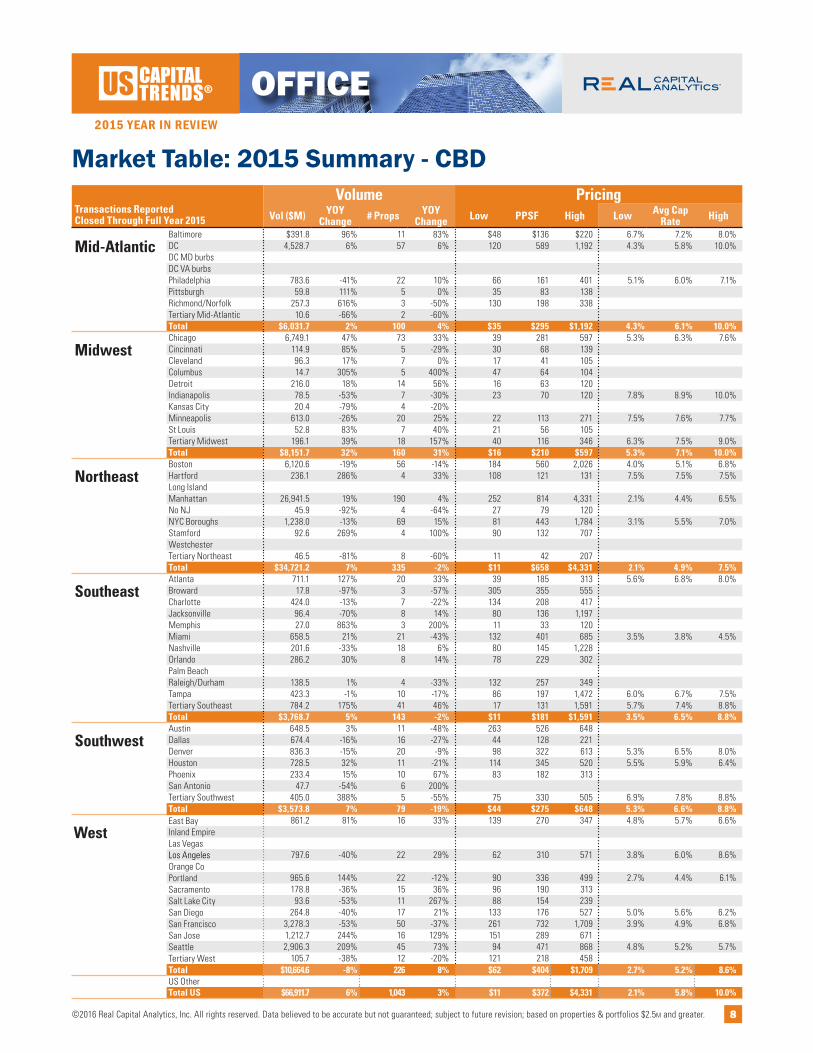
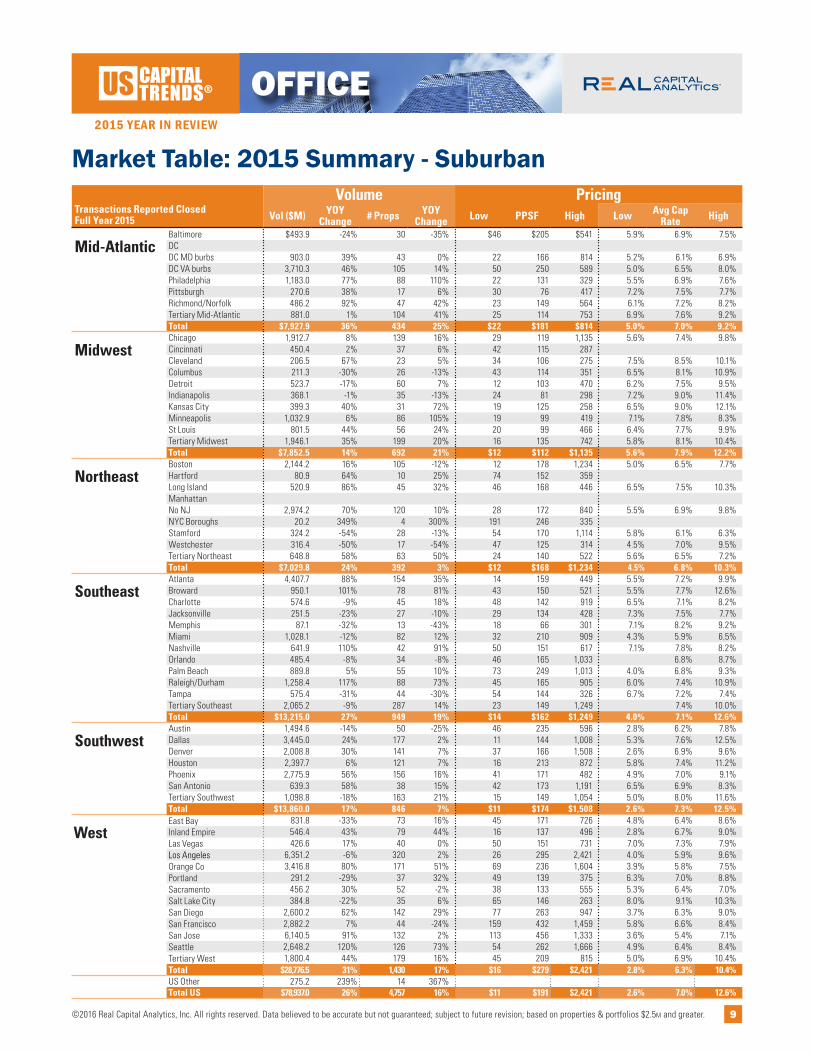
• Deal volume grew at a faster pace for suburban assets in 2015. Sales of suburban assets totaled $78.9b, a figure up 26% yoy. By contrast, the sale of CBD assets grew only 6% yoy on sales of $66.9b. Cap rates for the highest quality assets in CBD sub-markets seem to have hit a floor in 2014 while in suburban locales, cap rate compression has contin-ued even for the highest quality suburban assets.
• Still, while deal volume was positive for the year overall, trends were weaker into the second half of the year. Overall deal volume for H2’15 grew a mere 1% from H2’14 with uncertainty growing through-out 2015.
Office 2015 Year in ReviewOffice Annual Sales Volume
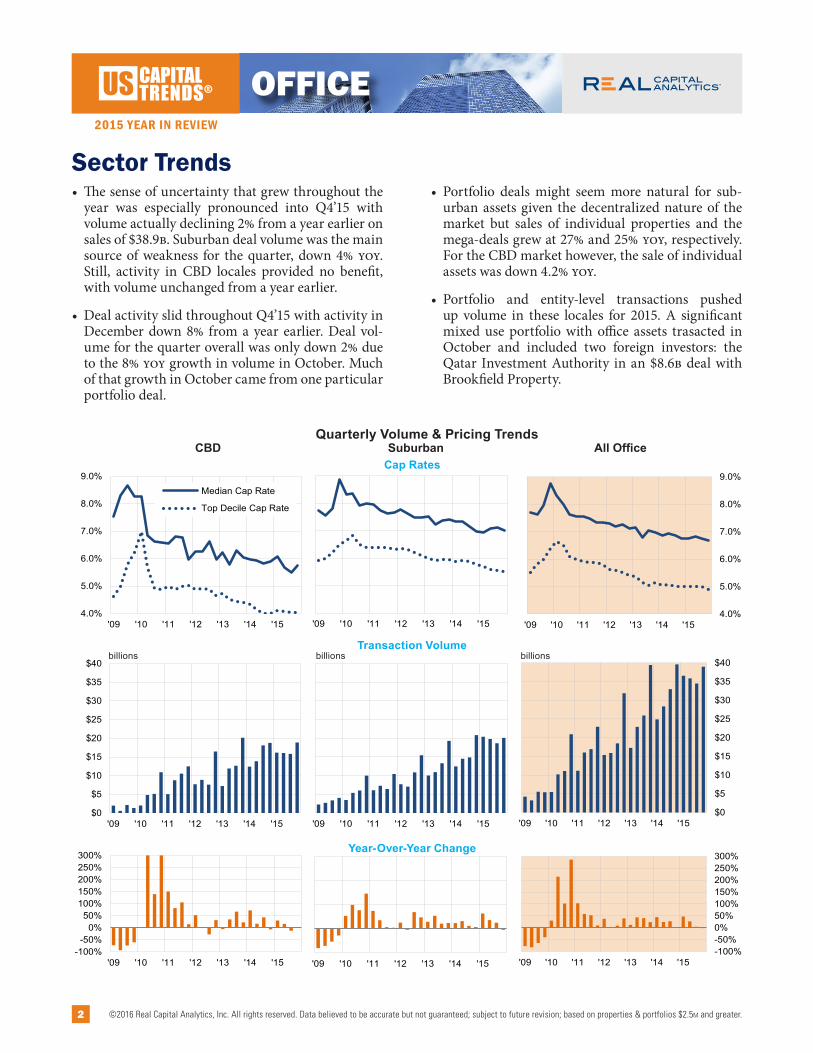
Sector Trends • The sense of uncertainty that grew throughout the
year was especially pronounced into Q4’15 with volume actually declining 2% from a year earlier on sales of $38.9b. Suburban deal volume was the main source of weakness for the quarter, down 4% yoy. Still, activity in CBD locales provided no benefit, with volume unchanged from a year earlier.
• Deal activity slid throughout Q4’15 with activity in December down 8% from a year earlier. Deal vol-ume for the quarter overall was only down 2% due to the 8% yoy growth in volume in October. Much of that growth in October came from one particular portfolio deal.
• Portfolio deals might seem more natural for sub-urban assets given the decentralized nature of the market but sales of individual properties and the mega-deals grew at 27% and 25% yoy, respectively. For the CBD market however, the sale of individual assets was down 4.2% yoy.
• Portfolio and entity-level transactions pushed up volume in these locales for 2015. A significant mixed use portfolio with office assets trasacted in October and included two foreign investors: the Qatar Investment Authority in an $8.6b deal with Brookfield Property.
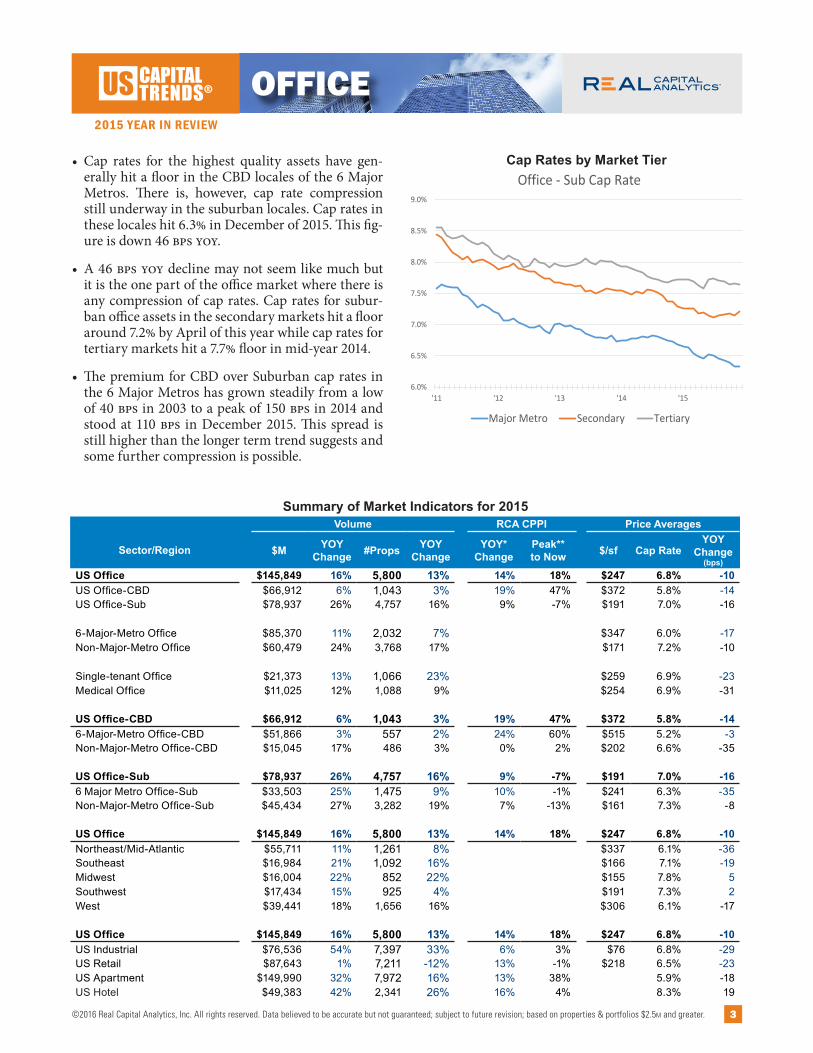
• Cap rates for the highest quality assets have gen-erally hit a floor in the CBD locales of the 6 Major Metros. There is, however, cap rate compression still underway in the suburban locales. Cap rates in these locales hit 6.3% in December of 2015. This fig-ure is down 46 bps yoy.
• A 46 bps yoy decline may not seem like much but it is the one part of the office market where there is any compression of cap rates. Cap rates for subur-ban office assets in the secondary markets hit a floor around 7.2% by April of this year while cap rates for tertiary markets hit a 7.7% floor in mid-year 2014.
• The premium for CBD over Suburban cap rates in the 6 Major Metros has grown steadily from a low of 40 bps in 2003 to a peak of 150 bps in 2014 and stood at 110 bps in December 2015. This spread is still higher than the longer term trend suggests and some further compression is possible.
Summary of Market Indicators for 2015Volume RCA CPPI Price Averages
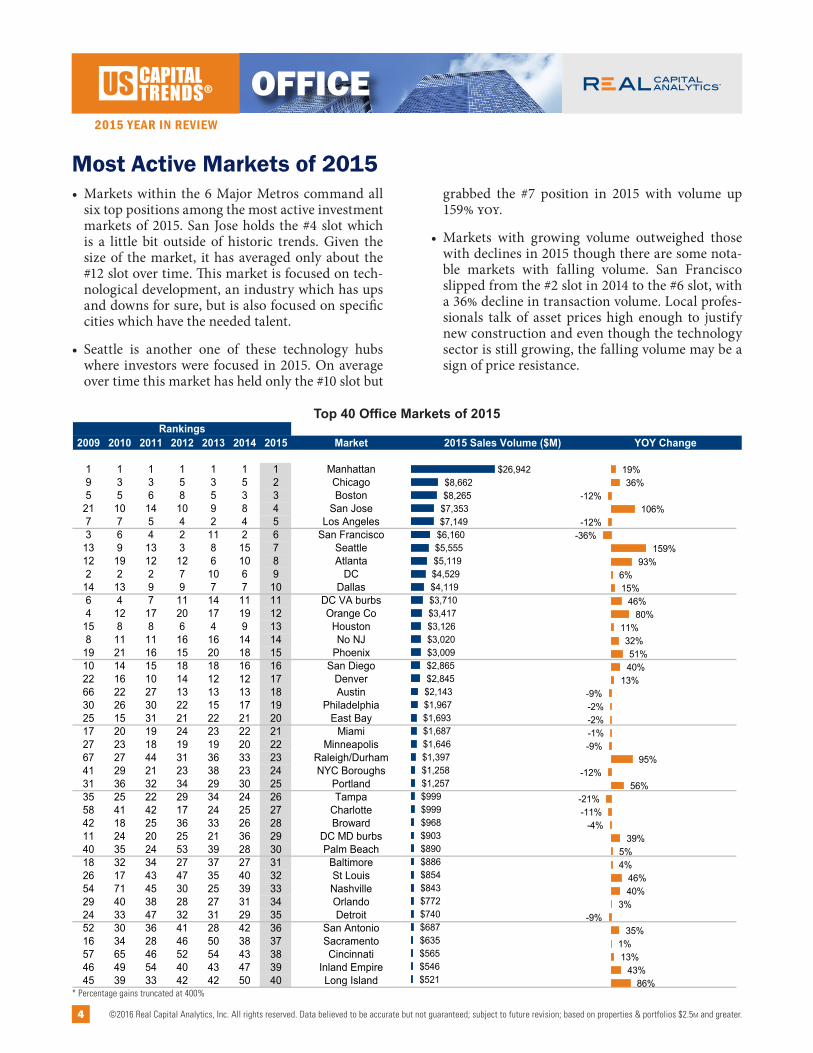
Most Active Markets of 2015• Markets within the 6 Major Metros command all
six top positions among the most active investment markets of 2015. San Jose holds the #4 slot which is a little bit outside of historic trends. Given the size of the market, it has averaged only about the #12 slot over time. This market is focused on tech-nological development, an industry which has ups and downs for sure, but is also focused on specific cities which have the needed talent.
• Seattle is another one of these technology hubs where investors were focused in 2015. On average over time this market has held only the #10 slot but
grabbed the #7 position in 2015 with volume up 159% yoy.
• Markets with growing volume outweighed those with declines in 2015 though there are some nota-ble markets with falling volume. San Francisco slipped from the #2 slot in 2014 to the #6 slot, with a 36% decline in transaction volume. Local profes-sionals talk of asset prices high enough to justify new construction and even though the technology sector is still growing, the falling volume may be a sign of price resistance.
* CPPI Year-over-year changes measure price movement between Q4’13 and Q4’14; ** Peak defined as Q4’07. 2014 RCA CPPI results are preliminary.
Cross Border Capital Summary
$0
$5
$10
$15
$20
$25
$30
'05 '06 '07 '08 '09 '10 '11 '12 '13 '14 '15
Canada Europe Middle EastAsia Australia Latin America
billions
$0 $1 $2 $3 $4 $5 $6 $7
Canada
Qatar
Germany
Norway
South Korea
China
Japan
Switzerland
Australia
Hong Kong
Top 10 Cross Border Office Investors ($B)Market Acq
(in $M)#
Props% of
Total Acq1 Manhattan $12,070.4 38 34%2 DC $2,524.0 17 54%3 Boston $2,308.3 16 24%4 Seattle $1,267.0 9 23%5 Chicago $982.0 14 11%6 San Francisco $978.4 11 13%7 DC VA burbs $950.8 6 23%8 Atlanta $930.3 12 15%9 Los Angeles $856.3 16 12%10 Houston $700.5 5 25%11 San Jose $466.1 3 5%12 Portland $400.2 3 37%13 Miami $396.1 12 31%14 Phoenix $340.6 9 9%15 Denver $307.2 8 10%16 Dallas $304.8 5 7%17 Philadelphia $207.7 24 10%18 East Bay $177.3 1 11%19 Austin $155.1 3 8%20 Tertiary West $142.2 3 10%
• Canadian investors were big buyers of office prop-erty in 2015. Deal volume from Canadian investors came in at $7.4b in 2015. Still, despite their proxim-ity and familiarity with the US market, Canadian investors were not the leading foreign buyers in 2015.
• It was the European investors who led on office purchases in 2015, accounting for deals totaling $8.5b. Norges Bank (NBIM) was the single largest European investor in the office market in 2015 with deals totaling $2.5b. This activity is more than the sum total of deal volume from all Australian and Latin American investors.
• Much of the attention on foreign investors in the business press has been focused on Chinese inves-tors but Asian investors overall were only the 3rd largest group of investors in US office properties in 2015. This group of investors were behind $5.0b in deals, down from $5.6 B in 2014. The single biggest deal from an Asian buyer involved Gaw Capital out of Hong Kong. Surprisingly, the biggest deal was in Seattle which is growing in importance as a leading market for institutional investment.
Cross Border Capital by Region of Origin: US Office Investment
Top Countries for Cross Border Office Investment ($B)
Top Market Destinations for Cross Border Office Investment
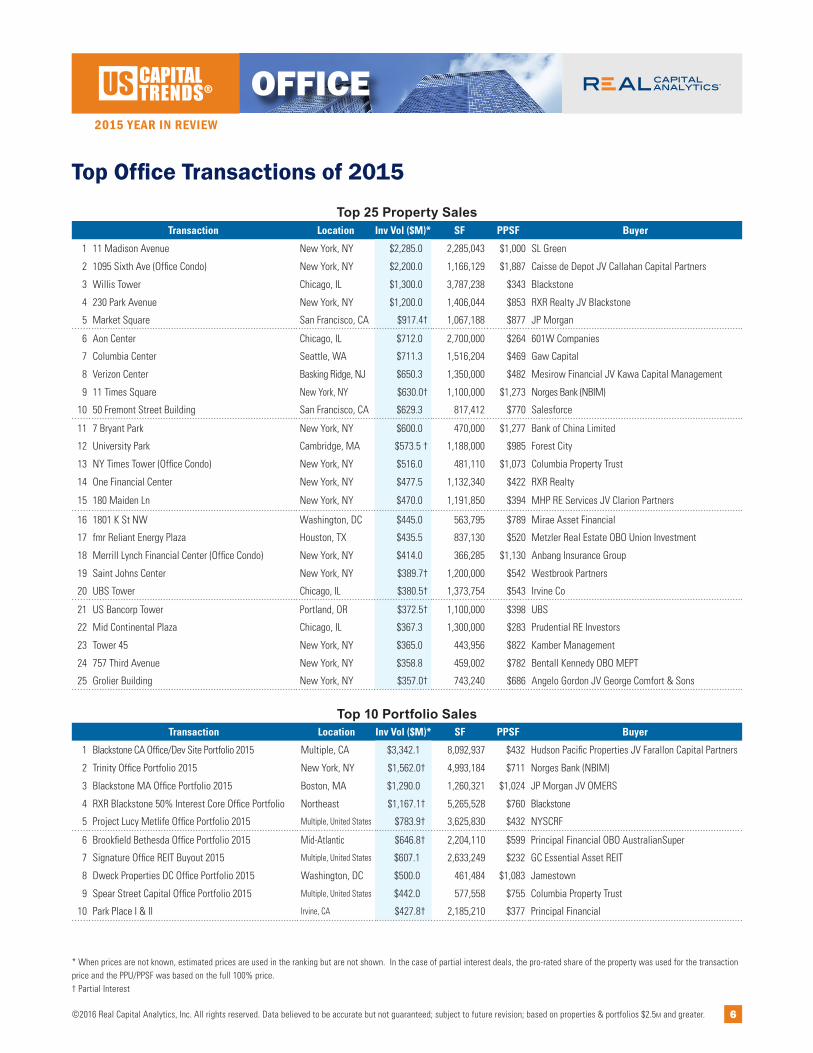
7 Signature Office REIT Buyout 2015 Multiple, United States $607.1 2,633,249 $232 GC Essential Asset REIT
8 Dweck Properties DC Office Portfolio 2015 Washington, DC $500.0 461,484 $1,083 Jamestown
9 Spear Street Capital Office Portfolio 2015 Multiple, United States $442.0 577,558 $755 Columbia Property Trust
10 Park Place I & II Irvine, CA $427.8† 2,185,210 $377 Principal Financial
* When prices are not known, estimated prices are used in the ranking but are not shown. In the case of partial interest deals, the pro-rated share of the property was used for the transaction price and the PPU/PPSF was based on the full 100% price. † Partial Interest
Methodology Rankings are based on the pro-rated share of the total property or portfolio value. Transactions $2.5M and greater. See notes page for full methodology.
*ranked by investment volume
(in Billions)Top Buyers by Region*
Mid-Atlantic Jamestown
AustralianSuperMirae Asset Financial
JP MorganPrudential RE Investors
Midwest Blackstone
601W CompaniesVentas
Select Income REITLone Star
Northeast Qatar Investment Authority
SL GreenBlackstone
Caisse de DepotCallahan Capital Partners
Southeast Starwood Capital Group
Vanderbilt Capital AdvisorsTrinity Partners
Building & Land TechnologyADIC
Southwest Select Income REIT
Accesso Partners LLCUnion InvestmentBank of America
CBRE Global Investors
West Hudson Pacific PropertiesFarallon Capital Partners
Methodology Full credit assigned to sellers’ representative. When two brokers represent same seller, both sellers’ representatives assigned full credit. For partial-interest, rankings are based on the pro-rated share of the total property or portfolio value. For more information on rankings please visit www.rcanalytics.com/Misc/Brokers_Ranking_Methodology.pdf
Mid-AtlanticEastdil
Cushman & Wakefield
CBRE
DTZ
JLL
MidwestEastdil
JLL
CBRE
HFF
Cushman & Wakefield
NortheastEastdil
CBRE
Cushman & Wakefield
JLL
Savills Studley
SoutheastCBRE
Eastdil
HFF
Cushman & Wakefield
JLL
SouthwestCBRE
HFF
Eastdil
Cushman & Wakefield
JLL
WestEastdil
CBRE
HFF
Cushman & Wakefield
JLL
Suburban CBD All Offi ce
$0 $8 $16
ONCORTrinity Partners
Coldwell BankerHealth America Realty Group
Mission Capital AdvisorsBrown Gibbons Lang & Co
Voit RE ServicesLee & Associates
Savills StudleyNAI Global
SVNStan Johnson Co
C-III Realty ServicesMadison Partners
Avison YoungTranswestern
Marcus & MillichapNewmark Grubb Knight Frank
Colliers InternationalDTZJLL
HFFCushman & Wakefield
EastdilCBRE
$0 $11 $22
Pinnacle RealtyS Charatan RealtyThe Dartmouth Co
The Macke CompanyThe Alter GroupColdwell BankerKidder MathewsMeridian Capital
Marcus & MillichapAckman-Ziff
Avison YoungTranswestern
Ripco Real EstatePrince Realty Advisors
NAI GlobalEastern Consolidated
Newmark Grubb Knight FrankDTZ
Colliers InternationalSavills Studley
HFFJLL
Cushman & WakefieldCBREEastdil
$0 $16 $32
Coldwell BankerAckman-Ziff
Brown Gibbons Lang & CoVoit RE Services
Ripco Real EstateLee & Associates
Prince Realty AdvisorsSVN
Eastern ConsolidatedC-III Realty Services
Stan Johnson CoMadison Partners
NAI GlobalAvison Young
Savills StudleyTranswestern
Marcus & MillichapNewmark Grubb Knight Frank
Colliers InternationalDTZJLL
HFFCushman & Wakefield
CBREEastdil
0 370 740
C-III Realty ServicesStan Johnson Co
NAI GlobalTranswestern
SVNAvison Young
EastdilDTZ
Newmark Grubb Knight FrankColliers International
JLLHFF
Marcus & MillichapCushman & Wakefield
CBRE
0 60 120
SVNEastern Consolidated
Avison YoungTranswestern
Savills StudleyNAI Global
Marcus & MillichapDTZ
Colliers InternationalNewmark Grubb Knight Frank
HFFJLL
Cushman & WakefieldEastdilCBRE
0 430 860
C-III Realty ServicesStan Johnson Co
NAI GlobalTranswestern
SVNAvison Young
DTZNewmark Grubb Knight Frank
Colliers InternationalJLL
EastdilHFF
Marcus & MillichapCushman & Wakefield
CBRE
*The transaction volume of brokerage firms that have merged are left unconsolidated before the merger date and are attributed to the surviving or newly formed company after the merger date.
Top 25 by Investment Volume(in Billions)
Top Office Brokers of 2015ABOUT REAL CAPITAL ANALYTICSReal Capital Analytics, Inc (RCA) is an indepen-dent data and analytics firm focused exclusively on the capital investment markets for commercial real estate. RCA offers the most in-depth, comprehensive and current information of activ-ity in the industry. Formed in 2000, RCA has offices in New York City, San Jose, and London. In addition to collecting transactional informa-tion for property sales and financing, RCA interprets the data includ-ing capitalization rates, market trends, pricing and sales volume. The firm publishes a series of Capital Trends reports and offers an online service that provides real-time, global transactional market informa-tion. For more information, visit: www.rcanalytics.com.
Information presented by RCA has been compiled from sources believed to be reliable. While we have no reason to doubt its accuracy, RCA makes no representation or warranty regarding the information. The information is provided as is without warranties of any kind, express or implied, and may be subject to material revisions.
NOTES & METHODOLOGYThe information maintained by RCA and presented in this report encom-passes markets nationally and includes only properties or portfolios $2.5M or greater. Readers should note that there is substantial investment activ-ity, largely local in nature, that falls below this threshold and is not cap-tured in this report.
Records are maintained for transactions that represent the transfer of a controlling interest in a property or portfolio of properties that are $2.5M or greater. Transactions are assumed to be fee simple; lease-hold and commercial condominium interests are noted, if known. Transactions include both real estate asset sales as well as transac-tions involving real estate operating and investment entities. Thus, for example, merger and acquisition activity among entire REITs or other real estate entities is included in this report unless noted oth-erwise. Sales of partial interest transactions will receive credit and be valued at the pro-rated share.
For this report, market classifications are defined as followed:
Major Metros: Boston, Chicago, DC Metro, LA Metro, NYC Metro and SF Metro
Secondary: Atlanta, Austin, Charlotte, Cincinnati, Cleveland, Colum-bus, Dallas, Baltimore, Denver, Detroit, Houston, Indianapolis, Jack-sonville, Kansas City, Las Vegas, Memphis, Milwaukee, Minneapolis, Nashville, Norfolk, Orlando, Philly Metro, Phoenix, Pittsburg, Portland, Raleigh/Durham, Sacramento, Salt Lake City, San Antonio, San Diego, Seattle, South Florida, St Louis and Tampa.
Tertiary: All other US markets.
Commercial Property Price Indices (RCA CPPI™): CPPI use advanced repeat-sale regression (RSR) methodology, which uses quali-fied repeat-sale observations to measure price change in commercial real estate. All CPPI are based on similar index methodology devel-oped by RCA and further information is available on our website. The US suite of CPPI includes 23 Moody’s/RCA CPPI national benchmarks and over 200 RCA US CPPI for regions, markets and property niches.
The Moody’s /RCA CPPI suite includes national composites for all property types and all commercial. Each of the apartment, hotel, CBD office, suburban office, retail and industrial sector indices are compos-ites with each based on Major Metro and Non-Major Metro indices.
The RCA US CPPI were developed and published by Real Capital Ana-lytics to complement the Moody’s/RCA CPPI but are not maintained, reviewed, endorsed, or otherwise affiliated with Moody’s Investors Service or its affiliates.
Ranking Methodology: Based on transactions $2.5M and greater. Full dollar value is assigned to each buyer, seller, or broker in joint venture transactions. Partial interest sales are included at the pro-rated share of the total property or portfolio value.Trend analysis may exclude certain transactions that exceed 5% of the data sample or that may otherwise skew results. A complete glossary and methodology can be found at www.rcanalytics.com.
ABOUT REAL CAPITAL ANALYTICSReal Capital Analytics, Inc (RCA) is an indepen-dent data and analytics firm focused exclusively on the capital investment markets for commercial real estate. RCA offers the most in-depth, comprehensive and current information of activ-ity in the industry. Formed in 2000, RCA has offices in New York City, San Jose, and London. In addition to collecting transactional informa-tion for property sales and financing, RCA interprets the data includ-ing capitalization rates, market trends, pricing and sales volume. The firm publishes a series of Capital Trends reports and offers an online service that provides real-time, global transactional market informa-tion. For more information, visit: www.rcanalytics.com.
Information presented by RCA has been compiled from sources believed to be reliable. While we have no reason to doubt its accuracy, RCA makes no representation or warranty regarding the information. The information is provided as is without warranties of any kind, express or implied, and may be subject to material revisions.
NOTES & METHODOLOGYThe information maintained by RCA and presented in this report encom-passes markets nationally and includes only properties or portfolios $2.5M or greater. Readers should note that there is substantial investment activ-ity, largely local in nature, that falls below this threshold and is not cap-tured in this report.
Records are maintained for transactions that represent the transfer of a controlling interest in a property or portfolio of properties that are $2.5M or greater. Transactions are assumed to be fee simple; lease-hold and commercial condominium interests are noted, if known. Transactions include both real estate asset sales as well as transac-tions involving real estate operating and investment entities. Thus, for example, merger and acquisition activity among entire REITs or other real estate entities is included in this report unless noted oth-erwise. Sales of partial interest transactions will receive credit and be valued at the pro-rated share.
For this report, market classifications are defined as followed:
Major Metros: Boston, Chicago, DC Metro, LA Metro, NYC Metro and SF Metro
Secondary: Atlanta, Austin, Charlotte, Cincinnati, Cleveland, Colum-bus, Dallas, Baltimore, Denver, Detroit, Houston, Indianapolis, Jack-sonville, Kansas City, Las Vegas, Memphis, Milwaukee, Minneapolis, Nashville, Norfolk, Orlando, Philly Metro, Phoenix, Pittsburg, Portland, Raleigh/Durham, Sacramento, Salt Lake City, San Antonio, San Diego, Seattle, South Florida, St Louis and Tampa.
Tertiary: All other US markets.
Commercial Property Price Indices (RCA CPPI™): CPPI use advanced repeat-sale regression (RSR) methodology, which uses quali-fied repeat-sale observations to measure price change in commercial real estate. All CPPI are based on similar index methodology devel-oped by RCA and further information is available on our website. The US suite of CPPI includes 23 Moody’s/RCA CPPI national benchmarks and over 200 RCA US CPPI for regions, markets and property niches.
The Moody’s /RCA CPPI suite includes national composites for all property types and all commercial. Each of the apartment, hotel, CBD office, suburban office, retail and industrial sector indices are compos-ites with each based on Major Metro and Non-Major Metro indices.
The RCA US CPPI were developed and published by Real Capital Ana-lytics to complement the Moody’s/RCA CPPI but are not maintained, reviewed, endorsed, or otherwise affiliated with Moody’s Investors Service or its affiliates.
Ranking Methodology: Based on transactions $2.5M and greater. Full dollar value is assigned to each buyer, seller, or broker in joint venture transactions. Partial interest sales are included at the pro-rated share of the total property or portfolio value.Trend analysis may exclude certain transactions that exceed 5% of the data sample or that may otherwise skew results. A complete glossary and methodology can be found at www.rcanalytics.com.