11
2015 rental rates surveyc&a
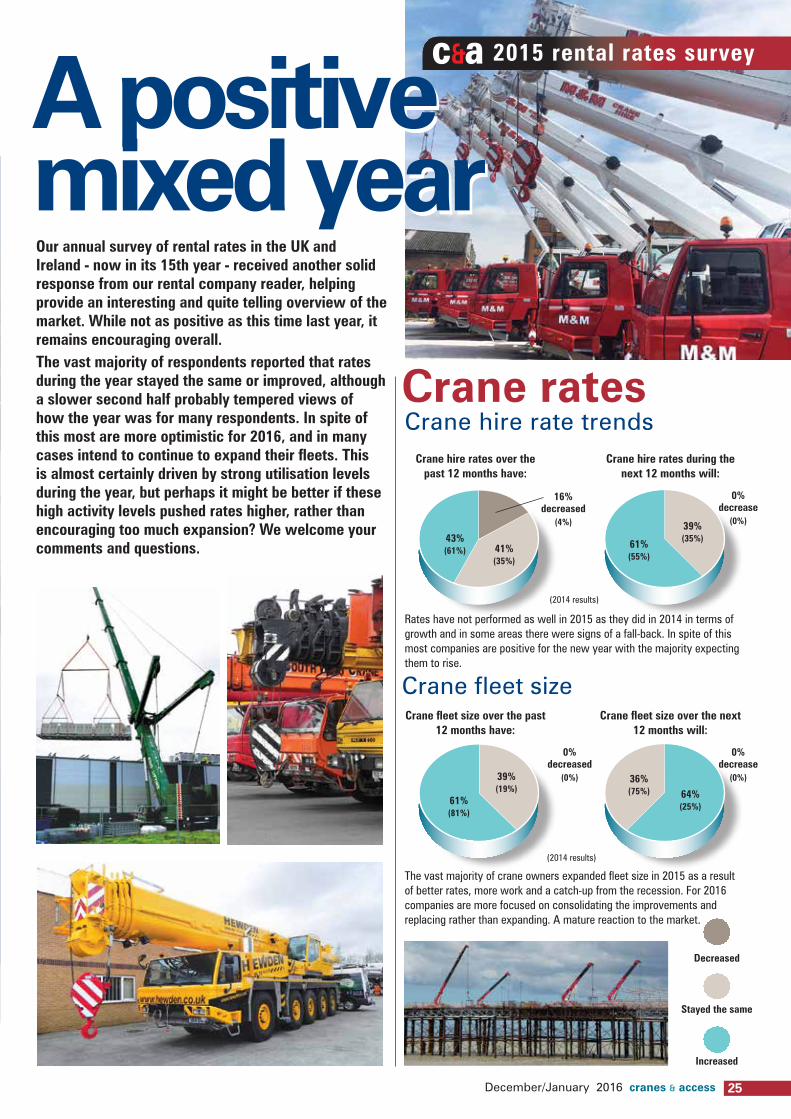
our annual survey of rental rates in the uK and ireland - now in its 15th year - received another solid response from our rental company reader, helping provide an interesting and quite telling overview of the market. While not as positive as this time last year, it remains encouraging overall.The vast majority of respondents reported that rates during the year stayed the same or improved, although a slower second half probably tempered views of how the year was for many respondents. in spite of this most are more optimistic for 2016, and in many cases intend to continue to expand their fleets. This is almost certainly driven by strong utilisation levels during the year, but perhaps it might be better if these high activity levels pushed rates higher, rather than encouraging too much expansion? We welcome your comments and questions.
Crane ratesCrane hire rate trends
Crane fleet size
crane hire rates over the past 12 months have:
crane fleet size over the past 12 months have:
16% decreased
(4%)
0% decreased
(0%)
(2014 results)
(2014 results)
0% decrease
(0%)
0% decrease
(0%)
crane hire rates during the next 12 months will:
crane fleet size over the next 12 months will:
Rates have not performed as well in 2015 as they did in 2014 in terms of growth and in some areas there were signs of a fall-back. In spite of this most companies are positive for the new year with the majority expecting them to rise.
The vast majority of crane owners expanded fleet size in 2015 as a result of better rates, more work and a catch-up from the recession. For 2016 companies are more focused on consolidating the improvements and replacing rather than expanding. A mature reaction to the market.
Decreased
Stayed the same
increased
41% (35%)
39% (19%) 64%
(25%)
43% (61%)
61% (55%)
61% (81%)
39% (35%)
36% (75%)
A positive mixed yearA positive mixed year
25December/January 2016 cranes & access

Weekly rates for tower cranesflat tops and saddle jibs Average lowest Highest ideal
Less than 70t/m £623 £600 £750 £850
120t/m £1,147 £900 £1,200 £1,350
200t/m £1,469 £1,350 £1,500 £1,650
300t/m £2,061 £1,500 £2,250 £2,312
luffers Average lowest Highest ideal
Less than 70t/m £1,371 £1,200 £1,600 £1,530
100t/m £1,628 £1,450 £2,100 £2,131
180t/m £2,250 £2,000 £2,750 £2,730
300t/m £2,666 £2,500 £3,600 £4,700
Self erectors Average lowest Highest ideal
Self Erectors £823 £675 £995 £1,022
2015 rental rates survey c&a
crane size Average lowest Highest ideal
Under 30 tonnes £476 £400 £510 £515
30 to 45 tonnes £527 £440 £600 £588
50 to 65 tonnes £632 £600 £680 £700
70 to 85 tonnes £787 £700 £880 £846
95 to 125 tonnes £1,170 £980 £1,500 £1,408
135 to 200 tonnes £2,163 £1,800 £2,700 £2,451
210 to 350 tonnes £3,661 £2,500 £5,000 £3,420
350 to 600 tonnes £4,624 £4,250 £5,500 £8,219
Over 600 tonnes £15,293 £14,500 £17,500 £18,210
Mobile Tower (4 to 5 axles) £1,240 £1,000 £1,500 £1,600
Mobile Tower (6 to 7 axles) £1,983 £1,850 £2,100 £2,850
crane size - operated Average lowest Highest ideal
Up to 50 tonnes £2,250 £1,950 £2,750 £3,225
50 to 60 tonnes £1,650 £1,600 £1,700 £2,038
70 to 80 tonnes £2,978 £1,850 £2,750 £3,720
90 to 100 tonnes £2,773 £2,250 £3,210 £4,500
120 to 150 tonnes £3,209 £2,950 £3,750 £5,920
180 to 250 tonnes £5,316 £5,000 £5,500 £6,000
crane size Average lowest Highest ideal
Pick & Carry £1,246 £500 £2,300 £1,550
Spider cranes (< 5 tonnes) £1,472 £750 £2,450 £1,800
Spider cranes (> 5 tonnes) £1,789 £950 £2,650 £2,100
up down same new category
Crane rental rates
Utilisation and percentage of initial cost
Daily rates for mobile cranes
Mobile cranes
Other cranes
Weekly rates for crawler cranes
Weekly rates of other cranes
utilisation Average rate as % of initial cost Average lowest Highest
Under 30 tonnes 69% 20% 85% 0.8%
30 to 45 tonnes 79% 70% 85% 0.8%
50 to 65 tonnes 79% 70% 85% 0.8%
70 to 85 tonnes 70% 55% 90% 0.9%
95 to 125 tonnes 68% 55% 65% 0.8%
135 to 200 tonnes 76% 60% 85% 0.9%
210 to 350 tonnes 73% 50% 90% 0.7%
350 to 600 tonnes 80% 75% 90% •
Over 600 tonnes • • • •
Mobile Tower (4 - 5 axles) 77% 70% 50% •
Mobile Tower (6 - 7 axles) 83% 70% 90% •
utilisation Average rate as % of initial cost Average lowest Highest
Self Erectors 76% 65% 80% 0.8%
crane size
Crawler cranesutilisation Average rate as
% of initial cost Average lowest Highest
Up to 50 tonnes 78% 65% 85% 0.8%
50 to 60 tonnes 64% 50% 75% 0.7%
70 to 80 tonnes 72% 60% 80% 0.6%
90 to 100 tonnes 81% 70% 90% 0.6%
120 to 150 tonnes 83% 80% 85% 0.6%
180 to 250 tonnes 60% 50% 75% 0.4%
crane size
Tower cranesutilisation Average rate as
% of initial cost Average lowest Highest
Less than 70t/m 71% 65% 85% 0.7%
120t/m 78% 80% 85% 0.7%
200t/m 80% 75% 90% 0.5%
300t/m 80% 75% 90% 0.6%
flat tops and saddle jibs
utilisation Average rate as % of initial cost Average lowest Highest
Less than 70t/m 92% 85% 100% 0.6%
100t/m 90% 80% 95% 0.7%
180t/m 90% 85% 95% 0.7%
300t/m 75% 60% 85% 0.9%
luffers
utilisation Average rate as % of initial cost Average lowest Highest
Pick & Carry 52% 30% 80% 1.5%
Spider cranes (< 5 tonnes) 75% 55% 90% 1.2%
Spider cranes (> 5 tonnes) 81% 70% 90% 1.2%
crane type
Self erectors
From last year rates have gone
• = Insufficient Data
26 cranes & access December/January 2016

27December/January 2016 cranes & access
The JLG 530LRT
2015 rental rates surveyc&a
What percentage of your jobs are contract lifts?
Do you employ any female crane operators?
Would you recommend the crane hire industry to your children?
Who does your Thorough Examinations?
Average fleet age in years
Respondent’s comments
(2014 results)
(2014 results)
(2014 results)
(2014 results)
Little change in this area with around two thirds of all lifts remaining as pure crane hire.
Predictably the improvements in the industry and opportunities for the next few years has encouraged more companies to tick the yes box.
No change here, in spite of some positive news articles during the year about women operators. It is more down to the number of applicants, rather than a resistance from crane companies.
contract lifts
Third party
Yes
Yes
Pure crane hire
in house
no
no
33% (34%)
78% (54%)
2% (3%)
25% (28%)
67% (66%)
22% (46%)
Should cranes be subject to MOT’s?(2014 results)
A strong surge towards the Yes camp possibly due to the publicity surrounding the Baldwins corporate manslaughter trial at the time companies were responding?
Yes no
72% (59%)
28% (41%)
98% (97%)
75% (72%)
What percentage of your operators are?
(2014 results)
This now seems an almost dead question, the threat towards agency drivers seems to have shifted back towards full time operators.
employed freelance
85% (75%)
15% (25%)
Average lowest Highest
7.4 (6.7) 4 (3) 15 (12)
“A lot of cranes have been taken out of the marketplace over the past few years and this is helping with keeping rates up. Companies are still underselling themselves. How many companies charge cancellations - and do they claim them even from other crane hire companies when cross hiring?”
“Lack of even routine maintenance is an inherent problem within the industry, poor hire rates result in little available down time for machines to be worked on. Crane hire companies just don’t have the financial resources to stand the cranes down for routine maintenance to be carried out. Road accidents like the tragic 500 tonne Baldwin one will continue to happen unless some form of MOT is introduced.”
“Rates in the UK are so low and everyone wants new equipment that it’s always safety that takes a bashing. Something has to give, whilst I appreciate it’s not an excuse, owners are under pressure to stay in business and in doing so they risk compromise or at least some people in the organisation do. Main clients should stop being cheapskates and protect the industry by paying the right money.”
“Rental rates are better but still not at levels that justify the massive investment required. Crane hire companies must stop being busy fools and relying on employees to work all hours that god gives to make it work.”
“Rates are getting a little better but historically they are still ridiculous, the smarter companies are managing to make a decent return though.”


29December/January 2016 cranes & access
2015 rental rates surveyc&aPowered Access ratesRate trends
Access rates over the past 12 months have:
(2014 results)
8% decrease
(0%)
Access rates during the next 12 months will:
Rental rate growth has clearly slowed with some respondents reporting a slip back in some categories. However the vast majority report stability which is even more positive given the fact that fleets have grown and a number of rapidly growing new entrants have joined the market. The vast majority of respondents are positive for 2016 which given the slower third quarter last year is encouraging.
18% (11%)27%
(57%)38% (17%)55%
(32%)
54% (83%)
Fleet trendsfleet size over the
past 12 months have:
9% decreased
(0%)
(2014 results)
0% decrease
(3%)
fleet size over the next 12 months will:
Fleet expansion has slowed a little compared to last year, but the majority of respondents still reported further growth in 2015. A surprising 72 percent plan to continue this in 2016 in spite of the fact that only half believe there is any chance of rates improving and while a gap still exists between actual rental rates and ideal rates.
28% (18%)
28% (15%)
63% (82%) 72%
(82%)
Push around scissor lifts
Diesel/bi-energy scissor lifts
Decreased Stayed the same increased
Platform Height Average lowest Highest ideal
Push Arounds £47 £35 £70 £81
Portable £114 £52 £185 £200
Platform Height Average lowest Highest ideal
8 metres (26ft) £189 £152 £240 £202
9-10 metres (30-33ft) £223 £159 £290 £233
11-12 metres (36-42ft) £236 £165 £290 £261
13-17 metres (43-56ft) £293 £180 £350 £345
17-22 metres £296 £225 £300 £350
Over 22 metres £782 £730 £800 £899
Rough Terrain articulated boomsPlatform Height Average lowest Highest ideal
12-14 metres (39-45ft) £230 £200 £350 £291
15-16 metres (49-52ft) £257 £220 £295 £321
17-19 metres (56-62ft) £339 £235 £450 £377
20-23 metres (65-70ft) £399 £350 £590 £452
24-26 metres (80-86ft) £593 £396 £980 £783
Over 27 metres £1,212 £1,104 £1,350 £1,656
Straight telescopic boomsPlatform Height Average lowest Highest ideal
Under 17 metres (40-46ft) £228 £210 £265 £329
20-23 metres (60-70ft) £387 £300 £423 £494
24-26 metres (80-86ft) £498 £500 £570 £691
Over 27 metres £1,202 £1,025 £1,500 £1,532
Mast boomsPlatform Height Average lowest Highest ideal
8 metres £161 £155 £170 £320
10 metres £209 £160 £280 £279
Electric self-propelled booms
Platform Height Average lowest Highest ideal
Under 11 metres £237 £220 £255 £320
10-12.5 metres (32-40ft) £236 £200 £380 £290
Over 14 metre (45ft plus) £321 £240 £475 £426
up down same new category
Weekly rental rates by general categoryElectric self-propelled scissor liftsPlatform Height Average lowest Highest ideal
Under 5 metres £88 £45 £130 £109
6 metres (19/20ft) £106 £75 £150 £132
8 metres (26ft) £139 £117 £190 £168
9-10 metres (30-33ft) £141 £115 £240 £196
11-12 metres (36-39ft) £214 £170 £240 £251
13-17 metres (42-55ft) £271 £175 £480 £278
17-22 metres £528 £495 £585 £600
Over 22 metres £733 £635 £780 £833
From last year rates have gone

30 cranes & access December/January 2016
utilisation
utilisation
Average rate as % of initial cost
Average rate as % of initial cost
Average lowest Highest
Push Arounds 63% 49% 78% 1.5%
Portable 71% 60% 90% 2.2%
Average lowest Highest
8 metres 60% 45% 80% 1.1%
10 metres 71% 53% 80% 1.6%
Platform Height
Platform Height
2015 rental rates survey c&a
Platform Height Average lowest Highest ideal
12-13 metres (30-38ft) £187 £185 £320 £267
17 metres (50ft) £349 £220 £600 £333
Over 20 metres No Data No Data No Data £575
up down same new category
Weekly rental rates by general category (continued)
Trailer lifts
Spider lifts
Van mounts - Weekly rates
Truck mounts - Daily rates
Utilisation and ReturnsElectric self-propelled scissor lifts
Push around scissor lifts
Diesel bi-energy scissor lifts
Electric self-propelled booms
Mast booms
RT articulated booms
While rates have improved in 2014 it is still from a low level. Increased costs - deliveries, fuel, maintenance etc - coupled with higher prices for new machines, means that margins are still tight. Although rates are holding up, the general view is that there is still room for improvement.
Platform Height Average lowest Highest ideal
Up to 15 metres £435 £160 £600 £521
16-20 metres £663 £220 £800 £810
20-25 metres £1,122 £800 £1,920 £1,472
26-35 metres £1,789 £1,650 £1,800 £2,108
Over 35 metres £2,120 £2,000 £2,200 £2,599
Platform Height Average lowest Highest ideal
Up to 13 metres £374 £350 £410 £405
13 to 17 metres £482 £375 £550 £506
Over 17 metres £661 £625 £725 £932
Platform Height Average lowest Highest ideal
under 25 self drive £221 £154 £305 £309
22-35m with operator £397 £390 £450 £491
36-45 metres £677 £550 £900 £894
46-70 metres £1,106 £975 £1,350 £1,650
Over 70 metres £2,492 £2,250 £2,500 £3,430
utilisation
utilisation
utilisation
Average rate as % of initial cost
Average rate as % of initial cost
Average rate as % of initial cost
Average lowest Highest
Under 5 metres 71% 60% 75% 1.7%
6 metres (19/20ft) 69% 65% 75% 1.8%
8 metres (26ft) 72% 68% 78% 1.4%
9-10 metres (30-33ft) 73% 66% 80% 1.5%
11-12 metres (36-39ft) 69% 50% 81% 1.6%
13-17 metres (42-55ft) 82% 45% 90% 1.2%
17-22 metres 71% 56% 75% 1.0%
Over 22 metres 77% 75% 81% 1.0%
Average lowest Highest
8 metres (26ft) 78% 52% 78% 0.9%
9-10 metres (30-33ft) 79% 66% 87% 0.9%
11-12 metres (36-42ft) 74% 60% 82% 0.7%
13-17 metres (43-56ft) 76% 60% 88% 0.6%
17-22 metres 74% 65% 86% 0.7%
Over 22 metres 72% 60% 80% 0.8%
Average lowest Highest
Under 11 metres 76% 60% 78% 1.1%
10-12 metres (32-40ft) 74% 65% 76% 1.0%
Over 14 metre (45ft plus) 81% 68% 92% 0.9%
Platform Height
Platform Height
utilisation Average rate as % of initial cost Average lowest Highest
12-14 metres (39-45ft) 55% 30% 75% 1.2%
15-16 metres (49-52ft) 73% 50% 86% 0.9%
17-19 metres (56-62ft) 76% 60% 85% 0.8%
20-23 metres (65-70ft) 86% 68% 92% 0.6%
24-26 metres (80-86ft) 79% 57% 89% 0.6%
Over 27 metres 72% 55% 82% 1.0%
Platform Height
Platform Height
From last year rates have gone
utilisation Average rate as % of initial cost Average lowest Highest
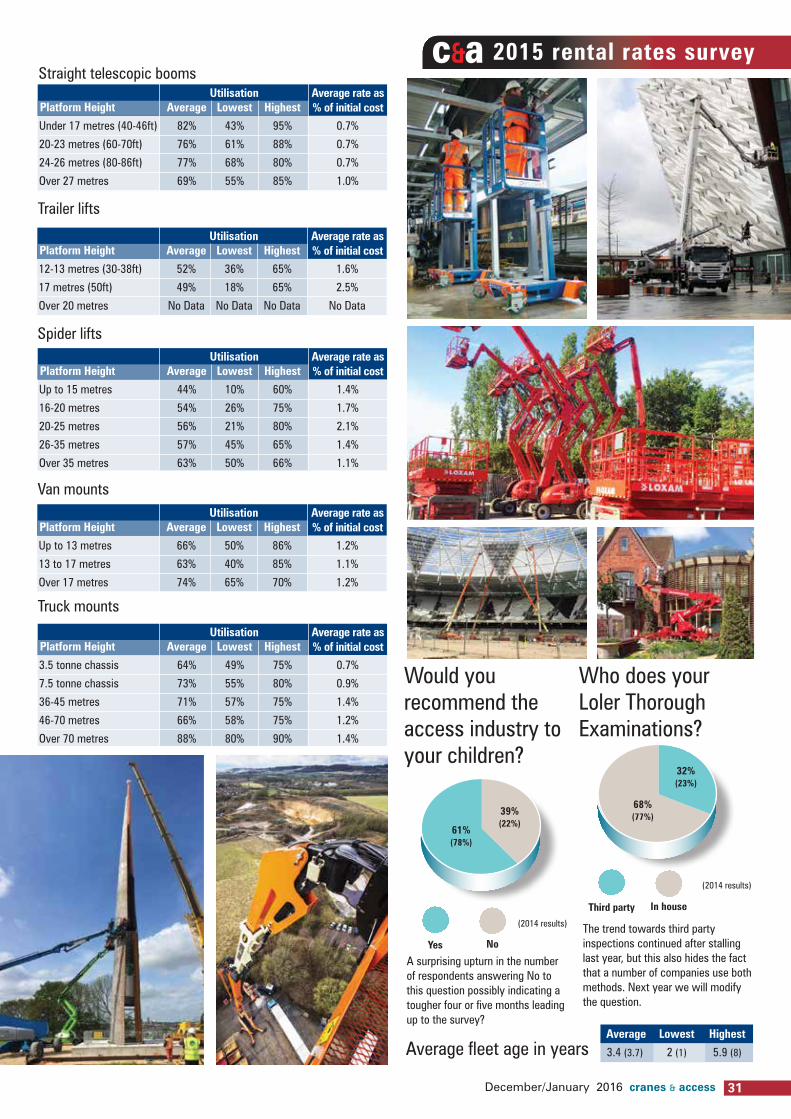
Under 17 metres (40-46ft) 82% 43% 95% 0.7%
20-23 metres (60-70ft) 76% 61% 88% 0.7%
24-26 metres (80-86ft) 77% 68% 80% 0.7%
Over 27 metres 69% 55% 85% 1.0%
Platform Height
Straight telescopic booms2015 rental rates surveyc&a
Trailer lifts
Spider lifts
Van mounts
Truck mounts
Would you recommend the access industry to your children?
Who does your Loler Thorough Examinations?
A surprising upturn in the number of respondents answering No to this question possibly indicating a tougher four or five months leading up to the survey?
Yes no
39% (22%)
61% (78%)
Third party in house
32% (23%)
68% (77%)
(2014 results)
(2014 results)
The trend towards third party inspections continued after stalling last year, but this also hides the fact that a number of companies use both methods. Next year we will modify the question.
Average fleet age in years Average lowest Highest
3.4 (3.7) 2 (1) 5.9 (8)
utilisation
utilisation
utilisation
utilisation
Average rate as % of initial cost
Average rate as % of initial cost
Average rate as % of initial cost
Average rate as % of initial cost
Average lowest Highest
Up to 15 metres 44% 10% 60% 1.4%
16-20 metres 54% 26% 75% 1.7%
20-25 metres 56% 21% 80% 2.1%
26-35 metres 57% 45% 65% 1.4%
Over 35 metres 63% 50% 66% 1.1%
Average lowest Highest
3.5 tonne chassis 64% 49% 75% 0.7%
7.5 tonne chassis 73% 55% 80% 0.9%
36-45 metres 71% 57% 75% 1.4%
46-70 metres 66% 58% 75% 1.2%
Over 70 metres 88% 80% 90% 1.4%
Average lowest Highest
12-13 metres (30-38ft) 52% 36% 65% 1.6%
17 metres (50ft) 49% 18% 65% 2.5%
Over 20 metres No Data No Data No Data No Data
Average lowest Highest
Up to 13 metres 66% 50% 86% 1.2%
13 to 17 metres 63% 40% 85% 1.1%
Over 17 metres 74% 65% 70% 1.2%
Platform Height
Platform Height
Platform Height
Platform Height
31December/January 2016 cranes & access

32 cranes & access December/January 2016
loader cranes2015 rental rates survey c&a
Telescopic handler rental ratesRate trends
in the past 12 months rental rates have:
14% decreased
(0%)
(2014 results)
0% decrease
(10%)
in the next 12 months rental rates will:
Rate growth slowed compared to last year as a large number of new machines were added and the catch-up from the slow-down came into balance. Overall it looks like rates stalled although the story is different for each size of machine. It is interesting to note that no one expects rates to fall this year, but then that was also the case last year and yet 14 percent of respondents did experience lower rates. This year more respondents are taking a pragmatic view that rates will stagnate, possibly because rates are reaching levels that our respondents consider to be ‘ideal’.
62% (66%)
73% (43%)
24% (34%)
27% (57%)
Fleet sizein the past 12 months
rental rates have:
0% decrease
(0%)
(2014 results)
0% decrease
(0%)
in the next 12 months rental rates will:
Every respondent maintained or increased fleet size this year and interestingly the average age of equipment dropped significantly, possibly due to one or two aging fleets dropping out or not responding. For 2016 the industry looks divided between maintaining fleets at this year’s levels and expanding them. No-one admitted to cut-back plans.
46% (42%)
44% (17%)
54% (58%) 56%
(83%)
Decreased Stayed the same increased
Access respondent’s comments
“Rates for big truck mounts are improving despite the increase in the machines on the market in the past two years. Hire companies that re-rent still seem to have a problem checking the rate with a specialist before quoting their customer!”
“This has been a good year - a bit soft in the autumn, but good - as we go over the winter everyone needs to hold their nerve and demand a fair price for a good service and good kit.”
“In the last four to five months there have been a number of new machines hitting the market. The UK is becoming saturated and the only thing that will suffer will be rental rates and returns, which accordingly will reflect in corners being cut from a safety and inspection perspective. Manufacturers prices are not being reflected in rental rates and the quality of salesmanship amongst the ‘Nationals’ is lamentable. Additionally, too many incredibly greedy individuals who have made their money first time around have come back into the market, which is not helping. Quality of service is everything and too many organisations are running too close to the edge and we feel that there will be casualties in the near future.”
“Some of the national companies are saying one thing and then doing the opposite, in one case they told their local staff to take the business from us no matter what the price - even if it was free.”
“There is a change going on with better construction companies beginning to understand that messing about with cut-price rates amounts to a good deal less than the cost of chopping and changing between suppliers. I hope that this is a trend that will continue and grow.”
“Machine manufacturers must not, whatever they do, bow to pressure from the slicker operators who push them for silly deals. If these guys would use the advantages of a good deal to make a bigger margin that would be fine, but they don’t they just use it to justify price cutting. And some of the worst offenders are those on their second time round who ought to know better. They are just looking for a quick buck and ego satisfaction.”
“We are not prepared to disclose our average rates or utilisation but I know that we achieve much better rates than some/most of our competitors and better rates than what we are often accused of. The market needs to up its game, I have filled in the generic questions, hope this of some use.”


lift height Average lowest Highest ideal
Under 5 metres £247 £210 £290 £303
5 to 7 metres £267 £205 £325 £330
8 to 10 metres £299 £230 £395 £335
11 to 13 metres £322 £250 £425 £399
14 to 15 metres £347 £275 £450 £429
16 to 18 metres £457 £390 £535 £529
Over 18 metres £662 £650 £700 £778
lift height Average lowest Highest ideal
Under 20 metres £721 £675 £800 £822
20 to 25 metres £1,010 £900 £1,100 £1,316
Over 25 metres £1,302 £1,150 £1,500 £1,604
up down same new category
Weekly rental rates for telehandlersFixed frame
360 degree
Utilisation and return on investment
360 degree
Fixed frame
Very little change here with around two thirds preferring to do them in-house.
This was intended to determine any trends in the type of rental company that offer telehandlers given that is not a specialist item like access and cranes. Clearly the majors such as Hewden, A-Plant and HSS influence this in that they all offer access and telehandlers. The combination of access and telehandlers is growing, probably more driven but the national generalists and telehandler rental companies getting into access, rather than access companies getting into telehandlers.
Who does your LOLER Thorough Examinations?
What other products do you provide?
Third party in house
31% (29%)
69% (71%)
(2014 results)
Average fleet age in years
Average lowest Highest
3.2 (3.1) 1 (1) 6 (12)
cranes Access General Plant Tools
9% (3.1) 36% (28) 44% (41) 21% (23)
Type Average lowest Highest
Fixed frame 2.0% 0% 5%
360 degree 9.0% 0% 20%
up down same new category
Percentage of units going out with work platform attachments:
Respondent’s commentsutilisation
utilisation
Average rate as % of initial cost
Average rate as % of initial cost
Average lowest Highest
Under 5 metres 79% 65% 95% 0.7%
5 to 7 metres 76% 70% 85% 0.8%
8 to 10 metres 78% 63% 85% 0.8%
11 to 13 metres 77% 65% 90% 0.7%
14 to 15 metres 83% 74% 95% 0.9%
16 to 18 metres 80% 75% 85% 0.8%
Over 18 metres 93% 85% 100% 1.1%
Average lowest Highest
Under 20 metres 74% 65% 80% 0.7%
20 to 25 metres 76% 70% 80% 0.8%
Over 25 metres 88% 80% 100% 0.9%
lift height
lift height
From last year rates have gone
From last year rates have gone
34 cranes & access December/January 2016
2015 rental rates survey c&a
“Business has been good this year with a lot more happening, but too many machines at the smaller end now and some companies - and they know who they are - are dropping the price to keep them busy.”
“Funny year 2015 - not bad but I’m not as optimistic as when I did this a year ago - can’t put my finger on it but maybe too many changes up in the air?”
“We have been buying teles this year and have added a good few to the fleet building it back to what we had before the crash. Rates need to go up still. We are going to add some rotos this year that’ll be interesting!”
“The big thing for next year (2016) is what happens with the big merger you have to hope it will add more stability to rates or even be a positive influence but not holding my breath.”
Comment from a contractor/reader – not sector specificI see you are looking for information on the rate guide again, I wanted to say that this is always an enjoyable read in so many ways. As an outsider which regular hires equipment I can tell you that suppliers are their own worst enemy, they don’t have enough respect for the service they provide, well some of them! We can get the same or sometimes better prices from the best players - it’s like buying a Beamer at a Lada price. Great for us but you have to worry how long they can go on like this. Great for us, but it is more important for us that they maintain the service and continuity and I am not sure that some can. Just look at some of the experimentation going on. Enough said, keep up the good work.


