22
HASBRO 2015 CORPORATE SOCIAL RESPONSIBILITY REPORT A ABOUT THIS REPORT CSR AT HASBRO PROGRESS AND HIGHLIGHTS DATA DASHBOARD 2015 REPORT UPDATE Corporate Social Responsibility
HASBRO 2015 CORPORATE SOCIAL RESPONSIBILITY REPORT A
ABOUT THIS REPORT CSR AT HASBRO PROGRESS AND HIGHLIGHTS DATA DASHBOARD
2015 REPORT UPDATE
Corporate Social Responsibility

HASBRO 2015 CORPORATE SOCIAL RESPONSIBILITY REPORT 1
ABOUT THIS REPORT CSR AT HASBRO PROGRESS AND HIGHLIGHTS DATA DASHBOARD
CONTENTS
About This Report 1
CSR at Hasbro 2
Progress and Highlights 3
Data Dashboard 12
About This ReportWelcome to our 2015 Corporate Social Responsibility
(CSR) Report Update, highlighting our progress and
goals for the calendar year 2015 (January 1, 2015 –
December 31, 2015). This CSR Report Update also
provides supplemental information about our business,
as set forth in our 2015 Annual Report. Reporting
and performance data include information on Hasbro
owned and operated facilities (offices and distribution
centers) unless stated otherwise. We remain committed
to publicly reporting on our CSR performance and
look forward to updating you further in our next, full,
Global Reporting Initiative-based CSR report, which
will be published in 2017.

HASBRO 2015 CORPORATE SOCIAL RESPONSIBILITY REPORT 2
ABOUT THIS REPORT CSR AT HASBRO PROGRESS AND HIGHLIGHTS DATA DASHBOARD
CSR at HasbroCorporate social responsibility at Hasbro is powered by a simple belief that every day is a chance to be better. The things we love most about play — joy, creativity and problem solving — inspire us to make a positive and enduring difference in the world. Thinking and acting responsibly guides us toward smarter ways of doing business. It unlocks new opportunities to improve how we design, create, make and market our iconic brands.
Our deep commitment to CSR reflects our desire to help build a safer, more sustainable world for future generations. As we grow our business and our social and environmental challenges evolve, so do our CSR programs and practices. We view CSR as a journey of continuous improvement and our approach is guided by three key CSR priorities that influence the decisions we make every day:
Product and content safety are our top priority and reflect the trust parents and caregivers place in us to provide safe toys and play experiences for their children. We embrace our responsibility to provide a safe environment for entertaining millions of consumers across the world.
We are committed to helping build a more sustainable world by reducing the environmental footprint of every aspect of our business. As we continue to improve our environmental practices, we grow stronger overall — through more efficient processes, lower operating costs, and greater focus on innovation across our brands.
Treating people fairly — with dignity and respect — is a core value at Hasbro. We work with our third-party factories, licensees, and stakeholders to address social compliance challenges, ultimately with a goal of ensuring our products are manufactured in a fair, safe and healthy environment for workers. Advancing worker rights remains a journey of continuous improvement and one that we take seriously.
Our CSR commitments also extend to other important areas including: maintaining strong governance and ethical conduct, supporting the well-being of our employees, and marketing our products responsibly. Additionally, Hasbro is committed to helping children in need around the world through our philanthropic efforts to empower childhood by bringing hope, play and service into the lives of children worldwide.
For a more detailed look on how Hasbro manages its CSR priority areas, please visit us online.
HUMAN RIGHTS & ETHICAL SOURCINGPRODUCT SAFETY
ENVIRONMENTAL SUSTAINABILITY

HASBRO 2015 CORPORATE SOCIAL RESPONSIBILITY REPORT 3
ABOUT THIS REPORT CSR AT HASBRO PROGRESS AND HIGHLIGHTS DATA DASHBOARD
Progress and Highlights

HASBRO 2015 CORPORATE SOCIAL RESPONSIBILITY REPORT 4
ABOUT THIS REPORT CSR AT HASBRO PROGRESS AND HIGHLIGHTS DATA DASHBOARD
Performance HighlightsHasbro continued to see steady improvement in its CSR program in 2015. We view our social and environmental advancements as points of departure, rather than points of arrival, as we challenge ourselves to be better.
At Hasbro, quality and safety are closely aligned. We incorporate safety into product design, reinforced by a strict testing protocol. Our rigorous quality assurance process guides our path from product design and material selection to engineering and manufacturing. We focus on producing strong safety outcomes. In 2015, we had zero consumer product recalls and no product safety fines.
More information about Hasbro’s product safety program is available on our CSR website.
Engaging for Chemical Safety Reform
Hasbro Government Affairs worked collaboratively with
U.S. Congress and non-governmental organization (NGO)
partners to encourage development of one uniform
national standard for chemical safety. This led in 2016 to
the passage of the Chemical Safety Improvement Act
(CSIA), which was the first substantial revision to chemical
laws in the U.S. since 1976. The CSIA is designed to provide
a unified, national approach to chemicals management,
ensuring that products are uniformly safe for children
across all 50 states.
PRODUCT SAFETY1

HASBRO 2015 CORPORATE SOCIAL RESPONSIBILITY REPORT 5
ABOUT THIS REPORT CSR AT HASBRO PROGRESS AND HIGHLIGHTS DATA DASHBOARD
Environmental sustainability is core to how we manage our business. We are committed to reducing our environmental footprint in our operations and supply chain and reducing the impacts of our products and packaging. In 2015, we continued to advance our industry leadership in sustainable packaging, formalized our commitment to climate change and renewable energy use, and made strides in reducing our operational footprint.
More information about Hasbro’s sustainability efforts is available on our CSR website.
Meeting and Resetting our 2020 Sustainability Goals
Hasbro believes in continuously improving its environ-
mental performance and works with Hasbro facility
leaders to conserve natural resources and reduce the
environmental impacts of our business operations.
Our current 2020 sustainability goals include:
Reducing Scope 1 and 2 greenhouse gas (GHG)
emissions from owned/operated facilities by
20% from 2012 levels
Reducing waste to landfill at owned/operated
facilities by 50% from 2012 levels
Reducing water consumption at owned/
operated facilities by 15% from 2012 levels
Reducing energy consumption by 25% from
2012 levels
In 2015, Hasbro sold its two owned and operated
manufacturing facilities1 which significantly reduced
our operational footprint and affected our progress
in meeting some of our 2020 environmental goals. To
address this, we are creating new goals in 2016 and
restating our baseline to continue building upon our
longstanding commitment to reducing the environ-
mental footprint of our global operations.
Advancing Sustainable Packaging
We are passionate about packaging design and take
great pride in the strides we have made in improving
the sustainability of our packaging — from eliminating
wire ties and polyvinyl chloride (PVC) in packaging
to reducing packaging waste and size. In 2015, we
achieved our goal to derive 90 percent of product
packaging and inbox content from recycled paper or
sources that practice sustainable forest management.
Supporting a Low-Carbon Economy Through Renewable Energy
Hasbro has a longstanding tradition of reducing our
global greenhouse gas emissions and energy use
and publicly report on these. In 2015, we affirmed our
commitment to climate change and advanced our
renewable energy efforts across our global operations
in support of a low-carbon economy. Through the
purchase of renewable energy certificates (RECs),
Hasbro addressed 100 percent of the company’s U.S.
electricity use in 2015 while supporting the develop-
ment of renewable U.S. wind power. Additionally,
Hasbro purchased carbon offsets to address
100 percent of our global onsite fuel use, non-U.S.
electricity use, and employee business travel in 2015.
ENVIRONMENTAL SUSTAINABILITY2
1 For more information about the sale, see Hasbro’s 2015 Annual Report.

HASBRO 2015 CORPORATE SOCIAL RESPONSIBILITY REPORT 6
ABOUT THIS REPORT CSR AT HASBRO PROGRESS AND HIGHLIGHTS DATA DASHBOARD
HUMAN RIGHTS AND ETHICAL SOURCING3
Hasbro believes that when consumers choose our toys and games, it’s an act of trust that our products are manufactured safely, under fair labor conditions and without ethical compromises. We work in partnership with third-party vendors to identify industry best practices, engage in strategic partnerships, and regularly monitor our third-party factories to enhance the safety, well-being and dignity of workers.
Achieving compliance by third-party factories is an ongoing process and requires deep engagement and oversight. As we move toward a more global sourcing strategy, this is becoming increasingly important for our business.
In 2015, Hasbro continued to pursue high ethical standards in factories that manufacture Hasbro products.
More information about Hasbro’s commitment to human rights and ethical sourcing program is available on our CSR website.
Strengthening Our Ethical Sourcing Standards
In 2015, Hasbro strengthened its Global Business
Ethics Principles — our ethical sourcing standards and
requirements for our vendors, suppliers and licensees —
to address modern forms of slavery as well as to
reinforce that freedom of association also includes the
right to collective bargaining.
Partnering With Vendors to Pilot Worker Collaboration Tool
In 2015, working with key vendors in China, we
partnered to pilot a mobile phone survey tool in four
vendor factories to collect information and further
understand the opinions of workers. While most
factories saw some improvements in worker opinions
on increased job satisfaction, improved worker/
management relationships, and reduced worker stress,
we will continue to partner with our vendors and
explore tools that increase outreach capabilities and
foster workplace improvements in vendor factories.

HASBRO 2015 CORPORATE SOCIAL RESPONSIBILITY REPORT 7
ABOUT THIS REPORT CSR AT HASBRO PROGRESS AND HIGHLIGHTS DATA DASHBOARD
At Hasbro, we recognize that the people who make our brands come to life are our most important asset. They are vital to our pursuit to create the world’s best play experiences. We seek to attract and retain diverse and talented employees who embrace our corporate values of Passion, Creativity, Integrity and Community. We strive to create an environment where our employees can grow, thrive, and be highly engaged and motivated by their work.
More information about Hasbro’s employee programs is available on our CSR website.
OUR EMPLOYEES4
Advancing Women in the Workplace
Hasbro continues to make strides in advancing
women in the workplace. In 2015 our women in
leadership roles2 was 35 percent globally, a 13 percent
increase compared to 2011. We also have had strong
engagement efforts led by our Women’s Leadership
employee network in the U.S. that is sponsored
by Hasbro’s chairman, president and CEO, focusing
on career development, work/life integration and
mentorship. They have hosted professional summits,
leadership panels and a speaker series for employees
in Rhode Island.
Transforming Talent With Year Up®
In 2014, in partnership with Year Up®, Hasbro created
a one year training and experience program called
“Transforming Talent,” dedicated to building a talent
pipeline of young adults ready to take on the chal-
lenges of a career at Hasbro. In 2015, Hasbro hired
nine graduates of the 12 students who graduated
from the program into positions in the company’s
U.S. Sales and Marketing group. Year Up® empowers
low-income young adults to go from poverty to
professional careers in a single year by connecting
young adults in need of opportunity with companies
in need of talent.
Supporting with HEART in the Community
Hasbro’s Equality Awareness Resource Team (HEART)
employee network advocates for a respectful, inclusive,
and supportive environment for LGBTQ employees
and allies. Annually, events are held across the United
States to commemorate LGBTQ Pride. As part of
the 2015 celebration, Hasbro sponsored the Kids’ Zone
at the Rhode Island PrideFest and brought joy to
children and their families.
Additionally, in 2015 Hasbro participated in the
Hong Kong LGBT Workplace Inclusion benchmark
which was the first benchmark on LGBT workplace
inclusion practices and initiatives in Asia, conducted
by Community Business, a not-for-profit organiza-
tion whose mission is to lead, inspire and support
businesses to have a positive impact on people
and communities.
2 Leadership roles are defined as director level and above.

HASBRO 2015 CORPORATE SOCIAL RESPONSIBILITY REPORT 8
ABOUT THIS REPORT CSR AT HASBRO PROGRESS AND HIGHLIGHTS DATA DASHBOARD
Hasbro has a long and proud tradition of supporting children worldwide through a variety of philanthropic programs, including our charitable grants, in-kind product donations, and employee volunteerism. Our philanthropic mission is to empower childhood by bringing “the sparkle of Hope, the joy of Play and the power of Service” into the lives of the children who need us most. Hasbro has strategic philanthropic partnerships to support children on both a national and global scale. We support communities in the U.S. as well as in over 40 countries where we have offices.
In 2015, Hasbro’s philanthropic support totaled $14.1 million and impacted more than three million children across the globe. For more information about Hasbro’s global philanthropy programs, please visit our Global Philanthropy website.
HOPESupporting Play at SOS Children’s Villages®
Our partnership with SOS Children’s Villages® is helping
children in 13 countries grow up in a loving home where
their essential needs are met. Hasbro supports and is
focused on enhancing programs that provide access
and integration of play. Together, we also responded
to two global crises in 2015. We sponsored
“Child-friendly Spaces” for children affected by the
Nepal earthquake and a “Mobile Play Bus” that
followed refugee families across Serbia and Croatia.
These programs are designed to provide some sense
of normalcy for children.
PLAYHelping Children With Illness have Some “SeriousFun”
As part of our strategic philanthropic partnership with
the SeriousFun Children’s Network, Hasbro opens its
doors to children and families with serious illness in
support of the Hole in the Wall Gang Camp’s CampOut
program. CampOut helps re-create the experience of
camp for former campers living in the area, while also
helping to build and strengthen support networks for
parents and children. Together with camp staff and
more than 40 Team Hasbro volunteers, Hasbro “staffs
camp” at its Global Headquarters in Rhode Island,
inviting former campers and their families living in the
region to take part in both classic camp activities and
Hasbro games.
SERVICEEngaging Youth Through generationOn
Our founding partnership with generationOn, the youth
service division of Points of Light, is a cornerstone of
our focus on raising a generation of youth who have
the compassion, empathy and confidence to stand up
for others and take action through service. Together in
2015, we launched the Martin Richard Bridge Builder
campaign and hosted the 6th annual Joy Maker
Challenge, engaging over 200,000 youth globally
to make a difference in the world through service
projects and acts of kindness.
Empowering Employees Through Community Service
The “power of service” is a core part of our culture
and — through Team Hasbro, our company volunteer
program — employees receive the benefit of four
hours per month to volunteer with programs and
organizations that benefit children. In 2015, 89 percent
of Hasbro’s global employees participated in Team
Hasbro events. Additionally, every December, our
Global Day of Joy empowers all of Hasbro’s employees
worldwide to engage in 200 community service
projects, which impacted 90,000 children in 2015.
COMMUNITY5
B3415 PD Town Firehouse Spring 2016B3417 PD Town Ice Cream Truck Spring 2016
B5868 PD Town 3 in 1 Town Center Fall 2016B5980 PD Town Painter Fall 2016B3415 PD Town Firehouse Spring 2016B3417 PD Town Ice Cream Truck Spring 2016
B5868 PD Town 3 in 1 Town Center Fall 2016B5980 PD Town Painter Fall 2016

HASBRO 2015 CORPORATE SOCIAL RESPONSIBILITY REPORT 9
ABOUT THIS REPORT CSR AT HASBRO PROGRESS AND HIGHLIGHTS DATA DASHBOARD
2015 Challenges and Looking to the FuturePeople and the planet are core to our purpose of making the world a better place for children and their families. This is why we continue to make CSR a business priority and have long been committed to doing the right thing for our employees, our consumers and the communities in which we serve.
We believe CSR is a journey of continuous improvement — one that is guided towards points of departure, rather than points of arrival — full of challenges and key learnings. This ultimately deepens our understanding of the complex issues of the world in which we operate and inspires us to raise the bar and strive to be better. As we work to elevate our CSR efforts in the future, we feel it’s important to reflect on the challenges we faced in 2015 and share how we are looking to improve in 2016 and beyond.
Engaging Stakeholders Through a Materiality Assessment
Hasbro began its formal CSR practice in 2011 and, at our five
year anniversary, we find it appropriate to both reflect on
our journey and to gather insight on the relative importance
of CSR issues, including key environmental, social and
governance topics. In 2016 we will conduct a materiality
assessment and evolve our CSR strategy accordingly.
Resetting Our Operational Environment Goals
In 2015, Hasbro sold its two owned and operated manufac-
turing facilities3 which significantly reduced our operational
footprint and affected our progress in meeting some of our
2020 environmental goals. To address this, we are creating
new goals in 2016 and restating our baseline. One of the
challenges we will face in defining future goals is identifying
significant reduction opportunities given that, since 2002,
we have made considerable improvements in conserving
energy and reducing greenhouse gas emissions at our
owned and operated facilities.
3 For more information about the sale, see Hasbro’s 2015 Annual Report.

HASBRO 2015 CORPORATE SOCIAL RESPONSIBILITY REPORT 10
ABOUT THIS REPORT CSR AT HASBRO PROGRESS AND HIGHLIGHTS DATA DASHBOARD
Addressing Stakeholders Concerns in Our Supply Chain
As a global company, we face supply chain challenges
that are both unique to our industry and shared across
sectors. For example, the toy industry faces high
seasonality of its sales, with much of the product
production occurring in a short window before the
holiday sales season.
In 2015, two NGO reports, from China Labor Watch
and the Institute for Global Labour and Human
Rights respectively, were released alleging poor labor
practices of toy companies, including references to
third-party factories claimed to produce Hasbro toys.
When stakeholders bring allegations of labor viola-
tions to our attention, those allegations are thoroughly
investigated to determine whether claims can be
validated, including through unannounced factory
inspections. In the case of the Institute for Global
Labour and Human Rights report, the factory refer-
enced in the report had been a third-party supplier
to Hasbro in the past; however, it had not supplied
Hasbro products since 2014. In the case of the China
Labor Watch report, ICTI CARE, a third-party social
compliance program that audited Hasbro’s vendors,
conducted an investigation into the allegations,
including the one factory that makes Hasbro product.
Where they found issues, they worked with the
factory to implement an action plan to address issues
identified. They further carried out unannounced visits
to the factory throughout the year, including during
peak production season to verify that progress had
been made.
As we expand our global sourcing and our supply
chain evolves, we continue to look critically at our
program, including ways to strengthen our processes,
including the frequency of oversight audits, capacity
building, and remediation follow-up with our social
compliance teams.
We appreciate these NGOs and other organizations for
sharing information about toy factory conditions and
welcome the opportunity to work together toward the
shared goal of ensuring human rights are being upheld
throughout our supply chain.
Promoting Ethical Sourcing in an Expanding Supply Chain
Hasbro is deeply committed to human rights and
ethical sourcing. As we move toward a more global
sourcing strategy, expanding our ethical sourcing
program is becoming increasingly important for our
business. We continuously evaluate new approaches
for adopting best practices, promoting social and
environmental performance, enabling capacity building
through enhanced tools and training, and increasing
transparency with suppliers.
Innovating Sustainable Packaging and Products
To further our innovative packaging and products, we
continue to strive to design for the environment and
minimize waste in our products and packaging. We
also aim to source materials responsibly and explore
sustainable materials. In 2016, we are investigating
the use of post-consumer recycled polyethylene
terephthalate (PET) in our packaging. We are also
exploring ways to help educate consumers on
packaging recyclability by providing on-package
material recycling instructions.

HASBRO 2015 CORPORATE SOCIAL RESPONSIBILITY REPORT 11
ABOUT THIS REPORT CSR AT HASBRO PROGRESS AND HIGHLIGHTS DATA DASHBOARD
Awards and RecognitionWe are proud of the prestigious recognition Hasbro has received for our CSR efforts. We know we must continue to improve our efforts, and utilize each day as a chance to be better and to find opportunities to make a positive and enduring difference in the world. Below are some of the awards earned in 2015:
Recognized as one of the “World’s Most Ethical Companies®” for the fourth consecutive year by the Ethisphere Institute.
Ranked on Corporate Responsibility Magazine’s “100 Best Corporate Citizens,” for the fourth consecutive year (#2 in 2015).
Ranked #1 “Most Responsible Company” for the Consumer Items Industry Sector by Corporate Responsibility Magazine for the second consecutive year.
Ranked one of “America’s Most Reputable Companies” by the Reputation Institute.
Recognized for Green Power Leadership the U.S. Environmental Protection Agency (EPA).
Named one of “America’s Most Community Minded Companies” by the Civic 50 for each year since the initiative began in 2012.

HASBRO 2015 CORPORATE SOCIAL RESPONSIBILITY REPORT 12
ABOUT THIS REPORT CSR AT HASBRO PROGRESS AND HIGHLIGHTS DATA DASHBOARD
Data Dashboard
HASBRO 2015 CORPORATE SOCIAL RESPONSIBILITY REPORT 13
ABOUT THIS REPORT CSR AT HASBRO PROGRESS AND HIGHLIGHTS DATA DASHBOARD
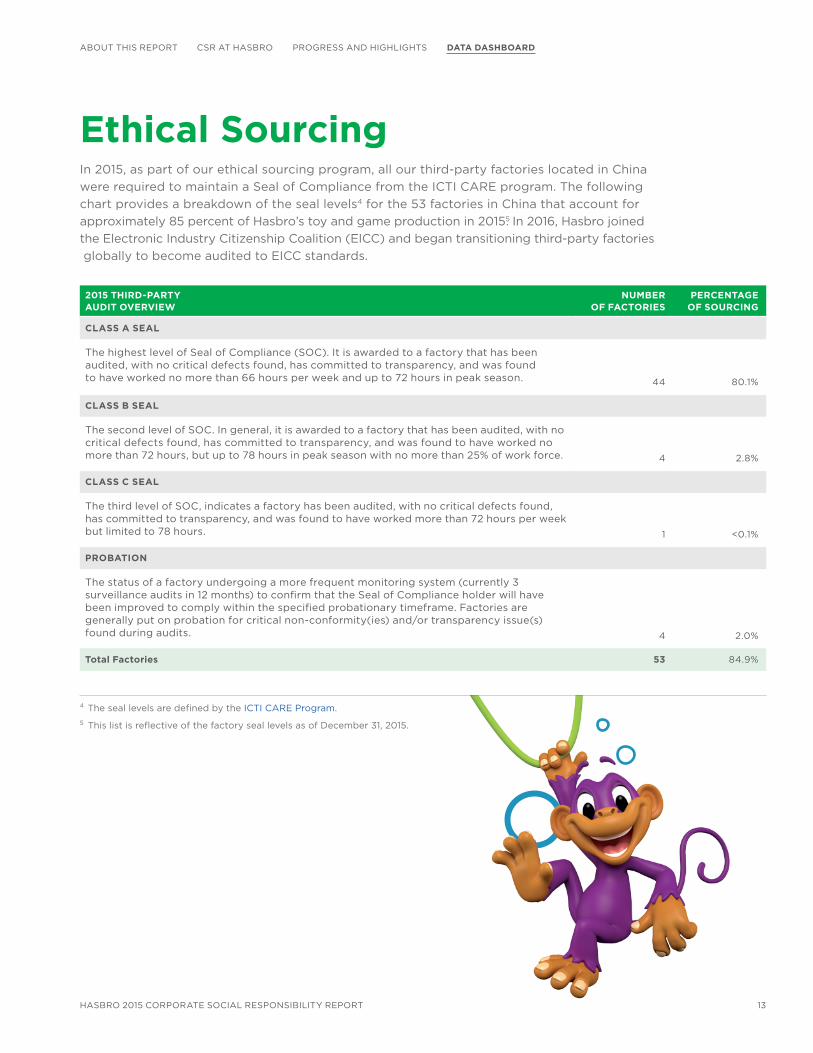
Ethical SourcingIn 2015, as part of our ethical sourcing program, all our third-party factories located in China
were required to maintain a Seal of Compliance from the ICTI CARE program. The following
chart provides a breakdown of the seal levels4 for the 53 factories in China that account for
approximately 85 percent of Hasbro’s toy and game production in 20155. In 2016, Hasbro joined
the Electronic Industry Citizenship Coalition (EICC) and began transitioning third-party factories
globally to become audited to EICC standards.
2015 THIRD-PARTY AUDIT OVERVIEW
NUMBER OF FACTORIES
PERCENTAGE OF SOURCING
CLASS A SEAL
The highest level of Seal of Compliance (SOC). It is awarded to a factory that has been audited, with no critical defects found, has committed to transparency, and was found to have worked no more than 66 hours per week and up to 72 hours in peak season. 44 80.1%
CLASS B SEAL
The second level of SOC. In general, it is awarded to a factory that has been audited, with no critical defects found, has committed to transparency, and was found to have worked no more than 72 hours, but up to 78 hours in peak season with no more than 25% of work force. 4 2.8%
CLASS C SEAL
The third level of SOC, indicates a factory has been audited, with no critical defects found, has committed to transparency, and was found to have worked more than 72 hours per week but limited to 78 hours. 1 <0.1%
PROBATION
The status of a factory undergoing a more frequent monitoring system (currently 3 surveillance audits in 12 months) to confirm that the Seal of Compliance holder will have been improved to comply within the specified probationary timeframe. Factories are generally put on probation for critical non-conformity(ies) and/or transparency issue(s) found during audits. 4 2.0%
Total Factories 53 84.9%
4 The seal levels are defined by the ICTI CARE Program.
5 This list is reflective of the factory seal levels as of December 31, 2015.

HASBRO 2015 CORPORATE SOCIAL RESPONSIBILITY REPORT 14
ABOUT THIS REPORT CSR AT HASBRO PROGRESS AND HIGHLIGHTS DATA DASHBOARD
2011 2012 2013 2014 2015
EMISSIONS AND ENERGY
Greenhouse Gas Emissions7 (metric tons C0
2e)
SCOPE 1 (DIRECT)
Asia Pacific 64 72 0 0 0
Europe 3,576 2,800 3,341 2,691 1,773
Latin America 139 139 601 923 144
U.S./Canada 3,877 2,974 3,405 3,608 3,320
Total Direct 7,656 5,985 7,347 7,222 5,237
Normalized (metric tons/$million of revenue) 1.79 1.46 1.80 1.69 1.18
SCOPE 2 (INDIRECT)
Asia Pacific 2,508 2,498 2,513 2,168 1,840
Europe 4,075 5,070 5,077 4,229 2,944
Latin America 345 467 467 467 448
U.S./Canada 12,756 9,387 8,847 8,220 4,234
Total Indirect 19,684 17,422 16,904 15,084 9,466
Normalized (metric tons/$million of revenue) 4.59 4.26 4.14 3.53 2.13
Total GHG Emissions (direct and indirect) 27,340 23,407 24,251 22,306 14,703
Total Normalized (metric tons/$million of revenue) 6.38 5.72 5.94 5.22 3.31
C02 Emissions (metric tons C0
2)
SCOPE 1 (DIRECT)
Asia Pacific 61 68 0 0 0
Europe 3,496 2,737 3,266 2,688 1,771
Latin America 137 137 592 888 144
U.S./Canada 3,839 2,944 3,371 3,602 3,314
Total Direct 7,533 5,886 7,229 7,178 5,229
Normalized (metric tons/$million of revenue) 1.76 1.44 1.77 1.68 1.18
Environment6

HASBRO 2015 CORPORATE SOCIAL RESPONSIBILITY REPORT 15
ABOUT THIS REPORT CSR AT HASBRO PROGRESS AND HIGHLIGHTS DATA DASHBOARD
2011 2012 2013 2014 2015
SCOPE 2 (INDIRECT)
Asia Pacific 2,443 2,433 2,448 2,155 1,829
Europe 4,025 5,007 5,014 4,212 2,930
Latin America 344 465 465 466 447
U.S./Canada 12,662 9,318 8,781 8,156 4,206
Total Indirect 19,474 17,223 16,708 14,989 9,412
Normalized (metric tons/$million of revenue) 4.54 4.21 4.09 3.50 2.12
Total C02 Emissions (direct and indirect) 27,007 23,109 23,937 22,167 14,641
Total Normalized 6.30 5.65 5.86 5.18 3.29
OTHER EMISSIONS
VOC Emissions8 (U.S. short tons) 9.69 8.61 9.23 7.10 0.00
NOx Emissions9De minimis De minimis De minimis De minimis De minimis
SOx Emissions9De minimis De minimis De minimis De minimis De minimis
TRI Emissions9De minimis De minimis De minimis De minimis De minimis
ENERGY
Energy Consumption (gigajoules)
Asia Pacific 20,940 7,296 11,066 9,685 8,274
Europe 36,147 38,414 40,831 25,793 26,162
Latin America 2,880 24,995 3,186 3,207 3,047
U.S./Canada 106,439 103,247 95,087 93,638 55,723
Total Electricity 166,406 173,953 150,170 132,322 93,206
Normalized (gigajoules/$million of revenue) 39 43 37 31 21
Fuel 77,059 74,910 76,518 77,263 65,552
Total 243,465 248,863 226,688 209,585 158,759
Total Normalized (gigajoules/$million of revenue) 56.81 60.86 55.53 49.00 35.70
ENVIRONMENT CONT’D
HASBRO 2015 CORPORATE SOCIAL RESPONSIBILITY REPORT 16
ABOUT THIS REPORT CSR AT HASBRO PROGRESS AND HIGHLIGHTS DATA DASHBOARD
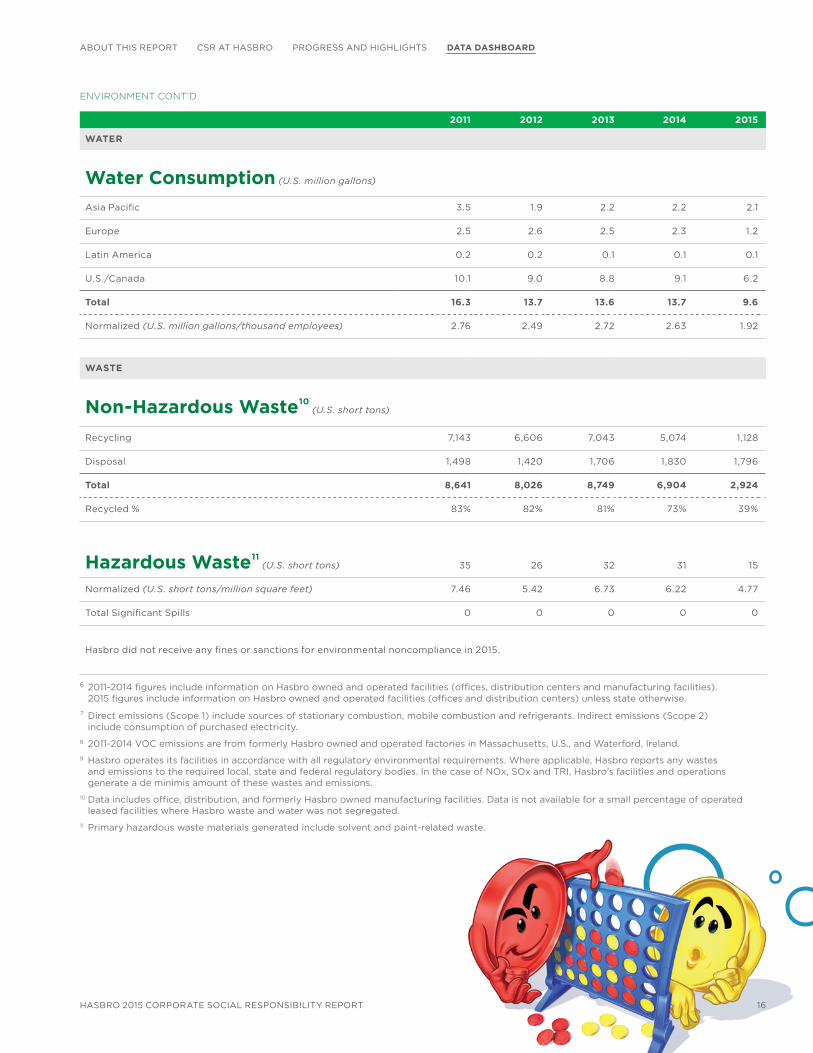
2011 2012 2013 2014 2015
WATER
Water Consumption (U.S. million gallons)
Asia Pacific 3.5 1.9 2.2 2.2 2.1
Europe 2.5 2.6 2.5 2.3 1.2
Latin America 0.2 0.2 0.1 0.1 0.1
U.S./Canada 10.1 9.0 8.8 9.1 6.2
Total 16.3 13.7 13.6 13.7 9.6
Normalized (U.S. million gallons/thousand employees) 2.76 2.49 2.72 2.63 1.92
WASTE
Non-Hazardous Waste10 (U.S. short tons)
Recycling 7,143 6,606 7,043 5,074 1,128
Disposal 1,498 1,420 1,706 1,830 1,796
Total 8,641 8,026 8,749 6,904 2,924
Recycled % 83% 82% 81% 73% 39%
Hazardous Waste11 (U.S. short tons) 35 26 32 31 15
Normalized (U.S. short tons/million square feet) 7.46 5.42 6.73 6.22 4.77
Total Significant Spills 0 0 0 0 0
Hasbro did not receive any fines or sanctions for environmental noncompliance in 2015.
6 2011-2014 figures include information on Hasbro owned and operated facilities (offices, distribution centers and manufacturing facilities). 2015 figures include information on Hasbro owned and operated facilities (offices and distribution centers) unless state otherwise.
7 Direct emissions (Scope 1) include sources of stationary combustion, mobile combustion and refrigerants. Indirect emissions (Scope 2) include consumption of purchased electricity.
8 2011-2014 VOC emissions are from formerly Hasbro owned and operated factories in Massachusetts, U.S., and Waterford, Ireland.
9 Hasbro operates its facilities in accordance with all regulatory environmental requirements. Where applicable, Hasbro reports any wastes and emissions to the required local, state and federal regulatory bodies. In the case of NOx, SOx and TRI, Hasbro’s facilities and operations generate a de minimis amount of these wastes and emissions.
10 Data includes office, distribution, and formerly Hasbro owned manufacturing facilities. Data is not available for a small percentage of operated leased facilities where Hasbro waste and water was not segregated.
11 Primary hazardous waste materials generated include solvent and paint-related waste.
ENVIRONMENT CONT’D

HASBRO 2015 CORPORATE SOCIAL RESPONSIBILITY REPORT 17
ABOUT THIS REPORT CSR AT HASBRO PROGRESS AND HIGHLIGHTS DATA DASHBOARD
Employees
2011 2012 2013 2014 2015
OUR EMPLOYEES
Employees, New Hires12 and Voluntary Turnover12
Total Employees 5,875 5,474 5,035 5,202 4,950
Women 51% 50% 50% 51% 54%
Total New Hires 568 496 632 710 720
% Female New Hires 51% 49% 54% 58% 58%
% Voluntary Turnover — 7% 10% 8% 7%
% Female Voluntary Turnover — 60% 53% 54% 58%
Employees, New Hires12 and Voluntary Turnover12 by RegionU.S.
Employees 3,155 2,791 2,533 2,644 2425
New Hires 307 257 357 434 376
Voluntary Turnover — 6% 12%13 9%14 7%
CANADA
Employees 154 154 155 153 152
New Hires 9 14 14 8 12
Voluntary Turnover — 8% 6% 6% 3%
ASIA PACIFIC
Employees 1,031 1,004 892 920 997
New Hires 111 75 103 128 166
Voluntary Turnover — 7% 7% 8% 8%

HASBRO 2015 CORPORATE SOCIAL RESPONSIBILITY REPORT 18
ABOUT THIS REPORT CSR AT HASBRO PROGRESS AND HIGHLIGHTS DATA DASHBOARD
2011 2012 2013 2014 2015
EUROPE
Employees 1,276 1,276 1,222 1,227 1,097
New Hires 114 99 114 93 121
Voluntary Turnover — 7% 7% 5% 6%
LATIN AMERICA
Employees 105 144 121 138 147
New Hires 5 19 27 28 27
Voluntary Turnover — — 15% 6% 8%
MEXICO
Employees 154 135 112 120 132
New Hires 22 32 17 19 18
Voluntary Turnover — 18% 15% 7% 8%
DIVERSITY AND INCLUSION
Women in Our Workforce
Female Employees12 51% 50% 50% 51% 54%
Female Leaders / Managers12,15 31% 30% 30% 33% 35%
U.S. Female Employees 48% 48% 48% 49% 53%
U.S. Female Leaders / Managers12,15 31% 33% 33% 34% 36%
Minorities in Our Workforce (U.S.)
Minority Employees 15% 15% 15% 16% 16%
Minority Leaders / Managers15 6% 6% 8% 8% 8%
Minority New Hires 19% 20% 17% 28% 23%
EMPLOYEES CONT’D
B3415 PD Town Firehouse Spring 2016B3417 PD Town Ice Cream Truck Spring 2016
B5868 PD Town 3 in 1 Town Center Fall 2016B5980 PD Town Painter Fall 2016B3415 PD Town Firehouse Spring 2016B3417 PD Town Ice Cream Truck Spring 2016
B5868 PD Town 3 in 1 Town Center Fall 2016B5980 PD Town Painter Fall 2016

HASBRO 2015 CORPORATE SOCIAL RESPONSIBILITY REPORT 19
ABOUT THIS REPORT CSR AT HASBRO PROGRESS AND HIGHLIGHTS DATA DASHBOARD
2011 2012 2013 2014 2015
EMPLOYEE HEALTH AND SAFETY
Employees by Ethnic Group (U.S.)
American Indian /Alaskan 0.1% <0.1% <0.1% <0.1% <0.1%
Asian or Pacific Islander 4% 4% 5% 6% 6%
Black /Not Hispanic Origin 3% 3% 3% 3% 2%
Hispanic 6% 6% 6% 7% 7%
Native Hawaiian <0.1% <0.1% <0.1% 0.2% 0.1%
White /Not Hispanic Origin 86% 86% 85% 84% 84%
Two or More Races 0% 0% 1% 1% 1%
Incidence Rates16 (per 200,000 hours worked)
Recordable Injuries and Illness 1.46 1.16 1.08 0.58 0.84
Lost Time Injuries and Illness 0.58 0.52 0.38 0.16 0.26
Lost Work Days 11.61 11.31 8.65 2.23 1.95
Work-Related Fatalities 0 0 0 0 0
Incidence Rates by Region (per 200,000 hours worked)
AMERICAS
Recordable Injuries and Illness 1.44 1.22 1.3 0.86 1.15
Lost Time Injuries and Illness 0.36 0.45 0.48 0.14 0.40
Lost Work Days 17.29 16.6 13.91 1.07 3.20
EUROPE
Recordable Injuries and Illness 2.76 1.57 1.39 1.51 0.76
Lost Time Injuries and Illness 1.87 0.74 0.56 0.34 0.09
Lost Work Days 11.84 5.63 6.39 7.74 0.26
ASIA PACIFIC
Recordable Injuries and Illness 0.1 0.44 0.11 0 0.00
Lost Time Injuries and Illness 0.1 0.36 0.11 0 0.00
Lost Work Days 0.15 2.04 0.63 0.00 0.00
Hasbro did not receive any fines or sanctions for health or safety noncompliance in 2015.
12 2011 excludes Brazil, Colombia, Dubai, Greece, Japan, Korea, Peru, Russia and Romania. 2012 excludes Dubai, Greece, Japan, Korea, Russia and Romania. 2013 excludes Dubai, Japan and Korea.
13 Includes a one-time Voluntary Early Retirement Program.
14 2013 Voluntary Early Retirement Program concluded in 2014.
15 Leaders/Managers are defined as director level and above.
16 We report injury rates, lost days, absenteeism and fatality information by region; however, we do not track this information by gender.
EMPLOYEES CONT’D

HASBRO 2015 CORPORATE SOCIAL RESPONSIBILITY REPORT 20
ABOUT THIS REPORT CSR AT HASBRO PROGRESS AND HIGHLIGHTS DATA DASHBOARD
Community
2011 2012 2013 2014 2015
Employee Volunteer Hours 18,531 20,451 26,348 42,627 52,230
Total Philanthropic Support (million)
Financial Support17 7.3 5.4 4.7 4.7 4.4
Product Donations (estimated retail value) 8.5 9.1 9.8 9.2 9.7
Total Philanthropic Support18 15.8 14.5 14.5 13.9 14.1
Children Impacted (million) 4.1 3.4 3.5 3.2 3.4
17 Total financial support represents the combined total of charitable company sponsorships and cash grants made during the fiscal year. The company’s grant making is done through the Hasbro Children’s Fund, including all matching gift grants.
18 Total philanthropic support represents both financial contributions and product donations.
21
ABOUT THIS REPORT CSR AT HASBRO PROGRESS AND HIGHLIGHTS DATA DASHBOARD
For more information about CSR at Hasbro please visit www.hasbro.com/csr.
To provide feedback on our reporting, please contact [email protected].
Hasbro, Inc.
1027 Newport Avenu
Pawtucket, RI 02861
© 2016 Hasbro, Inc.
"World’s Most Ethical Companies” and “Ethisphere” names and marks are registered trademarks of Ethisphere LLC.


