43
2015 REVALUATION WHAT HAPPENED? TAX IMPACT
| Date post: | 17-Apr-2018 |
| Category: |
Documents |
| Upload: | trinhhuong |
| View: | 216 times |
| Download: | 3 times |

2015 REVALUATION
WHAT HAPPENED?
TAX IMPACT

ASSESSOR
Per state statute, the Assessor’s Office discovers, lists, and classifies, for valuation, all property in Jefferson County to
achieve a fair and equal value for property tax purposes.
There are 239,143 property schedules, of which 176,248 are single family residential.
March 7, 2016

Colorado Property Tax Valuation History
• 1876 Colorado became a state
• 1876 County Assessors, County Board of Equalization, and State Board of
Equalization were created to assess at “full cash value”
• 1876 A portion of property tax went to the state
• 1876 State Board determined assessment inequalities existed
• Overruled by Supreme Court
• 1899 State Board attempted to equalize assessments
• Overruled by Supreme Court
• 1908 Assessors agreed to assess at 1/3rd of cash value
• 1911 Colorado Tax Commission was created
• 1914 Amendment was created to assess at “full cash value”
• 1921 State funds supported teacher salaries and the lower a counties tax base
the more state funds received for schools
• Incentive for lower assessments to increase state aid

Colorado Property Tax Valuation History• 1952 Real estate manual and inventory of all taxable property were created
• Resulted in 42.5% assessed value increase
• 1962 New amendment removed assessment at “true cash value”
• 1964 House Bill 1005 declared 6 factors for finding “actual value”• Counties had 3 years to assess property at 30% of “actual value”
• 1965 State revenue from property tax was eliminated
• 1970 House Bill 1053 created Division of Property Taxation and Board ofAssessment Appeals
• 1975 Board of Equalization ordered residential, commercial, and industrialproperty be no lower than 20% of “actual value”
• 1976 House Bill 1025 declared 4 year reassessment cycle and, for one year,assessments be 22% of “actual value”
• 1977 House Bill 1452 temporarily created 5 year cycle and limited average saleprices to 85%
• 1982 HCR 1005 known as Amendment 1 was voted into the constitution by thetaxpayers

1982 Constitutional Amendment 1
Out of concern for residential property owners paying more taxes overall,this was enacted in 1982.
• Requires an annual Legislative audit of all Colorado Assessor Offices’real and personal property values
• Exempts commercial inventory
• Exempts agricultural equipment
• Changes the make up of the State Board of Equalization
• Sets the assessment rate at 21% for residential property and 29% for allother property. This replaced the previous rate of 30% for all property.
At that time 45% of property tax revenue came from residential property,55% from all other property.

The Gallagher Amendment
Ensures the 45/55 percentage
allocation remains constant
The residential sector has grown
much faster than all other properties,
forcing the assessment rate to be
adjusted to adhere to that percentage
In 1983, the rate applied to
residential property owners was 21%.
By 2003, that rate had declined to
7.96%, where it remains
RESIDENTIAL
ASSESSMENT RATE
YEARS RATE
Prior to 1983 30%
1983 – 1986 21%
1987 18%
1988 16%
1989 – 1990 15%
1991 – 1992 14.34%
1993 – 1994 12.86%
1995 – 1996 10.36%
1997 – 2000 9.74%
2001 – 2002 9.15%
2003 – 2014 7.96%

1983 Colorado Statewide Values
1983 Jefferson County Values
2015 Jefferson County Estimated Values
Residential45%All Other
55%
Assessed
Residential
47%All Other53%
Actual
Residential 63%
All Other 37%
Assessed
Residential 70%
All Other 30%
Actual
Residential 68%
All Other 32%
Jefferson County 2015 Estimated Assessed Values
Residential 85%
All Other 15%
Jefferson County 2015 Estimated Actual Values
Jefferson County Residential percentage is historically higher than the 45% set in 1983

Mass Appraisal
The Assessor’s Office is charged with assigning a value to every property in the county. Mass appraisal is
the process that makes this possible. With over 200,000 properties and approximately 14,000 sales to
analyze, it would be impossible to individually appraise every property. Colorado statutes [39-1-104 (10.2) (a)
C.R.S.] require all county assessors to analyze sales data to see what differences, if any, there are between the
market conditions at the time of a comparable sale and the valuation date. Commonly referred to as time
trending, sales must be adjusted to the end of the data collection period.
TIME TRENDING
• Colorado Statues have a specific time frame for the sales that can be used
• Parcels are valued with 24 months of sales
• Sales must be adjusted to the end of the data collection period
(for the 2015 revaluation this period is July 1, 2012 - June 30, 2014)
The chart below shows the graphic representation of the 24-month time frame. The line is the
regression line and its “best fit” position. The black circles are the median sales ratio for each month.

Mass Appraisal
After time trending adjustments have been made, property is sorted into categories to create value
models in order to value groups of similar properties.
VALUE MODELS
• Regional location or neighborhoods
• Property types
(ex: single family, condos, townhomes, and duplex/triplex)
• Property characteristics:
▫ Quality
▫ Living area size
▫ Age of property
▫ Bath type and count
▫ Garage type and size
▫ Basement type and size
▫ Heating type
Once a value is assigned to all properties and the Assessor’s office sends out Notices of Value to all
county property owners – these notices are sent out by May 1st of each year.
Taxpayers can then protest their property values. At this point, the Assessor’s office looks to the
individual property that has been protested to find comparable sales particular to that property.

JEFFERSON COUNTY RESIDENTIAL PROPERTY VALUES INCREASE
• The average value of a single family residence rose approximately 20% between 2014 and 2015.
• The increase is a result of the change in the economy, a low inventory of residences and high demand for these properties.
* Estimated• The average value in 2015 increased only 12% since 2008.
• The 20% increase from last year does not mean that 2015 property taxes (payable in 2016) will rise 20 percent.
The property tax increase will be limited to the increase allowed by state law.
12%20%
BUDGET INCREASES HAVE CAPS DICTATED BY THE STATE OF COLORADO (CRS 29-1-301 (1) (a))
AND THE TAXPAYER BILL OF RIGHTS (TABOR) (Article X Section 20)

105
Jefferson County's 245 Special Districts
by Category Metropolitan Districts - 10543%
Water & Sanitation - 5221%
Water Districts - 219%
Fire Districts - 198%
Park & Recreation - 125%
Cities & Towns - 125%
Improvement - 104%
Sanitation - 83%
Other - 62%
No Tabor Adjustments for Metro Districts

COMPARISON OF TWO TAX DISTRICTS IN
ARVADA
ACTUAL SINGLE FAMILY PROPERTIES
Home value:Assessed value:
Mill levy:
$247,070$ 19,667
153.747
$247,575$ 19,707
101.247
Taxing Authority Mills Tax Mills Tax
ARVADA 4.310 $84.76 4.310 $84.94
ARVADA FIRE DIST 14.848 $292.02 14.848 $292.60
APEX PARK & REC DIST 5.378 $105.76 5.378 $105.98
URBAN DRAINAGE&FLOOD CONT DIST 0.632 $12.42 0.632 $12.46
URBAN DRAINAGE&FLOOD C SO PLAT 0.068 $1.34 0.068 $1.34
COUNTY 25.846 $508.34 25.846 $509.36
SCHOOL 50.165 $986.58 50.165 $988.58
LEYDEN ROCK METRO NO 2 46.250 $909.60
LEYDEN ROCK METRO NO 10 6.250 $122.92
TOTAL 153.747 $3,023.74 101.247 $1,995.26

Actual Value vs. Assessed Value
Actual Value x Assessment Rate = Assessed Value
Property Type Actual Value Assessment Rate Assessed Value
Residential
• residential improved• includes apartments
$200,000 x 07.96% $15,920
All Other
• vacant land• commercial• industrial• personal property•agricultural
$200,000 x 29.00% $58,000
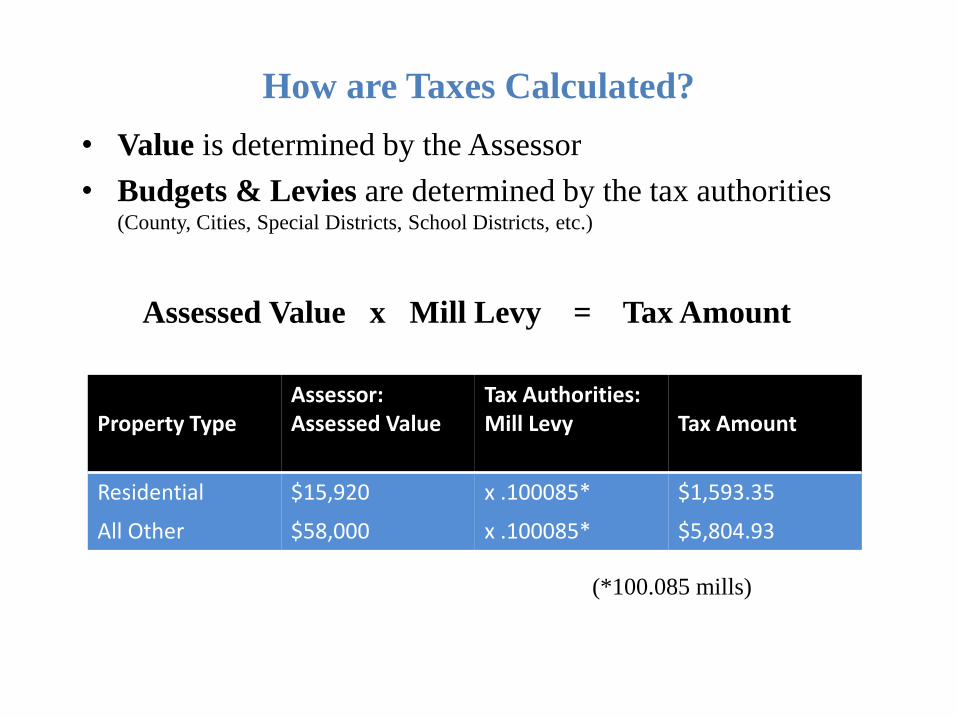
How are Taxes Calculated?
• Value is determined by the Assessor
• Budgets & Levies are determined by the tax authorities (County, Cities, Special Districts, School Districts, etc.)
Assessed Value x Mill Levy = Tax Amount
Property TypeAssessor:Assessed Value
Tax Authorities:Mill Levy Tax Amount
Residential $15,920 x .100085* $1,593.35
All Other $58,000 x .100085* $5,804.93
(*100.085 mills)

Abstract of Assessment
• After the levies are certified by the County Commissioners, an
Abstract of Assessment is compiled by the Assessor’s office
containing property valuation and distribution of property
revenue to each of the taxing authorities.
• The abstract details and summarizes all of the authorities that
collect property tax in Jefferson County. Jefferson County and
each authority have total assessed values, levies and revenues
reported in the abstract for collection in the following budget
year.
• The Assessor certifies and signs the Abstract.
• This information is transmitted to the state Division of Property
Taxation [DPT] for inclusion in the annual report to the
Governor.

Tax Roll
December 15th: All district budgets are due to the Board of
County Commissioners [BCC]
December 22nd: The levies are certified by the BCC
Late December: The tax roll is compiled by the Assessor’s
Office and sent to the Treasurer’s Office for distribution and
collection.

49%
Schools
25.2%
County20.3%
Special Districts
2.9%
Cities
2.6%
Urban Renewal
ALLOCATION OF EACH PROPERTY TAX
DOLLAR

How Does Jefferson County, CO compare?2007-2011 average property taxes paid per county

Annual Levy- Increase or Reduction
29-1-301. Levies reduced – limitation:
(1) (a) All statutory tax levies for collection in 1989 and thereafter when applied to the total
valuation for assessment of the state, each of the counties, cities, and towns not chartered as
home rule except as provided in this subsection (1), and each of the fire, sanitation, irrigation,
drainage, conservancy, and other special districts established by law shall be so reduced as to
prohibit the levying of a greater amount of revenue than was levied in the preceding year plus
five and one-half percent plus the amount of revenue abated or refunded by the taxing entity by
August 1 of the current year less the amount of revenue received by the taxing entity by August
1 of the current year as taxes paid on any taxable property that had previously been omitted
from the assessment roll of any year, except to provide for the payment of bonds and interest
thereon, for the payment of any contractual obligation that has been approved by a majority of
the qualified electors of the taxing entity, for the payment of expenses incurred in the
reappraisal of classes or subclasses ordered by or conducted by the state board of equalization,
for the payment to the state of excess state equalization payments to school districts which
excess is due to the undervaluation of taxable property, or for the payment of capital
expenditures as provided in subsection (1.2) of this section.

Article X Revenue Section 20
(1) General provisions. This section takes effect December 31, 1992 or as stated. Its
preferred interpretation shall reasonably restrain most the growth of government. All
provisions are self-executing and severable and supersede conflicting state
constitutional, state statutory, charter, or other state or local provisions. Other limits on
district revenue, spending, and debt may be weakened only by future voter approval.
Individual or class action enforcement suits may be filed and shall have the highest
civil priority of resolution. Successful plaintiffs are allowed costs and reasonable
attorney fees, but a district is not unless a suit against it be ruled frivolous. Revenue
collected, kept, or spent illegally since four full fiscal years before a suit is filed shall
be refunded with 10% annual simple interest from the initial conduct. Subject to
judicial review, districts may use any reasonable method for refunds under this
section, including temporary tax credits or rate reductions. Refunds need not be
proportional when prior payments are impractical to identify or return. When annual
district revenue is less than annual payments on general obligation bonds, pensions,
and final court judgments, (4) (a) and (7) shall be suspended to provide for the
deficiency.

Article X Revenue Section 20(2) Term definitions. Within this section:
• (a) "Ballot issue" means a non-recall petition or referred measure in an election.
• (b) "District" means the state or any local government, excluding enterprises.
• (c) "Emergency" excludes economic conditions, revenue shortfalls, or district salary or fringe
benefit increases.
• (d) "Enterprise" means a government-owned business authorized to issue its own revenue
bonds and receiving under 10% of annual revenue in grants from all Colorado state and local
governments combined.
• (e) " Fiscal year spending" means all district expenditures and reserve increases except, as to
both, those for refunds made in the current or next fiscal year or those from gifts, federal
funds, collections for another government, pension contributions by employees and pension
fund earnings, reserve transfers or expenditures, damage awards, or property sales.

JEFFERSON COUNTY
RESIDENTIAL
VALUATION CHANGES
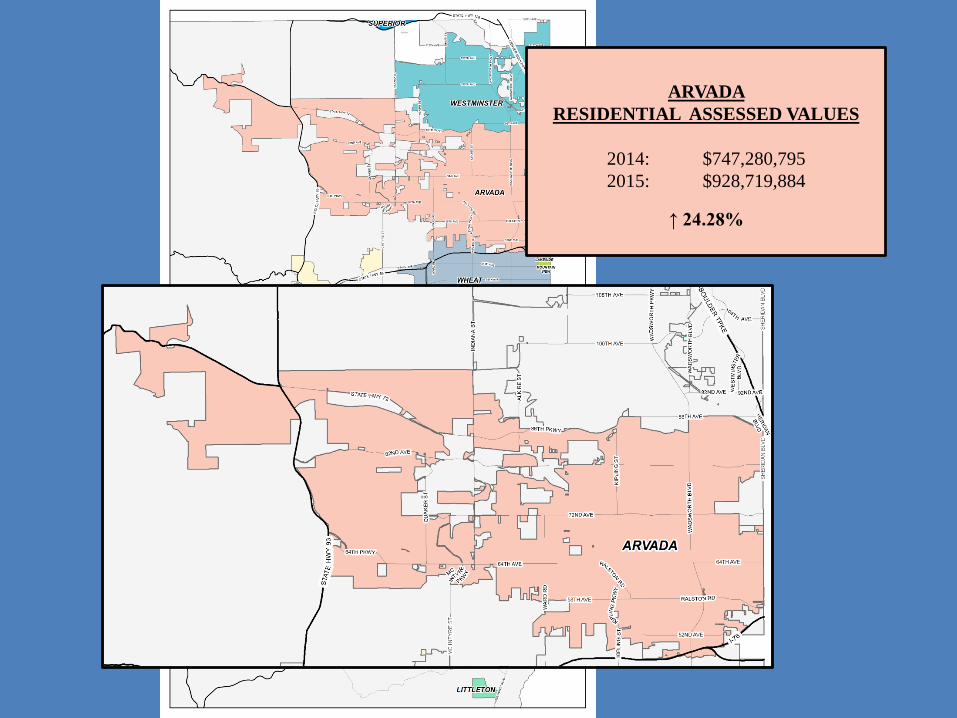
ARVADA
RESIDENTIAL ASSESSED VALUES
2014: $747,280,795
2015: $928,719,884
↑ 24.28%

Arvada Notice of Election

Arvada Fire Protection District Notice of Election

2015 / 2016 Valuation - City of Arvada2014
Mills
2014
Taxes
2015
Mills
2015
TaxesChange %
County General 17.499 120,489,663 15.595 127,537,225 7,047,562 5.85%
Developmental Disability 1.000 7,110,953 1.000 8,178,084 1,067,131 15.01%
Road & Bridge Fund 1.400 9,955,335 1.248 10,206,249 250,914 2.52%
Dept Social Services 1.465 10,417,547 1.306 10,680,578 263,031 2.52%
Capital Expenditures 1.057 7,516,278 0.942 7,703,755 187,477 2.49%
Library Fund 3.425 24,355,015 4.121 33,701,886 9,346,871 38.38%
Total County 25.846 179,844,790 24.212 198,007,777 18,162,987 10.10%
R-1 SCHOOL
General 42.676 295,810,293 40.737 326,557,003 30,746,710 10.39%
Bond Redemption 7.489 53,253,929 6.750 54,109,526 855,597 1.61%
Total School 50.165 349,064,222 47.487 380,666,529 31,602,307 9.05%
City of Arvada 4.310 4,541,300 4.310 5,454,515 913,215 20.11%
Arvada Fire District 14.848 18,784,953 14.776 22,252,276 3,467,323 18.46%
Apex Park & Rec District 5.378 6,809,518 4.881 7,315,856 506,338 7.44%
Urban Drainage & Flood 0.632 3,957,036 0.553 4,011,088 54,052 1.37%
Urban Drn & Fld Con So Pl 0.068 425,757 0.058 420,693 -5,064 -1.19%
Total 101.247 563,427,576 96.277 618,128,734 -4.970 9.71%

WESTMINSTER
RESIDENTIAL ASSESSED VALUES
2014: $249,741,383
2015: $313,141,233
↑ 25.39%

Westminster Notice of Election

2015 / 2016 Valuation - City of Westminster2014
Mills
2014
Taxes
2015
Mills
2015
TaxesChange %
County General 17.499 120,489,663 15.595 127,537,225 7,047,562 5.85%
Developmental Disability 1.000 7,110,953 1.000 8,178,084 1,067,131 15.01%
Road & Bridge Fund 1.400 9,955,335 1.248 10,206,249 250,914 2.52%
Dept Social Services 1.465 10,417,547 1.306 10,680,578 263,031 2.52%
Capital Expenditures 1.057 7,516,278 0.942 7,703,755 187,477 2.49%
Library Fund 3.425 24,355,015 4.121 33,701,886 9,346,871 38.38%
Total County 25.846 179,844,790 24.212 198,007,777 18,162,987 10.10%
R-1 SCHOOL
General 42.676 295,810,293 40.737 326,557,003 30,746,710 10.39%
Bond Redemption 7.489 53,253,929 6.750 54,109,526 855,597 1.61%
Total School 50.165 349,064,222 47.487 380,666,529 31,602,307 9.05%
City of Westminster 3.650 1,873,015 3.650 2,180,105 307,090 16.40%
Urban Drainage & Flood 0.632 3,957,036 0.553 4,011,088 54,052 1.37%
Urban Drn & Fld Con So Pl 0.068 425,757 0.058 420,693 -5,064 -1.19%
Total80.361 535,164,820 75.960 585,286,192 -4.401 9.37%

GOLDEN
RESIDENTIAL ASSESSED VALUES
2014: $146,405,492
2015: $183,858,420
↑ 25. 58%

Golden Notice of Election

2015 / 2016 Valuation - City of Golden2014
Mills
2014
Taxes
2015
Mills
2015
TaxesChange %
County General 17.499 120,489,663 15.595 127,537,225 7,047,562 5.85%
Developmental Disability 1.000 7,110,953 1.000 8,178,084 1,067,131 15.01%
Road & Bridge Fund 1.400 9,955,335 1.248 10,206,249 250,914 2.52%
Dept Social Services 1.465 10,417,547 1.306 10,680,578 263,031 2.52%
Capital Expenditures 1.057 7,516,278 0.942 7,703,755 187,477 2.49%
Library Fund 3.425 24,355,015 4.121 33,701,886 9,346,871 38.38%
Total County 25.846 179,844,790 24.212 198,007,777 18,162,987 10.10%
R-1 SCHOOL
General 42.676 295,810,293 40.737 326,557,003 30,746,710 10.39%
Bond Redemption 7.489 53,253,929 6.750 54,109,526 855,597 1.61%
Total School 50.165 349,064,222 47.487 380,666,529 31,602,307 9.05%
City of Golden 12.340 5,387,027 12.340 6,367,365 980,338 18.20%
Urban Drainage & Flood 0.632 3,957,036 0.553 4,011,088 54,052 1.37%
Urban Drn & Fld Con So Pl 0.068 425,757 0.058 420,693 -5,064 -1.19%
Total 89.051 538,678,832 84.650 589,473,452 -4.401 9.43%

LAKEWOOD
RESIDENTIAL ASSESSED VALUES
2014: $ 932,635,730
2015: $1,166,306,778
↑ 25.05%
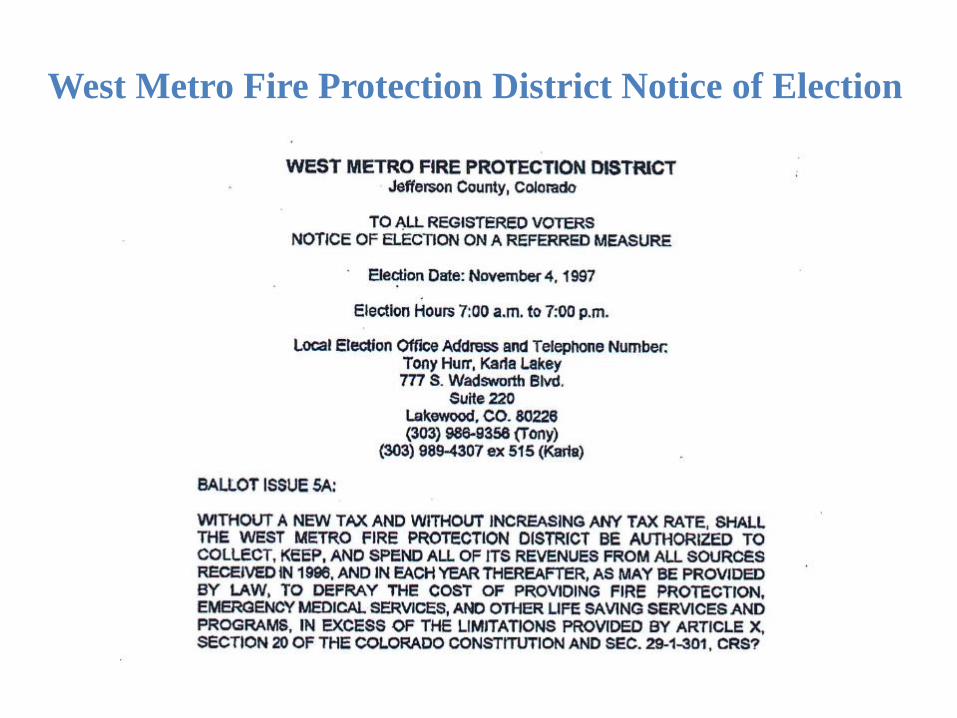
West Metro Fire Protection District Notice of Election

2015 / 2016 Valuation - City of Lakewood2014
Mills
2014
Taxes
2015
Mills
2015
TaxesChange %
County General 17.499 120,489,663 15.595 127,537,225 7,047,562 5.85%
Developmental Disability 1.000 7,110,953 1.000 8,178,084 1,067,131 15.01%
Road & Bridge Fund 1.400 9,955,335 1.248 10,206,249 250,914 2.52%
Dept Social Services 1.465 10,417,547 1.306 10,680,578 263,031 2.52%
Capital Expenditures 1.057 7,516,278 0.942 7,703,755 187,477 2.49%
Library Fund 3.425 24,355,015 4.121 33,701,886 9,346,871 38.38%
Total County 25.846 179,844,790 24.212 198,007,777 18,162,987 10.10%
R-1 SCHOOL
General 42.676 295,810,293 40.737 326,557,003 30,746,710 10.39%
Bond Redemption 7.489 53,253,929 6.750 54,109,526 855,597 1.61%
Total School 50.165 349,064,222 47.487 380,666,529 31,602,307 9.05%
City of Lakewood 4.711 7,933,999 2.031 4,076,491 -3,857,508 -48.62%
West Metro Fire Prot Dist 13.595 37,583,941 13.550 44,003,368 6,419,427 17.08%
Urban Drainage & Flood 0.632 3,957,036 0.553 4,011,088 54,052 1.37%
Urban Drn & Fld Con So Pl 0.068 425,757 0.058 420,693 -5,064 -1.19%
Total 95.017 578,809,745 87.891 631,185,946 -7.126 9.05%

UNINCORPORATED JEFFCO
RESIDENTIAL ASSESSED VALUES
2014: $1,846,969,402
2015: $2,193,577,555
↑ 18.77 %
EVERGREEN
RESIDENTIAL ASSESSED VALUES
2014: $ 135,629,083
2015: $ 152,664,661
↑ 12.56 %

Evergreen Fire Protection District Notice of Election

2015 / 2016 Valuation - Evergreen Area2014
Mills
2014
Taxes
2015
Mills
2015
TaxesChange %
County General 17.499 120,489,663 15.595 127,537,225 7,047,562 5.85%
Developmental Disability 1.000 7,110,953 1.000 8,178,084 1,067,131 15.01%
Road & Bridge Fund 1.400 9,955,335 1.248 10,206,249 250,914 2.52%
Dept Social Services 1.465 10,417,547 1.306 10,680,578 263,031 2.52%
Capital Expenditures 1.057 7,516,278 0.942 7,703,755 187,477 2.49%
Library Fund 3.425 24,355,015 4.121 33,701,886 9,346,871 38.38%
Total County 25.846 179,844,790 24.212 198,007,777 18,162,987 10.10%
R-1 SCHOOL
General 42.676 295,810,293 40.737 326,557,003 30,746,710 10.39%
Bond Redemption 7.489 53,253,929 6.750 54,109,526 855,597 1.61%
Total School 50.165 349,064,222 47.487 380,666,529 31,602,307 9.05%
Evergreen Fire District 9.117 3,428,493 9.026 3,754,236 325,743 9.50%
Evergreen Rec & Park 7.388 2,925,863 6.782 2,993,506 67,643 2.31%
Law Enforcement Agency 3.200 8,868,654 2.928 9,138,608 269,954 3.04%
Urban Drainage & Flood 0.632 3,957,036 0.553 4,011,088 54,052 1.37%
Urban Drn & Fld Con So Pl 0.068 425,757 0.058 420,693 -5,064 -1.19%
Total 96.416 548,514,815 91.046 598,992,437 -5.370 9.20%

WHEAT RIDGE
RESIDENTIAL ASSESSED VALUES
2014: $192,770,255
2015: $241,788,475
↑ 25.43%

Wheat Ridge Fire Protection District Notice of Election

2015 / 2016 Valuation - City of Wheat Ridge2014
Mills
2014
Taxes
2015
Mills
2015
Taxes Change %
County General 17.499 120,489,663 15.595 127,537,225 7,047,562 5.85%
Developmental Disability 1.000 7,110,953 1.000 8,178,084 1,067,131 15.01%
Road & Bridge Fund 1.400 9,955,335 1.248 10,206,249 250,914 2.52%
Dept Social Services 1.465 10,417,547 1.306 10,680,578 263,031 2.52%
Capital Expenditures 1.057 7,516,278 0.942 7,703,755 187,477 2.49%
Library Fund 3.425 24,355,015 4.121 33,701,886 9,346,871 38.38%
Total County 25.846 179,844,791 24.212 198,007,777 18,162,986 10.10%
R-1 SCHOOL
General 42.676 295,810,293 40.737 326,557,003 30,746,710 10.39%
Bond Redemption 7.489 53,253,929 6.750 54,109,526 855,597 1.61%
Total School 50.165 349,064,222 47.487 380,666,529 31,602,307 9.05%
City of Wheat Ridge 1.83 739,930 1.83 854,497 114,567 15.48%
Wheat Ridge Fire District 14.848 4,183,498 12.527 4,917,096 733,598 17.54%
Wheat Ridge San District 5.378 96,991 0.468 98,578 1,587 1.64
Urban Drainage & Flood 0.632 3,957,036 0.553 4,011,088 54,052 1.37%
Urban Drn & Fld Con So Pl 0.068 425,757 0.058 420,693 -5,064 -1.19%
Total 98.767 538,312,225 87.135 588,976,258 -11.632 9.41%

2015 / 2016 Example of 44 year old home in Arvada2014
Mills
2014
Taxes
2015
Mills
2015
Taxes Change %
County General 17.499 344.85 15.595 389.20 44.35 12.86%
Developmental Disability 1.000 19.71 1.000 24.96 5.25 26.64%
Road & Bridge Fund 1.400 27.59 1.248 31.15 3.56 12.89%
Dept Social Services 1.465 28.87 1.306 32.59 3.72 12.90%
Capital Expenditures 1.057 20.83 0.942 23.51 2.68 12.86%
Library Fund 3.425 67.50 4.121 102.85 35.35 52.38%
Total County 25.846 509.35 24.212 604.26 94.91 18.63%
R-1 SCHOOL
General 42.676 841.02 40.737 1,016.67 175.66 20.89%
Bond Redemption 7.489 147.59 6.750 168.46 20.87 14.14%
Total School 50.165 988.60 47.487 1,185.13 196.53 19.88%
City of Arvada 4.310 84.94 4.310 107.56 22.63 26.64%
Arvada Fire District 14.848 292.61 14.776 368.76 76.16 26.03%
Apex Park & Rec District 5.378 105.98 4.881 121.82 15.83 14.94%
Urban Drainage & Flood 0.632 12.45 0.553 13.80 1.35 10.81%
Urban Drn & Fld Con So Pl 0.068 1.34 0.058 1.45 0.11 8.02%
Total 101.247 1,995.27 96.277 2,402.79 407.51 20.42%
Senior Exemption 805.93 766.36 -39.56
Property Taxes 1,189.35 1,636.42 447.07 37.59%
Actual Values 247,580 313,530 65,950 26.64%

Assessor’s Office Contact Information
Phone Number
(303) 271-8600
Address
100 Jefferson County Parkway
Suite 2500
Admin and Courts Facility
Golden, Co 80419
PowerPoint Website: http://jeffco.us/assessor
Future Presentations
To be determined


