New Jersey Assessment of Skills and Knowledge 2015 TECHNICAL REPORT Science Grades 4 and 8 February 2016 PTM: 1510.64 Copyright 2016 by New Jersey Department of Education All rights reserved
Transcript
New Jersey Assessment of Skills and Knowledge
2015
TECHNICAL REPORT
Science Grades 4 and 8
February 2016 PTM: 1510.64
Copyright 2016 by New Jersey Department of Education All rights reserved
NJ ASK 2015 Grades 4 and 8 Technical Report
ii
STATE BOARD OF EDUCATION MARK W. BIEDRON .......................................................................... Hunterdon President JOSEPH FISICARO ............................................................................. Burlington Vice President ARCELIO APONTE ............................................................................. Middlesex RONALD K. BUTCHER ..................................................................... Gloucester JACK FORNARO ...................................................................................... Warren EDITHE FULTON ...................................................................................... Ocean ERNEST P. LEPORE ................................................................................ Hudson ANDREW J. MULVIHILL ........................................................................ Sussex J. PETER SIMON ........................................................................................ Morris DOROTHY STRICKLAND ......................................................................... Essex
DAVID C. HESPE, Commissioner of Education
NJ ASK 2015 Grades 4 and 8 Technical Report
iii
NJ ASK SCIENCE 2015 GRADES 4 and 8 TECHNICAL REPORT
TABLE OF CONTENTS PART 1: INTRODUCTION ................................................................................................... 7
1.1 Description of the Assessment ............................................................................... 8 1.2 Purpose of the Assessment..................................................................................... 8 1.3 Organizational Support ......................................................................................... 9
PART 2: TEST DEVELOPMENT ....................................................................................... 10 2.1 Test Specifications ................................................................................................ 10
Test Blueprints .................................................................................................... 11 2.2 Development of Test Items .................................................................................. 12
Test Form Distribution ....................................................................................... 12 PART 3: TEST ADMINISTRATION .................................................................................. 13
3.1 Participation ......................................................................................................... 13 3.2 Test Security Procedures ..................................................................................... 13 3.3 Test Administration Procedures ......................................................................... 14 3.4 Test Accommodations .......................................................................................... 14 3.5 Reliability and Validity of Tests for Special Populations ................................. 17
PART 4: SCORING ............................................................................................................... 19 4.1 Multiple-Choice Items ......................................................................................... 19 4.2 Constructed-Response Items ............................................................................... 19 4.3 Quality Control .................................................................................................... 20
PART 5: STANDARD SETTING ........................................................................................ 21 PART 6: ITEM and TEST STATISTICS ............................................................................ 22
Descriptive Statistics for Total Raw Score ....................................................... 30 Descriptive Statistics for Total Raw Score by Cluster .................................... 30 Scale Score Distributions by Content Area and Grade ................................... 31 Scale Score Distributions by Demographic Group .......................................... 32 Scale Score Distributions by District Factor Groups (DFG) .......................... 32
PART 7: EQUATING AND SCALING ............................................................................... 34 7.1 Descriptive Statistics for Equating Data ............................................................ 34 7.2 Equating and Scaling Procedures ....................................................................... 38
Item Calibration .................................................................................................. 38 7.3 Summary of Cut Scores ....................................................................................... 43 7.4 Equating and Scaling for Braille, Large-Print, and Alternate forms ............. 45
Braille and Large-Print Tests. ........................................................................... 45 Alternate Forms. ................................................................................................. 46
PART 8: RELIABILITY ....................................................................................................... 47
NJ ASK 2015 Grades 4 and 8 Technical Report
iv
8.1 Classical Reliability Estimates of Test Scores ................................................... 47 Reliability and Measurement Error .................................................................. 47 Raw Score Internal Consistency ........................................................................ 47
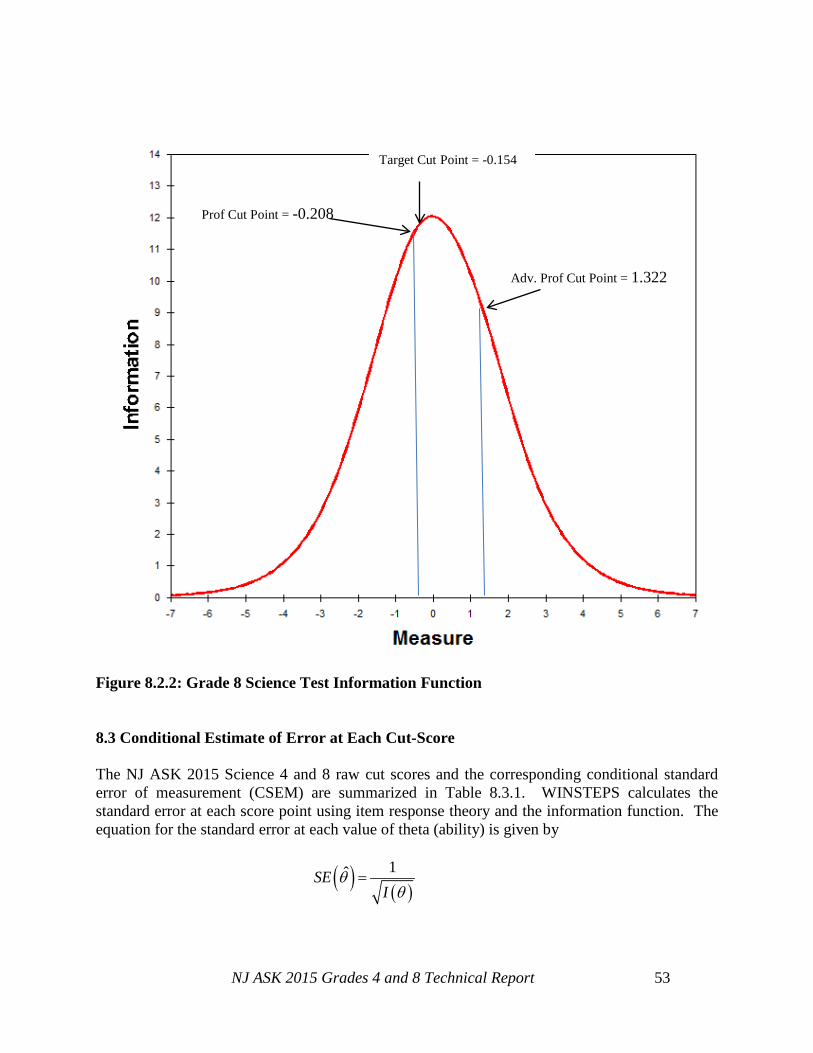
8.2 Reliability of Performance Classifications ......................................................... 49 Item Maps and Test Information Functions .................................................... 50
8.3 Conditional Estimate of Error at Each Cut-Score ............................................ 53 8.4 Rater Reliability ................................................................................................... 54
PART 9: VALIDITY ............................................................................................................. 55 9.1 Content and Curricular Validity ........................................................................ 55
Appropriateness of Content Definition ............................................................. 55 Adequacy of Content Representation ............................................................... 56 Adherence to Test Specification ........................................................................ 57 Test Administration and Accommodations ...................................................... 57
9.3 Criterion-Related Validity................................................................................... 59 PART 10: REPORTING ....................................................................................................... 60
10.1 Reports ................................................................................................................ 60 10.2 State Summary Reporting ................................................................................. 60
APPENDIX A ......................................................................................................................... 61 Field Test Form Distribution Plan ........................................................................... 61
APPENDIX B ......................................................................................................................... 64 CHECKLIST FOR FORMS DEVELOPMENT ..................................................... 64
APPENDIX C ......................................................................................................................... 66 MODIFICATIONS OF TEST ADMINISTRATION PROCEDURES FOR LIMITED ENGLISH PROFICIENT, SPECIAL EDUCATION STUDENTS, AND STUDENTS ELIGIBLE UNDER SECTION 504 OF THE REHABILITATION ACT OF 1973 ......................................................................... 66
APPENDIX D ......................................................................................................................... 71 SCORING RUBRICS ................................................................................................ 71
APPENDIX E ......................................................................................................................... 73 STANDARD SETTING ............................................................................................. 73 PERFORMANCE LEVEL DESCRIPTORS .......................................................... 73
APPENDIX F .......................................................................................................................... 76 SCALE SCORE CUMULATIVE ............................................................................. 76 FREQUENCY DISTRIBUTIONS ............................................................................ 76
APPENDIX G ......................................................................................................................... 79 ITEM PARAMETERS TABLES ............................................................................. 79
APPENDIX H ......................................................................................................................... 82 RAW SCORE TO SCALE SCORE CONVERSION TABLES ............................ 82
APPENDIX I .......................................................................................................................... 88 ITEM MAPS ............................................................................................................... 88
NJ ASK 2015 Grades 4 and 8 Technical Report
v
NJ ASK 2015 GRADES 4&8 TECHNICAL REPORT TABLES and FIGURES
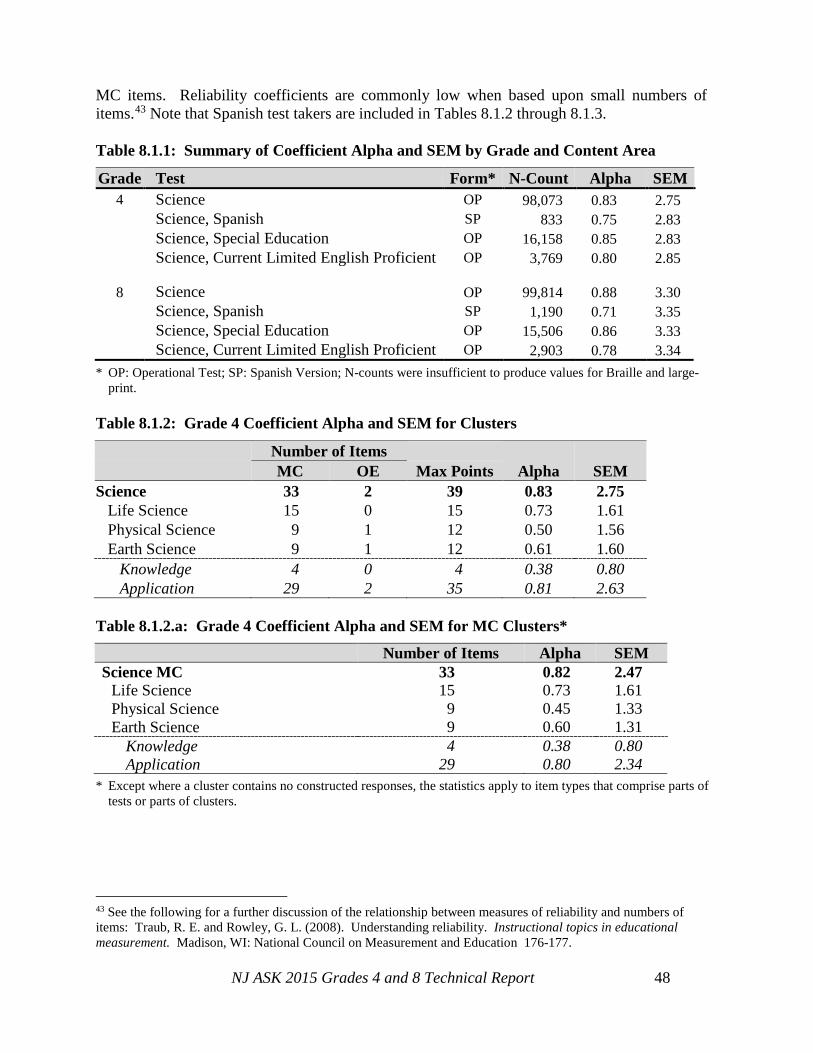
Table 2.1.1: NJ ASK Science 2015 Total Points Possible by Content Area .......................... 10 Table 2.1.2: NJ ASK Science 2015 Number of Items by Content Cluster and Skill .............. 10 Table 2.1.3: Test Construction Blueprint for NJ ASK 4 and 8 Science .................................. 11 Table 2.1.4: Actual Test Map for 2015 Grade 4 Science NJ ASK ......................................... 11 Table 2.1.5: Actual Test Map for 2015 Grade 8 Science NJ ASK ......................................... 11 Table 3.3.1: NJ ASK 2015 grades 4 and 8 Science Testing Window ..................................... 14 Table 3.4.1: Statistics for Students Classified as Special Education, NJ ASK Science ......... 16 Table 3.4.2: Statistics for Students Classified as Section 504, NJ ASK Science ................... 16 Table 4.2.1: Scoring Personnel by Grade and Content Area - NJ ASK Science 2015 ........... 20 Table 4.2.2: Automatic Rescore Statistics - NJ ASK Science 2015 ....................................... 20 Table 6.1.1: Grade 4 - Item Difficulty and Discrimination Summary Statistics by Cluster ... 24 Table 6.1.2: Grade 8 - Item Difficulty and Discrimination Summary Statistics by Cluster ... 24 Table 6.1.3: Grade 4 - Difficulty and Discrimination Indices for MC Items by Cluster ........ 25 Table 6.1.4: Grade 8 - Difficulty and Discrimination Indices for MC Items by Cluster ........ 26 Table 6.1.5: Number of Multiple-Choice Items Flagged by Distractor Analyses .................. 27 Table 6.2.2: Percent of Students Omitting the Last MC Item in Each Test Section ............... 27 Table 6.3.1: Grade 4 Correlation Coefficients among Content Domains and Clusters .......... 28 Table 6.3.2: Grade 8 Correlation Coefficients among Content Domains and Clusters .......... 28 Table 6.4.1: 2015 NJ ASK Operational Items - DIF Categories by Item Type and Grade .... 29 Table 6.5.1: Descriptive Statistics for Total Raw Score by Content Area and Grade Level .. 30 Table 6.5.2: Grade 4 Means and Standard Deviations for Raw Score .................................... 30 Table 6.5.3: Grade 8 Means and Standard Deviations for Raw Score .................................... 31 Table 6.5.4: Descriptive Statistics of Students’ Performance Levels by Content and Grade . 31 Table 7.1.1: N-Counts for the Equating Samples by Content and Grade2 .............................. 34 Table 7.1.2: Comparison of the Equating Sample and the Statewide DFGs—Grade 4.......... 35 Table 7.1.3: Comparison of the Equating Sample and the Statewide DFGs—Grade 8.......... 35 Table 7.1.4: Equating Sample N-Counts by Gender and Ethnicity: Science .......................... 36 Table 7.1.5: Descriptive Statistics for Raw Scores by Grade and Test Content ..................... 37 Table 7.1.6: Descriptive Statistics for Raw Scores by Gender—Male ................................... 37 Table 7.1.8: Descriptive Statistics for Raw Scores by District Factor Group: Science .......... 37 Figure 7.2.1: Scatter Plot of Anchor Items – Science Grade 4 ................................................ 40 Figure 7.2.2: Scatter Plot of Anchor Items – Science Grade 4 Delta Plot ............................... 40 Figure 7.2.3: Scatter Plot of Anchor Items – Science Grade 8 ................................................ 41 Figure 7.2.4: Scatter Plot of Anchor Items – Science Grade 8 Delta Plot ............................... 41 Table 7.2.1: Summary of the Infit and Outfit Statistics by Grade—Science ........................... 42 Table 7.3.1: Slope and Intercept of Theta to Scale Score Transformation .............................. 44 Table 7.4.1: Special Equatings ................................................................................................. 45 Table 8.1.1: Summary of Coefficient Alpha and SEM by Grade and Content Area .............. 48 Table 8.1.2: Grade 4 Coefficient Alpha and SEM for Clusters .............................................. 48 Table 8.1.2.a: Grade 4 Coefficient Alpha and SEM for MC Clusters* .................................. 48 Table 8.1.3: Grade 8 Coefficient Alpha and SEM for Clusters .............................................. 49 Table 8.1.3.a: Grade 8 Coefficient Alpha and SEM for MC Clusters* .................................. 49 Table 8.2.1: Consistency Indices for Performance Levels—Science ..................................... 50 Figure 8.2.1: Grade 4 Science Test Information Function ....................................................... 52
NJ ASK 2015 Grades 4 and 8 Technical Report
vi
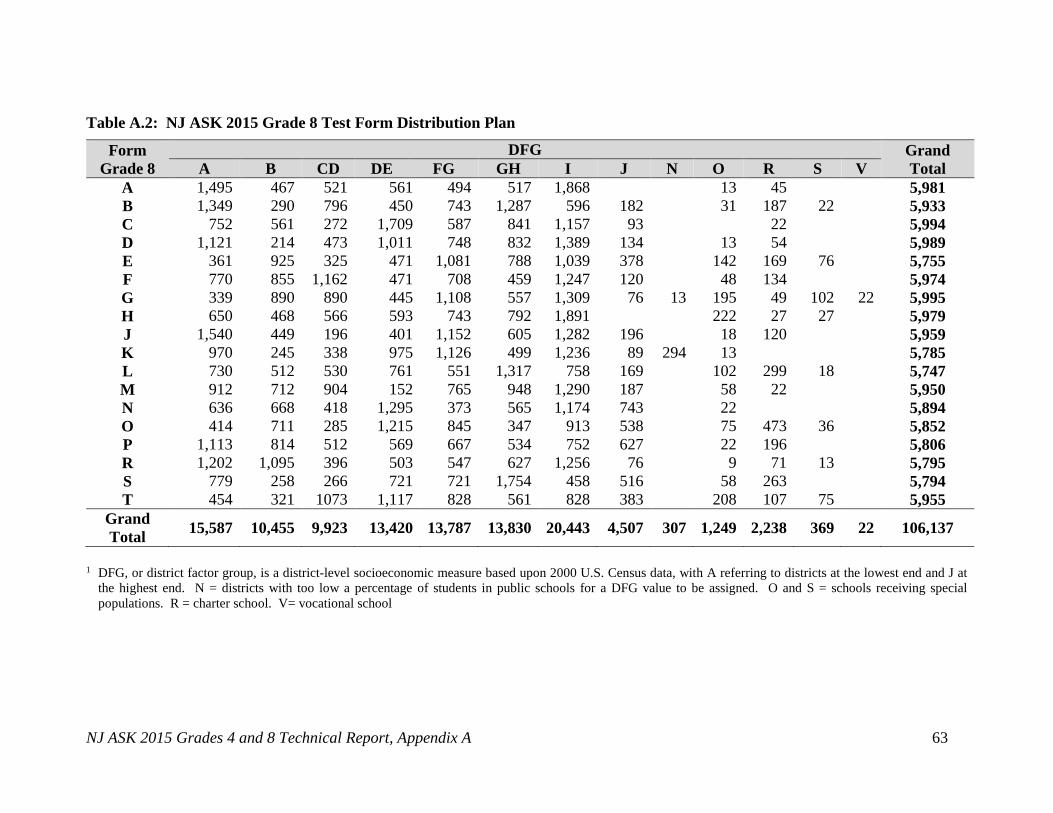
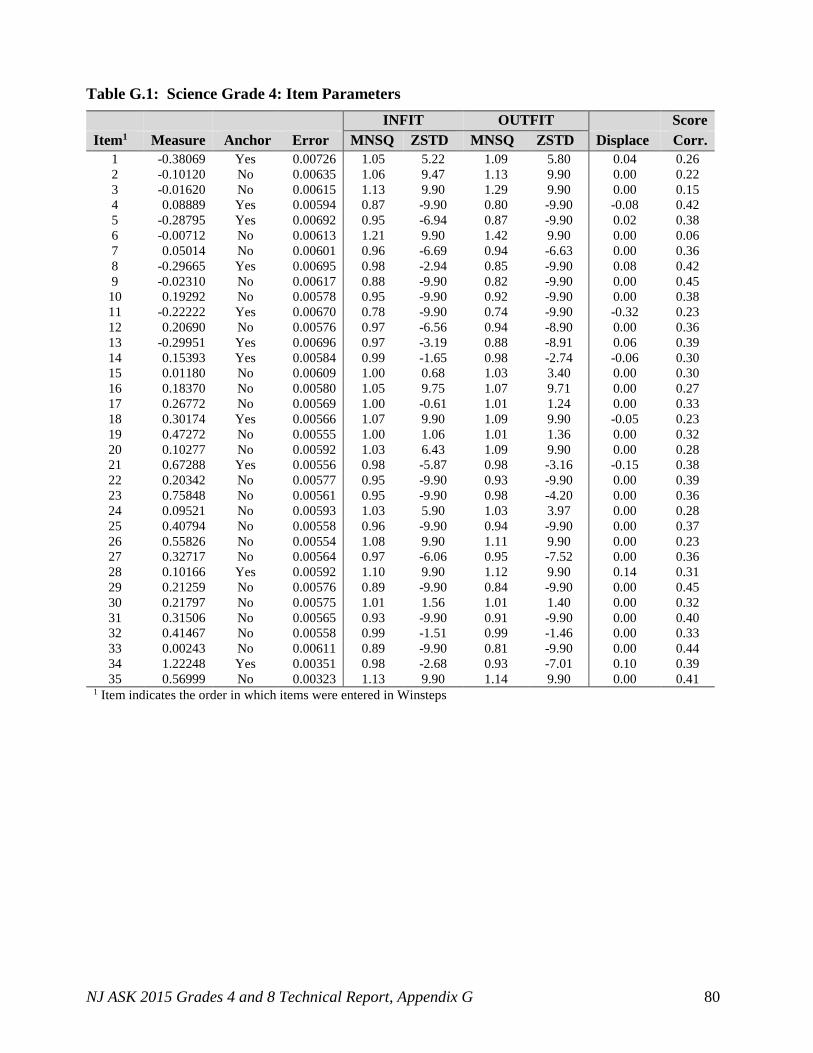
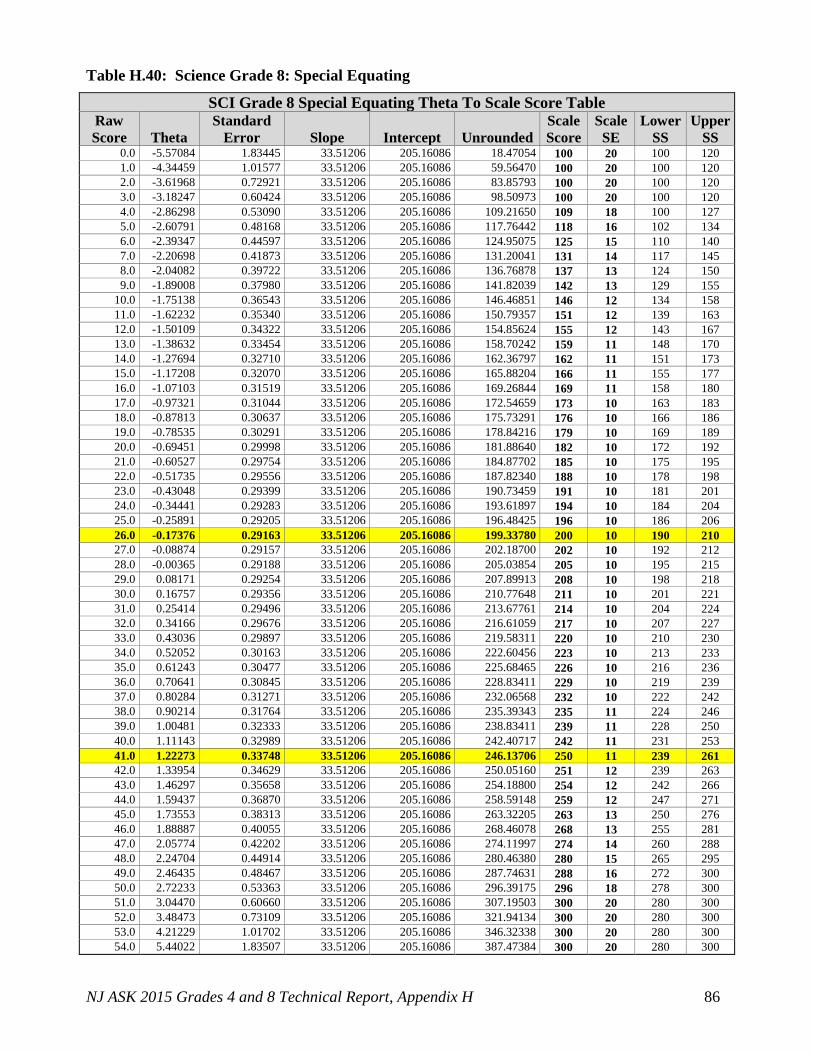
Figure 8.2.2: Grade 8 Science Test Information Function ....................................................... 53 Table 8.3.1: Raw Score Cut Scores with Conditional Standard Error of Measurement ......... 54 Table 8.4.1: Grade 4 Scoring Consistency of Constructed-Response Items........................... 54 Table 8.4.2: Grade 8 Scoring Consistency of Constructed-Response Items........................... 54 Table A.1: NJ ASK 2015 Grade 4 Test Form Distribution Plan ............................................ 62 Table A.2: NJ ASK 2015 Grade 8 Test Form Distribution Plan ............................................ 63 Table B-1: Checklist for Forms Development ........................................................................ 65 Table D.1: NJ ASK Generic Science Rubric ........................................................................... 72 Table F.1: Science Grade 4 ..................................................................................................... 77 Table F.2: Science Grade 8 ..................................................................................................... 78 Table G.1: Science Grade 4: Item Parameters ........................................................................ 80 Table G.2: Science Grade 8: Item Parameters ........................................................................ 81 Table H.37: Science Grade 4 .................................................................................................. 83 Table H.38: Science Grade 4: Special Equating ..................................................................... 84 Table H.39: Science Grade 8 .................................................................................................. 85 Table H.40: Science Grade 8: Special Equating ..................................................................... 86 Table H.41: Science Grade 8: Braille ..................................................................................... 87 Figure I.13: Item Map Science Grade 4 .................................................................................. 89 Figure I.14: Item Map Science Grade 8 .................................................................................. 90
NJ ASK 2015 Grades 4 and 8 Technical Report
7
PART 1: INTRODUCTION The purpose of this Technical Report is to provide information about the technical characteristics of the 2015 administration of the New Jersey Assessment of Skills and Knowledge (NJ ASK) for Science at grades 4 and 8. This report is intended for use by those who evaluate tests, interpret scores, or use test results for making educational decisions. It includes the following sections: test development, test administration, scoring, standard setting, item and test statistics, equating and scaling, reliability, validity, and score reporting. This report provides extensive detail about the development and operation of NJ ASK. The traditional concerns with a program are often labeled reliability and validity. The empirical reliability and validity of the assessments are reported explicitly in this document. While reliability (Part 8) is relatively straightforward, the steps in creating the program and putting it into operation are all aspects of validity (Part 9). The validity of any assessment stems from the steps taken in planning it; the processes of developing the tests’ content; the processes of consulting with stakeholders; the processes of communicating with users about the test; the processes of scoring and reporting; and the processes of data analysis and appropriate uses of outcomes. Each is an integral part of validity. Data for the analyses presented in this Technical Report were collected during the spring administration in May 2015. The short time duration between test administration and score reporting necessitated the use of a priority sample for the equating/scaling analyses presented in Part 7 – Equating and Scaling. A priority sample consists of a sub-group (approximately 30%) of the entire state student population that contains a representative sample of students from across the state based on ethnicity, gender and District Factor Group (DFG), a measure of socioeconomic status (see Section 6.5). The answer documents from the selected priority sample are scored and prioritized such that the results from this group are available for score-reporting-timeline-driven-analyses. The entire student population test results were utilized in less time-sensitive analyses such as those reported in Part 6 – Item and Test Statistics and in Part 8 – Reliability. The student N-counts are provided for each analysis in order for the reader to quickly ascertain whether the total student population or a sub-group was used for a given analysis. In reading this technical report, it is critical to remember that the testing program does not exist in a vacuum; it is not just a test. It is one part of a complex network intended to help schools focus their energies on dramatic improvement in student learning. NJ ASK is an integrated program of testing, accountability, and curricular and instructional support. It can only be evaluated properly within this full context. Detailed descriptions of the NJ ASK 2015 Science are provided in Sections 2.2 and 2.3.
NJ ASK 2015 Grades 4 and 8 Technical Report
8
1.1 Description of the Assessment The NJ ASK Science was administered as an operational assessment in spring 2015 to New Jersey students in grades 4 and 8. These assessments fulfill the requirements under the 2001 No Child Left Behind Act (NCLB) for each state to assess science at least once during grades 3–5 and grade 6–9. (Prior versions of NJ ASK assessed English Language Arts and mathematics. However, in 2015 the NJ DOE switched the assessment of those subjects to the Partnership for Assessment of Readiness for College and Careers (PARCC).) In 2008, grades 5 through 8 assessments were redesigned as NJ ASK 5–8. Grades 5 through 7 of this new ASK 5–8 replaced the interim ASK 5–7 administered in 2006 and 2007. For grade 8, ASK 8 replaced the Grade Eight Proficiency Assessment (GEPA), marking 2007 as the last GEPA administration; however, the ASK 8 science test design remains unchanged from GEPA. In 2009, ELA and mathematics assessments in grades 3 and 4 were also redesigned. New Jersey’s statewide assessments of science currently include the following components, with versions in both English and Spanish for NJ ASK:
Elementary School:
• Grade 4 New Jersey Assessment of Skills and Knowledge (NJ ASK)
Middle School:
• Grade 8 New Jersey Assessment of Skills and Knowledge (NJ ASK) High School:
• New Jersey Biology Competency Test (NJBTC) The NJ ASK Science scores at grades 4 and 8 are reported as scale scores, with score ranges as follows:
The scores of students who are included in the Partially Proficient level are considered to be below the state minimum of proficiency, and those students may be most in need of instructional support. 1.2 Purpose of the Assessment As a result of the NCLB requirements, New Jersey established statewide science assessments in grades 4, 8, and high school. The statewide assessments for grades 4 and 8 are administered annually as the New Jersey Assessment of Skills and Knowledge (NJ ASK). High school testing is administered via the New Jersey Biology Competency Test (NJBTC). Testing is conducted in the spring of each year to allow school staff and students the greatest opportunity to achieve the goal of Proficiency.
NJ ASK 2015 Grades 4 and 8 Technical Report
9
Schools and districts should use the results to identify strengths and weaknesses in their educational programs. This process is designed to improve instruction and foster better alignment with the New Jersey science standards. The results may also be used, along with other indicators of student progress, to identify those students who may need instructional support in any of the content areas. This support, which could be in the form of individual or programmatic intervention, would be a means to address any identified knowledge or skill gaps. 1.3 Organizational Support New Jersey’s Office of State Assessments (OSA) coordinates the development and implementation of NJ ASK Science. In addition to planning, scheduling, and directing all NJ ASK activities, the staff is extensively involved in numerous test design, item and statistical reviews, security, quality-assurance, and analytical procedures. Measurement Incorporated (MI), the contractor for NJ ASK Grades 4 and 8, is responsible for all aspects of the testing program, including activities such as program management, development of test materials (test items, test booklets, answer documents, and ancillary materials), and psychometric support, including standard setting. MI’s other activities include enrollment verification; distribution of all materials; receiving, scanning, editing, and scoring the answer documents; scoring constructed-response items; and creating, generating, and distributing all score reports of test results to students, schools, districts, and the state.
NJ ASK 2015 Grades 4 and 8 Technical Report
10
PART 2: TEST DEVELOPMENT A directory of test specifications and sample items was developed for each science content area. These specifications describe the test, format of the items, and the scores to be generated by the test. The material in the test specifications is designed for use by curriculum specialists and teachers to improve instruction at the district, school, and classroom levels. This document serves as the foundation for all test item development. 2.1 Test Specifications The 2015 NJ ASK was designed to measure the knowledge and skills identified in the 2004 revision of the New Jersey Core Curriculum Content Standards (CCCS) for science in grades 4 and 8. The following tables provide information about item type, content cluster/standards, and total point value by test section. Table 2.1.1 summarizes the total points possible for each of the content areas of the operational NJ ASK administered in 2015 for grades 4 and 8. Table 2.1.2 shows the number of items by content cluster/standard and skill, where appropriate. An in-depth discussion of the composition of the science assessments can be found in the 2009 NJ ASK Technical Report (PTM 1507-34), Part 2, Section 2.1. Table 2.1.1: NJ ASK Science 2015 Total Points Possible by Content Area Science Grade 4 Grade 8 Total 39 points 54 points Life Science 15 20 Physical Science 12 17 Earth Science 12 17
Knowledge 4 6 Application 35 48
Table 2.1.2: NJ ASK Science 2015 Number of Items by Content Cluster and Skill Science** Grade 4 Grade 8 Skill A K A K Life Science Physical Science
13 2 18 2 9 1 13 2
Earth Science 9 1 13 2 Total 31 4 44 6
**K = Knowledge, A = Application
NJ ASK 2015 Grades 4 and 8 Technical Report
11
Test Blueprints The following tables outline the test construction blueprints. The actual test map for each grade and content area for the NJ ASK Science 2015 is included. The NJ ASK Science assessment includes Life, Physical, and Earth Sciences. Each multiple choice item is worth one point; each constructed response item is worth up to three points. Each constructed response item is scored using an item-specific rubric.
Table 2.1.3: Test Construction Blueprint for NJ ASK 4 and 8 Science
Grade 4 Grade 8 Item Count by Type (does not include field test content)
MC 33 48
CR 2 2
Total raw score points possible 39 54 Approximate total testing time (includes field test content) 60 min. 120 min.
Table 2.1.4: Actual Test Map for 2015 Grade 4 Science NJ ASK
Cluster Cog/Prob MC (1 pt.) CR (3 pts.) # of Items # of Points Earth Application 8 1 9 11 Knowledge 1 0 1 1 Earth Total 9 1 10 12
Life Application 13 0 13 13 Knowledge 2 0 2 2 Life Total 15 0 15 15 Physical Application 8 1 9 11 Knowledge 1 0 1 1 Physical Total 9 1 10 12 Grand Total 33 2 35 39
Table 2.1.5: Actual Test Map for 2015 Grade 8 Science NJ ASK
Cluster Cog/Prob MC (1 pt.) CR (3 pts.) # of Items # of Points Earth Application 12 1 13 15 Knowledge 2 0 2 2 Earth Total 14 1 15 17
Life Application 18 0 18 18 Knowledge 2 0 2 2 Life Total 20 0 20 20 Physical Application 12 1 13 15 Knowledge 2 0 2 2 Physical Total 14 1 15 17 Grand Total 48 2 50 54
NJ ASK 2015 Grades 4 and 8 Technical Report
12
2.2 Development of Test Items The NJ ASK consists of two types of items:
1. Operational items used to determine students’ scores. 2. Field-test items evaluated for use as future base test items.
In the item development process, MI developed test and item specifications based upon requirements of the NJ CCCS for science in grades 4 and 8. Details regarding the item development process can be found in the 2009 NJ ASK Technical Report (PTM 1507-34), Part 2, Section 2.2.
Test Form Distribution Before spring of 2008, the NJ DOE developed items for the NJ ASK using a standalone field-test format. Beginning with the operational administration in spring of 2008, the NJ DOE began embedding field-test items for ELA, mathematics, and science. Thus, twenty-four forms of the NJ ASK 2015 assessments were distributed to New Jersey schools. Each of the 24 test forms at each grade level included identical base test (or operational) items as well as a semi-unique set of field-test items. Note that students earned scores only on operational items. The 24 field-test forms were assigned to school districts such that each district had one and only one test form, except in the case of unusually large districts (i.e., Jersey City, Newark, and Patterson), which received two forms. Moreover, the field-test forms were distributed across ethnic groups and DFG classifications, such that each group or classification was represented across each form. Finally, approximately equal numbers of students (approximately 4,500) were given each test form. Tables showing the final form distribution plan by test form, grade, and DFG classification can be found in Appendix A. Information regarding the Item Review Process, Item Use, Test Forms Assembly, and Quality Control for Test Construction can also be found in the 2009 NJ ASK Technical Report (PTM 1507-34), Part 2, Sections 2.3 through 2.6, respectively.
NJ ASK 2015 Grades 4 and 8 Technical Report
13
PART 3: TEST ADMINISTRATION Great care is taken to ensure the standard administration of the NJ ASK. Close attention to details is necessary to ensure that students taking the test in different locations have equal opportunities for success. Information about the administration of NJ ASK is available in the Test Coordinator Manual That information is not fully replicated here, but the following elements are of importance to this technical report. 3.1 Participation State regulations require that all students be included in the statewide assessment program and assessed annually. This includes limited English proficient (LEP) students and students with disabilities. In school year 2001–2002, students with severe cognitive disabilities were administered the Alternative Proficiency Assessment (APA) for the first time statewide. All public schools, including those without assessed grades, are counted in the state’s accountability system. All schools without assessed grades are counted as one unit with their respective receiving schools. This helps ensure closer vertical alignment of instructional services. In addition, special education students served in proprietary schools are counted in the sending schools’ accountability results, which ensure that placement decisions are reviewed closely at the school and district level for optimum student academic performance. New Jersey does not include in the accountability system the results of any student enrolled less than one full academic year in a school for school accountability or in a district for district accountability. This does not exclude from a district’s accountability the results of those students who transfer from one school to another within a district. 3.2 Test Security Procedures The NJ ASK test booklets and their contents are treated as secure materials. Detailed procedures for maintaining the security of test materials while they are in the districts are outlined in the New Jersey Assessment of Skills & Knowledge Spring 2015 Test Coordinator Manual Grades 4 and 8. It is the responsibility of the district to guarantee the security of the test materials. Examiners, proctors, and other school personnel are prohibited from copying, reading, discussing, or disclosing any test items before, during, or after test administration. When not being used during a test period, test materials are stored in a secure, locked location that is accessible only to individuals whose access is authorized by the school test coordinator. Inventory forms track test materials as they move from one location to another in districts. As part of the test development procedures, “breach” test forms and examiner manuals are prepared in the event of a security breach. If the NJ DOE identifies a security breach during the test administration window, MI immediately removes the NJ ASK test materials from the involved district or school. The test booklets for the content area affected are coded with a void code indicating a security breach. If the NJ DOE determines that there was enough time for testing, the breach forms are delivered to the district and the test is administered to the affected students in the content area impacted by the security breach. For students re-tested during the test administration window, scores are reported based on the breach form. If a
NJ ASK 2015 Grades 4 and 8 Technical Report
14
security breach is identified after the testing window, the impacted test booklets are coded with a security breach void code and no test results are reported for that content area. However, students receive a score for the content area not impacted by the security breach. 3.3 Test Administration Procedures Detailed instructions for administering the NJ ASK are provided in the New Jersey Assessment of Skills & Knowledge Spring 2015 Test Coordinator Manual Grades 4&8. The NJ ASK 4 and 8 was administered according to the following schedule: Table 3.3.1: NJ ASK 2015 grades 4 and 8 Science Testing Window
Grade Test Dates Testing Time (minutes)* Regular testing Make-up testing Day 4/Day 5
Grade 4 5/27/15 5/28/15 60
Grade 8 5/27/15 5/28/15 120 *Does not include administrative time but does include field-test time. Testing was not to be scheduled immediately after an athletic event or an assembly. All test schedules were checked with the appropriate school officials to ensure that other school activities did not interfere with the test administration. Other test administration procedures included:
• All testing had to be scheduled in the morning. Exceptions included homebound and bedside students, as well as students attending out-of-district placements who were tested at that placement by staff from the student’s home district.
• The district and school test coordinators (DTCs/STCs) were responsible for scheduling times and places for regular and make-up testing and for ensuring that all testing was completed according to the procedures and schedule described in the Test Coordinator Manual and in the Examiner Manual.
• Students who were required to test but were absent for the regular test administration had to be tested on the make-up dates.
• Students whose answer folders were voided during testing were considered to have attempted the test section. They were not allowed to retake or resume taking the voided test section during the make-up.
• Students who began a section of the test and did not complete it during the specified testing time were not allowed to complete the test section during the make-up period or any other time unless additional time was specified in their IEP or 504 plan.
3.4 Test Accommodations To ensure that students are tested under appropriate conditions, the Department of Education has adopted test accommodations and modifications that may be used when testing special populations of students. The content of the test typically remains the same, but administration
NJ ASK 2015 Grades 4 and 8 Technical Report
15
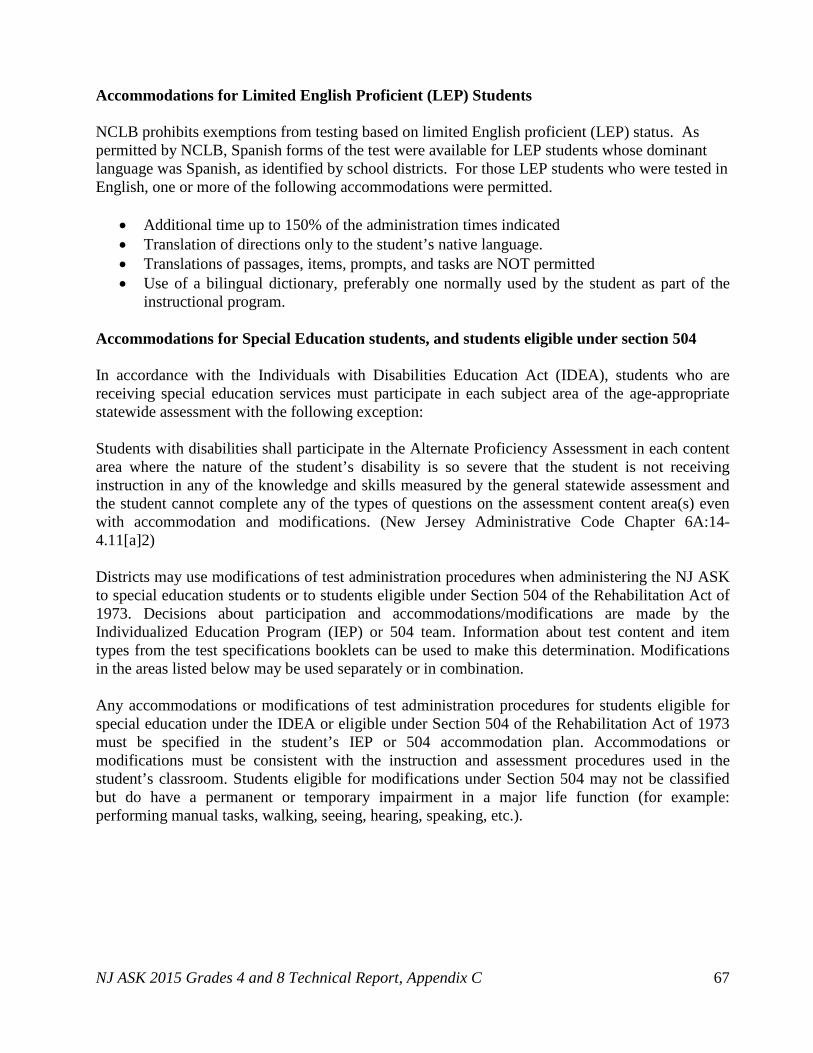
procedures, setting, and answer modes may be adapted. Students requiring accommodations must be tested in a separate location from general education students. General education students receive no special testing accommodations other than the standard room setup and materials distribution described in the examiner’s section of the Test Coordinator Manual. Limited English Proficient (LEP) students who do not take the Spanish form of the test are tested with one or more of these accommodations:
• Additional time up to 150% of the administration times indicated • Translation of directions only to the student’s native language • Use of a bilingual dictionary, preferably one normally used by the student as part of
the instructional program. Translations of passages, items, prompts, and tasks are NOT permitted. Students with Disabilities (SE/504) must take the NJ ASK unless their Individualized Education Program (IEP) specifically states that they take the Alternate Proficiency Assessment (APA) and not the NJ ASK. Students who are eligible under Section 504 of the Rehabilitation Act of 1973 may be tested using modified testing procedures that must be specified in the student’s 504 accommodation plan. Visually impaired students may take either a Braille or large-print version of the test. Specific instructions for administering the Braille and large-print versions of the test are provided in the supplementary instructions for examiners administering these forms. Students using the Braille test booklets:
• are instructed to bring a Braille ruler and a talking calculator to the test session; • are instructed to skip some items identified in the Braille instructions—the spaces for
these items must be left blank on the student answer folder; • have answer folders transcribed from Braille version by the examiner; • dictate their answers to the examiner or use a device that produces Braille.
For dictations and responses recorded in Braille:
• Students must indicate all punctuation and must spell all key words. • Examiners must transcribe the Brailled responses into the regular answer folder.
Students using the large-print test booklets:
• mark their answers in the large-print answer folders; • may be instructed to skip some questions—the spaces for these questions must be left
blank in the student’s large-print answer folder; • dictate responses on constructed-response items and writing tasks, indicate all
punctuation, and spell key words.
NJ ASK 2015 Grades 4 and 8 Technical Report
16
Accommodations and modifications of test administration procedures are listed in Appendix C of this report and are included in the Test Coordinator Manual. If a student requires an accommodation or modification that is not listed, district staff are instructed to contact the Office of Assessments, NJ ASK Program Coordinator. Accommodations or modifications are classified as follows: A = Setting Accommodations B = Scheduling Accommodations C = Test Materials/Modifications D = Test Procedures Modifications Tables 3.4.1–3.4.2 provide counts and performance results of special education and Section 504 students. Descriptive statistics are also provided for those students classified as special education or Section 504 who were tested without accommodations or modifications. Not every special education and Section 504 student is tested with an accommodation or modification. Accommodations and modifications may be used separately or in combination. The use of multiple accommodations for individual students is common. Table 3.4.1: Statistics for Students Classified as Special Education, NJ ASK Science
Grade Accommodation N Mean STD Min Max %PP %P %AP 4 Yes 12200 218.91 33.00 100 300 24.76 52.39 22.85 No 3958 238.69 35.31 118 300 12.63 41.03 46.34
3.5 Reliability and Validity of Tests for Special Populations1 Assessing the reliability and validity of the modifications made for the special populations is as important as assessing these psychometric properties of the operational tests. The reliability of an assessment refers to the consistency of test scores across test administrations. Validity of assessment is the degree to which an assessment measures what it is intended to measure and the extent to which the inferences made and actions taken on the basis of the assessment outcomes are accurate and appropriate. An assessment that is not reliable cannot be valid (AERA, APA, & NCME, 1999). New Jersey state regulations require that all students be included in the statewide assessment program and assessed annually including limited English proficient (LEP) students and students with disabilities. Beginning in school year 2001–2002, students with severe cognitive disabilities were administered the Alternative Proficiency Assessment (APA) for the first time statewide. All public schools, including those without assessed grades, are counted in the state’s accountability system. Given the high stakes nature of the tests for school accountability, it is important that the tests be reliable and valid. The NJ ASK tests are offered in English, Spanish, Braille, and large-print, and students are allowed various accommodations as determined by the individualized education plan (IEP) and 504 plan. Spanish forms are offered for current limited English proficient (CLEP) students whose dominant language is Spanish, as identified by school districts. Alternate forms of the tests are generated for students who cannot participate in the regular administration of the tests. The reliability and validity evidence for the 2015 NJ ASK tests for the regular and special populations are documented in various parts of this report. A reliable test is one that produces scores that are expected to be relatively stable if the test is administered repeatedly under similar conditions for the general testing population and across subgroups. For evidence that a test is performing similarly across subgroups, the reliability values for these subgroups can be compared to those of the total population. Note that the reliability measures are impacted by the population distribution and can be lower when the subgroup is homogenous in performance. However, one would expect the subgroup reliabilities to be adequately high for all groups. The test reliabilities measured by Cronbach alpha for the 2015 NJASK tests are described in Part 8. The alphas for overall student responses ranged from 0.83 to 0.88 for science indicating that the tests are highly reliable. The reliability of the tests for Spanish students only is lower than in the general population, ranging from 0.71 to 0.75 for science (see Table 8.1.1), which is still reasonable given the student population. Reliability estimates for special education and limited English proficient students can also be found in Table 8.1.1. The reliabilities for these special populations are quite similar to the general population. The reliability of the test and test scores is reflected in the evidence of rater consistency (i.e. inter-rater reliability). Although there is no separate inter-rater reliability analysis for CLEP
1 Sato, E., Worth, P, Gallagher, C., Lagunoff, R., and McKeag, H., (2007). Guidelines for Ensuring the Technical Quality of Assessments Affecting English Language Learners and Students with Disabilities: Development and Implementation of Regulations
NJ ASK 2015 Grades 4 and 8 Technical Report
18
students, the rater reliability coefficient for the total population shows relatively high agreement between the raters on the constructed-response items. The scoring processes are described in Part 4, and inter-rater reliability of test scores in constructed-response and writing items are presented in Part 8 of this report. The 2015 NJ ASK Science validity evidence for special populations is described here in terms of test content, test administration and response process, internal structure, and score reporting as proposed by Sato et. al (2007) for guidelines of evaluating reliability and validity of assessments. The fact that all tests are constructed under the same blueprint and specifications is evidence of content validity. The NJ ASK tests for special populations including Spanish, Braille, and large-print versions are translated directly from the operational forms. The items are developed to align with and measure the NJ core curriculum standards so that all students can demonstrate the knowledge and skills necessary for the attainment of English language proficiency and the language necessary for achievement in the academic content areas. All standards and assessments are reviewed by specialists from NJ content as well as bias and sensitivity review committees to identify and eliminate elements that may favor one group (e.g., language, culture, ethnicity) over another. Test items are developed under universal test design principles with NJ special student populations in mind so that no student group is disadvantaged. The test development process is described in Part 2 of this technical report. The test validity is also reflected in the fact that the test is inclusive for all students. In order to minimize or eliminate factors that contribute to assessment ambiguity and inaccuracy such that assessment results accurately reflect student knowledge and ability, various accommodations are provided to the special needs students based on their IEP or 504 plans. A list of acceptable test accommodations or modifications of test administrations is provided in Appendix C. The test validity further ensures the comparability and interpretation of scores and proficiency standards across different student groups. All NJ ASK item responses for a given grade/content from the general and special populations are combined for item analysis, calibration, and equating. These analyses include all students regardless of the test version taken, i.e., operational, Spanish, Braille, or large-print. An entirely different score conversion table is prepared for tests requiring modifications such that a subset of the total number of items constitutes the total score. However, these special test versions are placed on the same scale as the operational tests; thus, proficiency standards can be applied uniformly to all tests. The performance of students from various groups—including gender, ethnicity, special education, and LEP—are reported at the school level. Table 6.5.8 presents the mean and standard deviation of scale scores for Braille, large-print, and Spanish test takers. As shown in this table, students from the sub-populations performed less well than the general population in all content areas. The number of students in the sub-groups is small, however.
NJ ASK 2015 Grades 4 and 8 Technical Report
19
PART 4: SCORING 4.1 Multiple-Choice Items The answer keys approved by NJ DOE are used to score the multiple-choice items after the responses have been scanned. Each item has a key associated with the item (A, B, C, or D), which has been supplied and verified by the NJ ASK content specialists. All correct answers are assigned the value of “1” while incorrect answers are assigned the value of “0.” At no time in this process is the original scanned answer overwritten, in case the key is determined to be incorrect during the post-scoring quality assurance check. After scoring is completed, simple item statistics are provided to the appropriate NJ ASK content specialist to ensure that the correct keys are being applied. If a key changes, then the process is repeated until the scoring file is correct. The key-check data file contains the following information:
• percent of students getting the question correct (PC); • correlation of the item to the test as a whole (RPB); • correlation of each possible response option to the test as a whole (RPBA, RPBB, etc.); • percentage of students choosing each response option (A, B, C, D or X-omits); and • flags for items with high difficulty (DFLAG) or low correlations (CFLAG).
4.2 Constructed-Response Items A discussion of the following topics germane to the scoring of constructed response items can be found in the 2009 NJ ASK Technical Report (PTM 1507-34), Part 4, Section 4.2. • Scorer Selection • Range Finding • Field Test Range Finding • Scoring Guides • Team Leader Training and Qualifying • Scorer Training/Qualifying • Monitoring Scorer Performance
As the number of scoring personnel varies from year to year, Table 4.2.1 details the levels of staffing for scoring the 2015 NJ ASK. The table shows the numbers of scorers, team leaders and scoring directors at each grade level who participated in scoring.
NJ ASK 2015 Grades 4 and 8 Technical Report
20
Table 4.2.1: Scoring Personnel by Grade and Content Area - NJ ASK Science 2015
Grade Scorers Team Leaders Scoring Director Constructed Response 4 105 11 4 8 70 8 3
As shown in Part 8, Reliability, the raters are not in perfect agreement 100% of the time. Thus to ensure that no student is unjustly penalized because a rater may have been a little too stringent, rescoring is conducted automatically for any student who scores within one raw score point of the proficient cut score. MI reviews writing and constructed-response items and verifies the original scores or makes changes where warranted. Scores are never lowered during the automatic rescoring process even if a lower score results. Districts do not need to request rescoring. Table 4.2.2 provides automatic rescoring information for each grade level and content area. All open-ended/constructed response item types were scored by a single rater. Table 4.2.2: Automatic Rescore Statistics - NJ ASK Science 2015
4.3 Quality Control2 In order to ensure the quality of the testing materials, MI and the NJ DOE work together to rigorously proof all materials prior to printing/production. The steps of the quality control procedures can be found in the 2009 NJ ASK Technical Report (PTM 1507-34), Part 4, Section 4.3.
2 The NJ DOE checks all test result data for consistency, replicates reported summary data to ensure accuracy, and reviews all printed reporting materials to verify appropriateness. Additionally, the NJ DOE checks the recording and tallying of item scores.
NJ ASK 2015 Grades 4 and 8 Technical Report
21
PART 5: STANDARD SETTING Two separate standard settings have been held for NJ ASK. Both standard settings were relevant to only ELA and math. The first was conducted after the first administration of the new NJ ASK grades 5 through 8 in April–May 2008 and the second occurred after the 2009 administration of the new NJ ASK assessments in grades 3 and 4. Detailed information regarding these two standard settings can be found in the 2009 NJ ASK Technical Report (PTM 1507-34) and the New Jersey Assessment of Skills and Knowledge (NJ ASK) Standard Setting Report from 2008 and 2009. No recent standard settings have been held for science.
NJ ASK 2015 Grades 4 and 8 Technical Report
22
PART 6: ITEM and TEST STATISTICS 6.1 Classical Item Statistics For each administration, classical item analyses were completed prior to item calibration, scaling, and equating. These statistics were calculated again once all of the data were available. These analyses involve computing a set of statistics based on classical test theory for every item in each form. Each statistic was designed to provide some key information about the quality of each item from an empirical perspective. The statistics estimated for the NJ ASK are described below.
• Classical item difficulty (“p-value”): This statistic indicates the percentage of examinees in the sample that answered the item correctly. Desired p-values generally fall within the range of 0.20 to 0.90.
• Item discrimination (“r-biserial”): This statistic is measured by the poly-serial correlation between the item score and the test criterion score and describes the relationship between performance on the specific item and performance on the entire form. Higher values indicate greater differences in the performance of competent and less competent examinees. Items with negative correlations can indicate serious problems with the item content (e.g., multiple correct answers or unusually complex content) or can indicate that students have not been taught the content. For science, the test criterion score is the total score of all MC and CR items.
• Distractor analyses for MC items: This statistic reports the proportion of examinees who select each incorrect response (distractor).
• Percentage of students omitting an item: This statistic is useful for identifying problems with test features such as testing time and item/test layout. Typically, we would expect that if students have an adequate amount of testing time, 95% of students should attempt to answer each question. When a pattern of omit percentages exceeds 5% for a series of items at the end of a timed section, this may indicate that there was insufficient time for students to complete all items. Alternatively, if the omit percentage is greater than 5% for a single item, this could be an indication of an item/test layout problem. For example, students might accidentally skip an item that follows a lengthy stem.
Item analyses were conducted for the 2015 NJ ASK assessment of science for both grades 4 and 8. In this section, summary information is presented by grade at both the content domain and content cluster level. The information includes mean item scores and discrimination indices, as well as descriptive statistics for number correct raw score and for scale scores. Statistics include N-counts, means, standard deviations, minimum and maximum values, and a variety of data disaggregations, including student demographic group and DFG.
NJ ASK 2015 Grades 4 and 8 Technical Report
23
For multiple-choice (MC) items, the mean score is simply the proportion of students who gave a correct response to the item (usually referred to as item difficulty or the p-value), and the discrimination index is the point-biserial correlation between the item score and the total score based on the remaining items. Descriptive Statistics Tables 6.1.1 through 6.1.2 summarize by item response format, item difficulty, and discrimination of the items that comprise each content domain and cluster for grades 4 and 8, respectively. For MC items, both the mean and standard deviation are given. The mean value is the average of the p-values of the items in the cluster. For CR items, the mean value is the average item score for the items in the cluster. Item discrimination is the correlation between students’ item score and the total score of the remaining items on the test. Both item difficulty and discrimination are expressed in terms of the raw score metric. Tables 6.1.3 through 6.1.4 summarize frequency distributions for MC item difficulty and discrimination indices of items comprising each content domain and cluster for grades 4 and 8, respectively. The median item difficulty and discrimination is also displayed. Table 6.1.5 summarizes distractor analyses for MC items by test. The number in each cell indicates the number of items where at least one p-value or discrimination index (point-biserial) for the distractors was higher than the keyed option (answer identified as the correct response).
NJ ASK 2015 Grades 4 and 8 Technical Report
24
Table 6.1.1: Grade 4 - Item Difficulty and Discrimination Summary Statistics by Cluster
Test Section/ Cluster
Multiple-Choice Constructed-Response Item
Difficulty Item Discrimination Item
Difficulty Item Discrimination
Nitem Mean S.D. Mean Nitem Mean S.D. Mean Science Life Science
Table 6.1.3: Grade 4 - Difficulty and Discrimination Indices for MC Items by Cluster
Nitem
Difficulty Discrimination
Median p <
0.25
0.25
<=
p <
0.50
0.50
<=
p< 0
.75
0.75
<=
p< 0
.90
p >=
0.90
Median rpb
<0.2
0*
0.20
<=
rpb
< 0.
30
0.30
<=
rpb
< 0.
40
0.40
<=r
pb<
0.50
rpb
>= 0
.50
Science 33 0.66 0 1 26 6 0 0.34 2 10 16 5 0 Life Science 15 0.69 0 0 12 3 0 0.35 0 5 5 5 0 Physical Science 9 0.69 0 0 8 1 0 0.29 2 3 4 0 0 Earth Science 9 0.63 0 1 6 2 0 0.35 0 2 7 0 0 Knowledge 4 0.78 0 0 1 3 0 0.36 0 1 2 1 0 Application 29 0.66 0 1 25 3 0 0.33 2 9 14 4 0 * While ideally items should have a point-biserial correlation of at least 0.20, these items had acceptable p-values and were retained to preserve adequate
content coverage at the cluster level.
NJ ASK 2015 Grades 4 and 8 Technical Report
26
Table 6.1.4: Grade 8 - Difficulty and Discrimination Indices for MC Items by Cluster
Nitem
Difficulty Discrimination
Median p <
0.25
0.25
<=
p <
0.50
0.50
<=
p< 0
.75
0.75
<=
p< 0
.90
p >=
0.90
Median rpb
<0.2
0*
0.20
<=
rpb
< 0.
30
0.30
<=
rpb
< 0.
40
0.40
<=r
pb<
0.50
rpb
>= 0
.50
Science 48 0.62 0 5 38 5 0 0.33 2 15 21 10 0 Life Science 20 0.64 0 2 15 3 0 0.33 1 7 7 5 0 Physical Science 14 0.64 0 1 12 1 0 0.35 0 3 8 3 0 Earth Science 14 0.60 0 2 11 1 0 0.32 1 5 6 2 0 Knowledge 6 0.64 0 0 5 1 0 0.39 0 1 2 3 0 Application 42 0.62 0 5 33 4 0 0.33 2 14 19 7 0 * While ideally items should have a point-biserial correlation of at least 0.20, these items had acceptable p-values and were retained to preserve adequate
content coverage at the cluster level.
NJ ASK 2015 Grades 4 and 8 Technical Report
27
Table 6.1.5: Number of Multiple-Choice Items Flagged by Distractor Analyses
Test Grade Nitems P-Value* Point-Biserial* Science 4 33 0 1
8 48 0 0 * The p-value and point-biserial correlation in this table are calculated in the same way as for a correct answer,
except in this case the distractor is used instead of the correct answer. 6.2 Speededness The consequence of time limits on examinees’ scores is called speededness. An examination is "speeded" to the degree that those taking the exam score lower than they would have had the test not been timed. Most speededness statistics are based on the number of items that were not attempted by students. In each separately timed subsection of a test, if a student does not attempt the last item of the test, it can be assumed that the student may have run out of time before reaching the last item. The percentage of students omitting an item provides information about speededness, although it must be kept in mind that students can omit an item for reasons other than speededness (for example, choosing to not put effort into answering a constructed response item). Thus, if the percentage of omits is low, that implies that there is little speededness; if a percentage of omits is high, speededness, as well as other factors, may be the cause.
The NJ ASK was not designed to be a speeded test, but rather a power test. That is, all students are expected to have ample time to finish all items and prompts. As the tests were administered over four days, with multiple sessions each day, students were assumed to have enough time to complete the test. The number of items and item types composing each test, along with the testing time and day of administration, are detailed in Table 6.2.1. Table 6.2.2 presents the percentage of students omitting the last MC item in each test section. Table 6.2.1: Testing Schedule—Items and Time Allocations
6.3 Intercorrelations The Pearson product-moment correlations among the test sections/clusters are presented in Tables 6.3.1–6.3.2. Generally, the more items a cluster (standard) has, the higher the correlation with the total score. After all, the cluster (standard) makes up more of the points of the total score. For example, the Application total score at grade 4 is highly correlated with the total science test score (0.99) because application items make up 35 of the 39 possible points for science. Table 6.3.1: Grade 4 Correlation Coefficients among Content Domains and Clusters Science Life Physical Earth Knowledge Application Science 1.00 0.92 0.85 0.88 0.72 0.99 Life 0.92 1.00 0.68 0.71 0.70 0.91 Physical 0.85 0.68 1.00 0.62 0.60 0.84 Earth 0.88 0.71 0.62 1.00 0.60 0.88
6.4 DIF Analysis Using data from the field test items embedded in the 2014 operational tests, Differential Item Functioning (DIF) was examined using the Mantel-Haenszel (1959)3 procedure for the MC items and the Liu-Agresti cumulative common log odds ratio (Penfield, 2007)4 for CR items. As all items must be field tested and scrutinized including DIF analyses prior to appearing as an operational item, DIF analyses are not conducted on operational items. For DIF analyses, all members of the reference group (typically male/majority) are compared against all members of the focal group (typically female/minority). The DIF analyses conducted for NJ ASK 4 and 8 focused on gender and ethnicity. The number of examinees composing the
3 Mantel, N. & Haenszel, W. (1959). Statistical aspects of the analysis of data from retrospective studies of disease. Journal of National Cancer Institute, 22, 719-748. 4 Penfield, R. (2007). An approach for categorizing DIF in polytomous items. Applied Measurement In Education, 20, 335-355.
NJ ASK 2015 Grades 4 and 8 Technical Report 29
reference and focal groups differ dependent upon the year in which a given item was field tested. In general, appropriately 4,500 examinees respond to each field test item. The Mantel-Haenszel (MH) method is a non-parametric approach to DIF. In the MH procedure, total raw scores are held constant while the odds ratio is estimated. The ETS categorization is applied to flag the significance of DIF effects (Dorans & Holland, 1993)5. The Liu-Agresti cumulative common log odds ratio allows for the ETS categorization to be applied to polytomous items. DIF analyses are detailed in Section 2.2 - Development of Test Items. The letters A, B, and C are used to denote the ETS categorizations. A indicates a smaller degree of DIF, B indicates moderated DIF, and C indicates larger differences in the performance of the reference and focal groups on a given item. Slightly different categorizations were used for the constructed response items. A or NS indicates a smaller degree of DIF, B or S indicates moderated DIF, and C- indicates larger differences. Table 6.4.1 represents the ETS categorization of each of the items used in the 2015 NJ ASK operational test when they were field tested. Table 6.4.1: 2015 NJ ASK Operational Items - DIF Categories by Item Type and Grade
Test Grade Group Multiple Choice* Constructed-Response* A** B** C** A/NS+ B/S+ C-+
W/H 44 3 0 1 1 0 * The Mantel-Haenszel procedure is applied to MC and CR items. ** DIF categories for MC items: A, negligible; B, slight to moderate; and C, moderate to severe. *** DIF contrast groups: M/F, Male versus Female; W/B, White versus Black; and W/H, White versus Hispanic. + DIF categories for CR items: A/NS, negligible; B/S, moderate to severe; and C-, severe.
5 Dorans, N. J. & Holland, P. W. (1993). DIF detection and description: Mantel-Haenszel and standardization. In P. W. Holland & H. Wainer (Eds.), Differential item functioning (pp. 35-66). Hillsdale, NJ: Lawrence Erlbaum.
NJ ASK 2015 Grades 4 and 8 Technical Report 30
6.5 Summary Statistics Descriptive Statistics for Total Raw Score Descriptive statistics of total scores for NJ ASK 2015 are summarized in Table 6.5.1 by test content, form, and grade level. A total of 200,043 students participated in the science tests in grades 4 and 8. Table 6.5.1: Descriptive Statistics for Total Raw Score by Content Area and Grade Level
Test Grade Form N Mean STD Min Max Nitem Max Possible
Descriptive Statistics for Total Raw Score by Cluster Tables 6.5.2 through 6.5.3 summarize the means and standard deviations for raw score attained by cluster for the 2015 NJ ASK operational test forms. Table 6.5.2: Grade 4 Means and Standard Deviations for Raw Score
Number of Items Number of Possible Points
Raw Score Mean % of Points Available MC CR Mean STD
Table 6.5.3: Grade 8 Means and Standard Deviations for Raw Score
Number of Items Number of Possible Points
Raw Score Mean % of Points Available MC CR Mean STD
Science 48 2 54 31.47 9.64 58.27% Life Science 20 0 20 12.65 3.92 63.26% Physical Science 14 1 17 9.59 3.46 56.42% Earth Science 14 1 17 9.22 3.35 54.26% Knowledge 6 0 6 3.87 1.56 64.44% Application 42 2 48 27.60 8.50 57.50% Scale Score Distributions by Content Area and Grade Descriptive statistics for scale scores and percentage distributions of students’ performance levels are summarized in Table 6.5.4 by content area and grade. Science student records flagged as void, not present, or missing were removed. For all test forms, scale scores have a range of 100 to 300. A student is classified as Partially Proficient (PP) if his/her scale score is lower than 200. A student is classified as Advanced Proficient (AP) if his/her scale score is 250 or higher. All other students are classified as Proficient (P).
Table 6.5.4: Descriptive Statistics of Students’ Performance Levels by Content and Grade
Test Grade Form N+ Mean STD Min Max %PP %P %AP Science 4 OP 98073 240.97 32.95 100 300 9.06 43.40 47.55 BR 2 199.00 15.56 188 210 50.00 50.00 0.00 LP 66 224.15 33.54 148 288 21.21 48.48 30.30 SP 833 200.97 26.59 130 296 44.54 49.34 6.12
Scale Score Distributions by Demographic Group Descriptive statistics of scale scores and percentage distributions of students’ Performance by Demographic Groups can be found at http://www.nj.gov/education/schools/achievement. Scale score cumulative frequency distributions are attached as Appendix F. Note that Alternate and Braille forms are excluded from the cumulative frequency distributions. Scale Score Distributions by District Factor Groups (DFG) New Jersey has an established history of applying DFGs6 in the analysis and reporting of assessment results. DFG is an indicator of the socioeconomic status of citizens in each district and has been useful for the comparative reporting of test results from New Jersey’s statewide testing programs. The measure was first developed in 1974 using demographic variables from the 1970 United States Census. A revision was made in 1984 to take into account new data from the 1980 United States Census. The DFG designations were updated again in 1992 after the 1990 census. The current DFG designations are based upon the 2000 census. The DFGs are labeled from A (lowest) to J (highest). Additional DFGs are designated for special groups that are not defined geographically. For example N is used to designate districts with a percentage of students in public schools too low for a DFG value to be assigned; O and S indicate schools receiving special populations and are not included in the tables; R represents charter schools; and V denotes vocational schools Descriptive statistics of scale scores and percentage distributions of student performance by DFG for General Education group are summarized in Tables 6.5.5 by content area and grade. For each of the content areas, students who were flagged as “void” or “not present” were removed.
6 For more information on DFGs, see the following link: http://www.state.nj.us/education/finance/rda/dfg.shtml
NJ ASK 2015 Grades 4 and 8 Technical Report 33
Table 6.5.5: Descriptive Statistics for Science Performance Levels by DFG
Grade DFG+ N Mean STD Min Max %PP %P %AP 4 A 17,523 219.50 31.14 102 300 22.74 55.51 21.75 B 10,387 230.47 31.23 100 300 13.11 53.85 33.04 CD 9,341 235.78 30.70 102 300 9.70 50.36 39.94 DE 11,947 241.64 30.30 100 300 6.59 45.58 47.83 FG 11,348 245.80 30.21 130 300 5.17 41.16 53.67 GH 13,172 249.93 30.73 100 300 4.48 36.60 58.92 I 17,311 256.16 28.95 118 300 2.61 29.96 67.43 J 4,230 261.11 28.64 102 300 2.01 24.35 73.64 N 521 213.41 29.15 140 300 29.56 56.24 14.20 0 7 197.71 19.20 173 219 42.86 57.14 0.00 R 3,187 236.19 32.47 140 300 11.26 47.91 40.82
+N = majority of students in private schools; R = charter schools; V = vocational schools
NJ ASK 2015 Grades 4 and 8 Technical Report 34
PART 7: EQUATING AND SCALING This section details the equating and scaling procedures applied to the NJ ASK 2015 operational tests7. Equating and scaling procedures were applied to the grades 4 and 8 Science assessments. 7.1 Descriptive Statistics for Equating Data In 2008, data from approximately 35,000 students were used as impact data for standard setting. These data were used to establish new Proficient and Advanced Proficient cut scores for ELA and mathematics in grades 5 through 8. Thus, 2008 became the new base year to which future ELA and mathematics grade 5-8 assessments are equated. Likewise, standard settings were conducted for grades 3-4 ELA and mathematics in 2009; thus, making 2009 the year to which future grades 3-4 ELA and mathematics assessments are equated. The base years for science grades 4 and 8 are 2005 and 2000, respectively. The 2014 assessments were placed on the corresponding base-year scale using common item non-equivalent group with anchor test equating design based on an equating sample of approximately 30% of the total student population of science examinees. The NJ ASK 2015 equating samples are summarized in Table 7.1.1. Table 7.1.1: N-Counts for the Equating Samples by Content and Grade2
8 42,474 40.88 41,192 1,282 1Invalidation occurs when void codes are applied or a non-attempt flag is present 2Please Note: All Tables in Part 7are based on the equating sample. 3Minor data differences across tables reflect small amounts of unreported information. The 2015 equating sample was selected using a stratified random sampling methodology with DFG as a stratum. In addition, the samples were representative of the total student population in terms of demographic variables such as gender ethnicity, economic status, and Current Limited English Proficiency (CLEP). Comparisons between data from the 2015 Form Distribution Plan and the sample data used for equating and scaling are presented in Tables 7.1.2 to 7.1.3. These tables show the differences between the 2015 Form Distribution Plan and the equating sample.
7 All equating results are verified by two external reviewers.
NJ ASK 2015 Grades 4 and 8 Technical Report 35
Table 7.1.2: Comparison of the Equating Sample and the Statewide DFGs—Grade 4
DFG+ Statewide
Distribution Science
Obs(%) Diff A 17.66 17.98 -0.33 B 10.47 11.05 -0.58
CD 9.45 9.48 -0.03 DE 12.13 12.02 0.11 FG 11.58 11.65 -0.07 GH 13.30 14.37 -1.07
I 17.45 16.51 0.94 J 4.25 3.90 0.35 N 0.54 0.06 0.48 O 0.01 0.02 -0.01 R 3.17 2.97 0.20 S 0.00 0.00 0.00 V 0.00 0.00 0.00
* Indicates the maximum difference between statewide distribution and the sample. + N = majority of students in private schools, O and S = schools receiving special populations; R = charter schools;
V = vocational schools
Table 7.1.3: Comparison of the Equating Sample and the Statewide DFGs—Grade 8
DFG+ Statewide
Distribution Science
Obs(%) Diff A 16.07 16.44 -0.37 B 9.94 9.32 0.62
CD 9.24 9.46 -0.21 DE 12.64 10.83 1.81 FG 12.72 11.35 1.37 GH 13.08 16.12 -3.04
I 19.18 17.79 1.39 J 4.19 6.76 -2.57 N 0.38 0.05 0.33 O 0.02 0.01 0.01 R 2.52 1.83 0.69 S 0.00 0.00 -0.00 V 0.02 0.04 -0.03
* Indicates the maximum difference between statewide distribution and the sample. + N = majority of students in private schools, O and S = schools receiving special populations; R = charter schools;
V = vocational schools Table 7.1.4 presents the N-counts for the 2015 equating samples by DFG, gender, and ethnicity. Note that the sum for males and females does not equal the total in Table 7.1.1 as some examinees did not identify their gender. Similarly, some examinees did not identify ethnicity or marked
NJ ASK 2015 Grades 4 and 8 Technical Report 36
multiple ethnicities, therefore the sum over ethnic groups does not equal the total number of students. Also reported in Table 7.1.4 are the numbers of economically disadvantaged students as well as CLEP students.
Table 7.1.4: Equating Sample N-Counts by Gender and Ethnicity: Science
Grade DFG+ Male Female Asian Black Hispanic Indian Alaska
8 A 3,468 3,292 138 2,443 3,609 4 3 463 4,609 646 B 1,955 1,879 213 672 1,761 4 12 1,143 2,269 350 CD 2,034 1,860 228 759 1,070 0 3 1,799 1,846 133 DE 2,274 2,176 246 515 862 6 14 2,519 1,252 88 FG 2,396 2,278 419 588 738 6 17 2,823 1,150 101 GH 3,435 3,204 1,061 775 800 11 5 3,876 1,096 102 I 3,692 3,630 1,135 270 401 4 7 5,232 404 90 J 1,445 1,339 661 47 101 1 3 1,943 41 33 N 15 5 0 2 3 0 0 14 1 0 O 1 2 0 2 0 0 0 1 1 0 R 362 392 53 313 275 0 5 101 464 11 S 1 0 0 0 0 0 0 1 0 0 V 10 8 3 4 6 0 0 5 11 0 Total 21,088 20,065 4,157 6,390 9,626 36 69 19,920 13,144 1,554 1 Current LEP status in 2015 2 Economically Disadvantaged + N = majority of students in private schools, O and S = schools receiving special populations; R = charter schools;
V = vocational schools
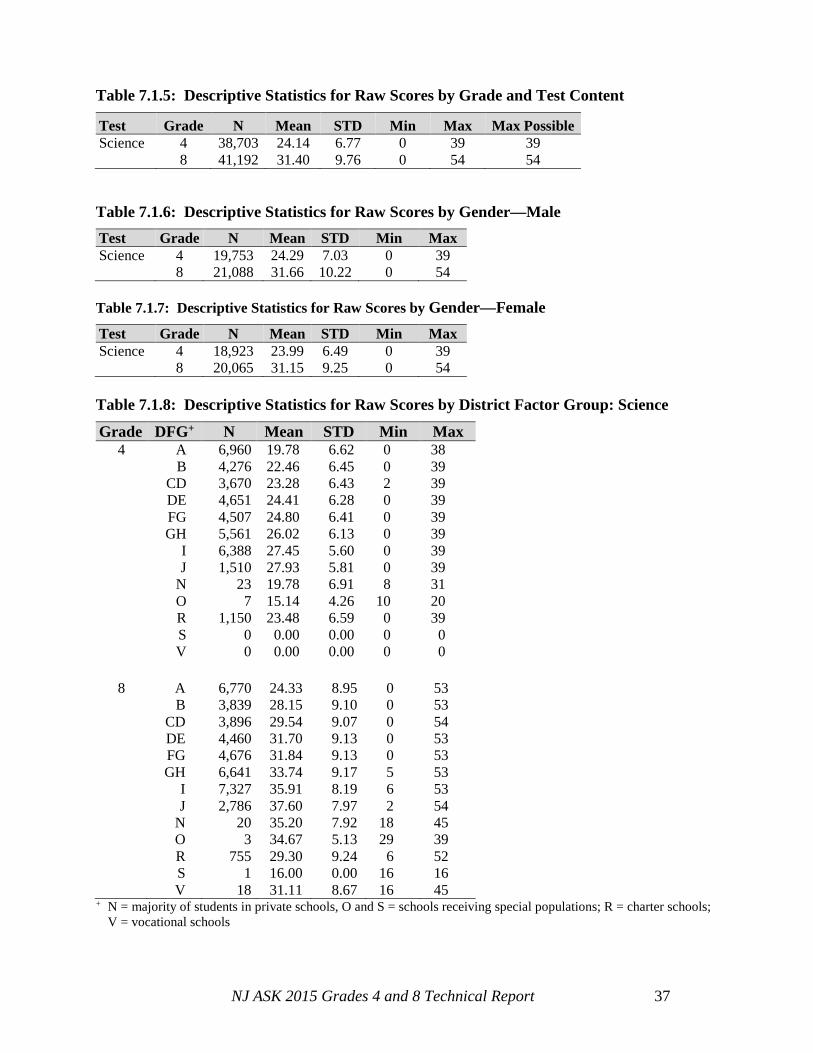
Table 7.1.5 displays descriptive statistics of the raw scores for the equating samples by grade and test content. Tables 7.1.6 and 7.1.7 summarize descriptive statistics for raw scores for the equating samples by gender. Table 7.1.8 summarizes descriptive statistics for raw scores for the samples by DFG. Note, the maximum possible score was achieved at all grade levels in science.
NJ ASK 2015 Grades 4 and 8 Technical Report 37
Table 7.1.5: Descriptive Statistics for Raw Scores by Grade and Test Content
Test Grade N Mean STD Min Max Max Possible Science 4 38,703 24.14 6.77 0 39 39 8 41,192 31.40 9.76 0 54 54
Table 7.1.6: Descriptive Statistics for Raw Scores by Gender—Male Test Grade N Mean STD Min Max Science 4 19,753 24.29 7.03 0 39 8 21,088 31.66 10.22 0 54 Table 7.1.7: Descriptive Statistics for Raw Scores by Gender—Female
Test Grade N Mean STD Min Max Science 4 18,923 23.99 6.49 0 39 8 20,065 31.15 9.25 0 54 Table 7.1.8: Descriptive Statistics for Raw Scores by District Factor Group: Science
Grade DFG+ N Mean STD Min Max 4 A 6,960 19.78 6.62 0 38
B 4,276 22.46 6.45 0 39 CD 3,670 23.28 6.43 2 39 DE 4,651 24.41 6.28 0 39 FG 4,507 24.80 6.41 0 39 GH 5,561 26.02 6.13 0 39 I 6,388 27.45 5.60 0 39 J 1,510 27.93 5.81 0 39 N 23 19.78 6.91 8 31 O 7 15.14 4.26 10 20 R 1,150 23.48 6.59 0 39 S 0 0.00 0.00 0 0 V 0 0.00 0.00 0 0
8 A 6,770 24.33 8.95 0 53 B 3,839 28.15 9.10 0 53 CD 3,896 29.54 9.07 0 54 DE 4,460 31.70 9.13 0 53 FG 4,676 31.84 9.13 0 53 GH 6,641 33.74 9.17 5 53 I 7,327 35.91 8.19 6 53 J 2,786 37.60 7.97 2 54 N 20 35.20 7.92 18 45 O 3 34.67 5.13 29 39 R 755 29.30 9.24 6 52 S 1 16.00 0.00 16 16 V 18 31.11 8.67 16 45
+ N = majority of students in private schools, O and S = schools receiving special populations; R = charter schools; V = vocational schools
NJ ASK 2015 Grades 4 and 8 Technical Report 38
7.2 Equating and Scaling Procedures Item Calibration
In order to accomplish equating and scaling for science in grades 4 and 8, the NJ ASK 2015 operational tests were calibrated using Winsteps (Linacre, 2006)8. Winsteps is designed to produce a single scale by jointly analyzing data resulting from students’ responses to both multiple-choice and open-ended items. Multiple-choice items were calibrated using the Rasch model (Rasch, 19609, Wright & Stone, 197910; Anderich, 197811), while the partial credit model (Masters, 1982)12 was used for open-ended items. Rasch scaling is “a method for obtaining objective, fundamental, linear measures from stochastic observations of ordered category responses” (Linacre, 2006, p.10). In the Rasch model, the probability of a correct response to item i given θ is:
)-(+1
)-()(
ibe
ibe
iP θ
θθ =
where θ = latent trait or ability level and bi = the difficulty parameter for item i. Similar to other IRT models (Hambleton, 198913; Hambleton & Swaminathan, 198514), the Rasch model requires an assumption of unidimensionality (Smith, Jr., 2004)15. Unidimensionality means that all items measure a single construct. If the data fit the model, the measurement units (logits) have the desirable property of maintaining the same size over the whole continuum. These interval measures may then be used in subsequent statistical analyses that assume an interval scale (Smith, Jr., 2004). Also, like other IRT models, the Rasch model allows for separability of parameter estimates (Hambleton, Swaminathan, & Rogers, 199116; van der Linden & Hambleton, 199717). That is, the ability estimates of persons are freed from the distributional properties of the specific items attempted. Likewise, the estimated difficulties of items are freed from the distributional
8 Linacre, J. M. (2006). A User's Guide to WINSTEPS MINISTEP Rasch-Model Computer Programs. Chicago 9 Rasch, G. (1960). Probabilistic models for some intelligence and attainment tests. Copenhagen: Danish Institute for Educational Research. 10 Wright, B. D., & Stone, M. H. (1979). Best test design. Chicago: MESA Press. 11 Anderich, D. (1978). A rating formulation for ordered response categories. Psychometrika, 43, 561-573. 12 Masters, G. N. (1982). A Rasch model for partial credit scoring. Psychometrika, 47, 149-174. 13 Hambleton, R. K (1989). Principles and selected applications of item response theory. In R. L. Linn (Ed.), Educational Measurement (3rd ed.). Washington, DC: American Council on Education. 14 Hambleton, R. K., & Swaminathan, H. (1985). Item Response Theory. Principles and Applications. Boston: Kluwer. 15 Smith, Jr. E. V. (2004). Evidence for the reliability of measures and validity of measure interpretation: A Rasch measurement perspective. In E. V. Smith, Jr. & R. M. Smith, Introduction to Rasch measurement: Theory, models and applications. Maple Grove, MN: JAM Press. 16 Hambleton, R. K., Swaminathan, H. & Rogers, H. J. (1991). Fundamentals of Items Response Theory. Newbury Park, CA: Sage Publications. 17 van der Linden, W. J. & Hambleton, R. K. (1997). Handbook of Modern Item Response Theory. New York: Springer-verlagVerlag.
NJ ASK 2015 Grades 4 and 8 Technical Report 39
properties of specific examinees used in the calibration. This property was useful for the Braille and large-print test score scaling described below in Section 7.4. The following steps detail the procedure used to equate the NJ ASK 2015 tests to the base scale. (1) Calibrate the 2015 assessment without constraint The first step in equating the NJ ASK 2015 tests to the base scale was to create data files for each test by grade and content area. These data were imported into Winsteps where an unconstrained, or free, calibration was conducted. This free calibration allowed Winsteps to calculate the 2015 Rasch values based strictly on how the examinees and items performed without regard to previous performance. (2) Examine the stability of the common items A set of items largely from the 2014 NJ ASK Operational tests calibrated to the base scale were selected as the potential anchor items for the NJ ASK 2015 Operational tests in science. These anchor items were internal – contributing to the students’ total score. These items were sound in statistical characteristics and representative of the test contents. Given that these tests were not released, these anchors can still be considered secure. The anchor sets included both multiple-choice and constructed response items. Assessing the stability of the common items was accomplished through comparing the constrained Rasch values from prior usage with the unconstrained 2015 Rasch values of the common items for all content area and grade combinations. The stability of common items refers to the expectation that common items function the same way for the groups involved in an equating study. It is recommended that the stability of common items be examined visually and statistically (Kolen and Brennan, 2004)18. In the NJ ASK 2015 anchor evaluation, both visual and analytical methods were applied. Anchor items were evaluated using both the 0.3 Criterion and the Delta Plot. In order for an anchor item to be considered for removal from the anchor set, the absolute logit difference between the adjusted 2015 “free” calibrations and the 2012 “base” calibrations has to be greater than 0.3 logits (Miller, Rotou, & Twing. 2004)19 and more than two standard deviations away from the line of best fit fitted to the base year and current year normalized inverse p-values in the delta plot. Figures 7.2.1 to 7.2.2 present scatter plots by content area and grade that were used for visual examination. Tables supporting the analytical examination are presented in the appendices of the 2015 Equating Report, Equating of NJ ASK Regular, Braille, large-print, and Alternate Test Forms.
18 Kolen, M. J., & Brennan, R. L. (2004). Test equating: Methods and practice. NY: Springer.
19 Miller, G.E., Rotou, O., & Twing, J.S. (2004). Evaluation of the 0.3 logits screening criterion in common item equating. Journal of Applied Measurement, 5(2), 172-177.
(3) Equate the 2015 assessments to the “base” scale It was assumed that the latent traits measured by the 2015 operational tests and the “base” tests were the same. Note that all anchor items for 2015 operational assessments were selected from previous administrations where the items were already calibrated to the base scale. Given the fact that common anchor items were used and the blueprint and item specifications were the same, it appears reasonable to assume that the underlying latent trait or construct measured by each assessment was the same. To equate the 2015 assessments to the “base” scale, the Rasch values (difficulties and Rasch-Anderich thresholds for the open-ended items) of the common items were fixed to the “base” scale. This resulted in a raw score to theta conversion on the “base” scale for the 2015 assessment (i.e., the 2015 assessments were scaled to the “base” metric). (4) Assess the model fit
Winsteps was able to produce an ability estimate (theta) for every possible number correct, raw score total as one or more examinees obtained a perfect score on each CR item in science. Table 7.1.1 shows the number of examinees used for the calibrations by grade and content area. Table 7.2.1 summarizes Infit and Outfit statistics for the NJ ASK 2015 tests. The Infit statistic is more sensitive to unexpected behavior affecting responses near an examinee’s ability level while the Outfit statistic is more sensitive to unexpected behavior by examinees far from their ability level (see Winsteps Manual, pp.199-202). Infit and Outfit can be expressed as a mean square (MNSQ) statistic or on a standardized metric (ZSTD). MNSQ values are more oriented toward practical significance, whereas Z values are more closely related to statistical significance. As a rule of thumb, the Rasch model fits the data well when the item mean square (“Infit”) indices are within the range of 0.70 to 1.30. The tables indicate that the majority of Infit indices are in the range of 0.70 to 1.30. The Infit statistics for science were within the recommended range. The Rasch model fits the data very well with an average Infit of approximately 1.0. Table 7.2.1: Summary of the Infit and Outfit Statistics by Grade—Science
INFIT OUTFIT Grade Measure Model Error MNSQ ZSTD MNSQ ZSTD
4 Mean 0.19 0.01 0.99 -1.26 0.99 -1.52 SD 0.33 0.00 0.08 7.75 0.14 8.20 Max 1.22 0.01 1.21 9.90 1.42 9.90 Min -0.38 0.00 0.78 -9.90 0.74 -9.90
8 Mean -0.08 0.01 1.00 0.80 1.00 0.79 SD 0.59 0.00 0.07 8.30 0.11 8.14 Max 1.73 0.01 1.15 9.90 1.27 9.90 Min -1.02 0.01 0.85 -9.90 0.73 -9.90
The Item Parameter tables located in Appendix G contain the displacement statistics for the common items generated from the anchor calibrations. The displacement statistic is a measure of the size of the change in the parameter estimate that would be observed in the next iteration if the targeted parameter were unconstrained and all other parameter estimates were held constant at current values. A large displacement value indicates lack of convergence, or the presence of
NJ ASK 2015 Grades 4 and 8 Technical Report 43
anchored or targeted values. It is recommended that “random displacements of less than 0.50 logits are unlikely to have much impact in a test instrument” (Linacre, 2006, p. 280).41 The tables in Appendix G show that all displacement statistics of the common items are smaller than 0.50, indicating the anchored calibrations converged well. 7.3 Summary of Cut Scores Total scores for NJ ASK 2015 were reported in scale scores with a range of 100–300. Note that scores of 100 and 300 are a theoretical floor and ceiling and may not actually have been observed for some grades and/or content areas. However, for each test, for a perfect raw score, the scale score was set to 300. A scale score of 200 represents the cut point between Partially Proficient (PP) and Proficient (P), while a scale score of 250 represents the cut point between Proficient and Advanced Proficient (AP). The scale score ranges are as following:
Partially Proficient 100 to 199 Proficient 200 to 249 Advanced Proficient 250 to 300
To produce the scale score ranges above, linear transformations were applied to theta estimates and scale scores. The following formula was used to obtain the slopes and intercepts for the transformation functions:
−−
−+
−−
= 112
121
12
12 )()()(()()()( θθθθθ
yscyscyscyyscyscysc
where 1θ and 2θ are person parameter estimates that correspond to the cut score points, and sc(y1) and sc(y2) are scale score points. The above formula was adopted from Kolen and Brennan (2004, p. 337)42. New standards have been set for various grades and content areas of the NJ ASK assessment at different times. Regardless of when new standards have been set, sc(y1) has always been 200 and sc(y2) has always been 250. Slopes and intercepts of the transformation functions are summarized in Table 7.3.1. The following sections specify how these slopes and intercepts were used to generate the scale scores in each content area and grade level. The complete raw to scale score conversion tables can be found in Appendix H.
41 Linacre, J. M. (2006). A user’s guide to Winsteps Ministep Rasch-model computer program. Chicago: MESA
Press. 42 Kolen, M. J., & Brennan, R. L. (2004). Test equating: Methods and practice. NY: Springer.
NJ ASK 2015 Grades 4 and 8 Technical Report 44
Table 7.3.1: Slope and Intercept of Theta to Scale Score Transformation
Test Grade Proficient Advanced Proficient
RS Theta SS RS Theta SS Science 4 15 -0.0144 200 26 0.6408 250 8 24 -0.2076 200 41 1.3220 250 After calibrating the 2015 Science assessments in grades 4 and 8 to the base scales, the raw score to theta conversion table produced by Winsteps was used to develop the raw to scale score tables. Using the slopes and intercepts shown in Table 7.3.1, linear transformations of the Winsteps theta estimates were conducted to produce the final science scaled scores for grades 4 and 8. NJDOE policy requires that scaled scores below 100 are rounded up to 100 and scaled scores above 300 are rounded down to 300. Additionally, NJDOE requires that the following rules apply: 1. If a raw score maps to an unrounded scaled score that is greater than 199.499 and less than or equal to
200.000, it will serve as the proficient cut score. Otherwise, the highest raw score that maps to a scaled score less than or equal to 199.499 will serve as the cut score. The selected cut score will be assigned a value of exactly 200.
2. If a raw score maps to an unrounded scaled score that is greater than 249.499 and less than or equal to 250.000, it will serve as the advanced cut score. Otherwise, the highest raw score that maps to a scaled score less than or equal to 249.499 will serve as the cut score. The selected cut score will be assigned a value of exactly 250.
3. In the unlikely event that two scores fall >199.499 and <200.000 or >249.999 and <250.000, the lower of these two scores would become the cut score.
4. When the implementation of the above rounding rules results in two raw scores mapping to a rounded scaled score of 200 or two raw scores mapping to a rounded scaled score 250, the scaled score associated with the higher of the two raw scores will be adjusted upwards by one (1) scaled score. Thus, the higher of the two raw scores at the proficient or advanced proficient cut point will be mapped to a rounded scaled score of 201 or 251, respectively.
NJ ASK 2015 Grades 4 and 8 Technical Report 45
7.4 Equating and Scaling for Braille, Large-Print, and Alternate forms This section describes the equating procedures for scores from the Braille, large-print, and Alternate forms of the NJ ASK 2015. Items that the Commission of the Blind deemed inappropriate were not scored for student with visual impairments. Braille and large-print test forms were constructed by removing the inappropriate items from the corresponding regular test forms. No items were removed from the 2015 NJ ASK large-print forms for any grade. All required modifications are summarized in Table 7.4.1. Results from these “special equatings” appear in Appendix H. Table 7.4.1: Special Equatings
Braille and Large-Print Tests. Several assumptions had to be made in order to equate the scores of the Braille and large-print tests to the scores of the regular test. First, it was assumed that the latent trait measured by the Braille tests and the regular test was the same. Given the fact that the same items were used across the tests within each content area, with the exception of the removed items, it seemed reasonable to assume that changes to item format or item presentation would not greatly change the overall latent trait or construct measured by each assessment. A second, stronger assumption, however, was that item parameters across the tests within each content area were identical. This of course is a very strong assumption considering the different item formats across the tests. However, this assumption was necessary because sample sizes for the Braille tests were too small to get reliable parameter estimates. Moreover, making these assumptions is considered common and current best practice for these populations. Because the first assumption noted above is reasonable, i.e., for each test the mathematics assessment measures mathematics, the following steps for equating the Braille tests to the regular tests were used:
• Conduct an anchored item calibration. The items in Table 7.4.1 were removed and the parameters and steps of the Braille test items were fixed with the estimates resulting from the corresponding regular test items.
• Transform the theta metric to the scale score metric. Because the theta values obtained from the anchored calibration and those obtained from the regular test score calibration are on the same metric, the transformation functions applied to the regular test scores can be applied to the Braille test scores.
NJ ASK 2015 Grades 4 and 8 Technical Report 46
• Create raw score to scale score look-up tables for each Braille test. In cases where no raw score corresponds to the cut scale scores (200 for Proficient and 250 for Advanced Proficient), the raw score point immediately below the cut score was assigned as the cut point scale score.
Alternate Forms. A security violation or a deviation from the standardized administration procedures of the NJ ASK is defined as a testing breach. An alternate form of the test was constructed for each grade of the 2015 NJ ASK tests with items from previous administrations. The alternate form was administered to all students of a given grade affected when a breach occurred. Equating of the alternate forms was conducted in a manner similar to that used with the Braille.
NJ ASK 2015 Grades 4 and 8 Technical Report 47
PART 8: RELIABILITY The New Jersey Department of Education is required by federal law to ensure that the instruments it uses to measure student achievement for school accountability provide reliable results. This section shows that results of the NJ ASK Science 2015 grade 4 and 8 measure student achievement in a reliable manner. The size of the measurement error associated with test scores is reasonable and can be taken into account when interpreting the scores for individual students. 8.1 Classical Reliability Estimates of Test Scores Reliability and Measurement Error A detailed review of the relationship between reliability and measurement can be found in the 2009 NJ ASK Technical Report (PTM 1507-34), Part 8 , Section 8.1. Raw Score Internal Consistency Consistency of individual student performance was estimated using Cronbach’s coefficient alpha. Coefficient alpha is conceptualized as the proportion of total raw score variance that may be attributed to a student’s true score variance. Ideally, more score variance should be attributable to true test scores than to measurement error. Alpha is an appropriate index of internal consistency for use on untimed tests such as NJ ASK. Separate analyses were performed for each grade level. Both MC and CR items scores were used in the computations. Coefficient alpha can be interpreted as a lower bound to reliability and was estimated using the following formula:
2
1Cronbach 21
1
i
n
Yi
X
nn
σα
σ=
= − −
∑,
where n is the number of items, 2iYσ is the variance of item i, and 2
Xσ is the variance of total
score. SEMs were calculated using the following formula:
Cronbach1XSEM S α= − ,
where XS is the standard deviation of observed total scores. Table 8.1.1 summarizes coefficient alpha and SEMs by content and form. All groups are included in the content area N counts as well as reported separately in Table 8.1.1. Tables 8.1.2 through 8.1.3 summarize coefficient alpha and SEMs of content clusters by test. Tables 8.1.2a – 8.1.3a summarize coefficient alpha and SEMs by item type at the test and cluster level for
NJ ASK 2015 Grades 4 and 8 Technical Report 48
MC items. Reliability coefficients are commonly low when based upon small numbers of items.43 Note that Spanish test takers are included in Tables 8.1.2 through 8.1.3. Table 8.1.1: Summary of Coefficient Alpha and SEM by Grade and Content Area
Grade Test Form* N-Count Alpha SEM 4 Science OP 98,073 0.83 2.75 Science, Spanish SP 833 0.75 2.83 Science, Special Education OP 16,158 0.85 2.83 Science, Current Limited English Proficient OP 3,769 0.80 2.85
8 Science OP 99,814 0.88 3.30 Science, Spanish SP 1,190 0.71 3.35 Science, Special Education OP 15,506 0.86 3.33 Science, Current Limited English Proficient OP 2,903 0.78 3.34
* OP: Operational Test; SP: Spanish Version; N-counts were insufficient to produce values for Braille and large-print.
Table 8.1.2: Grade 4 Coefficient Alpha and SEM for Clusters
* Except where a cluster contains no constructed responses, the statistics apply to item types that comprise parts of tests or parts of clusters.
43 See the following for a further discussion of the relationship between measures of reliability and numbers of items: Traub, R. E. and Rowley, G. L. (2008). Understanding reliability. Instructional topics in educational measurement. Madison, WI: National Council on Measurement and Education 176-177.
NJ ASK 2015 Grades 4 and 8 Technical Report 49
Table 8.1.3: Grade 8 Coefficient Alpha and SEM for Clusters
* Except where a cluster contains no constructed responses, the statistics apply to item types that comprise parts of tests or parts of clusters.
8.2 Reliability of Performance Classifications Two measures of reliability are presented below in Table 8.2.1. Stratified Alpha is used to assess the reliability of the different item types, e.g., multiple choice and constructed response. Stratified Cronbach Alpha can be calculated using the following formula:
Stratified ( )2
21
1 i ii
t
σ ρα
σ′−
= −∑ 44
where
2iσ = variance of score on cluster i, 2tσ = variance of total score, and
iiρ ′ = reliability coefficient of score on cluster i.
44 Maryland school assessment – Reading: Grades 3 through 8 (2004).
Reliability index for proficiency classifications (kappa) is an estimate of how reliably the test classifies students into the performance categories (Partially Proficient, Proficient, and Advanced Proficient). Kappa was computed with the BB-CLASS program (Brennan, 2004)45 that is based on the beta-binomial model. Coefficient kappa is given by:
1c
c
ϕ ϕκ
ϕ−
=−
,
where ϕ is the probability of a consistent classification and ϕc is the probability of a consistent classification by chance. A classification consistency index can be regarded as the percentage of examinees that would hypothetically be assigned to the same achievement level if the same test was administered a second time or an equivalent test was administered under the same conditions. Table 8.2.1 displays two cut scores for each grade. The lower cut score is the minimum raw score required to be classified as proficient and the higher cut score is the minimum raw score required for classification as advanced proficient. Table 8.2.1: Consistency Indices for Performance Levels—Science
Grade Alpha SEM Stratified Alpha Cut Score Kappa ϕ
Item Maps and Test Information Functions Item maps for science are presented in Appendix I. These figures indicate how well the item difficulties and person ability levels match. The test information function is another method of assessing the reliability or the precision of a test. The reliability of a test, however, is not uniform across the entire range of test scores. The highest and lowest scores typically have more measurement error than do scores in the middle of the range because more examinees tend to score in the middle of the score range. With item response theory (IRT), the item and test information functions can assess test reliability across the range of scores. The item information function is the probability of a correct response multiplied by the probability of an incorrect response. Item information functions (Iij) for every item (j) at every level of student ability (i) can be calculated for each item using the following equation:
( ) ( ), * 1ij i j ij ijI P Pθ δ = −
45 Brennan, R. L. (2004). Manual for BB-CLASS: A computer program that uses the beta-binomial model for
classification consistency and accuracy (version 1). CASMA Research Report 9. Iowa City, IA.
NJ ASK 2015 Grades 4 and 8 Technical Report 51
The total test information function for a given ability level is simply the sum of all the item information functions for that ability level (Lord & Novick, 196846; Hambleton, 198947). Computing an item information function for each ability level and summing these functions to derive test information functions for each ability level, one can plot the total information function for a test, as shown in Figures 8.2.2–8.2.15. Each item yields the greatest amount of information at the point at which the difficulty of the item (δj) is equal to the ability of the student (θi).
These figures illustrate the level of information at theta values ranging from – 4 to + 4. As shown, the information or reliability of the test scores is lower at the extremes and higher in the middle. More information implies less measurement error. Ideally, the Proficient cut score would occur at the peak of the information function where the most information and the least measurement error occur. Thus, scores in this area yield the most error free measurements. Two arrows appear in each TIF shown below. The arrow with the lower value on the x-axis (measure) represents the proficient cut and the arrow with the higher value represents the advance proficient cut. As depicted in these figures, the Proficient cut scores for science occur near the peak of information.
46 Lord, F. M., & Novick, M. R. (1968). Statistical theories of mental test scores. Reading MA: Addison-Welsley. 47 Hambleton, R. K. (1989). Principles and selected applications of item response theory. In R. L. Linn (Ed.), Educational measurement (3rd ed.). New York: American Council on Education and Macmillan.
NJ ASK 2015 Grades 4 and 8 Technical Report 52
Figure 8.2.1: Grade 4 Science Test Information Function
Prof Cut Point = -0.014 Adv. Prof Cut Point = 0.641
Target Cut Point = 0.020
NJ ASK 2015 Grades 4 and 8 Technical Report 53
Figure 8.2.2: Grade 8 Science Test Information Function 8.3 Conditional Estimate of Error at Each Cut-Score The NJ ASK 2015 Science 4 and 8 raw cut scores and the corresponding conditional standard error of measurement (CSEM) are summarized in Table 8.3.1. WINSTEPS calculates the standard error at each score point using item response theory and the information function. The equation for the standard error at each value of theta (ability) is given by
( )( )1ˆSE
Iθ
θ=
Prof Cut Point = -0.208
Target Cut Point = -0.154
Adv. Prof Cut Point = 1.322
NJ ASK 2015 Grades 4 and 8 Technical Report 54
where ( )I θ is the information function for a test at θ. For the Rasch model, the information provided by a test at θ is the sum of the item information functions at θ. Interpolation of the raw cut scores were used to derive the CSEM from the standard error associated with the theta at each cut score. Table 8.3.1: Raw Score Cut Scores with Conditional Standard Error of Measurement
8.4 Rater Reliability Tables 8.4.1 and 8.4.2 show the percentages of constructed-response items scored with exact agreement, adjacent agreement, and resolution needed by grade. Raters used scoring rubrics with a score range of 0 to 3. There were no half points assigned for any of the CR items. Only 10% of the constructed-response items were read by a second rater. The purpose of the second reading for the constructed-response items was to investigate the consistency between raters for the NJ ASK Science 2015. As shown in the tables below, the exact agreement rates ranged from 69.0% to 92.6% at the test level. An adjacent score is a score assigned by the second rater that is no more than ±1 score point from the score assigned by the first rater. The adjacent agreement rates ranged from 7.2% to 26.4%. On average, approximately 1.5% of the scores require resolution by a third rater. Table 8.4.1: Grade 4 Scoring Consistency of Constructed-Response Items
% Raters in
Exact Agreement % Raters in
Adjacent Agreement % Resolution Needed Science Total 80.8 16.8 2.2
CR 1 69.0 26.4 4.2 CR 2 92.6 7.2 0.2
Table 8.4.2: Grade 8 Scoring Consistency of Constructed-Response Items
% Raters in
Exact Agreement % Raters in
Adjacent Agreement % Resolution
Needed Science Total 82.5 16.4 0.8
CR 1 77.4 21.2 1.2 CR 2 87.6 11.6 0.4
NJ ASK 2015 Grades 4 and 8 Technical Report 55
PART 9: VALIDITY The Standards for Educational and Psychological Testing states, “Ultimately, the validity of an intended interpretation of test scores relies on all the available evidence relevant to the technical quality of a testing program. This includes evidence of careful test construction; adequate score reliability; appropriate test administration and scoring; accurate score scaling, equating, and standard setting; and careful attention to fairness for all examinees” (p. 17).48 While this section summarizes evidence supporting claims as to the validity of NJ ASK performance scores, many parts of this technical report provide appropriate evidence for validity. Given the procedural and empirical evidence available and the rationale presented below, valid performance standards-based interpretations and uses of the scores are generally supported. The following section begins with a review of important federal statutes requiring the NJ ASK Science 4 and 8 and explains the purposes and intended uses of performance test scores, suggesting the value implications of performance scores for schools, teachers, students, and parents. Content-related evidence supporting validity is presented in terms of the adequacy and appropriateness of the state content standards and the representation of the content standards on the tests. Then, validity evidence based on the internal structure of NJ ASK is provided through a correlational analysis of NJ ASK content clusters with each other. Reference to specific Standards within the Standards for Educational and Psychological Testing are provided where appropriate. 9.1 Content and Curricular Validity49 Content validity of a test refers to the degree to which the content of a test is congruent with the purpose of testing, as defined by the curriculum. Baker and Linn (2002)50 suggest that “Two questions are central in the evaluation of content aspects of validity. Is the definition of the content domain to be assessed adequate and appropriate? Does the test provide an adequate representation of the content domain the test is intended to measure?” (p. 6). The following two sections help answer these two very important questions and also address Standard 1.6 of the Standards for Educational and Psychological Testing. Appropriateness of Content Definition In 1996, the New Jersey State Board of Education adopted the New Jersey Core Curriculum Content Standards, an ambitious framework for educational reform in the State’s public schools. New Jersey’s standards were created to improve student achievement by clearly defining what all students should know and be able to do at the end of thirteen years of public education. Since 48 American Educational Research Association, American Psychological Association, and National Council on
Measurement in Education. (1999). Standards for Educational and Psychological Testing. Washington: APA. 49 Standard 1.6 – When the validation rests in part on the appropriateness of test content, the procedures followed in
specifying and generating test content should be described and justified in reference to the construct the test is intended to measure or the domain it is intended to represent. If the definition of the content sampled incorporates criteria such as importance, frequency, or criticality, these criteria should also be clearly explained and justified (page 18).
50 Baker, E. L., & Linn, R. L. (2002). Validity Issues for Accountability Systems. Center for the Study of Evaluation. Technical Report 585, Los Angeles, CA.
NJ ASK 2015 Grades 4 and 8 Technical Report 56
the adoption of those standards, the NJ DOE has continuously engaged in discussions with educators, business representatives, and national experts about the impact of the standards on classroom practices. To assist teachers and curriculum specialists in aligning curriculum with the standards, the NJ DOE provided local school districts with a curriculum framework for each content area. The frameworks provided classroom teachers and curriculum specialists with sample teaching strategies, adaptations, and background information relevant to each of the content areas. The review process required by the State Board involved teachers, school administrators, students, parents, and representatives from business, higher education, and the community. In addition, several content areas were reviewed by Achieve, Inc., and the Council of Chief State School Officers (CCSSO). In response to this unprecedented review, the 2004 New Jersey Core Curriculum Content Standards provide the level of specificity and depth of content that better prepares students for post secondary education and employment. The standards are based on the latest research in each of the content areas and identify the essential core of learning for all students. Since the adoption of the original 1996 New Jersey Core Curriculum Content Standards (CCCS), the New Jersey State Board of Education approved administrative code that implements all aspects of standards-based reform. N.J.A.C. 6A:8 requires districts to align all curriculum to the standards; ensure that teachers provide instruction according to the standards; ensure student performance is assessed in each content area; and provide teachers with opportunities for professional development that focuses on the standards. Adequacy of Content Representation The content-related evidence of validity includes the extent to which the test items represent these specified content domains and cognitive dimensions. Adequacy of the content representation of the NJ ASK is critical because the tests must provide an indication of student progress toward achieving the knowledge and skills identified in the CCCS, and the tests must fulfill the requirements under NCLB. Adequate representation of the content domains defined in the CCCS is assured through use of a test blueprint and a responsible test construction process. New Jersey performance standards, as well as the CCCS, are taken into consideration in the writing of multiple-choice and constructed-response items and constructed-response rubric development. Each test must align with and proportionally represent the sub-domains of the test blueprint. Evidence to support the above is described in Part 2, Test Development Process, and Part 6, Item and Test Statistics. Part 2 provides evidence that the NJ test specifications were followed in the development of test items; alignment of items with the CCCS; and the review of items by NJ content experts, teachers, and Sensitivity committee. Item writers were recruited with specific qualifications and were trained and validated before they started writing items. Tables 2.1.3 through 2.1.5 in Part 2 provide a comparison of target test construction maps to actual test maps for science. The tables indicate that the target blueprint representation in terms of number of items and score points for each sub-domain was adequately met.
NJ ASK 2015 Grades 4 and 8 Technical Report 57
The CCCS are represented on each test by balancing sub-domain coverage on each test, by proportionally representing items corresponding to Partially Proficient, Proficient, and Advanced Proficient performance categories on each test, and by matching item format to the requirements of the content and standards descriptions. Adherence to Test Specification MI followed statistical and content specifications to make sure that the 2015 NJ ASK assessments are valid. The statistical specification described the psychometric characteristics of the items included in the 2015 assessments. The primary statistical targets used for NJ ASK test assembly were the p-value estimates also called proportion correct or item difficulty, the point bi-serial correlation which is a measure of how well the items discriminate among test takers and is related to the overall reliability of the test, and proportion correct value which is an indication of test difficulty. Similarly, the minimum target value for a proportion-correct was set at 0.25 and maximum was set at 0.95. In addition, content experts made sure that the items selected for the 2015 NJ ASK tests were free from poor model fit and differential item functioning when they were first field tested. Content specification pertains to the adherence to content representation across content standards and sub-domains. MI developed all test items to conform to the NJ ASK content standards and test blueprints. Part 2 of this document describes test development activities of the NJ ASK assessments. The actual test maps for NJ ASK are shown in Tables 2.1.3 through 2.1.5 and the 2015 tests configurations are shown in Tables 2.1.1 and 2.1.2. The Tables indicate that the 2015 assessments adequately adhere to the test blueprints. Qualified item writers who were familiar with the NJ state specifications and populations were recruited and trained for item writing. Detail procedures are described in Part 2 of this document. The items were reviewed by NJ’s content review committee and sensitivity review committee comprised of NJ teachers making sure that the items align with the state standards and are free from bias for a specific group of student population. Only items accepted from the committees were added to the bank for possible use in future operational tests. Test Administration and Accommodations Part 3 of this report describes the test administration process. In order to securely administer the tests the test administrator were trained on the process and test co-coordinator manuals were produced for the step by step process. A test form distribution list was prepared for the proportional representation of DFG prior to the test administration. Tests were administered under standard condition. For the case where the standard condition was compromised or breached a separate alternate form was developed for each grade and content area. The alternate test forms matched test blueprint and difficulty of the regular tests. The tests were also translated into large-print and Braille, and a separate Spanish version of the test was developed for state approved accommodations for LEP. Similarly, various accommodations (see Appendix C for the list of accommodations) were offered for students identified by IEP and 504 plans to minimize assessment ambiguity and inaccuracy.
NJ ASK 2015 Grades 4 and 8 Technical Report 58
9.2 Construct Validity51 Because the NJ ASK testing program assesses student performance in several content areas using a variety of testing methods, it is important to study the pattern of relationships among the content areas and testing methods. Therefore, this section addresses evidence based on responses and internal structure. One method for studying patterns of relationships to provide evidence supporting the inferences made from test scores is the multi-trait matrix. Tables 6.3.1 through 6.3.2 summarize Pearson correlation coefficients among test content domains and clusters by grade level. The correlations between clusters within a content area were generally found to be higher than the correlations between clusters across the content areas. Scaling and Performance Score Reporting The NJ ASK Science grade 4 and 8 are scaled in several ways: raw score points, Item Response Theory (IRT), and performance standard level (based on scale-score cuts). New Jersey actively promotes the use of performance level results, reporting them annually on each content test at the student, school, district and state levels. Individual student and average scale scores are also used, but should play a secondary role, generally interpreted with reference to their distance from performance-score cut points. Test results are reported for students as a whole as well as by student group including sex, ethnicity, disability, English language proficiency, migrant status, and DFG. Scores are reported to schools and districts in the annually published reports (see Part 10: Reporting). NJ ASK performance scores indicate that an individual student performs at the Partially Proficient, Proficient, and Advanced Proficient level in a content area. Performance standard descriptions associated with each level provide details of the performance that students have met or exceeded. No stakes for students or teachers are attached by the state to student-level scores. Teachers are counseled to interpret individual student scores only in the context of other assessment results and their own experience.
51 Standard 1.11 – If the rationale for a test use or interpretation depends on premises about the relationships among
parts of the test, evidence concerning the internal structure of the test should be provided. Standard 1.12 – When interpretation of subscores, score differences, or profiles is suggested, the rationale and
relative evidence in support of such interpretation should be provided. Where composite scores are developed, the basis and rationale for arriving at the composites should be given.
NJ ASK 2015 Grades 4 and 8 Technical Report 59
9.3 Criterion-Related Validity Validity evidence related to other Standards is listed below: Standard 1.552
• The composition of the sample of examinees from which validity evidence was obtained is described in detail in Part 6 – Item and Test Statistics, including major relevant sociodemographic characteristics. This information is imbedded within the Tables of Part 6. These tables also provide descriptive statistics for number correct raw score and for scale scores. Statistics include N-counts, means, standard deviations, minimum and maximum values, and a variety of data disaggregations, including student demographic group and DFG.
Standard 1.753
• Standard setting procedures, including the selection process and the characteristics of judges, is described in detail in Part 5.
• The NJ ASK Science 2015 4 and 8 constructed-response items required hand scoring. The processes of selecting and training scorers, reading and scoring papers, and monitoring scoring are described in detail in Part 4.
Standard 1.1354
• The conditions under which the data were collected are described in Part 2. Information about the administration of NJ ASK is available in the New Jersey Assessment of Skills & Knowledge Spring 2015 Test Coordinator Manual Grades 4 & 8 which can be found at https://www.measinc.com/nj/NJASK/Default.aspx
52 Standard 1.5 - The composition of any sample of examinees from which validity evidence is obtained should be
described in as much detail as is practical, including major relevant sociodemographic and developmental characteristics.
53 Standard 1.7 – When a validation rests in part on the opinions or decisions of expert judges, observers, or raters, procedures for selecting such experts and for eliciting judgments or ratings should be fully described. The qualifications, and experience, of the judges should be presented. The description of procedures should include any training and instructions provided, should indicate whether participants reached their decisions independently, and should report the level of agreement reached. If participants interacted with one another or exchanged information, the procedures through which they may have influenced one another should be set forth.
54 Standard 1.13 - When validity evidence includes statistical analyses of test results, either alone or together with data on other variables, the conditions under which the data were collected should be described in enough detail that users can judge the relevance of the statistical findings to local conditions. Attention should be drawn to any features of a validation data collection that are likely to differ from typical operational testing conditions and that could plausibly influence test performance.
PART 10: REPORTING Previously, scores were reported in two cycles. Data for Cycle I reporting were produced after districts submit record changes. Data for Cycle II reporting were produced after the completion of automatic rescoring of the constructed-response items and writing tasks. Beginning in 2011, only one reporting cycle was used. Reports were produced after districts submitted record changes and the automatic rescoring of the constructed response items and writing tasks were completed. 10.1 Reports While there is only one reporting cycle currently, the same reports were produced as in previous years, with one exception. The Preliminary Performance by Demographic Group—School and District are no longer produced. The following reports were produced separately for each grade.
• Student Sticker (1 per student) • Individual Student Report (ISR) (2 per student) • Student Roster – Science (Grade 8 only) • All Sections Roster • Performance by Demographic Group –School • Performance by Demographic Group –District • Cluster Means Report
Brief descriptions of each report and the score reporting categories can be found in the 2015 NJ ASK Score Intrepretation Manual (PTM 1510.52), Part 3, at http://www.state.nj.us/education/assessment/njask/ref/SIM15.pdf. 10.2 State Summary Reporting The state summary data file contains the same type of test results based on the performance by demographics reports at the state, district, and school levels. This data file is available in text and in Excel formats.
Grand Total 17,479 10,510 9,603 12,717 12,633 14,116 18,918 4,481 480 705 2,598 236 0 104,476
1 DFG, or district factor group, is a district-level socioeconomic measure based upon 2000 U.S. Census data, with A referring to districts at the lowest end and J at
the highest end. N = districts with too low a percentage of students in public schools for a DFG value to be assigned. O and S = schools receiving special populations. R = charter school. V= vocational school
NJ ASK 2015 Grades 4 and 8 Technical Report, Appendix A 63
Table A.2: NJ ASK 2015 Grade 8 Test Form Distribution Plan
Grand Total 15,587 10,455 9,923 13,420 13,787 13,830 20,443 4,507 307 1,249 2,238 369 22 106,137
1 DFG, or district factor group, is a district-level socioeconomic measure based upon 2000 U.S. Census data, with A referring to districts at the lowest end and J at
the highest end. N = districts with too low a percentage of students in public schools for a DFG value to be assigned. O and S = schools receiving special populations. R = charter school. V= vocational school
NJ ASK 2015 Grades 4 and 8 Technical Report, Appendix B 64
APPENDIX B CHECKLIST FOR FORMS DEVELOPMENT
NJ ASK 2015 Grades 4 and 8 Technical Report, Appendix B 65
Table B-1: Checklist for Forms Development
Item Data Average Target Rasch value based on standard setting year* As many items as possible have a p-value above 0.35 and below 0.90 As many items as possible have a pt. bis above 0.25 No item was used as a sample item.
* Targets are the theta cuts from the standard setting year. Item Distribution Item standards are distributed equally throughout the test There are a variety of indicators assessed in each standard MC items are generally in passage order, and OE items are at the end of the passage sets. WT items are in the appropriate places. Answer key distribution is nearly equal between answer choices: A B C D Having more than 2 MC items in a row with the same answer is avoided.
Name, Gender, and Ethnicity Distributions Check gender distribution (number of passages or prompts which have a male and/or female):
Male Female Both Check ethnicity distribution (number of passages or prompts):
Caucasian Hispanic Asian African American Other
There are NOT two or more items in the same session that have similar contexts. There are NOT two or more items with similar answers or answer choices. Sample items and test items do NOT clue each other. Items do NOT have any fairness or sensitivity related to the names and contexts of the items.
NJ ASK 2015 Grades 4 and 8 Technical Report, Appendix C 66
APPENDIX C MODIFICATIONS OF TEST ADMINISTRATION PROCEDURES FOR LIMITED ENGLISH PROFICIENT, SPECIAL EDUCATION STUDENTS, AND STUDENTS ELIGIBLE UNDER SECTION 504
OF THE REHABILITATION ACT OF 1973
NJ ASK 2015 Grades 4 and 8 Technical Report, Appendix C 67
Accommodations for Limited English Proficient (LEP) Students NCLB prohibits exemptions from testing based on limited English proficient (LEP) status. As permitted by NCLB, Spanish forms of the test were available for LEP students whose dominant language was Spanish, as identified by school districts. For those LEP students who were tested in English, one or more of the following accommodations were permitted.
• Additional time up to 150% of the administration times indicated • Translation of directions only to the student’s native language. • Translations of passages, items, prompts, and tasks are NOT permitted • Use of a bilingual dictionary, preferably one normally used by the student as part of the
instructional program. Accommodations for Special Education students, and students eligible under section 504 In accordance with the Individuals with Disabilities Education Act (IDEA), students who are receiving special education services must participate in each subject area of the age-appropriate statewide assessment with the following exception: Students with disabilities shall participate in the Alternate Proficiency Assessment in each content area where the nature of the student’s disability is so severe that the student is not receiving instruction in any of the knowledge and skills measured by the general statewide assessment and the student cannot complete any of the types of questions on the assessment content area(s) even with accommodation and modifications. (New Jersey Administrative Code Chapter 6A:14-4.11[a]2) Districts may use modifications of test administration procedures when administering the NJ ASK to special education students or to students eligible under Section 504 of the Rehabilitation Act of 1973. Decisions about participation and accommodations/modifications are made by the Individualized Education Program (IEP) or 504 team. Information about test content and item types from the test specifications booklets can be used to make this determination. Modifications in the areas listed below may be used separately or in combination. Any accommodations or modifications of test administration procedures for students eligible for special education under the IDEA or eligible under Section 504 of the Rehabilitation Act of 1973 must be specified in the student’s IEP or 504 accommodation plan. Accommodations or modifications must be consistent with the instruction and assessment procedures used in the student’s classroom. Students eligible for modifications under Section 504 may not be classified but do have a permanent or temporary impairment in a major life function (for example: performing manual tasks, walking, seeing, hearing, speaking, etc.).
NJ ASK 2015 Grades 4 and 8 Technical Report, Appendix C 68
ACCEPTABLE ACCOMMODATIONS OR MODIFICATIONS Code
A. Setting Accommodations 1. Administering the assessment:
a. individually in a separate room b. in a small group in a separate room c. in the resource room d. in a special education classroom e. using carrels f. at home or in a hospital (this depends on the nature of the
assessment task) 2. Seating the student in the front of the room near the examiner or proctor 3. Seating the student facing the examiner or proctor 4. Providing special lighting 5. Providing special furniture (e.g., desks, trays, carrels)
B. Scheduling Accommodations
1. Adding time as needed 2. Providing frequent breaks 3. Terminating a section of the test when a student has indicated that he/she
has completed all the items he/she can. The test examiner must ensure that the student has attempted all items in a section since items are not ordered by difficulty. When this accommodation is used, the test must be administered in a small group or individually to avoid distraction.
C. Test Materials Modifications
1. Administering the large-print version of test materials 2. Administering the Braille version of test materials
D. Test Procedures Modifications
1. Administration modifications a. reading directions aloud b. reading test items (not reading passages) aloud c. providing and ensuring that amplification (hearing aid and/or FM
system) is in working order d. using a sign language or cued speech interpreter for administration of directions or items but not reading passages e. masking a portion of the test booklet and/or answer folder to eliminate visual distractors or providing reading windows f. repeating, clarifying, or rewording directions g. providing written directions on a separate sheet or transparency h. using an examiner who is familiar with the student
NJ ASK 2015 Grades 4 and 8 Technical Report, Appendix C 69
i. using an examiner who can communicate fluently in sign language (American Sign Language or a form of Manually Coded English) j. providing manipulatives for math items k. using graph paper for math section l. using a Braille ruler and talking calculator m using tactile or visual cues for deaf or hard of hearing students to indicate time to begin, time remaining, and time to end a particular part of the test
2. Response modifications
a. having an examiner record the student’s identifying information on the answer folder, or grid corrections to the pre-ID label
b. dictating oral responses to a scribe (person who writes from dictation) – student must indicate all punctuation and must spell all key words c. using a Braille writer to record responses d. signing responses to a sign language interpreter (student must indicate all
punctuation and must spell all key words) e. recording responses on a word processor f. using large-face calculators g. using talking calculators h. providing an Augmentative Communication device i. using a larger diameter or modified special grip #2 pencil j. masking portions of the answer folder to eliminate visual distractors k. marking answers in the test booklet (an examiner would transfer the answers to an answer folder) l. Allowing separate additional continuation pages for writing tasks. These pages MUST be properly marked to link them to the correct student for credit.
OTHER CONSIDERATIONS
Ensure that:
a. any medication has been appropriately adjusted to prevent interference with the student’s functioning. b. eyeglasses are used, if needed. c. hearing aids, FM systems, Augmentative Communication devices, word processors, or other equipment are functioning properly. d. source and strength of light are appropriate. e. all students can clearly see and hear the examiner. f. all deaf or hard of hearing students who communicate aurally/orally are
watching the examiner when instructions are given. g. responses to CR items and writing tasks which are written or typed on separate sheets of paper by students eligible for this accommodation are labeled with student data paper-clipped to the front of the answer folder, and placed in the fluorescent orange envelope provided. Copies of these pages
NJ ASK 2015 Grades 4 and 8 Technical Report, Appendix C 70
should be made and retained on file by the school district until scores are received. h. students using the large-print test booklets
1. mark their answers in the large-print answer folder. All responses must be transcribed into the regular answer folder provided in the large print kit.
2. may be instructed to skip items identified in the LP instructions. The spaces for these items must be left blank on the student’s answer
folder (included in the large-print kit). 3. who dictate responses on CR items and writing tasks
indicate all punctuation and spell all key words. i. students using the Braille test booklets
1. are instructed to bring a Braille ruler and a talking calculator to the test session.
2. are instructed to skip dropped items identified in the Braille instructions. The spaces for these items must be left blank on the student transcription answer folder (included in the Braille kit).
3. have answer folders transcribed from the Braille version by the examiner.
4. dictate their answers to the examiner or use a device that produces Braille. For dictations and responses recorded in Braille:
• Students must indicate all punctuation and must spell all key words.
• Examiners must transcribe the Braille responses into the regular answer folder included in the Braille kit.
j. students who communicate in sign language 1. have an interpreter to translate oral directions and test items (but not the Reading passages in the English Language Arts section of the test). The interpreter should be able to communicate in the mode used by the student, American Sign Language or a form of Manually Coded English. The interpreter should be instructed to interpret so as not to give the answer to the student through the use of a particular sign or finger spelling.
2. using American Sign Language for CR and writing task responses will sign the responses to the interpreter who will interpret them into spoken English and a scribe will record the responses in the answer folder. 3. using Signed English or cued speech will sign/cue to the interpreter who will transliterate (word for word) into spoken English and a scribe will record the responses.
.
NJ ASK 2015 Grades 4 and 8 Technical Report, Appendix D 71
APPENDIX D SCORING RUBRICS
NJ ASK 2015 Grades 4 and 8 Technical Report, Appendix D 72
3-Point Response Student response is reasonably complete, clear, and satisfactory.
2-Point Response Student response has minor omissions and/or some incorrect or non-relevant information.
1-Point Response Student response includes some correct information, but most information included in the response is either incorrect or not relevant.
0-Point Response Student attempts the task but the response is incorrect, irrelevant, or inappropriate.
NJ ASK 2015 Grades 4 and 8 Technical Report, Appendix E 73
APPENDIX E STANDARD SETTING
PERFORMANCE LEVEL DESCRIPTORS
NJ ASK 2015 Grades 4 and 8 Technical Report, Appendix E 74
Standard Setting Demographic background information of PLD panelists and standard setting participants from the 2008 and 2009 meetings can be found in Appendix E1 of the 2009 NJ ASK Technical Report (PTM 1507-34),
NJ ASK 2015 Grades 4 and 8 Technical Report, Appendix E 75
New Jersey Assessment of Skills and Knowledge (NJ ASK)
and Grade Eight Proficiency Assessment (GEPA) Performance Level Descriptors
Science Grade 8
Proficient The Proficient student can recognize the structural levels of living things. This student knows that some traits of organisms are beneficial and some detrimental. This student can interpret visual and textual data to understand the relationship within a food web and the interdependence of living and nonliving systems.
The proficient student can recognize the effect force has on an object, trace the flow of energy through a system, and use the properties of matter to identify and separate materials. This student can understand different types of energy and use information from data charts to interpret relationships and predict outcomes.
The proficient student can recognize the existence of a relationship between the moon and tides, recognize the different characteristics of the planets in the solar system, and understand the natural forces that change the surface of the Earth, including chemical and physical weathering.
Advanced Proficient The advanced proficient student can support scientific conclusions with valid contextual and visual data and make predictions based on the interactions of living things. This student is able to use interpretive skills to analyze visual and textual data in order to solve problems dealing with the application of force and energy.
The advanced proficient student understands the difference between types of energy waves and can recognize and apply experimental principles and empirical data.
The advanced proficient student can recognize the nature of the tides’ relationship to Earth, Sun, and moon; interpret topographical maps; and identify the steps in the process of weathering and erosion.
NJ ASK 2015 Grades 4 and 8 Technical Report, Appendix F 76
APPENDIX F SCALE SCORE CUMULATIVE
FREQUENCY DISTRIBUTIONS
NJ ASK 2015 Grades 4 and 8 Technical Report, Appendix F 77
Table F.1: Science Grade 4
Science Grade 4 All Students* Female Male Afr. A. Hispanic White Cumulative Cumul. Cumul. Cumul. Cumul. Cumul.