84
Trans-European Road Network, TEN-T (Roads) 2015 Performance Report December 2016

Trans-European Road Network, TEN-T (Roads)
2015 Performance Report
December 2016

Page 2 of 84
Trans-European Road Network, TEN-T (Roads): 2015 Performance Report
Prepared by: CEDR TASK GROUP N1 (PERFORMANCE INDICATORS)
Group leader Lars Bergman Sweden
Group members Stefan Resch Austria Christian Wampera Austria Frederic Plumier Belgium (Wallonia)
Elpida Epamenonda Cyprus Bo Ekman Denmark Eric thor Straten Denmark Roman Limbach Germany Katerina Romaidou Greece Olympia Stratigaki Greece Sandro La Monica Italy Randi Harnes Norway Grzegorz Obara Poland Anton Svigelj Slovenia Bine Pengal Slovenia Manuel de Lucas Tellez Meneses Spain Yan Cerf Switzerland Colin Bird UK (England)
Other contributors Thomas Spiegel Austria Hartmut Treichel Germany Peter Høier Denmark Jaan Ingermaa Estonia Matti Raekallio Finland Pekka Ovaska Finland Eirikur Bjarnason Iceland Brendan Kennedy Ireland Pier Paolo Cartolano Italy Arunas Rutka Lithuania Paul Mangen Luxembourg Sarah Anastasi Malta Peter Schout Netherlands Paal Tvedt Norway Jan Kristian Jensen Norway Aleksandra Cybulska Poland
Approved by: CEDR's GOVERNING BOARD on 6 October 2016 Edited and published by: CEDR's Secretariat General CEDR report 2016/04 ISBN: 979-10-93321-21-9 Disclaimer This document expresses the current position of CEDR. It does not necessarily represent the views of individual member countries and should not be considered the official position of member countries.

Page 3 of 84
Trans-European Road Network, TEN-T (Roads): 2015 Performance Report
EXECUTIVE SUMMARY
This is the fourth biennial report that CEDR has published on the performance of the TEN-T (Roads) network within CEDR member countries. CEDR's intention in collecting and publishing this information is to establish a stable set of data with which to monitor trends and identify changes in the performance of the TEN-T (Roads) network. As such, the report is a useful source of information for individual National Road Administrations (NRAs), regulatory bodies, and others for benchmarking purposes and for setting national performance targets. The first Performance Report was published in 2009 and since then, despite being voluntary, 24 of CEDR's 28 member countries have chosen to participate in at least one of the four reports. Together, these 24 countries cover approximately 90,000 km of the total 103,000 km TEN-T (Roads) network. This network represents the most important roads in Europe. More than two billion vehicle kilometres are driven on this network every day. The 2015 report provides a detailed snapshot of the performance of the TEN-T (Roads) network in CEDR member countries in 2015 and identifies overall trends in the performance of the network as a whole. The report shows that:
1 The TEN-T network includes the most important roads in Europe. 60% of the network consists of motorways (this proportion is gradually increasing) and 17% is made of up roads with more than 4 lanes. The network also includes 1,200 km of bridges and more than 1,000 km of tunnels. Investment in the TEN-T network is continuing, with planned capacity improvements identified on nearly 25% of the network.
2 The network is also very heavily trafficked. More than 40% of the network
carries in excess of 20,000 vehicles per day while 6% carries more than 80,000 vehicles per day, Traffic Density exceeds 12,000 vehicles per lane per day on 15% of the network, and HGVs comprise more than 20% of all traffic on nearly 20% of the network. The Traffic Flow for both all vehicles and HGVs specifically is increasing, particularly on motorways.
3 However, despite this, the network is relatively safe. The average Fatal
Accident Rate on motorways is less than 2 fatal accidents per BVehKm and less than 6 per BVehKm on non-motorways. However, at the same time, there are wide variations across the network.
The main change impacting on the 2015 report has been the implementation of the new TEN-T Guidelines in January 2014, which have resulted in CEDR members making significant changes to the roads included in the TEN-T as well as some re-categorisation of motorways and non-motorways. The 2015 report again demonstrates CEDR's ability to collect and report consistent data about network performance that can enable meaningful comparison of information and benchmarking between NRAs and that can support wider CEDR initiatives both now and in the future.

Page 4 of 84
Trans-European Road Network, TEN-T (Roads): 2015 Performance Report
CONTENTS
1 INTRODUCTION ............................................................................................. 6
1.1 Purpose of document ................................................................................................................ 6
1.2 Background and context ........................................................................................................... 6
2 ABOUT THE TEN-T (ROADS) NETWORK .................................................... 7
2.1 Scope of the report .................................................................................................................... 7
2.2 Content changes for the 2015 report ....................................................................................... 7
2.3 Participating countries in 2015 ............................................................................................... 10
2.4 National statistics .................................................................................................................... 11
2.5 Core and comprehensive networks ....................................................................................... 15
3 NETWORK TRENDS .................................................................................... 16
3.1 Road Type ................................................................................................................................ 16
3.2 Traffic Flow – All Vehicles ....................................................................................................... 17
3.3 Traffic Flow - HGV .................................................................................................................... 18
4 STRUCTURE OF THE NETWORK ............................................................... 20
4.1 Road Type ................................................................................................................................ 20
4.2 Number of Lanes ..................................................................................................................... 23
4.3 Length of Bridges .................................................................................................................... 26
4.4 Length of Tunnels .................................................................................................................... 28
4.5 Physical Environment ............................................................................................................. 30
4.6 Intelligent Transport Systems (ITS) ....................................................................................... 33
5 PERFORMANCE OF THE NETWORK ......................................................... 34
5.1 Average Traffic Flow ............................................................................................................... 34
5.2 Traffic Density .......................................................................................................................... 37
5.3 Proportion of Heavy Goods Vehicles ..................................................................................... 40
5.4 Heavy Goods Vehicle Traffic Flow ......................................................................................... 43
5.5 Fatal Accident Rate ................................................................................................................. 46
5.6 Planned Capacity Improvements ........................................................................................... 49
6 CONCLUSIONS AND FUTURE DEVELOPMENTS...................................... 52
7 APPENDIX 1: METHODOLOGY AND DATA VALIDITY .............................. 53
8 APPENDIX 2: BASE DATA DEFINITIONS ................................................... 54
8.1 Road Type ................................................................................................................................ 54
8.2 Section Length ......................................................................................................................... 54

Page 5 of 84
Trans-European Road Network, TEN-T (Roads): 2015 Performance Report
8.3 Number of Lanes ..................................................................................................................... 55
8.4 Length of Bridges .................................................................................................................... 55
8.5 Length of Tunnels .................................................................................................................... 56
8.6 Physical Environment ............................................................................................................. 56
8.7 Intelligent Transport Systems (ITS) ....................................................................................... 57
8.8 Traffic Flow ............................................................................................................................... 57
8.9 Proportion of HGVs ................................................................................................................. 58
8.10 Fatal Accidents ........................................................................................................................ 58
8.11 Planned Capacity Improvements ........................................................................................... 59
9 APPENDIX 3: PERFORMANCE INDICATOR MAPS ................................... 60
9.1 Road Type ................................................................................................................................ 61
9.2 Number of Lanes ..................................................................................................................... 62
9.3 Length of Bridges .................................................................................................................... 63
9.4 Length of Tunnels .................................................................................................................... 64
9.5 Physical Environment ............................................................................................................. 65
9.6 Average Daily Traffic Flow ...................................................................................................... 66
9.7 Traffic Density .......................................................................................................................... 67
9.8 Proportion of Average Daily Traffic comprising HGVs......................................................... 68
9.9 Average Daily HGVs ................................................................................................................ 69
9.10 Annual Average Fatal Accident Rate ..................................................................................... 70
9.11 Planned Capacity Improvements ........................................................................................... 71
10 APPENDIX 4: TEN-T CORRIDORS .............................................................. 72
10.1 Scandinavian–Mediterranean Corridor .................................................................................. 73
10.2 North Sea–Baltic Corridor ....................................................................................................... 74
10.3 North Sea–Mediterranean Corridor ........................................................................................ 75
10.4 Baltic–Adriatic Corridor .......................................................................................................... 76
10.5 Orient/East–Med Corridor ....................................................................................................... 77
10.6 Rhine–Alpine Corridor............................................................................................................. 78
10.7 Atlantic Corridor ...................................................................................................................... 79
10.8 Rhine–Danube Corridor .......................................................................................................... 80
10.9 Mediterranean Corridor ........................................................................................................... 81
11 APPENDIX 5: LIST OF FIGURES ................................................................ 82

Page 6 of 84
Trans-European Road Network, TEN-T (Roads): 2015 Performance Report
1 INTRODUCTION
1.1 Purpose of document
The 2015 TEN-T (Roads) Performance Report is the fourth biennial report that CEDR has published on the performance of the TEN-T (Roads) network within CEDR member countries. CEDR's intention in producing these reports is to establish a stable set of data with which to monitor trends and identify changes in the performance of the TEN-T (Roads) network. As such, the report is a particularly useful source of information for individual NRAs, regulatory bodies, and others for benchmarking purposes and for setting national performance targets. It is also expected that the Performance Report and underpinning data will continue to evolve to provide the backbone for the collection, referencing, and graphical representation of any other data required by CEDR (e.g. customer consultation, environmental data, Open Data) in the future. This framework is considered to be the state of the art and represents the best source of performance data on the TEN-T (Roads) network.
1.2 Background and context
CEDR has long recognised the need for high-quality, comparable information about the performance of the TEN-T (Roads) network and has, therefore, undertaken work to develop a simple, low-cost performance reporting framework that could be used by all members to provide such data. This framework comprises a common location referencing model for the TEN-T (Roads) network and a set of common definitions for base data that is used as basis of the calculated performance indicators. The performance reporting framework was successfully implemented in SP1 and has been the basis of the biennial CEDR report on the performance of the TEN-T (Roads) network since 2009. Despite being voluntary, 24 of CEDR's 28 member countries have chosen to participate in at least one of the four reports. This framework has advantages over other systems that member countries have to use to provide data to the Commission and others because: all data is referenced to a common, stable location referencing model, all data is based on common data definitions, and objective data is provided directly by NRAs. The framework therefore improves data quality and consistency and makes comparison of this information more meaningful.

Page 7 of 84
Trans-European Road Network, TEN-T (Roads): 2015 Performance Report
2 ABOUT THE TEN-T (ROADS) NETWORK
2.1 Scope of the report
Since the first TEN-T (Roads) Performance Report was published in 2009, 24 of CEDR's 28 member countries have chosen to participate in at least one report. Together, these 28 countries account for 96,000 km of the total 103,000 km TEN-T (Roads) network. This network represents the most important roads in Europe. More than two billion vehicle kilometres are driven on the network every day. The total TEN-T (Roads) network within CEDR member countries is shown in Figure 1 overleaf. km % CEDR
member countries
Length of TEN-T (Roads) 103,000 - -
Length of TEN-T (Roads) in CEDR member countries 96,000 100 28
Length covered in all Performance Reports to date 90,000 94 24
Length covered in the 2015 Performance Report 74,000 77 19
The 2015 TEN-T (Roads) Performance Report includes data from 19 member countries, covering 74,000 km of the TEN-T (Roads) network. With the implementation of the new TEN-T Guidelines in January 2014, the concept of a 'core network' was introduced. The 74,434 km covered in the 2015 report includes 29,721 km of core network. Based on data provided by the countries themselves, Figure 2 shows the core and comprehensive networks covered by the 2015 report. Later sections of the report compare the performance of the core and comprehensive networks. At the same time, the Commission introduced nine 'core network corridors' to facilitate the coordinated implementation of the core network. The nine corridors are shown in Appendix 4, but no analysis of them has been included in the 2015 report. Future analysis could include the corridors and could provide performance information to the Corridor Committees on, for example, service stations, charging points for electric vehicles, etc.
2.2 Content changes for the 2015 report
As well as introducing the concept of core and comprehensive networks in accordance with the new TEN-T Guidelines, a number of other changes have been introduced in the 2015 report: The previous road type categories 'Expressway' and 'Ordinary Roads' have been
combined into a single category of 'Non-motorway' due to the lack of consistent definitions of 'Expressway'.
Network trends now include data from 2011, 2013, and 2015. Some new indicators have been added: 'Physical Environment', 'ITS', and
'Planned Capacity Improvements'. A number of indicators have been dropped or modified. The performance of national networks is compared to the average of all
participating countries.

Page 8 of 84
Trans-European Road Network, TEN-T (Roads): 2015 Performance Report
Figure 1: The TEN-T (Roads) network within CEDR member countries

Page 9 of 84
Trans-European Road Network, TEN-T (Roads): 2015 Performance Report
Figure 2: The TEN-T core and comprehensive road networks covered by CEDR Performance Report (2015)

Page 10 of 84
Trans-European Road Network, TEN-T (Roads): 2015 Performance Report
2.3 Participating countries in 2015
This is the fourth biennial report published by CEDR on the performance of the TEN-T (Roads) network. Although participation in the report is entirely voluntary, 19 out of a possible 28 CEDR member countries have provided data for the 2015 report as shown in Figure 31. The key changes in 2015 are the non-involvement of Belgium (Flanders) and Belgium (Wallonia) and the continued non-involvement of Cyprus, France, and Hungary. Although the networks for all 24 participating countries have been included on the maps, the subsequent tables and graphs are based only on performance data provided for 20152.
Figure 3: Countries participating in the 2015 TEN-T (Roads) Performance Report
1 Preliminary data was also provided by Poland although this has not yet been included in any detailed analysis. 2 UK performance data for 2015 only includes data from the TEN-T (Roads) network in England. Some
performance data for Italy includes only roads that are administered by ANAS.
2009 2011 2013 2015 Comments on 2015 data provision Austria Belgium (Flanders) Most recent network data included in maps only Belgium (Wallonia) Most recent network data included in maps only Cyprus Most recent network data included in maps only Czech Republic No performance data, only network included in maps Denmark Estonia Finland France Only most recent network data included in maps Germany Greece Hungary Only most recent network data included in maps Iceland Ireland Italy Some data only available for roads administered by ANAS Latvia No performance data, only network included in maps Lithuania Luxembourg Malta Netherlands Norway Poland Preliminary data only, not included in detailed analysis Portugal No performance data, only network included in maps Slovenia Spain Sweden Switzerland UK Includes performance data for England only (2013 also included data from Scotland)

Page 11 of 84
Trans-European Road Network, TEN-T (Roads): 2015 Performance Report
2.4 National statistics
The length and performance of the TEN-T (Roads) network in each of the countries that provided data for the 2015 report, as well as other general statistics such as population and surface area, are given in the table and graphs below for information.
AT CH DE DK EE ES FI
Austria Switzerland Germany Denmark Estonia Spain Finland
GR IE IS IT LT LU MT
Greece Ireland Iceland Italy Lithuania Luxembourg Malta
NE NO SE SI UK
Netherlands Norway Sweden Slovenia UK
Po
pu
lati
on
(1000's
)
To
tal
Are
a
(km
^2)
Co
mp
reh
en
siv
e
Netw
ork
Co
re N
etw
ork
Mo
torw
ay
No
n-M
oto
rway
No
Data
Tra
ffic
Flo
w
(AA
DT
)
Tra
ffic
Den
sit
y
(AA
DT
/Lan
e)
Pro
po
rtio
n H
GV
(%)
Austria 8,355 83,872 1,689 1,072 1,689 - - 54,705 10,943 10.9
Denmark 5,511 43,098 1,554 749 1,113 441 - 30,626 7,117 12.5
Estonia 1,340 45,228 1,350 480 - 1,350 - 10,800 4,126 13.4
Finland 5,326 338,424 5,229 1,094 799 4,430 - 13,927 4,275 10.1
Germany 82,002 357,021 10,700 6,365 10,341 359 - 55,127 11,199 15.2
Greece 11,260 131,990 4,831 1,780 1,695 3,136 - 18,698 4,500 16.1
Iceland 319 103,001 1,803 53 3 1,800 - 11,913 3,319 7.1
Ireland 4,450 70,280 2,258 499 907 1,350 - 27,125 7,688 6.5
Italy 60,045 301,338 8,809 4,259 6,832 1,977 - 28,161 12,045 15.5
Lithuania 3,350 65,200 1,652 597 320 1,332 - 9,568 3,071 19.2
Luxembourg 494 2,586 90 90 90 - - 43,097 10,703 16.4
Malta 414 364 109 23 - 109 - 21,058 6,526 0.0
Netherlands 16,486 41,543 1,886 643 1,886 - - 77,556 14,898 14.1
Norway 5,166 385,252 4,928 242 552 4,376 - 14,849 4,562 14.4
Slovenia 2,032 20,273 593 467 537 56 - 29,252 7,322 13.3
Spain 45,828 504,030 12,311 5,976 10,636 1,675 - 28,483 6,127 13.4
Sweden 9,256 449,964 6,391 2,972 1,952 4,439 - 19,208 5,017 14.4
Switzerland 7,702 41,290 1,325 300 1,123 202 - 53,895 15,680 6.1
UK 60,631 223,010 6,926 2,060 2,674 1,694 2,558 78,703 13,951 11.6
Total/Average 329,969 3,207,764 74,434 29,721 43,150 28,727 2,558 32,987 8,056 12.1
National StatisticsTEN-T (Roads) Network Use
(Average)TEN-T (Roads) Network Length (km)
Country

Page 12 of 84
Trans-European Road Network, TEN-T (Roads): 2015 Performance Report
Figure 4 compares the Traffic Density (calculated from the data provided on Traffic Flow and Number of Lanes) on the TEN-T (Roads) network to national population for each participating country. This shows that the majority of countries with a population of less than 20 million have a Traffic Density of less than 8,000 AADT/lane apart from Austria, Luxembourg, the Netherlands, and Switzerland, which all have a Traffic Density of more than 10,000 AADT/lane. The four countries with a population greater than 40 million have a Traffic Density of more than 10,000 AADT/lane apart from Spain, which has a Traffic Density of 6,000 AADT/lane. However, care should be taken when making this kind of comparison because different interpretations of the TEN-T Guidelines, as well as local decisions, have resulted in different countries selecting different types of road for inclusion in the TEN-T network.
AT CH DE DK EE ES FI
Austria Switzerland Germany Denmark Estonia Spain Finland
GR IE IS IT LT LU MT
Greece Ireland Iceland Italy Lithuania Luxembourg Malta
NE NO SE SI UK
Netherlands Norway Sweden Slovenia UK
Figure 4: Comparison of population and Traffic Density on TEN-T roads
AT
DK
EEFI
DE
GR
IS
IE
IT
LT
LU
MT
NL
NO
SI
ES
SE
CH
UK
-
2,000
4,000
6,000
8,000
10,000
12,000
14,000
16,000
18,000
- 10,000 20,000 30,000 40,000 50,000 60,000 70,000 80,000 90,000
Tra
ffic
Den
sit
y (
AA
DT
/Lan
e)
Population (1000's)

Page 13 of 84
Trans-European Road Network, TEN-T (Roads): 2015 Performance Report
Figure 5 compares the length of the TEN-T (Roads) network and the surface area of each country participating in the 2015 report. Not surprisingly, this shows not only that the length of the TEN-T network is largely proportional to the size of a country, but also that there are broadly two groups of countries: the first are those countries with a surface area of less than 110,000 km2 and a TEN-T (Roads) network of less than 2,100 km. These countries are all very close to the line. The second group includes countries with a surface area greater than 110,000 km2 and a much wider spread in terms of network length, ranging from 5,200 km (Norway) to more than 12,300 km (Spain). In this second group, it is possible to differentiate between those countries with a relatively long network compared with the surface area (countries above the line) and those countries with a relatively short network compared with the surface area (countries below the line).
AT CH DE DK EE ES FI
Austria Switzerland Germany Denmark Estonia Spain Finland
GR IE IS IT LT LU MT
Greece Ireland Iceland Italy Lithuania Luxembourg Malta
NE NO SE SI UK
Netherlands Norway Sweden Slovenia UK
Figure 5: Comparison of the length of the TEN-T network and the surface area of CEDR countries
ATCH
DKEE
FI
DE
GR
IS
IE
IT
LT
LUMT
NL
NO
SI
ES
SE
UK
-
2,000
4,000
6,000
8,000
10,000
12,000
14,000
- 100,000 200,000 300,000 400,000 500,000 600,000
Le
ng
th o
f T
EN
-T r
oa
d n
etw
ork
(k
m)
Surface Area (km2)
TEN-T Road Network Length vs Surface Area

Page 14 of 84
Trans-European Road Network, TEN-T (Roads): 2015 Performance Report
Figure 6 combines surface area, population, and relative Traffic Density, the latter of which is represented by the size of the circles. This shows that, overall, the most populated countries (Germany, Italy, Spain, and the UK) have the largest lengths of network in Europe, and together with Austria, Switzerland, and the Benelux countries, the busiest in terms of Traffic Flow and Traffic Density. Again, care should be taken when making this kind of comparison because different countries have selected different types of road for inclusion in their TEN-T network.
Figure 6: Traffic Density vs. area and population
Regarding other national data, the proportion of HGVs is relatively consistent across the whole of Europe, with all countries reporting overall network averages of between 10% and 16% except at the lower end (Ireland (6%), and Iceland (7%)) and at the upper end (Lithuania (19%)). In Switzerland, only 6% of traffic is HGV. However, this is explained by local regulations that stipulate that transiting HGVs must travel by rail. No HGV data was available from Malta.
Switzerland
Netherlands
UK
Italy
Germany
Austria
Luxembourg
Ireland
Slovenia
DenmarkMalta
Spain
Sweden
Norway
Greece
Finland
Estonia
Iceland
Lithuania
-100,000
-
100,000
200,000
300,000
400,000
500,000
600,000
-10,000 - 10,000 20,000 30,000 40,000 50,000 60,000 70,000 80,000 90,000
Are
a (
km2 )
Population (,000s)
Traffic Density (AADT/Lane)

Page 15 of 84
Trans-European Road Network, TEN-T (Roads): 2015 Performance Report
2.5 Core and comprehensive networks
In 2014, the new TEN-T Guidelines introduced the concept of the 'core network'. Figure 7 shows the length of core and non-core network in each of the participating countries compared with the network average figures (the percentages are the proportion of the comprehensive network in each country that is identified as core).
Figure 7: Comparison of core and non-core network lengths on TEN-T roads
The figures in Figure 7 show that Luxembourg (100%) Slovenia (79%), Austria (63%), and Germany (59%) have the highest proportion of national core network, while Iceland (3%) and Norway (5%) have the lowest. The core and comprehensive networks in the participating countries are shown on a map in Figure 2. It should be noted that as many of the performance indicators in this report are shown as percentages of network length, countries with relatively short TEN-T (Roads) networks such as Luxembourg and Malta can have disproportionately high results. It should also be noted that the selection of sections for inclusion in the core network has to be negotiated with the Commission. Care should therefore be taken when interpreting this data.
63% 48%36%
21%
59%
37%
3%22%
48%
36%
100% 21%
34%
5%
79%
49%
47%
23%
30%
-
2,000
4,000
6,000
8,000
10,000
12,000
14,000
Length
of
TE
N-T
(K
m)
Core Network Non-Core Network No Data

Page 16 of 84
Trans-European Road Network, TEN-T (Roads): 2015 Performance Report
3 NETWORK TRENDS
This is the fourth TEN-T (Roads) Performance Report produced by CEDR, and there is now a core set of performance data within a subset of 11 participating countries that is considered relatively stable and can enable simple trends to be highlighted over the period 2011 to 2015. This subset comprises the following countries: Austria Denmark Estonia Finland Germany Iceland
Lithuania Norway Slovenia Spain Sweden
This subset represents 48,000 km of TEN-T roads. This is 47% of the total length of the TEN-T (Roads) network and 50% of the network within CEDR member countries. The changes over the period 2011 to 2015 are shown below at a network level. For this subset of countries and indicators, there is reasonable confidence that any changes are due to genuine changes in network performance rather than corrections or amendments to the data.
3.1 Road Type
At a network level, Figure 8 shows that between 2011 and 2013, the overall length of the network in these countries remained constant, with a slight increase in the length of motorway coupled with an equivalent reduction in the length of non-motorway roads.
Figure 8: Network-trends in Road Type (2011–2015)
However, between 2013 and 2015, there has been an 8% increase in the overall length of the network in these countries as additional national roads have been included in the TEN-T network in response to the new TEN-T Guidelines. This has
0
5,000
10,000
15,000
20,000
25,000
30,000
Motorway Non-motorway
Len
gth
(km
)
2011
2013
2015

Page 17 of 84
Trans-European Road Network, TEN-T (Roads): 2015 Performance Report
particularly been the case in Denmark, Estonia, Finland, and Sweden. The changes in network length from 2013 to 2015 are shown in the table below.
Country Length of TEN-T (Roads) network
2011 % change 2013 % change 2015
Austria 1,782 0% 1,782 -5% 1,689
Denmark 916 0% 916 70% 1,554
Estonia 1,018 0% 1,017 33% 1,350
Finland 4,056 0% 4,058 29% 5,229
Germany 10,137 0% 10,150 5% 10,700
Iceland 1,803 0% 1,803 0% 1,803
Lithuania 1,657 0% 1,652 0% 1,652
Norway 3,726 32% 4,900 1% 4,928
Slovenia 607 0% 609 -3% 593
Spain 12,091 0% 12,114 2% 12,311
Sweden 5,603 0% 5,617 14% 6,391
3.2 Traffic Flow – All Vehicles
At a network level, Figure 9 shows that between 2011 and 2013, the overall Traffic Flow on the network in these countries increased by nearly 2% with a slight increase on both motorways (1.0%) and non-motorways (1.5%). However, while the overall increase in Traffic Flow remained at 2% between 2013 and 2015, the increase on motorways was nearly 8%. On non-motorways, it reduced by nearly 8%. There could be a number of reasons for this change: the additional roads that have been included in the TEN-T network in response to the new TEN-T Guidelines could have higher levels of traffic, or the increased traffic could be due to economic recovery or a transfer of traffic from ordinary roads to TEN-T roads as part of an additional mobility shift.

Page 18 of 84
Trans-European Road Network, TEN-T (Roads): 2015 Performance Report
Figure 9: Network trends in All Vehicle Traffic Flow (2011–2015)
3.3 Traffic Flow - HGV
At a network level, Figure 10 shows that between 2011 and 2013, there was an overall increase of 5% in HGV Traffic Flow in these countries, with an increase of 3% on motorways and 6% on non-motorways. However, between 2013 and 2015, the figures show an overall decrease of 7% in HGV Traffic Flow, which includes an increase of 2% on motorways and a decrease of 12% on non-motorways. There could be a number of reasons for this change: the additional roads that have been included in the TEN-T network in response to the new TEN-T Guidelines could have higher levels of HGV traffic, the increased traffic could be due to economic recovery or a transfer of HGV traffic from non-motorway roads to motorways, or as a result of regulatory changes relating to HGVs.
0
5,000
10,000
15,000
20,000
25,000
30,000
35,000
40,000
45,000
Motorway Non-motorway
Ave
rag
e D
aily
Tra
ffic
Flo
w -
All
Veh
icle
s
2011
2013
2015

Page 19 of 84
Trans-European Road Network, TEN-T (Roads): 2015 Performance Report
Figure 10: Network trends in HGV Traffic Flow (2011–2015)

Page 20 of 84
Trans-European Road Network, TEN-T (Roads): 2015 Performance Report
4 STRUCTURE OF THE NETWORK
4.1 Road Type
For the purposes of the 2015 report, the TEN-T network consists of two types of road: 'motorway' and 'non-motorway'.3 Full definitions of these road types are given in Section 8.1.
Road Type
Motorway Non-motorway No data
Country Network length
(km) No of
sections Length (km) %
Length (km)
% Length
(km) %
Austria 1,689 85 1,689 100.0 - 0.0 - 0.0
Denmark 1,554 69 1,113 71.6 441 28.4 - 0.0
Estonia 1,350 45 - 0.0 1,350 100.0 - 0.0
Finland 5,229 173 799 15.3 4,430 84.7 - 0.0
Germany 10,700 360 10,341 96.6 359 3.4 - 0.0
Greece 4,831 120 1,695 35.1 3,136 64.9 - 0.0
Iceland 1,803 78 3 0.2 1,800 99.8 - 0.0
Ireland 2,258 60 907 40.2 1,350 59.8 - 0.0
Italy 8,809 244 6,832 77.6 1,977 22.4 - 0.0
Lithuania 1,652 127 320 19.4 1,332 80.6 - 0.0
Luxembourg 90 28 90 100.0 - 0.0 - 0.0
Malta 109 48 - 0.0 109 100.0 - 0.0
Netherlands 1,886 119 1,886 100.0 - 0.0 - 0.0
Norway 4,928 206 552 11.2 4,376 88.8 - 0.0
Slovenia 593 51 537 90.6 56 9.4 - 0.0
Spain 12,311 416 10,636 86.4 1,675 13.6 - 0.0
Sweden 6,391 119 1,952 30.5 4,439 69.5 - 0.0
Switzerland 1,325 111 1,123 84.8 202 15.2 - 0.0
UK 6,926 144 2,674 38.6 1,694 24.5 2558 36.9
Total (all data)
74,434 2,603 43,150 58.0 28,727 38.6 2,558 3.4
Total (Ex No data)
71,876 2,603 43,150 60.0 28,727 40.0 - -
As Figure 11 shows, for the network for which data is available, 60% of the TEN-T (Roads) network is motorway, 40% is non-motorway. A number of countries (Austria, Luxembourg, and the Netherlands) have indicated that their entire TEN-T (Roads) network consists of motorway. In contrast, Estonia and Malta's networks are comprised entirely of non-motorway roads. The national distribution of road types is shown in Figure 12 against a background of the average values for the comprehensive network as a whole.
3 This is a change from previous reports, which had two types of non-motorway sections, 'expressway' and
'ordinary road'. These categories have been combined because the term 'expressway' is not widely used within CEDR countries, leading to differences of interpretation of this category resulting in a lack of consistency in the reporting of these two categories.

Page 21 of 84
Trans-European Road Network, TEN-T (Roads): 2015 Performance Report
Figure 11: Overall distribution of Road Types on the TEN-T road network (2015)
Figure 12: National distribution of Road Types on the TEN-T network (2015)
A comparison of the distribution of lengths and the split between motorway and non-motorway roads, as described in Figure 12, indicates that those countries with the largest networks (Germany, Italy, and Spain) have generally well-developed motorway networks, with over 75% of the network of motorway designation, as do Austria, Denmark, the Netherlands, Slovenia, and Switzerland. The figures suggest that more needs to be done to improve the standard of the TEN-T (Roads) network, particularly in countries with smaller networks, such as Iceland, Estonia, and Malta. However, while many countries have plans to upgrade their networks, the key factor is to achieve an appropriate national mix of road types. Moreover, the cost effectiveness of upgrading must be considered.
0
2,000
4,000
6,000
8,000
10,000
12,000
14,000
Co
mp
reh
en
siv
e N
etw
ork
Le
ng
th (
km
)
No Data
Non-Motorway
Motorway
60%
40%
Motorway
Non-Motorway

Page 22 of 84
Trans-European Road Network, TEN-T (Roads): 2015 Performance Report
Preliminary data from Poland indicates that 11% of the network is motorway and 89% is non-motorway. A comparison of the core and comprehensive networks for which data is available (see Figure 13) shows that while 60% of the comprehensive network as a whole is made up of motorways, more than 84% of the core network consists of motorway.
Figure 13: Comparison of Road Types on core and comprehensive networks (2015)
60.0
84.3
40.0
15.7
0
10,000
20,000
30,000
40,000
50,000
60,000
70,000
80,000
Comprehensive Core
Netw
ork
Length
by R
oad T
ype (
km
)
Motorway Non-Motorway

Page 23 of 84
Trans-European Road Network, TEN-T (Roads): 2015 Performance Report
4.2 Number of Lanes
The Number of Lanes is defined as the average number of lanes along a TEN-T section in both directions. This figure is aggregated from the data from individual national sections so that, for example, a TEN-T section that consists of five national sections that are 2-lane roads and one national section that is a 4-lane road will have an average number of lanes greater than two and so will be included in the category 'More than 2, up to 4 lanes'. A fuller definition is given in Section 8.3.
Number of Lanes
2 lanes or less
More than 2, up to 4 lanes
More than 4, up to 6 lanes
More than 6 lanes
No data
Country Total
length
Length (km)
% Length
(km) %
Length (km)
% Length
(km) %
Length (km)
%
Austria 1,689 16 0.9 802 47.5 821 48.6 50 3.0 - 0.0
Denmark 1,554 164 10.6 1,090 70.1 250 16.1 50 3.2 - 0.0
Estonia 1,350 1,212 89.7 138 10.3 - 0.0 - 0.0 - 0.0
Finland 5,229 2,694 51.5 2,459 47.0 76 1.5 - 0.0 - 0.0
Germany 10,700 36 0.3 5,521 51.6 4,907 45.9 236 2.2 - 0.0
Greece 4,831 2,776 57.5 1,606 33.2 429 8.9 20 0.4 - 0.0
Iceland 1,803 1,699 94.2 95 5.3 9 0.5 - 0.0 - 0.0
Ireland 2,258 1,285 56.9 885 39.2 87 3.9 - 0.0 - 0.0
Italy 8,809 6,965 79.1 1,793 20.4 - 0.0 - 0.0 51 0.6
Lithuania 1,652 975 59.0 607 36.7 - 0.0 - 0.0 70 4.2
Luxembourg 90 - 0.0 88 97.3 2 2.7 - 0.0 - 0.0
Malta 109 43 39.4 63 57.6 1 0.7 2 2.2 - 0.0
Netherlands 1,886 - 0.0 722 38.3 994 52.7 171 9.0 - 0.0
Norway 4,928 3,329 67.6 1,500 30.4 89 1.8 10 0.2 - 0.0
Slovenia 593 41 6.9 384 64.8 168 28.3 - 0.0 - 0.0
Spain 12,311 1,804 14.7 8,990 73.0 1,210 9.8 226 1.8 79 0.6
Sweden 6,391 3,275 51.2 2,964 46.4 149 2.3 3 0.0 - 0.0
Switzerland 1,325 279 21.1 1,044 78.8 2 0.2 - 0.0 - 0.0
UK 6,926 - 0.0 1,524 22.0 2,086 30.1 758 10.9 2,558 36.9
Total (all data)
74,434 26,594 35.7 32,275 43.4 11,280 15.2 1,527 2.1 2,758 3.7
Total (ex No data)
71,676 26,594 37.1 32,275 45.0 11,280 15.7 1,527 2.1 - -
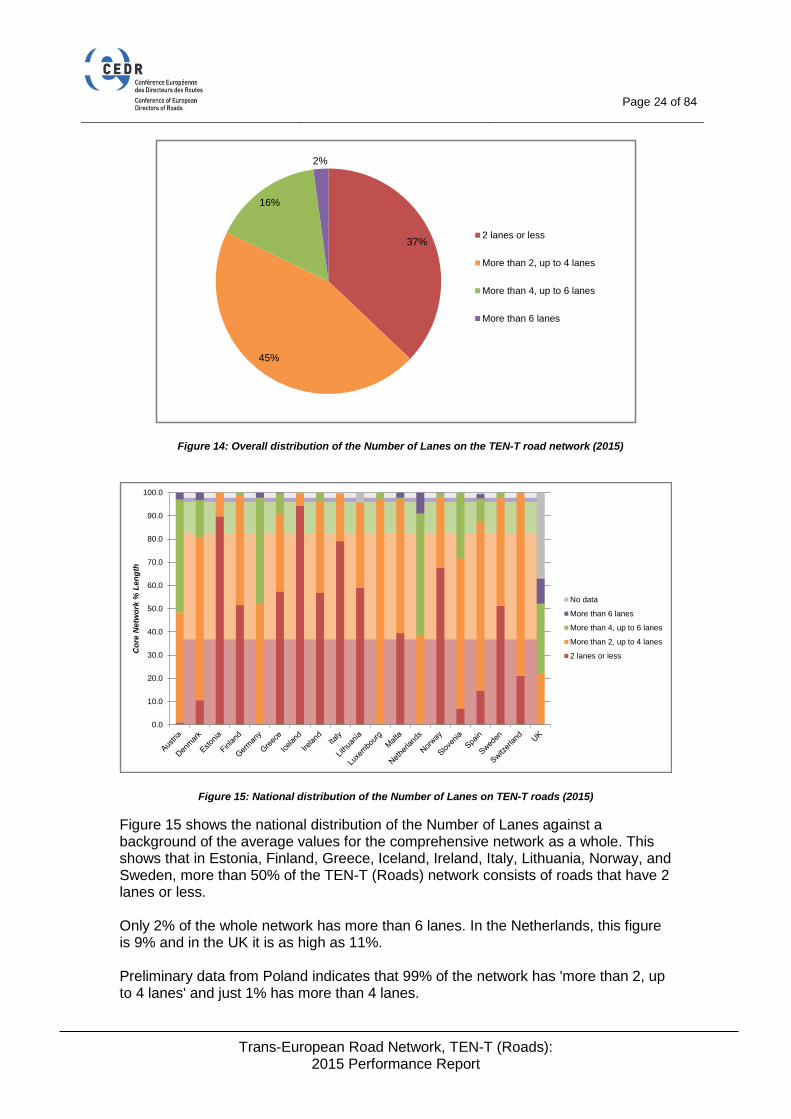
As illustrated in Figure 14, these results show that the largest category of the TEN-T (Roads) network (45%) is that of roads with more than 2 and up to 4 lanes, and 37% of the network is made up of 2-lane roads, with the other 16% being roads of more than 4 lanes.
Page 24 of 84
Trans-European Road Network, TEN-T (Roads): 2015 Performance Report
Figure 14: Overall distribution of the Number of Lanes on the TEN-T road network (2015)
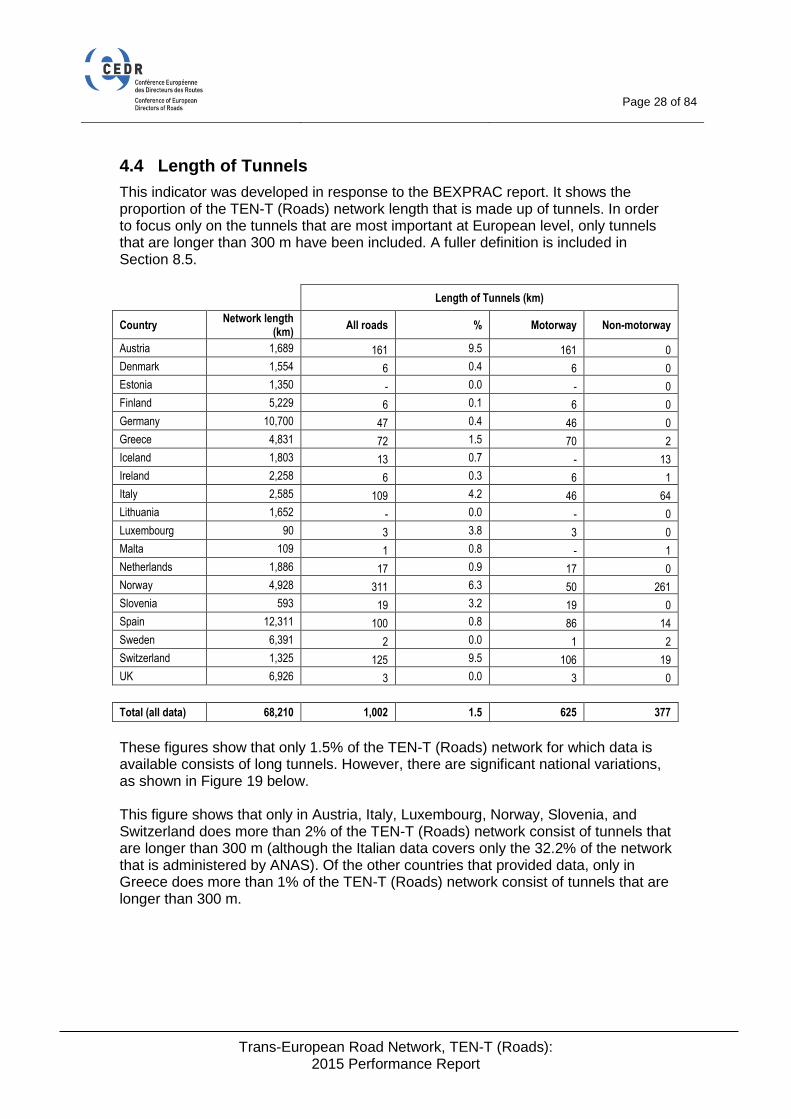
Figure 15: National distribution of the Number of Lanes on TEN-T roads (2015)
Figure 15 shows the national distribution of the Number of Lanes against a background of the average values for the comprehensive network as a whole. This shows that in Estonia, Finland, Greece, Iceland, Ireland, Italy, Lithuania, Norway, and Sweden, more than 50% of the TEN-T (Roads) network consists of roads that have 2 lanes or less. Only 2% of the whole network has more than 6 lanes. In the Netherlands, this figure is 9% and in the UK it is as high as 11%. Preliminary data from Poland indicates that 99% of the network has 'more than 2, up to 4 lanes' and just 1% has more than 4 lanes.
0.0
10.0
20.0
30.0
40.0
50.0
60.0
70.0
80.0
90.0
100.0
Co
re N
etw
ork
% L
en
gth
No data
More than 6 lanes
More than 4, up to 6 lanes
More than 2, up to 4 lanes
2 lanes or less
37%
45%
16%
2%
2 lanes or less
More than 2, up to 4 lanes
More than 4, up to 6 lanes
More than 6 lanes

Page 25 of 84
Trans-European Road Network, TEN-T (Roads): 2015 Performance Report
Figure 16 shows the Number of Lanes on the core network compared with the comprehensive network where data is available. This shows that 5% of the core network has 'more than 6 lanes' compared with 2% of the comprehensive network, 30% has 'more than 4, up to 6' compared with 15%, 56% has 'More than 2, up to 4 lanes' compared with 43%, and just 9% of the core network has '2 lanes or less' compared with 36% of the comprehensive network.
Figure 16: Comparison of Number of Lanes on core and comprehensive networks (2015)
35.7
9.2
43.4
56.1
15.2
30.1
2.1 4.5
0%
10%
20%
30%
40%
50%
60%
70%
80%
90%
100%
Comprehensive Core
% L
eng
th b
y N
o o
f L
an
es
2 lanes or less More than 2, up to 4 lanes More than 4, up to 6 lanes More than 6 lanes

Page 26 of 84
Trans-European Road Network, TEN-T (Roads): 2015 Performance Report
4.3 Length of Bridges
This indicator was originally developed in response to the BEXPRAC4 report. It shows the proportion of the TEN-T (Roads) network length that is made up of bridges. In order to focus only on the bridges that are most important at European level, only bridges that are longer than 100 m have been included. A fuller definition is included in Section 8.4.
Country Network length
(km)
Length of Bridges (km)
All roads % Motorway Non-motorway
Austria 1,689 103 6.1 103 -
Denmark 1,554 31 2.0 28 4
Estonia 1,350 7 0.5 0 7
Finland 5,229 62 1.2 24 37
Germany 10,700 228 2.1 225 3
Greece 4,831 64 1.3 54 10
Iceland 1,803 6 0.3 - 6
Ireland 2,258 5 0.0 3 2
Italy 2,585 261 10.1 151 110
Lithuania 1,652 - 0.0 - -
Luxembourg 90 5 5.7 5 -
Malta 109 - 0.4 - -
Netherlands 1,886 24 1.3 24 -
Norway 4,928 50 1.0 22 28
Slovenia 593 24 4.0 24 -
Spain 12,311 220 1.8 213 8
Sweden 6,391 47 0.7 31 16
Switzerland 1,325 112 8.4 101 11
UK 6,926 - 0.0 - -
Total (all data) 68,210 1,248 1.8 1,007 241
These figures show that 1.8% of the TEN-T (Roads) network for which data is available consists of longer bridges. However, there are significant national variations, as shown in Figure 17 below.
4 http://www.cedr.eu/download/Publications/2010/e_BEXPRAC.pdf

Page 27 of 84
Trans-European Road Network, TEN-T (Roads): 2015 Performance Report
Figure 17: Proportion of the length of national TEN-T roads comprising bridges (2015)
The figure above shows that only in Austria, Italy, Luxembourg, Switzerland, and Slovenia does more than 4% of the TEN-T (Roads) network consist of bridges longer than 100 m (although the Italian data only relates to the part of the network under the administration of ANAS) compared to the network average of 1.8%. In no other countries that provided data do bridges longer than 100 m represent more than 2% of the TEN-T (Roads) network.
Figure 18: Comparison of Length of Bridges on core and comprehensive networks (2015)
A comparison of the core and comprehensive networks (see Figure 18) shows that the core network has a higher percentage of network with bridges at nearly 2% compared with 1.8% on the comprehensive network as a whole.
Network Average %
0.0
2.0
4.0
6.0
8.0
10.0
12.0
%a
ge
Ne
two
rk le
ng
th
1.75
1.80
1.85
1.90
1.95
2.00
Comprehensive Core
%age N
etw
ork
length
Page 28 of 84
Trans-European Road Network, TEN-T (Roads): 2015 Performance Report
4.4 Length of Tunnels
This indicator was developed in response to the BEXPRAC report. It shows the proportion of the TEN-T (Roads) network length that is made up of tunnels. In order to focus only on the tunnels that are most important at European level, only tunnels that are longer than 300 m have been included. A fuller definition is included in Section 8.5.
Length of Tunnels (km)
Country Network length
(km) All roads % Motorway Non-motorway
Austria 1,689 161 9.5 161 0
Denmark 1,554 6 0.4 6 0
Estonia 1,350 - 0.0 - 0
Finland 5,229 6 0.1 6 0
Germany 10,700 47 0.4 46 0
Greece 4,831 72 1.5 70 2
Iceland 1,803 13 0.7 - 13
Ireland 2,258 6 0.3 6 1
Italy 2,585 109 4.2 46 64
Lithuania 1,652 - 0.0 - 0
Luxembourg 90 3 3.8 3 0
Malta 109 1 0.8 - 1
Netherlands 1,886 17 0.9 17 0
Norway 4,928 311 6.3 50 261
Slovenia 593 19 3.2 19 0
Spain 12,311 100 0.8 86 14
Sweden 6,391 2 0.0 1 2
Switzerland 1,325 125 9.5 106 19
UK 6,926 3 0.0 3 0
Total (all data) 68,210 1,002 1.5 625 377
These figures show that only 1.5% of the TEN-T (Roads) network for which data is available consists of long tunnels. However, there are significant national variations, as shown in Figure 19 below. This figure shows that only in Austria, Italy, Luxembourg, Norway, Slovenia, and Switzerland does more than 2% of the TEN-T (Roads) network consist of tunnels that are longer than 300 m (although the Italian data covers only the 32.2% of the network that is administered by ANAS). Of the other countries that provided data, only in Greece does more than 1% of the TEN-T (Roads) network consist of tunnels that are longer than 300 m.

Page 29 of 84
Trans-European Road Network, TEN-T (Roads): 2015 Performance Report
Figure 19: Proportion of the length of national TEN-T roads comprising tunnels (2015)
Figure 20 compares the core and comprehensive networks and shows that, in contrast to bridges, the non-core network has a significantly larger percentage of length with tunnels (nearly 1.5%) than on the core network (less than 1%).
Figure 20: Comparison of the Length of Tunnels on core and comprehensive networks (2015)
Average %
0.0
2.0
4.0
6.0
8.0
10.0
12.0
%a
ge
Ne
two
rk le
ng
th
0.00
0.20
0.40
0.60
0.80
1.00
1.20
1.40
1.60
Comprehensive Core
%age N
etw
ork
length

Page 30 of 84
Trans-European Road Network, TEN-T (Roads): 2015 Performance Report
4.5 Physical Environment
In previous reports, a Road Environment indicator was included in response to the BEXPRAC report , which made reference to roads in urban, rural, and mountainous environments. There were concerns about these categories as 'mountainous' was used to indicate not only the terrain, but also the existence of additional winter maintenance costs. Moreover, 'rural' and 'mountainous' are obviously not mutually exclusive categories. For this reason, a new indicator (Physical Environment) was included in the 2015 report, which is limited to the categories urban and rural. The intention is that this data could help to interpret other performance indicators. However, it should be noted that the terms 'rural' and 'urban' are open to interpretation and may be used to mean the terrain surrounding the road or the characteristics of the network itself, e.g. traffic speed, distance between junctions. A fuller definition is provided in Section 8.6.
Rural Urban No data
Country Network length (km) Length (km) % Length (km) % Length (km) %
Austria 1,689 1,488 88.1 201 11.9 - 0.0
Denmark 1,554 1,554 100.0 - 0.0 - 0.0
Estonia 1,350 1,299 96.2 51 3.8 - 0.0
Finland 5,229 5,077 97.1 152 2.9 - 0.0
Germany 10,700 9,823 91.8 877 8.2 - 0.0
Greece 4,831 4,721 97.7 110 2.3 - 0.0
Iceland 1,803 1,732 96.1 71 3.9 - 0.0
Ireland 2,258 2,157 95.5 101 4.5 - 0.0
Italy 8,809 2,823 32.0 336 3.8 5,650 64.1
Lithuania 1,652 1,551 93.9 101 6.1 - 0.0
Luxembourg 90 74 82.4 16 17.6 - 0.0
Malta 109 42 39.0 66 61.0 - 0.0
Netherlands 1,886 1,439 76.3 447 23.7 - 0.0
Norway 4,928 4,606 93.5 322 6.5 - 0.0
Slovenia 593 546 92.1 47 7.9 - 0.0
Spain 12,311 11,546 93.8 765 6.2 - 0.0
Sweden 6,391 5,811 90.9 580 9.1 - 0.0
Switzerland 1,325 674 50.9 651 49.1 - 0.0
UK 6,926 4,352 62.8 16 0.2 2,558 36.9
Total (all data)
74,434 61,315 82.4 4,911 6.6 8,208 11.0
Total (ex No data)
66,226 61,315 92.6 4,911 7.4 - -
The figures show that, of the network for which data is available, 93% is categorised as rural and 7% as urban.

Page 31 of 84
Trans-European Road Network, TEN-T (Roads): 2015 Performance Report
The national distribution of Physical Environment on TEN-T (Roads) is shown in Figure 21 against a background of the average values for the comprehensive network as a whole. This shows that only Malta (61%), the Netherlands (24%), and Switzerland (49.1%) have categorised more than 20% of their networks as urban. Apart from Austria (12%) and Luxembourg (18%), the networks in all other countries are less than 10% urban; indeed the TEN-T (Roads) network in Denmark is 100% rural. Preliminary data from Poland indicates that 97% of the network is rural and 3% is urban.
Figure 21: National distribution of TEN-T Physical Environments (2015)
Figure 22 shows the average traffic flow (AADT) on rural and urban roads on each national network. This shows that in all cases, urban roads carry more traffic than rural roads. On the TEN-T (Roads) network as a whole, urban roads carry on average twice as much traffic as rural roads.
Figure 22: Comparison of traffic flow on urban and rural roads (2015)
-
10.00
20.00
30.00
40.00
50.00
60.00
70.00
80.00
90.00
100.00
% N
etw
ork
Le
ng
th
No data
Rural
Urban
0
20,000
40,000
60,000
80,000
100,000
120,000
140,000
Ave
rag
e D
ail
y T
raff
ic F
low
(A
AD
T)
Rural
Urban

Page 32 of 84
Trans-European Road Network, TEN-T (Roads): 2015 Performance Report
Comparing the core and comprehensive networks where data is available (see Figure 23), the core network is 9% urban compared with 7% of the comprehensive network as a whole.
Figure 23: Comparison of Physical Environments on core and comprehensive networks (2015)
7.4 9.2
92.6 91.8
0.0
10.0
20.0
30.0
40.0
50.0
60.0
70.0
80.0
90.0
100.0
Comprehensive Core
% N
etw
ork
Len
gth
Urban Rural

Page 33 of 84
Trans-European Road Network, TEN-T (Roads): 2015 Performance Report
4.6 Intelligent Transport Systems (ITS)
Previous reports have included a simple indicator showing whether or not a section on the TEN-T network had ITS or not. In discussions with CEDR TG N7 (ITS for NRAs), this indicator was extended to include the level of ITS on a section. These levels range from zero (None) to five (Co-operative ITS) and are defined more fully in Section 8.7. However, it was clear from returned data that different countries had interpreted the different levels of ITS differently. For this reason, this indicator has not been included in the 2015 report. The definitions will be further reviewed to ensure they are clear before the data collection exercise for the next report.

Page 34 of 84
Trans-European Road Network, TEN-T (Roads): 2015 Performance Report
5 PERFORMANCE OF THE NETWORK
5.1 Average Traffic Flow
Average Traffic Flow on the TEN-T (Roads) network is expressed as Annual Average Daily Traffic or AADT. A full definition is given in Section 8.8. Across the TEN-T (Roads) network covered by the 2015 report, the average daily traffic on a section is 34,551 vehicles per day. The average traffic on a section of motorway is 47,854 vehicles per day and on non-motorway sections 11,592 vehicles per day. The following table shows the distribution of Traffic Flow in participating countries.
Annual Average Daily Traffic Flow (AADT)
Less than 5,000 5,000–20,000 20,000–40,000 40,000–80,000 80,000–100,000
More than 100,000
No data
Country Total
length (km)
Length (km) %
Length (km) %
Length (km) %
Length (km) %
Length (km) %
Length (km) %
Length (km) %
Austria 1,689
0.0 111 6.6 878 52.0 607 35.9 53 3.1 33 2.0 7 0.4
Denmark 1,554 125 8.0 651 41.9 414 26.6 323 20.8 36 2.3 5 0.3 - 0.0
Estonia 1,350 242 17.9 1,059 78.5 49 3.6 - 0.0 - 0.0 - 0.0 - 0.0
Finland 5,229 2,242 42.9 2,532 48.4 371 7.1 84 1.6 - 0.0 - 0.0 - 0.0
Germany 10,700 - 0.0 1,256 11.7 3,591 33.6 4,725 44.2 697 6.5 431 4.0 - 0.0
Greece 4,831 205 4.2 1,624 33.6 284 5.9 56 1.2 65 1.3 9 0.2 2,588 53.6
Iceland 1,803 1,651 91.6 117 6.5 19 1.1 16 0.9 - 0.0 - 0.0 - 0.0
Ireland 2,258 52 2.3 1,820 80.6 224 9.9 137 6.1 8 0.4 18 0.8 - 0.0
Italy 8,809 192 2.2 960 10.9 272 3.1 60 0.7 8 0.1 20 0.2 7,297 82.8
Lithuania 1,652 602 36.4 869 52.6 146 8.8 13 0.8 - 0.0 - 0.0 22 1.3
Luxembourg 90 - 0.0 11 12.7 26 29.2 52 58.1 - 0.0 - 0.0 - 0.0
Malta 109 4 3.3 68 63.0 31 28.1 4 3.7 2 1.8 - 0.0 - 0.0
Netherlands 1,886 - 0.0 24 1.3 264 14.0 1,079 57.2 238 12.6 281 14.9 - 0.0
Norway 4,928 3,174 64.4 1,340 27.2 269 5.5 132 2.7 13 0.3 - 0.0 - 0.0
Slovenia 593 21 3.5 203 34.2 265 44.7 104 17.5 - 0.0 - 0.0 - 0.0
Spain 12,311 1,475 12.0 6,904 56.1 2,690 21.9 935 7.6 71 0.6 160 1.3 76 0.6
Sweden 6,391 2,605 40.8 2,633 41.2 906 14.2 175 2.7 33 0.5 39 0.6 - 0.0
Switzerland 1,325 20 1.5 136 10.3 400 30.2 423 31.9 53 4.0 64 4.8 229 17.3
UK 6,926 - 0.0 304 4.4 789 11.4 1,632 23.6 655 9.5 988 14.3 2,558 36.9
Total (all data)
74,434 12,610 16.9 22,623 30.4 11,888 16.0 10,557 14.2 1,931 2.6 2,048 2.8 12,777 17.2
Total (ex No data)
61,657 12,610 20.5 22,623 36.7 11,888 19.3 10,557 17.1 1,931 3.1 2,048 3.3 - -

Page 35 of 84
Trans-European Road Network, TEN-T (Roads): 2015 Performance Report
Figure 24: Overall distribution of Traffic Flow on TEN-T roads (2015)
For the network for which data is available, Figure 24 shows that the TEN-T network is split into two sections: 56% is relatively lightly trafficked and carries less than 20,000 vehicles per day, 44% is heavily trafficked, carrying more than 20,000 vehicles per day, of which 6% of the network is very heavily trafficked, carrying more than 80,000 per day.
Figure 25: National distribution of Traffic Flow on TEN-T roads (2015)
Figure 25 shows the national distributions of Traffic Flow for 2015 against a background of the average values for the comprehensive network as a whole. This shows that the Netherlands and the UK have the busiest TEN-T (Roads) network, with more than 20% carrying more than 80,000 vehicles per day respectively. The
0
10
20
30
40
50
60
70
80
90
100
% L
en
gth
AA
DT
by
Ba
nd
No data
5,000 - 20,000
Less than 5,000
20,000 - 40,000
40,000 - 80,000
80,000 - 100,000
More than 100,000
3%3%
17%
19%
37%
21%
More than 100,000
80,000 - 100,000
40,000 - 80,000
20,000 - 40,000
5,000 - 20,000
Less than 5,000

Page 36 of 84
Trans-European Road Network, TEN-T (Roads): 2015 Performance Report
next busiest network is in Germany, where more than 10% of the network carries more than 80,000 vehicles per day. Conversely, the countries with the lowest levels of traffic on the TEN-T (Roads) network are Iceland, Norway, and Sweden, with more than 40% carrying less than 5,000 vehicles per day. Preliminary data from Poland indicates that the average daily traffic on a section is 25,000 vehicles per day. Figure 26: Comparison of Traffic Flow on core and comprehensive networks (2015) compares the overall distribution of Traffic Flow on the core and the comprehensive networks. This shows that 12% of the core network carries in excess of 80,000 vehicles per day compared with 6% on the comprehensive network as a whole. Meanwhile, less than 4% of the core network carries less than 5,000 vehicles per day compared with 21% of the comprehensive network as a whole.
Figure 26: Comparison of Traffic Flow on core and comprehensive networks (2015)
3.36.9
3.1
5.5
17.1
25.5
19.3
24.6
36.7
33.7
20.5
3.8
0.0
10.0
20.0
30.0
40.0
50.0
60.0
70.0
80.0
90.0
100.0
Comprehensive Core
% L
eng
th A
AD
T b
y B
an
d
More than 100,000 80,000 - 100,000 40,000 - 80,000 20,000 - 40,000 5,000 - 20,000 Less than 5,000

Page 37 of 84
Trans-European Road Network, TEN-T (Roads): 2015 Performance Report
5.2 Traffic Density
Traffic Density on the TEN-T (Roads) network is expressed as Annual Traffic Flow or AADT per lane5 and is calculated from data provided about Traffic Flow and Number of Lanes (see Sections 8.8 and 8.3 respectively).
Traffic Density (AADT / lane)
Less than 3,000 3,000–6,000 6,000–12,000 12,000–18,000 More than 18,000 No data
Country Total
length (km)
Length (km) %
Length (km) %
Length (km) %
Length (km) %
Length (km) %
Length (km) %
Austria 1,689 21 1.2 547 32.4 844 50.0 234 13.9 36 2.1 7 0.4
Denmark 1,554 196 12.6 687 44.2 585 37.6 86 5.5 - 0.0 - 0.0
Estonia 1,350 575 42.6 529 39.2 247 18.3 - 0.0 - 0.0 - 0.0
Finland 5,229 3,229 61.8 1,553 29.7 420 8.0 27 0.5 - 0.0 - 0.0
Germany 10,700 279 2.6 1,643 15.4 5,619 52.5 2,840 26.5 319 3.0 - 0.0
Greece 4,831 1,190 24.6 639 13.2 335 6.9 14 0.3 65 1.3 2,588 53.6
Iceland 1,803 1,709 94.8 57 3.2 34 1.9 3 0.2 - 0.0 - 0.0
Ireland 2,258 322 14.2 1,240 54.9 591 26.2 79 3.5 26 1.2 - 0.0
Italy 8,809 50 0.6 667 7.6 435 4.9 323 3.7 37 0.4 7,297 82.8
Lithuania 1,652 1,058 64.0 448 27.1 71 4.3 - 0.0 - 0.0 75 4.5
Luxembourg 90 - 0.0 25 27.7 33 36.8 32 35.5 - 0.0 - 0.0
Malta 109 10 8.8 53 48.4 42 38.2 3 2.8 2 1.8 - 0.0
Netherlands 1,886 - 0.0 88 4.7 476 25.2 941 49.9 382 20.2 - 0.0
Norway 4,928 3,511 71.2 877 17.8 451 9.2 89 1.8 - 0.0 - 0.0
Slovenia 593 62 10.5 236 39.8 258 43.5 37 6.2 - 0.0 - 0.0
Spain 12,311 4,790 38.9 4,740 38.5 2,052 16.7 460 3.7 115 0.9 155 1.3
Sweden 6,391 3,481 54.5 1,972 30.9 843 13.2 95 1.5 - 0.0 - 0.0
Switzerland 1,325 20 1.5 157 11.8 426 32.2 275 20.8 218 16.5 229 17.3
UK 6,926 - 0.0 592 8.5 1,368 19.8 1,753 25.3 655 9.5 2,558 36.9
Total (all
data) 74,434 20,502 27.5 16,749 22.5 15,129 20.3 7,291 9.8 1,854 2.5 12,909 17.3
Total (ex No data)
61,525 20,502 33.3 16,749 27.2 15,129 24.6 7,291 11.8 1,854 3.0 - -
The average Traffic Density on TEN-T (Roads) network is 7,830 vehicles per lane per day. The average Traffic Density on motorways is 8,594 vehicles per lane per day, and on non-motorways is 3,694 vehicles per lane per day. Figure 27 shows that that 33% of the TEN-T (Roads) network has a Traffic Density of less than 3,000 vehicles per lane per day. The proportion of the network with a Traffic Density of between 3,000 and 6,000 vehicles per lane per day is 27% and the proportion with a Traffic Density of between 6,000 and 12,000 vehicles per lane per day is 25%.
5 It is recognised that there are other measures of traffic density in use within Europe. This indicator is therefore
necessarily a compromise that aims to allow relative performance to be examined.

Page 38 of 84
Trans-European Road Network, TEN-T (Roads): 2015 Performance Report
As for the busiest roads, 15% of the TEN-T (Roads) network has a traffic density of more than 12,000 vehicles per lane per day.
Figure 27: Overall distribution of Traffic Density on TEN-T roads (2015)
Figure 28: National distribution of Traffic Density on TEN-T roads (2015)
The national figures in Figure 28 (shown against a background of the average values for the comprehensive network as a whole) indicate that Germany, Luxembourg, the Netherlands, Switzerland, and the UK have the highest levels of Traffic Density, with more than 25% of the TEN-T (Roads) network in each of these countries carrying more than 12,000 vehicles per lane per day. In the Netherlands, 70% of the network
0.0
10.0
20.0
30.0
40.0
50.0
60.0
70.0
80.0
90.0
100.0
% N
etw
ok L
en
gth
in
Tra
ffic
Den
sit
y B
an
d
No data
Less than 3,000
3,000 - 6,000
6,000 - 12,000
12,000 - 18,000
More than 18,000
3%
12%
25%
27%
33%
More than 18,000
12,000 - 18,000
6,000 - 12,000
3,000 - 6,000
Less than 3,000

Page 39 of 84
Trans-European Road Network, TEN-T (Roads): 2015 Performance Report
carries more than 12,000 vehicles per lane per day and 20% carries more than 18,000 vehicles per lane per day. The countries with the lowest Traffic Density on the TEN-T (Roads) network are Estonia, Finland, Iceland, Lithuania, Norway, Spain, and Sweden, where more than 40% of the TEN-T (Roads) network has a Traffic Density of less than 3,000 vehicles per lane per day. Preliminary data from Poland indicates that the average daily Traffic Density is 5,800 vehicles per lane per day. Figure 29 shows a comparison between Traffic Density on the core and comprehensive network for roads where data is available. This shows that on the core network, some 23% has a Traffic Density greater than 12,000 vehicles per lane per day compared with 15% on the comprehensive network as a whole. Conversely, only 17% of the core network has less than 3,000 vehicles per lane per day compared with 33% of the comprehensive network as a whole.
Figure 29: Comparison of Traffic Density on core and comprehensive networks (2015)
3.0 4.4
11.8
18.5
24.6
32.7
27.2
27.9
33.3
16.5
0.0
10.0
20.0
30.0
40.0
50.0
60.0
70.0
80.0
90.0
100.0
Comprehensive Core
More than 18,000 12,000 - 18,000 6,000 - 12,000 3,000 - 6,000 Less than 3,000

Page 40 of 84
Trans-European Road Network, TEN-T (Roads): 2015 Performance Report
5.3 Proportion of Heavy Goods Vehicles
The proportion of the traffic on the TEN-T (Roads) network that comprises heavy goods vehicles (HGVs) is expressed as a percentage. HGVs are defined as goods vehicles weighing in excess of 3.5 tonnes (see Section 8.9).
Proportion of total traffic comprising HGVs
Less than 5% 5%–10% 10%–20% More than 20% No data
Country Total length
(km) Length
(km) %
Length (km)
% Length
(km) %
Length (km)
% Length
(km) %
Austria 1,689 5 0.3 380 22.5 1,232 72.9 65 3.8 7 0.4
Denmark 1,554 54 3.5 275 17.7 1,096 70.5 129 8.3 - 0.0
Estonia 1,350 17 1.3 244 18.1 893 66.1 196 14.5 - 0.0
Finland 5,229 37 0.7 1,957 37.4 3,208 61.3 28 0.5 - 0.0
Germany 10,700 44 0.4 1,290 12.1 6,839 63.9 2,527 23.6 - 0.0
Greece 4,831 73 1.5 171 3.5 959 19.8 825 17.1 2,803 58.0
Iceland 1,803 72 4.0 596 33.1 1,135 63.0 - 0.0 - 0.0
Ireland 2,258 377 16.7 1,643 72.8 234 10.4 4 0.2 - 0.0
Italy 8,809 15 0.2 266 3.0 567 6.4 664 7.5 7,297 82.8
Lithuania 1,652 18 1.1 173 10.5 932 56.4 507 30.7 22 1.3
Luxembourg 90 - 0.0 - 0.0 80 88.5 10 11.5 - 0.0
Malta 109 - 0.0 - 0.0 - 0.0 - 0.0 109 100.0
Netherlands 1,886 - 0.0 229 12.1 1,437 76.2 220 11.7 - 0.0
Norway 4,928 - 0.0 212 4.3 3,574 72.5 1,142 23.2 - 0.0
Slovenia 593 43 7.3 219 36.9 243 41.0 88 14.8 - 0.0
Spain 12,311 239 1.9 2,418 19.6 6,112 49.6 3,020 24.5 522 4.2
Sweden 6,391 39 0.6 175 2.7 3,991 62.4 2,186 34.2 - 0.0
Switzerland 1,325 386 29.1 594 44.8 116 8.8 - 0.0 229 17.3
UK 6,926 44 0.6 1,896 27.4 2,274 32.8 154 2.2 2,558 36.9
Total (all data) 74,434 1,463 2.0 12,738 17.1 34,921 46.9 11,766 15.8 13,546 18.2
Total (ex No data)
60,888 1,463 2.4 12,738 20.9 34,921 57.4 11,766 19.3 - -
On average, 13% of the traffic using the TEN-T (Roads) network each day is HGVs. This proportion is fairly consistent across different road types; on motorways, the figure is 13%, on non-motorways 12%. Figure 30 shows the overall proportion of traffic on the TEN-T network comprising HGVs. The figures show that on 24% of the TEN-T (Roads) network, HGVs comprise less than 10% of all traffic. Meanwhile, on 57% of the TEN-T (Roads) network, HGVs comprise between 10 and 20% of all traffic, while HGVs comprise more than 20% of traffic on 19% of the TEN-T (Roads) network.

Page 41 of 84
Trans-European Road Network, TEN-T (Roads): 2015 Performance Report
Figure 30: Overall proportion of traffic on TEN-T roads comprising HGVs (2015)
Figure 31: Proportion of traffic on national TEN-T roads comprising HGVs (2015)
Figure 31 shows the national figures against a background of the average values for the comprehensive network as a whole and indicates that the countries with the highest proportion of HGVs on the TEN-T (Roads) network are Germany, Lithuania, Norway, Spain, and Sweden, where HGVs comprise more than 20% of all traffic on more than 20% of the TEN-T roads network. The countries with the lowest proportion of HGVs on the TEN-T (Roads) network are Finland, Iceland, Ireland, Slovenia, and Switzerland, where HGVs comprise 10% of all traffic or less on more than 35% of the TEN-T (Roads) network. Preliminary data from Poland indicates that HGVs comprise approximately 23% of all traffic.
0.0
10.0
20.0
30.0
40.0
50.0
60.0
70.0
80.0
90.0
100.0
% N
etw
ork
Le
ng
th
No data
Less than 5%
5% - 10%
10% - 20%
More than 20%

Page 42 of 84
Trans-European Road Network, TEN-T (Roads): 2015 Performance Report
Figure 32 compares the proportion of HGVs on the core and comprehensive networks where data is available. The figures show that HGVs comprise more than 20% of all traffic on more than 25% of the core network compared with less than 20% on the comprehensive network. Meanwhile, HGVs comprise less than 5% of all traffic on less than 1% of the core network compared with more than 2% on the comprehensive network as a whole.
Figure 32: Comparison of HGV proportion on core and comprehensive networks (2015)
19.325.2
57.4
59.8
20.9
14.1
2.4 0.8
0%
10%
20%
30%
40%
50%
60%
70%
80%
90%
100%
Comprehensive Core
% N
etw
ork
Len
gth
More than 20% 10% - 20% 5% - 10% Less than 5%

Page 43 of 84
Trans-European Road Network, TEN-T (Roads): 2015 Performance Report
5.4 Heavy Goods Vehicle Traffic Flow
As well as understanding the proportion of vehicles using the TEN-T (Roads) network that are heavy goods vehicles (HGVs), it is useful to consider the actual volume of HGV traffic. HGVs are defined as goods vehicles weighing in excess of 3.5 tonnes.
HGV Traffic Flow (AADT)
Less than 3,000 3,000–6,000 6,000–9,000
More than 9,000
No data
Country Total length
(km) Length
(km) %
Length (km)
% Length
(km) %
Length (km)
% Length
(km) %
Austria 1,689 386 22.9 832 49.3 251 14.9 213 12.6 7 0.4
Denmark 1,554 859 55.3 389 25.0 216 13.9 90 5.8 - 0.0
Estonia 1,350 1,331 98.6 19 1.4 - 0.0 - 0.0 - 0.0
Finland 5,229 5,138 98.3 91 1.7 - 0.0 - 0.0 - 0.0
Germany 10,700 1,642 15.3 3,165 29.6 1,939 18.1 3,954 37.0 - 0.0
Greece 4,831 1,404 29.1 434 9.0 125 2.6 65 1.3 2,803 58.0
Iceland 1,803 1,803 100.0 - 0.0 - 0.0 - 0.0 - 0.0
Ireland 2,258 2,117 93.8 123 5.4 18 0.8 -
- 0.0
Italy 8,809 1,122 12.7 302 3.4 - 0.0 88 1.0 7,297 82.8
Lithuania 1,652 1,438 87.0 186 11.3 6 0.4 - 0.0 22 1.3
Luxembourg 90 11 12.7 33 36.2 27 30.0 19 21.1 - 0.0
Malta 109 - 0.0 - 0.0 - 0.0 - 0.0 109 100.0
Netherlands 1,886 101 5.4 352 18.6 535 28.4 898 47.6 - 0.0
Norway 4,928 4,579 92.9 288 5.8 55 1.1 6 0.1 - 0.0
Slovenia 593 308 51.9 183 30.9 102 17.2 - 0.0 - 0.0
Spain 12,311 8,188 66.5 2,631 21.4 445 3.6 526 4.3 522 4.2
Sweden 6,391 4,981 77.9 1,311 20.5 95 1.5 4 0.1 - 0.0
Switzerland 1,325 731 55.2 264 19.9 101 7.6 - 0.0 229 17.3
UK 6,926 999 14.4 727 10.5 1,357 19.6 1,285 18.6 2,558 36.9
Total (all data)
74,434 37,139 49.9 11,330 15.2 5,272 7.1 7,148 9.6 13,546 18.2
Total (ex No data)
60,888 37,139 61.0 11,330 18.6 5,272 8.7 7,148 11.7 - -
On average 3,517 HGVs use each section per day. On motorway sections, this figure is as high as 5,023 per day, while on non-motorways it is 1,006 HGVs per day. The figures show that 61% of the TEN-T (Roads) network carries fewer than 3,000 HGVs per day, 27% carries between 3,000 and 9,000 HGVs per day, and 12% carries more than 9,000 HGVs per day.

Page 44 of 84
Trans-European Road Network, TEN-T (Roads): 2015 Performance Report
Figure 33: Overall HGV Traffic Flow on TEN-T roads (2015)
Figure 34: National distribution of HGV Traffic Flow on TEN-T roads (2015)
The national figures in Figure 34 (shown against a background of the average values for the comprehensive network as a whole) indicate that the countries that carry the greatest number of HGVs on their TEN-T roads are Germany, Luxembourg, the Netherlands, and the UK, with at least 18% of the network carrying more than 9,000 HGVs per day. The countries carrying the fewest HGVs are Estonia, Finland, Iceland, Ireland, and Norway, where at least 90% of the TEN-T (Roads) network carries less than 3,000 HGVs per day. Preliminary data from Poland indicates that the average daily HGV Traffic Flow is 5,700 vehicles per day.
0.0
10.0
20.0
30.0
40.0
50.0
60.0
70.0
80.0
90.0
100.0
% H
GV
Tra
ffic
Flo
w
No data
Less than 3,000
3,000 - 6,000
6,000 - 9,000
More than 9,000
12%
9%
18%61%
More than 9,000
6,000 - 9,000
3,000 - 6,000
Less than 3,000

Page 45 of 84
Trans-European Road Network, TEN-T (Roads): 2015 Performance Report
Figure 35: Comparison of HGV traffic on core and comprehensive networks (2015)
Figure 35 compares the core and comprehensive networks where data is available. This shows that 24% of the core network has HGV traffic greater than 9,000 vehicles per day compared to 12% of the comprehensive network as a whole. Meanwhile, 37% of the core network has HGV traffic less than 3,000 vehicles per day, compared with 61% on the comprehensive network as a whole.
11.7
23.6
8.7
14.418.6
24.8
61.0
37.2
0%
10%
20%
30%
40%
50%
60%
70%
80%
90%
100%
Comprehensive Core
% H
GV
Flo
w
More than 9,000 6,000 - 9,000 3,000 - 6,000 Less than 3,000 No Data

Page 46 of 84
Trans-European Road Network, TEN-T (Roads): 2015 Performance Report
5.5 Fatal Accident Rate
This indicator shows the average rate of fatal accidents on a TEN-T section. The indicator is expressed as average annual Fatal Accident Rate per billion vehicle kilometres or BVehKm. It is designed to provide an indication of the relative safety of TEN-T sections, taking into account their length and level of use. The definition of fatal accident base data used in the calculation is provided in Section 8.10.
Name
Average Annual Fatal Accident Rate / BVehKm per Section
Motorway Non-motorway
Austria 1.62 N/a
Denmark 0.97 5.82
Estonia N/a 10.23
Finland 2.62 9.28
Germany 1.48 1.06
Greece 1.70 0.87
Iceland 0.00 5.28
Ireland 0.95 4.46
Italy 0.79 1.00
Lithuania 4.83 12.32
Luxembourg 1.12 N/a
Malta N/a 13.79
Netherlands 0.90 N/a
Norway 0.85 5.03
Slovenia 2.21 7.02
Spain 2.10 7.26
Sweden 0.82 2.64
Switzerland 0.98 1.91
UK 0.92 2.23
Average 1.46 5.64
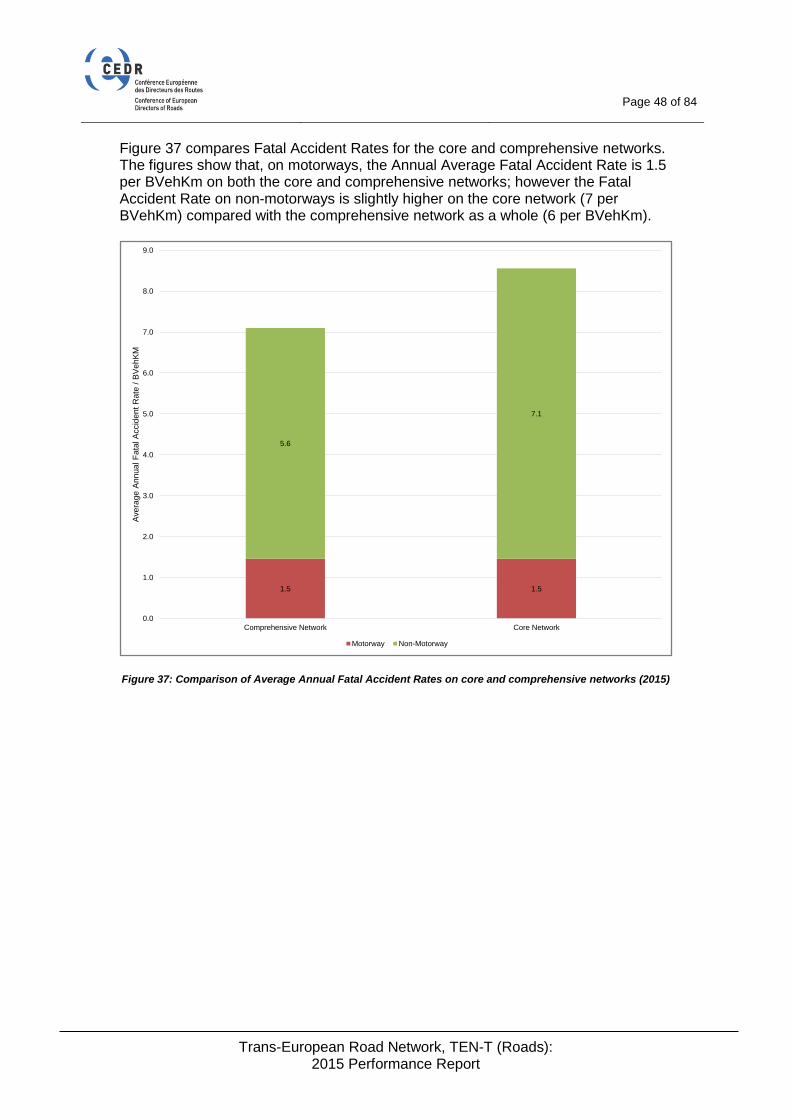
On an average motorway section of the TEN-T (Roads) network, there are 1.5 fatal accidents per year for every billion vehicle-kilometres driven. On non-motorway sections, this figure rises to 5.6.

Page 47 of 84
Trans-European Road Network, TEN-T (Roads): 2015 Performance Report
Figure 36 shows the national distribution of Fatal Accident Rates for motorways and non-motorways as well as the average figures for the comprehensive network as a whole. These figures show that motorways in Finland, Lithuania, Slovenia, and Spain have the highest Fatal Accident Rates, with more than 2.0 fatal accidents per BVehKm, while motorways in Iceland6, Italy, Norway, and Sweden have fewer than 0.9 fatal accidents per BVehKm.
Figure 36: Average Annual Fatal Accident Rate on the TEN-T network (2015)
On non-motorway roads, Estonia, Lithuania, and Malta have the highest accident rates with more than 10.0 fatal accidents per BVehKm, while non-motorways in Germany, Greece, Italy, and Switzerland have the lowest accident rates with fewer than 2.0 accidents per BVehKm. Preliminary data from Poland indicates that the average annual Fatal Accident Rate is 3.98 fatal accidents per BVehKm.
6 It should be noted that Iceland has only 3 km of motorways.
0.00
2.00
4.00
6.00
8.00
10.00
12.00
14.00
16.00
Ave
rage
An
nu
al F
atal
Acc
ide
nt
Rat
e /
BV
eh
KM
Motorway
Non-Motorway
Avg Motorway
Avg Non-Motorway
Avg All Roads
Page 48 of 84
Trans-European Road Network, TEN-T (Roads): 2015 Performance Report
Figure 37 compares Fatal Accident Rates for the core and comprehensive networks. The figures show that, on motorways, the Annual Average Fatal Accident Rate is 1.5 per BVehKm on both the core and comprehensive networks; however the Fatal Accident Rate on non-motorways is slightly higher on the core network (7 per BVehKm) compared with the comprehensive network as a whole (6 per BVehKm).
Figure 37: Comparison of Average Annual Fatal Accident Rates on core and comprehensive networks (2015)
1.5 1.5
5.6
7.1
0.0
1.0
2.0
3.0
4.0
5.0
6.0
7.0
8.0
9.0
Comprehensive Network Core Network
Avera
ge A
nnual F
ata
l A
ccid
ent
Rate
/ B
VehK
M
Motorway Non-Motorway
Page 49 of 84
Trans-European Road Network, TEN-T (Roads): 2015 Performance Report
5.6 Planned Capacity Improvements
Planned Capacity Improvements is a new indicator included in the 2015 report to represent a proxy for capacity issues, such as bottlenecks, on the network. Member countries were asked to highlight sections that had been identified as being in need of capacity improvements in their organisations' most recent network improvement plan. It should be noted that there is no indication of the currency of the plan nor whether any planned improvements have subsequently been completed. These issues will be considered in future reports. A fuller definition is provided in Section 8.11.
Planned Capacity Improvement on section
Yes No No data
Name Total sections No. sections % No. sections % No. sections %
Austria 85 17 20.0 62 72.9 6 7.1
Denmark 69 5 7.2 64 92.8 - 0.0
Estonia 45 11 24.4 34 75.6 - 0.0
Finland 173 27 15.6 146 84.4 - 0.0
Germany 360 168 46.7 192 53.3 - 0.0
Greece 120 17 14.2 95 79.2 8 6.7
Iceland 78 2 2.6 76 97.4 - 0.0
Ireland 60 6 10.0 54 90.0 - 0.0
Italy 247 13 5.3 68 27.5 166 67.2
Lithuania 127 40 31.5 87 68.5 - 0.0
Luxembourg 28 - 0.0 - 0.0 28 100.0
Malta 48 3 6.3 - 0.0 45 93.8
Netherlands 119 52 43.7 67 56.3 - 0.0
Norway 206 28 13.6 178 86.4 - 0.0
Slovenia 51 1 2.0 50 98.0 - 0.0
Spain 416 101 24.3 315 75.7 - 0.0
Sweden 119 18 15.1 101 84.9 - 0.0
Switzerland 111 - 0.0 - 0.0 111 100.0
UK 157 19 12.1 89 56.7 49 31.2
Total/Average 2,619 528 20.2 1,678 64.1 413 15.8
Total (ex No data)
2,206 528 23.9 1,678 76.1 - 0
As shown in Figure 38, 24% of the TEN-T (Roads) network where data is available has been identified as being in need of capacity improvements. Figure 39 shows the national distribution against a background of the average values for the comprehensive network as a whole. The figures show that in Estonia, Germany, Lithuania, the Netherlands, and Spain, more than 24% of the network has been identified as being in need of capacity improvements. Iceland and Slovenia have identified the lowest proportion of the network identified as needing capacity improvements (2.6% and 2.0% respectively). No data was available from Switzerland.

Page 50 of 84
Trans-European Road Network, TEN-T (Roads): 2015 Performance Report
Figure 38: Overall Planned Capacity Improvements on TEN-T roads (2015)
Figure 39: Planned Capacity Improvements on the TEN-T Network (2015)
Yes24%
No76%
Yes No
0.00
10.00
20.00
30.00
40.00
50.00
60.00
70.00
80.00
90.00
100.00
% N
o o
f S
ec
tio
ns
wit
h P
lan
ne
d C
ap
ac
ity
Im
pro
ve
me
nts
No Data
No
Yes

Page 51 of 84
Trans-European Road Network, TEN-T (Roads): 2015 Performance Report
Figure 40 compares the planned capacity improvements on the core and comprehensive networks where data is available. The figures show that 32% of the core network has been identified as in need of capacity improvements compared with 25% of the comprehensive network as a whole.
Figure 40: Comparison of Overall Planned Capacity Improvements on core and comprehensive networks
(2015)
24%
31%
76%
69%
0
250
500
750
1,000
1,250
1,500
1,750
2,000
2,250
2,500
Comprehensive Core
Nu
mb
er
of
Se
ctio
ns
Yes No

Page 52 of 84
Trans-European Road Network, TEN-T (Roads): 2015 Performance Report
6 CONCLUSIONS AND FUTURE DEVELOPMENTS
The 2015 TEN-T (Roads) Performance Report provides a detailed snapshot of the performance of the TEN-T (Roads) network in CEDR member countries in 2015 and identifies overall trends in the performance of the network as a whole.
The 2015 report has built on previous reports to provide a better, richer source of performance data that can be used by national road administrations and regulatory bodies for benchmarking and target setting, and by CEDR itself to support current and future initiatives.
The 2015 report covers 74,000 km of the 103,000 km TEN-T (Roads) network and continues to underline the importance of this network by showing that:
1 The TEN-T network includes the most important roads in Europe; 60% of the network consists of motorways – this proportion is gradually increasing – and 17% is made of up roads with more than 4-lanes. The network also includes 1,200 km of bridges and more than 1,000 km of tunnels. Investment in the TEN-T network is continuing with planned capacity improvements identified on nearly 25% of the network.
2 The network is also very heavily trafficked; more than 40% of the network carries in excess of 20,000 vehicles per day while 6% carries more than 80,000 vehicles per day. Traffic Density exceeds 12,000 vehicles per lane per day on 15% of the network, and HGVs comprise more than 20% of all traffic on nearly 20% of the network. The Traffic Flow for both all vehicles and HGVs specifically is increasing, particularly on motorways.
3 However, despite this, the network is relatively safe; the average Fatal Accident Rate on motorways is less than 2 fatal accidents per BVehKm and is less than 6 per BVehKm on non-motorways. However, there are wide variations across the network.
The main change impacting on the 2015 report has been the implementation of the new TEN-T Guidelines in January 2014, which introduced the concept of a core and comprehensive network as well as the new TEN-T corridors. The new guidelines have resulted in CEDR members making significant changes (mostly increases) to roads included in the TEN-T and some re-categorisation of motorways and non-motorways. This may make it necessary to re-baseline the network trends before any future reports.
Other potential future developments could include:
Improved ITS base data definitions so that this can be included as an indicator Reporting on the performance of the nine TEN-T corridors Development of PIs to support future transport initiatives including electric
vehicles, open data, autonomous vehicles Automation of data collection process to improve consistency and efficiency
Overall, the 2015 TEN-T (Roads) Performance Report continues to show that it is possible to produce comparable information on the performance of the TEN-T (Roads) network in the majority of CEDR member countries and to show trends between the performance of the network over a five-year period. The report, and its underpinning data, therefore represents a valuable resource to CEDR and its members, as well as regulatory bodies and other external stakeholders.

Page 53 of 84
Trans-European Road Network, TEN-T (Roads): 2015 Performance Report
7 APPENDIX 1: METHODOLOGY AND DATA VALIDITY
7.1 Methodology The TEN-T (Roads) Performance Report is based on a common location referencing model and common data definitions that have been developed by practitioners with an understanding of the data. Data is provided directly by NRAs and is processed centrally to produce this report and the accompanying maps as described below: 1 Individual countries referenced their local networks into Logical Nodes and
Sections using the TEN-T (Roads) Location Referencing System developed by CEDR in SP1.
2 They then submitted their network and performance base data (including the
geographical coordinates of each node) using a standard Excel spreadsheet and a set of base data definitions that they were provided with (see Section 8).
3 Once received, the data was checked, and errors were corrected in consultation
with the individual countries. 4 The data was then loaded into a database for statistical analysis using SQL
queries and the production of GIS data in ESRI ShapeFile format for the production of the maps.
5 An Excel spreadsheet containing the results of the SQL queries was exported
from the database and used to produce the maps and charts in this report. As this is now the fourth biennial report that CEDR has produced, the participating countries are familiar with the requirements and the process and data quality has improved. Although relatively mature, the process is largely manual and revolves around a two-year cycle. It is possible that, in future, the process could become more automated and, therefore, more up-to-date data could be provided. 7.2 Data quality and validity The data included in this report is intended to accurately represent the performance of the TEN-T (Roads) network in 2015 and is assumed to be correct as of 1 January 2015. However, as the data has been provided by individual NRAs and requires aggregation of local data and interpretation of data definitions, it is possible that the quality of data will vary. This may particularly be the case where: countries are participating for the first time (not that this applies in 2015); definitions of base data have changed; or network coverage within a country has been extended (e.g. in response to the
new TEN-T Guidelines). CEDR therefore takes no responsibility for the accuracy or quality of the data that has been used to produce this report.
Page 54 of 84
Trans-European Road Network, TEN-T (Roads): 2015 Performance Report
8 APPENDIX 2: BASE DATA DEFINITIONS
8.1 Road Type
Title Road Type
Definition The predominant Road Type along a Logical Section
Permitted values Motorway or Non-motorway
Definitions A motorway is a road that is part of the TEN-T network that comprises two carriageways, separated by a physical barrier for most of its length. All crossings are normally grade separated. No stopping and usually a minimum speed. Access is generally restricted to certain types of vehicle. A non-motorway is a road that is not a motorway but is still a strategic road and is part of the TEN-T network.
8.2 Section Length
Title Section Length
Definition The route length of a Logical Section in kilometres
Permitted values Integer
Definitions The route length of a section is the distance from the start node to the end node of a Logical Section, measured in one direction only. This means that, for dual carriageways, the length is included once only and is the average of the distances on each carriageway. The route length should be rounded to the nearest kilometre.

Page 55 of 84
Trans-European Road Network, TEN-T (Roads): 2015 Performance Report
8.3 Number of Lanes
Title Number of Lanes
Definition The average number of lanes along a Logical Section
Permitted values Real number to one decimal place (e.g. 4.2)
Definitions The length-weighted average number of permanent lanes in both directions along a Logical Section, including crawler lanes and bus lanes. The Number of Lanes should be calculated as the length-weighted average number of lanes in one direction plus the length-weighted average number of lanes in the other direction. For example, if a Logical Section has 2 lanes for 25% of its length and 1 lane for 75% of its length in one direction, and has 1 lane for 100% of its length in the other direction, then its length-weighted average number of lanes is: (25% x 2 + 75% x 1) + (100% x 1) = 2.25 This Logical Section will therefore be recorded as having 2.3 lanes.
8.4 Length of Bridges
Title Length of Bridges
Definition The total length of bridges along a Logical Section in kilometres
Permitted values Real number to one decimal place
Definitions The total Length of Bridges along a section is the total length of road that crosses bridges within that Logical Section, measured in one direction only. This means that, for dual carriageways, the length is included once only and is the average of the total length of bridges on each carriageway. Only road-carrying bridges that have a length greater than 0.1 km should be reported. The total Length of Bridges along a Logical Section should be rounded to the nearest 0.1 km. For example, on a 2-km Logical Section which has two bridges, one 0.5 km long and one 0.075 km long, the total Length of Bridges for that Logical Section would be reported as 0.5 km.

Page 56 of 84
Trans-European Road Network, TEN-T (Roads): 2015 Performance Report
8.5 Length of Tunnels
Title Length of Tunnels
Definition The total Length of Tunnels along a Logical Section in kilometres
Permitted values Real number to one decimal place
Definitions The Length of Tunnels along a section is the total length of road that passes through tunnels within that Logical Section, measured in one direction only. This means that, for dual carriageways, the length is included once only and is the average of the total length of tunnels on each carriageway. Only tunnels that have a length greater than 0.3 km should be reported. The total Length of Tunnels along a Logical Section should be rounded to the nearest 0.1 km. For example, on a 2-km Logical Section which has two tunnels, one 0.5 km long and one 0.2 km long, the total Length of Tunnels for that Logical Section would be reported as 0.5 km.
8.6 Physical Environment
Title Physical Environment
Definition An indication of the predominant physical environment along a Logical Section.
Permitted values Urban or Rural
Definitions Urban: the Logical Section predominantly passes through built-up areas. Rural: the Logical Section predominantly passes through non built-up areas.

Page 57 of 84
Trans-European Road Network, TEN-T (Roads): 2015 Performance Report
8.7 Intelligent Transport Systems (ITS)
Title ITS
Definition An indication of the type of Intelligent Transport System (ITS) in place on the Logical Section.
Permitted values 0, 1, 2, 3, or 4
Definitions Level 0 None Level 1 Monitoring system (e.g. real-time data about traffic/weather
conditions is collected by the road administration) Level 2 Traffic information system (road administration passively manages
the network e.g. information about traffic/weather conditions is provided to road users)
Level 3 Traffic management system (road administration actively manages
the network e.g. variable speed limits, dynamic lane management, ramp metering)
Level 4 Cooperative ITS (i.e. vehicle-to-vehicle or infrastructure-to-vehicle
information) The types of ITS are based on the EasyWay Deployment Guidelines
8.8 Traffic Flow
Title Traffic Flow
Definition The annual average daily traffic along a Logical Section
Permitted values Integer
Definitions The length-weighted Average Annual Daily Traffic (AADT) along a Logical Section, in both directions, rounded to the nearest integer. This includes all vehicle types. The Traffic Flow should be calculated as the length-weighted AADT in one direction plus the length-weighted AADT in the other direction. See Number of Lanes for a description of length weighting. If traffic count data is not available, estimated values can be used.

Page 58 of 84
Trans-European Road Network, TEN-T (Roads): 2015 Performance Report
8.9 Proportion of HGVs
Title Proportion of Heavy Goods Vehicles
Definition The proportion of annual average daily traffic along a Logical Section that comprises Heavy Goods Vehicles (HGVs)
Permitted values Percentage to one decimal place
Definitions The proportion of length-weighted average annual daily traffic (AADT) along a Logical Section, in both directions, that comprises Heavy Goods Vehicles, expressed as a percentage. See Number of Lanes for a description of length weighting. HGVs are goods vehicles weighing in excess of 3.5 tonnes.
8.10 Fatal Accidents
Title Fatal Accidents
Definition The total number of fatal accidents that occurred along the Logical Section over the last five calendar years
Permitted values Fatal Accidents Integer
Number of Years (if <5) Integer
Definitions The aggregated number of fatal accidents that occurred on the section over the last five years. Any accidents that occurred at a Logical Node should be allocated to a single Logical Section as appropriate. If data is not available for the last five years, the number of years that the number of accidents is aggregated over should be provided.

Page 59 of 84
Trans-European Road Network, TEN-T (Roads): 2015 Performance Report
8.11 Planned Capacity Improvements
Title Planned Capacity Improvements
Definition An indication that capacity improvements are planned on the Logical Section
Permitted values Yes or No
Definitions Capacity improvements that are planned for all or part of the Logical Section within the organisation's current maintenance or investment plans. The need for capacity improvements is deemed to indicate that the Logical Section currently experiences traffic congestion, i.e. it is a bottleneck.
Page 60 of 84
Trans-European Road Network, TEN-T (Roads): 2015 Performance Report
9 APPENDIX 3: PERFORMANCE INDICATOR MAPS
All maps have been produced using the performance data provided by the respective NRAs. For some maps, further calculation was carried out centrally using the data provided.
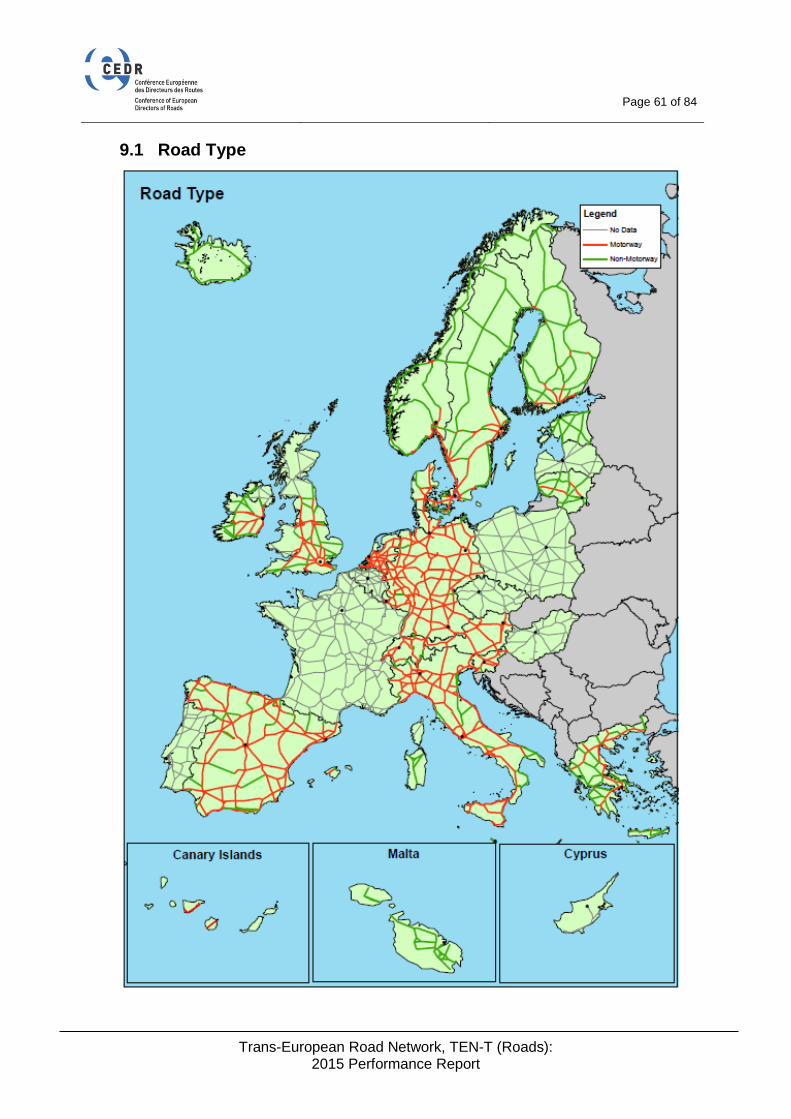
Page 61 of 84
Trans-European Road Network, TEN-T (Roads): 2015 Performance Report
9.1 Road Type

Page 62 of 84
Trans-European Road Network, TEN-T (Roads): 2015 Performance Report
9.2 Number of Lanes

Page 63 of 84
Trans-European Road Network, TEN-T (Roads): 2015 Performance Report
9.3 Length of Bridges
The figures shown on the map are the proportion of each section that comprises a bridge longer than 300 m.

Page 64 of 84
Trans-European Road Network, TEN-T (Roads): 2015 Performance Report
9.4 Length of Tunnels
The figures shown on the map are the proportion of each section that comprises a tunnel longer than 100 m.

Page 65 of 84
Trans-European Road Network, TEN-T (Roads): 2015 Performance Report
9.5 Physical Environment

Page 66 of 84
Trans-European Road Network, TEN-T (Roads): 2015 Performance Report
9.6 Average Daily Traffic Flow

Page 67 of 84
Trans-European Road Network, TEN-T (Roads): 2015 Performance Report
9.7 Traffic Density

Page 68 of 84
Trans-European Road Network, TEN-T (Roads): 2015 Performance Report
9.8 Proportion of Average Daily Traffic comprising HGVs

Page 69 of 84
Trans-European Road Network, TEN-T (Roads): 2015 Performance Report
9.9 Average Daily HGVs

Page 70 of 84
Trans-European Road Network, TEN-T (Roads): 2015 Performance Report
9.10 Annual Average Fatal Accident Rate

Page 71 of 84
Trans-European Road Network, TEN-T (Roads): 2015 Performance Report
9.11 Planned Capacity Improvements

Page 72 of 84
Trans-European Road Network, TEN-T (Roads): 2015 Performance Report
10 APPENDIX 4: TEN-T CORRIDORS
'Core network corridors' were introduced to facilitate the coordinated implementation of the core network. They bring together public and private resources and concentrate EU support from the Connecting Europe Facility (CEF), particularly to: remove bottlenecks, build missing cross-border connections, and promote modal integration and interoperability. It should be noted that the network alignment presented in the 2015 TEN-T Performance Report is not provided by the respective NRAs directly. The alignment is based on the official maps on the EC website7. Each TEN-T Corridor includes all traffic modes: roads railways ports motorways of the sea (MoS) Only roads are presented in the 2015 TEN-T Performance Report. This means that a corridor may not be presented to its full extent in the 2015 TEN-T Performance Report compared with the official map on the EC website. For example, the Scandinavian–Mediterranean Corridor continues to Malta (Valletta) via MoS from southern Italy, but not via a road. No roads in Malta are affiliated to the corridor.
7 http://ec.europa.eu/transport/themes/infrastructure/ten-t-guidelines/corridors/index_en.htm
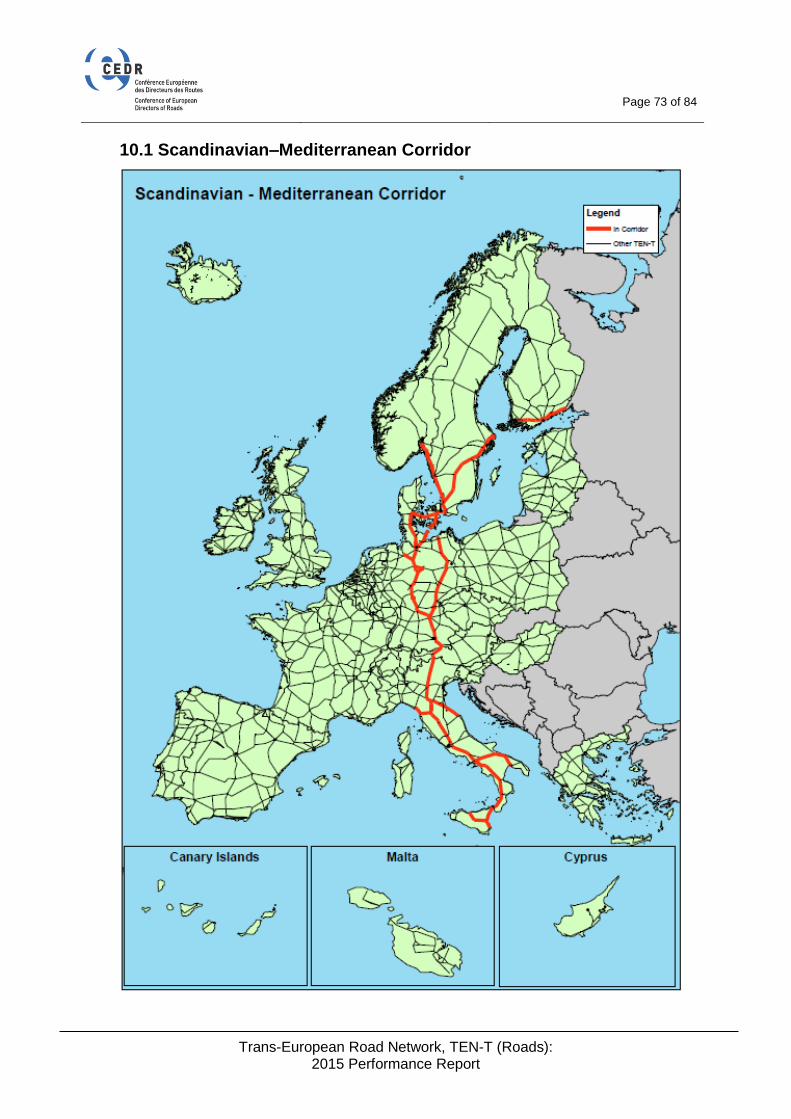
Page 73 of 84
Trans-European Road Network, TEN-T (Roads): 2015 Performance Report
10.1 Scandinavian–Mediterranean Corridor
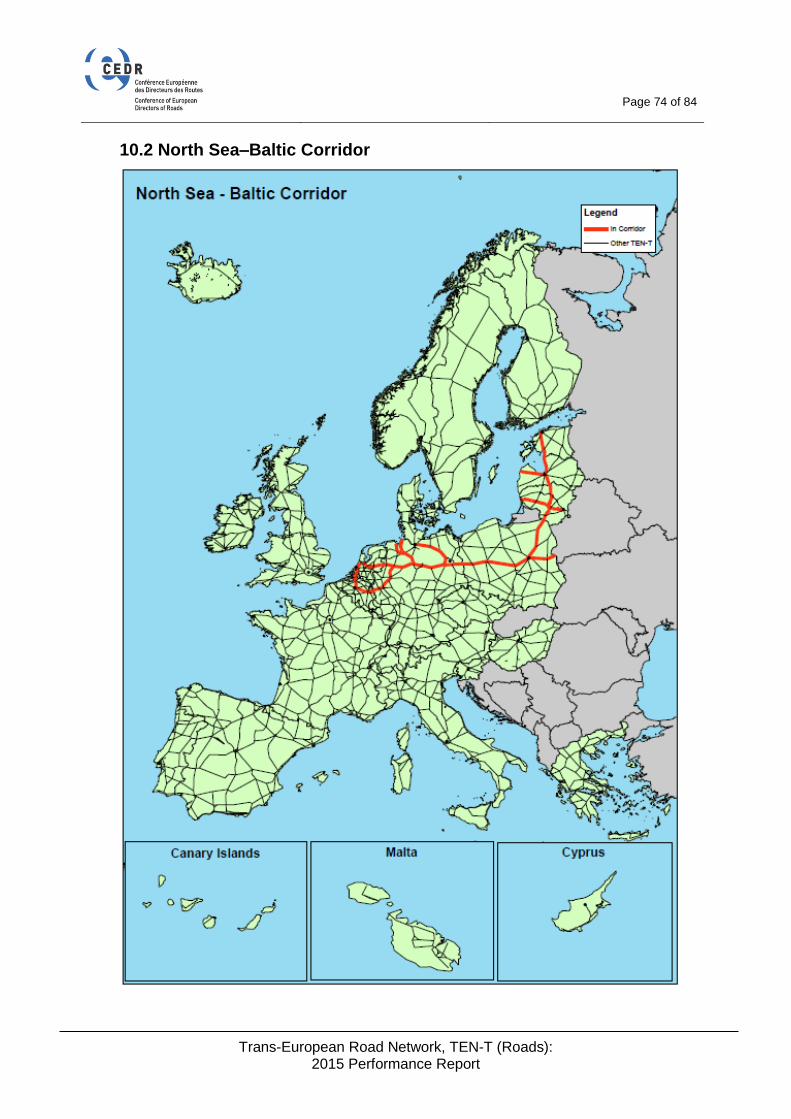
Page 74 of 84
Trans-European Road Network, TEN-T (Roads): 2015 Performance Report
10.2 North Sea–Baltic Corridor

Page 75 of 84
Trans-European Road Network, TEN-T (Roads): 2015 Performance Report
10.3 North Sea–Mediterranean Corridor

Page 76 of 84
Trans-European Road Network, TEN-T (Roads): 2015 Performance Report
10.4 Baltic–Adriatic Corridor

Page 77 of 84
Trans-European Road Network, TEN-T (Roads): 2015 Performance Report
10.5 Orient/East–Med Corridor

Page 78 of 84
Trans-European Road Network, TEN-T (Roads): 2015 Performance Report
10.6 Rhine–Alpine Corridor

Page 79 of 84
Trans-European Road Network, TEN-T (Roads): 2015 Performance Report
10.7 Atlantic Corridor

Page 80 of 84
Trans-European Road Network, TEN-T (Roads): 2015 Performance Report
10.8 Rhine–Danube Corridor

Page 81 of 84
Trans-European Road Network, TEN-T (Roads): 2015 Performance Report
10.9 Mediterranean Corridor

Page 82 of 84
Trans-European Road Network, TEN-T (Roads): 2015 Performance Report
11 APPENDIX 5: LIST OF FIGURES
Figure 1: The TEN-T (Roads) network within CEDR member countries 8 Figure 2: The TEN-T core and comprehensive road networks covered by CEDR Performance Report (2015) 9 Figure 3: Countries participating in the 2015 TEN-T (Roads) Performance Report 10 Figure 4: Comparison of population and Traffic Density on TEN-T roads 12 Figure 5: Comparison of the length of the TEN-T network and the surface area of CEDR countries 13 Figure 6: Traffic Density vs. area and population 14 Figure 7: Comparison of core and non-core network lengths on TEN-T roads 15 Figure 8: Network-trends in Road Type (2011–2015) 16 Figure 9: Network trends in All Vehicle Traffic Flow (2011–2015) 18 Figure 10: Network trends in HGV Traffic Flow (2011–2015) 19 Figure 11: Overall distribution of Road Types on the TEN-T road network (2015) 21 Figure 12: National distribution of Road Types on the TEN-T network (2015) 21 Figure 13: Comparison of Road Types on core and comprehensive networks (2015) 22 Figure 14: Overall distribution of the Number of Lanes on the TEN-T road network (2015) 24 Figure 15: National distribution of the Number of Lanes on TEN-T roads (2015) 24 Figure 16: Comparison of Number of Lanes on core and comprehensive networks (2015) 25 Figure 17: Proportion of the length of national TEN-T roads comprising bridges (2015) 27 Figure 18: Comparison of Length of Bridges on core and comprehensive networks (2015) 27 Figure 19: Proportion of the length of national TEN-T roads comprising tunnels (2015) 29 Figure 20: Comparison of the Length of Tunnels on core and comprehensive networks (2015) 29 Figure 21: National distribution of TEN-T Physical Environments (2015) 31 Figure 22: Comparison of traffic flow on urban and rural roads (2015) 31 Figure 23: Comparison of Physical Environments on core and comprehensive networks (2015) 32 Figure 24: Overall distribution of Traffic Flow on TEN-T roads (2015) 35 Figure 25: National distribution of Traffic Flow on TEN-T roads (2015) 35 Figure 26: Comparison of Traffic Flow on core and comprehensive networks (2015) 36 Figure 27: Overall distribution of Traffic Density on TEN-T roads (2015) 38 Figure 28: National distribution of Traffic Density on TEN-T roads (2015) 38 Figure 29: Comparison of Traffic Density on core and comprehensive networks (2015) 39 Figure 30: Overall proportion of traffic on TEN-T roads comprising HGVs (2015) 41 Figure 31: Proportion of traffic on national TEN-T roads comprising HGVs (2015) 41 Figure 32: Comparison of HGV proportion on core and comprehensive networks (2015) 42 Figure 33: Overall HGV Traffic Flow on TEN-T roads (2015) 44 Figure 34: National distribution of HGV Traffic Flow on TEN-T roads (2015) 44 Figure 35: Comparison of HGV traffic on core and comprehensive networks (2015) 45 Figure 36: Average Annual Fatal Accident Rate on the TEN-T network (2015) 47

Page 83 of 84
Trans-European Road Network, TEN-T (Roads): 2015 Performance Report
Figure 37: Comparison of Average Annual Fatal Accident Rates on core and comprehensive networks (2015) 48 Figure 38: Overall Planned Capacity Improvements on TEN-T roads (2015) 50 Figure 39: Planned Capacity Improvements on the TEN-T Network (2015) 50 Figure 40: Comparison of Overall Planned Capacity Improvements on core and comprehensive networks (2015) 51

Ref: CEDR report 2016/04 – Trans-European Road Network, TEN-T (Roads): 2015 Performance Report ISBN: 979-10-93321-21-9
Conference of European Directors of Roads
Avenue d'Auderghem 22-28 1040 Brussels, Belgium
e-mail : [email protected]
Tel. : + 32 (0) 2 771 2478


