New Forest District Council LAQM USA 2015 1 2015 Updating and Screening Assessment for New Forest District Council In fulfillment of Part IV of the Environment Act 1995 Local Air Quality Management October 2015
Transcript
New Forest District Council
LAQM USA 2015 1
2015 Updating and Screening Assessment for New Forest District Council
In fulfillment of Part IV of the Environment Act 1995 Local Air Quality Management October 2015
New Forest District Council
LAQM USA 2015 2
New Forest District Council
LAQM USA 2015 3
Local Authority Officer
Rachel Higgins
Department Public Health and Community Safety
Address
New Forest District Council Appletree Court Lyndhurst Hampshire SO43 7PA
1.3 Locations of air quality objective exceedances
1.4 Areas of previous interest
2.1 Details of automatic monitoring sites
2.2 Details of non-automatic monitoring sites
2.3 Results of automatic monitoring for nitrogen dioxide:
Comparison with annual mean objective
2.4 Results of automatic monitoring for nitrogen dioxide:
Comparison with hourly mean objective
2.5 Results from nitrogen dioxide diffusion tubes in 2014
2.6 Results from nitrogen dioxide diffusion tubes (2008-2014)
2.7 Results of automatic monitoring for PM10:
Comparison with annual mean objective
2.8 Results of automatic monitoring for PM10 :
Comparison with 24hour mean objective
2.9 Results of automatic monitoring of sulphur dioxide:
Comparison with objectives
List of Figures
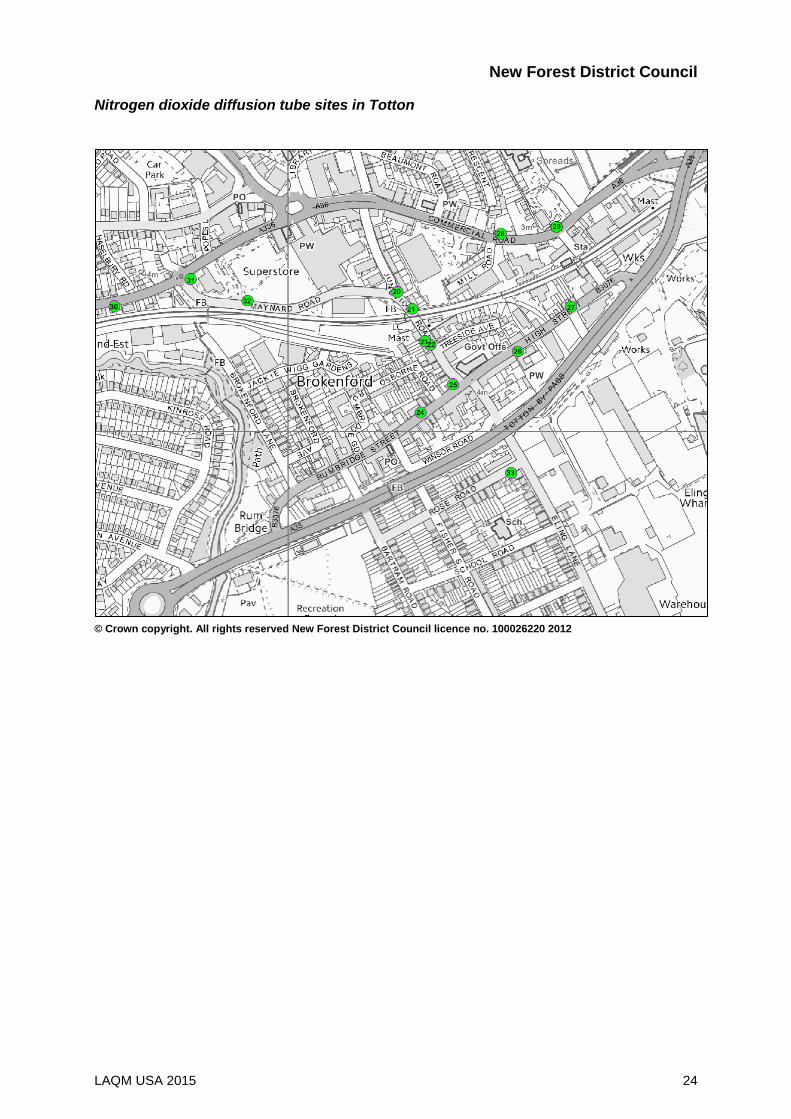
1.1 Totton Air Quality Management Area
1.2 Lyndhurst Air Quality Management Area
1.3 Fawley Air Quality Management Area (revoked)
2.1 Maps of automatic monitoring sites
2.2 Maps of non-automatic monitoring sites
2.3 Trends in annual mean nitrogen dioxide concentrations
2.4 Trends in hourly mean nitrogen dioxide concentrations
2.5 Trends in annual mean nitrogen dioxide concentrations (diffusion tube sites)
2.6 Trends in annual mean PM10 concentrations
2.7 Trends in 24 hour mean PM10 concentrations
2.8 Trends in 15 min mean sulphur dioxide concentrations
8.1 Location of diffusion tube monitoring sites 4a and 4b
New Forest District Council
LAQM USA 2015 8
Appendices
Appendix A: Part A permitted processes within New Forest district
Appendix B: QA/QC
Local bias correction factor spreadsheets
Appendix C: Full data set – nitrogen dioxide automatic monitoring hourly means
Appendix D: Annualised calculations for short term data sets
Appendix E: Adjustment for relevant exposure
Appendix F: Full data set – diffusion tube monitoring results
Appendix G: Detailed information regarding the decision to progress to revoke the Totton Air Quality Management Area
New Forest District Council
LAQM USA 2015 9
1 Introduction
1.1 Description of Local Authority Area
The New Forest District lies to the south-western corner of Hampshire, between the large
conurbations of Southampton and Christchurch/Bournemouth and Poole. The District covers
75,100 hectares (290 sq. miles) and has a diverse environment, including the New Forest
(and associated New Forest National Park) that covers approximately three quarters of the
district comprising of mainly protected heath lands and forests, a coastline of 64km, areas of
industry, towns and villages. The total population of the District is 176,800 (ONS, 2013).
Along Southampton Water much of the shoreline is influenced by urban and industrial
development, including 13 (Part A) permitted processes, as listed in Appendix A, under the
Pollution Prevention and Control (England and Wales) Regulations 2000. The local
landscape is dominated by a refinery, one of the largest in Europe, other processes include a
gas fired power station, energy recovery facilities and chemical installations.
1.2 Purpose of Report
This report fulfils the requirements of the Local Air Quality Management (LAQM) process as
set out in Part IV of the Environment Act (1995), the Air Quality Strategy for England,
Scotland, Wales and Northern Ireland 2007 and the relevant Policy and Technical Guidance
documents. The LAQM process places an obligation on all local authorities to regularly
review and assess air quality in their areas, and to determine whether or not the air quality
objectives are likely to be achieved. Where exceedences are considered likely, the local
authority must then declare an Air Quality Management Area (AQMA) and prepare an Air
Quality Action Plan (AQAP) setting out the measures it intends to put in place in pursuit of
the objectives.
The objective of this Updating and Screening Assessment is to identify any matters that have
changed which may lead to risk of an air quality objective being exceeded. A checklist
approach and screening tools are used to identify significant new sources or changes and
whether there is a need for a Detailed Assessment. The Updating and Screening
Assessment should provide an update of any outstanding information requested previously in
Review and Assessment reports.
New Forest District Council
LAQM USA 2015 10
1.3 Air Quality Objectives
The air quality objectives applicable to LAQM in England are set out in the Air Quality
(England) Regulations 2000 (SI 928), The Air Quality (England) (Amendment) Regulations
2002 (SI 3043), and are shown in Table 1.1. This table shows the objectives in units of
microgrammes per cubic metre g/m3 (milligrammes per cubic metre, mg/m3 for carbon
monoxide) with the number of exceedences in each year that are permitted (where
applicable).
Table 1.1 Air Quality Objectives included in Regulations for the purpose of LAQM in England
Pollutant
Air Quality Objective Date to be achieved by Concentration Measured as
Benzene 16.25 µg/m3 Running annual mean 31.12.2003
5.00 µg/m3 Running annual mean 31.12.2010
1,3-Butadiene 2.25 µg/m3 Running annual mean 31.12.2003
Carbon monoxide 10.0 mg/m3 Running 8-hour mean 31.12.2003
Lead 0.5 µg/m3 Annual mean 31.12.2004
0.25 µg/m3 Annual mean 31.12.2008
Nitrogen dioxide
200 µg/m3 not to be exceeded more than
18 times a year 1-hour mean 31.12.2005
40 µg/m3 Annual mean 31.12.2005
Particles (PM10) (gravimetric)
50 µg/m3, not to be exceeded more than
35 times a year 24-hour mean 31.12.2004
40 µg/m3 Annual mean 31.12.2004
Sulphur dioxide
350 µg/m3, not to be exceeded more than
24 times a year 1-hour mean 31.12.2004
125 µg/m3, not to be exceeded more than 3
times a year 24-hour mean 31.12.2004
266 µg/m3, not to be exceeded more than
35 times a year
15-minute mean 31.12.2005
New Forest District Council
LAQM USA 2015 11
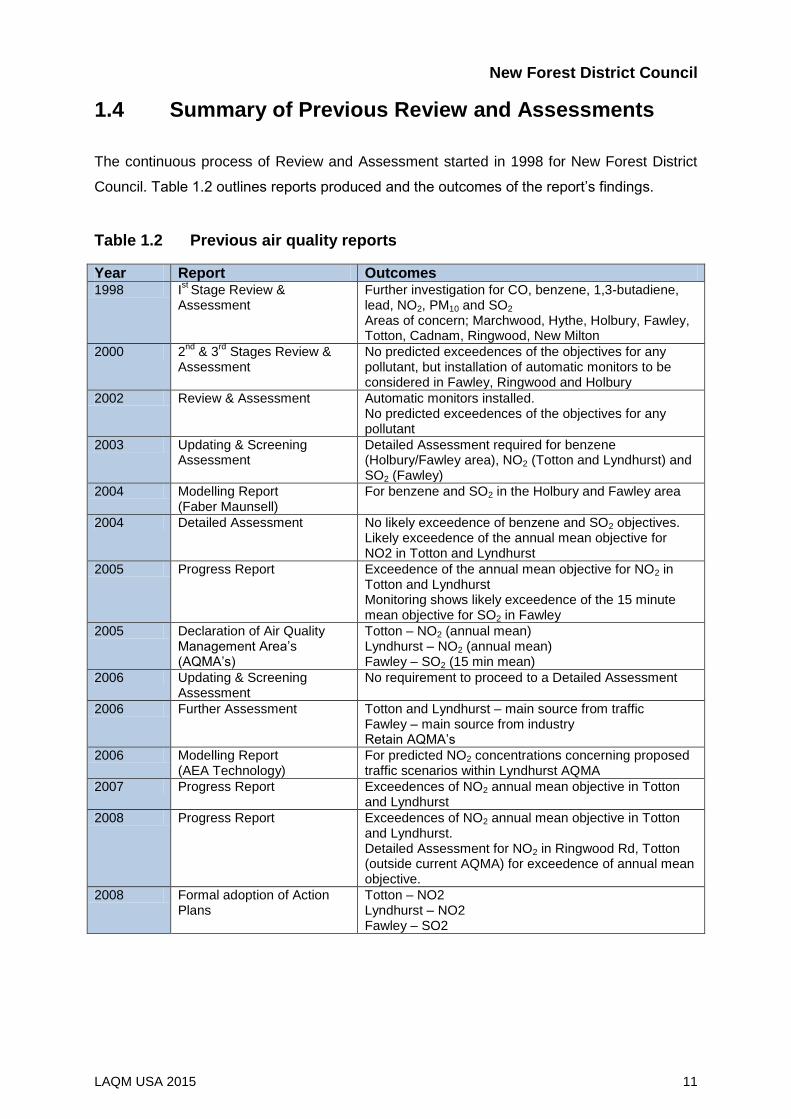
1.4 Summary of Previous Review and Assessments
The continuous process of Review and Assessment started in 1998 for New Forest District
Council. Table 1.2 outlines reports produced and the outcomes of the report’s findings.
Table 1.2 Previous air quality reports
Year Report Outcomes 1998 I
st Stage Review &
Assessment Further investigation for CO, benzene, 1,3-butadiene, lead, NO2, PM10 and SO2 Areas of concern; Marchwood, Hythe, Holbury, Fawley, Totton, Cadnam, Ringwood, New Milton
2000 2nd
& 3rd
Stages Review & Assessment
No predicted exceedences of the objectives for any pollutant, but installation of automatic monitors to be considered in Fawley, Ringwood and Holbury
2002 Review & Assessment Automatic monitors installed. No predicted exceedences of the objectives for any pollutant
2003 Updating & Screening Assessment
Detailed Assessment required for benzene (Holbury/Fawley area), NO2 (Totton and Lyndhurst) and SO2 (Fawley)
2004 Modelling Report (Faber Maunsell)
For benzene and SO2 in the Holbury and Fawley area
2004 Detailed Assessment No likely exceedence of benzene and SO2 objectives. Likely exceedence of the annual mean objective for NO2 in Totton and Lyndhurst
2005 Progress Report Exceedence of the annual mean objective for NO2 in Totton and Lyndhurst Monitoring shows likely exceedence of the 15 minute mean objective for SO2 in Fawley
2005 Declaration of Air Quality Management Area’s (AQMA’s)
No requirement to proceed to a Detailed Assessment
2006 Further Assessment Totton and Lyndhurst – main source from traffic Fawley – main source from industry Retain AQMA’s
2006 Modelling Report (AEA Technology)
For predicted NO2 concentrations concerning proposed traffic scenarios within Lyndhurst AQMA
2007 Progress Report Exceedences of NO2 annual mean objective in Totton and Lyndhurst
2008 Progress Report Exceedences of NO2 annual mean objective in Totton and Lyndhurst. Detailed Assessment for NO2 in Ringwood Rd, Totton (outside current AQMA) for exceedence of annual mean objective.
2008 Formal adoption of Action Plans
Totton – NO2 Lyndhurst – NO2 Fawley – SO2
New Forest District Council
LAQM USA 2015 12
Year Report Outcomes
2008 Modelling Report (AEA Technology)
For proposed traffic scenarios within Lyndhurst Air Quality Action Plan – recommendation to forward 2 options
2008 Monitoring Report (AEA Technology)
6 month survey of PM10 in Totton and Lyndhurst. No requirement for further action.
2009 Updating & Screening Assessment
Detailed Assessments required for NO2 (A31 and Lymington concerning traffic) and for PM10 (Sway concerning poultry farms)
2009 Action Plan Progress Report Updating progression of actions within Action Plans for the declared AQMA’s
2010 Progress Report Detailed Assessments required for NO2 (Shrubbs Hill Rd and Gosport Lane, Lyndhurst concerning traffic) Updating progression of actions within Action Plans for the declared AQMA’s
2011 Detailed Assessment (poultry farm)
Likely exceedence of the 24hr mean objective for PM10 in Sway
2011 Modelling Report (AEA Technology)
For proposed traffic scenarios within Lyndhurst Air Quality Action Plan – some reductions in NO2 predicted but at the expense of vehicle flow.
2011 Progress Report Detailed Assessment required for NO2 (Shrubbs Hill Rd and Gosport Lane, Lyndhurst concerning traffic) Updating progression of actions within Action Plans for the declared AQMA’s
2012 Detailed Assessment (AEA Technology)
For Shrubbs Hill Road and Gosport Lane, Lyndhurst – likely exceedance of the annual mean objective for NO2 in Gosport Lane but not for Shrubbs Hill Road (both locations outside current AQMA)
2012 Updating & Screening Assessment
Revocation recommended for Fawley AQMA (SO2 15 min mean objective) without the requirement to produce a Detailed Assessment. Requirement to declare an AQMA in Sway (PM10 24hr mean objective)
2013 Revocation of AQMA Fawley AQMA (SO2 15 min mean objective) revoked in April 2013
2013 Progress Report Current AQMA’s in Lyndhurst and Totton (NO2 annual mean objective) On advice from air quality helpdesk:
To continue monitoring in Gosport Lane and Shrubbs Hill Road, Lyndhurst before deciding whether to extend current AQMA or declare new AQMA’s (NO2 annual mean objective)
Not to declare AQMA in Sway (PM10 24hr mean objective) due to changes in air quality advice
To consider revoking Totton AQMA (NO2 annual mean objective) due to no recent exceedances at monitoring sites
2014 Progress Report Current AQMA’s in Lyndhurst and Totton (NO2 annual mean objective) On advice from air quality helpdesk:
To continue monitoring in Gosport Lane and Shrubbs Hill Road, Lyndhurst before deciding whether to extend current AQMA or declare new AQMA’s (NO2 annual mean objective)
To consider revoking Totton AQMA (NO2 annual mean objective) due to no recent exceedances at monitoring sites but to take into account planning application for a large brownfield development in close proximity to the AQMA.
New Forest District Council
LAQM USA 2015 13
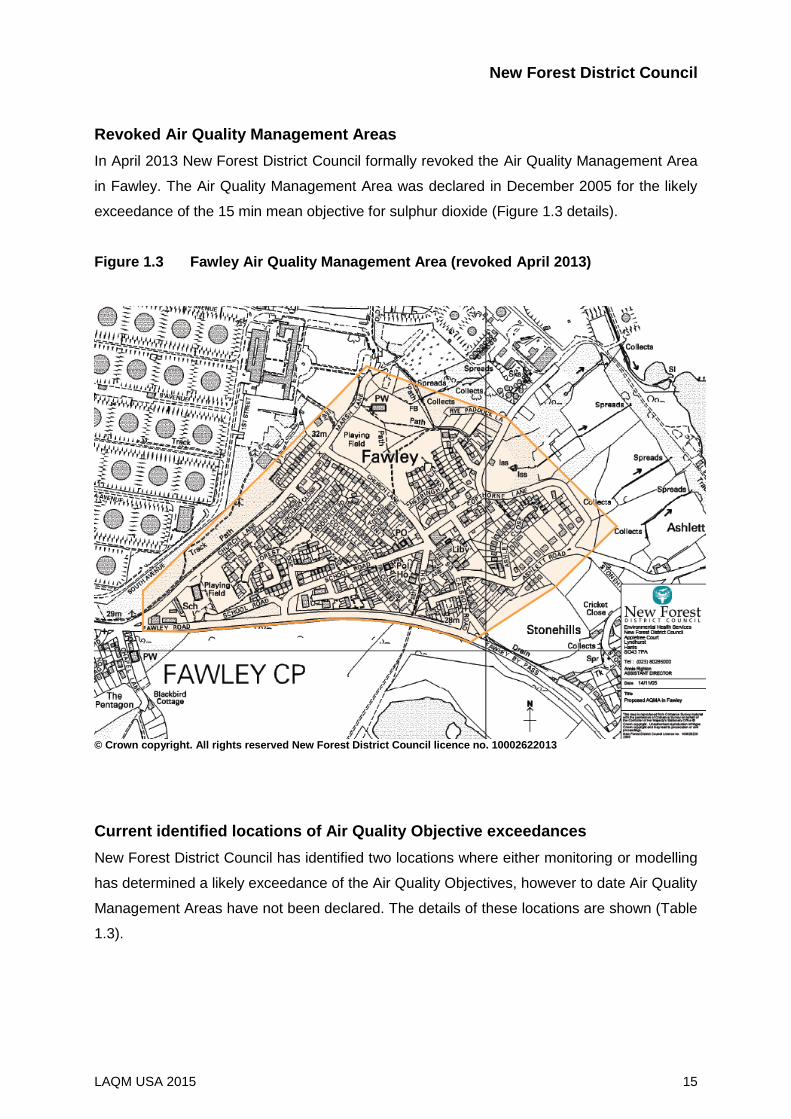
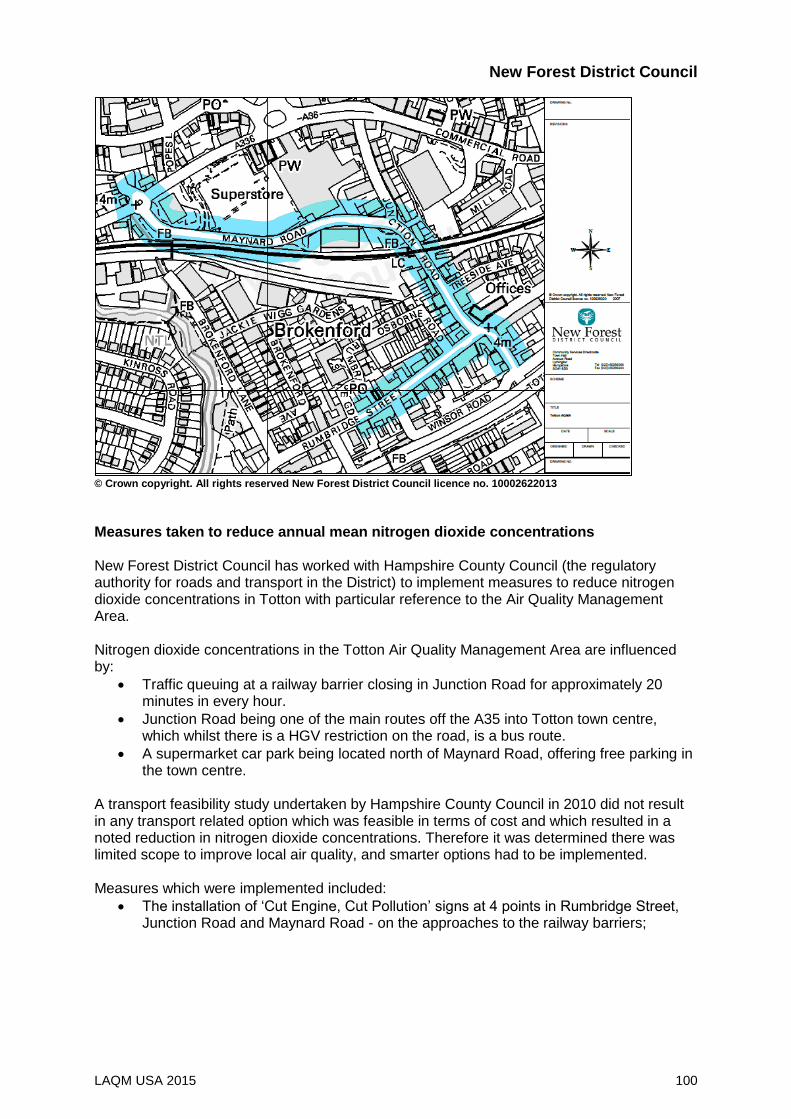
Current Air Quality Management Areas New Forest District Council has two current Air Quality Management Areas. These are
detailed below;
Totton
Air Quality Management Area (Figure 1.1) declared with respect to likely exceedence of the
Table 2.2 Details of Non-Automatic Monitoring Sites
Site Name Site ID Site Type
X OS Grid Ref
Y OS Grid Ref
Pollutants Monitored
In AQMA?
Is monitoring collocated with a continuous analyser (Y/N)
Relevant Exposure?
(Y/N with distance (m) to relevant exposure)
Distance to kerb of nearest road
(m)
(N/A if not applicable)
Worst-case Location?
Lyndhurst
Lyndhurst Rd, Goose Green
1 Kerbside
429991
107583 NO2 N N N (4m) 0.4 Y
1, Foxlease Terrace, Shrubbs Hill Rd
2 Roadside
429928
107687 NO2 N N Y(1m) 1.5 Y
Shrubbs Hill Rd
3 Roadside
429934
107698 NO2 N N N* 2.2 Y
The Orchards, Shrubbs Hill Rd
4a Roadside
429895
107770 NO2 N N Y (1m) 3 Y
The Orchards, Shrubbs Hill Rd
4b Roadside
429895
107770 NO2 N N Y (1m) 5 Y
Shrubbs Hill Rd
5 Roadside
429758
107972
NO2 N N N (13m) 2 Y
Little Queens, Shrubbs Hill Rd
6 Roadside
429689
108111 NO2 N N Y (1m) 6 Y
Queens House
7 Roadside
429710
108128 NO2 N N N* 5 Y
School, High St.
8 Roadside
429767
108205 NO2 Y N Y (1m) 6 Y
15, High St.
9 Kerbside
429864
108213 NO2 Y N Y (1m) 1.25 Y
New Forest District Council
LAQM USA 2015 26
Site Name Site ID
Site Type
X OS Grid Ref
Y OS Grid Ref
Pollutants Monitored
In AQMA?
Is monitoring collocated with a continuous analyser (Y/N)
Relevant Exposure?
(Y/N with distance (m) to relevant exposure)
Distance to kerb of nearest road
(m)
(N/A if not applicable)
Worst-case Location?
Lyndhurst
14, High St. (analyser)
10 Kerbside
429858
108205 NO2 Y Y Y (1m) 0.9 Y
16, High St.
11 Kerbside
429875
108207 NO2 Y N Y (1m) 1.55 Y
2a, Romsey Rd
12 Roadside
429891
108245 NO2 Y N N (3m) 2 Y
22, Romsey Rd
13 Roadside
429911
108402 NO2 N N N* 2.3 Y
28, High St.
14 Roadside
429933
108200 NO2 Y N N (5m) 4 Y
65, High St.
15 Roadside
430026
108206 NO2 Y N Y (1m) 1.8 Y
2, Gosport Lane
16 Roadside
430079
108147 NO2 N N Y (1m) 2.2 Y
South View, Gosport Lane
17
Roadside
430092
108077 NO2 N N N (5m) 2 Y
Lyndhurst Park Hotel
18 Roadside
430162
108173 NO2 N N N (5m) 1.88 Y
Baytree Cottage, Bournem’th Rd
19 Roadside
429169
108129
NO2 N N N (1m) 2 N
New Forest District Council
LAQM USA 2015 27
Site Name
Site ID
Site Type
X OS Grid Ref
Y OS Grid Ref
Pollutants Monitored
In AQMA
?
Is monitoring collocated
with a continuous
analyser (Y/N
Relevant Exposure?
(Y/N with distance (m) to relevant exposure)
Distance to kerb of nearest road
(m) (N/A if not applicable)
Worst-case Location?
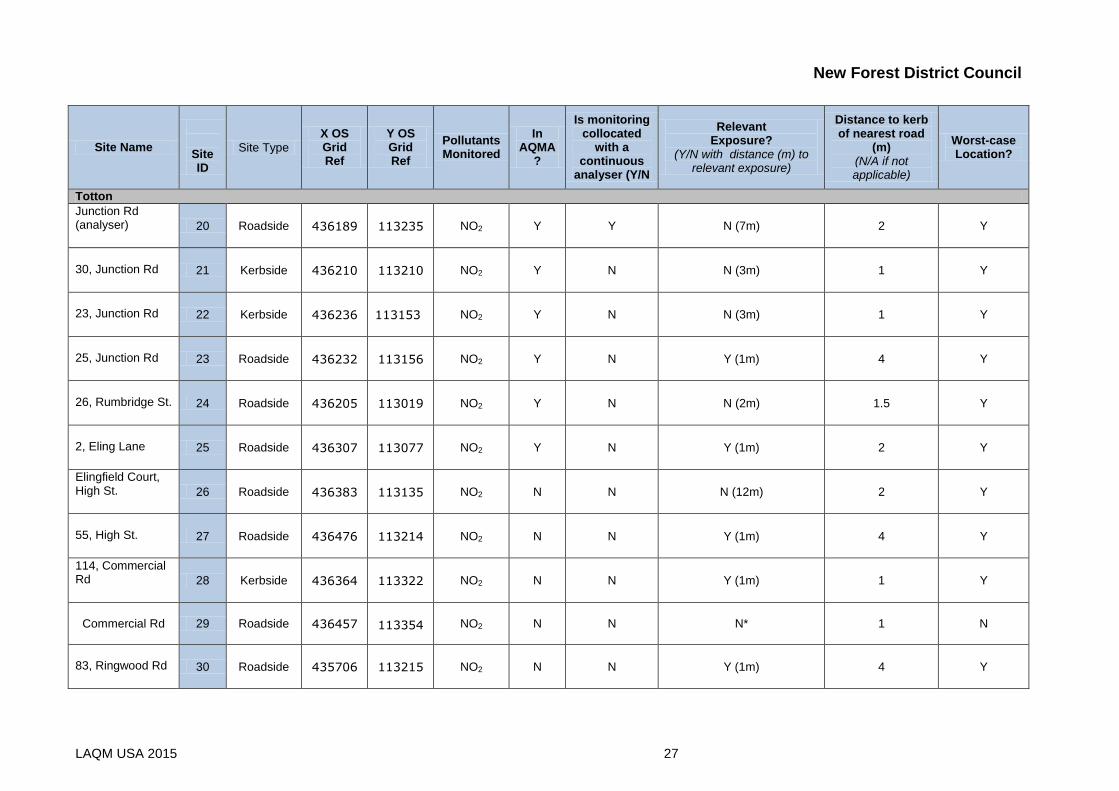
Totton
Junction Rd (analyser) 20 Roadside
436189
113235 NO2 Y Y N (7m) 2 Y
30, Junction Rd 21 Kerbside
436210
113210 NO2 Y N N (3m) 1 Y
23, Junction Rd 22 Kerbside
436236
113153 NO2 Y N N (3m) 1 Y
25, Junction Rd 23 Roadside
436232
113156 NO2 Y N Y (1m) 4 Y
26, Rumbridge St. 24 Roadside
436205
113019 NO2 Y N N (2m) 1.5 Y
2, Eling Lane 25 Roadside
436307
113077 NO2 Y N Y (1m) 2 Y
Elingfield Court, High St. 26 Roadside
436383
113135 NO2 N N N (12m) 2 Y
55, High St. 27 Roadside
436476
113214 NO2 N N Y (1m) 4 Y
114, Commercial Rd 28 Kerbside
436364
113322 NO2 N N Y (1m) 1 Y
Commercial Rd
29 Roadside 436457
113354 NO2 N N N* 1 N
83, Ringwood Rd 30 Roadside
435706
113215 NO2 N N Y (1m) 4 Y
New Forest District Council
LAQM USA 2015 28
Site Name
Site ID
Site Type
X OS Grid Ref
Y OS Grid Ref
Pollutants Monitored
In AQMA
?
Is monitoring collocated
with a continuous
analyser (Y/N)
Relevant Exposure?
(Y/N with distance (m) to relevant exposure)
Distance to kerb of nearest road
(m) (N/A if not applicable)
Worst-case Location?
Totton
Ringwood Rd / Maynard Rd roundab’t
31 Roadside
435834
113260 NO2 Y N N* 2 Y
Asda roundab’t 32 Roadside
435927
113226 NO2 Y N N* 2 Y
1, Rose Rd 33 Roadside
436374
112929 NO2 N N N (5m) 2 N
Other locations
A31, Stoney Cross 34 Roadside
425877
111778 NO2 N N Y (14m) 20 N
Rockbourne School 35 Rural
411569
118098 NO2 N N Y (1m) N/A N
11, Bilberry Drive, Marchwood 36 Industrial
438500
110629 NO2
N
N Y (5m) N/A N
Shorefield Rd, Marchwood 37 Industrial
438765
111006 NO2 N N Y (6m) N/A N
3 Magazine Lane, Marchwood (adj to)
38 Industrial
439075
111152 NO2 N Y Y (15m) N/A Y
9, Boardwalk Way, Marchwood 39 Industrial
439106
111409 NO2 N N Y (4m) N/A Y
Autumn Road, Marchwood 40 Industrial
439174
110367 NO2 N N Y (5m) N/A N
New Forest District Council
LAQM USA 2015 29
Note: 1. All diffusion tubes are located at a height between 2.5m and 3m 2. *indicates sites which have no local relevant exposure relating to the site, for example at places of work, hotels, isolated lamp-posts. These sites may
have been selected for planning or general air quality modelling purposes to obtain general air quality information
Site Name
Site ID
Site Type X OS Grid Ref
Y OS Grid Ref
Pollutants Monitored
In AQMA?
Is monitoring collocated
with a continuous
analyser (Y/N)
Relevant Exposure? (Y/N with
distance (m) to relevant exposure)
Distance to kerb of nearest road (m)
(N/A if not applicable)
Worst-case Location?
Other locations
Marchwood School, Twiggs Lane
41 Suburban
438363
109694 NO2 N N Y (1m) 25 N
Teachers Way, Holbury 42 Industrial
442947
103931 NO2 N N Y(1m) N/A Y
Jubilee Hall, The Square, Fawley 43 Industrial
445881
103247 NO2
Y (for
SO2) N Y(1m) N/A Y
School field, Beaulieu 44 Rural
438836
102115 NO2 N N Y (1m) N/A N
New Forest District Council
LAQM USA 2015 30
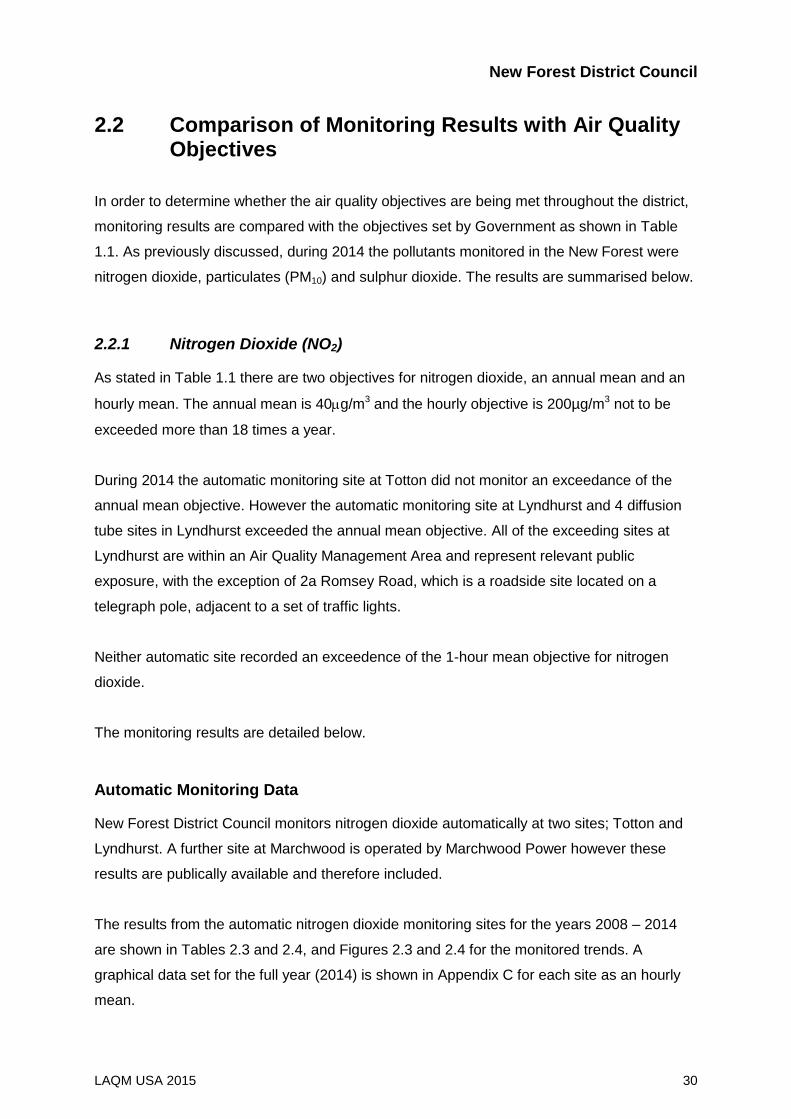
2.2 Comparison of Monitoring Results with Air Quality Objectives
In order to determine whether the air quality objectives are being met throughout the district,
monitoring results are compared with the objectives set by Government as shown in Table
1.1. As previously discussed, during 2014 the pollutants monitored in the New Forest were
nitrogen dioxide, particulates (PM10) and sulphur dioxide. The results are summarised below.
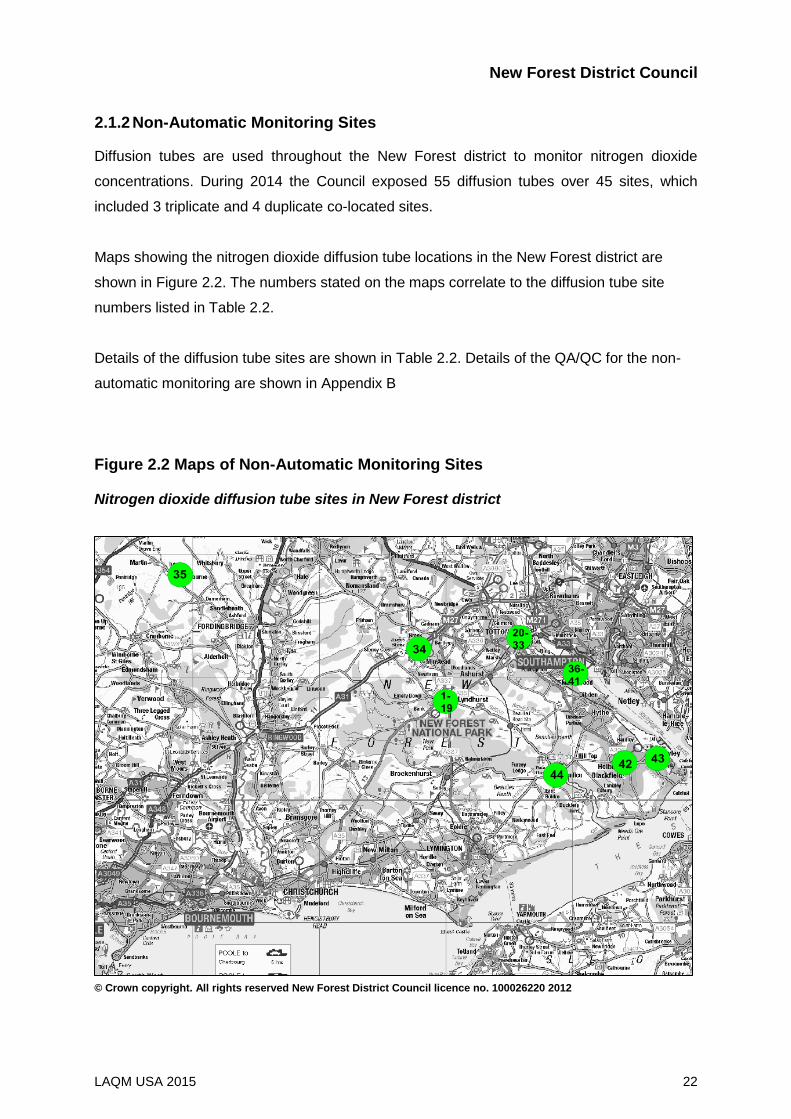
2.2.1 Nitrogen Dioxide (NO2)
As stated in Table 1.1 there are two objectives for nitrogen dioxide, an annual mean and an
hourly mean. The annual mean is 40g/m3 and the hourly objective is 200µg/m3 not to be
exceeded more than 18 times a year.
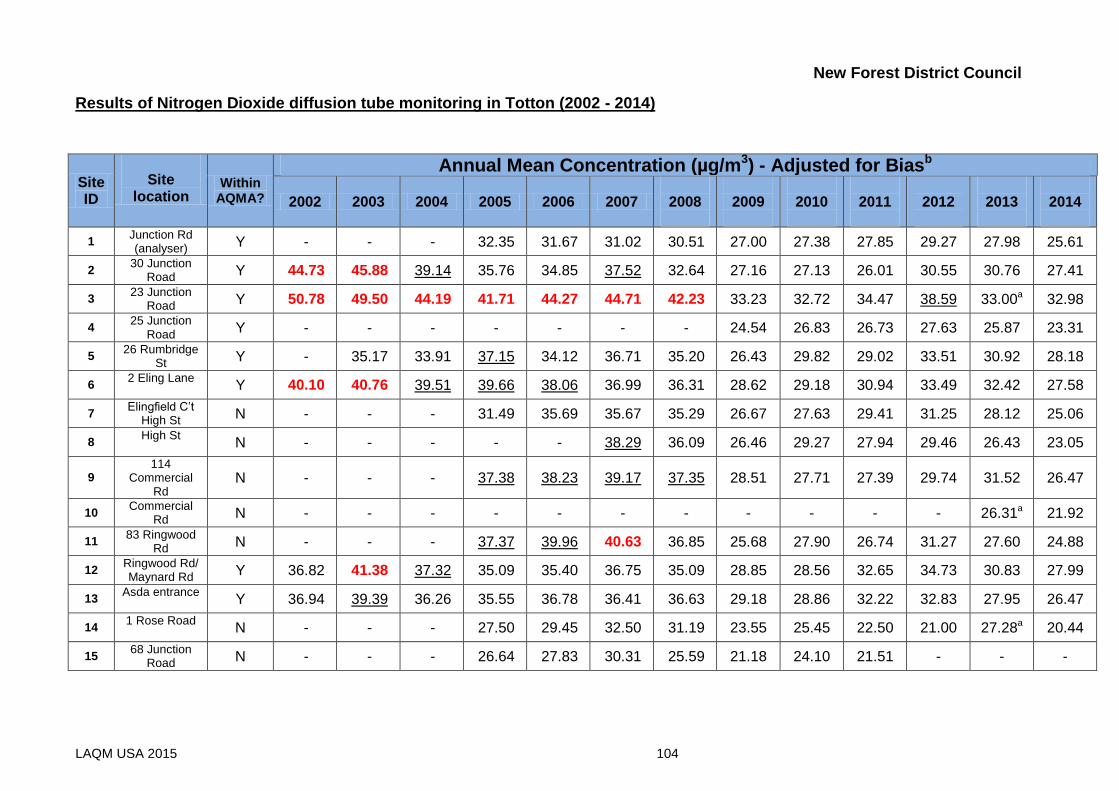
During 2014 the automatic monitoring site at Totton did not monitor an exceedance of the
annual mean objective. However the automatic monitoring site at Lyndhurst and 4 diffusion
tube sites in Lyndhurst exceeded the annual mean objective. All of the exceeding sites at
Lyndhurst are within an Air Quality Management Area and represent relevant public
exposure, with the exception of 2a Romsey Road, which is a roadside site located on a
telegraph pole, adjacent to a set of traffic lights.
Neither automatic site recorded an exceedence of the 1-hour mean objective for nitrogen
dioxide.
The monitoring results are detailed below.
Automatic Monitoring Data
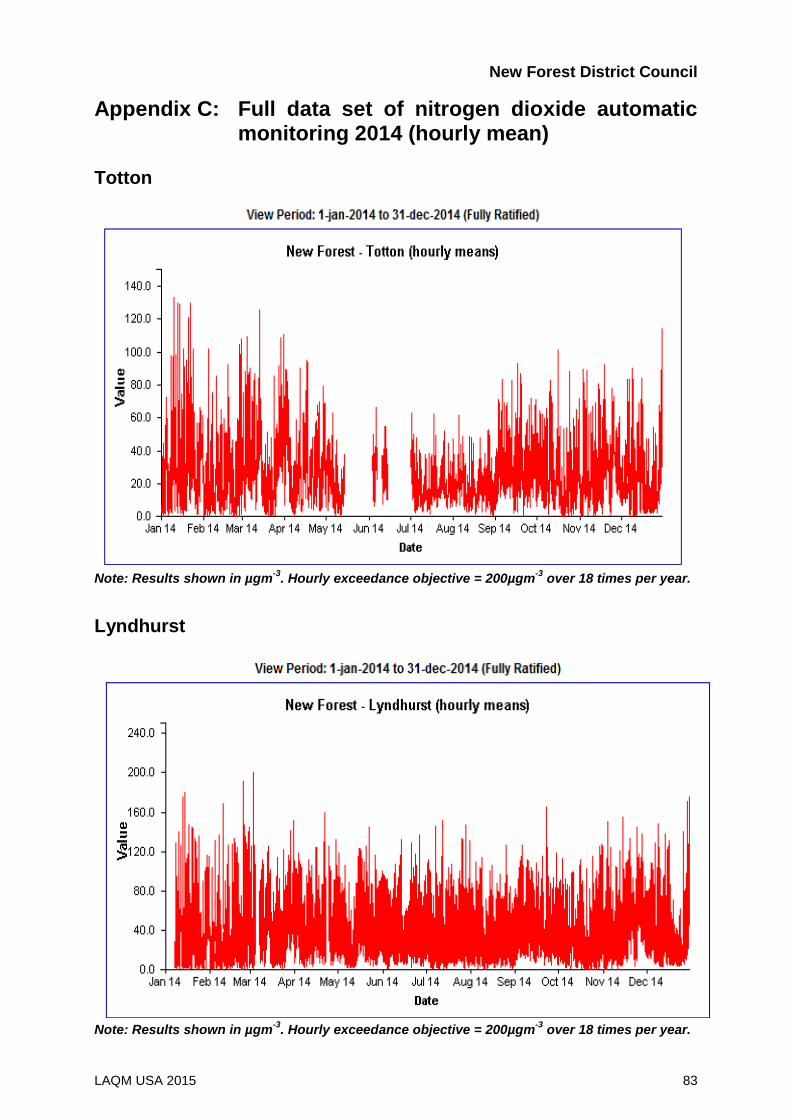
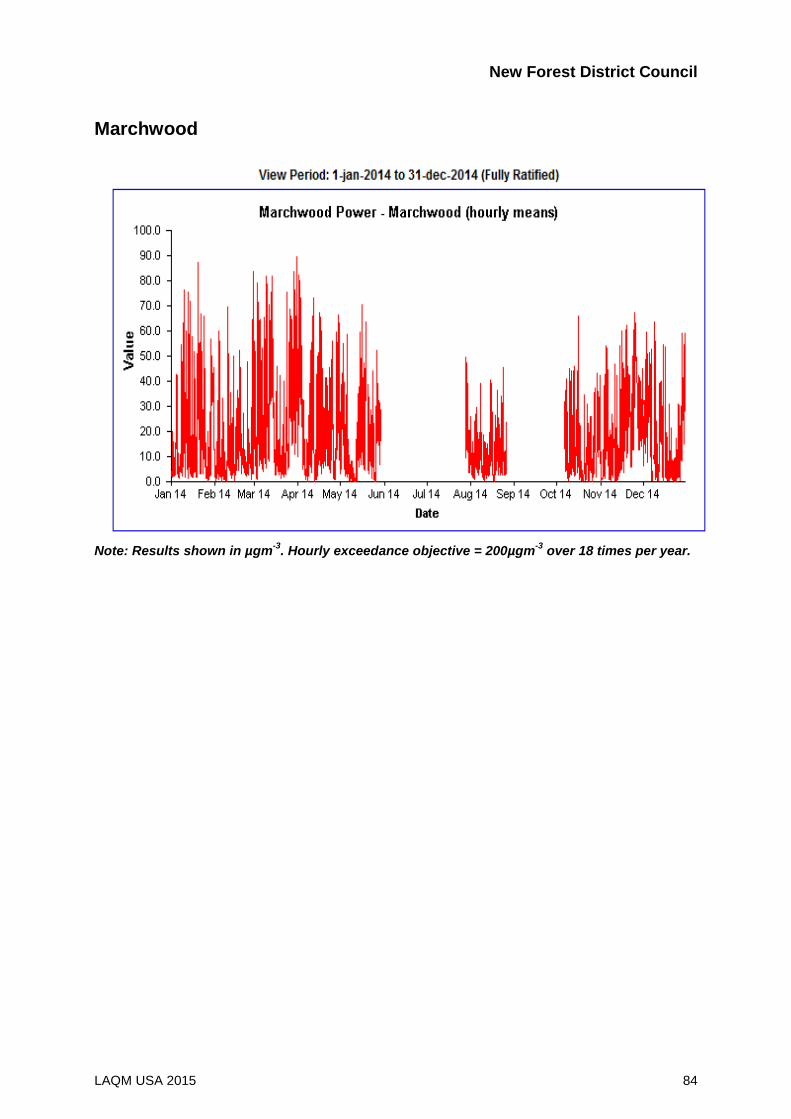
New Forest District Council monitors nitrogen dioxide automatically at two sites; Totton and
Lyndhurst. A further site at Marchwood is operated by Marchwood Power however these
results are publically available and therefore included.
The results from the automatic nitrogen dioxide monitoring sites for the years 2008 – 2014
are shown in Tables 2.3 and 2.4, and Figures 2.3 and 2.4 for the monitored trends. A
graphical data set for the full year (2014) is shown in Appendix C for each site as an hourly
mean.
New Forest District Council
LAQM USA 2015 31
Table 2.3 Results of Automatic Monitoring of Nitrogen Dioxide: Comparison with Annual Mean Objective
a i.e. data capture for the full calendar year (e.g. if monitoring was carried out for six months the maximum data capture for the full calendar year would be 50%)
2. b means should be “annualised” as in Box 3.2 of TG(09) (http://laqm.defra.gov.uk/technical-guidance/index.html?d=page=38), if valid data capture is less than 75% result in brackets (as
shown in Appendix D) 3. * data capture in 2014 less than 90% therefore results should be viewed with caution and used as guidance only
Figure 2.3 Trends in Annual Mean Nitrogen Dioxide Concentrations measured at Automatic Monitoring sites
1. a i.e. data capture for the full calendar year (e.g. if monitoring was carried out for six months the maximum data capture for the full calendar year would be 50%)
2. b If the data capture for full calendar year is less than 90%, include the 99.8
th percentile of hourly means in brackets
Figure 2.4 Trends in Hourly Mean Objective for NO2 measured at Automatic Monitoring sites
0
2
4
6
8
10
12
14
16
18
20
2005 2006 2007 2008 2009 2010 2011 2012 2013 2014
no
. of
exc
ee
dan
ces
> 2
00
µgm
-3
as a
n h
ou
rly
ave
rage
Year
Totton
Lyndhurst
Marchwood
Objective
New Forest District Council
LAQM USA 2015 33
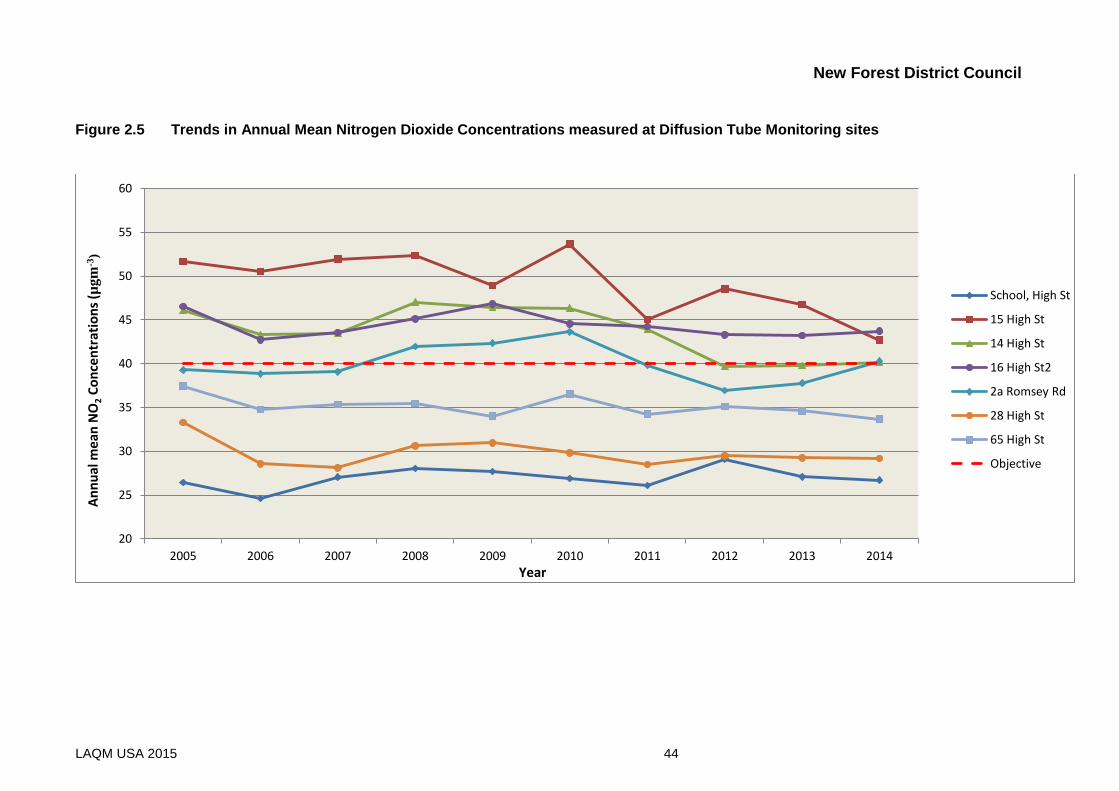
The monitoring results from the automatic sites are reported as a whole number, and in 2014
show consistent results compared to the results from 2013. It is noted that Lyndhurst is
reporting an exceedance of the annual mean objective for nitrogen dioxide, although the
actual result for 2014 is reported as 40.5µg/m3 a slight decrease from the actual 2013 annual
mean nitrogen dioxide result of 40.6µg/m3 (the 2012 result was 40.4 µg/m3).
It is noted that the trend data for the automatic monitoring site at Lyndhurst shows an overall
decrease in nitrogen dioxide concentrations. In 2011 following 3 years (2008-2010) of a
consistent exceedance of 46µg/m3, a decrease in the nitrogen dioxide annual mean was
monitored at 43µg/m3 with a further decrease monitored in 2012 of 3µg/m3 to an annual
mean concentration of 40µg/m3, followed by a reported 1µg/m3 increase in 2013 and 2014.
However as noted above the actual difference in monitored results between 2012 and 2014
is 0.2µg/m3 (40.4µg/m3 2012 – 40.6µg/m3 2014).
It is noted that the automatic monitoring sites at Totton and Marchwood monitored
concentrations well below the annual mean and hourly mean objectives for nitrogen dioxide,
with neither site monitoring any significant variations in concentrations over recent years.
Overall both sites have monitored a general decrease in the annual mean concentration for
nitrogen dioxide.
Lyndhurst and Totton sites are within current Air Quality Management Areas, and the
Lyndhurst site represents relevant public exposure. It should be noted that the declaration of
the Air Quality Management Area for Totton was based on diffusion tube data (2004 and
2005) and not the data collated from the automatic monitoring site.
Neither Lyndhurst, Totton nor Marchwood monitored an exceedence of the hourly objective
for nitrogen dioxide (18 exceedances greater than 200µg/m3 over the year). There has been
1 exceedance greater than 200µg/m3 over an hourly average at Lyndhurst and 0
exceedances at Totton and Marchwood during 2014.
New Forest District Council
LAQM USA 2015 34
Diffusion Tube Monitoring Data
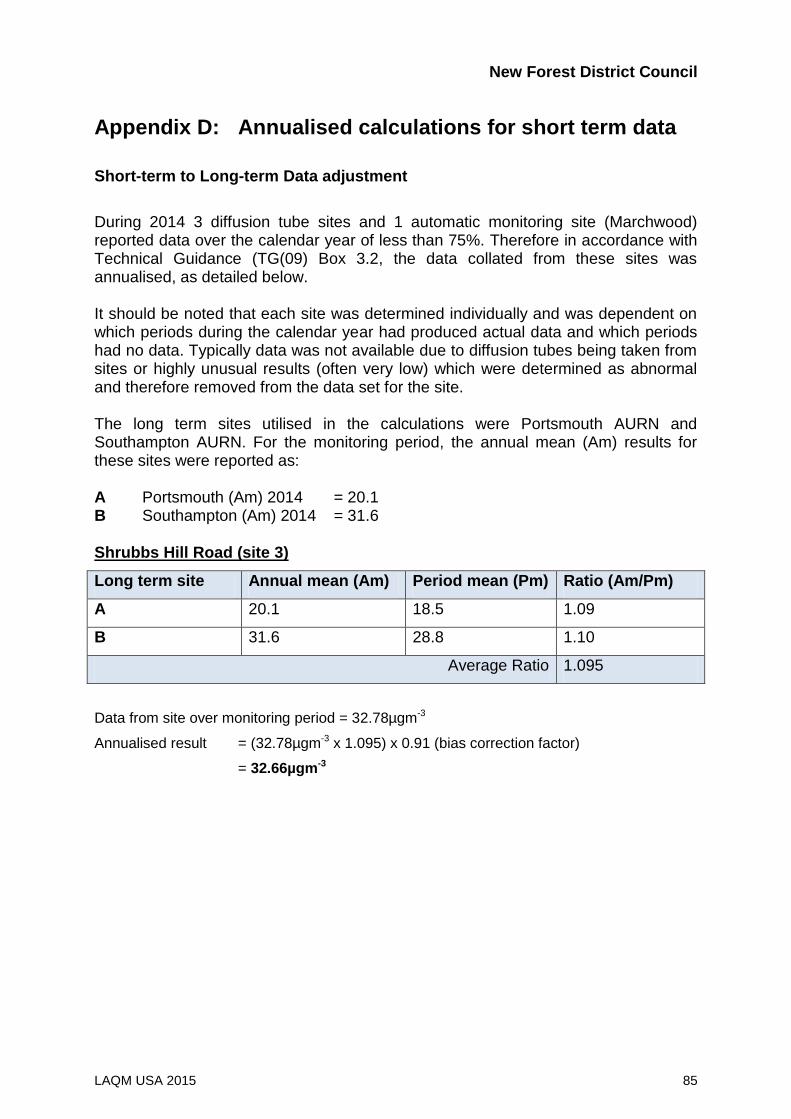
The results from the nitrogen dioxide diffusion tube monitoring sites for 2014 are shown in
Table 2.5, while Table 2.6 shows the results from 2008 - 2014. Figure 2.5 show the trends
from the diffusion tubes for sites in Lyndhurst which have often shown exceedances of the
annual mean objective for nitrogen dioxide.
Calculations regarding the annualisation of data are provided in Appendix D, adjustment for
relevant exposure in Appendix E and the data set for the full year (2014) is given in Appendix
F for each diffusion tube site.
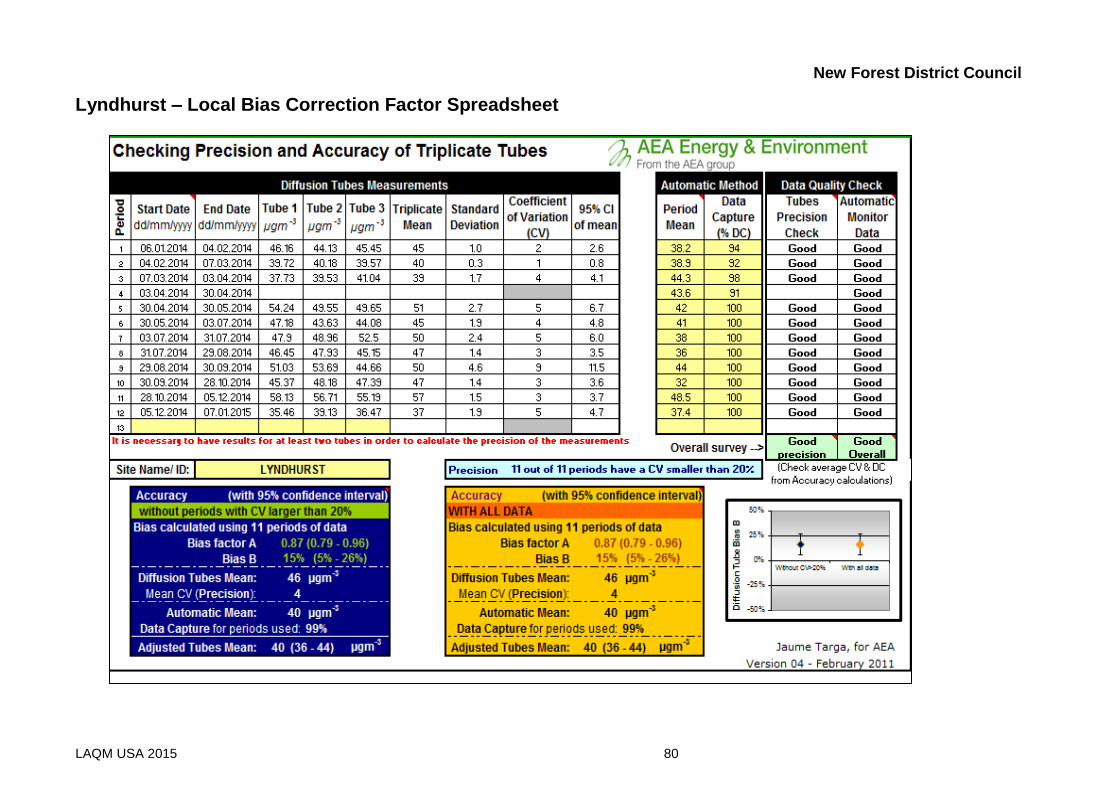
The tables report the annual mean results which have been bias adjusted using either locally
or nationally derived factors. Details of the use and selection of bias correction factors are
given in Appendix B.
New Forest District Council
LAQM USA 2015 35
Table 2.5 Results of Nitrogen Dioxide Diffusion Tubes (2014)
Site ID Location Site Type
Within AQMA?
Triplicate (T) or Co-located
(C) Tube
Full Calendar Year Data Capture 2014
(%) a
Confirm if data has been distance
corrected (Y/N)
2014 Annual Mean Concentration (µg/m3)
(Bias Adjusted) b
Lyndhurst
1
Lyndhurst Rd, Goose Green
Kerbside N - 83 N 28.96
2
1, Foxlease Tr, Shrubbs Hill Rd
Roadside N - 83 N 32.73
3
Shrubbs Hill Rd
Roadside N - 59 N 32.66a
4a
The Orchards, Shrubbs Hill Rd
Roadside N - 100 N 39.83
4b
The Orchards, Shrubbs Hill Rd
Roadside N - 83 N 32.92
5
Shrubbs Hill Rd
Roadside N - 67 N 29.06a
6
Little Queens, Shrubbs Hill Rd
Roadside N - 92 N 20.84
7
Queens House
Roadside N - 92 N 20.78
8
School, High St.
Roadside Y - 100 N 26.70
9
15, High St.
Kerbside Y - 92 N 42.70*
10
14, High St. (analyser)
Kerbside Y T 92 N 40.12*
New Forest District Council
LAQM USA 2015 36
Site ID Location Site Type
Within AQMA?
Triplicate (T) or Co-located
(C) Tube
Full Calendar Year Data Capture 2014
(%) a
Confirm if data has been distance
corrected (Y/N)
2014 Annual Mean Concentration (µg/m3)
(Bias Adjusted) b
11
16, High St.
Kerbside Y - 92 N 43.73*
12
2a, Romsey Rd
Roadside Y - 75 N 40.30*
13
22, Romsey Rd
Roadside N - 92 N 29.17
14
28, High St.
Roadside Y C 92 N 29.19
15
65, High St.
Roadside Y - 100 N 33.66*
16
2, Gosport Lane
Roadside N - 92 N 37.65
17 South View, Gosport Lane
Roadside N - 67 Y 26.20a,c
18
Lyndhurst Park Hotel
Roadside N - 100 N 25.77
19 Bournem’th Rd Roadside N - 83 N 29.17
Totton
20 Junction Rd (analyser) Roadside Y T 92 N 25.61
21 30, Junction Rd
Kerbside Y - 100 N 27.41
22 23, Junction Rd
Kerbside Y - 92 N 32.98
New Forest District Council
LAQM USA 2015 37
Site ID Location Site Type
Within AQMA?
Triplicate (T) or Co-located
(C) Tube
Full Calendar Year Data Capture 2014
(%) a
Confirm if data has been distance
corrected (Y/N)
2014 Annual Mean Concentration (µg/m3)
(Bias Adjusted) b
23 25, Junction Rd
Roadside Y - 100 N 23.31
24 26, Rumbridge St. Roadside Y - 100 N 28.18
25 2, Eling Lane Roadside Y - 92 N 27.58
26 Elingfield Court, High St. Roadside N - 83 N 25.06
27 55, High St. Roadside N - 83 N 23.05
28 114, Commercial Rd
Kerbside N - 92 N 26.47
29 Commercial Road Roadside N - 75 N 21.92
30 83 Ringwood Rd Roadside N - 92 N 24.88
31 Maynard Rd roundab’t Roadside Y - 92 N 27.99
32 Asda roundab’t Roadside Y - 92 N 26.47
33 1, Rose Rd Roadside N - 100 N 20.44
Other sites
34 A31, Stoney Cross Roadside N C 100 N 31.42
New Forest District Council
LAQM USA 2015 38
Site ID Location Site Type
Within AQMA?
Triplicate (T) or Co-located
(C) Tube
Full Calendar Year Data Capture 2014
(%) a
Confirm if data has been distance
corrected (Y/N)
2014 Annual Mean Concentration (µg/m3)
(Bias Adjusted) b
35 Rockbourne School Rural N - 100 N 8.02
36 11, Bilberry Drive, Marchw’d
Industrial N - 100 N 15.52
37 Shorefield Rd, Marchwood Industrial N - 100 N 20.24
38 3 Magazine Lane, Marchw’d
Industrial N T 100 N 17.84
39 9, Boardwalk Way, Marchw’d
Industrial N - 100 N 19.29
40 Autumn Road, Marchwood Industrial N - 100 N 17.35
41 School, Twiggs Lane Suburban N - 100 N 19.14
42 Teachers Way, Holbury Industrial N C 100 N 11.32
43 Jubilee Hall, The Square, Fawley
Industrial N - 100 N 14.40
44 School field, Beaulieu Rural N - 83 N 10.22
Notes: 1. Results in red and bold = exceedence of the NO2 annual mean AQS objective of 40µg/m3
2. Results underlined are close to the NO2 annual mean objective
3. Results in red, bold and underlined = annual mean > 60µg/m
3, indicating a potential exceedence of the NO2 hourly mean air quality objective
4. *denotes sites in Lyndhurst which were locally bias adjusted due to locations (including analyser) being within a street canyon
New Forest District Council
LAQM USA 2015 39
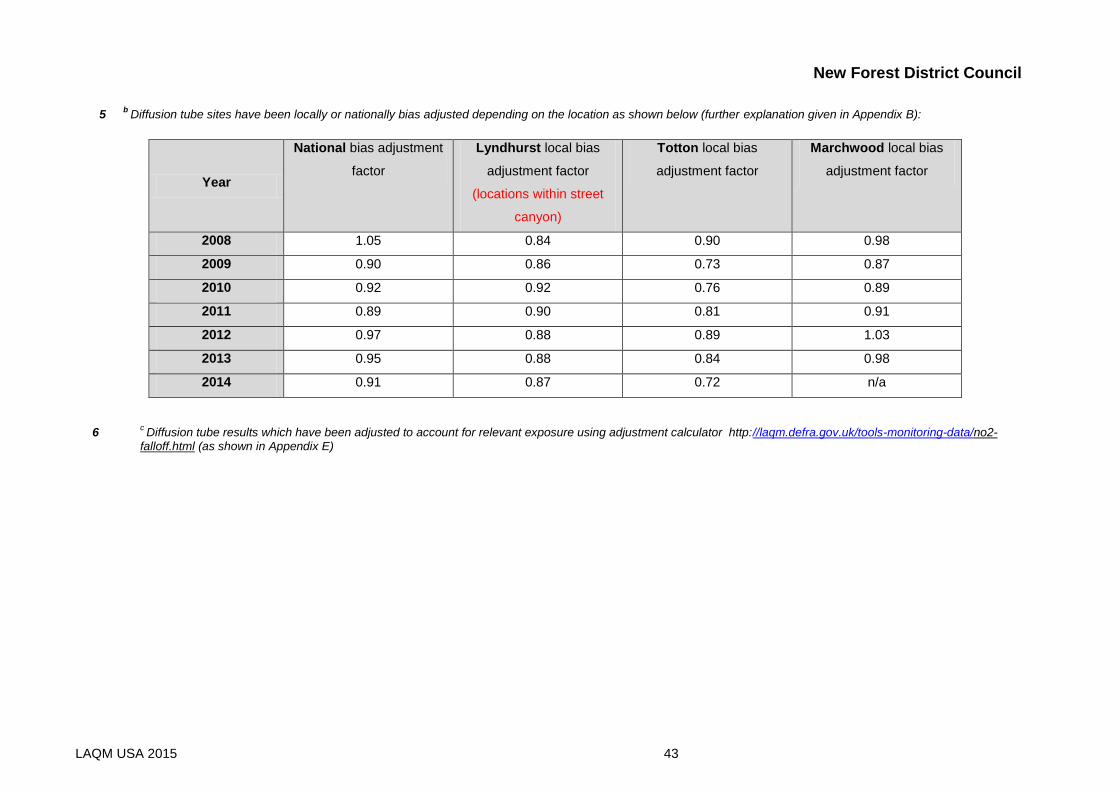
5.
a Means results should be “annualised” as in Box 3.2 of TG(09) if full calendar year data capture is less than 75% (as shown in Appendix D)
6.
b Diffusion tube sites have been locally or nationally bias adjusted depending on the location as shown below
(further explanation given in Appendix B):
Year
Lyndhurst local bias adjustment factor (street canyon)
Totton local bias adjustment factor
National bias adjustment factor
2014 0.87 0.72 0.91
7.
c Diffusion tube results which have been adjusted to account for relevant exposure using adjustment calculator http://laqm.defra.gov.uk/tools-monitoring-data/no2-
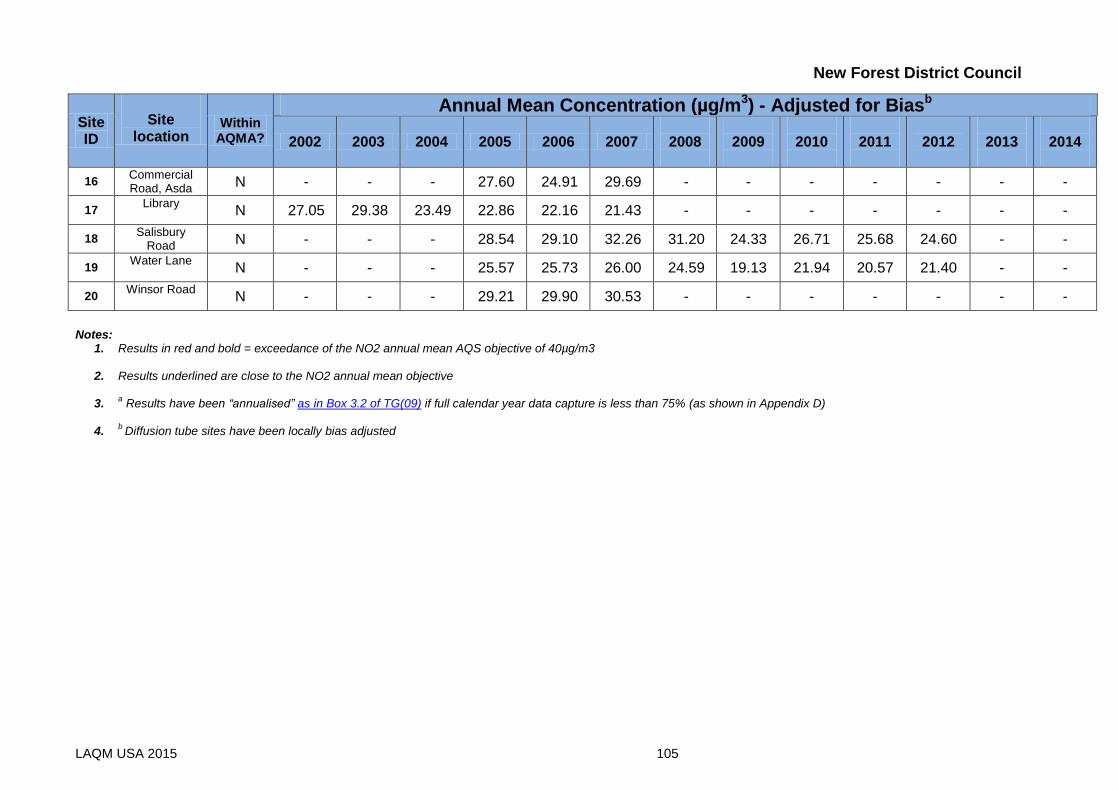
Annual Mean Concentration (µg/m3) - Adjusted for Biasb 2008
Bias Adjusted (see note)
2009 Bias Adjusted
(see note)
2010 Bias Adjusted
(see note)
2011 Bias Adjusted
(see note)
2012 Bias Adjusted
(see note)
2013 Bias Adjusted
(see note)
2014 Bias Adjusted
(see note) Lyndhurst
1
Kerbside N 23.97 22.56 24.83 25.59 27.78 28.62 28.96
2
Roadside N 31.56 32.79 33.07 30.93 33.05 34.24 32.73
3
Roadside N 33.78 35.26 33.80 28.49 30.53 28.75 32.66a
4a
Roadside N 38.92 40.33 42.62 37.92 43.58 44.73 39.83
4b
Roadside N - - - - - 32.98 32.92
5
Roadside N 32.95 34.21 34.29 32.47 33.01 32.13 29.06a
6
Roadside N 19.63 22.56 23.26 21.38 21.76 20.76 20.84
7
Roadside N 21.52 22.98 23.76 20.88 21.88 20.74a 20.78
8
Roadside Y 28.05 27.67 26.90 26.10 29.12 27.08 26.70
9
Kerbside Y 52.34* 48.92* 53.67* 45.03* 48.55* 46.77* 42.70*
10
Kerbside Y 47.02* 46.42* 46.36* 43.89* 39.67* 39.80* 40.12*
11
Kerbside Y 45.12* 46.83* 44.55* 44.23* 43.30* 43.21* 43.73*
12
Roadside Y 41.96* 42.34* 43.63* 39.83* 36.94* 37.79* 40.30*
13
Roadside N 28.09 29.06 25.98 27.64 29.51 29.55 29.17
14
Roadside Y 30.62 30.95 29.83 28.47 29.46 29.24 29.19
15
Roadside Y 35.46* 34.00* 36.54* 34.26* 35.13* 34.63* 33.66*
New Forest District Council
LAQM USA 2015 41
Site ID
Site Type
Within AQMA?
Annual Mean Concentration (µg/m3) - Adjusted for Biasb 2008
Bias Adjusted (see note)
2009 Bias Adjusted
(see note)
2010 Bias Adjusted
(see note)
2011 Bias Adjusted
(see note)
2012 Bias Adjusted
(see note)
2013 Bias Adjusted
(see note)
2014 Bias Adjusted
(see note)
16 Roadside N 36.46 42.12 39.14 43.81 39.58 37.48 37.65
17
Roadside N - - - 29.49 33.64 36.50c 26.20a,c
18
Roadside N - 25.00 27.20 25.30 28.11 25.89 25.77
19
Roadside N 27.46 29.41 31.33 27.98 30.49 28.78 29.17
Totton
20 Roadside Y 30.51 27.00 27.38 27.85 29.27 27.98 25.61
21 Kerbside Y 32.64 27.16 27.13 26.01 30.55 30.76 27.41
22 Kerbside Y 42.23 33.23 32.72 34.47 38.59 33.00a 32.98
23 Roadside Y - 24.54 26.83 26.73 27.63 25.87 23.31
24 Roadside Y 35.20 26.43 29.82 29.02 33.51 30.92 28.18
25 Roadside Y 36.31 28.62 29.18 30.94 33.49 32.42 27.58
26 Roadside N 35.29 26.67 27.63 29.41 31.25 28.12 25.06
27 Roadside N - 26.46 29.27 27.94 29.46 26.43 23.05
28 Kerbside N 37.35 28.51 27.71 27.39 29.74 31.52 26.47
29 Roadside N - - - - - 26.31a 21.92
30 Roadside N 36.85 25.68 27.90 26.74 31.27 27.60 24.88
31 Roadside Y 35.09 28.85 28.56 32.65 34.73 30.83 27.99
32 Roadside Y 36.63 29.18 28.86 32.22 32.83 27.95 26.47
New Forest District Council
LAQM USA 2015 42
Site ID
Site Type
Within AQMA?
Annual Mean Concentration (µg/m3) - Adjusted for Biasb 2008
Bias Adjusted (see note)
2009 Bias Adjusted
(see note)
2010 Bias Adjusted
(see note)
2011 Bias Adjusted
(see note)
2012 Bias Adjusted
(see note)
2013 Bias Adjusted
(see note)
2014 Bias Adjusted
(see note)
33 Roadside N 31.19 23.55 25.45 22.50 21.00 27.28a 20.44
Other sites
34 Roadside N 42.82 33.62 33.97 34.71 36.24 33.78 31.42
35 Rural N 9.51 8.41 10.55 8.15 9.08 10.67 8.02
36 Industrial N 19.10 15.92 17.99 15.09 16.74 16.31 15.52
37 Industrial N 26.12 21.60 25.41 19.38 22.15 22.83 20.24
38 Industrial N 22.84 17.46 20.92 16.58 20.72 20.52 17.84
39 Industrial N 24.46 17.71 22.75 17.66 21.28 20.86 19.29
40 Industrial N 20.96 18.33 19.43 18.07 19.85 21.10 17.35
41 Suburban N 23.21 20.71 20.95 18.81 21.38 20.64 19.14
42 Industrial N 15.99 12.68 14.96 12.31 13.31 14.18 11.32
43 Industrial N 20.45 16.68 17.71 15.50 16.42 16.45 14.40
44 Rural N 11.81 9.58 12.88 12.01 12.24 11.85 10.22
Notes:
1 * denotes sites in Lyndhurst which were locally bias adjusted due to locations (including analyser) being within a street canyon
2 In red and bold, exceedence of the NO2 annual mean AQS objective of 40µg/m3
3 Results underlined are close to the NO2 annual mean objective
4 a Means should be “annualised” as in Box 3.2 of TG(09) (http://laqm.defra.gov.uk/technical-guidance/index.html?d=page=38), if full calendar year data capture is less
b Diffusion tube sites have been locally or nationally bias adjusted depending on the location as shown below (further explanation given in Appendix B):
Year
National bias adjustment
factor
Lyndhurst local bias
adjustment factor
(locations within street
canyon)
Totton local bias
adjustment factor
Marchwood local bias
adjustment factor
2008 1.05 0.84 0.90 0.98
2009 0.90 0.86 0.73 0.87
2010 0.92 0.92 0.76 0.89
2011 0.89 0.90 0.81 0.91
2012 0.97 0.88 0.89 1.03
2013 0.95 0.88 0.84 0.98
2014 0.91 0.87 0.72 n/a
6 c Diffusion tube results which have been adjusted to account for relevant exposure using adjustment calculator http://laqm.defra.gov.uk/tools-monitoring-data/no2-
CM5 Marchwood Industrial N 88 Y 40 25 24 30 28 20 20 19 Note:
1. a i.e. data capture for the full calendar year (e.g. if monitoring was carried out for six months the maximum data capture for the full calendar year would be 50%).
2. All PM10 data has been adjusted to gravimetric equivalent using the volatile correction method (VCM) as described in Appendix B.
Figure 2.6 Trends in Annual Mean PM10 Concentrations
10
15
20
25
30
35
40
45
2005 2006 2007 2008 2009 2010 2011 2012 2013 2014
An
nu
al M
ean
PM
10
Co
nce
ntr
atio
n
(µgm
-3)
Year
Holbury
Totton
Marchwood
Objective
New Forest District Council
LAQM USA 2015 48
Table 2.8 Results of Automatic Monitoring for PM10: Comparison with 24-hour mean Objective
CM5 Marchwood Industrial N 88 Y 35 19 7 (38) 13 23 8 1(38) 6(33) Notes:
1. a i.e. data capture for the full calendar year (e.g. if monitoring was carried out for six months the maximum data capture for the full calendar year would be 50%)
2. b if data capture for full calendar year is less than 90%, include the 90.4
th percentile of 24-hour means in brackets
3. All PM10 data has been adjusted to gravimetric equivalent using the volatile correction method (VCM) as described in Appendix B.
Figure 2.7 Trends in PM10 24hr Mean Objective
0
5
10
15
20
25
30
35
40
2005 2006 2007 2008 2009 2010 2011 2012 2013 2014
No
. of
exc
ee
dan
ces
>50
µgm
-3 o
ver
24
hrs
Me
an
Year
Totton
Holbury
Marchwood
Objective
New Forest District Council
LAQM USA 2015 49
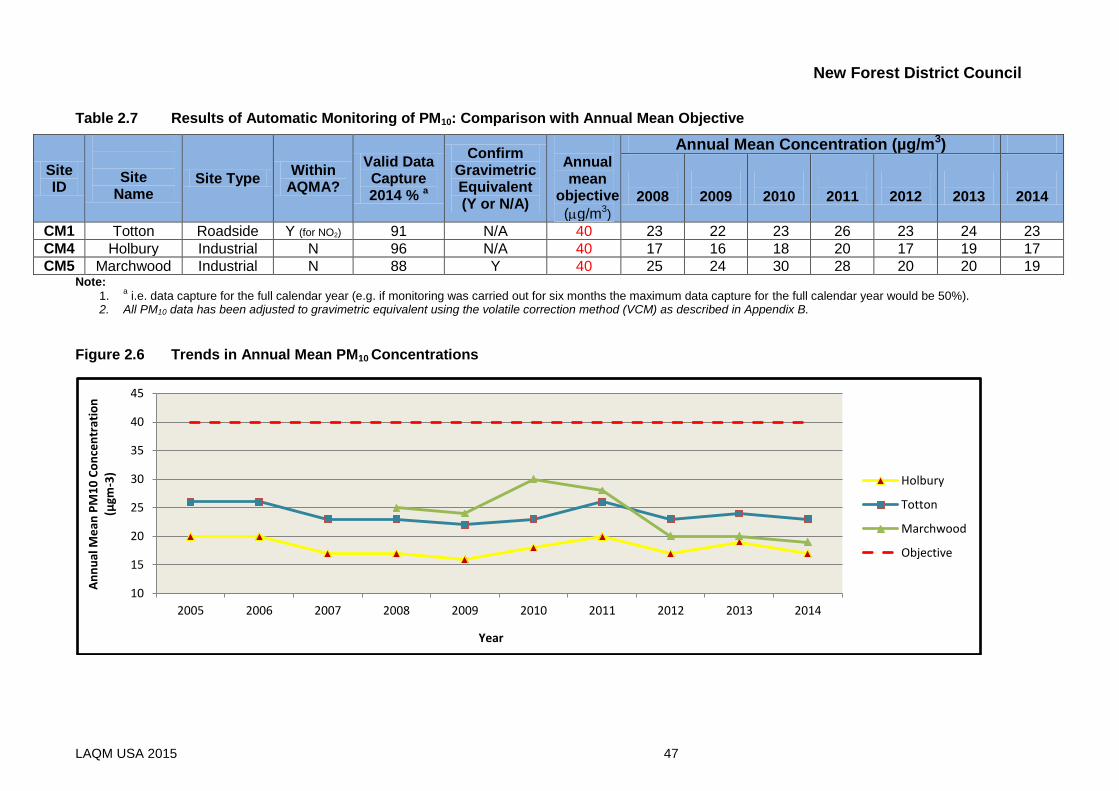
None of the automatic monitoring sites exceeded the objectives set for PM10 during 2014.
The monitoring site at Holbury represents relevant public exposure, and whilst the sites at
Totton and Marchwood are close to residential housing they do not represent relevant public
exposure.
The automatic monitoring results show the PM10 concentrations at Totton, Holbury and
Marchwood are well below the annual and daily mean objectives during 2014, and over the
period 2005-2014. Overall there has been a slight decrease in monitored concentrations over
the period 2005 – 2014 for both PM10 objectives at all the monitoring sites, although it is
noted that there is a greater degree of variation over time in the daily concentrations at the
automatic monitoring sites compared to the annual mean concentrations.
New Forest District Council
LAQM USA 2015 50
2.2.3 Sulphur Dioxide
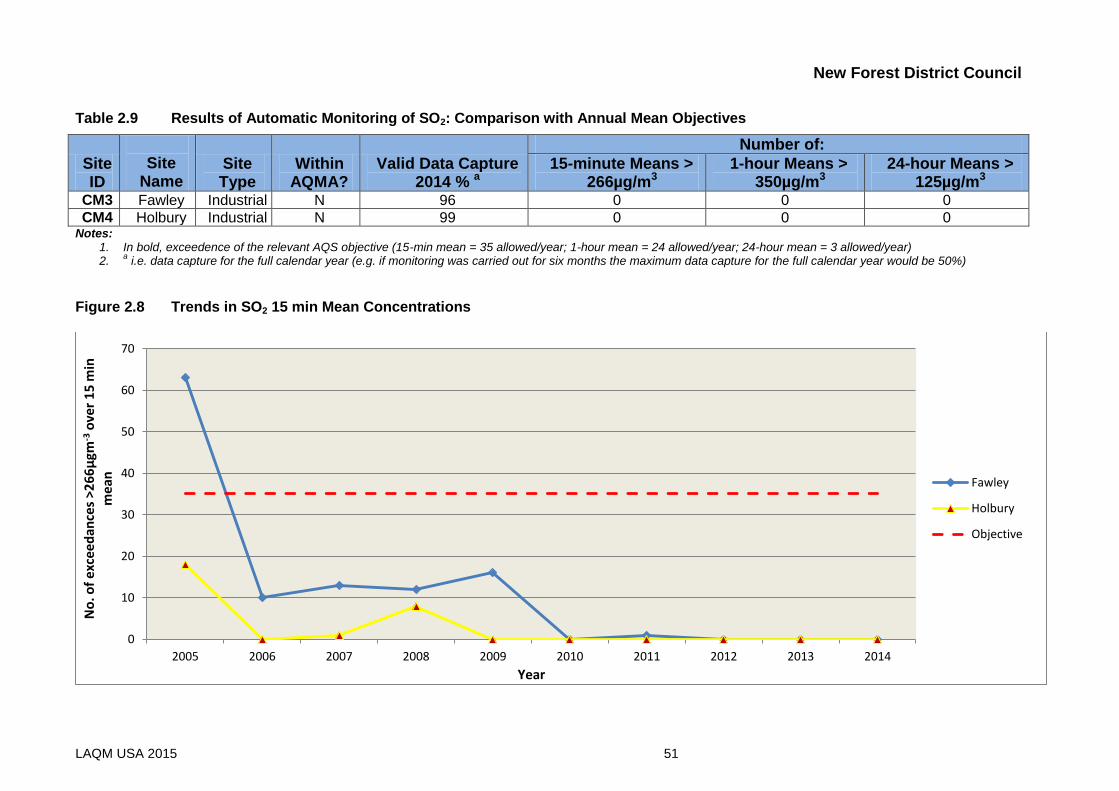
New Forest District Council monitored sulphur dioxide automatically at two sites during 2014;
Holbury and Fawley.
As stated in Table 1.1 there are three objectives for sulphur dioxide, a 24-hour mean, an
hourly mean and a 15-minute mean. The 24-hour objective is set at 125g/m3 not to be
exceeded more than 3 times in a year, the hourly objective is set at 350µg/m3 not to be
exceeded more than 24-times a year and the 15-minute objective is set at 266g/m3 not to
be exceeded more than 35 times in a year.
The results from the two automatic monitoring sites for 2014 against the 3 sulphur dioxide
objectives are shown in Table 2.9. Figure 2.8 shows the trends in the 15-min mean objective
for sulphur dioxide between 2005 and 2014.
There were no exceedences of the sulphur dioxide objectives at the monitoring sites during
2014.
Details of the QA/QC for the automatic monitoring are shown in Appendix B.
New Forest District Council
LAQM USA 2015 51
Table 2.9 Results of Automatic Monitoring of SO2: Comparison with Annual Mean Objectives
Site ID
Site
Name Site Type
Within AQMA?
Valid Data Capture 2014 % a
Number of:
15-minute Means > 266µg/m3
1-hour Means > 350µg/m3
24-hour Means > 125µg/m3
CM3 Fawley Industrial N 96 0 0 0
CM4 Holbury Industrial N 99 0 0 0 Notes:
1. In bold, exceedence of the relevant AQS objective (15-min mean = 35 allowed/year; 1-hour mean = 24 allowed/year; 24-hour mean = 3 allowed/year) 2.
a i.e. data capture for the full calendar year (e.g. if monitoring was carried out for six months the maximum data capture for the full calendar year would be 50%)
Figure 2.8 Trends in SO2 15 min Mean Concentrations
0
10
20
30
40
50
60
70
2005 2006 2007 2008 2009 2010 2011 2012 2013 2014
No
. of
exc
eed
ance
s >2
66
µgm
-3 o
ver
15
min
m
ean
Year
Fawley
Holbury
Objective
New Forest District Council
LAQM USA 2015 52
None of the monitoring sites exceeded the objectives set for sulphur dioxide during 2014.
Both monitoring sites represent relevant public exposure.
The trend data clearly shows the exceedance of the 15minute mean objective for sulphur
dioxide at Fawley in 2005 which resulted in the declaration of the Air Quality Management
Area. However the graph also shows how the number of exceedances of the 15 minute
mean objective has significantly decreased since 2005, with all subsequent results being well
below the objective of 35 exceedances per year.
There are no trend graphs presented for the 1-hour and 24-hour sulphur dioxide objectives.
The monitoring results for Fawley and Holbury recorded zero for each objective since the
sites became operational in 2005, with one exception at Fawley in 2005 when 4
exceedances of the hourly objective were monitored. The hourly objective is set at 350µg/m3,
not to be exceeded more than 24 times a year therefore this objective was not exceeded in
2005.
New Forest District Council
LAQM USA 2015 53
2.2.4 Benzene
New Forest District Council has not monitored for benzene within its district during 2014.
2.2.5 Other pollutants monitored
New Forest District Council has not monitored for any other pollutants within its district during
2014.
2.2.6 Summary of Compliance with AQS Objectives
New Forest District Council has examined the results from monitoring in the district.
Concentrations outside of the AQMA’s are all below the objectives at relevant
locations, therefore there is no need to proceed to a Detailed Assessment.
New Forest District Council
LAQM USA 2015 54
3 Road Traffic Sources
3.1 Narrow Congested Streets with Residential Properties Close to the Kerb
The criteria for assessing narrow congested streets are set out in Box 5.3 of Government
guidance (Defra, 2009). Narrow congested streets with residential properties close to the kerb
were considered in previous Updating and Screening Assessments and no new narrow
congested streets have been identified.
New Forest District Council confirms that there are no new/newly identified congested streets
with a flow above 5,000 vehicles per day and residential properties close to the kerb, that
have not been adequately considered in previous rounds of Review and Assessment.
3.2 Busy Streets Where People May Spend 1-hour or More Close to Traffic
The criteria for assessing busy streets are set out in Box 5.3 of Government guidance (Defra,
2009). Busy streets where people may spend 1 hour or more close to traffic were considered
in previous Updating and Screening Assessments and no new busy streets have been
identified.
New Forest District Council confirms that there are no new/newly identified busy streets
where people may spend 1 hour or more close to traffic.
New Forest District Council
LAQM USA 2015 55
3.3 Roads with a High Flow of Buses and/or HGVs.
The criteria for assessing roads with a high flow of buses and / or HGV’s are set out in Box
5.3 of Government guidance (Defra, 2009). Roads with a high flow of buses and / or HGV’s
were considered in previous Updating and Screening Assessments and no new roads have
been identified. However it is noted that a proposed development of an off-shore wind farm in
the Solent, may increase the number of heavy duty vehicle’s (HDV’s) travelling through the
Lyndhurst Air Quality Management Area over a 2 year period. This proposal is currently at
the planning stage, and New Forest District Council had commented on the transport plans
and possible mitigation measures to reduce the impact on local traffic movements and air
quality.
New Forest District Council confirms that there are no new/newly identified roads with high
flows of buses/HDVs.
3.4 Junctions
The criteria for assessing junctions are set out in Box 5.3 of Government guidance (Defra,
2009). Junctions were considered in previous Updating and Screening Assessments and no
new junctions of significance have been identified.
New Forest District Council confirms that there are no new/newly identified busy
junctions/busy roads.
New Forest District Council
LAQM USA 2015 56
3.5 New Roads Constructed or Proposed Since the Last Round of Review and Assessment
The criteria for assessing new roads are set out in Box 5.3 of Government guidance (Defra,
2009). There are no new or proposed new roads since the last review and assessment of
local air quality, however it is noted that a planning application for a large development of
commercial and residential premises in Totton may be submitted in the near future. If such
an application is submitted the impact of the proposed development on local air quality will
be considered as part of the planning process. Future review and assessment reports will
also assess the potential impact of such a development on local air quality.
New Forest District Council confirms that there are no new/proposed roads.
3.6 Roads with Significantly Changed Traffic Flows
The criteria for assessing roads with significantly changed traffic flows are set out in Box 5.3
of Government guidance (Defra, 2009). There are no roads identified with significantly changed
traffic flows since the last review and assessment of local air quality.
New Forest District Council confirms that there are no new/newly identified roads with
significantly changed traffic flows.
3.7 Bus and Coach Stations
The criteria for assessing bus and coach stations are set out in Box 5.3 of Government
guidance (Defra, 2009). Bus and coach stations were considered in previous Updating and
Screening Assessments and none meeting the criteria were identified.
New Forest District Council confirms that there are no relevant bus stations in the Local
Authority area.
New Forest District Council
LAQM USA 2015 57
4 Other Transport Sources
4.1 Airports
The criteria for assessing airports are set out in Box 5.4 of Government guidance (Defra, 2009).
New Forest District Council confirms that there are no airports in the Local Authority area.
4.2 Railways (Diesel and Steam Trains)
4.2.1 Stationary Trains
The criteria for assessing stationary trains are set out in Box 5.4 of Government guidance
(Defra, 2009). Stationary trains were considered in previous Updating and Screening
Assessments and no locations meeting the criteria were identified.
New Forest District Council confirms that there are no locations where diesel or steam trains
are regularly stationary for periods of 15 minutes or more, with potential for relevant
exposure within 15m.
4.2.2 Moving Trains
The criteria for moving trains are set out in Box 5.4 of Government guidance (Defra, 2009).
Moving trains were considered in previous Updating and Screening Assessments.
New Forest District Council confirms that there are no locations with a large number of
movements of diesel locomotives, and potential long-term relevant exposure within 30m.
New Forest District Council
LAQM USA 2015 58
4.3 Ports (Shipping)
The criteria for shipping ports are set out in Box 5.4 of Government guidance (Defra, 2009).
Southampton Port is within 1km of relevant exposure locations in the New Forest district,
therefore the Port has been considered in previous Updating and Screening Assessments, in
addition to modelling work undertaken as part of a potential port development in 2004
(Dibden Bay) which assessed the potential impact of sulphur dioxide from shipping on
relevant residential premises. This previous work concluded that the relevant sulphur dioxide
objectives were unlikely to be exceeded at locations within the New Forest due to emissions
from Southampton Port. It is also noted that the sulphur content in shipping fuel will be
decreased from 2015 to 0.1% whilst the ships are berthing and in port, therefore reducing the
sulphur dioxide emissions from shipping activities at Southampton Port.
New Forest District Council confirms that whilst there is relevant exposure within 1km of the
shipping berths at Southampton Port, previous work undertaken shows that it is unlikely that
relevant sulphur dioxide objectives will be exceeded. A Detailed Assessment is therefore not
required.
New Forest District Council
LAQM USA 2015 59
5 Industrial Sources
5.1 Industrial Installations
5.1.1 New or Proposed Installations for which an Air Quality Assessment has been Carried Out
The criteria for assessing industrial installations are set out in Box 5.5 of Government
guidance (Defra, 2009). There are no new or proposed industrial installations within the New
Forest district since the last Updating and Screening Assessment.
New Forest District Council confirms that there are no new or proposed industrial
installations for which planning approval has been granted within its area or nearby in a
neighbouring authority.
5.1.2 Existing Installations where Emissions have Increased Substantially or New Relevant Exposure has been Introduced
The criteria for assessing industrial installations are set out in Box 5.5 of Government
guidance (Defra, 2009). There are no existing installation where emissions have increased
substantially or new relevant exposure has been introduced since the last Updating and
Screening Assessment.
New Forest District Council confirms that there are no industrial installations with
substantially increased emissions or new relevant exposure in their vicinity within its area or
nearby in a neighbouring authority.
5.1.3 New or Significantly Changed Installations with No Previous Air Quality Assessment
The criteria for assessing industrial installations are set out in Box 5.5 of Government
guidance (Defra, 2009). There are no new or significantly changed industrial installations with
no previous air quality assessment.
New Forest District Council confirms that there are no new or proposed industrial
installations for which planning approval has been granted within its area or nearby in a
neighbouring authority.
New Forest District Council
LAQM USA 2015 60
5.2 Major Fuel (Petrol) Storage Depots
The criteria for assessing industrial installations are set out in Box 5.5 of Government
guidance (Defra, 2009). There is a major fuel (petrol) storage depot located in the New Forest
district at the Hythe terminal, however the location has been screened in accordance with
guidance (Defra, 2009) and with the assistance of the Air Quality Helpdesk and it has been
concluded there is no requirement to proceed to a Detailed Assessment at this time.
It is noted that any changes to the capacity of fuel stored on site may result in the location
being re-assessed to determine if there is a requirement to proceed to a Detailed
Assessment. Considering the site is currently inspected bi-annually by the Local Authority as
part of its permitting regime, it is likely any such changes to the fuel storage capacities will be
quickly identified.
New Forest District Council has assessed a major petrol storage depot, and concluded that it
will not be necessary to proceed to a Detailed Assessment.
5.3 Petrol Stations
The criteria for assessing industrial installations are set out in Box 5.5 of Government
guidance (Defra, 2009). There are no petrol stations in the New Forest district which fulfil the
specified criteria.
New Forest District Council confirms that there are no petrol stations meeting the specified
criteria.
New Forest District Council
LAQM USA 2015 61
5.4 Poultry Farms
The criteria for assessing industrial installations are set out in Box 5.5 of Government
guidance (Defra, 2009). In the Updating and Screening Assessment 2009 the potential
combined impact from two medium sized poultry on residential premises in Sway was
identified as an area requiring further assessment through a Detailed Assessment. During
2010 – 2011 New Forest District Council contracted AEA Technology to undertake the
Detailed Assessment taking into account the two poultry farms plus a neighbouring waste
transfer station.
Following the submission of the Detailed Assessment the Council discussed the conclusions
with the Defra Air Quality Helpdesk (operated by Bureauveritas). It was concluded that there
was no requirement to declare an Air Quality Management Area in Sway due to the
combined impact of the poultry farms. This conclusion was reached by considering changes
to the criteria to assess poultry farms, the Detailed Assessment results, the assessment of
the combined impacts of two poultry farms and modelled impact. As such it was determined
that New Forest District Council would not take any further action concerning particulate
matter from the identified poultry farms in Sway (Pitmore Farm and Matford Farm) unless
Local Air Quality Management guidance changed or the number of birds processed on site
increased significantly. To date, no such changes have occurred and therefore the Council
will not be considering these poultry farms further.
New Forest District Council confirms that there are no poultry farms meeting the specified
criteria.
New Forest District Council
LAQM USA 2015 62
6 Commercial and Domestic Sources
6.1 Biomass Combustion – Individual Installations
The criteria for assessing biomass combustion (individual installations) are set out in Box 5.8,
of Government guidance (Defra, 2009). Two commercial boilers have been identified by New
Forest District Council;
A Vyncke ‘CNS-C’ hot water (WID ready) 4.7MW biomass boiler burning Grade A and
Grade B waste wood at Double H Nurseries, Gore Road, New Milton BH25 5NG.
In order to operate, this boiler required planning permission from Hampshire County
Council and permitting by the Local Authority under the provisions laid out in the
Pollution Prevention and Control Act 1990, the Environmental Permitting (England
and Wales) Regulations 2010 (as amended). The permit was issued in February
2015.
The planning and permitting processes included the submission of a detailed air
quality assessment to determine the impact of the boiler on local air quality and
emission testing once the boiler was commissioned. The detailed assessment and
emission testing determined the operation of this biomass boiler did not have a
significant impact on local air quality.
A 1MW biomass boiler burning virgin wood at Pinetops Nurseries, Milford Road,
Lymington SO41 0JD.
This boiler is only recently installed and is intended to be authorised under the
provisions laid out under the Clean Air Act 1993. There may be the requirement for
the boiler to be permitted in the future should waste wood be considered as a fuel
source.
If New Forest District Council becomes aware of any other biomass combustion plant they
will be considered in future Review and Assessment reports.
New Forest District Council has assessed the biomass combustion plant, and concluded that
it will not be necessary to proceed to a Detailed Assessment.
New Forest District Council
LAQM USA 2015 63
6.2 Biomass Combustion – Combined Impacts
The criteria for assessing biomass combustion (individual installations) are set out in Box 5.8,
of Government guidance (Defra, 2009). The combined impact of biomass combustion has been
assessed in previous Review and Assessment reports, and it is considered unlikely that the
criteria to proceed to a Detailed Assessment would be met in the New Forest district.
New Forest District Council has assessed the biomass combustion plant, and concluded that
it will not be necessary to proceed to a Detailed Assessment.
6.3 Domestic Solid-Fuel Burning
The criteria for assessing domestic solid-fuel burning are set out in Box 5.8, of Government
guidance (Defra, 2009). Domestic solid-fuel burning has been assessed in previous Review
and Assessment reports, and it is considered unlikely that the criteria to proceed to a
Detailed Assessment would be met in the New Forest district due to no areas of significant
domestic fuel use.
New Forest District Council confirms that there are no areas of significant domestic fuel use
in the Local Authority area.
New Forest District Council
LAQM USA 2015 64
7 Fugitive or Uncontrolled Sources
The criteria for assessing fugitive or uncontrolled source are set out in Box 5.10, of
Government guidance (Defra, 2009). There are no new locations, current sources with a
significant change or new relevant exposure locations identified for fugitive or uncontrolled
sources within the New Forest district. If New Forest District Council becomes aware of any
sources for fugitive or uncontrolled emissions they will be considered in future Review and
Assessment reports.
New Forest District Council confirms that there are no potential sources of fugitive particulate
matter emissions in the Local Authority area.
New Forest District Council
LAQM USA 2015 65
8 Conclusions and Proposed Actions
8.1 Conclusions from New Monitoring Data
Throughout 2014 monitoring for nitrogen dioxide, particulate matter (PM10) and sulphur dioxide has
been undertaken throughout the New Forest district. The only pollutant monitored as exceeding air
quality objectives was nitrogen dioxide with regards to the annual mean objective.
The majority of monitoring for nitrogen dioxide concentrations was undertaken using diffusion
tubes located throughout the District. The annual mean results for each diffusion tube site was
biased corrected either using a locally determined bias correction factor as detailed in Appendix B
or using the national bias correction factor (Defra, 2015).
During 2014, 5 sites monitored an exceedance of the annual mean objective for nitrogen dioxide; 1
site was the automatic analyser at Lyndhurst, whilst the other 4 sites were from diffusion tubes in
Lyndhurst. All the sites monitoring an exceedance of the annual mean objective for nitrogen
dioxide are within the current Air Quality Management Area in Lyndhurst.
The ratified result from the automatic analyser in Lyndhurst for 2014 was 41µg/m3 which although
is an exceedance of the annual mean objective for nitrogen dioxide and an increase from 40µg/m3
in 2012, is the same result as that monitored in 2013. However the automatic analyser results are
presented as whole numbers (unlike the diffusion tube results which are presented to two decimal
places), and on closer scrutiny the actual monitoring results from the automatic analyser were
40.4µg/m3 (2012), 40.6µg/m3 (2013) and 40.5µg/m3 (2014). Therefore the results from the
automatic analyser have shown consistency over the past 3 years, and unfortunately any slight
increase on the 2012 monitoring result will determine a reported exceeedance of the air quality
objective for nitrogen dioxide.
The diffusion tube sites which monitored an exceedance of the annual mean objective for nitrogen
dioxide in Lyndhurst have consistently exceeded the objective since 2006. However with particular
reference to each locations, it has been noted that for:
15 High Street (site 9) the monitored annual mean concentration was significantly reduced
by approximately 6µg/m3 compared to 2012 monitoring results, with a significant reduction
of 4µg/m3 between 2013 and 2014. This monitoring location has historically recorded the
highest monitoring result for the annual mean nitrogen dioxide concentration in the district,
New Forest District Council
LAQM USA 2015 66
however following the monitored reduction in nitrogen dioxide in 2014, this location is not
currently recording the highest monitored result.
14 High Street (site 10) monitored a similar result to previous years (2012 and 2013). This
followed a significant reduction in nitrogen dioxide annual mean concentration since 2011,
with the concentration at this location being at around the annual mean objective
concentration of 40µg/m3.
16 High Street (site 11) has monitored a further year of a consistent result of between
43µg/m3 and 44µg/m3. This location recorded the highest monitored concentration of
nitrogen dioxide in the district during 2014, however this was because of the significant
reduction in nitrogen dioxide concentration monitored at 15 High Street.
2a Romsey Road (site 12) is a site on a telegraph pole with no relevant exposure, but at a
traffic light point. This site has monitored a 2.5µg/m3 increase in nitrogen dioxide
concentration as an annual mean.
14 and 15 High Street (along with 16 High Street) are within the street canyon part of the High
Street, forming part of the one-way traffic system around Lyndhurst. Due to the air quality issues in
Lyndhurst the use of a green filter, long vehicle detection system and MOVA (Microprocessor
Optimised Vehicle Actuation) system (HCC, 2015) were introduced on the traffic lights off the one
way between the High Street (in the street canyon) into Romsey Road to improve traffic flow and
air quality. This system was introduced in 2012 and increased in use in 2013 when it was in
continual use apart from times when a long vehicle approaches the junction or when the pedestrian
crossings are in use.
It has been noted that the traffic flow around the one-way system has improved and although there
are still times of congestion these appear less frequent and less pronounced. Hampshire County
Council has also confirmed that the traffic figures around Lyndhurst have remained consistent,
therefore the reduction in the annual mean nitrogen dioxide concentrations noted at the monitoring
sites in the street canyon may be as a result of the improved traffic flow, and further monitoring
should confirm this.
Both monitoring locations at 16 High Street and 2a Romsey Road are adjacent to traffic lights and
are therefore at the point where vehicles are accelerating away from a junction. This may explain
the consistent or increased results for these sites.
New Forest District Council
LAQM USA 2015 67
It is also noted that the monitoring locations around the one way system in Lyndhurst, in particular
sites 1 – 11 (inclusive) have monitored similar results or slightly decreased results compared to the
2013 results. This may be characteristic throughout the district, as there seems to be a slight
decrease in the monitored nitrogen dioxide annual mean concentrations over the majority of sites,
or as a direct result of the improved congestion in Lyndhurst.
There have been uncertainties to why the location at Shrubbs Hill Road (site 4a) was monitoring an
annual mean concentration for nitrogen dioxide above the objective when monitoring sites either
side did not monitor such high results and because a Detailed Assessment in 2012 concluded the
site should not be exceeding. Therefore in 2013 the site was altered to a duplicate site to ensure
precision in the monitored concentrations and an addition diffusion tube site was located adjacent
to the front door of the residential premises (as shown in Figure 8.1).
Figure 8.1 Location of diffusion tube monitoring sites 4a and 4b
4b
4a
The monitored nitrogen dioxide concentration at site 4a shows a significant decrease of 5µg/m3
between 2013 and 2014, producing a borderline result in 2014 just under the objective
concentration at 39.83µg/m3. However the location at site 4b monitored a concentration of
32.92µg/m3 which was consistent with the result for 2013. Whilst the monitored result at site 4b is
significantly below the annual mean objective for nitrogen dioxide it also implies that the reduction
in the monitored result at site 4a may be as a result of the improvements seen in traffic congestion
around the one-way system in Lyndhurst.
New Forest District Council
LAQM USA 2015 68
The monitoring location at 2 Gosport Lane, Lyndhurst (site 16) has historically been a site which
has monitored concentrations of nitrogen dioxide which have on occasions exceeded the annual
mean objective. This site was included as part of a Detailed Assessment in 2012, however
subsequent monitoring since 2012 has not shown concentrations exceeding the objective for
nitrogen dioxide, although the annual mean results have remained borderline. This location is
adjacent to 2 merging lanes of traffic on the Lyndhurst one way system (after sharp 90 degree
corners), however the overall improved traffic flow around Lyndhurst may also be having a positive
impact on the nitrogen dioxide concentrations monitored at this site.
Previous monitoring results at Shrubbs Hill Road (site 4a) and Gosport Lane (site 16) have
resulted in the consideration of either declaring an additional Air Quality Management Area(s) in
Lyndhurst or extending the existing Air Quality Management Area. Based on the monitoring results
in 2014, it is recommended that monitoring at these locations should continue to determine
whether concentrations of nitrogen dioxide remain below the annual mean objective level therefore
removing the requirement to declare additional or extend the existing Air Quality Management Area
in Lyndhurst.
A noted dramatic decrease in nitrogen dioxide annual mean concentrations in 2014 was at 15
Gosport Lane, Lyndhurst (site 17). This result has been annualised and adjusted for distance to a
relevant exposure (to enable comparison to the 2013 monitoring result which was a borderline
result in 2013). The 2014 monitored result shows a reduction of 10µg/m3, however in 2013 this
location was adjacent to a development site, which may have resulted in increased nitrogen
dioxide concentrations due to the influence of on-site construction traffic.
Nitrogen dioxide monitoring using the automatic analyser and diffusion tubes will
continue in Lyndhurst during 2015.
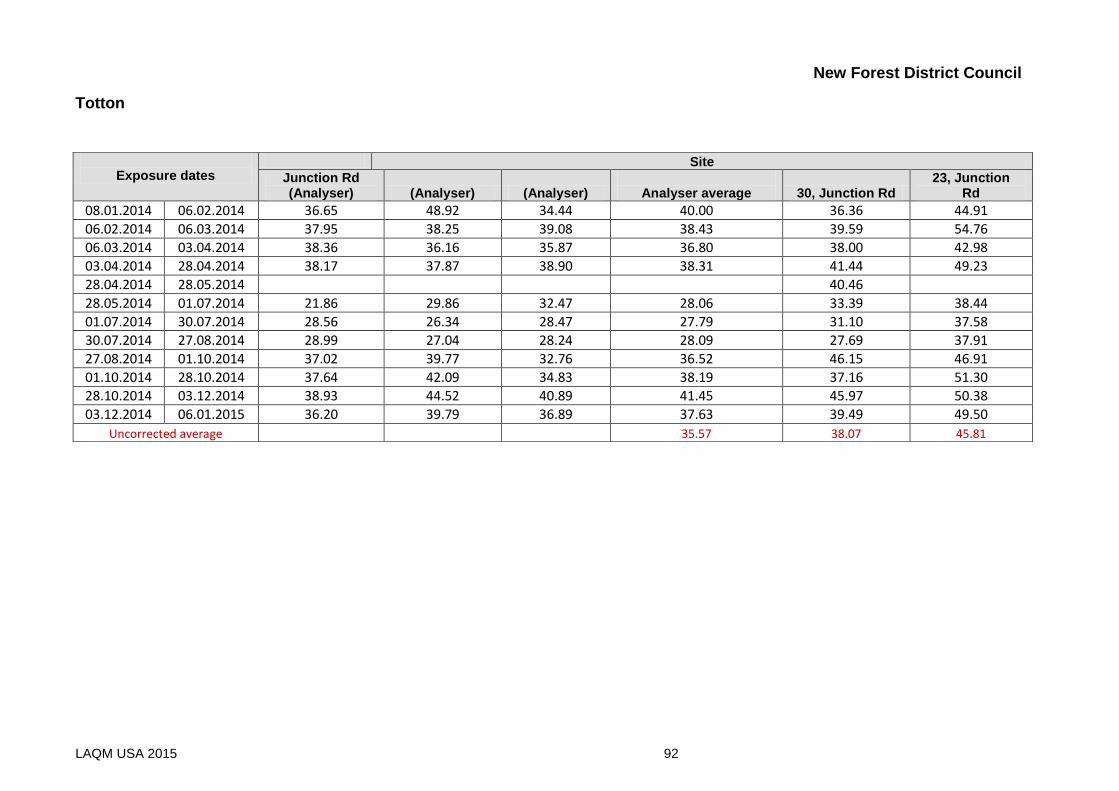
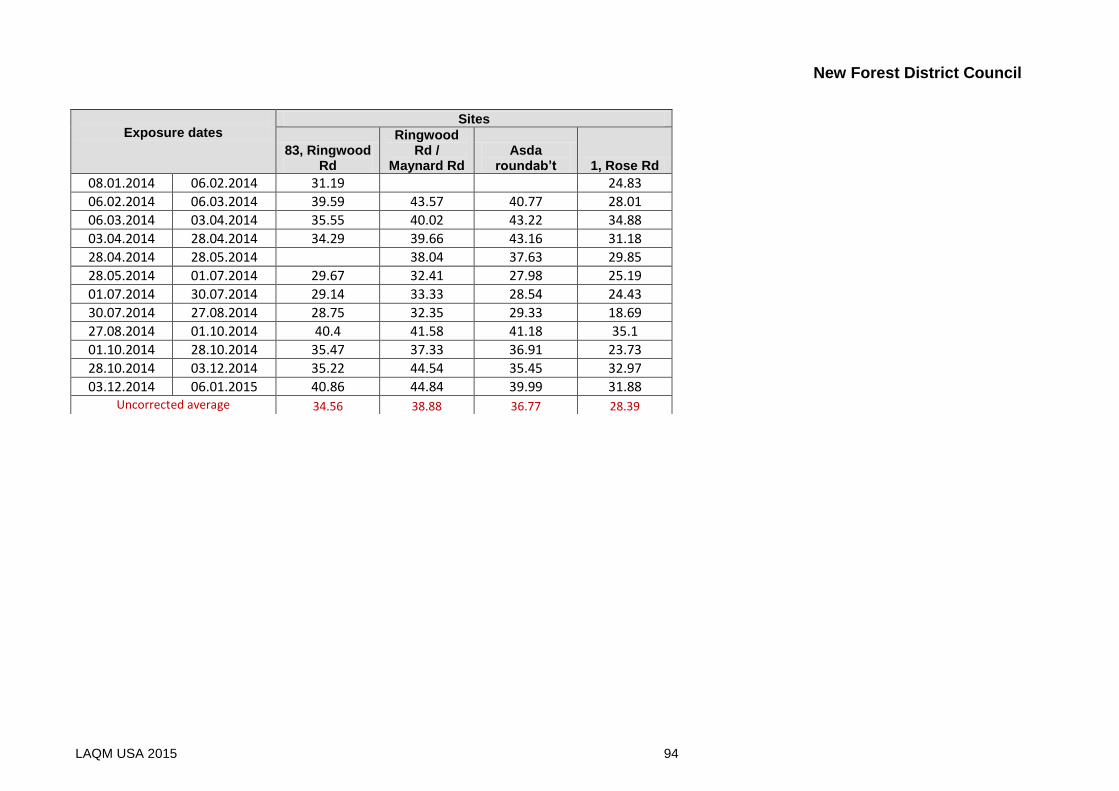
The nitrogen dioxide monitoring undertaken in Totton during 2014 did not show any exceedances
of the annual mean objective, or results considered borderline. In fact the highest recorded
monitoring concentration was 32.98µg/m3 at a kerbside location in Junction Road which is not
relevant exposure.
It is noted that following advice from the Air Quality helpdesk the local bias correction factor of 0.72
was applied to the Totton diffusion tubes. This bias correction factor is considered relatively low,
resulting in the corrected monitored results being reduced quite dramatically from the raw data.
New Forest District Council
LAQM USA 2015 69
It is noted that if the national bias correction factor of 0.91 was applied to the raw data in Totton,
one site would exceed the annual mean objective for nitrogen dioxide. However this exceeding site
is a kerbside location and not of relevant exposure. All the other monitored concentrations would
have been below the annual mean objective concentration even with the application of the national
bias correction factor.
The application of a low bias correction factor in Totton is not unusual with other previous local bias
correction factors applied being 0.81 (2011), 0.89 (2012), 0.84 (2013) and 0.72 (2014). This site,
when compared to Lyndhurst appears to have a greater degree of variation in the local bias
correction factors, whereas Lyndhurst show greater consistency in the factors determined. The
local bias correction factors for Lyndhurst were; 0.90 (2011), 0.88 (2012), 0.88 (2013) and 0.87
(2014).
However due to the application of the 0.72 bias correction factor, all the diffusion tube results in
Totton have shown a decrease when compared to the 2013 results. This is due to the bias
correction factor rather than the actual monitored concentrations, but overall the results are
acceptable.
Therefore whilst it is evident that the decision of which bias correction factor to use will greatly
influence the presented results, the application of a locally derived bias correction factor is
preferred to reflect local conditions if it is considered robust. In the case of Totton I discussed my
queries and findings with the Air Quality helpdesk and it was concluded the application of the local
bias correction factor (0.72) to the 2014 monitored diffusion tube data was acceptable.
Monitoring in Totton has not shown an exceedance of the annual mean objective for nitrogen
dioxide either inside or outside the Air Quality Management Area at any site since 2008. Whilst it is
noted that the Council should be revoking the Air Quality Management Area in Totton based on the
monitoring results, previous Air Quality Review and Assessment reports have deferred the decision
to start the revocation the Air Quality Management Area due to the likelihood of a major
development for houses and commercial premises on a brown field site at Eling Wharf, just outside
the current Air Quality Management Area.
However due to the continued monitoring evidence that there have been no exceedances of the
annual mean objective for nitrogen dioxide at any monitoring location in Totton during the last 6
years, it is the recommendation of this report that the revocation of the Totton Air Quality
Management Area should proceed. This report would also recommend that nitrogen dioxide
New Forest District Council
LAQM USA 2015 70
monitoring continues in Totton for a number of years post revocation of the Air Quality
Management Area, and whilst the planning department has advised that a planning application will
be received for the re-development of Eling Wharf the impact on local air quality would be
thoroughly considered during the planning process and any determined significant impact on local
air quality is suitably and robustly mitigated.
Nitrogen dioxide monitoring using the automatic analyser and diffusion tubes will
continue in Totton during 2015.
The trend data shown for nitrogen dioxide monitoring using diffusion tubes at sites within the
Lyndhurst Air Quality Management Area has shown a general slight decrease in nitrogen dioxide
concentrations over time (2005 – 2014). This has been particularly noted in the sites located within
the street canyon part of the High Street, 14, 15 and 16 High Street where the nitrogen dioxide
annual mean concentrations continue to exceed the air quality objective. It is hoped this
decreasing trend will continue.
It is also noted that throughout all the diffusion tube sites, the majority of sites have monitored
slight decreases in nitrogen dioxide concentrations between 2013 and 2014 with 36 sites (out of
44) monitoring a decrease which was noted at both rural background sites (sites 35 and 44). The
changes across the district are difficult to explain - it may be the influence of weather conditions or
subtle changes in fleet configurations. Whilst it is worth keeping a note of such patterns, overall it is
monitored exceedances of the air quality objectives which would result in action being taken to
reduce pollution concentrations.
There are no further nitrogen dioxide monitoring locations which have caused concern during
2014. As such a number of diffusion tube sites have been removed following a number of years of
low monitoring results and / or irrelevant exposure locations. These sites are:
23 Junction Road, Totton not relevant exposure,
- relevant exposure site (25 Junction Road) in close proximity
It is noted that there have been no monitored exceedance of the short term nitrogen dioxide hourly
objective at any automatic monitoring location, or any diffusion tube monitoring an annual mean
concentration >60µg/m3 which may be indicative of a possible exceedance of the hourly objective
for nitrogen dioxide.
The Council will continue to review its monitoring sites throughout the District and locate or remove
sites as required. In the meantime monitoring of nitrogen dioxide using diffusion tubes
will continue throughout the District during 2015.
It is noted that there are no monitored exceedances of the particulate matter (PM10) objectives at
any of the monitoring sites during 2014. The sites monitoring PM10 at Holbury and Totton are still
relevant and will continue to monitor for particulate matter. It is noted that the Council uses TEOM
monitors which do not meet the equivalence criteria, however the annual results are corrected
using the Defra accepted volatile correction method (VCM) as detailed in Appendix B. Should the
Council determine the PM10 concentrations are likely to exceed the objectives or that the
particulate monitoring equipment requires replacement, then equipment that meets the
equivalence criteria will be installed to replace the existing TEOM’s.
Monitoring of PM10 at Totton and Holbury will continue in 2015.
Monitoring results for sulphur dioxide from Fawley and Holbury have not shown an exceedance of
the any of the sulphur dioxide objectives. Indeed there have been no monitored exceedances of
the sulphur dioxide objective since the monitored exceedance of the 15 minute mean objective at
Fawley in 2005. As a result the Air Quality Management Area for Fawley for the likely exceedance
of the 15 minute mean objective was revoked in April 2013, however monitoring will continue into
the near future to ensure the concentrations of monitored sulphur dioxide remain below the
objective levels.
Monitoring of sulphur dioxide at Fawley and Holbury will continue in 2015 in order
to obtain local monitoring data for the area.
New Forest District Council
LAQM USA 2015 72
8.2 Conclusions from Assessment of Sources
The assessment of sources within the New Forest district has concluded that to the best of
our knowledge there will be no impacts on air quality from local developments: road
transport, other transport, industrial installations, commercial or domestic sources and
fugitive emissions.
However it is noted that there is the potential for increases in benzene emissions from the
fuel terminal at Hythe. Therefore checks on the status on this site will be made as part of the
bi-annual permitting inspection by the Local Authority.
It is also likely that there will be an increase in the number of biomass boilers installed at
commercial premises within the District. Therefore the Local Authority needs to ensure such
installations are properly assessed for the likely impact on local air quality and regulated
under the most appropriate legislation.
8.3 Proposed Actions
The Updating and Screening Assessment 2015 has not identified the requirement for
additional monitoring. Due to a number of years of low monitoring results and / or non-
relevant exposure locations a number of diffusion tubes will be removed during the
monitoring programme for 2015. However the monitoring programme within New Forest
district will continue during 2015.
The Updating and Screening Assessment 2015 has recommended the requirement to
proceed to revoking the Air Quality Management Area for Totton following 6 years of no
monitored exceedance of the annual mean objective for nitrogen dioxide in Totton. The
revocation of an Air Quality Management Area includes producing evidence such as
monitoring and / or modelling data to support the revocation, a consultation process and the
Local Authority cabinet approval.
Appendix G of this report summarises the actions taken to declare the Totton Air Quality
Management Area, measures implemented and all monitoring results. It is hoped that
Appendix G provides the evidence required to enable New Forest District Council to proceed
New Forest District Council
LAQM USA 2015 73
through the process to revoke the Totton Air Quality Management Area without the
requirement to produce a Detailed Assessment.
Therefore in conclusion, further work to be completed or progressed by New Forest District
Council is as follows:
Continue the current air quality monitoring programme in New Forest district
Submit the Action Plan Progress Reports by December 2015 for: - Lyndhurst Air Quality Management Area
- Totton Air Quality Management Area
Produce a district wide Progress Report by April 2016
Continue with the recommendation to revoke the Totton Air Quality Management Area
- Subject to agreement on the recommendation to revoke
- If revocation is agreed, with the aim to formally revoke the Totton Air Quality Management Area by June 2016 following a consultation process and cabinet approval
New Forest District Council
LAQM USA 2015 74
9 References
Defra (2009). Part IV of the Environment Act 1995. Local Air Quality Management. Technical Guidance LAQM.TG(09). February 2009. Defra. Defra (2015). Diffusion Tubes. [Online]. Available from: http://laqm.defra.gov.uk/diffusion-tubes/diffusion-tubes.html [Accessed 3 June 2015].
Erg (2015). Air Quality in the New Forest. [Online]. Available from: http://www.hantsair.org.uk/hampshire/asp/home.asp?la=NFDC [Accessed 20 May 2015]. Environment Agency (2014). Public Registers [Online]. Available from: http://epr.environment-agency.gov.uk/ePRInternet/searchregisters.aspx [Accessed 3 June 2015]. Hampshire County Council (2015). Traffic Signal Control (MOVA system) [Online]. Available from: http://www3.hants.gov.uk/search?cx=009988739743092233991%3A4hx6rzq-jqg&cof=FORID%3A11&q=MOVA&sa=Search [Accessed 19 June 2013].
Office for National Statistics (2013).Neighbourhood Statistics. [Online]. Available from: http://www.neighbourhood.statistics.gov.uk/dissemination/ [Accessed 22 May 2013].
Appendix A: Part A permitted processes within New Forest district
Appendix B: QA/QC
Local bias correction factor spreadsheets
Appendix C: Full data set – nitrogen dioxide automatic monitoring hourly means
Appendix D: Annualised calculations for short term data sets
Appendix E: Adjustment for relevant exposure
Appendix F: Full data set – diffusion tube monitoring results
Appendix G: Detailed information regarding the decision to progress to revoke the Totton Air Quality Management Area
New Forest District Council
LAQM USA 2015 76
Appendix A: Part A Permitted Processes within New Forest district (2014) (EA, 2014)
Operator/Site Name Current
Environmental Permit Number
Esso Petroleum Co. Ltd JP3631KW
Esso Petroleum Company Ltd BR6996IC
ExxonMobil Chemical Limited ZP3839MG
Tradebe FP3435KW FP3935KL
Nalco Manufacturing Ltd PP3432HA
Versalis UK Ltd BR8263IE
Veolia ES (UK) Ltd NP3833UE
Veolia ES Hampshire Ltd BJ7093IY
Marchwood Power Ltd BL6217IM
RWE npower plc WP3535ZZ
Npower Cogen (Hythe) Ltd BK1732IQ
GEO Speciality Chemicals UK Ltd SP3038FQ
New Forest District Council
LAQM USA 2015 77
Appendix B: QA/QC QA/QC of automatic monitoring All of the automatic monitoring sites undertake a daily internal calibration using either on site gases or permeation tubes and scrubbers. The sites are also manually calibrated using a reference span gas once a fortnight. The gas is obtained from Air Liquide and BOC, and each cylinder is certified. In addition, the sites are serviced and calibrated every 6 months by engineers from EnviroTech who hold the service contract for the Council. The engineer is also available for call outs if the site appears to be malfunctioning. Erg, at Kings College, London, validates and ratifies the data from the sites, which is downloaded twice a day. During the validation process any potential problems are identified and if necessary reported back to the Council and EnviroTech. The data is ratified every 1-3 months during which the manual calibrations and servicing are taken into account. Full ratification of the data occurs annually when all servicing and auditing reports, calibrations and breakdown information can be applied to the data. The Council contracts AEA to externally audit the automatic monitoring sites biannually. This process ensures quality assurance and control of the sites. The data given in the Updating and Screening Assessment 2015 has been fully ratified. QA/QC of diffusion tube monitoring The determination of nitrogen dioxide diffusion tube precision is obtained from duplicate and triplicate co-located sites. The results from triplicate diffusion tube sites operated by New Forest District Council at Totton, Lyndhurst and Marchwood can be seen in the spreadsheet calculation used to determine local bias correction and shown in Appendix F. Overall the triplicate diffusion tube sites showed good precision during 2014. Gradko International Ltd. is a UKAS accredited laboratory and has been rated ‘good’ through the Workplace Analysis Scheme for Proficiency (WASP) as determined by the health and safety laboratory. Gradko International Ltd. also follows procedures set out in the Technical Guidance LAQM.TG(09) (Defra, 2009). Diffusion Tube Bias Adjustment Factors The nitrogen dioxide diffusion tubes were supplied and analysed by Gradko International Ltd. The preparation method used for the diffusion tubes was 20% TEA (triethanolamine) in water.
New Forest District Council
LAQM USA 2015 78
The national bias adjustment factor for Gradko using the preparation method of 20% TEA in water (2014) was 0.91. This was obtained from the Local Air Quality Management website (Defra, 2015) from database version 06/15. Factor from Local Co-location Studies Two different local bias correction factors were determined for the data for 2014. These were as follows; Details of Bias Correction Factors
Location Bias Correction Factor
Totton 0.72
Lyndhurst (street canyon) 0.87
The local bias correction factors have been determined using calculations supplied by the Local Air Quality Management website (Defra, 2015) and are shown below for Totton and Lyndhurst.
New Forest District Council
LAQM USA 2015 79
Totton – Local Bias Correction Factor Spreadsheet
New Forest District Council
LAQM USA 2015 80
Lyndhurst – Local Bias Correction Factor Spreadsheet
New Forest District Council
LAQM USA 2015 81
Discussion of Choice of Factor to Use The diffusion tube results have been bias corrected to allow for laboratory bias. Bias correction factors can either be determined from local or national data sets, and factors influencing the decision on which bias correction factors to use include local conditions and the location of automatic nitrogen oxides analysers. 3 different bias correction factors have been applied to the 2014 diffusion tube data for New Forest. Local bias correction factors were determined and used for diffusion tube sites located in Totton. This location contains an automatic monitoring site with a co-located triplicate diffusion tube site, therefore enabling a local correction factor to be applied. It was noted that Government guidance (TG, 09) advises that data capture for an automatic analyser should be greater than 90% in order to use the data, including for the determination of local bias correction factors. It was noted that the automatic analyser at Totton had a data capture slightly below the recommended level of 90 % (at 86 %). However, low data capture was primarily in 2 months: i) May 2014 - when the diffusion tubes were also missing; and ii) June 2014 - when the diffusion tubes had a poor precision and are not used in the calculation of the bias correction factor. The automatic analyser’s data capture and the availability and precision of diffusion tubes were all good for the remaining 10 months of 2014. In fact, the result from the bias correction spreadsheet is the same (0.72) when the results from the analyser are altered to give a 90% data capture:
New Forest District Council
LAQM USA 2015 82
As such, the use of the continuous monitor to calculate a local bias correction factor is justified and supported by the Local Air Quality helpdesk. In Lyndhurst 5 diffusion tube sites have been locally biased corrected. These 5 diffusion tube sites and the automatic monitoring site are located within the street canyon of the High Street. The remaining 14 diffusion tube sites in Lyndhurst have been bias corrected using the national bias correction factor, as these sites are located outside the effects of the street canyon in the High Street, Lyndhurst. Previous Local Air Quality Reports for the New Forest have presented a local bias correction factor for Marchwood. Whilst a triplicate diffusion site was co-located with the automatic analyser site during 2014, the data capture for the automatic site was poor at 70%, therefore there was no justification to obtain a local bias correction factor for the Marchwood area. The bias correction factors used on the 2014 diffusion tube data are shown below;
Details of Bias Correction Factors
Location Bias Correction Factor
Local / National
Totton 0.72 Local
Lyndhurst (street canyon) 0.87 Local
Lyndhurst 0.91 National
Remaining sites 0.91 National
It is noted that bias correction factors less than 1 will reduce the raw annual mean result for each diffusion tube, whilst factors greater than 1 will increase the raw annual mean result. The degree of adjustment will depend on the bias correction factor with larger adjustments noted the further the correction factor is from 1. Therefore the choice of bias correction factor is important. In conclusion, I am confident in the determination and selection of the bias correction factors used to adjust raw diffusion tube data. The correct methods have been followed using the data available, although it is clear how influential the correction factors can be to the overall conclusion made. PM Monitoring Adjustment New Forest District Council uses TEOM analysers to monitor PM10. It is noted that this monitoring equipment does not meet the equivalence criteria, however guidance states that it is not necessary to immediately replace the monitoring equipment particularly considering the monitored PM10 concentrations are below the objectives. When the equipment is due for replacement the Council will consider other equipment which meets the equivalence criteria. PM10 data has been adjusted using the Volatile Correction Model (VCM) to correct for the use of a TEOM particulate monitor.
New Forest District Council
LAQM USA 2015 83
Appendix C: Full data set of nitrogen dioxide automatic monitoring 2014 (hourly mean)
Totton
Note: Results shown in µgm-3
. Hourly exceedance objective = 200µgm-3
over 18 times per year.
Lyndhurst Note: Results shown in µgm
-3. Hourly exceedance objective = 200µgm
-3 over 18 times per year.
New Forest District Council
LAQM USA 2015 84
Marchwood
Note: Results shown in µgm-3
. Hourly exceedance objective = 200µgm-3
over 18 times per year.
New Forest District Council
LAQM USA 2015 85
Appendix D: Annualised calculations for short term data
Short-term to Long-term Data adjustment
During 2014 3 diffusion tube sites and 1 automatic monitoring site (Marchwood) reported data over the calendar year of less than 75%. Therefore in accordance with Technical Guidance (TG(09) Box 3.2, the data collated from these sites was annualised, as detailed below. It should be noted that each site was determined individually and was dependent on which periods during the calendar year had produced actual data and which periods had no data. Typically data was not available due to diffusion tubes being taken from sites or highly unusual results (often very low) which were determined as abnormal and therefore removed from the data set for the site. The long term sites utilised in the calculations were Portsmouth AURN and Southampton AURN. For the monitoring period, the annual mean (Am) results for these sites were reported as: A Portsmouth (Am) 2014 = 20.1 B Southampton (Am) 2014 = 31.6 Shrubbs Hill Road (site 3)
Long term site Annual mean (Am) Period mean (Pm) Ratio (Am/Pm)
A 20.1 18.5 1.09
B 31.6 28.8 1.10
Average Ratio 1.095
Data from site over monitoring period = 32.78µgm-3
Annualised result = (32.78µgm-3 x 1.095) x 0.91 (bias correction factor)
= 32.66µgm-3
New Forest District Council
LAQM USA 2015 86
Shrubbs Hill Road (site 5)
Long term
site
Annual
mean
(Am)
Period
mean
Period
mean
Period
mean
Period
mean
Period
mean
average
(Pm)
Ratio
(Am/Pm)
A 20.1 - 25.1 14.9 24.5 21.50 0.93
B 31.6 36.0 37.0 27.0 37.1 34.27 0.92
Average Ratio 0.925
Data from site over monitoring period = 34.53µgm-3
Annualised result = (34.53µgm-3 x 0.925) x 0.91 (bias correction factor)
= 29.06µgm-3
Gosport Lane (site 17)
Long term
site
Annual
mean
(Am)
Period
mean
Period
mean
Period mean
Average (Pm)
Ratio
(Am/Pm)
A 20.1 - 19.8 19.8 1.01
B 31.6 36.0 31.1 33.55 0.94
Average Ratio 0.975
Data from site over monitoring period = 33.78µgm-3
Annualised result = (33.78µgm-3 x 0.975) x 0.91 (bias correction factor)
= 29.97µgm-3
Marchwood automatic analyser Long
term
site
Annual
mean
(Am)
Period
mean
Period
mean
Period
mean
Period
mean
Period
mean
Period
mean
Period
mean
Period
mean
Average
(Pm)
Ratio
(Am/Pm)
A 20.1 - 22.4 13.5 19.4 28.9 34.2 17.8 22.7 0.88
B 31.6 33.7 33.7 24.7 33.8 36.9 44.8 32.6 34.31 0.92 Average Ratio 0.90
Data from site over monitoring period = 18µgm-3 Annualised result = 18µgm-3 x 0.9
= 16µgm-3
New Forest District Council
LAQM USA 2015 87
Appendix E: Adjustment for relevant exposure
In accordance with guidance (Defra, 2015) adjustments are made to bias corrected diffusion tube results when monitoring is undertaken at an exceeding site which is not determined to be relevant public exposure. With regards to the monitoring undertaken within the New Forest district only one site monitored an exceedance of the nitrogen dioxide annual mean at a location determined not to be relevant public exposure: South View, Gosport Lane, Lyndhurst. South View monitored an annual mean for nitrogen dioxide of 29.97µgm-3 after a correction for annualisation (as shown in Appendix D) due to a data capture of less than 75 for the year. The result then requires adjusting for distance using the adjustment calculator http://laqm.defra.gov.uk/tools-monitoring-data/no2-falloff.html which decreases the concentration to 26.20µgm-3 at the point of relevant exposure, as shown below:
04.12.2014 08.01.2015 39.53 40.73 40.13 9.56 Uncorrected average 34.53 8.81
New Forest District Council
LAQM USA 2015 98
Appendix G: Detailed information regarding the decision to progress to revoke the Totton Air Quality Management Area
As noted in Section 8, the Updating and Screening Assessment 2015 is recommending the revocation of the current Totton Air quality Management Area. This decision is based on continuing monitoring data within and outside of the Air Quality Management Area in Totton which has not shown an exceedance of the nitrogen dioxide annual mean objective over the previous 6 years. The purpose of Appendix G is to detail all monitoring results for Totton and summarise the actions taken with regards to the Air Quality Management Area. It is hoped that Appendix G will remove the requirement for New Forest District Council to produce a Detailed Assessment as further evidence for the requirement to revoke the Air Quality Management Area for Totton as recommended by the Air Quality Helpdesk. Totton Air Quality Management Area A table summarising the progression to declaring the Totton Air Quality Management Area, and action taken in Totton post declaration of the Air Quality Management Area is shown below:
Year Comment Associated Report
2002 No predicted exceedences of the objectives for any pollutant. However diffusion tube monitoring undertaken in Junction Road in response to a planning application for a port development (Dibden Bay) which would extend the duration that a railway barrier would be closed in Junction Road therefore increasing the duration of queuing traffic. The reasoning behind the monitoring was to obtain baseline figures for nitrogen dioxide.
Review and Assessment
2003 Monitoring determined an exceedance of the annual mean objective for nitrogen dioxide in Junction Road, Totton which was predicted to continue to exceed objective concentrations in 2005. This determination was based on current traffic conditions (not those predicted if the Didben Bay development progressed).
Updating and Screening Assessment
2004 Confirmation of the likely exceedance of the annual mean objective for NO2 in Totton. Real time NO2 (and PM10) analyser installed (November 2004) in Junction Road
Detailed Assessment
2005 Confirmation of the exceedance of the annual mean objective for NO2 in Totton. Declaration of Air Quality Management Area in Totton (following full consultation process)
Progress Report
2006 Confirmed main source of NO2 in Totton is from traffic sources.
Further Assessment
2006 Installation of ‘Cut pollution, Cut Engine’ signs on roads leading to railway barrier.
2007 Exceedences of NO2 annual mean objective in Totton.
Progress Report
New Forest District Council
LAQM USA 2015 99
Year Comment Associated Report
2008 Exceedences of NO2 annual mean objective in Totton. Formal adoption of the Totton Air Quality Action Plan.
Progress Report Totton Air Quality Action Plan
2009 No monitored exceedance of the annual mean objective for NO2 in Totton at sites of relevant exposure.
Updating and Screening Assessment
2010 No monitored exceedance of the annual mean objective for NO2 in Totton at sites of relevant exposure.
Progress Report
2010 Feasibility study by Hampshire County Council into transport options for Totton to improve air quality within the Air Quality Management Area – concluded no feasible transport scheme is appropriate.
Feasibility Study
2011 No monitored exceedance of the annual mean objective for NO2 in Totton at sites of relevant exposure.
Progress Report
2012 No monitored exceedance of the annual mean objective for NO2 in Totton at sites of relevant exposure.
Updating and Screening Assessment
2013 No monitored exceedance of the annual mean objective for NO2 in Totton at sites of relevant exposure. Consider revoking Totton AQMA (NO2 annual mean objective) due to no recent exceedances at monitoring sites. However concerns regarding large housing development being planned outside AQMA but in close proximity.
Progress Report
2014 No monitored exceedance of the annual mean objective for NO2 in Totton at sites of relevant exposure. Consider revoking Totton AQMA (NO2 annual mean objective) due to no recent exceedances at monitoring sites. However concerns regarding large housing development being planned outside AQMA but in close proximity.
Progress Report
The declared Area Quality Management Area for Totton is shown below. The area was determined using monitoring results and following full consultation.
Measures taken to reduce annual mean nitrogen dioxide concentrations New Forest District Council has worked with Hampshire County Council (the regulatory authority for roads and transport in the District) to implement measures to reduce nitrogen dioxide concentrations in Totton with particular reference to the Air Quality Management Area. Nitrogen dioxide concentrations in the Totton Air Quality Management Area are influenced by:
Traffic queuing at a railway barrier closing in Junction Road for approximately 20 minutes in every hour.
Junction Road being one of the main routes off the A35 into Totton town centre, which whilst there is a HGV restriction on the road, is a bus route.
A supermarket car park being located north of Maynard Road, offering free parking in the town centre.
A transport feasibility study undertaken by Hampshire County Council in 2010 did not result in any transport related option which was feasible in terms of cost and which resulted in a noted reduction in nitrogen dioxide concentrations. Therefore it was determined there was limited scope to improve local air quality, and smarter options had to be implemented. Measures which were implemented included:
The installation of ‘Cut Engine, Cut Pollution’ signs at 4 points in Rumbridge Street, Junction Road and Maynard Road - on the approaches to the railway barriers;
New Forest District Council
LAQM USA 2015 101
Surveys determining the number of vehicles turning off their engines at the railway barrier. Currently determined to be in the region of 20%.
Improvements undertaken by Hampshire County Council to the pavements, pedestrian crossings and bus stops in the local area to encourage local residents to walk into Totton town centre rather than drive.
Monitoring in Totton Monitoring in Totton has been undertaken since 2002 using diffusion tubes, and since 2005 using an automatic analyser located in Junction Road. The locations of the monitoring sites are shown below (please note the automatic analyser is located at the same location of diffusion tube site 1), in addition to the monitoring results from both the automatic analyser and diffusion tube sites.
New Forest District Council
LAQM USA 2015 102
Map showing monitoring locations in central Totton (including those no longer in use) and current AQMA
New Forest District Council
LAQM USA 2015 103
Results of Automatic Monitoring of Nitrogen Dioxide at Totton: Comparison with Annual Mean Objective Details of monitoring locations
Notes: * data capture in 2014 less than 90% therefore results should be viewed with caution and used as guidance only
Conclusions The monitoring undertaken in Totton since 2002 has been consistent, thorough and widespread, covering both the current Air Quality Management Area in Totton and at locations outside this Area. Therefore a detailed knowledge of nitrogen dioxide concentrations throughout Totton has been obtained over the previous 12 years. Whilst it is acknowledged that the measures to reduce nitrogen dioxide concentrations have been limited in Totton, the monitoring results from both automatic monitoring and diffusion tube monitoring have shown no exceedances of the annual mean objective for nitrogen dioxide within the current Air Quality Management Area since 2008. The monitoring has also shown that the annual mean nitrogen dioxide concentrations in Totton have been significantly below the objective level for a number of years. The production of a Detailed Assessment would typically be a review of the monitoring undertaken to date in Totton. Furthermore there would be no advantage gained by undertaking an additional modelling exercise on the area to support the extensive monitoring results already obtained for the area. As such the conclusions reached from a Detailed Assessment are unlikely to be different from those reached within this report. Therefore it is recommended that based on the monitoring evidence presented in this report, and particularly Appendix G, New Forest District Council should proceed to start the process to revoke the Totton Air Quality Management Area without the requirement to produce a Detailed Assessment. The Council is mindful that the revocation process would involve full consultation and Cabinet approval with monitoring likely to continue in Totton for a suitable period post revocation. In addition any planned re-development in Totton should include the requirement to consider the impact of the development on local air quality and the implementation of appropriate mitigation measures should they be required.