2015 Upgrades to the GFDL Hurricane Model Morris A. Bender, Matthew Morin, and Timothy Marchok (GFDL/NOAA) Isaac Ginis and Biju Thomas (University of Rhode Island) Robert E. Tuleya (Old Dominion University) EMC/NCP CCB Review Wednesday, April 15 th , 2015 1
Transcript
2015 Upgrades to the GFDL Hurricane Model
Morris A. Bender, Matthew Morin, and Timothy Marchok (GFDL/NOAA)
Isaac Ginis and Biju Thomas (University of Rhode Island)
Robert E. Tuleya (Old Dominion University)
EMC/NCP CCB Review
Wednesday, April 15th, 2015 1
Summary of Proposed Upgrades
• Upgraded version of GFS
• Increase of vertical sigma levels from 42 to 60 Similar Configuration to HWRF levels
• Improved Initialization of Moisture Field (r)
• Using improved moisture specification: reintroduction of Vortex Specification for all storms (e.g. TD, and weak TS) except Nameless systems
• New Specification of Storm size (Rb)
• Modified filter depth in vortex specification (Tested, but rejected due to unfavorable impact)
• Correct Specification of Ocean Currents in Surface flux computation
rgale averaged sum of radIi of gale winds vgale at each of the 4 storm quadrants
𝑹𝒃 = e(MLG/(1 + x))
𝑽 𝒓 𝒕𝒂𝒏 =𝑴 𝒑
𝒓𝒙 −𝟏
𝟐 𝒇 𝒓 𝑪𝒂𝒓𝒓 𝒂𝒏𝒅 𝑬𝒍𝒔𝒃𝒆𝒓𝒓𝒚, 𝑴𝑾𝑹 (𝟏𝟗𝟗𝟕)
Where: (x = .4)
The Absolute Angular Momentum (Mgale) at the radius of Gale winds can be determined from the tcvitals :
In current vortex initialization we assume Rb is a simple function of the Radius of the Last closed Isobar (RLCI) from the tcvitals file (Rb = 1.5 * RLCI)
New Estimate for Rb :
𝑴(𝒑) = 𝑴 𝒓 /r (1-x)
MLG = 𝒍𝒐𝒈 (2(M(r))gale/f rgale(1-x)
M(r)gale = rgalevgale + 𝟏
𝟐 f rgale
2
7
New Storm Size
OLD Storm Size Based on JTWC
Old Storm Size
Old Storm Size
New Storm Size
New Storm Size
Typhoon Pabuk
0000 UTC 23 September
1200 UTC 22 September
1200 UTC 23 September
Old Storm Size
New Storm Size
8
Performance Evaluation of Upgraded
Model with Previous GFS
9
2014 Atlantic Season with 2014 GFS
16-18% Reduced Track Error for
2-5 Days for Both Upgraded Models
New Models Comparable to GFS
INTENSITY PERFORMANCE MIXED
42 LEVEL IMPROVED EARLY TIME
60 LEVEL IMPROVED LATER TIME
TRACK ERROR (NM) INTENSITY ERROR (KNOTS)
10
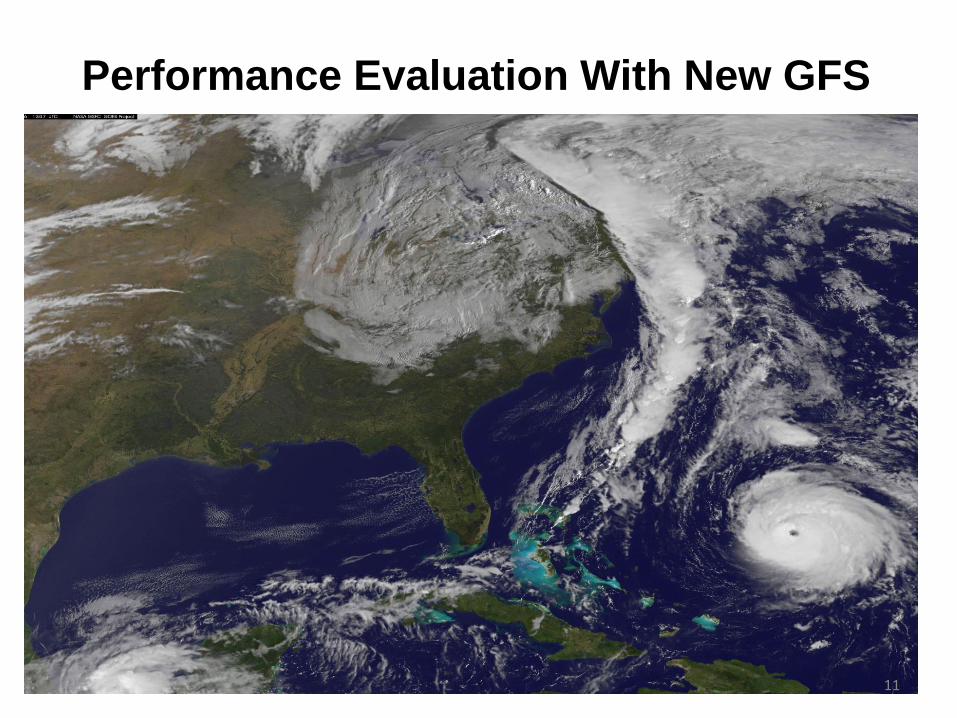
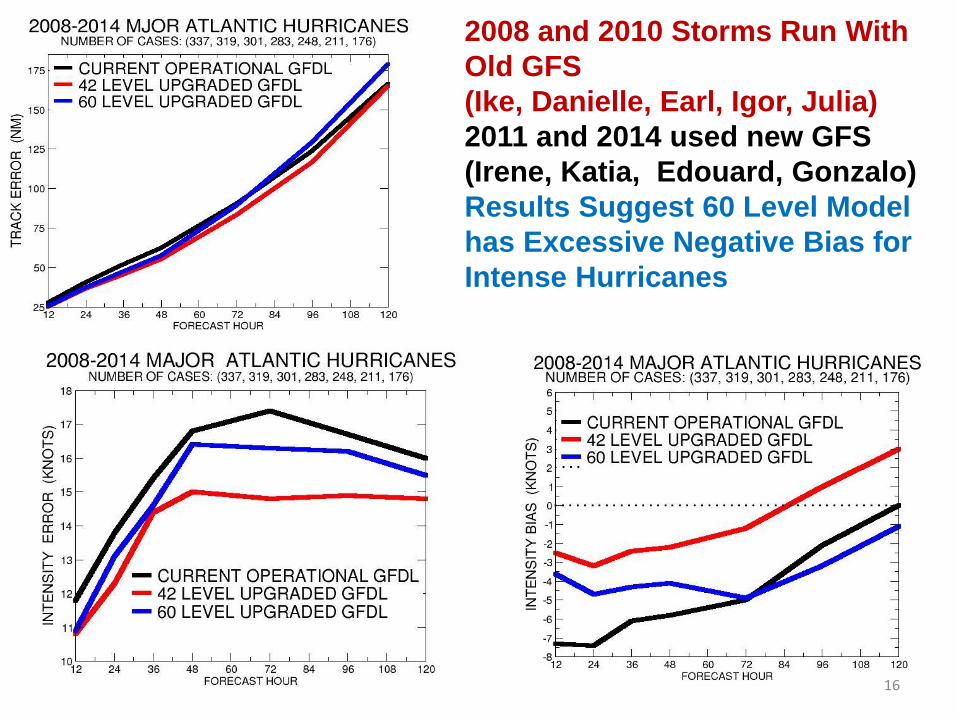
Performance Evaluation With New GFS
11
Impact Only of GFS Upgrade in Atlantic
TRACK ERROR (NM) INTENSITY ERROR (KNOTS)
New GFS Degrades GFDL degraded both track and intensity skill by
6% at days 1-2
Track (12%) and Intensity (10%) Skill Significantly degraded days 3-5
12
2011, 2012, 2014 Atlantic Seasons
with New GFS TRACK ERROR (NM) INTENSITY ERROR (KNOTS)
2-Model Ensemble errors very comparable to HWRF all forecast times
2-Model Ensemble errors average 11%
less then HWRF days 1-5 25
GFDL/HWRF Intensity Comparison Atlantic East Pacific
2-Model Ensemble errors average 7%
less then either HWRF or GFDL model
2-Model Ensemble errors 5% less then
HWRF days 1-2.
Comparable to HWRF days 3-5 26
GFDL/HWRF Intensity Bias
Comparison Atlantic East Pacific
2-Model Ensemble much less overall bias then either GFDL or HWRF 27
2014 vs 2015 Operational Guidance of Atlantic RI
1200 UTC 12 September 1200 UTC 13 September
2015 HWRF
2014 HWRF
2014 GFDL
2014 HWRF
2015 HWRF
Hurricane
Edouard
Hurricane
Edouard
0600 UTC 13 October 1200 UTC 13 October
2014 GFDL 2014 HWRF
2015 HWRF
2014 GFDL
Hurricane
Gonzalo
Hurricane
Gonzalo
2015 HWRF
2015 GFDL 2015 GFDL
2014 HWRF
2015 GFDL
2015 HWRF
2015 GFDL
2014 GFDL
28
2014 vs 2015 Operational Guidance of EPAC RI
Hurricane
Vance Hurricane
Odile 2015 GFDL
2014 GFDL
2014 HWRF
2014 HWRF
0600 UTC 12 September
0000 UTC 22 August
Hurricane
Marie
2014 HWRF
2014 GFDL
2014 GFDL
1200 UTC 3 August
Hurricane
Genevieve
2015 HWRF
2014 HWRF
2015 HWRF
2015 GFDL
2015 GFDL
2015 GFDL
2014 GFDL
2015 HWRF
2015 HWRF
29
Future Plans
• Address Negative Bias in 60 level GFDL model for intense hurricanes, by:
• 1. Evaluating impact of GFS enhanced PBL turbulence mixing in stratocumulus regions
• 2. Evaluating different distributions of vertical levels (e.g., reduced number in outflow and more in mid-levels)
• Study could have benefit of reducing negative bias in 60 level HWRF in RI and intense hurricanes
30
Summary of GFDL upgrades • GFDL model upgrade demonstrates improved
track and intensity guidance with both old and upgraded version of GFS for Atlantic and Eastern Pacific Hurricane Seasons for both the 42 and 60 level models.
• Upgraded version with increased vertical resolution (60 vertical levels) performed well in multi-year Atlantic sample dominated with weaker storms.
• For Major hurricanes 60 level version had large negative bias and degraded tracks at later times.
• 42 Level Upgraded Model is being recommended for 2015 implementation while a more optimal distribution of increased vertical levels is being evaluated for future upgrades and potentially as part of 2015 GFDL ensemble system. 31
The National Hurricane Center (NHC) endorses the proposed
implementation of the GFDL Hurricane Model for 2015. Retrospective
runs of this model for a large number of cases from the 2011, 2012, and
2014 hurricane seasons showed a significant reduction, in comparison
to the current operational version of the model, in the intensity forecast
error of 10-11 % in the Atlantic basin. Also, there was a considerable
reduction of a negative bias of intensity forecasts in both the Atlantic
and eastern North Pacific. In this regard the intensity bias was reduced
to nearly zero in the critical 1-3 day time range in the Atlantic.
The impact on track forecasts was largely neutral to slightly positive,
except at days 4-5 for the east Pacific where the improvements were
more substantial - and on the order of 12%.
The NHC looks forward to having these improvements to our numerical
guidance for TC prediction for the upcoming hurricane season.