22/03/27 1 Development of Emissions Development of Emissions Scenarios Database for the Scenarios Database for the IPCC Fourth Assessment Report IPCC Fourth Assessment Report and Regional Mitigation and Regional Mitigation Analysis Analysis - A Review of Post-SRES Scenarios - A Review of Post-SRES Scenarios - - International Energy International Energy Workshop 2005 Workshop 2005 5-7, July 2005 5-7, July 2005 National Institute for Environmental Studies Tatsuya HANAOKA ・ Mikiko KAIN UMA Kyoto University Reina KAWASE ・ Yuzuru MATSUO
Transcript
23/04/18 1
Development of Emissions Scenarios Development of Emissions Scenarios Database for the IPCC Fourth Assessment Database for the IPCC Fourth Assessment Report and Regional Mitigation AnalysisReport and Regional Mitigation Analysis
- A Review of Post-SRES Scenarios -- A Review of Post-SRES Scenarios -
International Energy Workshop 2005International Energy Workshop 20055-7, July 20055-7, July 2005
National Institute for Environmental Studies Tatsuya HANAOKA ・ Mikiko KAINUMAKyoto University Reina KAWASE ・ Yuzuru MATSUOKA
23/04/18 2
OverviewOverview
1.1. Background and Previous WorkBackground and Previous Work
2.2. Outline of Emissions Scenarios DatabaseOutline of Emissions Scenarios Database
3.3. Development of Emissions Scenarios DatabaseDevelopment of Emissions Scenarios Database
4.4. Quantitative Analysis.Quantitative Analysis.
5.5. Conclusions and Future WorkConclusions and Future Work
23/04/18 3
Emissions scenarios vary depending on various socio-economic development pathways Morita and Matsuoka started to develop emissions scenarios database since 1992, to contribute for IPCC Assessment
Background and Previous WorkBackground and Previous WorkBackground:
◆ Nakicenovic, and Morita et al (1998) 428 scenarios of global and regional GHG emissions from 176 literature sources◆ Rana, and Morita (2000) 75 scenarios of global and regional GHG emissions from 25 literature sources
Previous results of the Database:
utilized for SRES
utilized for TAR
23/04/18 4
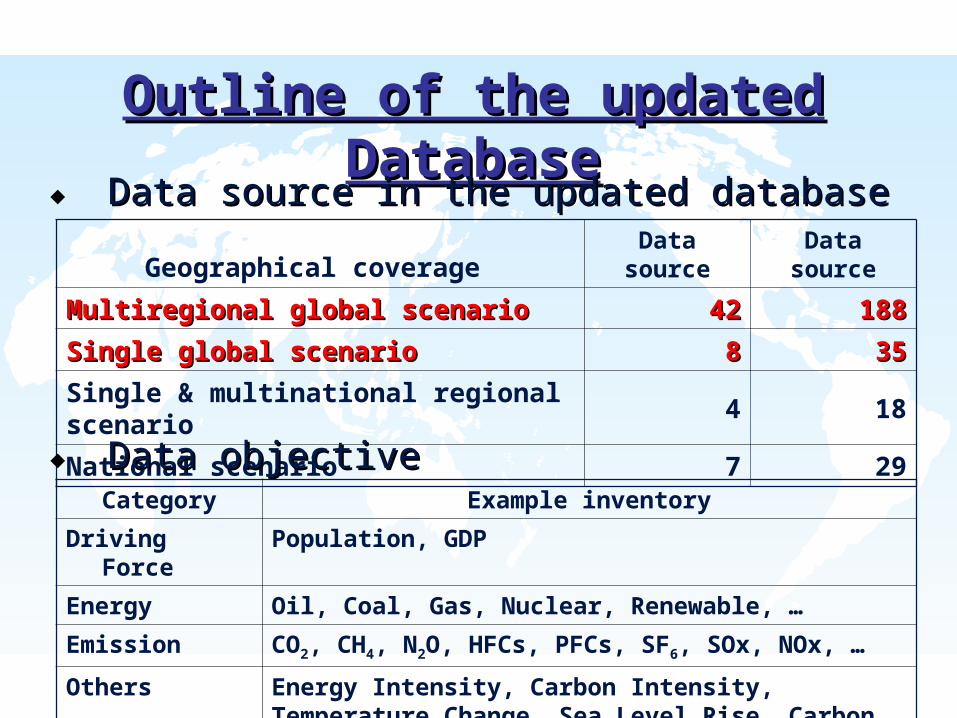
Outline of Emissions Scenarios Database ①Outline of Emissions Scenarios Database ①
Others Energy Intensity, Carbon Intensity, Temperature Change, Sea Level Rise, …
23/04/18 5
Outline of Emissions Scenarios Database ②Outline of Emissions Scenarios Database ②
Data SourceNumber of
data source
Data source reviewed by IPCC SAR etc. 40
Data source described in the scientific literatures and conferences such as EMF, IEW etc.
125
Data source reviewed by SRES process and Post-SRES process
41
Data source of national scenarios described in National Communication submitted to UNFCCC
45
◆ Data source in the current databaseData source in the current database
23/04/18 6
Scope of WorkScope of Work
◆ Update the current Emissions Scenarios DatabaseUpdate the current Emissions Scenarios Database
◆ Analyze various new mitigation scenarios since TARAnalyze various new mitigation scenarios since TAR..
Contribute for Contribute for the IPCC Fourth Assessment Reportthe IPCC Fourth Assessment Report
23/04/18 7
Development of DatabaseDevelopment of Database
● Subject matter:Subject matter: New mitigation scenarios since TARNew mitigation scenarios since TAR ● ● Regional scale:Regional scale: Global, regional and national level analysisGlobal, regional and national level analysis
● ● Temporal scale:Temporal scale: Scenarios with horizons beyond 2030Scenarios with horizons beyond 2030 ● ● Gas classifications:Gas classifications: all anthropogenic GHGsall anthropogenic GHGs
CO2, CH4, N2O, CFCs, HCFCs, HFCs, PFCs, SF6, CO,
NMVOC, SOx, NOx and Black Carbon etc ● ● Sector classifications:Sector classifications: Multi-sector scenariosMulti-sector scenarios
Outline of scenarios of interest:Outline of scenarios of interest:
“Call for Scenarios” was sent to more than one hundred researchers all over the world
23/04/18 8
Outline of the updated DatabaseOutline of the updated Database
Geographical coverage Data source Data source
Multiregional global scenarioMultiregional global scenario 4242 188188
Single global scenarioSingle global scenario 88 3535
Total COTotal CO22, CH, CH44 and N and N22O emission changes O emission changes
from baseline in 2100from baseline in 2100
- 120- 100- 80- 60- 40- 20
0204060
Wor
ld
OEC
D90
REF
ASI
A
ALM
Wor
ld
OEC
D90
REF
ASI
A
ALM
Wor
ld
OEC
D90
REF
ASI
A
ALM
CO2 CH4 N2O
Emis
sion
s ch
ange
from
bas
elin
e in
210
0 (%
)
Mid- half range MIN mitigation MAX mitigation
23/04/18 12
Evaluation Method: the Kaya identity Evaluation Method: the Kaya identity
AeisAA
Ep
Ep
C
C
CC s
s
C : Net CO2 emission including CO2 capture and storage.Cs : Fossil&industrial CO2 emission.Ep : primary energy consumption.A : economic activity.S : the ratio of net CO2 emission to generated
CO2 emission.i : carbon intensity (the ratio of generated CO2 emissions
to primary energy consumption).e : energy intensity (the ratio of total primary energy consumption to economic activity).
23/04/18 13
GDP growth & Energy Intensity Improvement GDP growth & Energy Intensity Improvement under 550 ppmv Stabilization Scenariosunder 550 ppmv Stabilization Scenarios
0.0
0.5
1.0
1.5
2.0
2.5
3.0
3.5
4.0
0.0 1.0 2.0 3.0 4.0 5.0 6.0
annual GDP growth (2000- 2050) (%/ yr)
annu
al E
I im
prov
emen
t (2
000-
2050
) (%/
yr) WORLD
ALMASIAOECD90REF
0.0
0.5
1.0
1.5
2.0
2.5
3.0
3.5
4.0
0.0 1.0 2.0 3.0 4.0 5.0 6.0
annual GDP growth (2000- 2100) (%/ yr)
annu
al E
I im
prov
emen
t (2
000-
2100
) (%/
yr) WORLD
ALMASIAOECD90REF
(a)Annual rate from 2000 – 2050 (b)Annual rate from 2000 – 2100
23/04/18 14
GDP growth & Carbon Intensity Reduction GDP growth & Carbon Intensity Reduction under 550 ppmv Stabilization Scenariosunder 550 ppmv Stabilization Scenarios
- 1.0
0.0
1.0
2.0
3.0
4.0
5.0
0.0 1.0 2.0 3.0 4.0 5.0 6.0
annual GDP growth (2000- 2050) (%/ yr)
annu
al C
I red
uctio
n (2
000-
2050
) (%/
yr)
WORLDALMASIAOECD90REF
- 1.0
0.0
1.0
2.0
3.0
4.0
5.0
0.0 1.0 2.0 3.0 4.0 5.0 6.0
annual GDP growth (2000- 2100) (%/ yr)
annu
al C
I red
uctio
n (2
000-
2100
) (%/
yr)
WORLDALMASIAOECD90REF
(a)Annual rate from 2000 – 2050 (b)Annual rate from 2000 – 2100
23/04/18 15
Carbon Intensity & Energy Intensity Carbon Intensity & Energy Intensity under 550 ppmv Stabilization Scenariosunder 550 ppmv Stabilization Scenarios
0.0
1.0
2.0
3.0
4.0
5.0
- 1.0 0.0 1.0 2.0 3.0 4.0 5.0
annual CI reduction (2000- 2050) (%/ yr)
annu
al E
I im
prov
emen
t (2
000-
2050
) (%/
yr) WORLD
ALMASIAOECD90REF
0.0
1.0
2.0
3.0
4.0
5.0
- 1.0 0.0 1.0 2.0 3.0 4.0 5.0
annual CI reduction (2000- 2100) (%/ yr)
annu
al E
I im
prov
emen
t (2
000-
2100
) (%/
yr) WORLD
ALMASIAOECD90REF
(a)Annual rate from 2000 – 2050 (b)Annual rate from 2000 – 2100
23/04/18 16
Carbon Tax & Regional CO2 mitigation rateCarbon Tax & Regional CO2 mitigation rate
0
100
200
300
400
500
600
700
0 20 40 60 80 100 120
CO2 reduction from baseline in 2050 [%]
Car
bon
tax
in 2
050
(200
0US$/
tC)
WORLDALMASIAOECD90REF
0
100
200
300
400
500
600
700
0 20 40 60 80 100 120
CO2 reduction from baseline in 2100 [%]
Car
bon
tax
in 2
100
(200
0US$/
tC)
WORLDALMASIAOECD90REF
(a) Case in 2050 (b) Case in 2100
23/04/18 17
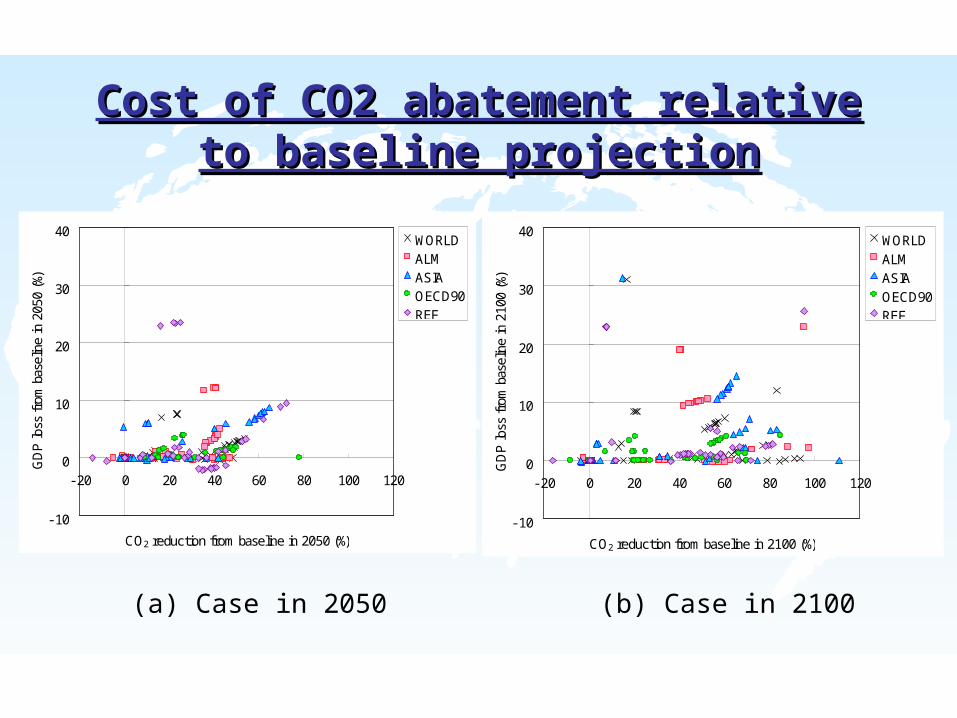
Cost of CO2 abatement relative to Cost of CO2 abatement relative to baseline projectionbaseline projection
- 10
0
10
20
30
40
- 20 0 20 40 60 80 100 120
CO2 reduction from baseline in 2050 (%)
GD
P lo
ss fr
om b
asel
ine
in 2
050
(%)
WORLDALMASIAOECD90REF
- 10
0
10
20
30
40
- 20 0 20 40 60 80 100 120
CO2 reduction from baseline in 2100 (%)
GD
P lo
ss fr
om b
asel
ine
in 2
100
(%)
WORLDALMASIAOECD90REF
(a) Case in 2050 (b) Case in 2100
23/04/18 18
ConclusionsConclusions
The development of the Emissions Scenarios Database would contribute to the understanding of future GHG emissions scenarios and can provide important insights for policy analysis. By updating the Database, it becomes available to analyze various new mitigation scenarios since TAR at the regional level as well as the global level
23/04/18 19
Future WorkFuture Work
This study is in an intermediate stage and there is This study is in an intermediate stage and there is
scope for further refinement.scope for further refinement.
◆ ◆ contact as many researchers as possible in the
world and collect and clarify more detailed datacollect and clarify more detailed data
◆◆ collect more data from regional or national
scenarios and analyze emission reduction factors analyze emission reduction factors
in detail at the sub-regional and national levelsin detail at the sub-regional and national levels
◆◆ pay attention to reduction measures for non-CO2 pay attention to reduction measures for non-CO2
emissionsemissions such as CH4, N2O, F gases etc
23/04/18 20
Special Thanks for Researchers’ Special Thanks for Researchers’ cooperation in this Databasecooperation in this Database