52
CHAPTER 6 REVENUE Chapter Page 6.1 Revenue Overview 225 6.2 Revenue and Forward Estimates 227 6.3 Taxation Reform 249 2016-17 Budget Paper No. 3 223 Revenue

CHAPTER 6
REVENUE
Chapter Page
6.1 Revenue Overview 225
6.2 Revenue and Forward Estimates 227
6.3 Taxation Reform 249
2016-17 Budget Paper No. 3 223 Revenue
2016-17 Budget Paper No. 3 224 Revenue
6.1 REVENUE OVERVIEW
Total ACT General Government Sector (GGS) revenue in 2016-17 is estimated to be $5.1 billion, compared with a 2015-16 estimated outcome of $4.7 billion.
The increase of $326 million primarily reflects increased current grants from the Commonwealth (consisting of $105.4 million more in Goods and Services Tax (GST) revenue, an additional $33.2 million in National Specific Purpose Payments, and an extra $32.1 million in National Partnership Payments – Capital), a $90.6 million increase in taxation revenue and $37.4 million extra from gains from contributed assets. Offsetting these increases are lower interest income ($17.6 million), and dividend and tax equivalents income ($14.6 million).
Over the forward estimates, total revenue is expected to grow at an average annual rate of 3.3 per cent.
This Budget continues the Government’s tax reform process. Insurance duties are fully abolished from 1 July 2016, while conveyance duties are being further reduced. More information on the Government’s taxation reform program is provided in Taxation Reform (Chapter 6.3).
2016-17 Budget and Forward Estimates RevenuesFigure 6.1.1 provides an overview of the sources of ACT Government revenue.
Figure 6.1.1: Components of the 2016-17 Budget General Government Sector Revenue
32%
41%
2%
10%
3%1%
8%
3%
0
10
20
30
40
50
Per c
ent
2016-17 Budget Paper No. 3 225 Revenue Overview

As can be seen from Figure 6.1.1, the majority of GGS revenue is from Commonwealth Grants (41 per cent) and own source taxation (32 per cent).
The ACT has a number of revenue raising disadvantages in comparison with other jurisdictions as a significant proportion of the Territory’s economic activity is generated by Commonwealth Government expenditure within the ACT.
Commonwealth employment, which contributes much of the Territory’s wages expenditure, is exempt from payroll tax. Moreover, the ACT has limited employment in manufacturing, agricultural and mining industries, important contributors to other jurisdictions’ payroll tax bases.
While the ACT is compensated for these limitations through the Commonwealth Grants Commission’s assessment process for allocating GST revenue, it nevertheless has comparatively less capacity and flexibility to raise own-source revenue than other jurisdictions.
Table 6.1.1 provides a summary of GGS revenue by source.
Table 6.1.1: General Government Sector Revenue
2015-16 Empty Cell 2015-16 2016-17 Empty Cell 2017-18 2018-19 2019-20Budget Empty Cell Est.
OutcomeBudget Var Estimate Estimate Estimate
$'000 Empty Cell $'000 $'000 % $'000 $'000 $'0001,491,730 Own Source
Taxation1,543,327 1,633,960 6 1,751,100 1,871,500 1,970,398
1,860,511 Commonwealth Grants1
1,874,723 2,087,251 11 2,162,771 2,200,391 2,293,328
109,573 Gains from Contributed Assets
118,429 155,806 32 98,906 124,785 100,206
482,202 Sales of Goods and Services
476,411 479,416 1 504,001 519,408 529,257
135,201 Interest Income 133,836 116,210 -13 117,197 106,154 112,56463,167 Distribution from
Financial Investments
28,300 36,391 29 45,293 47,615 50,573
329,428 Dividend and Income Tax Equivalents
420,448 405,808 -3 282,238 364,778 382,900
137,729 Other 136,956 143,342 5 142,321 144,619 142,5954,609,541 Total 4,732,430 5,058,184 7 5,103,827 5,379,250 5,581,821
Note:1. This amount includes the gross-up of the Goods and Services Tax (GST) on Non-Government Schools funding of
$18.2 million in 2015-16, $19.3 million in 2016-17, $19.9 million in 2017-18, $20.8 million in 2018-19 and $21.9 million in 2019-20.
Further detail on revenue lines is provided in Revenue and Forward Estimates (Chapter 6.2).
2016-17 Budget Paper No. 3 226 Revenue Overview
6.2 REVENUE AND FORWARD ESTIMATES
Own Source Taxation
The estimated outcome for own source taxation revenue in 2015-16 is $1.5 billion, which is $52 million higher than the 2015-16 Budget. The increase is largely due to higher than expected payroll tax and conveyance duties.
Total own source taxation revenue is forecast to increase to $1.6 billion in 2016-17 as a result of indexation and new initiatives, including the increased scope for the Lifetime Care and Support Levy to fund the extension of the Lifetime Care and Support Scheme to cover catastrophically injured workers, and a new Safer Families Levy. Table 6.2.1 provides the 2015-16 estimated outcome, the 2016-17 Budget and the forward estimates for own source taxation revenue.
Table 6.2.1: Own Source Taxation Revenue
2015-16 Empty Cell 2015-16 2016-17 Empty Cell 2017-18 2018-19 2019-20Budget Empty Cell Est.
OutcomeBudget Var Estimate Estimate Estimate
$'000 Empty Cell $'000 $'000 % $'000 $'000 $'000Empty Cell General Tax Empty Cell Empty Cell Empty Cell Empty Cell Empty Cell Empty Cell
402,250 Payroll Tax 421,825 439,977 4 468,230 506,069 543,3415,733 Tax Waivers 169 172 2 178 182 182
145,303 Commercial General Rates1
144,478 158,602 10 171,229 184,517 198,501
274,456 Residential General Rates1
274,764 288,578 5 316,805 345,290 371,163
94,069 Land Tax 99,069 110,345 11 130,079 138,212 144,195921,811 Total General Tax 940,305 997,673 6 1,086,522 1,174,270 1,257,383
Empty Cell Duties Empty Cell Empty Cell Empty Cell Empty Cell Empty Cell Empty Cell
62,033 Commercial Conveyances2
86,577 79,410 -8 74,820 72,894 72,598
167,024 Residential Conveyances2
181,593 187,564 3 196,905 206,769 212,930
12,964 General Insurance3 12,964 - -100 - - -873 Life Insurance3 873 - -100 - - -
30,286 Motor Vehicle Registrations and Transfers
27,644 30,630 11 31,325 32,390 33,490
273,180 Total Duties 309,652 297,605 -4 303,051 312,054 319,018Empty Cell Gambling Taxes Empty Cell Empty Cell Empty Cell Empty Cell Empty Cell Empty Cell
1,025 Tabcorp Licence Fee 1,025 1,032 1 1,058 1,084 1,11133,793 Gaming Tax 33,852 34,098 1 34,951 35,825 36,721
1,538 Casino Tax 2,238 2,254 1 2,310 2,368 2,42715,683 Interstate Lotteries 14,783 14,886 1 15,258 15,639 16,03052,039 Total Gambling Taxes 51,898 52,270 1 53,577 54,916 56,289
Empty Cell Other Taxes Empty Cell Empty Cell Empty Cell Empty Cell Empty Cell Empty Cell
121,013 Motor Vehicle Registration4
118,731 127,371 7 135,660 144,560 144,502
20,652 Ambulance Levy 20,652 22,694 10 24,281 25,424 26,69016,290 Lease Variation Charge5 5,057 17,744 251 18,454 19,377 20,346
2016-17 Budget Paper No. 3 227 Revenue and Forward Estimates

2015-16 Empty Cell 2015-16 2016-17 Empty Cell 2017-18 2018-19 2019-20Budget Empty Cell Est.
OutcomeBudget Var Estimate Estimate Estimate
$'000 Empty Cell $'000 $'000 % $'000 $'000 $'00026,980 Utilities (Network
Facilities) Tax27,653 30,049 9 31,546 33,132 34,784
54,411 Fire and Emergency Service Levy
54,348 64,487 19 73,315 82,332 85,192
1,806 City Centre Marketing and Improvements Levy
1,983 1,986 .. 1,989 1,992 1,995
3,548 Energy Industry Levy 3,548 3,637 3 3,728 3,821 3,917- Lifetime Care and
Support Levy69,500 13,744 45 14,277 14,822 15,382
- Safer Families Levy7 - 4,700 # 4,700 4,800 4,900244,700 Total Other Taxes 241,472 286,412 19 307,950 330,260 337,708
1,491,730 Total Taxation 1,543,327 1,633,960 6 1,751,100 1,871,500 1,970,398
Notes: Numbers may not add due to rounding.1. Variance is due to the increase in the number of rateable properties, the Wage Price Index and tax reform.2. Variance is due to a range of market factors, including changes in property prices, the numbers of properties sold and
the composition of property types transacted.3. Duty on insurance will be fully abolished on 1 July 2016.4. This includes revenue from the ‘ACT Compulsory Third-Party Insurance Regulator’.5. Excludes a payment of $12 million in 2015-16 to the Land Development Agency for a Deed of Variation on a property.6. The 2015-16 Budget of $9.850 million is included in Fees for Regulatory Services (Table 6.2.10). The levy was
reclassified as taxation revenue during 2015-16. The scope of the Lifetime Care and Support Scheme will be extended to include work accidents from 1 July 2016.
7. The Safer Families Levy will be introduced on 1 July 2016.
Payroll Tax
The ACT Government is increasing the payroll tax free threshold from $1.850 million to $2 million as of 1 July 2016 – refer to Revenue Initiatives (Chapter 3.4) for more information. The payroll tax rate remains unchanged at 6.85 per cent.
Payroll tax revenue in 2015-16 is estimated at $421.8 million, and is forecast to increase to $440 million in 2016-17. The increase of $18.2 million reflects forecast growth in employment and wages, and payroll tax compliance, partly offset by an increase in the payroll tax free threshold.
Tax Waivers
Tax waivers represent the amount of revenue that has been waived. The estimated value of waivers is also reflected in expenses. The grossing up of revenue and expenses enables tax treatments to be transparent.
The estimate at the 2015-16 Budget was $5.7 million and the 2015-16 estimated outcome is $0.2 million. The Government has decided to reclassify conveyance duty for home owners taking part in the Loose-fill Asbestos Insulation Eradication Scheme as revenue forgone rather than as a tax waiver. The variance is largely accounted for by this change. Waivers are forecast to return to trend levels from 2016-17.
2016-17 Budget Paper No. 3 228 Revenue and Forward Estimates

General Rates
General rates are levied on commercial and residential property owners to provide funding for a wide range of services for the ACT community.
Increases in general rates revenue are due to the indexation of revenue from existing properties by the Wage Price Index, expected revenue from new properties, as well as tax reform.
The 2015-16 estimated outcome for general rates revenue is $419.2 million. This is forecast to increase to $447.2 million in 2016-17 reflecting tax reform increases of around 4.5 per cent on average for residential properties and 7 per cent on average for commercial properties.
The Government will change the early payment discount from 1 July 2016. The current discount of 3 per cent will be reduced to 2 per cent, reflecting the current environment of low interest rates. The continuation of a discount will provide a financial incentive for early payment. Refer to Revenue Initiatives (Chapter 3.4) for more information.
The rating system in 2016-17 will have the following elements:
a fixed charge of:
- $765 for residential properties;
- $150 for rural properties; and
- $2,235 for commercial properties.
a valuation based charge on the Average Unimproved Land Value (AUV) for 2016 (which is the average of 2014, 2015 and 2016 land values);
marginal rating factors applied to the AUV of residential properties (refer to Table 6.2.2):
Table 6.2.2: Residential General Rates Marginal Rates
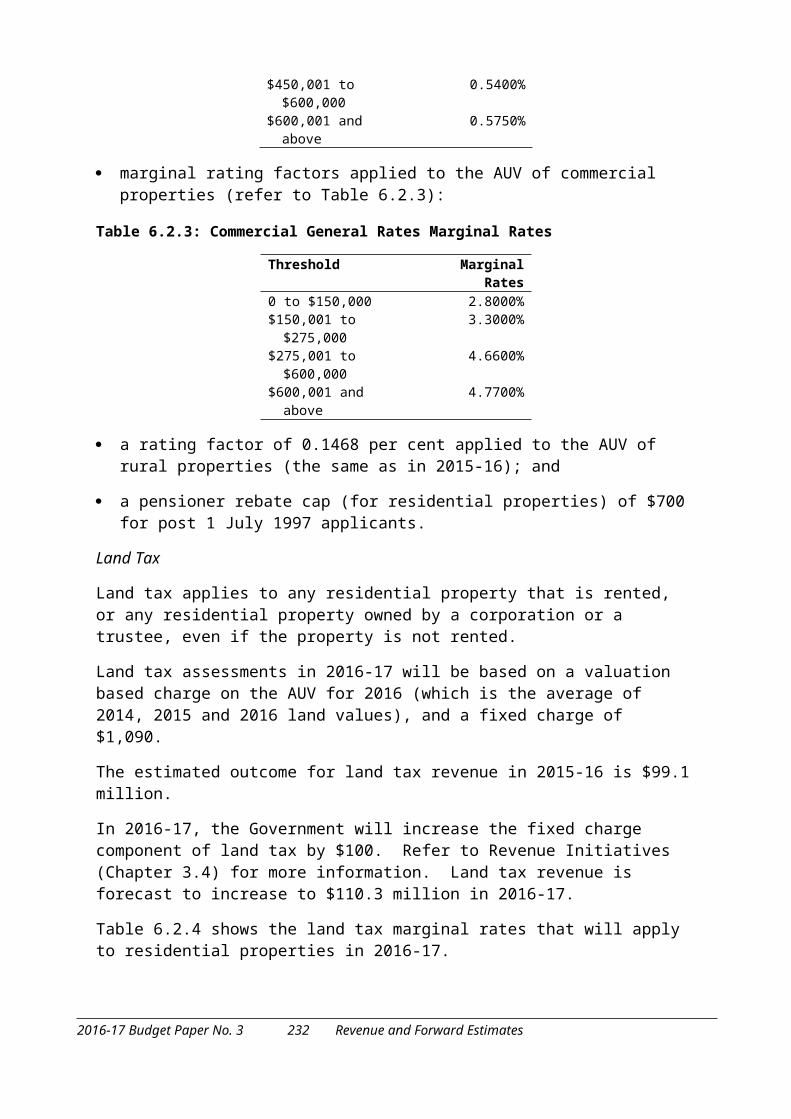
Threshold Marginal Rates0 to $150,000 0.2746%$150,001 to $300,000 0.3900%$300,001 to $450,000 0.4800%$450,001 to $600,000 0.5400%$600,001 and above 0.5750%
marginal rating factors applied to the AUV of commercial properties (refer to Table 6.2.3):
Table 6.2.3: Commercial General Rates Marginal Rates
Threshold Marginal Rates0 to $150,000 2.8000%$150,001 to $275,000 3.3000%$275,001 to $600,000 4.6600%$600,001 and above 4.7700%
2016-17 Budget Paper No. 3 229 Revenue and Forward Estimates

a rating factor of 0.1468 per cent applied to the AUV of rural properties (the same as in 2015-16); and
a pensioner rebate cap (for residential properties) of $700 for post 1 July 1997 applicants.
Land Tax
Land tax applies to any residential property that is rented, or any residential property owned by a corporation or a trustee, even if the property is not rented.
Land tax assessments in 2016-17 will be based on a valuation based charge on the AUV for 2016 (which is the average of 2014, 2015 and 2016 land values), and a fixed charge of $1,090.
The estimated outcome for land tax revenue in 2015-16 is $99.1 million.
In 2016-17, the Government will increase the fixed charge component of land tax by $100. Refer to Revenue Initiatives (Chapter 3.4) for more information. Land tax revenue is forecast to increase to $110.3 million in 2016-17.
Table 6.2.4 shows the land tax marginal rates that will apply to residential properties in 2016-17.
Table 6.2.4: Land Tax – Marginal Rates
Threshold Marginal Rates$0 to $75,000 0.41%$75,001 to $150,000 0.48%$150,001 to $275,000 0.61%$275,001+ 1.23%
Duty on Conveyances
Duty is levied on the agreement for the sale or transfer of land, a Crown lease or a land use entitlement for residential and commercial properties located in the ACT.
The duty rates are generally applied to the transfer value of the property. A concessional rate applies for persons qualifying under the ACT Home Buyer Concession Scheme, the ACT Pensioner Duty Concession Scheme, the Over 60s Home Bonus Scheme, or the Disability Duty Concession Scheme.
The rates of conveyance duty will continue to be reduced over a 20 year period as a key part of the ACT tax reform program. Table 6.2.5 outlines conveyance duty thresholds and rates for 2015-16 and 2016-17. The 2016-17 rates will apply from 8 June 2016.
2016-17 Budget Paper No. 3 230 Revenue and Forward Estimates
Table 6.2.5: Conveyance Duty Thresholds and Rates
Threshold 2015-16%
2016-17%
Up to $200,000 1.8 1.48$200,001 to $300,000 3.0 2.5$300,001 to $500,000 4.0 4.0$500,001 to $750,000 5.0 5.0$750,001 to $1,000,000 6.5 6.5$1,000,001 to $1,454,999 7.0 7.0$1,455,000 and above1 5.17 5.09
Note:1. The $1,455,000 and above rate is a flat rate.
Commercial conveyance duty
The revenue from commercial conveyance duty is estimated at $86.6 million in 2015-16. This is forecast to decrease to $79.4 million in 2016-17, largely reflecting a moderating of activity from 2015-16 levels.
For Stage Two of tax reform, conveyance duty for commercial property transactions below $1.5 million will be phased out over two years. A flat rate of 5 per cent will apply to the entire value of commercial property transactions over $1.5 million. Refer to Revenue Initiatives (Chapter 3.4) for more information.
Residential conveyance duty
The estimated outcome for residential conveyance duty in 2015-16 is $181.6 million and is forecast to increase to $187.6 million in 2016-17.
Residential conveyance duty rates will further reduce in the 2016-17 Budget, as previously announced, and over the next five year period of tax reform. Refer to Revenue Initiatives (Chapter 3.4) for more information on this initiative.
Duty on Motor Vehicle Registrations and Transfers
Duty is payable on an application to register a new motor vehicle or to transfer the registration of a second hand vehicle.
The estimated outcome for 2015-16 is $27.6 million and the forecast for 2016-17 is $30.6 million.
Tabcorp Licence Fee
The ACT receives an annual totalisator licence fee from Tabcorp for the provision of totalisator services in the Territory. Estimated revenue for 2015-16 is $1.025 million and is subject to annual indexation.
2016-17 Budget Paper No. 3 231 Revenue and Forward Estimates
Gaming Tax
Gaming tax revenue incorporates gaming machine taxes and interactive gaming taxes. Gaming machines are taxed on the basis of monthly revenue, which is defined as monthly gaming machine revenue less amounts paid out in prize money. Estimated total gaming tax revenue for 2015-16 is $33.9 million and the forecast for 2016-17 is $34.1 million.
Casino Tax
The tax applying to Casino Canberra is 10.9 per cent of gross profits from general gaming operations. Estimated revenue for 2015-16 is $2.2 million and the forecast for 2016-17 is $2.3 million.
Interstate Lotteries
The ACT receives revenue based on the value of NSW Lotteries tickets purchased in the ACT. Estimated revenue for 2015-16 is $14.8 million and the forecast for 2016-17 is $14.9 million.
Motor Vehicle Registration Fees
Estimated revenue from motor vehicle registrations in 2015-16 is $118.7 million and forecast to increase to $127.4 million in 2016-17. The increase of $8.6 million is mainly due to a 5 per cent indexation of registration fees. The estimate includes an allowance for growth in the number of motor vehicle registrations.
Ambulance Levy
The Ambulance Levy is payable each month by private health insurance companies to offset the cost of providing ambulance services in the Territory. The levy is calculated on the number and type of private health insurance contributions.
The estimated revenue for 2015-16 is $20.7 million and the forecast for 2016-17 is $22.7 million. The increase is partially due to an increase in the Ambulance Levy by $5 per year for individuals and $10 per year for families, commencing on 1 January 2017. Refer to Revenue Initiatives (Chapter 3.4) for more information on this initiative.
Lease Variation Charge
The estimated revenue for the Lease Variation Charge (LVC) for 2015-16 is estimated at $5.1 million. In addition, and not reflected in the LVC estimate, is a deed of variation on a property which resulted in a payment to the Land Development Agency (LDA) of $12 million. The deed of variation reflected an uplift in the value of development rights on a holding lease and was based on the calculation of the LVC. This revenue would have been recorded as a LVC if the uplift in value had applied to a Crown lease rather than a holding lease.
The revenue from the LVC in 2016-17 is forecast to be $17.7 million.
2016-17 Budget Paper No. 3 232 Revenue and Forward Estimates

Utilities (Network Facilities) Tax
The Utilities (Network Facilities) Tax (UNFT) applies to the owner of a utility network facility that is installed on or under land in the ACT. The 2015-16 estimated outcome is $27.7 million, and is forecast to increase to $30 million in 2016-17.
The Government indexed the UNFT by an additional 5 per cent for the year ending March 2017 (a total increase of 10 per cent). This was announced in the 2015-16 Budget Review. The UNFT will revert to the current annual 5 per cent indexation from 2017-18.
Fire and Emergency Services Levy
A Fire and Emergency Services Levy (FESL) is charged on all rateable properties in the ACT. The revenue raised from the FESL is used to support the Emergency Services Agency to deliver high quality and effective services.
The estimates for FESL revenue include expected revenue from both existing and new properties, and represent the net amount after allowing for pensioner rebates and discounts for early payment. The estimated outcome from FESL revenue is $54.3 million in 2015-16 and $64.5 million for 2016-17.
The increase in 2016-17 is largely due to an increase in the fixed charge for residential and rural properties and an increase in the marginal rates of FESL for commercial properties.
The Government will increase FESL for residential and rural properties by around $10 from 2016-17. The ACT Government is transitioning the Emergency Services Agency to a more sustainable funding model so that, in total, by 2018-19 the FESL and other emergency services charges (the Road Rescue Fee and the Ambulance Levy) will account for approximately 75 to 80 per cent of the total cost of delivering emergency services to the Canberra community, which is the standard used by other jurisdictions across Australia.
The FESL in 2016-17 will have the following elements:
a fixed charge of $252 for residential and rural properties;
a pensioner rebate of $98; and
a valuation-based charge for commercial properties with progressive marginal rating factors applied to the average of the 2014, 2015 and 2016 AUVs.
Refer to Revenue Initiatives (Chapter 3.4) for more information on this initiative.
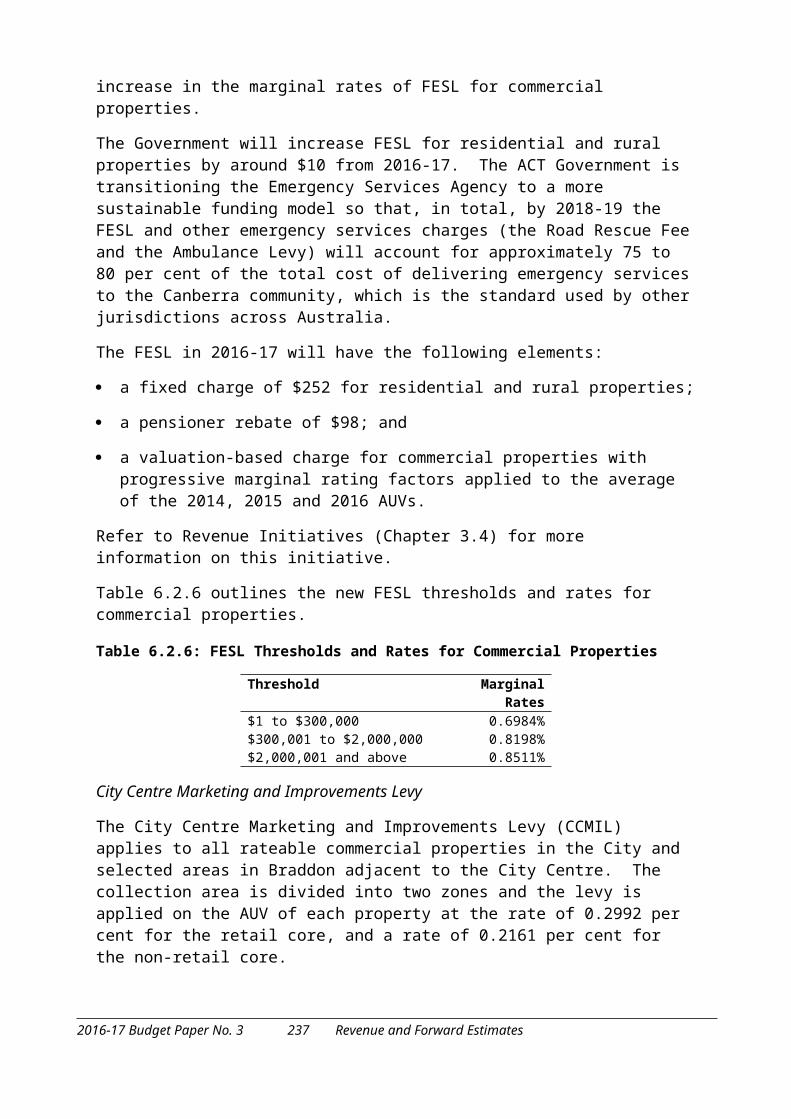
Table 6.2.6 outlines the new FESL thresholds and rates for commercial properties.
Table 6.2.6: FESL Thresholds and Rates for Commercial Properties
Threshold Marginal Rates$1 to $300,000 0.6984%$300,001 to $2,000,000 0.8198%$2,000,001 and above 0.8511%
2016-17 Budget Paper No. 3 233 Revenue and Forward Estimates

City Centre Marketing and Improvements Levy
The City Centre Marketing and Improvements Levy (CCMIL) applies to all rateable commercial properties in the City and selected areas in Braddon adjacent to the City Centre. The collection area is divided into two zones and the levy is applied on the AUV of each property at the rate of 0.2992 per cent for the retail core, and a rate of 0.2161 per cent for the non-retail core.
The revenue collected from the CCMIL is used to promote, maintain and improve the amenities of the City Centre area. The estimated outcome for 2015-16 is $2 million and the forecast for 2016-17 is also $2 million.
Energy Industry Levy
The Energy Industry Levy funds:
the Territory’s national regulatory obligations and costs for the Australian Energy Market Commission and the Ministerial Council on Energy’s responsibilities under the Australian Energy Market Agreement; and
local regulatory costs incurred by the Territory in relation to energy utility services.
The levy applies to the energy utility industry sectors of: electricity distribution; electricity supply; gas distribution; and gas supply. The estimated outcome for 2015-16 is $3.5 million and the forecast for 2016-17 is $3.6 million.
Lifetime Care and Support Levy
The Lifetime Care and Support (LTCS) Levy funds the Lifetime Care and Support Scheme which provides ongoing treatment and care to people catastrophically injured in the ACT from either a motor vehicle accident or a work accident (from 1 July 2016).
The estimated outcome for 2015-16 is $9.5 million and the forecast for 2016-17 is $13.7 million. The increase of $4.2 million largely reflects a new LTCS levy on workers’ compensation insurers and self-insurers, and a $1 increase in the LTCS levy applying to Compulsory-Third Party (CTP) Insurance policies issued under the Road Transport (Third-Party Insurance) Act 2008. The concessional levy on vehicles registered under the ACT’s Veteran, Vintage and Historic registration scheme will remain unchanged in 2016-17 at $7 per year.
Safer Families Levy
The Government will introduce a Safer Families Levy on 1 July 2016. The Levy will be $30 per year and will be applied to all residential and rural properties. The forecast revenue from the Levy in 2016-17 is $4.7 million. The Safer Families Levy will support a range of important measures to prevent and respond to family violence. Refer to Revenue Initiatives (Chapter 3.4) for more information.
2016-17 Budget Paper No. 3 234 Revenue and Forward Estimates
ACT Taxes Compared to NSW
Table 6.2.7 shows the comparative rates of tax between the ACT and NSW for major taxation items. Note that the release of the 2016-17 NSW Budget in June 2016 may change the information below.
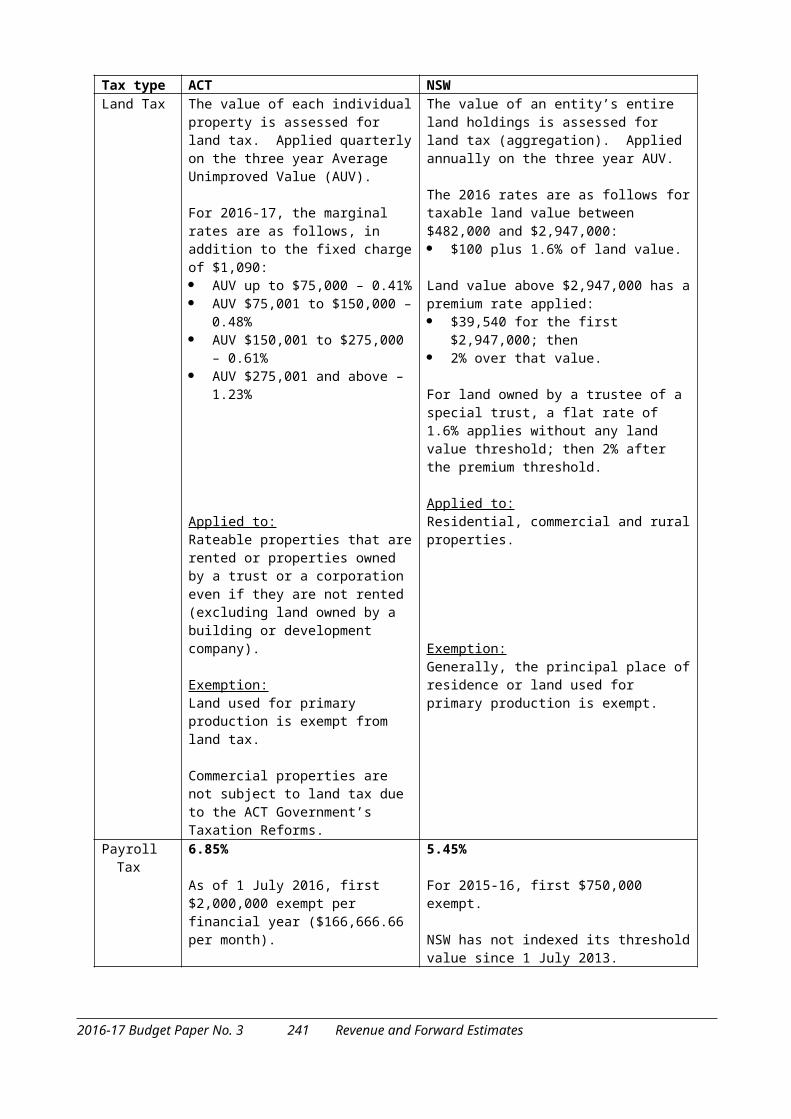
Table 6.2.7: Major ACT Taxes compared with NSW
Tax type ACT NSWLand Tax The value of each individual property is
assessed for land tax. Applied quarterly on the three year Average Unimproved Value (AUV).
For 2016-17, the marginal rates are as follows, in addition to the fixed charge of $1,090: AUV up to $75,000 – 0.41% AUV $75,001 to $150,000 – 0.48% AUV $150,001 to $275,000 – 0.61% AUV $275,001 and above – 1.23%
Applied to:Rateable properties that are rented or properties owned by a trust or a corporation even if they are not rented (excluding land owned by a building or development company).
Exemption:Land used for primary production is exempt from land tax.
Commercial properties are not subject to land tax due to the ACT Government’s Taxation Reforms.
The value of an entity’s entire land holdings is assessed for land tax (aggregation). Applied annually on the three year AUV.
The 2016 rates are as follows for taxable land value between $482,000 and $2,947,000: $100 plus 1.6% of land value.
Land value above $2,947,000 has a premium rate applied: $39,540 for the first $2,947,000; then 2% over that value.
For land owned by a trustee of a special trust, a flat rate of 1.6% applies without any land value threshold; then 2% after the premium threshold.
Applied to:Residential, commercial and rural properties.
Exemption:Generally, the principal place of residence or land used for primary production is exempt.
Payroll Tax 6.85%
As of 1 July 2016, first $2,000,000 exempt per financial year ($166,666.66 per month).
5.45%
For 2015-16, first $750,000 exempt.
NSW has not indexed its threshold value since 1 July 2013.
2016-17 Budget Paper No. 3 235 Revenue and Forward Estimates

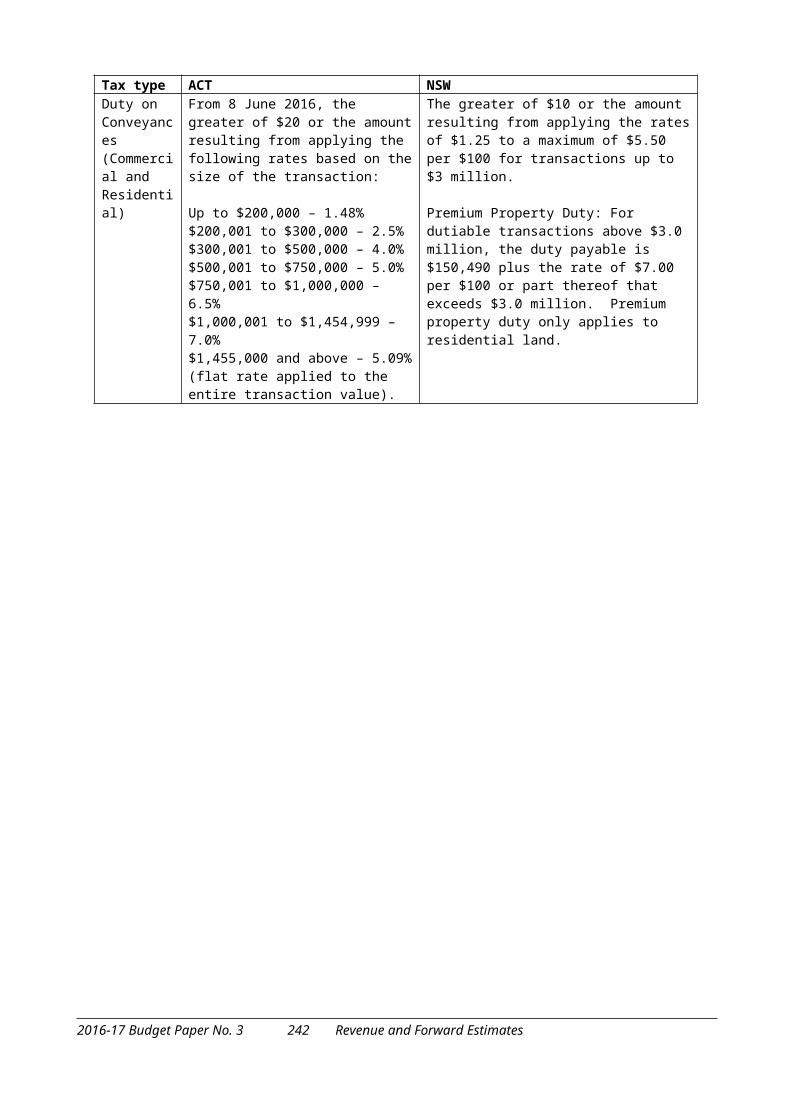
Tax type ACT NSWDuty on Conveyances(Commercial and Residential)
From 8 June 2016, the greater of $20 or the amount resulting from applying the following rates based on the size of the transaction:
Up to $200,000 – 1.48% $200,001 to $300,000 – 2.5%$300,001 to $500,000 – 4.0%$500,001 to $750,000 – 5.0%$750,001 to $1,000,000 – 6.5%$1,000,001 to $1,454,999 – 7.0%$1,455,000 and above – 5.09% (flat rate applied to the entire transaction value).
The greater of $10 or the amount resulting from applying the rates of $1.25 to a maximum of $5.50 per $100 for transactions up to $3 million.
Premium Property Duty: For dutiable transactions above $3.0 million, the duty payable is $150,490 plus the rate of $7.00 per $100 or part thereof that exceeds $3.0 million. Premium property duty only applies to residential land.
Concessions on Conveyances
Home Buyer Concession Scheme (HBCS):For transactions dated from 8 June 2016: concession for house and land value
up to $585,000; and concession for vacant land value up
to $317,600.
Pensioner Duty Concession Scheme (PDCS):For transactions dated from 8 June 2016: concession for house and land value
up to $865,000. concession for vacant land value up
to $419,900.
Over 60s Home Bonus Scheme: This scheme was introduced on 4 June 2014 and expires on 31 December 2016. It is similar to the PDCS, for non-pensioners who are aged 60 years and over. All other criteria are the same as the PDCS.For transactions dated from 8 June 2016: concession for house and land
values up to $865,000. concession for vacant land values up
to $419,900.
The property value thresholds for the HBCS, PDCS and Over 60s Home Bonus are determined biannually, taking into account movements in the market.
First Home – New Home Scheme:The First Home – New Home scheme provides that an agreement or transfer will only be eligible for a concession or exemption if it is for the acquisition of a new home or vacant land intended to be used as the site for a new home. A duty concession is not available for established properties.
Eligible first home buyers will not pay duty on a new home or off the plan purchase valued up to $550,000 with a phase-out concession up to a property value cap of $650,000. For vacant land, no duty is payable for a value up to $350,000 and is phased out at $450,000. These rates have applied from 1 July 2012.
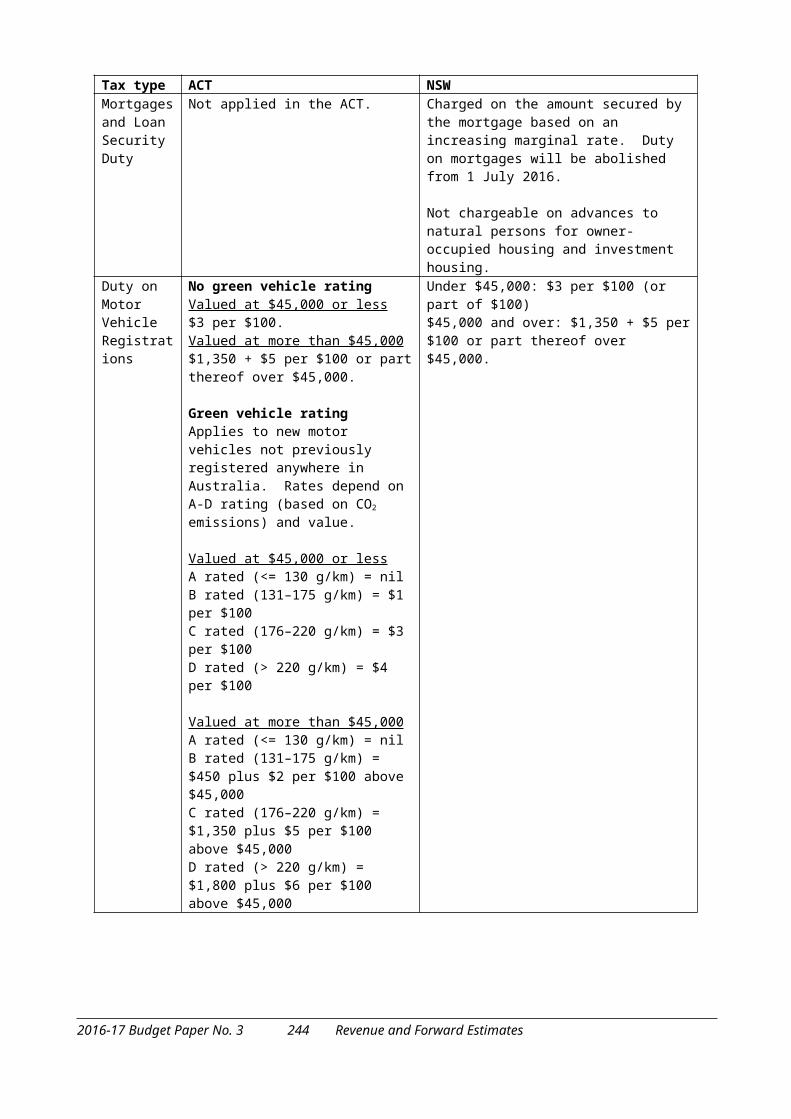
Mortgages and Loan Security Duty
Not applied in the ACT. Charged on the amount secured by the mortgage based on an increasing marginal rate. Duty on mortgages will be abolished from 1 July 2016.
Not chargeable on advances to natural persons for owner-occupied housing and investment housing.
2016-17 Budget Paper No. 3 236 Revenue and Forward Estimates
Tax type ACT NSWDuty on Motor Vehicle Registrations
No green vehicle ratingValued at $45,000 or less$3 per $100.Valued at more than $45,000$1,350 + $5 per $100 or part thereof over $45,000.
Green vehicle ratingApplies to new motor vehicles not previously registered anywhere in Australia. Rates depend on A-D rating (based on CO2 emissions) and value.
Valued at $45,000 or lessA rated (<= 130 g/km) = nilB rated (131–175 g/km) = $1 per $100C rated (176–220 g/km) = $3 per $100D rated (> 220 g/km) = $4 per $100
Valued at more than $45,000A rated (<= 130 g/km) = nilB rated (131–175 g/km) = $450 plus $2 per $100 above $45,000C rated (176–220 g/km) = $1,350 plus $5 per $100 above $45,000D rated (> 220 g/km) = $1,800 plus $6 per $100 above $45,000
Under $45,000: $3 per $100 (or part of $100)$45,000 and over: $1,350 + $5 per $100 or part thereof over $45,000.
Duty on General Insurance
Duty on general insurance has been abolished, effective from 1 July 2016.
2.5% to 9% of the premium, depending on the type of insurance.
Type A insurance (e.g. a property and items not covered by Type B & C insurance): 9 per cent.
Type B insurance (e.g. a vehicle): 5 per cent.
Type C insurance (e.g. livestock): 2.5 per cent.Duty on Life Insurance
Duty on life insurance has been abolished, effective from 1 July 2016.
Term, temporary or insurance rider policies5% of the first year’s premium.
Trauma or disability policies5% of premium paid to effect the insurance.
All other (e.g. life insurance)Sum insured $0 to $2,000 - $1 Sum insured over $2,000 - $1 plus $0.20 per $200 or part thereof in excess of $2,000.
2016-17 Budget Paper No. 3 237 Revenue and Forward Estimates
Commonwealth Government Grants
Total revenue expected to be received from Commonwealth Government grants in 2016-17 is $2.1 billion1. Details of Commonwealth Government grants are provided in Table 6.2.8.
Further information on funding for Commonwealth Government grants can be found in Federal Financial Relations (Chapter 7).
Table 6.2.8: Commonwealth Government Grants
2015-16 Empty Cell 2015-16 2016-17 Empty Cell 2017-18 2018-19 2019-20Budget Empty Cell Est.
OutcomeBudget Var Estimate Estimate Estimate
$'000 Empty Cell $'000 $'000 % $'000 $'000 $'000Empty Cell Current Grants Empty Cell Empty Cell Empty Cell Empty Cell Empty Cell Empty Cell
1,032,368 GST Revenue Grant 1,049,000 1,154,400 10 1,215,700 1,279,100 1,334,50038,515 ACT Municipal Services 38,500 39,100 2 39,600 40,200 40,900
659,033 National Specific Purpose Payments (SPPs)
677,180 710,373 5 719,442 758,605 797,485
48,562 Financial Assistance Grants to Local Government
24,283 48,611 100 50,530 52,452 54,527
30,519 National Partnership Payments (NPPs) – Current1
32,130 48,864 52 63,796 26,146 25,112
11,677 Other Commonwealth Government Payments – Current
11,676 11,881 2 11,871 11,391 11,686
1,820,674 Total Current Grants 1,832,769 2,013,229 10 2,100,939 2,167,894 2,264,210Empty Cell Empty Cell Empty Cell Empty Cell Empty Cell Empty Cell Empty Cell Empty Cell
Empty Cell Capital Grants Empty Cell Empty Cell Empty Cell Empty Cell Empty Cell Empty Cell
39,837 National Partnership Payments (NPPs) – Capital1
41,954 74,022 76 61,832 32,497 29,118
39,837 Total Capital Grants 41,954 74,022 76 61,832 32,497 29,118Empty Cell Empty Cell Empty Cell Empty Cell Empty Cell Empty Cell Empty Cell Empty Cell
1,860,511 Total Commonwealth Government Funding2
1,874,723 2,087,251 11 2,162,771 2,200,391 2,293,328
Notes:1. An adjustment was made to the published 2015-16 Budget amounts reflecting a reclassification of $1.66 million from
capital to recurrent funding for Sustainable Rural Water Use.2. This amount includes the gross-up of the Goods and Services Tax (GST) on Non-Government Schools funding of
$18.2 million in 2015-16, $19.3 million in 2016-17, $19.9 million in 2017-18, $20.8 million in 2018-19 and $21.9 million in 2019-20.
1 Includes the gross-up of GST on Non-Government Schools funding.
2016-17 Budget Paper No. 3 238 Revenue and Forward Estimates
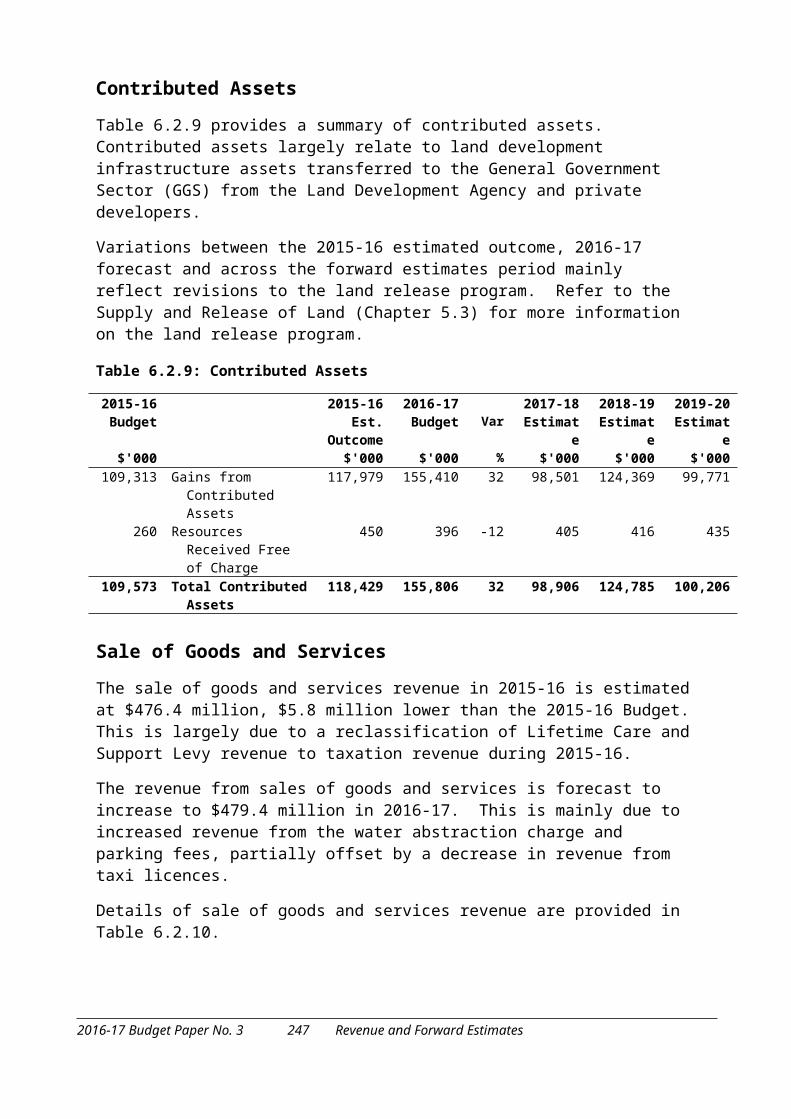
Contributed Assets
Table 6.2.9 provides a summary of contributed assets. Contributed assets largely relate to land development infrastructure assets transferred to the General Government Sector (GGS) from the Land Development Agency and private developers.
Variations between the 2015-16 estimated outcome, 2016-17 forecast and across the forward estimates period mainly reflect revisions to the land release program. Refer to the Supply and Release of Land (Chapter 5.3) for more information on the land release program.
Table 6.2.9: Contributed Assets
2015-16 Empty Cell 2015-16 2016-17 Empty Cell 2017-18 2018-19 2019-20Budget Empty Cell Est.
OutcomeBudget Var Estimate Estimate Estimate
$'000 Empty Cell $'000 $'000 % $'000 $'000 $'000109,313 Gains from Contributed
Assets117,979 155,410 32 98,501 124,369 99,771
260 Resources Received Free of Charge
450 396 -12 405 416 435
109,573 Total Contributed Assets 118,429 155,806 32 98,906 124,785 100,206
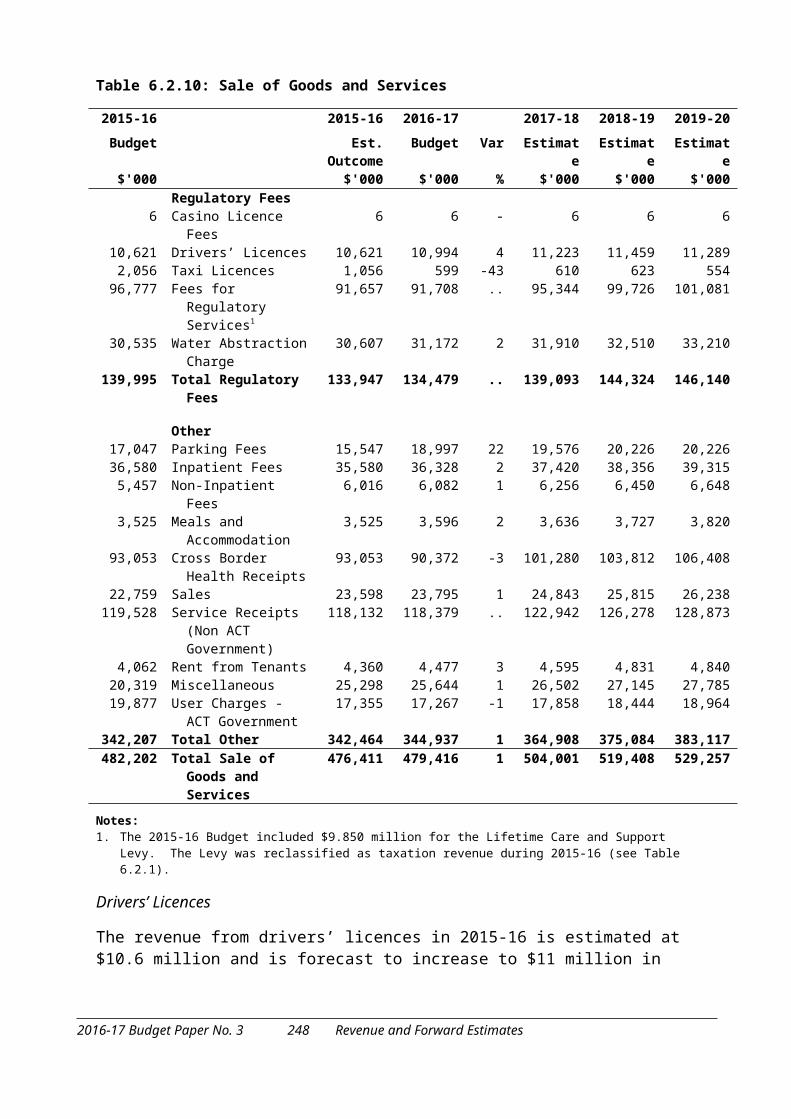
Sale of Goods and Services
The sale of goods and services revenue in 2015-16 is estimated at $476.4 million, $5.8 million lower than the 2015-16 Budget. This is largely due to a reclassification of Lifetime Care and Support Levy revenue to taxation revenue during 2015-16.
The revenue from sales of goods and services is forecast to increase to $479.4 million in 2016-17. This is mainly due to increased revenue from the water abstraction charge and parking fees, partially offset by a decrease in revenue from taxi licences.
Details of sale of goods and services revenue are provided in Table 6.2.10.
2016-17 Budget Paper No. 3 239 Revenue and Forward Estimates

Table 6.2.10: Sale of Goods and Services
2015-16 Empty Cell 2015-16 2016-17 Empty Cell 2017-18 2018-19 2019-20Budget Empty Cell Est.
OutcomeBudget Var Estimate Estimate Estimate
$'000 Empty Cell $'000 $'000 % $'000 $'000 $'000Empty Cell Regulatory Fees Empty Cell Empty Cell Empty Cell Empty Cell Empty Cell Empty Cell
6 Casino Licence Fees 6 6 - 6 6 610,621 Drivers’ Licences 10,621 10,994 4 11,223 11,459 11,289
2,056 Taxi Licences 1,056 599 -43 610 623 55496,777 Fees for Regulatory
Services191,657 91,708 .. 95,344 99,726 101,081
30,535 Water Abstraction Charge
30,607 31,172 2 31,910 32,510 33,210
139,995 Total Regulatory Fees 133,947 134,479 .. 139,093 144,324 146,140Empty Cell Empty Cell Empty Cell Empty Cell Empty Cell Empty Cell Empty Cell Empty Cell
Empty Cell Other Empty Cell Empty Cell Empty Cell Empty Cell Empty Cell Empty Cell
17,047 Parking Fees 15,547 18,997 22 19,576 20,226 20,22636,580 Inpatient Fees 35,580 36,328 2 37,420 38,356 39,315
5,457 Non-Inpatient Fees 6,016 6,082 1 6,256 6,450 6,6483,525 Meals and
Accommodation3,525 3,596 2 3,636 3,727 3,820
93,053 Cross Border Health Receipts
93,053 90,372 -3 101,280 103,812 106,408
22,759 Sales 23,598 23,795 1 24,843 25,815 26,238119,528 Service Receipts (Non
ACT Government)118,132 118,379 .. 122,942 126,278 128,873
4,062 Rent from Tenants 4,360 4,477 3 4,595 4,831 4,84020,319 Miscellaneous 25,298 25,644 1 26,502 27,145 27,78519,877 User Charges - ACT
Government17,355 17,267 -1 17,858 18,444 18,964
342,207 Total Other 342,464 344,937 1 364,908 375,084 383,117482,202 Total Sale of Goods and
Services476,411 479,416 1 504,001 519,408 529,257
Notes:1. The 2015-16 Budget included $9.850 million for the Lifetime Care and Support Levy. The Levy was reclassified as
taxation revenue during 2015-16 (see Table 6.2.1).
Drivers’ Licences
The revenue from drivers’ licences in 2015-16 is estimated at $10.6 million and is forecast to increase to $11 million in 2016-17. This increase largely reflects a 5 per cent increase in driver licence fees from 2016-17.
Taxi Licences
The revenue from taxi licences in 2015-16 is estimated at $1.1 million and is forecast to decrease to $0.6 million in 2016-17. The reduction of $0.5 million is mainly due to the Government’s taxi industry innovation reforms.
2016-17 Budget Paper No. 3 240 Revenue and Forward Estimates
Fees for Regulatory Services
The 2015-16 estimated outcome for fees for regulatory services is $91.7 million which is $5.1 million below the original 2015-16 Budget. This largely reflects the inclusion of the LTCS Levy of $9.850 million in the original 2015-16 Budget, which was reclassified as taxation revenue during 2015-16. Fees for regulatory services are forecast to be $91.7 million in 2016-17.
Water Abstraction Charge
The revenue from the Water Abstraction Charge (WAC) in 2015-16 is estimated at $30.6 million and is forecast to increase to $31.2 million in 2016-17. This increase is due to an expected increase in the volume of water consumption and the 2 per cent indexation per annum commencing in 2016-17 that was announced in the 2015-16 Budget Review.
Parking Fees
The estimated revenue from parking fees in 2015-16 is $15.5 million and the forecast for 2016-17 is $19 million. The increase of $3.5 million is mainly due to the installation of modern parking machines, fee increases, and temporarily closed parking sites being re-opened.
Patient Fees
Inpatient fees and non-inpatient fees are payments for the provision of hospital and related services, which are collected at the Canberra Hospital. Patient fees relate to admitted patients, while non-inpatient fees are primarily for accident and emergency services.
The 2015-16 estimated outcome is $35.6 million for inpatient fees and $6 million for non-inpatient fees. The 2016-17 estimates are $36.3 million and $6.1 million, respectively.
Cross Border Health Receipts
Cross Border Health Receipts are payments from other State and Territory Governments (predominantly NSW) for the provision of medical services provided to non-ACT residents at ACT public hospitals. The estimated revenue for 2015-16 is $93.1 million and the forecast for 2016-17 is $90.4 million. These amounts only reflect the level of revenue estimated to be received directly from other States and the Northern Territory; the balance of cross border revenue is received via the Commonwealth. The overall level of Cross Border revenue (including the components received from the Commonwealth) is expected to increase year on year.
In 2016-17, the Commonwealth agreed with the States and Territories to adopt interim funding arrangements for public hospitals, including a continuation of Activity Based Funding whereby Commonwealth funds for cross border patients are received directly from the Commonwealth. Previously, ACT Budget estimates from 2017-18 onwards were premised on the 2014-15 Federal Budget decision that States were required to seek reimbursement directly from other jurisdictions from 1 July 2017.
2016-17 Budget Paper No. 3 241 Revenue and Forward Estimates
Sales
Revenues from sales include those generated from entry fees to sporting and cultural facilities, such as the Canberra Theatre Centre and hire of those venues. Sales of merchandise, programs and giftware in these venues or the rights to sell these, are also included. The estimated outcome for 2015-16 is $23.6 million and the forecast for 2016-17 is $23.8 million.
Service Receipts (non-ACT Government)
This item includes payments from clients for the provision of services, such as facility fees to physicians at hospitals, medical supplies, sterilising services, Capital Linen and commercial training.
The 2015-16 estimated outcome is $118.1 million and the 2016-17 forecast is $118.4 million.
Miscellaneous
Miscellaneous revenue is estimated at $25.3 million in 2015-16 and the 2016-17 forecast is $25.6 million.
User Charges – ACT Government
This item includes revenue for rent, property management, shared services and insurance that is collected from ACT agencies in the Public Trading Enterprise sector. The 2015-16 estimated outcome is $17.4 million and the 2016-17 forecast is $17.3 million.
Interest Income
Table 6.2.11 provides a summary of interest expected to be received.
Table 6.2.11: Interest Income
2015-16 Empty Cell 2015-16 2016-17 Empty Cell 2017-18 2018-19 2019-20Budget Empty Cell Est.
OutcomeBudget Var Estimate Estimate Estimate
$'000 Empty Cell $'000 $'000 % $'000 $'000 $'000Empty Cell Interest Received Empty Cell Empty Cell Empty Cell Empty Cell Empty Cell Empty Cell
41,439 Interest Received from Banks
51,712 31,200 -40 25,400 24,912 28,728
79,145 Interest Received on Advances and Loans to Agencies
71,178 77,374 9 85,027 75,089 76,588
1,786 Interest Received on Advances from Private Sector – Non Banks
1,725 - -100 - - -
6,533 Interest Received – Other
7,201 4,781 -34 3,957 3,190 4,094
6,298 Interest from Financial Investments
2,020 2,855 41 2,813 2,963 3,154
135,201 Total Interest Received 133,836 116,210 -13 117,197 106,154 112,564
2016-17 Budget Paper No. 3 242 Revenue and Forward Estimates

Interest Received from Banks
This item represents the interest income for general government investments and interest earnings on cash balances held in bank accounts. General government investments comprise the balances of the Territory Banking Account and investments made on behalf of government directorates and some Territory Authorities.
The increase of $10.3 million in the 2015-16 estimated outcome from the 2015-16 Budget is mainly due to higher investment balances and returns. The decrease of $20.5 million in the 2016-17 forecast from the 2015-16 estimated outcome mainly reflects estimated lower investment balances and rate of return.
Interest Received on Advances and Loans to Agencies
Interest received on advances and loans to agencies mainly relates to interest loans provided by the Territory to Icon Water.
The decrease of $8 million in the 2015-16 estimated outcome from the original budget is mainly due to lower interest receipts on inflation linked loans due to a lower Consumer Price Index during the year, and the timing and a lower amount of new loan funding to Icon Water.
The increase of $6.2 million in the 2016-17 forecast from the 2015-16 estimated outcome mainly reflects higher interest receipts due to a higher balance of outstanding loans with Icon Water.
Interest Received from the Private Sector
The decrease of $1.7 million in the 2016-17 Budget from the 2015-16 estimated outcome reflects the repayment of all outstanding loans by the University of Canberra.
Other Interest Income
Other interest income includes income mainly recognised by the Chief Minister, Treasury and Economic Development Directorate, the Transport Canberra and City Services Directorate, and the Environment and Planning Directorate. The majority of interest recognised relates to interest charged to the LDA in relation to the holding costs of land.
The estimated outcome for 2015-16 is $7.2 million, and the forecast for 2016-17 is $4.8 million.
Interest from Financial Investments
Interest from financial investments mainly comprises interest earnings on cash and fixed income investment assets of the Superannuation Provision Account.
The decrease of $4.3 million in the 2015-16 estimated outcome from the original budget is mainly due to lower than anticipated interest earnings on the Australian inflation linked debt investments resulting from low underlying inflation. The increase of $0.8 million in the 2016-17 Budget from the 2015-16 estimated outcome mainly reflects the anticipated growth in assets and changes to the portfolio’s asset allocation.
2016-17 Budget Paper No. 3 243 Revenue and Forward Estimates
Distributions from Financial Investments
Table 6.2.12 provides a summary of distributions from financial investments received.
Table 6.2.12: Distributions from Financial Investments
2015-16 Empty Cell 2015-16 2016-17 Empty Cell 2017-18 2018-19 2019-20Budget Empty Cell Est.
OutcomeBudget Var Estimate Estimate Estimate
$'000 Empty Cell $'000 $'000 % $'000 $'000 $'000Empty Cell Interest Received Empty Cell Empty Cell Empty Cell Empty Cell Empty Cell Empty Cell
63,167 Distributions from Financial Investments
28,300 36,391 29 45,293 47,615 50,573
63,167 Total Interest Received 28,300 36,391 29 45,293 47,615 50,573
Distributions from Financial Investments
The decrease of $34.9 million in the 2015-16 estimated outcome from the original budget is mainly due to the timing of distribution receipts, the availability of income for distribution from investment trusts, the divestment of unit trust investments and the asset allocation of the portfolio through maintaining a higher allocation to cash investments over the year.
The increase of $8.1 million in the 2016-17 Budget from the 2015-16 estimated outcome mainly reflects the timing of distribution receipts and the anticipated growth in portfolio assets and changes to the portfolio’s asset allocation.
Dividends and Tax Equivalents
Table 6.2.13 provides a summary of dividends and tax equivalents.
Table 6.2.13: Dividends and Tax Equivalents
2015-16 Empty Cell 2015-16 2016-17 Empty Cell 2017-18 2018-19 2019-20Budget Empty Cell Est.
OutcomeBudget Var Estimate Estimate Estimate
$'000 Empty Cell $'000 $'000 % $'000 $'000 $'000Empty Cell Dividends Empty Cell Empty Cell Empty Cell Empty Cell Empty Cell Empty Cell
69,172 Dividends – Icon Water 76,171 71,774 -6 74,828 90,876 104,886500 Dividends – CIT Solutions 500 500 - 500 500 500
107,043 Dividends – Land Development Agency
163,616 149,273 -9 71,032 114,385 118,560
50,858 Dividends from Financial Investments
49,900 50,990 2 51,206 53,954 57,452
227,573 Total Dividends 290,187 272,537 -6 197,566 259,715 281,398Empty Cell Empty Cell Empty Cell Empty Cell Empty Cell Empty Cell Empty Cell Empty Cell
Empty Cell Tax Equivalents Empty Cell Empty Cell Empty Cell Empty Cell Empty Cell Empty Cell
101,855 Income Tax Equivalent 130,261 133,271 2 84,672 105,063 101,502101,855 Total Tax Equivalents 130,261 133,271 2 84,672 105,063 101,502329,428 Total Dividend and Tax
Equivalents420,448 405,808 -3 282,238 364,778 382,900
2016-17 Budget Paper No. 3 244 Revenue and Forward Estimates

Icon Water
The estimated dividend from Icon Water in 2015-16 is $76.2 million, which is $7 million higher than the original 2015-16 Budget. This largely reflects increased water sales, together with lower interest charges on borrowings. The dividend in 2016-17 is estimated to be $71.8 million. The reduction of $4.4 million in dividends in 2016-17 from the 2015-16 estimated outcome is due to a reduced level of distributions from the ActewAGL Joint Venture.
The Government has also agreed to provide once off dividend relief to Icon Water in 2015-16 by reducing the payout ratio to 64 per cent. The Government has also changed the dividend policy for Icon Water to exclude gifted assets on an ongoing basis which will assist Icon Water to maintain sustainable gearing levels.
Land Development Agency
The Land Development Agency’s (LDA’s) ‘nominal’ surplus is not fully recognised as revenue in the GGS Net Operating Balance, consistent with the Government Finance Statistics accounting principles. In general, LDA’s nominal surplus comprises sale of assets (for example, undeveloped commercial land) and profit from development and marketing activities. Proceeds from asset sales (including gains from land rezoning) are treated as capital distributions and only profits from development and marketing activities are recognised as dividend revenue.
The dividend in 2015-16 is expected to be $163.6 million, $56.6 million above the original 2015-16 Budget due to increased sales activity. The dividend forecast for 2016-17 is $149.3 million. Refer to Supply and Release of Land (Chapter 5.3).
Dividends from Financial Investments
This item represents dividends from financial investment assets of the Superannuation Provision Account.
The decrease of $1 million in the 2015-16 estimated outcome from the original 2015-16 Budget reflects the estimated change in the amount of dividends declared on individual share holdings over the year and expected to be received.
The increase of $1.1 million in the 2016-17 Budget from the 2015-16 estimated outcome mainly reflects the anticipated growth in portfolio assets and changes to the portfolio’s asset allocation.
Income Tax Equivalents
This item represents income tax equivalent payments made by the Public Trading Enterprise sector. The estimated outcome for 2015-16 is $130.3 million and reflects the performance forecast from the ACT agencies that are subject to the National Tax Equivalent Regime.
The increase of $28.4 million in 2015-16 from the original 2015-16 Budget forecast is mainly due to additional tax payments by Icon Water associated with the ActewAGL Joint Venture, gains from contributed assets, increased water sales and lower interest charges and, to a lesser degree, additional revenue from the LDA due to higher land sales.
2016-17 Budget Paper No. 3 245 Revenue and Forward Estimates

The revenue from income tax equivalents is forecast to increase to $133.3 million in 2016-17, largely reflecting Asset Recycling Initiative land sales.
Other Revenue
Table 6.2.14 provides the 2015-16 estimated outcome, the 2016-17 Budget and the forward estimates for other revenue.
The 2015-16 outcome for other revenue is estimated to be $137 million or $0.8 million less than the 2015-16 Budget estimate. Other revenue is expected to increase by $6.4 million to $143.3 million.
Table 6.2.14: Other Revenue
2015-16 Empty Cell 2015-16 2016-17 Empty Cell 2017-18 2018-19 2019-20Budget Empty Cell Est.
OutcomeBudget Var Estimate Estimate Estimate
$'000 Empty Cell $'000 $'000 % $'000 $'000 $'000Empty Cell Fines Empty Cell Empty Cell Empty Cell Empty Cell Empty Cell Empty Cell
23,590 Traffic Infringement Fines
19,585 24,332 24 27,848 29,149 28,946
380 Court Fines 2,200 387 -82 408 408 40813,625 Parking Fines 11,625 14,442 24 15,309 16,228 16,228
1,059 Other Fines 896 924 3 927 930 93038,654 Total Fines 34,306 40,085 17 44,492 46,715 46,512
Empty Cell Empty Cell Empty Cell Empty Cell Empty Cell Empty Cell Empty Cell Empty Cell
Empty Cell Other Empty Cell Empty Cell Empty Cell Empty Cell Empty Cell Empty Cell
12,649 Superannuation Contribution
16,802 16,632 -1 16,274 15,966 15,884
16,885 Rents and Commutation 14,328 13,037 -9 12,294 11,443 10,50420,047 Contributions 20,047 20,047 - 20,047 20,047 20,04749,494 Other Miscellaneous
Revenue51,473 53,541 4 49,214 50,448 49,648
99,075 Total Other 102,650 103,257 1 97,829 97,904 96,083137,729 Total Other Revenue 136,956 143,342 5 142,321 144,619 142,595
Traffic Infringement Fines
The estimated revenue from traffic infringement fines in 2015-16 is $19.6 million, which is $4 million lower than the 2015-16 Budget estimate. Revenue is forecast to increase by $4.7 million to $24.3 million in 2016-17. This is partly due to the introduction of an additional two mobile cameras, and upgrades to the traffic adjudication system.
Parking Fines
The estimated outcome in 2015-16 is $11.6 million, which is $2 million less than the 2015-16 Budget largely due to construction activity at various parking sites.
Parking fine revenue is forecast to increase to $14.4 million in 2016-17, mainly as a result of increased parking enforcement activity and a return to more usual levels of parking fines following the re-opening of a number of parking sites.
2016-17 Budget Paper No. 3 246 Revenue and Forward Estimates
Superannuation Contributions
This item represents the payment of employer superannuation contributions to the Territory Banking Account (TBA) by the Public Trading Enterprise sector and external sector (ActewAGL). The contribution calculations are based on annual actuarially determined employer contribution rates for either CSS or PSS membership. This item also includes the employee contributions to the TBA by those Members of the Legislative Assembly who are members of the defined benefit superannuation arrangement.
Rents and Commutation
Rents and commutation income is estimated at $14.3 million in 2015-16, $2.6 million below the original 2015-16 Budget. This is partly due to a lower than anticipated number of land rent transactions under the Land Rent Scheme. The income from rents is forecast to decline to $13 million in 2016-17 due to lower land rent transactions and higher conversion rates from land rent leases to Crown leases.
Contributions
This item includes voluntary contributions, fundraising and excursion funds, and revenue from hire of school buildings, which are collected by schools and the Education Directorate.
Other Miscellaneous Revenue
Other miscellaneous revenue is forecast to increase to $53.5 million in 2016-17, from an estimated outcome of $51.5 million in 2015-16.
Table 6.2.15 below provides a breakdown of other miscellaneous revenue.
Table 6.2.15: Breakdown – Other Miscellaneous RevenueEmpty Cell 2015-16 2016-17 2017-18 2018-19 2019-20Empty Cell Est. Outcome Budget Estimate Estimate EstimateEmpty Cell $'000 $'000 $'000 $'000 $'000
Revenue from Financial Investments 735 709 676 712 758Donations 1,932 1,979 2,119 2,172 2,223Other Grants 19,680 23,752 18,543 17,710 18,147Recoveries 13,502 12,530 12,834 13,190 13,589Perpetual Care Trust 1,525 1,252 1,296 1,340 1,387Problem Gambling Assistance Fund 1,112 1,120 1,148 1,177 1,206Regulatory Fees 2,787 1,155 1,157 1,160 1,163Miscellaneous 10,200 11,044 11,441 12,987 11,175Total Other Miscellaneous Revenue 51,473 53,541 49,214 50,448 49,648
2016-17 Budget Paper No. 3 247 Revenue and Forward Estimates
2016-17 Budget Paper No. 3 248 Revenue and Forward Estimates
6.3 TAXATION REFORM
The Government is committed to making the Territory’s taxation system fairer, simpler and more efficient through significant taxation reforms. In this Budget, the Government continues the reform process it started in the 2012-13 Budget by announcing the next stage of the reform agenda. The Stage One reforms covered the first five years of the 20 year reform program, drew on the recommendations of the 2012 ACT Taxation Review and were consistent with the Commonwealth’s 2010 Review of Australia’s Future Tax System (Henry Tax Review). The main reform initiative relates to the abolition of inefficient taxes on conveyances and insurance premiums. The revenue lost through the abolition of these inefficient taxes is being replaced through the general rates system.
The transition to an efficient broad-based land tax secures a stable revenue base into the future to fund the provision of high quality government services, such as schools, roads, hospitals and community facilities, and relieves future generations from the economic burden of an unfair and inefficient tax system. The abolition of inefficient taxes will result in significant economic gains in the wider economy through increased productivity.
While we are transferring our revenue source from an inefficient to an efficient tax base, we are not increasing revenue overall as a consequence of this tax reform. The ACT is still a relatively low taxing jurisdiction. Our own source tax revenue as a share of Gross State Product is the second lowest of any jurisdiction in Australia.
Moving to a stable and secure revenue base – Impact of Stage One reforms
The 2016-17 Budget completes the first five years of the Territory’s tax reform program. The rollout of the Stage One tax reforms has led to a significantly reduced reliance on inefficient and volatile transaction taxes (conveyance and insurance duties) and an increased reliance on the efficient general rates base. From 1 July 2016, taxes on general insurance and life insurance will be completely eliminated in the Territory.
In 201112, conveyance and insurance duty revenues together represented 24 per cent of total own source tax revenue – this is forecast to decrease to around 16 per cent in 2016-17. The relative share of inefficient taxes will decline further over the forward estimates period as the transition of tax bases continues.
General rates revenue is now the largest component of own source tax revenue at around 27 per cent of total tax revenues in 201617 compared to 18 per cent in 2011-12. The changing trends of relative tax revenue shares are shown in Figure 6.3.1.
2016-17 Budget Paper No. 3 249 Taxation Reform
Figure 6.3.1: General rates, conveyance and insurance duties as a percentage of total tax revenue
0
5
10
15
20
25
30
2011-12 2012-13 2013-14 2014-15 2015-16 2016-17
Perc
enta
ge o
f tot
al t
ax re
venu
e
General rates Conveyance and Insurance duty
Abolishing insurance duties
In the 201213 Budget, the Government announced the abolition of duty on insurance premiums over a five year period. On 1 July 2016, insurance duty will be fully abolished in the ACT. As a result, an ACT household paying around $3,000 per year in insurance premiums will save up to $300 per year compared to other jurisdictions.
From 1 July 2016, the ACT will be the only jurisdiction to have fully abolished duty on both general and life insurance premiums (based on available information at the time of finalising the 2016-17 Budget papers). As shown in Table 6.3.1, the rate of duty on general insurance in NSW and Queensland is 9 per cent, 10 per cent in Victoria and 11 per cent in South Australia.
Table 6.3.1: Interstate comparison of insurance duty
State Duty on general insurance from 1 July 2016 (%)
Duty on life insurance from 1 July 2016 (%)
NSW 9 5Victoria 10 NilWestern Australia 10 NilQueensland 9 5South Australia 11 1.5Tasmania 10 5Northern Territory 10 NilACT Nil Nil
The complete removal of insurance duties in the ACT will make insurance more affordable for households and businesses, and allow more appropriate levels of cover to be taken out.
2016-17 Budget Paper No. 3 250 Taxation Reform

Abolishing Conveyance (Stamp) Duty
Conveyance duty has been recognised as an unfair and inefficient tax that makes buying a property more expensive. It acts as a disincentive for people to move to accommodation more suited to their needs and can discourage investment in commercial property. As the Henry Tax Review noted “stamp duties on conveyances are inconsistent with the needs of a modern tax system”.2
As conveyance duty is only paid by those who purchase a property, and hence only a small proportion of the community in any one year, it is not a fair way to fund services that benefit the whole community. In addition, conveyance duty is a volatile revenue source. In the 22 years between 198990 and 201112, conveyance duty revenues fell from the previous year’s level on nine occasions. Having a significant revenue source with this level of volatility is not a sustainable way to fund important services to the community.
For these reasons, the Government commenced a program to abolish conveyance duty over a 20 year period. This timeframe was set to ensure the reform was undertaken in a staged approach, to minimise disruption to the market and to allow households and businesses time to plan and make decisions with certainty. The Government has committed to cut conveyance duty rates in each budget with the medium term aim of having the lowest rates in Australia. The stamp duty reductions to date are already significant, saving purchasers thousands of dollars when buying a property compared to pre-tax reform duty levels.
Because of the Government’s tax reforms to date, the conveyance duty charge for most residential properties in the ACT is already significantly lower than the national average, and the lowest of all jurisdictions except Queensland’s rate for owner occupier properties. Figure 6.3.2 below shows a comparison of conveyance duty charges for a $500,000 property in each jurisdiction.
2 2010, Australia’s Future Tax System, Report to the Treasurer, Part One, Commonwealth Treasury.
2016-17 Budget Paper No. 3 251 Taxation Reform
Figure 6.3.2: Conveyance duty payment for a $500,000 property
0
5,000
10,000
15,000
20,000
25,000
Conv
eyan
ce d
uty
($)
National average
Note: The rate used for Queensland is the owner occupier rate. A higher rate is applied by the Queensland Government for investment properties.
Economic Impacts
As a tax on property transactions, conveyance duty influences the decision of property buyers to purchase or not purchase a property. As a result, conveyance duty reduces the number of properties that are sold each year. Deloitte Access Economics (Deloitte) modelling published by the Property Council of Australia (PCA)3 suggests that a significant number of property transactions are foregone each year as a result of conveyance duty.4
Recent modelling by Commonwealth Treasury found that general rates are least likely to have a negative impact on the economy compared to other taxes, whereas conveyance duty slows economic growth by increasing the cost of purchasing property.5
3 2015, The economic impact of stamp duty: Three reform options, report prepared for the Property Council of Australia by Deloitte Access Economics.
4 The modelling published by the Property Council of Australia reported a national estimate of 340,000 transactions foregone each year.5 2015, Treasury Working Paper 2015-01, Understanding the Economy-Wide Efficiency and Incidence of Major Australian Taxes.
2016-17 Budget Paper No. 3 252 Taxation Reform

To illustrate the potential economic benefits of genuine tax reform, it is useful to consider independent economic modelling. There is no recent work undertaken independently to model the ACT Government’s tax reform. However, recent modelling by Deloitte (referred to above) measures the impacts on Gross Domestic Product (GDP), real consumption and employment by sector under a scenario where conveyance duties were abolished at a national level and the revenue replaced through the GST. The modelling used a long-run comparative static model that measures the changes in the economy as calculated using before and after snapshots 10 years apart.
The Deloitte modelling estimates that after 10 years replacing conveyance duties with GST would:
increase GDP by $3.3 billion (in 201314 dollars) – the ACT’s share of this would be around $71 million;
increase real consumption by $9.7 billion (in 201314 dollars) – the ACT’s share of this would be around $211 million (or approximately $1,400 per household); and
move employment towards construction, retail trade and services.
The ACT’s tax reforms have replaced conveyance duty revenue with a broad-based land tax which is more efficient than the GST and would provide greater economic benefits compared to the Deloitte scenario.
Stage Two reforms
Stage Two of the reform program will commence in 201718. The initiatives incorporated in Stage Two will build on the progress made in Stage One – but take a more targeted approach. A key aspect of the Stage Two reforms is the separation of residential and commercial conveyance duty rates from 2017-18 onwards. This will allow taxation to be adjusted to better reflect the differences in each sector.
Residential
The Government will further reduce conveyance duty rates in the 201617 Budget, as previously announced, and over the next five year period of tax reform. Table 6.3.2 shows the residential conveyance duty rate scale for 201617 and the next five years.
2016-17 Budget Paper No. 3 253 Taxation Reform
Table 6.3.2: Residential Conveyance Duty Rates
Threshold 2015-16%
2016-17%
2017-18%
2018-19%
2019-20%
2020-21%
2021-22%
Up to $200,000 1.8 1.48 1.4 1.3 1.2 1.1 1.0$200,001 to $300,000 3.0 2.5 2.4 2.3 2.2 2.1 2.0$300,001 to $500,000 4.0 4.0 3.8 3.6 3.4 3.2 3.0$500,001 to $750,000 5.0 5.0 4.78 4.56 4.32 4.1 3.9$750,001 to $1,000,000 6.5 6.5 6.3 6.1 5.9 5.7 5.5$1,000,001 to $1,454,999 7.0 7.0 6.8 6.6 6.4 6.2 6.0$1,455,000 and above1 5.17 5.09 4.91 4.73 4.54 4.36 4.18
Note:1. The $1,455,000 and above rate is a flat rate.
Table 6.3.3 below shows the reduction in conveyance duty payable since the commencement of the reform program in 201213 for a range of different property values. For example, in 201617, as a result of taxation reform:
a property valued at $400,000 will save $5,540 or 37 per cent;
a property valued at $500,000 will save $7,040 or 34 per cent;
a property valued at $800,000 will save $8,540 or 23 per cent; and
a property valued at $2,000,000 will save $14,950 or 13 per cent.
Table 6.3.3: Residential conveyance duty as at 2011-12, 2016-17 and 2021-22
Property value 2011-12 2016-17 (Stage One) 2021-22 (Stage Two)Empty Cell Duty ($) Duty ($) Reduction Duty ($) Reduction
$300,000 9,500 5,460 -43% 4,000 -58%$400,000 15,000 9,460 -37% 7,000 -53%$500,000 20,500 13,460 -34% 10,000 -51%$600,000 26,250 18,460 -30% 13,900 -47%$700,000 32,000 23,460 -27% 17,800 -44%$800,000 37,750 29,210 -23% 22,500 -40%$900,000 43,500 35,710 -18% 28,000 -36%$1 million 49,250 42,210 -14% 33,500 -32%$1.1 million 56,000 49,210 -12% 39,500 -29%$1.2 million 62,750 56,210 -10% 45,500 -27%
Table 6.3.3 shows that the conveyance duty payable on transactions on property below $600,000 has decreased by 30 per cent or more in the first stage of tax reform.
Properties below $600,000 account for around 75 per cent of residential and 50 per cent of commercial conveyance duty transactions.
2016-17 Budget Paper No. 3 254 Taxation Reform
Commercial
The Government’s reforms to conveyance duty have provided significant savings on higher value properties, which in the ACT are almost exclusively confined to the commercial sector. For example, in 2016-17:
a property valued at $5 million will save $64,750 or 20 per cent;
a property valued at $10 million will save $147,750 or 22 per cent; and
a property valued at $20 million will save $313,750 or 24 per cent.
In 201718, reductions in conveyance duty for commercial properties will be accelerated by providing a 50 per cent discount on conveyance duty for all commercial transactions below $1.5 million.
In 201819, conveyance duty for commercial property transactions below $1.5 million will be fully abolished. This will result in about 70 per cent of all commercial property transactions paying no conveyance duty from 2018-19. A flat rate of 5 per cent will apply to all commercial property transactions of $1.5 million and above.
Removing conveyance duty for properties below $1.5 million will significantly reduce the upfront costs of purchasing commercial property in the ACT. South Australia is the only other jurisdiction to abolish commercial conveyance duty. The commercial conveyance duty rates applicable to commercial properties below $1.5 million in 201718 (which includes the 50 per cent discount) are shown in Table 6.3.4.
Table 6.3.4: Commercial Conveyance Duty Rates
Threshold 2017-18%
2018-19%
Up to $200,000 0.7 0$200,001 to $300,000 1.2 0$300,001 to $500,000 1.9 0$500,001 to $750,000 2.39 0$750,001 to $1,000,000 3.15 0$1,000,001 to $1,499,999 3.4 0$1,500,000 and above1 5.0 5.0
Note:1. The $1,500,000 and above rate is a flat rate.
2016-17 Budget Paper No. 3 255 Taxation Reform

Table 6.3.5: Interstate comparison of commercial conveyance duty payable, 2018-191
State Property ValueEmpty Cell $0.5 million $1.5 million $10 millionEmpty Cell $ $ $
ACT 0 0 500,000South Australia 0 0 0NSW 17,990 67,990 535,490Victoria 25,070 82,500 550,000Queensland 15,925 66,775 555,525Western Australia 19,665 71,165 508,915Northern Territory 23,929 74,250 545,000Tasmania 18,248 62,685 445,185
Note:1. Estimates based on information available at the time of publication.
Annual change to total conveyance duty revenue
Under the reform program, conveyance duty charges per transaction will reduce every year. However, total conveyance duty revenue can vary significantly from year to year and is notoriously hard to predict. It may be the case that in some years the total revenue collected from conveyance duty is greater than a previous year. This is because conveyance duty is a volatile revenue source and is influenced by a range of market factors, including changes in property prices, the number of properties sold and the composition of property types transacted, i.e. houses, units and commercial properties.
The impact of reduced duty rates will mean that total conveyance duty revenue will decline over the medium term.
It should also be noted that the aim of tax reform is to reduce the cost of turnover in the property market. It could be expected therefore that lower conveyance duty rates will increase activity and this can have the effect of increasing aggregate conveyance duty revenue while lowering the tax raised per transaction. While proving causality is difficult, increased conveyance duty revenue in 201516 (see Revenue and Forward Estimates (Chapter 6.2) for further information) is consistent with this outcome.
General Rates
General rates are levied annually on the unimproved value of all properties in the ACT which makes it a highly stable and secure revenue base. The Government is able to forecast revenue with a high degree of accuracy which makes budgeting more reliable and transparent.
Prior to the commencement of the Government’s tax reform program, general rates increased each year in line with changes in the Wage Price Index (WPI). This ensured that revenues remained in line with the costs required to maintain high quality Government services. Since the commencement of tax reform, general rates have been increasing by an additional amount (above WPI) as we transition our tax base away from inefficient transaction-based taxes to the general rates system. In the absence of tax reform, general rates would have continued to increase by WPI.
2016-17 Budget Paper No. 3 256 Taxation Reform

Analysis of the impacts on tax reform to date show that the distribution of property average unimproved values (AUVs) is not well represented by the current general rates thresholds, in particular for commercial properties where the highest threshold is $275,000. In order to better align the rates scale with the distribution of property AUVs, an additional threshold and rating factor will be introduced from 2016-17 for both commercial and residential sectors, as shown in Table 6.3.6 and Table 6.3.7 below.
Table 6.3.6: Residential general rates
Threshold 2015-16 Threshold 2016-170 to $150,000 0.2746% 0 to $150,000 0.2746%$150,001 to $300,000 0.3857% $150,001 to $300,000 0.3900%$300,001 to $450,000 0.4629% $300,001 to $450,000 0.4800%$450,001 and above 0.5339% $450,001 to $600,000 0.5400%
Empty Cell Empty Cell $600,001 and above 0.5750%Fixed charge $730 Fixed charge $765
Table 6.3.7: Commercial general rates
Threshold 2015-16 Threshold 2016-170 to $150,000 2.63% 0 to $150,000 2.80%$150,001 to $275,000 3.05% $150,001 to $275,000 3.30%$275,001 and above 4.43% $275,001 to $600,000 4.66%
Empty Cell Empty Cell $600,001 and above 4.77%Fixed charge $2,130 Fixed charge $2,235
Overall, general rates will increase by an average of 4.5 per cent for residential properties and by an average of 7 per cent for commercial properties in 2016-17. This is lower than the 8.75 per cent overall increase in general rates previously used for the 2015-16 Budget estimates.
The annual increases for the next five years of Stage Two tax reform for residential properties will be 7 per cent on average. For units only, a change in the rates methodology will also add around $150 on average in 2017-18 and $115 on average in 2018-19.
Commercial general rates will increase on average by around 6 per cent each year.
General rates are an important revenue base for the Territory. In other Australian jurisdictions, general rates are levied by local councils to pay only for municipal services including local roads, libraries, parks and gardens, and rubbish collection. In the ACT, they also help to fund a range of services which are usually provided by state governments, including: schools; hospitals and community health; policing, emergency services and the justice system; disability and community services; and environmental regulation.
As shown in Figure 6.3.3, the ACT Government spends 14 per cent of its revenue on local government functions.
2016-17 Budget Paper No. 3 257 Taxation Reform

Figure 6.3.3: ACT Government spend as a percentage of State and Local Government Services
Local Government Services
14%
State Government Services
86%
General rates have increased each year since tax reform commenced to make our tax system more sustainable, stable, efficient and equitable.
Residential general rates
The level of increase in residential general rates has differed significantly for houses and units over the first stage of tax reform. The progressive nature of the general rates system has resulted in lower increases for properties with lower AUVs. Houses typically have relatively higher AUVs than units – despite often having similar market values. Table 6.3.8 below shows the difference in rates paid by a house in Charnwood and a unit in the City with the same market values.
Table 6.3.8: 2015-16 Comparison of general rates liability
Suburb Property type AUV General rates Market valueCity Unit $130,000 $1,087 $500,000Charnwood House $240,000 $1,489 $500,000Difference - 85% 37% 0%
In Stage Two of the tax reform program, it is appropriate that the charging structure for general rates becomes more equitable between different housing types. From 1 July 2017, the Government will change the general rates calculation for multi-unit dwellings to base it on the total AUV of the land rather than the individual AUV of the unit (consistent with changes to Land Tax). This change, to be phased in over two years, will establish greater equity in general rates paid between houses and units. This will make the increase in general rates for units higher than houses in 2017-18 and 2018-19 as the transition takes effect.
Commercial general rates
Overall, general rates for commercial properties will increase by an average of 6 per cent in each year from 201718 to 202122. This will provide certainty to the sector.
The actual increase for a particular property will depend on that property’s AUV.
2016-17 Budget Paper No. 3 258 Taxation Reform


