169
2016-2017 ADOPTED BUDGET STATE FINANCIAL REPORT JULY 1, 2016

2016-2017 ADOPTED BUDGET
STATE FINANCIAL REPORT
JULY 1, 2016


Long Beach UnifiedLos Angeles County
July 1 BudgetTABLE OF CONTENTS 19 64725 0000000
Form TC
California Dept of EducationSACS Financial Reporting Software - 2016.1.0File: tc (Rev 03/03/2014) Page 1 of 2 Printed: 6/24/2016 3:49 PM
G = General Ledger Data; S = Supplemental DataData Supplied For:
Form Description 2015-16Estimated
Actuals
2016-17Budget
01 General Fund/County School Service Fund GS GS09 Charter Schools Special Revenue Fund10 Special Education Pass-Through Fund11 Adult Education Fund G G12 Child Development Fund G G13 Cafeteria Special Revenue Fund G G14 Deferred Maintenance Fund15 Pupil Transportation Equipment Fund17 Special Reserve Fund for Other Than Capital Outlay Projects G G18 School Bus Emissions Reduction Fund19 Foundation Special Revenue Fund20 Special Reserve Fund for Postemployment Benefits21 Building Fund G G25 Capital Facilities Fund G G30 State School Building Lease-Purchase Fund35 County School Facilities Fund G G40 Special Reserve Fund for Capital Outlay Projects G G49 Capital Project Fund for Blended Component Units51 Bond Interest and Redemption Fund G G52 Debt Service Fund for Blended Component Units53 Tax Override Fund56 Debt Service Fund57 Foundation Permanent Fund61 Cafeteria Enterprise Fund62 Charter Schools Enterprise Fund63 Other Enterprise Fund66 Warehouse Revolving Fund67 Self-Insurance Fund G G71 Retiree Benefit Fund73 Foundation Private-Purpose Trust Fund76 Warrant/Pass-Through Fund95 Student Body Fund76A Changes in Assets and Liabilities (Warrant/Pass-Through)95A Changes in Assets and Liabilities (Student Body)A Average Daily Attendance S SASSET Schedule of Capital Assets SCASH Cashflow WorksheetCB Budget Certification SCC Workers' Compensation Certification SCEA Current Expense Formula/Minimum Classroom Comp. - Actuals GSCEB Current Expense Formula/Minimum Classroom Comp. - Budget GSCHG Change Order FormDEBT Schedule of Long-Term Liabilities SICR Indirect Cost Rate Worksheet GSL Lottery Report GS

Long Beach UnifiedLos Angeles County
July 1 BudgetTABLE OF CONTENTS 19 64725 0000000
Form TC
California Dept of EducationSACS Financial Reporting Software - 2016.1.0File: tc (Rev 03/03/2014) Page 2 of 2 Printed: 6/24/2016 3:49 PM
G = General Ledger Data; S = Supplemental DataData Supplied For:
Form Description 2015-16Estimated
Actuals
2016-17Budget
MYP Multiyear Projections - General Fund GSNCMOE No Child Left Behind Maintenance of Effort GSSEA Special Education Revenue AllocationsSEAS Special Education Revenue Allocations Setup (SELPA Selection) SSIAA Summary of Interfund Activities - Actuals GSIAB Summary of Interfund Activities - Budget G01CS Criteria and Standards Review GS GS

Long Beach UnifiedLos Angeles County
July 1 BudgetGeneral Fund
Unrestricted and RestrictedExpenditures by Object
19 64725 0000000Form 01
California Dept of EducationSACS Financial Reporting Software - 2016.1.0File: fund-a (Rev 03/22/2016) Page 1 Printed: 6/24/2016 3:03 PM
2015-16 Estimated Actuals 2016-17 Budget
Description Resource CodesObjectCodes
Unrestricted(A)
Restricted(B)
Total Fundcol. A + B
(C)Unrestricted
(D)Restricted
(E)
Total Fundcol. D + E
(F)
% DiffColumnC & F
A. REVENUES
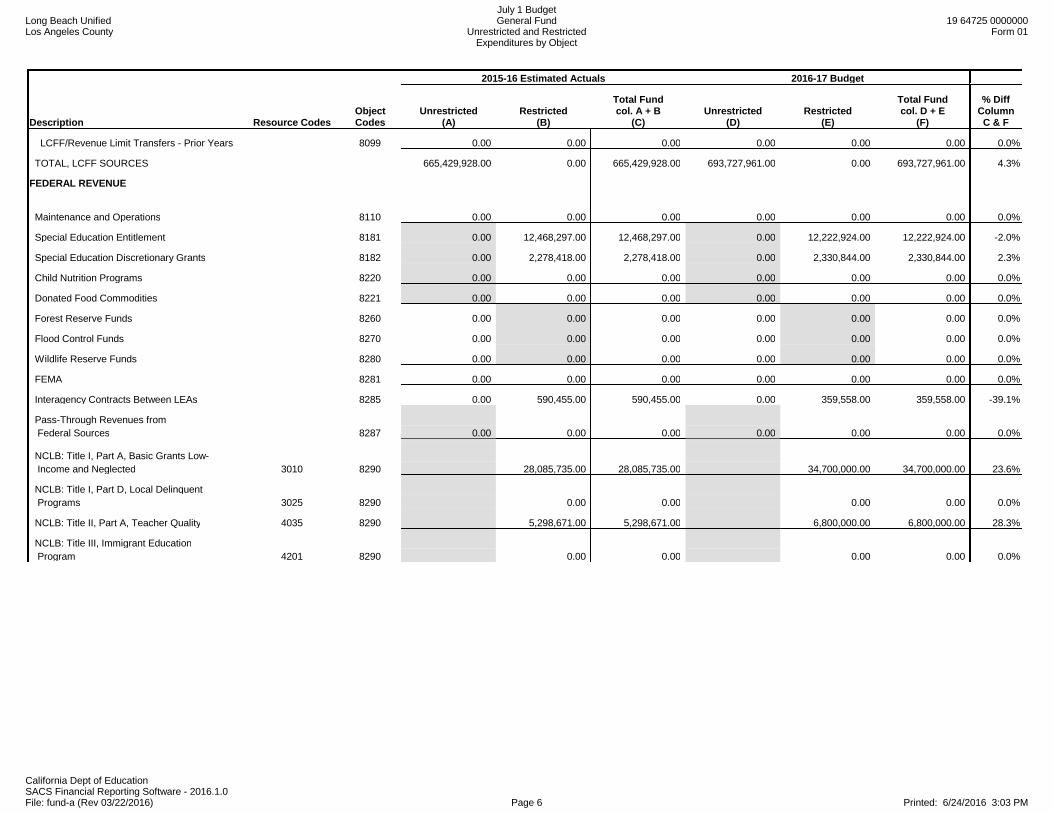
1) LCFF Sources 8010-8099 665,429,928.00 0.00 665,429,928.00 693,727,961.00 0.00 693,727,961.00 4.3%
2) Federal Revenue 8100-8299 698,043.00 55,213,536.00 55,911,579.00 150,000.00 63,918,593.00 64,068,593.00 14.6%
3) Other State Revenue 8300-8599 53,545,632.00 93,822,895.00 147,368,527.00 32,029,405.00 89,988,614.00 122,018,019.00 -17.2%
4) Other Local Revenue 8600-8799 10,609,489.00 11,645,392.00 22,254,881.00 8,885,035.00 7,976,174.00 16,861,209.00 -24.2%
5) TOTAL, REVENUES 730,283,092.00 160,681,823.00 890,964,915.00 734,792,401.00 161,883,381.00 896,675,782.00 0.6%
B. EXPENDITURES
1) Certificated Salaries 1000-1999 294,087,910.00 83,092,843.00 377,180,753.00 297,358,706.00 84,449,648.00 381,808,354.00 1.2%
2) Classified Salaries 2000-2999 73,936,170.00 41,444,289.00 115,380,459.00 75,110,909.00 42,290,102.00 117,401,011.00 1.8%
3) Employee Benefits 3000-3999 134,484,252.00 69,902,788.00 204,387,040.00 144,249,902.00 71,835,386.00 216,085,288.00 5.7%
4) Books and Supplies 4000-4999 15,409,370.00 18,729,101.00 34,138,471.00 36,944,116.00 24,292,899.00 61,237,015.00 79.4%
5) Services and Other Operating Expenditures 5000-5999 55,026,088.00 41,608,202.00 96,634,290.00 57,667,122.00 43,167,479.00 100,834,601.00 4.3%
6) Capital Outlay 6000-6999 1,129,475.00 570,166.00 1,699,641.00 990,000.00 668,654.00 1,658,654.00 -2.4%
7) Other Outgo (excluding Transfers of Indirect 7100-7299 Costs) 7400-7499 0.00 200,000.00 200,000.00 0.00 200,000.00 200,000.00 0.0%
8) Other Outgo - Transfers of Indirect Costs 7300-7399 (9,280,603.00) 7,862,953.00 (1,417,650.00) (8,512,608.00) 7,334,936.00 (1,177,672.00) -16.9%
9) TOTAL, EXPENDITURES 564,792,662.00 263,410,342.00 828,203,004.00 603,808,147.00 274,239,104.00 878,047,251.00 6.0%
C. EXCESS (DEFICIENCY) OF REVENUES OVER EXPENDITURES BEFORE OTHER FINANCING SOURCES AND USES (A5 - B9) 165,490,430.00 (102,728,519.00) 62,761,911.00 130,984,254.00 (112,355,723.00) 18,628,531.00 -70.3%
D. OTHER FINANCING SOURCES/USES 1) Interfund Transfers a) Transfers In 8900-8929 2,200,000.00 0.00 2,200,000.00 500,000.00 0.00 500,000.00 -77.3%
b) Transfers Out 7600-7629 4,000,000.00 0.00 4,000,000.00 4,000,000.00 0.00 4,000,000.00 0.0%
2) Other Sources/Uses a) Sources 8930-8979 0.00 0.00 0.00 0.00 0.00 0.00 0.0%
b) Uses 7630-7699 0.00 0.00 0.00 0.00 0.00 0.00 0.0%
3) Contributions 8980-8999 (100,429,481.00) 100,429,481.00 0.00 (108,026,544.00) 108,026,544.00 0.00 0.0%
4) TOTAL, OTHER FINANCING SOURCES/USES (102,229,481.00) 100,429,481.00 (1,800,000.00) (111,526,544.00) 108,026,544.00 (3,500,000.00) 94.4%

Long Beach UnifiedLos Angeles County
July 1 BudgetGeneral Fund
Unrestricted and RestrictedExpenditures by Object
19 64725 0000000Form 01
California Dept of EducationSACS Financial Reporting Software - 2016.1.0File: fund-a (Rev 03/22/2016) Page 2 Printed: 6/24/2016 3:03 PM
2015-16 Estimated Actuals 2016-17 Budget
Description Resource CodesObjectCodes
Unrestricted(A)
Restricted(B)
Total Fundcol. A + B
(C)Unrestricted
(D)Restricted
(E)
Total Fundcol. D + E
(F)
% DiffColumnC & F
E. NET INCREASE (DECREASE) IN FUND BALANCE (C + D4) 63,260,949.00 (2,299,038.00) 60,961,911.00 19,457,710.00 (4,329,179.00) 15,128,531.00 -75.2%
F. FUND BALANCE, RESERVES 1) Beginning Fund Balance a) As of July 1 - Unaudited 9791 90,245,078.83 24,894,487.61 115,139,566.44 153,506,027.83 22,595,449.61 176,101,477.44 52.9%
b) Audit Adjustments 9793 0.00 0.00 0.00 0.00 0.00 0.00 0.0%
c) As of July 1 - Audited (F1a + F1b) 90,245,078.83 24,894,487.61 115,139,566.44 153,506,027.83 22,595,449.61 176,101,477.44 52.9%
d) Other Restatements 9795 0.00 0.00 0.00 0.00 0.00 0.00 0.0%
e) Adjusted Beginning Balance (F1c + F1d) 90,245,078.83 24,894,487.61 115,139,566.44 153,506,027.83 22,595,449.61 176,101,477.44 52.9%
2) Ending Balance, June 30 (E + F1e) 153,506,027.83 22,595,449.61 176,101,477.44 172,963,737.83 18,266,270.61 191,230,008.44 8.6%
Components of Ending Fund Balance a) Nonspendable Revolving Cash 9711 406,650.00 0.00 406,650.00 406,650.00 0.00 406,650.00 0.0%
Stores 9712 1,200,000.00 0.00 1,200,000.00 1,200,000.00 0.00 1,200,000.00 0.0%
Prepaid Expenditures 9713 300,000.00 0.00 300,000.00 300,000.00 0.00 300,000.00 0.0%
All Others 9719 0.00 0.00 0.00 0.00 0.00 0.00 0.0%
b) Restricted 9740 0.00 22,595,451.58 22,595,451.58 0.00 18,266,272.58 18,266,272.58 -19.2%
c) Committed Stabilization Arrangements 9750 0.00 0.00 0.00 0.00 0.00 0.00 0.0%
Other Commitments 9760 59,730,000.00 0.00 59,730,000.00 72,100,000.00 0.00 72,100,000.00 20.7%
d) Assigned
Other Assignments 9780 0.00 0.00 0.00 0.00 0.00 0.00 0.0%
e) Unassigned/unappropriated
Reserve for Economic Uncertainties 9789 16,644,060.00 0.00 16,644,060.00 17,460,945.00 0.00 17,460,945.00 4.9%
Unassigned/Unappropriated Amount 9790 75,225,317.83 (1.97) 75,225,315.86 81,496,142.83 (1.97) 81,496,140.86 8.3%

Long Beach UnifiedLos Angeles County
July 1 BudgetGeneral Fund
Unrestricted and RestrictedExpenditures by Object
19 64725 0000000Form 01
California Dept of EducationSACS Financial Reporting Software - 2016.1.0File: fund-a (Rev 03/22/2016) Page 3 Printed: 6/24/2016 3:03 PM
2015-16 Estimated Actuals 2016-17 Budget
Description Resource CodesObjectCodes
Unrestricted(A)
Restricted(B)
Total Fundcol. A + B
(C)Unrestricted
(D)Restricted
(E)
Total Fundcol. D + E
(F)
% DiffColumnC & F
G. ASSETS
1) Cash a) in County Treasury 9110 0.00 0.00 0.00
1) Fair Value Adjustment to Cash in County Treasury 9111 0.00 0.00 0.00
b) in Banks 9120 0.00 0.00 0.00
c) in Revolving Fund 9130 0.00 0.00 0.00
d) with Fiscal Agent 9135 0.00 0.00 0.00
e) collections awaiting deposit 9140 0.00 0.00 0.00
2) Investments 9150 0.00 0.00 0.00
3) Accounts Receivable 9200 0.00 0.00 0.00
4) Due from Grantor Government 9290 0.00 0.00 0.00
5) Due from Other Funds 9310 0.00 0.00 0.00
6) Stores 9320 0.00 0.00 0.00
7) Prepaid Expenditures 9330 0.00 0.00 0.00
8) Other Current Assets 9340 0.00 0.00 0.00
9) TOTAL, ASSETS 0.00 0.00 0.00
H. DEFERRED OUTFLOWS OF RESOURCES
1) Deferred Outflows of Resources 9490 0.00 0.00 0.00
2) TOTAL, DEFERRED OUTFLOWS 0.00 0.00 0.00
I. LIABILITIES
1) Accounts Payable 9500 0.00 0.00 0.00
2) Due to Grantor Governments 9590 0.00 0.00 0.00
3) Due to Other Funds 9610 0.00 0.00 0.00
4) Current Loans 9640 0.00 0.00 0.00
5) Unearned Revenue 9650 0.00 0.00 0.00
6) TOTAL, LIABILITIES 0.00 0.00 0.00
J. DEFERRED INFLOWS OF RESOURCES
1) Deferred Inflows of Resources 9690 0.00 0.00 0.00
2) TOTAL, DEFERRED INFLOWS 0.00 0.00 0.00
K. FUND EQUITY
Ending Fund Balance, June 30

Long Beach UnifiedLos Angeles County
July 1 BudgetGeneral Fund
Unrestricted and RestrictedExpenditures by Object
19 64725 0000000Form 01
California Dept of EducationSACS Financial Reporting Software - 2016.1.0File: fund-a (Rev 03/22/2016) Page 4 Printed: 6/24/2016 3:03 PM
2015-16 Estimated Actuals 2016-17 Budget
Description Resource CodesObjectCodes
Unrestricted(A)
Restricted(B)
Total Fundcol. A + B
(C)Unrestricted
(D)Restricted
(E)
Total Fundcol. D + E
(F)
% DiffColumnC & F
(G9 + H2) - (I6 + J2) 0.00 0.00 0.00

Long Beach UnifiedLos Angeles County
July 1 BudgetGeneral Fund
Unrestricted and RestrictedExpenditures by Object
19 64725 0000000Form 01
California Dept of EducationSACS Financial Reporting Software - 2016.1.0File: fund-a (Rev 03/22/2016) Page 5 Printed: 6/24/2016 3:03 PM
2015-16 Estimated Actuals 2016-17 Budget
Description Resource CodesObjectCodes
Unrestricted(A)
Restricted(B)
Total Fundcol. A + B
(C)Unrestricted
(D)Restricted
(E)
Total Fundcol. D + E
(F)
% DiffColumnC & F
LCFF SOURCES Principal Apportionment State Aid - Current Year 8011 456,892,999.00 0.00 456,892,999.00 479,017,951.00 0.00 479,017,951.00 4.8%
Education Protection Account State Aid - Current Year 8012 102,445,074.00 0.00 102,445,074.00 102,445,074.00 0.00 102,445,074.00 0.0%
State Aid - Prior Years 8019 0.00 0.00 0.00 0.00 0.00 0.00 0.0%
Tax Relief Subventions Homeowners' Exemptions 8021 529,094.00 0.00 529,094.00 373,219.00 0.00 373,219.00 -29.5%
Timber Yield Tax 8022 0.00 0.00 0.00 0.00 0.00 0.00 0.0%
Other Subventions/In-Lieu Taxes 8029 779,168.00 0.00 779,168.00 1,589,486.00 0.00 1,589,486.00 104.0%
County & District Taxes Secured Roll Taxes 8041 75,100,834.00 0.00 75,100,834.00 95,171,601.00 0.00 95,171,601.00 26.7%
Unsecured Roll Taxes 8042 1,580,914.00 0.00 1,580,914.00 2,140,742.00 0.00 2,140,742.00 35.4%
Prior Years' Taxes 8043 2,359,468.00 0.00 2,359,468.00 1,338,933.00 0.00 1,338,933.00 -43.3%
Supplemental Taxes 8044 3,542,029.00 0.00 3,542,029.00 1,400,667.00 0.00 1,400,667.00 -60.5%
Education Revenue Augmentation Fund (ERAF) 8045 18,177,307.00 0.00 18,177,307.00 2,793,276.00 0.00 2,793,276.00 -84.6%
Community Redevelopment Funds (SB 617/699/1992) 8047 4,162,813.00 0.00 4,162,813.00 7,538,031.00 0.00 7,538,031.00 81.1%
Penalties and Interest from Delinquent Taxes 8048 112,133.00 0.00 112,133.00 245,966.00 0.00 245,966.00 119.4%
Miscellaneous Funds (EC 41604) Royalties and Bonuses 8081 0.00 0.00 0.00 0.00 0.00 0.00 0.0%
Other In-Lieu Taxes 8082 0.00 0.00 0.00 0.00 0.00 0.00 0.0%
Less: Non-LCFF (50%) Adjustment 8089 (30,703.00) 0.00 (30,703.00) (93,903.00) 0.00 (93,903.00) 205.8%
Subtotal, LCFF Sources 665,651,130.00 0.00 665,651,130.00 693,961,043.00 0.00 693,961,043.00 4.3% LCFF Transfers
Unrestricted LCFF Transfers - Current Year 0000 8091 0.00 0.00 0.00 0.00 0.0%
All Other LCFF Transfers - Current Year All Other 8091 0.00 0.00 0.00 0.00 0.00 0.00 0.0%
Transfers to Charter Schools in Lieu of Property Taxes 8096 (221,202.00) 0.00 (221,202.00) (233,082.00) 0.00 (233,082.00) 5.4%
Property Taxes Transfers 8097 0.00 0.00 0.00 0.00 0.00 0.00 0.0%
Long Beach UnifiedLos Angeles County
July 1 BudgetGeneral Fund
Unrestricted and RestrictedExpenditures by Object
19 64725 0000000Form 01
California Dept of EducationSACS Financial Reporting Software - 2016.1.0File: fund-a (Rev 03/22/2016) Page 6 Printed: 6/24/2016 3:03 PM
2015-16 Estimated Actuals 2016-17 Budget
Description Resource CodesObjectCodes
Unrestricted(A)
Restricted(B)
Total Fundcol. A + B
(C)Unrestricted
(D)Restricted
(E)
Total Fundcol. D + E
(F)
% DiffColumnC & F
LCFF/Revenue Limit Transfers - Prior Years 8099 0.00 0.00 0.00 0.00 0.00 0.00 0.0%
TOTAL, LCFF SOURCES 665,429,928.00 0.00 665,429,928.00 693,727,961.00 0.00 693,727,961.00 4.3%
FEDERAL REVENUE
Maintenance and Operations 8110 0.00 0.00 0.00 0.00 0.00 0.00 0.0%
Special Education Entitlement 8181 0.00 12,468,297.00 12,468,297.00 0.00 12,222,924.00 12,222,924.00 -2.0%
Special Education Discretionary Grants 8182 0.00 2,278,418.00 2,278,418.00 0.00 2,330,844.00 2,330,844.00 2.3%
Child Nutrition Programs 8220 0.00 0.00 0.00 0.00 0.00 0.00 0.0%
Donated Food Commodities 8221 0.00 0.00 0.00 0.00 0.00 0.00 0.0%
Forest Reserve Funds 8260 0.00 0.00 0.00 0.00 0.00 0.00 0.0%
Flood Control Funds 8270 0.00 0.00 0.00 0.00 0.00 0.00 0.0%
Wildlife Reserve Funds 8280 0.00 0.00 0.00 0.00 0.00 0.00 0.0%
FEMA 8281 0.00 0.00 0.00 0.00 0.00 0.00 0.0%
Interagency Contracts Between LEAs 8285 0.00 590,455.00 590,455.00 0.00 359,558.00 359,558.00 -39.1%
Pass-Through Revenues from Federal Sources 8287 0.00 0.00 0.00 0.00 0.00 0.00 0.0%
NCLB: Title I, Part A, Basic Grants Low- Income and Neglected 3010 8290 28,085,735.00 28,085,735.00 34,700,000.00 34,700,000.00 23.6%
NCLB: Title I, Part D, Local Delinquent Programs 3025 8290 0.00 0.00 0.00 0.00 0.0%
NCLB: Title II, Part A, Teacher Quality 4035 8290 5,298,671.00 5,298,671.00 6,800,000.00 6,800,000.00 28.3%
NCLB: Title III, Immigrant Education Program 4201 8290 0.00 0.00 0.00 0.00 0.0%
Long Beach UnifiedLos Angeles County
July 1 BudgetGeneral Fund
Unrestricted and RestrictedExpenditures by Object
19 64725 0000000Form 01
California Dept of EducationSACS Financial Reporting Software - 2016.1.0File: fund-a (Rev 03/22/2016) Page 7 Printed: 6/24/2016 3:03 PM
2015-16 Estimated Actuals 2016-17 Budget
Description Resource CodesObjectCodes
Unrestricted(A)
Restricted(B)
Total Fundcol. A + B
(C)Unrestricted
(D)Restricted
(E)
Total Fundcol. D + E
(F)
% DiffColumnC & F
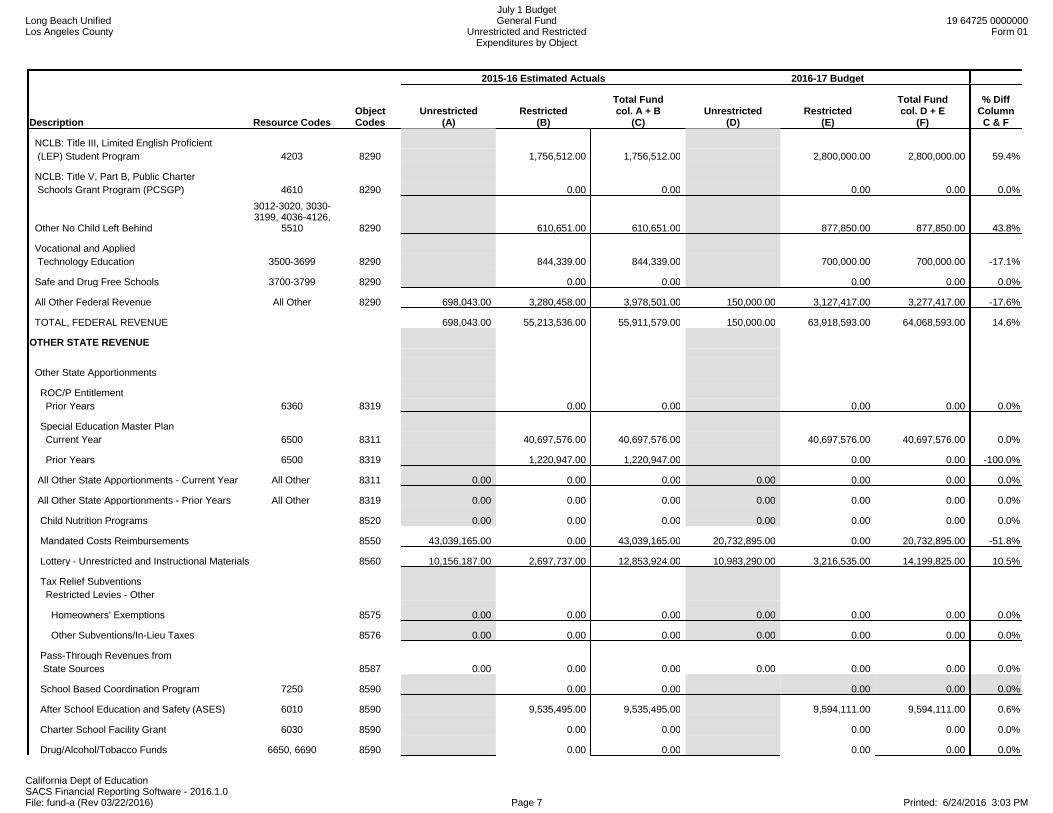
NCLB: Title III, Limited English Proficient (LEP) Student Program 4203 8290 1,756,512.00 1,756,512.00 2,800,000.00 2,800,000.00 59.4%
NCLB: Title V, Part B, Public Charter Schools Grant Program (PCSGP) 4610 8290 0.00 0.00 0.00 0.00 0.0%
Other No Child Left Behind
3012-3020, 3030-3199, 4036-4126,
5510 8290 610,651.00 610,651.00 877,850.00 877,850.00 43.8%
Vocational and Applied Technology Education 3500-3699 8290 844,339.00 844,339.00 700,000.00 700,000.00 -17.1%
Safe and Drug Free Schools 3700-3799 8290 0.00 0.00 0.00 0.00 0.0%
All Other Federal Revenue All Other 8290 698,043.00 3,280,458.00 3,978,501.00 150,000.00 3,127,417.00 3,277,417.00 -17.6%
TOTAL, FEDERAL REVENUE 698,043.00 55,213,536.00 55,911,579.00 150,000.00 63,918,593.00 64,068,593.00 14.6%
OTHER STATE REVENUE
Other State Apportionments
ROC/P Entitlement Prior Years 6360 8319 0.00 0.00 0.00 0.00 0.0%
Special Education Master Plan Current Year 6500 8311 40,697,576.00 40,697,576.00 40,697,576.00 40,697,576.00 0.0%
Prior Years 6500 8319 1,220,947.00 1,220,947.00 0.00 0.00 -100.0%
All Other State Apportionments - Current Year All Other 8311 0.00 0.00 0.00 0.00 0.00 0.00 0.0%
All Other State Apportionments - Prior Years All Other 8319 0.00 0.00 0.00 0.00 0.00 0.00 0.0%
Child Nutrition Programs 8520 0.00 0.00 0.00 0.00 0.00 0.00 0.0%
Mandated Costs Reimbursements 8550 43,039,165.00 0.00 43,039,165.00 20,732,895.00 0.00 20,732,895.00 -51.8%
Lottery - Unrestricted and Instructional Materials 8560 10,156,187.00 2,697,737.00 12,853,924.00 10,983,290.00 3,216,535.00 14,199,825.00 10.5%
Tax Relief Subventions Restricted Levies - Other
Homeowners' Exemptions 8575 0.00 0.00 0.00 0.00 0.00 0.00 0.0%
Other Subventions/In-Lieu Taxes 8576 0.00 0.00 0.00 0.00 0.00 0.00 0.0%
Pass-Through Revenues from State Sources 8587 0.00 0.00 0.00 0.00 0.00 0.00 0.0%
School Based Coordination Program 7250 8590 0.00 0.00 0.00 0.00 0.0%
After School Education and Safety (ASES) 6010 8590 9,535,495.00 9,535,495.00 9,594,111.00 9,594,111.00 0.6%
Charter School Facility Grant 6030 8590 0.00 0.00 0.00 0.00 0.0%
Drug/Alcohol/Tobacco Funds 6650, 6690 8590 0.00 0.00 0.00 0.00 0.0%

Long Beach UnifiedLos Angeles County
July 1 BudgetGeneral Fund
Unrestricted and RestrictedExpenditures by Object
19 64725 0000000Form 01
California Dept of EducationSACS Financial Reporting Software - 2016.1.0File: fund-a (Rev 03/22/2016) Page 8 Printed: 6/24/2016 3:03 PM
2015-16 Estimated Actuals 2016-17 Budget
Description Resource CodesObjectCodes
Unrestricted(A)
Restricted(B)
Total Fundcol. A + B
(C)Unrestricted
(D)Restricted
(E)
Total Fundcol. D + E
(F)
% DiffColumnC & F
California Clean Energy Jobs Act 6230 8590 3,071,213.00 3,071,213.00 3,071,213.00 3,071,213.00 0.0%
Career Technical Education Incentive Grant Program 6387 8590 0.00 0.00 0.00 0.00 0.0%
American Indian Early Childhood Education 7210 8590 0.00 0.00 0.00 0.00 0.0%
Specialized Secondary 7370 8590 750,000.00 750,000.00 750,000.00 750,000.00 0.0%
Quality Education Investment Act 7400 8590 0.00 0.00 0.00 0.00 0.0%
Common Core State Standards Implementation 7405 8590 0.00 0.00 0.00 0.00 0.0%
All Other State Revenue All Other 8590 350,280.00 35,849,927.00 36,200,207.00 313,220.00 32,659,179.00 32,972,399.00 -8.9%
TOTAL, OTHER STATE REVENUE 53,545,632.00 93,822,895.00 147,368,527.00 32,029,405.00 89,988,614.00 122,018,019.00 -17.2%

Long Beach UnifiedLos Angeles County
July 1 BudgetGeneral Fund
Unrestricted and RestrictedExpenditures by Object
19 64725 0000000Form 01
California Dept of EducationSACS Financial Reporting Software - 2016.1.0File: fund-a (Rev 03/22/2016) Page 9 Printed: 6/24/2016 3:03 PM
2015-16 Estimated Actuals 2016-17 Budget
Description Resource CodesObjectCodes
Unrestricted(A)
Restricted(B)
Total Fundcol. A + B
(C)Unrestricted
(D)Restricted
(E)
Total Fundcol. D + E
(F)
% DiffColumnC & F
OTHER LOCAL REVENUE
Other Local Revenue County and District Taxes
Other Restricted Levies Secured Roll 8615 0.00 0.00 0.00 0.00 0.00 0.00 0.0%
Unsecured Roll 8616 0.00 0.00 0.00 0.00 0.00 0.00 0.0%
Prior Years' Taxes 8617 0.00 0.00 0.00 0.00 0.00 0.00 0.0%
Supplemental Taxes 8618 0.00 0.00 0.00 0.00 0.00 0.00 0.0%
Non-Ad Valorem Taxes Parcel Taxes 8621 0.00 0.00 0.00 0.00 0.00 0.00 0.0%
Other 8622 0.00 0.00 0.00 0.00 0.00 0.00 0.0%
Community Redevelopment Funds Not Subject to LCFF Deduction 8625 0.00 0.00 0.00 0.00 0.00 0.00 0.0%
Penalties and Interest from Delinquent Non-LCFF Taxes 8629 0.00 0.00 0.00 0.00 0.00 0.00 0.0%
Sales Sale of Equipment/Supplies 8631 0.00 0.00 0.00 0.00 0.00 0.00 0.0%
Sale of Publications 8632 0.00 0.00 0.00 0.00 0.00 0.00 0.0%
Food Service Sales 8634 0.00 0.00 0.00 0.00 0.00 0.00 0.0%
All Other Sales 8639 0.00 0.00 0.00 0.00 0.00 0.00 0.0%
Leases and Rentals 8650 989,386.00 123,310.00 1,112,696.00 1,200,058.00 0.00 1,200,058.00 7.9%
Interest 8660 1,000,000.00 21,221.00 1,021,221.00 1,000,000.00 21,221.00 1,021,221.00 0.0%
Net Increase (Decrease) in the Fair Value of Investments 8662 0.00 0.00 0.00 0.00 0.00 0.00 0.0%
Fees and Contracts Adult Education Fees 8671 0.00 0.00 0.00 0.00 0.00 0.00 0.0%
Non-Resident Students 8672 0.00 0.00 0.00 0.00 0.00 0.00 0.0%
Transportation Fees From Individuals 8675 0.00 0.00 0.00 0.00 0.00 0.00 0.0%
Interagency Services 8677 0.00 0.00 0.00 0.00 0.00 0.00 0.0%
Mitigation/Developer Fees 8681 0.00 0.00 0.00 0.00 0.00 0.00 0.0%
All Other Fees and Contracts 8689 0.00 0.00 0.00 0.00 0.00 0.00 0.0%
Other Local Revenue Plus: Misc Funds Non-LCFF

Long Beach UnifiedLos Angeles County
July 1 BudgetGeneral Fund
Unrestricted and RestrictedExpenditures by Object
19 64725 0000000Form 01
California Dept of EducationSACS Financial Reporting Software - 2016.1.0File: fund-a (Rev 03/22/2016) Page 10 Printed: 6/24/2016 3:03 PM
2015-16 Estimated Actuals 2016-17 Budget
Description Resource CodesObjectCodes
Unrestricted(A)
Restricted(B)
Total Fundcol. A + B
(C)Unrestricted
(D)Restricted
(E)
Total Fundcol. D + E
(F)
% DiffColumnC & F
(50%) Adjustment 8691 0.00 0.00 0.00 0.00 0.00 0.00 0.0%
Pass-Through Revenues From Local Sources 8697 0.00 0.00 0.00 0.00 0.00 0.00 0.0%
All Other Local Revenue 8699 8,620,103.00 11,500,861.00 20,120,964.00 6,684,977.00 7,954,953.00 14,639,930.00 -27.2%
Tuition 8710 0.00 0.00 0.00 0.00 0.00 0.00 0.0%
All Other Transfers In 8781-8783 0.00 0.00 0.00 0.00 0.00 0.00 0.0%
Transfers of Apportionments Special Education SELPA Transfers From Districts or Charter Schools 6500 8791 0.00 0.00 0.00 0.00 0.0%
From County Offices 6500 8792 0.00 0.00 0.00 0.00 0.0%
From JPAs 6500 8793 0.00 0.00 0.00 0.00 0.0%
ROC/P Transfers From Districts or Charter Schools 6360 8791 0.00 0.00 0.00 0.00 0.0%
From County Offices 6360 8792 0.00 0.00 0.00 0.00 0.0%
From JPAs 6360 8793 0.00 0.00 0.00 0.00 0.0%
Other Transfers of Apportionments From Districts or Charter Schools All Other 8791 0.00 0.00 0.00 0.00 0.00 0.00 0.0%
From County Offices All Other 8792 0.00 0.00 0.00 0.00 0.00 0.00 0.0%
From JPAs All Other 8793 0.00 0.00 0.00 0.00 0.00 0.00 0.0%
All Other Transfers In from All Others 8799 0.00 0.00 0.00 0.00 0.00 0.00 0.0%
TOTAL, OTHER LOCAL REVENUE 10,609,489.00 11,645,392.00 22,254,881.00 8,885,035.00 7,976,174.00 16,861,209.00 -24.2%
TOTAL, REVENUES 730,283,092.00 160,681,823.00 890,964,915.00 734,792,401.00 161,883,381.00 896,675,782.00 0.6%

Long Beach UnifiedLos Angeles County
July 1 BudgetGeneral Fund
Unrestricted and RestrictedExpenditures by Object
19 64725 0000000Form 01
California Dept of EducationSACS Financial Reporting Software - 2016.1.0File: fund-a (Rev 03/22/2016) Page 11 Printed: 6/24/2016 3:03 PM
2015-16 Estimated Actuals 2016-17 Budget
Description Resource CodesObjectCodes
Unrestricted(A)
Restricted(B)
Total Fundcol. A + B
(C)Unrestricted
(D)Restricted
(E)
Total Fundcol. D + E
(F)
% DiffColumnC & F
CERTIFICATED SALARIES
Certificated Teachers' Salaries 1100 249,473,126.00 58,589,865.00 308,062,991.00 253,284,787.00 61,441,627.00 314,726,414.00 2.2%
Certificated Pupil Support Salaries 1200 17,470,562.00 9,700,836.00 27,171,398.00 17,817,861.00 9,921,573.00 27,739,434.00 2.1%
Certificated Supervisors' and Administrators' Salaries 1300 21,246,949.00 5,933,756.00 27,180,705.00 21,612,808.00 4,601,624.00 26,214,432.00 -3.6%
Other Certificated Salaries 1900 5,897,273.00 8,868,386.00 14,765,659.00 4,643,250.00 8,484,824.00 13,128,074.00 -11.1%
TOTAL, CERTIFICATED SALARIES 294,087,910.00 83,092,843.00 377,180,753.00 297,358,706.00 84,449,648.00 381,808,354.00 1.2%
CLASSIFIED SALARIES
Classified Instructional Salaries 2100 3,457,256.00 25,372,001.00 28,829,257.00 3,495,324.00 25,877,345.00 29,372,669.00 1.9%
Classified Support Salaries 2200 26,844,345.00 8,333,345.00 35,177,690.00 27,949,776.00 8,559,091.00 36,508,867.00 3.8%
Classified Supervisors' and Administrators' Salaries 2300 18,436,135.00 4,294,843.00 22,730,978.00 19,287,196.00 4,442,233.00 23,729,429.00 4.4%
Clerical, Technical and Office Salaries 2400 21,214,098.00 2,431,224.00 23,645,322.00 19,715,938.00 2,554,997.00 22,270,935.00 -5.8%
Other Classified Salaries 2900 3,984,336.00 1,012,876.00 4,997,212.00 4,662,675.00 856,436.00 5,519,111.00 10.4%
TOTAL, CLASSIFIED SALARIES 73,936,170.00 41,444,289.00 115,380,459.00 75,110,909.00 42,290,102.00 117,401,011.00 1.8%
EMPLOYEE BENEFITS
STRS 3101-3102 31,730,253.00 31,952,750.00 63,683,003.00 37,374,033.00 33,824,320.00 71,198,353.00 11.8%
PERS 3201-3202 7,551,105.00 3,918,521.00 11,469,626.00 8,734,053.00 3,936,300.00 12,670,353.00 10.5%
OASDI/Medicare/Alternative 3301-3302 9,376,183.00 4,104,305.00 13,480,488.00 9,750,461.00 3,780,884.00 13,531,345.00 0.4%
Health and Welfare Benefits 3401-3402 70,919,175.00 24,800,579.00 95,719,754.00 74,239,908.00 25,290,691.00 99,530,599.00 4.0%
Unemployment Insurance 3501-3502 192,180.00 61,053.00 253,233.00 187,567.00 62,648.00 250,215.00 -1.2%
Workers' Compensation 3601-3602 6,441,706.00 2,114,119.00 8,555,825.00 6,508,426.00 2,205,215.00 8,713,641.00 1.8%
OPEB, Allocated 3701-3702 657,696.00 217,660.00 875,356.00 596,368.00 238,826.00 835,194.00 -4.6%
OPEB, Active Employees 3751-3752 7,615,954.00 2,733,801.00 10,349,755.00 6,858,661.00 2,496,502.00 9,355,163.00 -9.6%
Other Employee Benefits 3901-3902 0.00 0.00 0.00 425.00 0.00 425.00 New
TOTAL, EMPLOYEE BENEFITS 134,484,252.00 69,902,788.00 204,387,040.00 144,249,902.00 71,835,386.00 216,085,288.00 5.7%
BOOKS AND SUPPLIES
Approved Textbooks and Core Curricula Materials 4100 2,820,188.00 4,088,635.00 6,908,823.00 17,301,351.00 2,976,335.00 20,277,686.00 193.5%
Books and Other Reference Materials 4200 210,379.00 747,442.00 957,821.00 64,237.00 853,868.00 918,105.00 -4.1%
Materials and Supplies 4300 9,668,769.00 8,548,731.00 18,217,500.00 19,329,105.00 16,965,478.00 36,294,583.00 99.2%

Long Beach UnifiedLos Angeles County
July 1 BudgetGeneral Fund
Unrestricted and RestrictedExpenditures by Object
19 64725 0000000Form 01
California Dept of EducationSACS Financial Reporting Software - 2016.1.0File: fund-a (Rev 03/22/2016) Page 12 Printed: 6/24/2016 3:03 PM
2015-16 Estimated Actuals 2016-17 Budget
Description Resource CodesObjectCodes
Unrestricted(A)
Restricted(B)
Total Fundcol. A + B
(C)Unrestricted
(D)Restricted
(E)
Total Fundcol. D + E
(F)
% DiffColumnC & F
Noncapitalized Equipment 4400 2,706,138.00 5,339,293.00 8,045,431.00 246,923.00 3,491,758.00 3,738,681.00 -53.5%
Food 4700 3,896.00 5,000.00 8,896.00 2,500.00 5,460.00 7,960.00 -10.5%
TOTAL, BOOKS AND SUPPLIES 15,409,370.00 18,729,101.00 34,138,471.00 36,944,116.00 24,292,899.00 61,237,015.00 79.4%
SERVICES AND OTHER OPERATING EXPENDITURES
Subagreements for Services 5100 66,000.00 8,834,066.00 8,900,066.00 300,000.00 11,225,000.00 11,525,000.00 29.5%
Travel and Conferences 5200 679,069.00 919,526.00 1,598,595.00 458,427.00 641,092.00 1,099,519.00 -31.2%
Dues and Memberships 5300 148,379.00 45,900.00 194,279.00 95,595.00 50,000.00 145,595.00 -25.1%
Insurance 5400 - 5450 0.00 700.00 700.00 0.00 0.00 0.00 -100.0%
Operations and Housekeeping Services 5500 11,237,153.00 10,000.00 11,247,153.00 11,820,807.00 10,000.00 11,830,807.00 5.2%
Rentals, Leases, Repairs, and Noncapitalized Improvements 5600 13,526,355.00 914,612.00 14,440,967.00 13,503,221.00 1,318,962.00 14,822,183.00 2.6%
Transfers of Direct Costs 5710 1,528,922.00 (1,528,922.00) 0.00 1,539,395.00 (1,539,395.00) 0.00 0.0%
Transfers of Direct Costs - Interfund 5750 (84,060.00) (560,000.00) (644,060.00) (401,918.00) (186,736.00) (588,654.00) -8.6%
Professional/Consulting Services and Operating Expenditures 5800 23,584,538.00 32,901,669.00 56,486,207.00 26,027,650.00 31,633,280.00 57,660,930.00 2.1%
Communications 5900 4,339,732.00 70,651.00 4,410,383.00 4,323,945.00 15,276.00 4,339,221.00 -1.6%
TOTAL, SERVICES AND OTHER OPERATING EXPENDITURES 55,026,088.00 41,608,202.00 96,634,290.00 57,667,122.00 43,167,479.00 100,834,601.00 4.3%
Long Beach UnifiedLos Angeles County
July 1 BudgetGeneral Fund
Unrestricted and RestrictedExpenditures by Object
19 64725 0000000Form 01
California Dept of EducationSACS Financial Reporting Software - 2016.1.0File: fund-a (Rev 03/22/2016) Page 13 Printed: 6/24/2016 3:03 PM
2015-16 Estimated Actuals 2016-17 Budget
Description Resource CodesObjectCodes
Unrestricted(A)
Restricted(B)
Total Fundcol. A + B
(C)Unrestricted
(D)Restricted
(E)
Total Fundcol. D + E
(F)
% DiffColumnC & F
CAPITAL OUTLAY
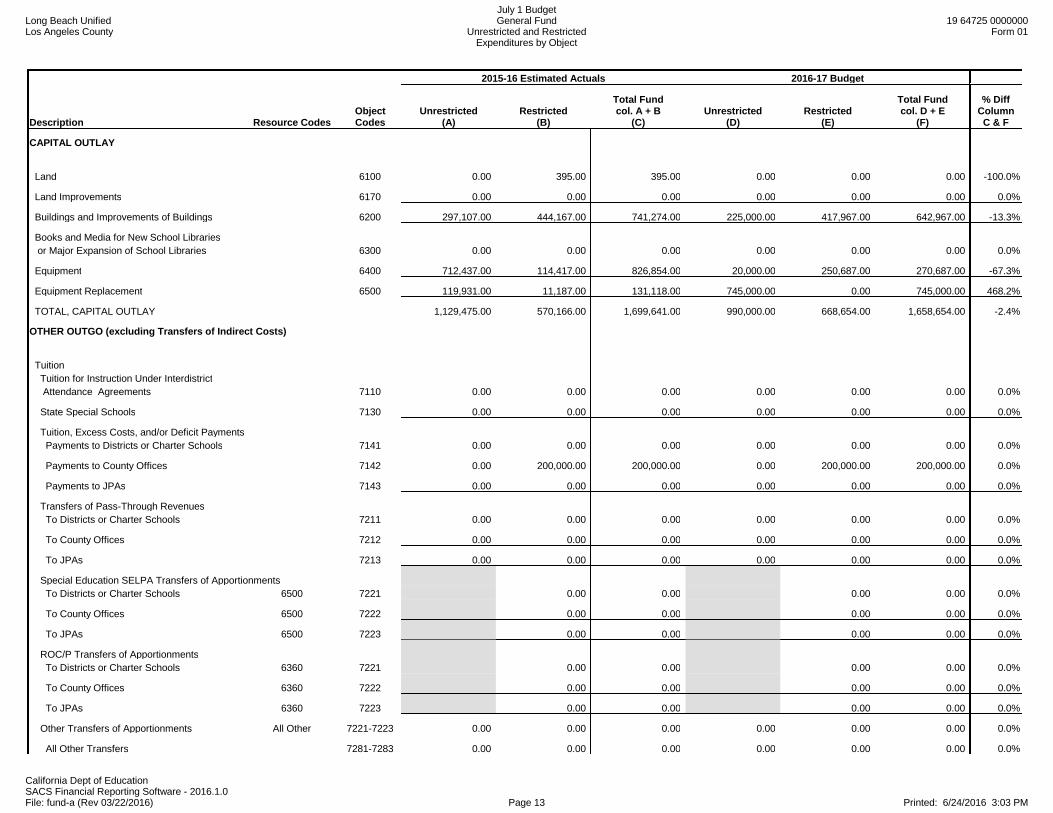
Land 6100 0.00 395.00 395.00 0.00 0.00 0.00 -100.0%
Land Improvements 6170 0.00 0.00 0.00 0.00 0.00 0.00 0.0%
Buildings and Improvements of Buildings 6200 297,107.00 444,167.00 741,274.00 225,000.00 417,967.00 642,967.00 -13.3%
Books and Media for New School Libraries or Major Expansion of School Libraries 6300 0.00 0.00 0.00 0.00 0.00 0.00 0.0%
Equipment 6400 712,437.00 114,417.00 826,854.00 20,000.00 250,687.00 270,687.00 -67.3%
Equipment Replacement 6500 119,931.00 11,187.00 131,118.00 745,000.00 0.00 745,000.00 468.2%
TOTAL, CAPITAL OUTLAY 1,129,475.00 570,166.00 1,699,641.00 990,000.00 668,654.00 1,658,654.00 -2.4%
OTHER OUTGO (excluding Transfers of Indirect Costs)
Tuition Tuition for Instruction Under Interdistrict Attendance Agreements 7110 0.00 0.00 0.00 0.00 0.00 0.00 0.0%
State Special Schools 7130 0.00 0.00 0.00 0.00 0.00 0.00 0.0%
Tuition, Excess Costs, and/or Deficit Payments Payments to Districts or Charter Schools 7141 0.00 0.00 0.00 0.00 0.00 0.00 0.0%
Payments to County Offices 7142 0.00 200,000.00 200,000.00 0.00 200,000.00 200,000.00 0.0%
Payments to JPAs 7143 0.00 0.00 0.00 0.00 0.00 0.00 0.0%
Transfers of Pass-Through Revenues To Districts or Charter Schools 7211 0.00 0.00 0.00 0.00 0.00 0.00 0.0%
To County Offices 7212 0.00 0.00 0.00 0.00 0.00 0.00 0.0%
To JPAs 7213 0.00 0.00 0.00 0.00 0.00 0.00 0.0%
Special Education SELPA Transfers of Apportionments To Districts or Charter Schools 6500 7221 0.00 0.00 0.00 0.00 0.0%
To County Offices 6500 7222 0.00 0.00 0.00 0.00 0.0%
To JPAs 6500 7223 0.00 0.00 0.00 0.00 0.0%
ROC/P Transfers of Apportionments To Districts or Charter Schools 6360 7221 0.00 0.00 0.00 0.00 0.0%
To County Offices 6360 7222 0.00 0.00 0.00 0.00 0.0%
To JPAs 6360 7223 0.00 0.00 0.00 0.00 0.0%
Other Transfers of Apportionments All Other 7221-7223 0.00 0.00 0.00 0.00 0.00 0.00 0.0%
All Other Transfers 7281-7283 0.00 0.00 0.00 0.00 0.00 0.00 0.0%
Long Beach UnifiedLos Angeles County
July 1 BudgetGeneral Fund
Unrestricted and RestrictedExpenditures by Object
19 64725 0000000Form 01
California Dept of EducationSACS Financial Reporting Software - 2016.1.0File: fund-a (Rev 03/22/2016) Page 14 Printed: 6/24/2016 3:03 PM
2015-16 Estimated Actuals 2016-17 Budget
Description Resource CodesObjectCodes
Unrestricted(A)
Restricted(B)
Total Fundcol. A + B
(C)Unrestricted
(D)Restricted
(E)
Total Fundcol. D + E
(F)
% DiffColumnC & F
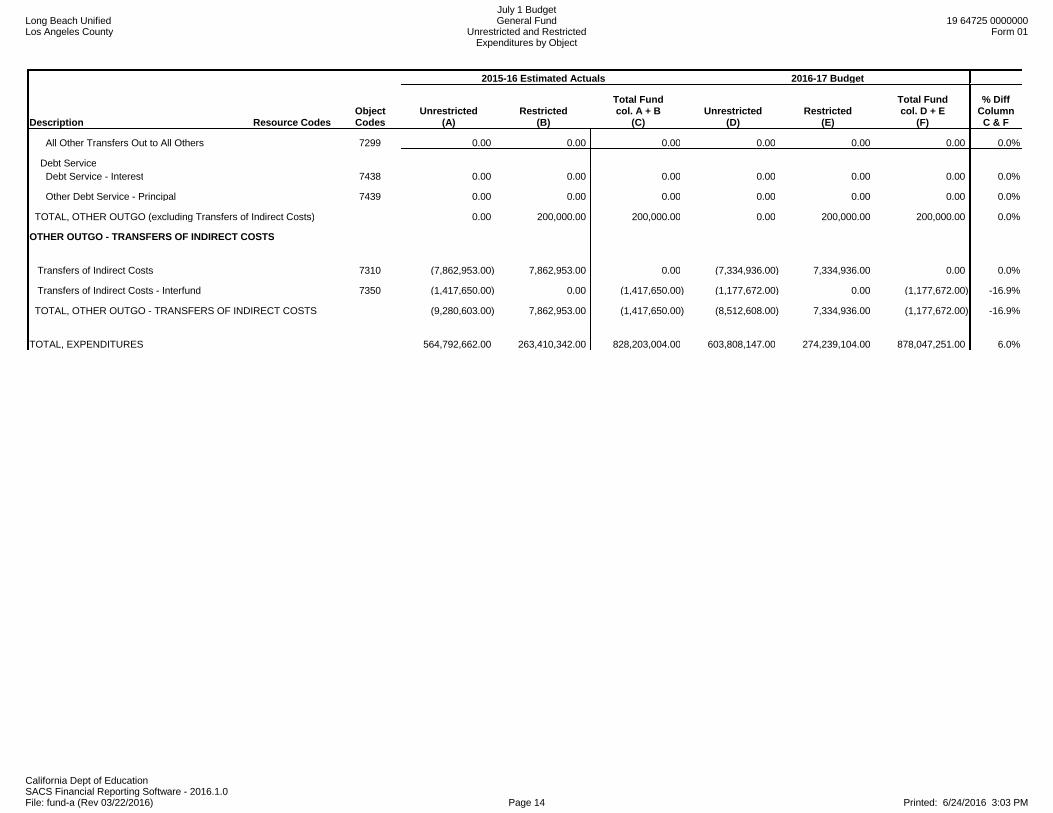
All Other Transfers Out to All Others 7299 0.00 0.00 0.00 0.00 0.00 0.00 0.0%
Debt Service Debt Service - Interest 7438 0.00 0.00 0.00 0.00 0.00 0.00 0.0%
Other Debt Service - Principal 7439 0.00 0.00 0.00 0.00 0.00 0.00 0.0%
TOTAL, OTHER OUTGO (excluding Transfers of Indirect Costs) 0.00 200,000.00 200,000.00 0.00 200,000.00 200,000.00 0.0%
OTHER OUTGO - TRANSFERS OF INDIRECT COSTS
Transfers of Indirect Costs 7310 (7,862,953.00) 7,862,953.00 0.00 (7,334,936.00) 7,334,936.00 0.00 0.0%
Transfers of Indirect Costs - Interfund 7350 (1,417,650.00) 0.00 (1,417,650.00) (1,177,672.00) 0.00 (1,177,672.00) -16.9%
TOTAL, OTHER OUTGO - TRANSFERS OF INDIRECT COSTS (9,280,603.00) 7,862,953.00 (1,417,650.00) (8,512,608.00) 7,334,936.00 (1,177,672.00) -16.9%
TOTAL, EXPENDITURES 564,792,662.00 263,410,342.00 828,203,004.00 603,808,147.00 274,239,104.00 878,047,251.00 6.0%

Long Beach UnifiedLos Angeles County
July 1 BudgetGeneral Fund
Unrestricted and RestrictedExpenditures by Object
19 64725 0000000Form 01
California Dept of EducationSACS Financial Reporting Software - 2016.1.0File: fund-a (Rev 03/22/2016) Page 15 Printed: 6/24/2016 3:03 PM
2015-16 Estimated Actuals 2016-17 Budget
Description Resource CodesObjectCodes
Unrestricted(A)
Restricted(B)
Total Fundcol. A + B
(C)Unrestricted
(D)Restricted
(E)
Total Fundcol. D + E
(F)
% DiffColumnC & F
INTERFUND TRANSFERS
INTERFUND TRANSFERS IN
From: Special Reserve Fund 8912 2,200,000.00 0.00 2,200,000.00 500,000.00 0.00 500,000.00 -77.3%
From: Bond Interest and Redemption Fund 8914 0.00 0.00 0.00 0.00 0.00 0.00 0.0%
Other Authorized Interfund Transfers In 8919 0.00 0.00 0.00 0.00 0.00 0.00 0.0%
(a) TOTAL, INTERFUND TRANSFERS IN 2,200,000.00 0.00 2,200,000.00 500,000.00 0.00 500,000.00 -77.3%
INTERFUND TRANSFERS OUT
To: Child Development Fund 7611 0.00 0.00 0.00 0.00 0.00 0.00 0.0%
To: Special Reserve Fund 7612 0.00 0.00 0.00 0.00 0.00 0.00 0.0%
To: State School Building Fund/ County School Facilities Fund 7613 0.00 0.00 0.00 0.00 0.00 0.00 0.0%
To: Cafeteria Fund 7616 0.00 0.00 0.00 0.00 0.00 0.00 0.0%
Other Authorized Interfund Transfers Out 7619 4,000,000.00 0.00 4,000,000.00 4,000,000.00 0.00 4,000,000.00 0.0%
(b) TOTAL, INTERFUND TRANSFERS OUT 4,000,000.00 0.00 4,000,000.00 4,000,000.00 0.00 4,000,000.00 0.0%
OTHER SOURCES/USES
SOURCES State Apportionments Emergency Apportionments 8931 0.00 0.00 0.00 0.00 0.00 0.00 0.0%
Proceeds
Proceeds from Sale/Lease- Purchase of Land/Buildings 8953 0.00 0.00 0.00 0.00 0.00 0.00 0.0%
Other Sources
Transfers from Funds of Lapsed/Reorganized LEAs 8965 0.00 0.00 0.00 0.00 0.00 0.00 0.0%
Long-Term Debt Proceeds Proceeds from Certificates of Participation 8971 0.00 0.00 0.00 0.00 0.00 0.00 0.0%
Proceeds from Capital Leases 8972 0.00 0.00 0.00 0.00 0.00 0.00 0.0%
Proceeds from Lease Revenue Bonds 8973 0.00 0.00 0.00 0.00 0.00 0.00 0.0%
All Other Financing Sources 8979 0.00 0.00 0.00 0.00 0.00 0.00 0.0%

Long Beach UnifiedLos Angeles County
July 1 BudgetGeneral Fund
Unrestricted and RestrictedExpenditures by Object
19 64725 0000000Form 01
California Dept of EducationSACS Financial Reporting Software - 2016.1.0File: fund-a (Rev 03/22/2016) Page 16 Printed: 6/24/2016 3:03 PM
2015-16 Estimated Actuals 2016-17 Budget
Description Resource CodesObjectCodes
Unrestricted(A)
Restricted(B)
Total Fundcol. A + B
(C)Unrestricted
(D)Restricted
(E)
Total Fundcol. D + E
(F)
% DiffColumnC & F
(c) TOTAL, SOURCES 0.00 0.00 0.00 0.00 0.00 0.00 0.0%
USES
Transfers of Funds from Lapsed/Reorganized LEAs 7651 0.00 0.00 0.00 0.00 0.00 0.00 0.0%
All Other Financing Uses 7699 0.00 0.00 0.00 0.00 0.00 0.00 0.0%
(d) TOTAL, USES 0.00 0.00 0.00 0.00 0.00 0.00 0.0%
CONTRIBUTIONS
Contributions from Unrestricted Revenues 8980 (100,429,481.00) 100,429,481.00 0.00 (108,026,544.00) 108,026,544.00 0.00 0.0%
Contributions from Restricted Revenues 8990 0.00 0.00 0.00 0.00 0.00 0.00 0.0%
(e) TOTAL, CONTRIBUTIONS (100,429,481.00) 100,429,481.00 0.00 (108,026,544.00) 108,026,544.00 0.00 0.0%
TOTAL, OTHER FINANCING SOURCES/USES (a - b + c - d + e) (102,229,481.00) 100,429,481.00 (1,800,000.00) (111,526,544.00) 108,026,544.00 (3,500,000.00) 94.4%

Long Beach UnifiedLos Angeles County
July 1 BudgetAdult Education Fund
Expenditures by Object19 64725 0000000
Form 11
California Dept of EducationSACS Financial Reporting Software - 2016.1.0File: fund-b (Rev 03/08/2016) Page 1 Printed: 6/24/2016 3:04 PM
Description Resource Codes Object Codes2015-16
Estimated Actuals2016-17Budget
PercentDifference
A. REVENUES
1) LCFF Sources 8010-8099 0.00 0.00 0.0%
2) Federal Revenue 8100-8299 249,672.00 242,600.00 -2.8%
3) Other State Revenue 8300-8599 2,342,105.00 2,339,503.00 -0.1%
4) Other Local Revenue 8600-8799 250,713.00 223,000.00 -11.1%
5) TOTAL, REVENUES 2,842,490.00 2,805,103.00 -1.3%
B. EXPENDITURES
1) Certificated Salaries 1000-1999 801,757.00 813,227.00 1.4%
2) Classified Salaries 2000-2999 69,570.00 72,052.00 3.6%
3) Employee Benefits 3000-3999 349,100.00 366,718.00 5.0%
4) Books and Supplies 4000-4999 9,914.00 331,052.00 3239.2%
5) Services and Other Operating Expenditures 5000-5999 171,098.00 145,790.00 -14.8%
6) Capital Outlay 6000-6999 0.00 0.00 0.0%
7) Other Outgo (excluding Transfers of Indirect 7100-7299, Costs) 7400-7499 1,076,264.00 1,076,264.00 0.0%
8) Other Outgo - Transfers of Indirect Costs 7300-7399 0.00 0.00 0.0%
9) TOTAL, EXPENDITURES 2,477,703.00 2,805,103.00 13.2%
C. EXCESS (DEFICIENCY) OF REVENUES OVER EXPENDITURES BEFORE OTHER FINANCING SOURCES AND USES (A5 - B9) 364,787.00 0.00 -100.0%
D. OTHER FINANCING SOURCES/USES 1) Interfund Transfers a) Transfers In 8900-8929 0.00 0.00 0.0%
b) Transfers Out 7600-7629 0.00 0.00 0.0%
2) Other Sources/Uses a) Sources 8930-8979 0.00 0.00 0.0%
b) Uses 7630-7699 0.00 0.00 0.0%
3) Contributions 8980-8999 0.00 0.00 0.0%
4) TOTAL, OTHER FINANCING SOURCES/USES 0.00 0.00 0.0%

Long Beach UnifiedLos Angeles County
July 1 BudgetAdult Education Fund
Expenditures by Object19 64725 0000000
Form 11
California Dept of EducationSACS Financial Reporting Software - 2016.1.0File: fund-b (Rev 03/08/2016) Page 2 Printed: 6/24/2016 3:04 PM
Description Resource Codes Object Codes2015-16
Estimated Actuals2016-17Budget
PercentDifference
E. NET INCREASE (DECREASE) IN FUND BALANCE (C + D4) 364,787.00 0.00 -100.0%
F. FUND BALANCE, RESERVES 1) Beginning Fund Balance a) As of July 1 - Unaudited 9791 94,565.56 459,352.56 385.8%
b) Audit Adjustments 9793 0.00 0.00 0.0%
c) As of July 1 - Audited (F1a + F1b) 94,565.56 459,352.56 385.8%
d) Other Restatements 9795 0.00 0.00 0.0%
e) Adjusted Beginning Balance (F1c + F1d) 94,565.56 459,352.56 385.8%
2) Ending Balance, June 30 (E + F1e) 459,352.56 459,352.56 0.0% Components of Ending Fund Balance a) Nonspendable Revolving Cash 9711 0.00 0.00 0.0%
Stores 9712 0.00 0.00 0.0%
Prepaid Expenditures 9713 0.00 0.00 0.0%
All Others 9719 0.00 0.00 0.0%
b) Restricted 9740 459,353.00 459,353.00 0.0%
c) Committed Stabilization Arrangements 9750 0.00 0.00 0.0%
Other Commitments 9760 0.00 0.00 0.0%
d) Assigned Other Assignments 9780 0.00 0.00 0.0%
e) Unassigned/Unappropriated Reserve for Economic Uncertainties 9789 0.00 0.00 0.0%
Unassigned/Unappropriated Amount 9790 (0.44) (0.44) 0.0%
Long Beach UnifiedLos Angeles County
July 1 BudgetAdult Education Fund
Expenditures by Object19 64725 0000000
Form 11
California Dept of EducationSACS Financial Reporting Software - 2016.1.0File: fund-b (Rev 03/08/2016) Page 3 Printed: 6/24/2016 3:04 PM
Description Resource Codes Object Codes2015-16
Estimated Actuals2016-17Budget
PercentDifference
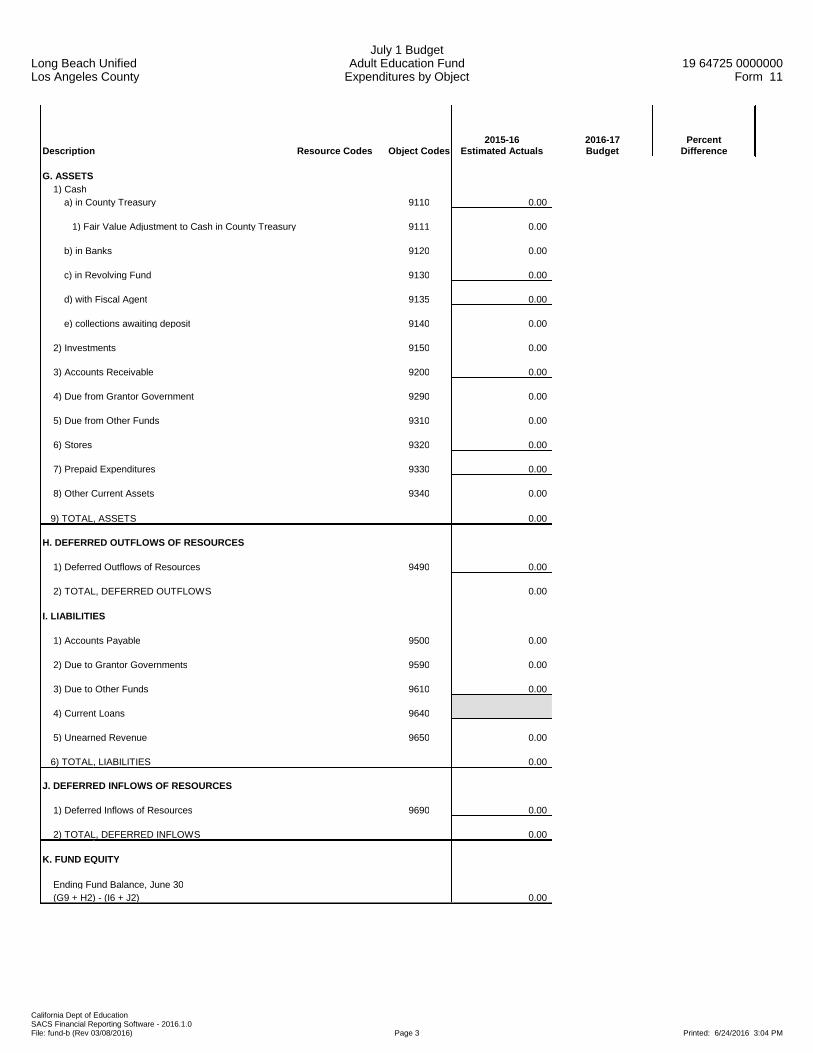
G. ASSETS 1) Cash a) in County Treasury 9110 0.00
1) Fair Value Adjustment to Cash in County Treasury 9111 0.00
b) in Banks 9120 0.00
c) in Revolving Fund 9130 0.00
d) with Fiscal Agent 9135 0.00
e) collections awaiting deposit 9140 0.00
2) Investments 9150 0.00
3) Accounts Receivable 9200 0.00
4) Due from Grantor Government 9290 0.00
5) Due from Other Funds 9310 0.00
6) Stores 9320 0.00
7) Prepaid Expenditures 9330 0.00
8) Other Current Assets 9340 0.00
9) TOTAL, ASSETS 0.00
H. DEFERRED OUTFLOWS OF RESOURCES
1) Deferred Outflows of Resources 9490 0.00
2) TOTAL, DEFERRED OUTFLOWS 0.00
I. LIABILITIES
1) Accounts Payable 9500 0.00
2) Due to Grantor Governments 9590 0.00
3) Due to Other Funds 9610 0.00
4) Current Loans 9640
5) Unearned Revenue 9650 0.00
6) TOTAL, LIABILITIES 0.00
J. DEFERRED INFLOWS OF RESOURCES
1) Deferred Inflows of Resources 9690 0.00
2) TOTAL, DEFERRED INFLOWS 0.00
K. FUND EQUITY
Ending Fund Balance, June 30 (G9 + H2) - (I6 + J2) 0.00

Long Beach UnifiedLos Angeles County
July 1 BudgetAdult Education Fund
Expenditures by Object19 64725 0000000
Form 11
California Dept of EducationSACS Financial Reporting Software - 2016.1.0File: fund-b (Rev 03/08/2016) Page 4 Printed: 6/24/2016 3:04 PM
Description Resource Codes Object Codes2015-16
Estimated Actuals2016-17Budget
PercentDifference
LCFF SOURCES
LCFF Transfers
LCFF Transfers - Current Year 8091 0.00 0.00 0.0%
LCFF/Revenue Limit Transfers - Prior Years 8099 0.00 0.00 0.0%
TOTAL, LCFF SOURCES 0.00 0.00 0.0%
FEDERAL REVENUE
Interagency Contracts Between LEAs 8285 0.00 0.00 0.0%
No Child Left Behind 3105, 4045 8290 0.00 0.00 0.0%
Vocational and Applied Technology Education 3500-3699 8290 0.00 0.00 0.0%
Safe and Drug Free Schools 3700-3799 8290 0.00 0.00 0.0%
All Other Federal Revenue All Other 8290 249,672.00 242,600.00 -2.8%
TOTAL, FEDERAL REVENUE 249,672.00 242,600.00 -2.8%
OTHER STATE REVENUE
Other State Apportionments
All Other State Apportionments - Current Year 8311 0.00 0.00 0.0%
All Other State Apportionments - Prior Years 8319 0.00 0.00 0.0%
Pass-Through Revenues from State Sources 8587 1,076,264.00 1,076,264.00 0.0%
Adult Education Block Grant Program 6391 8590 1,128,239.00 1,128,239.00 0.0%
All Other State Revenue All Other 8590 137,602.00 135,000.00 -1.9%
TOTAL, OTHER STATE REVENUE 2,342,105.00 2,339,503.00 -0.1%

Long Beach UnifiedLos Angeles County
July 1 BudgetAdult Education Fund
Expenditures by Object19 64725 0000000
Form 11
California Dept of EducationSACS Financial Reporting Software - 2016.1.0File: fund-b (Rev 03/08/2016) Page 5 Printed: 6/24/2016 3:04 PM
Description Resource Codes Object Codes2015-16
Estimated Actuals2016-17Budget
PercentDifference
OTHER LOCAL REVENUE
Other Local Revenue
Sales Sale of Equipment/Supplies 8631 0.00 0.00 0.0%
Leases and Rentals 8650 0.00 0.00 0.0%
Interest 8660 2,243.00 0.00 -100.0%
Net Increase (Decrease) in the Fair Value of Investments 8662 0.00 0.00 0.0%
Fees and Contracts Adult Education Fees 8671 0.00 0.00 0.0%
Interagency Services 8677 0.00 0.00 0.0%
Other Local Revenue
All Other Local Revenue 8699 248,470.00 223,000.00 -10.3%
Tuition 8710 0.00 0.00 0.0%
TOTAL, OTHER LOCAL REVENUE 250,713.00 223,000.00 -11.1%
TOTAL, REVENUES 2,842,490.00 2,805,103.00 -1.3%

Long Beach UnifiedLos Angeles County
July 1 BudgetAdult Education Fund
Expenditures by Object19 64725 0000000
Form 11
California Dept of EducationSACS Financial Reporting Software - 2016.1.0File: fund-b (Rev 03/08/2016) Page 6 Printed: 6/24/2016 3:04 PM
Description Resource Codes Object Codes2015-16
Estimated Actuals2016-17Budget
PercentDifference
CERTIFICATED SALARIES
Certificated Teachers' Salaries 1100 755,590.00 751,905.00 -0.5%
Certificated Pupil Support Salaries 1200 0.00 0.00 0.0%
Certificated Supervisors' and Administrators' Salaries 1300 46,167.00 61,322.00 32.8%
Other Certificated Salaries 1900 0.00 0.00 0.0%
TOTAL, CERTIFICATED SALARIES 801,757.00 813,227.00 1.4%
CLASSIFIED SALARIES
Classified Instructional Salaries 2100 31,450.00 37,427.00 19.0%
Classified Support Salaries 2200 2,484.00 0.00 -100.0%
Classified Supervisors' and Administrators' Salaries 2300 5,208.00 6,180.00 18.7%
Clerical, Technical and Office Salaries 2400 4,648.00 21,081.00 353.5%
Other Classified Salaries 2900 25,780.00 7,364.00 -71.4%
TOTAL, CLASSIFIED SALARIES 69,570.00 72,052.00 3.6%
EMPLOYEE BENEFITS
STRS 3101-3102 193,560.00 222,308.00 14.9%
PERS 3201-3202 8,154.00 8,127.00 -0.3%
OASDI/Medicare/Alternative 3301-3302 14,663.00 16,845.00 14.9%
Health and Welfare Benefits 3401-3402 107,991.00 93,472.00 -13.4%
Unemployment Insurance 3501-3502 383.00 443.00 15.7%
Workers' Compensation 3601-3602 13,353.00 15,493.00 16.0%
OPEB, Allocated 3701-3702 1,373.00 1,417.00 3.2%
OPEB, Active Employees 3751-3752 9,623.00 8,613.00 -10.5%
Other Employee Benefits 3901-3902 0.00 0.00 0.0%
TOTAL, EMPLOYEE BENEFITS 349,100.00 366,718.00 5.0%
BOOKS AND SUPPLIES
Approved Textbooks and Core Curricula Materials 4100 1,114.00 0.00 -100.0%
Books and Other Reference Materials 4200 800.00 0.00 -100.0%
Materials and Supplies 4300 8,000.00 331,052.00 4038.2%
Noncapitalized Equipment 4400 0.00 0.00 0.0%
TOTAL, BOOKS AND SUPPLIES 9,914.00 331,052.00 3239.2%

Long Beach UnifiedLos Angeles County
July 1 BudgetAdult Education Fund
Expenditures by Object19 64725 0000000
Form 11
California Dept of EducationSACS Financial Reporting Software - 2016.1.0File: fund-b (Rev 03/08/2016) Page 7 Printed: 6/24/2016 3:04 PM
Description Resource Codes Object Codes2015-16
Estimated Actuals2016-17Budget
PercentDifference
SERVICES AND OTHER OPERATING EXPENDITURES
Subagreements for Services 5100 0.00 0.00 0.0%
Travel and Conferences 5200 1,007.00 600.00 -40.4%
Dues and Memberships 5300 0.00 0.00 0.0%
Insurance 5400-5450 0.00 0.00 0.0%
Operations and Housekeeping Services 5500 15,300.00 25,500.00 66.7%
Rentals, Leases, Repairs, and Noncapitalized Improvements 5600 0.00 0.00 0.0%
Transfers of Direct Costs 5710 0.00 0.00 0.0%
Transfers of Direct Costs - Interfund 5750 1,500.00 1,800.00 20.0%
Professional/Consulting Services and Operating Expenditures 5800 152,541.00 115,290.00 -24.4%
Communications 5900 750.00 2,600.00 246.7%
TOTAL, SERVICES AND OTHER OPERATING EXPENDITURES 171,098.00 145,790.00 -14.8%
CAPITAL OUTLAY
Land 6100 0.00 0.00 0.0%
Land Improvements 6170 0.00 0.00 0.0%
Buildings and Improvements of Buildings 6200 0.00 0.00 0.0%
Equipment 6400 0.00 0.00 0.0%
Equipment Replacement 6500 0.00 0.00 0.0%
TOTAL, CAPITAL OUTLAY 0.00 0.00 0.0%
OTHER OUTGO (excluding Transfers of Indirect Costs)
Tuition
Tuition, Excess Costs, and/or Deficit Payments Payments to Districts or Charter Schools 7141 0.00 0.00 0.0%
Payments to County Offices 7142 0.00 0.00 0.0%
Payments to JPAs 7143 0.00 0.00 0.0%
Other Transfers Out
Transfers of Pass-Through Revenues To Districts or Charter Schools 7211 1,076,264.00 1,076,264.00 0.0%
To County Offices 7212 0.00 0.00 0.0%
To JPAs 7213 0.00 0.00 0.0%
Debt Service
Debt Service - Interest 7438 0.00 0.00 0.0%
Other Debt Service - Principal 7439 0.00 0.00 0.0%
TOTAL, OTHER OUTGO (excluding Transfers of Indirect Costs) 1,076,264.00 1,076,264.00 0.0%
Long Beach UnifiedLos Angeles County
July 1 BudgetAdult Education Fund
Expenditures by Object19 64725 0000000
Form 11
California Dept of EducationSACS Financial Reporting Software - 2016.1.0File: fund-b (Rev 03/08/2016) Page 8 Printed: 6/24/2016 3:04 PM
Description Resource Codes Object Codes2015-16
Estimated Actuals2016-17Budget
PercentDifference
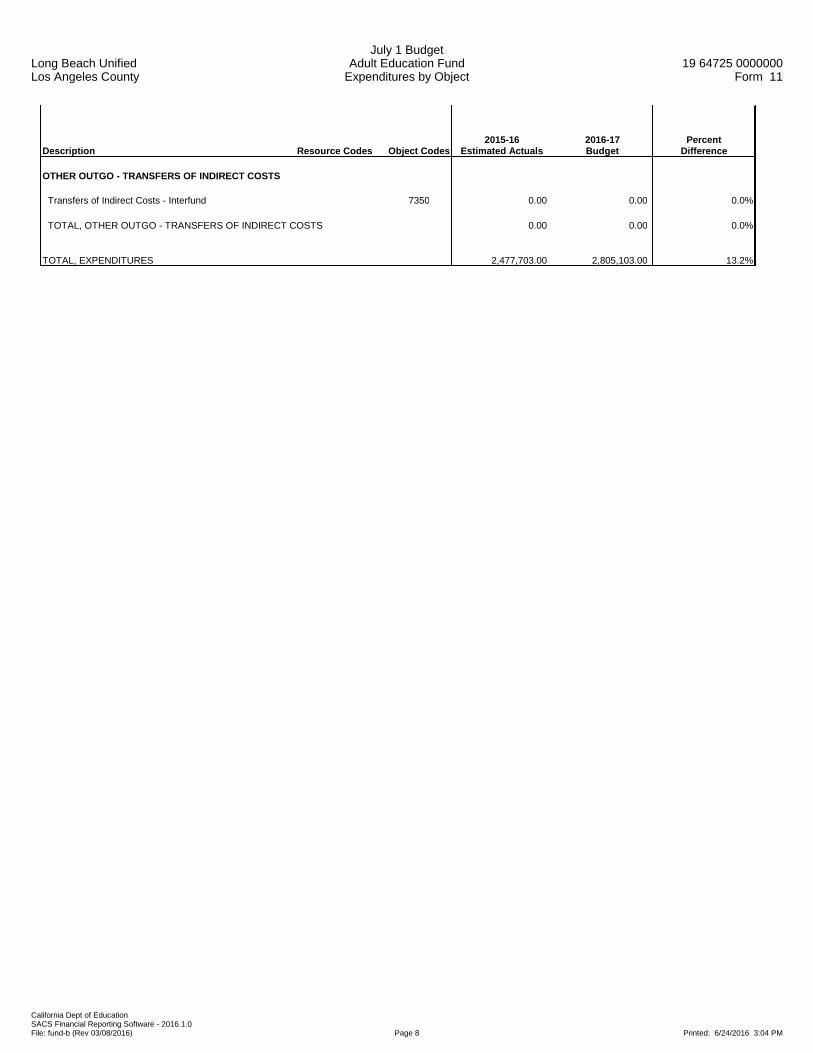
OTHER OUTGO - TRANSFERS OF INDIRECT COSTS
Transfers of Indirect Costs - Interfund 7350 0.00 0.00 0.0%
TOTAL, OTHER OUTGO - TRANSFERS OF INDIRECT COSTS 0.00 0.00 0.0%
TOTAL, EXPENDITURES 2,477,703.00 2,805,103.00 13.2%

Long Beach UnifiedLos Angeles County
July 1 BudgetAdult Education Fund
Expenditures by Object19 64725 0000000
Form 11
California Dept of EducationSACS Financial Reporting Software - 2016.1.0File: fund-b (Rev 03/08/2016) Page 9 Printed: 6/24/2016 3:04 PM
Description Resource Codes Object Codes2015-16
Estimated Actuals2016-17Budget
PercentDifference
INTERFUND TRANSFERS
INTERFUND TRANSFERS IN
Other Authorized Interfund Transfers In 8919 0.00 0.00 0.0%
(a) TOTAL, INTERFUND TRANSFERS IN 0.00 0.00 0.0%
INTERFUND TRANSFERS OUT
To: State School Building Fund/ County School Facilities Fund 7613 0.00 0.00 0.0%
Other Authorized Interfund Transfers Out 7619 0.00 0.00 0.0%
(b) TOTAL, INTERFUND TRANSFERS OUT 0.00 0.00 0.0%
OTHER SOURCES/USES
SOURCES
Other Sources
Transfers from Funds of Lapsed/Reorganized LEAs 8965 0.00 0.00 0.0%
Long-Term Debt Proceeds Proceeds from Certificates of Participation 8971 0.00 0.00 0.0%
Proceeds from Capital Leases 8972 0.00 0.00 0.0%
All Other Financing Sources 8979 0.00 0.00 0.0%
(c) TOTAL, SOURCES 0.00 0.00 0.0%
USES
Transfers of Funds from Lapsed/Reorganized LEAs 7651 0.00 0.00 0.0%
All Other Financing Uses 7699 0.00 0.00 0.0%
(d) TOTAL, USES 0.00 0.00 0.0%
CONTRIBUTIONS
Contributions from Unrestricted Revenues 8980 0.00 0.00 0.0%
Contributions from Restricted Revenues 8990 0.00 0.00 0.0%
(e) TOTAL, CONTRIBUTIONS 0.00 0.00 0.0%
TOTAL, OTHER FINANCING SOURCES/USES (a - b + c - d + e) 0.00 0.00 0.0%

Long Beach UnifiedLos Angeles County
July 1 BudgetChild Development FundExpenditures by Object
19 64725 0000000Form 12
California Dept of EducationSACS Financial Reporting Software - 2016.1.0File: fund-b (Rev 03/08/2016) Page 1 Printed: 6/24/2016 3:04 PM
Description Resource Codes Object Codes2015-16
Estimated Actuals2016-17Budget
PercentDifference
A. REVENUES
1) LCFF Sources 8010-8099 0.00 0.00 0.0%
2) Federal Revenue 8100-8299 21,881,196.00 21,784,215.00 -0.4%
3) Other State Revenue 8300-8599 8,441,736.00 8,059,613.00 -4.5%
4) Other Local Revenue 8600-8799 1,224,873.00 1,364,720.00 11.4%
5) TOTAL, REVENUES 31,547,805.00 31,208,548.00 -1.1%
B. EXPENDITURES
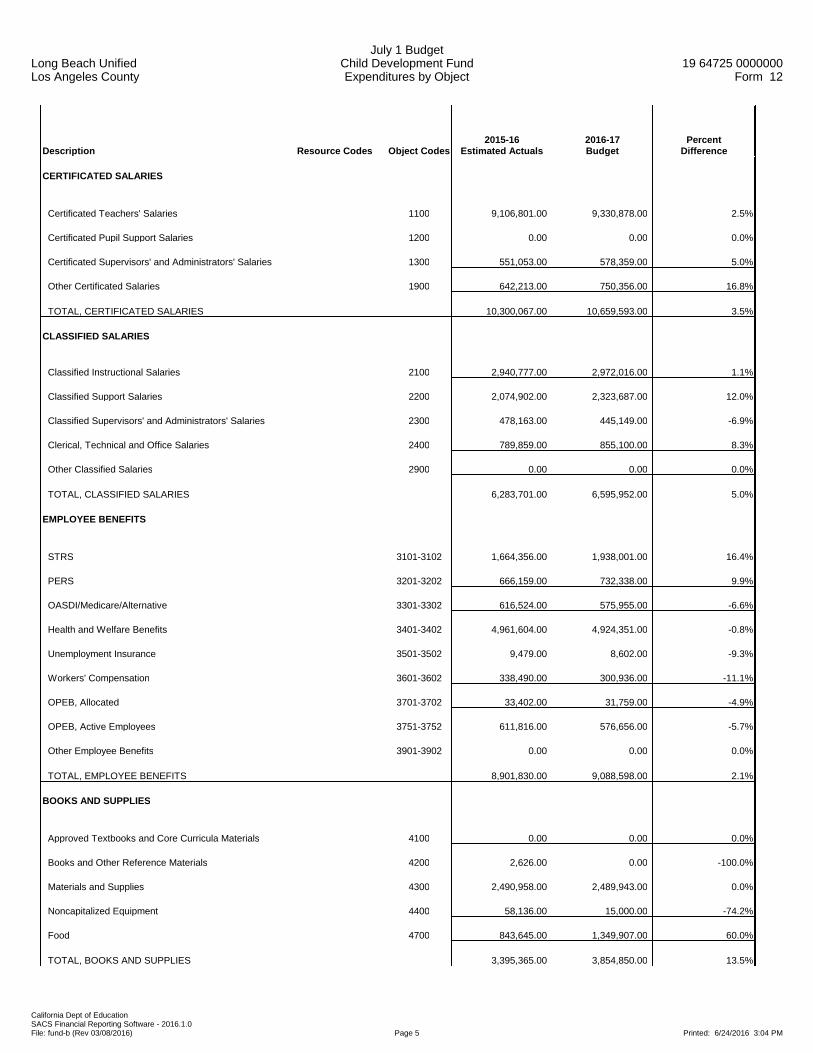
1) Certificated Salaries 1000-1999 10,300,067.00 10,659,593.00 3.5%
2) Classified Salaries 2000-2999 6,283,701.00 6,595,952.00 5.0%
3) Employee Benefits 3000-3999 8,901,830.00 9,088,598.00 2.1%
4) Books and Supplies 4000-4999 3,395,365.00 3,854,850.00 13.5%
5) Services and Other Operating Expenditures 5000-5999 1,625,417.00 1,081,942.00 -33.4%
6) Capital Outlay 6000-6999 0.00 35,000.00 New
7) Other Outgo (excluding Transfers of Indirect 7100-7299, Costs) 7400-7499 0.00 0.00 0.0%
8) Other Outgo - Transfers of Indirect Costs 7300-7399 1,042,650.00 923,368.00 -11.4%
9) TOTAL, EXPENDITURES 31,549,030.00 32,239,303.00 2.2%
C. EXCESS (DEFICIENCY) OF REVENUES OVER EXPENDITURES BEFORE OTHER FINANCING SOURCES AND USES (A5 - B9) (1,225.00) (1,030,755.00) 84043.3%
D. OTHER FINANCING SOURCES/USES 1) Interfund Transfers a) Transfers In 8900-8929 0.00 0.00 0.0%
b) Transfers Out 7600-7629 0.00 0.00 0.0%
2) Other Sources/Uses a) Sources 8930-8979 0.00 0.00 0.0%
b) Uses 7630-7699 0.00 0.00 0.0%
3) Contributions 8980-8999 0.00 0.00 0.0%
4) TOTAL, OTHER FINANCING SOURCES/USES 0.00 0.00 0.0%

Long Beach UnifiedLos Angeles County
July 1 BudgetChild Development FundExpenditures by Object
19 64725 0000000Form 12
California Dept of EducationSACS Financial Reporting Software - 2016.1.0File: fund-b (Rev 03/08/2016) Page 2 Printed: 6/24/2016 3:04 PM
Description Resource Codes Object Codes2015-16
Estimated Actuals2016-17Budget
PercentDifference
E. NET INCREASE (DECREASE) IN FUND BALANCE (C + D4) (1,225.00) (1,030,755.00) 84043.3%
F. FUND BALANCE, RESERVES 1) Beginning Fund Balance a) As of July 1 - Unaudited 9791 1,336,238.77 1,335,013.77 -0.1%
b) Audit Adjustments 9793 0.00 0.00 0.0%
c) As of July 1 - Audited (F1a + F1b) 1,336,238.77 1,335,013.77 -0.1%
d) Other Restatements 9795 0.00 0.00 0.0%
e) Adjusted Beginning Balance (F1c + F1d) 1,336,238.77 1,335,013.77 -0.1%
2) Ending Balance, June 30 (E + F1e) 1,335,013.77 304,258.77 -77.2% Components of Ending Fund Balance a) Nonspendable Revolving Cash 9711 0.00 0.00 0.0%
Stores 9712 0.00 0.00 0.0%
Prepaid Expenditures 9713 0.00 0.00 0.0%
All Others 9719 0.00 0.00 0.0%
b) Restricted 9740 1,335,013.77 304,259.45 -77.2%
c) Committed Stabilization Arrangements 9750 0.00 0.00 0.0%
Other Commitments 9760 0.00 0.00 0.0%
d) Assigned Other Assignments 9780 0.00 0.00 0.0%
e) Unassigned/Unappropriated Reserve for Economic Uncertainties 9789 0.00 0.00 0.0%
Unassigned/Unappropriated Amount 9790 0.00 (0.68) New

Long Beach UnifiedLos Angeles County
July 1 BudgetChild Development FundExpenditures by Object
19 64725 0000000Form 12
California Dept of EducationSACS Financial Reporting Software - 2016.1.0File: fund-b (Rev 03/08/2016) Page 3 Printed: 6/24/2016 3:04 PM
Description Resource Codes Object Codes2015-16
Estimated Actuals2016-17Budget
PercentDifference
G. ASSETS 1) Cash a) in County Treasury 9110 0.00
1) Fair Value Adjustment to Cash in County Treasury 9111 0.00
b) in Banks 9120 0.00
c) in Revolving Fund 9130 0.00
d) with Fiscal Agent 9135 0.00
e) collections awaiting deposit 9140 0.00
2) Investments 9150 0.00
3) Accounts Receivable 9200 0.00
4) Due from Grantor Government 9290 0.00
5) Due from Other Funds 9310 0.00
6) Stores 9320 0.00
7) Prepaid Expenditures 9330 0.00
8) Other Current Assets 9340 0.00
9) TOTAL, ASSETS 0.00
H. DEFERRED OUTFLOWS OF RESOURCES
1) Deferred Outflows of Resources 9490 0.00
2) TOTAL, DEFERRED OUTFLOWS 0.00
I. LIABILITIES
1) Accounts Payable 9500 0.00
2) Due to Grantor Governments 9590 0.00
3) Due to Other Funds 9610 0.00
4) Current Loans 9640
5) Unearned Revenue 9650 0.00
6) TOTAL, LIABILITIES 0.00
J. DEFERRED INFLOWS OF RESOURCES
1) Deferred Inflows of Resources 9690 0.00
2) TOTAL, DEFERRED INFLOWS 0.00
K. FUND EQUITY
Ending Fund Balance, June 30 (G9 + H2) - (I6 + J2) 0.00
Long Beach UnifiedLos Angeles County
July 1 BudgetChild Development FundExpenditures by Object
19 64725 0000000Form 12
California Dept of EducationSACS Financial Reporting Software - 2016.1.0File: fund-b (Rev 03/08/2016) Page 4 Printed: 6/24/2016 3:04 PM
Description Resource Codes Object Codes2015-16
Estimated Actuals2016-17Budget
PercentDifference
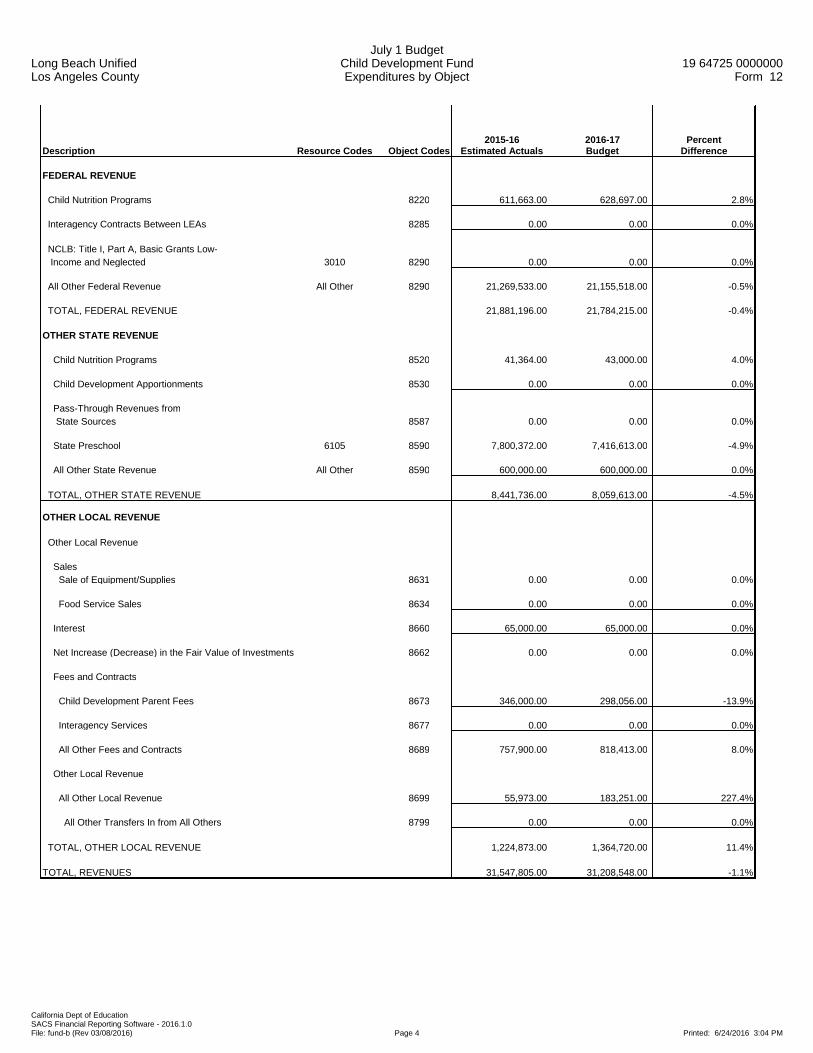
FEDERAL REVENUE
Child Nutrition Programs 8220 611,663.00 628,697.00 2.8%
Interagency Contracts Between LEAs 8285 0.00 0.00 0.0%
NCLB: Title I, Part A, Basic Grants Low- Income and Neglected 3010 8290 0.00 0.00 0.0%
All Other Federal Revenue All Other 8290 21,269,533.00 21,155,518.00 -0.5%
TOTAL, FEDERAL REVENUE 21,881,196.00 21,784,215.00 -0.4%
OTHER STATE REVENUE
Child Nutrition Programs 8520 41,364.00 43,000.00 4.0%
Child Development Apportionments 8530 0.00 0.00 0.0%
Pass-Through Revenues from State Sources 8587 0.00 0.00 0.0%
State Preschool 6105 8590 7,800,372.00 7,416,613.00 -4.9%
All Other State Revenue All Other 8590 600,000.00 600,000.00 0.0%
TOTAL, OTHER STATE REVENUE 8,441,736.00 8,059,613.00 -4.5%
OTHER LOCAL REVENUE
Other Local Revenue
Sales Sale of Equipment/Supplies 8631 0.00 0.00 0.0%
Food Service Sales 8634 0.00 0.00 0.0%
Interest 8660 65,000.00 65,000.00 0.0%
Net Increase (Decrease) in the Fair Value of Investments 8662 0.00 0.00 0.0%
Fees and Contracts
Child Development Parent Fees 8673 346,000.00 298,056.00 -13.9%
Interagency Services 8677 0.00 0.00 0.0%
All Other Fees and Contracts 8689 757,900.00 818,413.00 8.0%
Other Local Revenue
All Other Local Revenue 8699 55,973.00 183,251.00 227.4%
All Other Transfers In from All Others 8799 0.00 0.00 0.0%
TOTAL, OTHER LOCAL REVENUE 1,224,873.00 1,364,720.00 11.4%
TOTAL, REVENUES 31,547,805.00 31,208,548.00 -1.1%
Long Beach UnifiedLos Angeles County
July 1 BudgetChild Development FundExpenditures by Object
19 64725 0000000Form 12
California Dept of EducationSACS Financial Reporting Software - 2016.1.0File: fund-b (Rev 03/08/2016) Page 5 Printed: 6/24/2016 3:04 PM
Description Resource Codes Object Codes2015-16
Estimated Actuals2016-17Budget
PercentDifference
CERTIFICATED SALARIES
Certificated Teachers' Salaries 1100 9,106,801.00 9,330,878.00 2.5%
Certificated Pupil Support Salaries 1200 0.00 0.00 0.0%
Certificated Supervisors' and Administrators' Salaries 1300 551,053.00 578,359.00 5.0%
Other Certificated Salaries 1900 642,213.00 750,356.00 16.8%
TOTAL, CERTIFICATED SALARIES 10,300,067.00 10,659,593.00 3.5%
CLASSIFIED SALARIES
Classified Instructional Salaries 2100 2,940,777.00 2,972,016.00 1.1%
Classified Support Salaries 2200 2,074,902.00 2,323,687.00 12.0%
Classified Supervisors' and Administrators' Salaries 2300 478,163.00 445,149.00 -6.9%
Clerical, Technical and Office Salaries 2400 789,859.00 855,100.00 8.3%
Other Classified Salaries 2900 0.00 0.00 0.0%
TOTAL, CLASSIFIED SALARIES 6,283,701.00 6,595,952.00 5.0%
EMPLOYEE BENEFITS
STRS 3101-3102 1,664,356.00 1,938,001.00 16.4%
PERS 3201-3202 666,159.00 732,338.00 9.9%
OASDI/Medicare/Alternative 3301-3302 616,524.00 575,955.00 -6.6%
Health and Welfare Benefits 3401-3402 4,961,604.00 4,924,351.00 -0.8%
Unemployment Insurance 3501-3502 9,479.00 8,602.00 -9.3%
Workers' Compensation 3601-3602 338,490.00 300,936.00 -11.1%
OPEB, Allocated 3701-3702 33,402.00 31,759.00 -4.9%
OPEB, Active Employees 3751-3752 611,816.00 576,656.00 -5.7%
Other Employee Benefits 3901-3902 0.00 0.00 0.0%
TOTAL, EMPLOYEE BENEFITS 8,901,830.00 9,088,598.00 2.1%
BOOKS AND SUPPLIES
Approved Textbooks and Core Curricula Materials 4100 0.00 0.00 0.0%
Books and Other Reference Materials 4200 2,626.00 0.00 -100.0%
Materials and Supplies 4300 2,490,958.00 2,489,943.00 0.0%
Noncapitalized Equipment 4400 58,136.00 15,000.00 -74.2%
Food 4700 843,645.00 1,349,907.00 60.0%
TOTAL, BOOKS AND SUPPLIES 3,395,365.00 3,854,850.00 13.5%

Long Beach UnifiedLos Angeles County
July 1 BudgetChild Development FundExpenditures by Object
19 64725 0000000Form 12
California Dept of EducationSACS Financial Reporting Software - 2016.1.0File: fund-b (Rev 03/08/2016) Page 6 Printed: 6/24/2016 3:04 PM
Description Resource Codes Object Codes2015-16
Estimated Actuals2016-17Budget
PercentDifference
SERVICES AND OTHER OPERATING EXPENDITURES
Subagreements for Services 5100 0.00 0.00 0.0%
Travel and Conferences 5200 59,158.00 53,693.00 -9.2%
Dues and Memberships 5300 3,400.00 4,600.00 35.3%
Insurance 5400-5450 0.00 0.00 0.0%
Operations and Housekeeping Services 5500 185,838.00 170,604.00 -8.2%
Rentals, Leases, Repairs, and Noncapitalized Improvements 5600 490,909.00 225,941.00 -54.0%
Transfers of Direct Costs 5710 0.00 0.00 0.0%
Transfers of Direct Costs - Interfund 5750 215,421.00 235,196.00 9.2%
Professional/Consulting Services and Operating Expenditures 5800 561,856.00 295,010.00 -47.5%
Communications 5900 108,835.00 96,898.00 -11.0%
TOTAL, SERVICES AND OTHER OPERATING EXPENDITURES 1,625,417.00 1,081,942.00 -33.4%
CAPITAL OUTLAY
Land 6100 0.00 0.00 0.0%
Land Improvements 6170 0.00 0.00 0.0%
Buildings and Improvements of Buildings 6200 0.00 0.00 0.0%
Equipment 6400 0.00 35,000.00 New
Equipment Replacement 6500 0.00 0.00 0.0%
TOTAL, CAPITAL OUTLAY 0.00 35,000.00 New
OTHER OUTGO (excluding Transfers of Indirect Costs)
Other Transfers Out
All Other Transfers Out to All Others 7299 0.00 0.00 0.0%
Debt Service
Debt Service - Interest 7438 0.00 0.00 0.0%
Other Debt Service - Principal 7439 0.00 0.00 0.0%
TOTAL, OTHER OUTGO (excluding Transfers of Indirect Costs) 0.00 0.00 0.0%
OTHER OUTGO - TRANSFERS OF INDIRECT COSTS
Transfers of Indirect Costs - Interfund 7350 1,042,650.00 923,368.00 -11.4%
TOTAL, OTHER OUTGO - TRANSFERS OF INDIRECT COSTS 1,042,650.00 923,368.00 -11.4%
TOTAL, EXPENDITURES 31,549,030.00 32,239,303.00 2.2%

Long Beach UnifiedLos Angeles County
July 1 BudgetChild Development FundExpenditures by Object
19 64725 0000000Form 12
California Dept of EducationSACS Financial Reporting Software - 2016.1.0File: fund-b (Rev 03/08/2016) Page 7 Printed: 6/24/2016 3:04 PM
Description Resource Codes Object Codes2015-16
Estimated Actuals2016-17Budget
PercentDifference
INTERFUND TRANSFERS
INTERFUND TRANSFERS IN
From: General Fund 8911 0.00 0.00 0.0%
Other Authorized Interfund Transfers In 8919 0.00 0.00 0.0%
(a) TOTAL, INTERFUND TRANSFERS IN 0.00 0.00 0.0%
INTERFUND TRANSFERS OUT
Other Authorized Interfund Transfers Out 7619 0.00 0.00 0.0%
(b) TOTAL, INTERFUND TRANSFERS OUT 0.00 0.00 0.0%
OTHER SOURCES/USES
SOURCES
Other Sources
Transfers from Funds of Lapsed/Reorganized LEAs 8965 0.00 0.00 0.0%
Long-Term Debt Proceeds Proceeds from Certificates of Participation 8971 0.00 0.00 0.0%
Proceeds from Capital Leases 8972 0.00 0.00 0.0%
All Other Financing Sources 8979 0.00 0.00 0.0%
(c) TOTAL, SOURCES 0.00 0.00 0.0%
USES
Transfers of Funds from Lapsed/Reorganized LEAs 7651 0.00 0.00 0.0%
All Other Financing Uses 7699 0.00 0.00 0.0%
(d) TOTAL, USES 0.00 0.00 0.0%
CONTRIBUTIONS
Contributions from Unrestricted Revenues 8980 0.00 0.00 0.0%
Contributions from Restricted Revenues 8990 0.00 0.00 0.0%
(e) TOTAL, CONTRIBUTIONS 0.00 0.00 0.0%
TOTAL, OTHER FINANCING SOURCES/USES (a - b + c - d + e) 0.00 0.00 0.0%
Long Beach UnifiedLos Angeles County
July 1 BudgetCafeteria Special Revenue Fund
Expenditures by Object19 64725 0000000
Form 13
California Dept of EducationSACS Financial Reporting Software - 2016.1.0File: fund-b (Rev 03/08/2016) Page 1 Printed: 6/24/2016 3:05 PM
Description Resource Codes Object Codes2015-16
Estimated Actuals2016-17Budget
PercentDifference
A. REVENUES
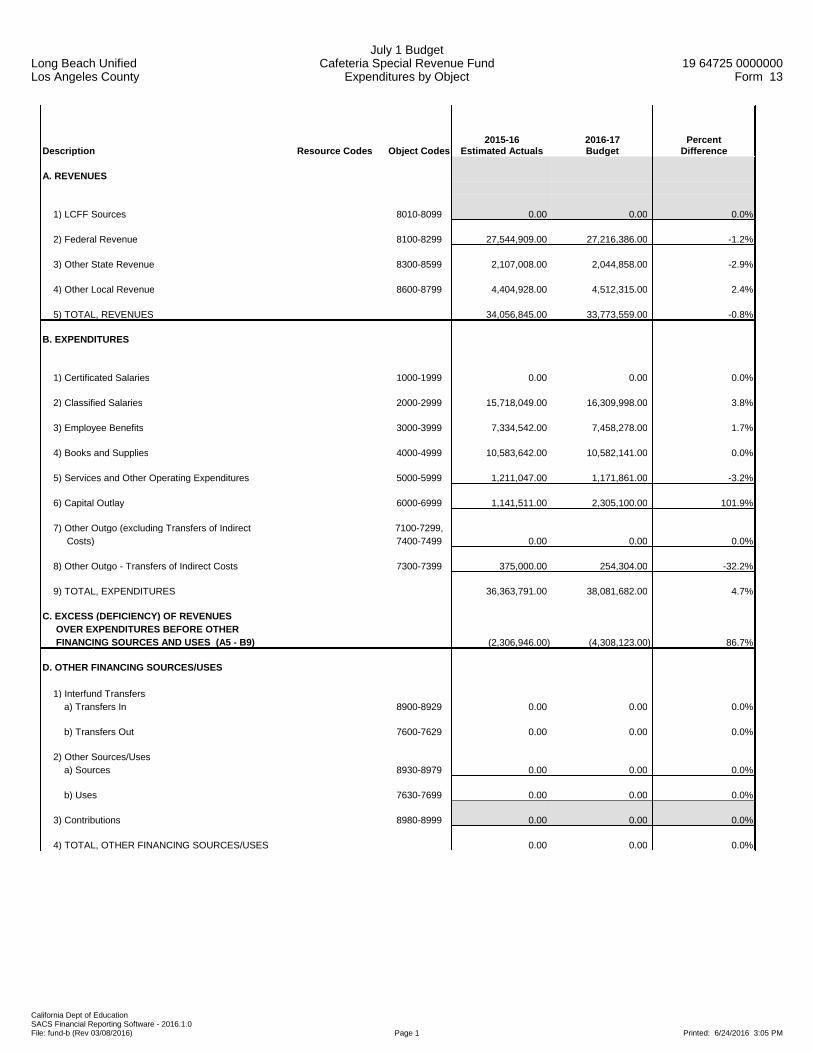
1) LCFF Sources 8010-8099 0.00 0.00 0.0%
2) Federal Revenue 8100-8299 27,544,909.00 27,216,386.00 -1.2%
3) Other State Revenue 8300-8599 2,107,008.00 2,044,858.00 -2.9%
4) Other Local Revenue 8600-8799 4,404,928.00 4,512,315.00 2.4%
5) TOTAL, REVENUES 34,056,845.00 33,773,559.00 -0.8%
B. EXPENDITURES
1) Certificated Salaries 1000-1999 0.00 0.00 0.0%
2) Classified Salaries 2000-2999 15,718,049.00 16,309,998.00 3.8%
3) Employee Benefits 3000-3999 7,334,542.00 7,458,278.00 1.7%
4) Books and Supplies 4000-4999 10,583,642.00 10,582,141.00 0.0%
5) Services and Other Operating Expenditures 5000-5999 1,211,047.00 1,171,861.00 -3.2%
6) Capital Outlay 6000-6999 1,141,511.00 2,305,100.00 101.9%
7) Other Outgo (excluding Transfers of Indirect 7100-7299, Costs) 7400-7499 0.00 0.00 0.0%
8) Other Outgo - Transfers of Indirect Costs 7300-7399 375,000.00 254,304.00 -32.2%
9) TOTAL, EXPENDITURES 36,363,791.00 38,081,682.00 4.7%
C. EXCESS (DEFICIENCY) OF REVENUES OVER EXPENDITURES BEFORE OTHER FINANCING SOURCES AND USES (A5 - B9) (2,306,946.00) (4,308,123.00) 86.7%
D. OTHER FINANCING SOURCES/USES 1) Interfund Transfers a) Transfers In 8900-8929 0.00 0.00 0.0%
b) Transfers Out 7600-7629 0.00 0.00 0.0%
2) Other Sources/Uses a) Sources 8930-8979 0.00 0.00 0.0%
b) Uses 7630-7699 0.00 0.00 0.0%
3) Contributions 8980-8999 0.00 0.00 0.0%
4) TOTAL, OTHER FINANCING SOURCES/USES 0.00 0.00 0.0%
Long Beach UnifiedLos Angeles County
July 1 BudgetCafeteria Special Revenue Fund
Expenditures by Object19 64725 0000000
Form 13
California Dept of EducationSACS Financial Reporting Software - 2016.1.0File: fund-b (Rev 03/08/2016) Page 2 Printed: 6/24/2016 3:05 PM
Description Resource Codes Object Codes2015-16
Estimated Actuals2016-17Budget
PercentDifference
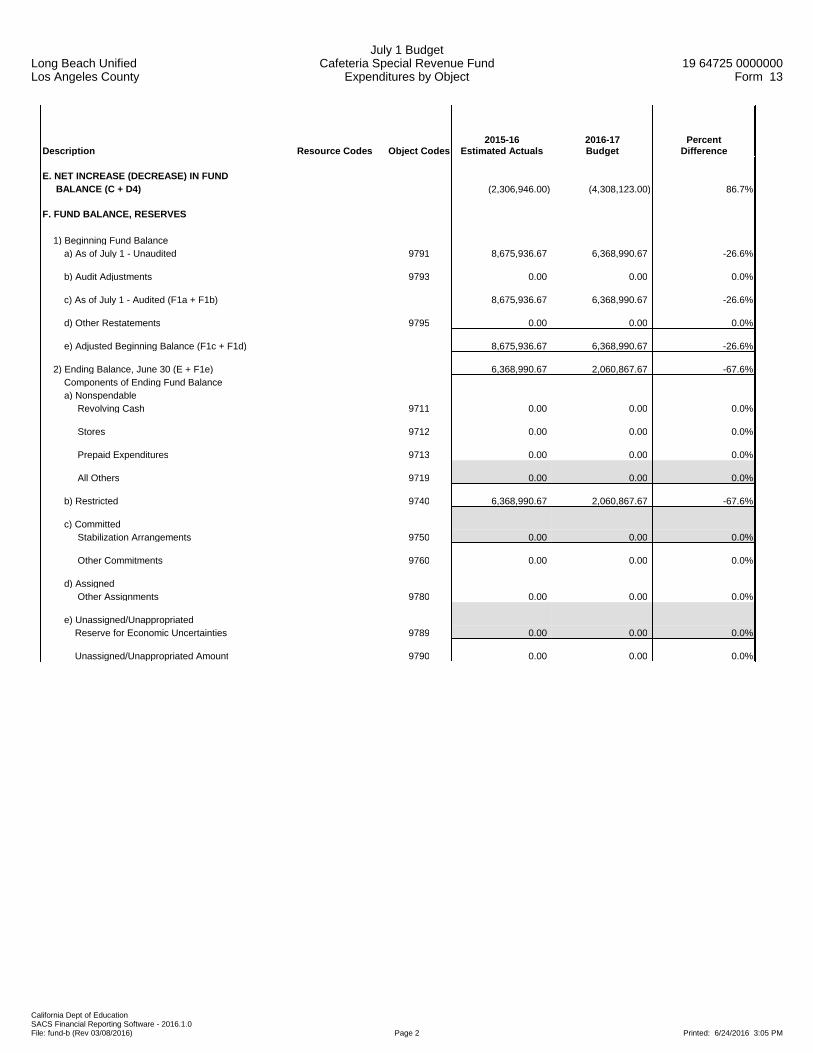
E. NET INCREASE (DECREASE) IN FUND BALANCE (C + D4) (2,306,946.00) (4,308,123.00) 86.7%
F. FUND BALANCE, RESERVES 1) Beginning Fund Balance a) As of July 1 - Unaudited 9791 8,675,936.67 6,368,990.67 -26.6%
b) Audit Adjustments 9793 0.00 0.00 0.0%
c) As of July 1 - Audited (F1a + F1b) 8,675,936.67 6,368,990.67 -26.6%
d) Other Restatements 9795 0.00 0.00 0.0%
e) Adjusted Beginning Balance (F1c + F1d) 8,675,936.67 6,368,990.67 -26.6%
2) Ending Balance, June 30 (E + F1e) 6,368,990.67 2,060,867.67 -67.6% Components of Ending Fund Balance a) Nonspendable Revolving Cash 9711 0.00 0.00 0.0%
Stores 9712 0.00 0.00 0.0%
Prepaid Expenditures 9713 0.00 0.00 0.0%
All Others 9719 0.00 0.00 0.0%
b) Restricted 9740 6,368,990.67 2,060,867.67 -67.6%
c) Committed Stabilization Arrangements 9750 0.00 0.00 0.0%
Other Commitments 9760 0.00 0.00 0.0%
d) Assigned Other Assignments 9780 0.00 0.00 0.0%
e) Unassigned/Unappropriated Reserve for Economic Uncertainties 9789 0.00 0.00 0.0%
Unassigned/Unappropriated Amount 9790 0.00 0.00 0.0%

Long Beach UnifiedLos Angeles County
July 1 BudgetCafeteria Special Revenue Fund
Expenditures by Object19 64725 0000000
Form 13
California Dept of EducationSACS Financial Reporting Software - 2016.1.0File: fund-b (Rev 03/08/2016) Page 3 Printed: 6/24/2016 3:05 PM
Description Resource Codes Object Codes2015-16
Estimated Actuals2016-17Budget
PercentDifference
G. ASSETS 1) Cash a) in County Treasury 9110 0.00
1) Fair Value Adjustment to Cash in County Treasury 9111 0.00
b) in Banks 9120 0.00
c) in Revolving Fund 9130 0.00
d) with Fiscal Agent 9135 0.00
e) collections awaiting deposit 9140 0.00
2) Investments 9150 0.00
3) Accounts Receivable 9200 0.00
4) Due from Grantor Government 9290 0.00
5) Due from Other Funds 9310 0.00
6) Stores 9320 0.00
7) Prepaid Expenditures 9330 0.00
8) Other Current Assets 9340 0.00
9) TOTAL, ASSETS 0.00
H. DEFERRED OUTFLOWS OF RESOURCES
1) Deferred Outflows of Resources 9490 0.00
2) TOTAL, DEFERRED OUTFLOWS 0.00
I. LIABILITIES
1) Accounts Payable 9500 0.00
2) Due to Grantor Governments 9590 0.00
3) Due to Other Funds 9610 0.00
4) Current Loans 9640
5) Unearned Revenue 9650 0.00
6) TOTAL, LIABILITIES 0.00
J. DEFERRED INFLOWS OF RESOURCES
1) Deferred Inflows of Resources 9690 0.00
2) TOTAL, DEFERRED INFLOWS 0.00
K. FUND EQUITY
Ending Fund Balance, June 30 (G9 + H2) - (I6 + J2) 0.00

Long Beach UnifiedLos Angeles County
July 1 BudgetCafeteria Special Revenue Fund
Expenditures by Object19 64725 0000000
Form 13
California Dept of EducationSACS Financial Reporting Software - 2016.1.0File: fund-b (Rev 03/08/2016) Page 4 Printed: 6/24/2016 3:05 PM
Description Resource Codes Object Codes2015-16
Estimated Actuals2016-17Budget
PercentDifference
FEDERAL REVENUE
Child Nutrition Programs 8220 27,431,309.00 27,205,026.00 -0.8%
Donated Food Commodities 8221 0.00 0.00 0.0%
All Other Federal Revenue 8290 113,600.00 11,360.00 -90.0%
TOTAL, FEDERAL REVENUE 27,544,909.00 27,216,386.00 -1.2%
OTHER STATE REVENUE
Child Nutrition Programs 8520 2,107,008.00 2,044,858.00 -2.9%
All Other State Revenue 8590 0.00 0.00 0.0%
TOTAL, OTHER STATE REVENUE 2,107,008.00 2,044,858.00 -2.9%
OTHER LOCAL REVENUE
Other Local Revenue
Sales Sale of Equipment/Supplies 8631 0.00 0.00 0.0%
Food Service Sales 8634 4,390,884.00 4,498,936.00 2.5%
Leases and Rentals 8650 0.00 0.00 0.0%
Interest 8660 10,231.00 8,379.00 -18.1%
Net Increase (Decrease) in the Fair Value of Investments 8662 0.00 0.00 0.0%
Fees and Contracts
Interagency Services 8677 0.00 0.00 0.0%
Other Local Revenue
All Other Local Revenue 8699 3,813.00 5,000.00 31.1%
TOTAL, OTHER LOCAL REVENUE 4,404,928.00 4,512,315.00 2.4%
TOTAL, REVENUES 34,056,845.00 33,773,559.00 -0.8%

Long Beach UnifiedLos Angeles County
July 1 BudgetCafeteria Special Revenue Fund
Expenditures by Object19 64725 0000000
Form 13
California Dept of EducationSACS Financial Reporting Software - 2016.1.0File: fund-b (Rev 03/08/2016) Page 5 Printed: 6/24/2016 3:05 PM
Description Resource Codes Object Codes2015-16
Estimated Actuals2016-17Budget
PercentDifference
CERTIFICATED SALARIES
Certificated Supervisors' and Administrators' Salaries 1300 0.00 0.00 0.0%
Other Certificated Salaries 1900 0.00 0.00 0.0%
TOTAL, CERTIFICATED SALARIES 0.00 0.00 0.0%
CLASSIFIED SALARIES
Classified Support Salaries 2200 8,217,715.00 8,631,459.00 5.0%
Classified Supervisors' and Administrators' Salaries 2300 5,476,719.00 5,616,525.00 2.6%
Clerical, Technical and Office Salaries 2400 1,215,214.00 1,252,926.00 3.1%
Other Classified Salaries 2900 808,401.00 809,088.00 0.1%
TOTAL, CLASSIFIED SALARIES 15,718,049.00 16,309,998.00 3.8%
EMPLOYEE BENEFITS
STRS 3101-3102 0.00 0.00 0.0%
PERS 3201-3202 1,446,636.00 1,500,599.00 3.7%
OASDI/Medicare/Alternative 3301-3302 1,170,601.00 1,109,757.00 -5.2%
Health and Welfare Benefits 3401-3402 3,903,044.00 4,110,400.00 5.3%
Unemployment Insurance 3501-3502 7,996.00 7,330.00 -8.3%
Workers' Compensation 3601-3602 286,526.00 259,580.00 -9.4%
OPEB, Allocated 3701-3702 32,541.00 23,737.00 -27.1%
OPEB, Active Employees 3751-3752 487,198.00 446,875.00 -8.3%
Other Employee Benefits 3901-3902 0.00 0.00 0.0%
TOTAL, EMPLOYEE BENEFITS 7,334,542.00 7,458,278.00 1.7%
BOOKS AND SUPPLIES
Books and Other Reference Materials 4200 0.00 0.00 0.0%
Materials and Supplies 4300 1,380,474.00 1,110,851.00 -19.5%
Noncapitalized Equipment 4400 64,448.00 112,348.00 74.3%
Food 4700 9,138,720.00 9,358,942.00 2.4%
TOTAL, BOOKS AND SUPPLIES 10,583,642.00 10,582,141.00 0.0%

Long Beach UnifiedLos Angeles County
July 1 BudgetCafeteria Special Revenue Fund
Expenditures by Object19 64725 0000000
Form 13
California Dept of EducationSACS Financial Reporting Software - 2016.1.0File: fund-b (Rev 03/08/2016) Page 6 Printed: 6/24/2016 3:05 PM
Description Resource Codes Object Codes2015-16
Estimated Actuals2016-17Budget
PercentDifference
SERVICES AND OTHER OPERATING EXPENDITURES
Subagreements for Services 5100 0.00 0.00 0.0%
Travel and Conferences 5200 42,311.00 9,314.00 -78.0%
Dues and Memberships 5300 1,216.00 1,216.00 0.0%
Insurance 5400-5450 0.00 0.00 0.0%
Operations and Housekeeping Services 5500 290,275.00 312,725.00 7.7%
Rentals, Leases, Repairs, and Noncapitalized Improvements 5600 176,725.00 259,605.00 46.9%
Transfers of Direct Costs 5710 0.00 0.00 0.0%
Transfers of Direct Costs - Interfund 5750 275,245.00 316,308.00 14.9%
Professional/Consulting Services and Operating Expenditures 5800 396,647.00 244,181.00 -38.4%
Communications 5900 28,628.00 28,512.00 -0.4%
TOTAL, SERVICES AND OTHER OPERATING EXPENDITURES 1,211,047.00 1,171,861.00 -3.2%
CAPITAL OUTLAY
Buildings and Improvements of Buildings 6200 1,000,000.00 2,125,000.00 112.5%
Equipment 6400 0.00 6,000.00 New
Equipment Replacement 6500 141,511.00 174,100.00 23.0%
TOTAL, CAPITAL OUTLAY 1,141,511.00 2,305,100.00 101.9%
OTHER OUTGO (excluding Transfers of Indirect Costs)
Debt Service
Debt Service - Interest 7438 0.00 0.00 0.0%
Other Debt Service - Principal 7439 0.00 0.00 0.0%
TOTAL, OTHER OUTGO (excluding Transfers of Indirect Costs) 0.00 0.00 0.0%
OTHER OUTGO - TRANSFERS OF INDIRECT COSTS
Transfers of Indirect Costs - Interfund 7350 375,000.00 254,304.00 -32.2%
TOTAL, OTHER OUTGO - TRANSFERS OF INDIRECT COSTS 375,000.00 254,304.00 -32.2%
TOTAL, EXPENDITURES 36,363,791.00 38,081,682.00 4.7%

Long Beach UnifiedLos Angeles County
July 1 BudgetCafeteria Special Revenue Fund
Expenditures by Object19 64725 0000000
Form 13
California Dept of EducationSACS Financial Reporting Software - 2016.1.0File: fund-b (Rev 03/08/2016) Page 7 Printed: 6/24/2016 3:05 PM
Description Resource Codes Object Codes2015-16
Estimated Actuals2016-17Budget
PercentDifference
INTERFUND TRANSFERS
INTERFUND TRANSFERS IN
From: General Fund 8916 0.00 0.00 0.0%
Other Authorized Interfund Transfers In 8919 0.00 0.00 0.0%
(a) TOTAL, INTERFUND TRANSFERS IN 0.00 0.00 0.0%
INTERFUND TRANSFERS OUT
Other Authorized Interfund Transfers Out 7619 0.00 0.00 0.0%
(b) TOTAL, INTERFUND TRANSFERS OUT 0.00 0.00 0.0%
OTHER SOURCES/USES
SOURCES
Other Sources
Transfers from Funds of Lapsed/Reorganized LEAs 8965 0.00 0.00 0.0%
Long-Term Debt Proceeds
Proceeds from Capital Leases 8972 0.00 0.00 0.0%
All Other Financing Sources 8979 0.00 0.00 0.0%
(c) TOTAL, SOURCES 0.00 0.00 0.0%
USES
Transfers of Funds from Lapsed/Reorganized LEAs 7651 0.00 0.00 0.0%
All Other Financing Uses 7699 0.00 0.00 0.0%
(d) TOTAL, USES 0.00 0.00 0.0%
CONTRIBUTIONS
Contributions from Unrestricted Revenues 8980 0.00 0.00 0.0%
Contributions from Restricted Revenues 8990 0.00 0.00 0.0%
(e) TOTAL, CONTRIBUTIONS 0.00 0.00 0.0%
TOTAL, OTHER FINANCING SOURCES/USES (a - b + c - d + e) 0.00 0.00 0.0%

Long Beach UnifiedLos Angeles County
July 1 BudgetSpecial Reserve Fund for Other Than Capital Outlay Projects
Expenditures by Object19 64725 0000000
Form 17
California Dept of EducationSACS Financial Reporting Software - 2016.1.0File: fund-b (Rev 03/08/2016) Page 1 Printed: 6/24/2016 3:05 PM
Description Resource Codes Object Codes2015-16
Estimated Actuals2016-17Budget
PercentDifference
A. REVENUES
1) LCFF Sources 8010-8099 0.00 0.00 0.0%
2) Federal Revenue 8100-8299 0.00 0.00 0.0%
3) Other State Revenue 8300-8599 0.00 0.00 0.0%
4) Other Local Revenue 8600-8799 61,695.00 61,000.00 -1.1%
5) TOTAL, REVENUES 61,695.00 61,000.00 -1.1%
B. EXPENDITURES
1) Certificated Salaries 1000-1999 0.00 0.00 0.0%
2) Classified Salaries 2000-2999 0.00 0.00 0.0%
3) Employee Benefits 3000-3999 0.00 0.00 0.0%
4) Books and Supplies 4000-4999 0.00 0.00 0.0%
5) Services and Other Operating Expenditures 5000-5999 0.00 0.00 0.0%
6) Capital Outlay 6000-6999 0.00 0.00 0.0%
7) Other Outgo (excluding Transfers of Indirect 7100-7299, Costs) 7400-7499 0.00 0.00 0.0%
8) Other Outgo - Transfers of Indirect Costs 7300-7399 0.00 0.00 0.0%
9) TOTAL, EXPENDITURES 0.00 0.00 0.0%
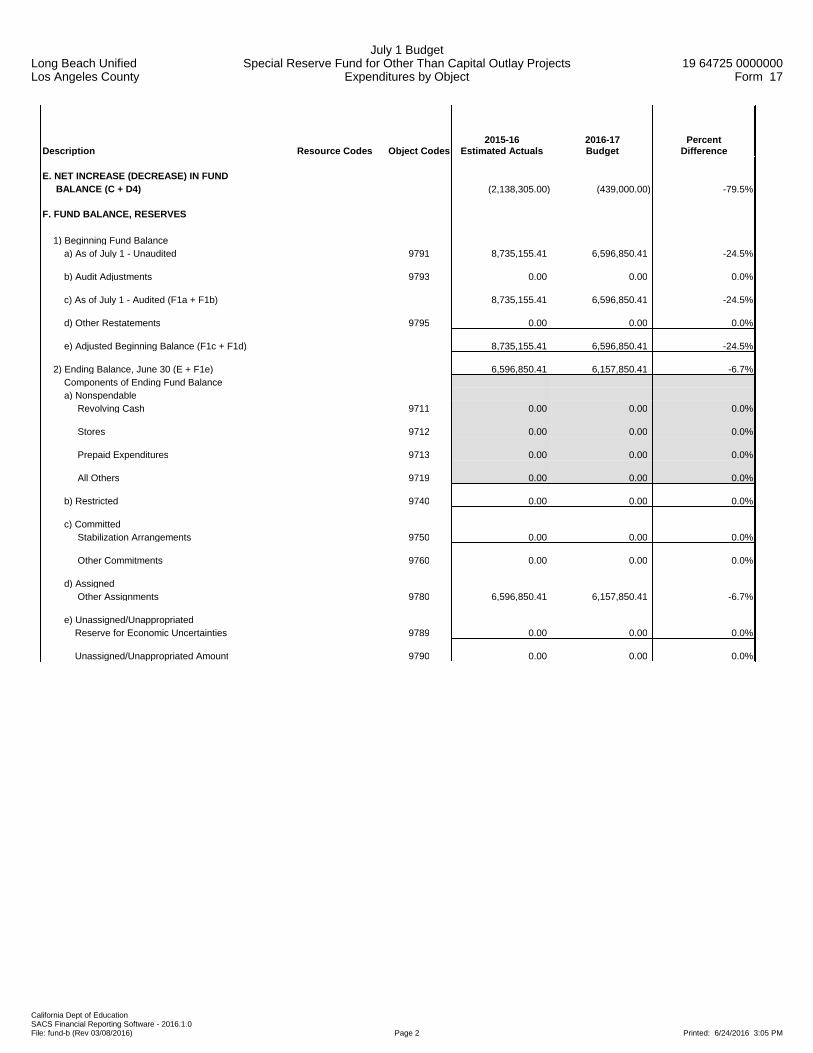
C. EXCESS (DEFICIENCY) OF REVENUES OVER EXPENDITURES BEFORE OTHER FINANCING SOURCES AND USES (A5 - B9) 61,695.00 61,000.00 -1.1%
D. OTHER FINANCING SOURCES/USES 1) Interfund Transfers a) Transfers In 8900-8929 0.00 0.00 0.0%
b) Transfers Out 7600-7629 2,200,000.00 500,000.00 -77.3%
2) Other Sources/Uses a) Sources 8930-8979 0.00 0.00 0.0%
b) Uses 7630-7699 0.00 0.00 0.0%
3) Contributions 8980-8999 0.00 0.00 0.0%
4) TOTAL, OTHER FINANCING SOURCES/USES (2,200,000.00) (500,000.00) -77.3%
Long Beach UnifiedLos Angeles County
July 1 BudgetSpecial Reserve Fund for Other Than Capital Outlay Projects
Expenditures by Object19 64725 0000000
Form 17
California Dept of EducationSACS Financial Reporting Software - 2016.1.0File: fund-b (Rev 03/08/2016) Page 2 Printed: 6/24/2016 3:05 PM
Description Resource Codes Object Codes2015-16
Estimated Actuals2016-17Budget
PercentDifference
E. NET INCREASE (DECREASE) IN FUND BALANCE (C + D4) (2,138,305.00) (439,000.00) -79.5%
F. FUND BALANCE, RESERVES 1) Beginning Fund Balance a) As of July 1 - Unaudited 9791 8,735,155.41 6,596,850.41 -24.5%
b) Audit Adjustments 9793 0.00 0.00 0.0%
c) As of July 1 - Audited (F1a + F1b) 8,735,155.41 6,596,850.41 -24.5%
d) Other Restatements 9795 0.00 0.00 0.0%
e) Adjusted Beginning Balance (F1c + F1d) 8,735,155.41 6,596,850.41 -24.5%
2) Ending Balance, June 30 (E + F1e) 6,596,850.41 6,157,850.41 -6.7% Components of Ending Fund Balance a) Nonspendable Revolving Cash 9711 0.00 0.00 0.0%
Stores 9712 0.00 0.00 0.0%
Prepaid Expenditures 9713 0.00 0.00 0.0%
All Others 9719 0.00 0.00 0.0%
b) Restricted 9740 0.00 0.00 0.0%
c) Committed Stabilization Arrangements 9750 0.00 0.00 0.0%
Other Commitments 9760 0.00 0.00 0.0%
d) Assigned Other Assignments 9780 6,596,850.41 6,157,850.41 -6.7%
e) Unassigned/Unappropriated Reserve for Economic Uncertainties 9789 0.00 0.00 0.0%
Unassigned/Unappropriated Amount 9790 0.00 0.00 0.0%
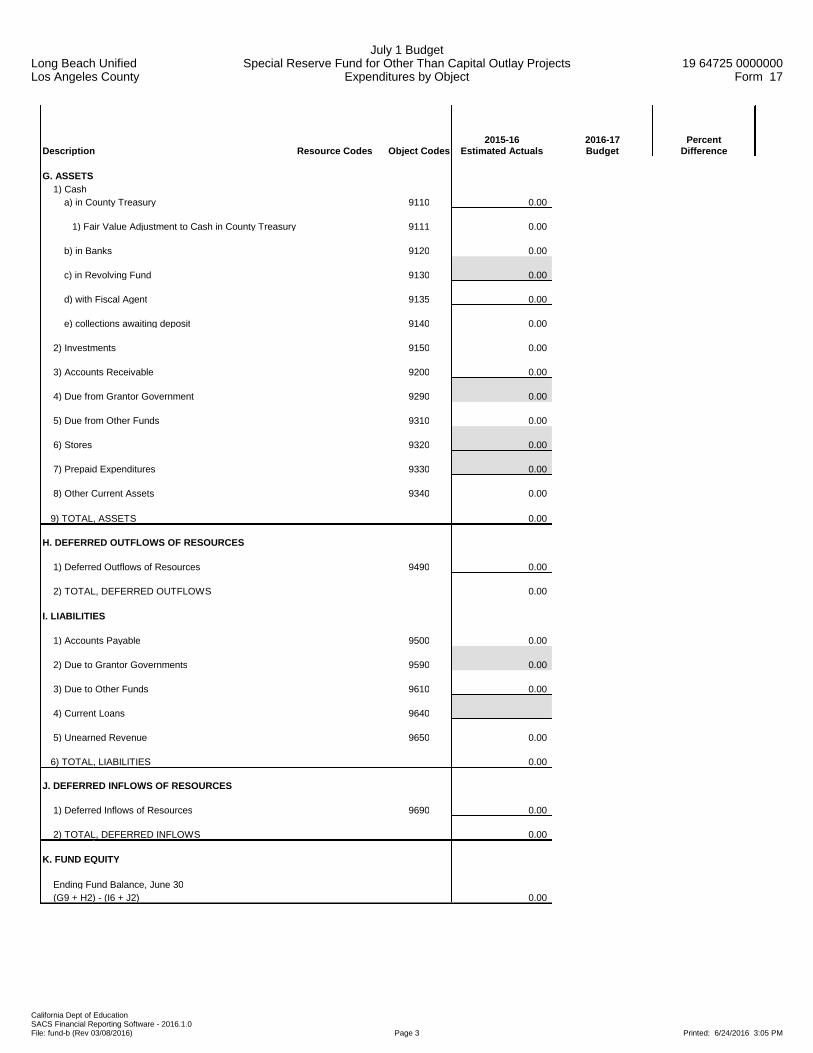
Long Beach UnifiedLos Angeles County
July 1 BudgetSpecial Reserve Fund for Other Than Capital Outlay Projects
Expenditures by Object19 64725 0000000
Form 17
California Dept of EducationSACS Financial Reporting Software - 2016.1.0File: fund-b (Rev 03/08/2016) Page 3 Printed: 6/24/2016 3:05 PM
Description Resource Codes Object Codes2015-16
Estimated Actuals2016-17Budget
PercentDifference
G. ASSETS 1) Cash a) in County Treasury 9110 0.00
1) Fair Value Adjustment to Cash in County Treasury 9111 0.00
b) in Banks 9120 0.00
c) in Revolving Fund 9130 0.00
d) with Fiscal Agent 9135 0.00
e) collections awaiting deposit 9140 0.00
2) Investments 9150 0.00
3) Accounts Receivable 9200 0.00
4) Due from Grantor Government 9290 0.00
5) Due from Other Funds 9310 0.00
6) Stores 9320 0.00
7) Prepaid Expenditures 9330 0.00
8) Other Current Assets 9340 0.00
9) TOTAL, ASSETS 0.00
H. DEFERRED OUTFLOWS OF RESOURCES
1) Deferred Outflows of Resources 9490 0.00
2) TOTAL, DEFERRED OUTFLOWS 0.00
I. LIABILITIES
1) Accounts Payable 9500 0.00
2) Due to Grantor Governments 9590 0.00
3) Due to Other Funds 9610 0.00
4) Current Loans 9640
5) Unearned Revenue 9650 0.00
6) TOTAL, LIABILITIES 0.00
J. DEFERRED INFLOWS OF RESOURCES
1) Deferred Inflows of Resources 9690 0.00
2) TOTAL, DEFERRED INFLOWS 0.00
K. FUND EQUITY
Ending Fund Balance, June 30 (G9 + H2) - (I6 + J2) 0.00

Long Beach UnifiedLos Angeles County
July 1 BudgetSpecial Reserve Fund for Other Than Capital Outlay Projects
Expenditures by Object19 64725 0000000
Form 17
California Dept of EducationSACS Financial Reporting Software - 2016.1.0File: fund-b (Rev 03/08/2016) Page 4 Printed: 6/24/2016 3:05 PM
Description Resource Codes Object Codes2015-16
Estimated Actuals2016-17Budget
PercentDifference
OTHER LOCAL REVENUE
Other Local Revenue
Sales Sale of Equipment/Supplies 8631 0.00 0.00 0.0%
Interest 8660 61,695.00 61,000.00 -1.1%
Net Increase (Decrease) in the Fair Value of Investments 8662 0.00 0.00 0.0%
TOTAL, OTHER LOCAL REVENUE 61,695.00 61,000.00 -1.1%
TOTAL, REVENUES 61,695.00 61,000.00 -1.1%

Long Beach UnifiedLos Angeles County
July 1 BudgetSpecial Reserve Fund for Other Than Capital Outlay Projects
Expenditures by Object19 64725 0000000
Form 17
California Dept of EducationSACS Financial Reporting Software - 2016.1.0File: fund-b (Rev 03/08/2016) Page 5 Printed: 6/24/2016 3:05 PM
Description Resource Codes Object Codes2015-16
Estimated Actuals2016-17Budget
PercentDifference
INTERFUND TRANSFERS
INTERFUND TRANSFERS IN
From: General Fund/CSSF 8912 0.00 0.00 0.0%
Other Authorized Interfund Transfers In 8919 0.00 0.00 0.0%
(a) TOTAL, INTERFUND TRANSFERS IN 0.00 0.00 0.0%
INTERFUND TRANSFERS OUT
To: General Fund/CSSF 7612 2,200,000.00 500,000.00 -77.3%
To: State School Building Fund/ County School Facilities Fund 7613 0.00 0.00 0.0%
Other Authorized Interfund Transfers Out 7619 0.00 0.00 0.0%
(b) TOTAL, INTERFUND TRANSFERS OUT 2,200,000.00 500,000.00 -77.3%
OTHER SOURCES/USES
SOURCES
Other Sources
Transfers from Funds of Lapsed/Reorganized LEAs 8965 0.00 0.00 0.0%
(c) TOTAL, SOURCES 0.00 0.00 0.0%
USES
Transfers of Funds from Lapsed/Reorganized LEAs 7651 0.00 0.00 0.0%
(d) TOTAL, USES 0.00 0.00 0.0%
CONTRIBUTIONS
Contributions from Restricted Revenues 8990 0.00 0.00 0.0%
(e) TOTAL, CONTRIBUTIONS 0.00 0.00 0.0%
TOTAL, OTHER FINANCING SOURCES/USES (a - b + c - d + e) (2,200,000.00) (500,000.00) -77.3%

Long Beach UnifiedLos Angeles County
July 1 BudgetBuilding Fund
Expenditures by Object19 64725 0000000
Form 21
California Dept of EducationSACS Financial Reporting Software - 2016.1.0File: fund-d (Rev 02/02/2016) Page 1 Printed: 6/24/2016 3:07 PM
Description Resource Codes Object Codes2015-16
Estimated Actuals2016-17Budget
PercentDifference
A. REVENUES
1) LCFF Sources 8010-8099 0.00 0.00 0.0%
2) Federal Revenue 8100-8299 0.00 0.00 0.0%
3) Other State Revenue 8300-8599 0.00 0.00 0.0%
4) Other Local Revenue 8600-8799 975,000.00 700,000.00 -28.2%
5) TOTAL, REVENUES 975,000.00 700,000.00 -28.2%
B. EXPENDITURES
1) Certificated Salaries 1000-1999 0.00 0.00 0.0%
2) Classified Salaries 2000-2999 243,701.00 296,890.00 21.8%
3) Employee Benefits 3000-3999 92,723.00 127,546.00 37.6%
4) Books and Supplies 4000-4999 4,116,654.00 4,000,000.00 -2.8%
5) Services and Other Operating Expenditures 5000-5999 6,985,480.00 6,000,000.00 -14.1%
6) Capital Outlay 6000-6999 59,468,695.00 140,000,000.00 135.4%
7) Other Outgo (excluding Transfers of Indirect 7100-7299, Costs) 7400-7499 0.00 0.00 0.0%
8) Other Outgo - Transfers of Indirect Costs 7300-7399 0.00 0.00 0.0%
9) TOTAL, EXPENDITURES 70,907,253.00 150,424,436.00 112.1%
C. EXCESS (DEFICIENCY) OF REVENUES OVER EXPENDITURES BEFORE OTHER FINANCING SOURCES AND USES (A5 - B9) (69,932,253.00) (149,724,436.00) 114.1%
D. OTHER FINANCING SOURCES/USES 1) Interfund Transfers a) Transfers In 8900-8929 0.00 0.00 0.0%
b) Transfers Out 7600-7629 0.00 0.00 0.0%
2) Other Sources/Uses a) Sources 8930-8979 0.00 0.00 0.0%
b) Uses 7630-7699 0.00 0.00 0.0%
3) Contributions 8980-8999 0.00 0.00 0.0%
4) TOTAL, OTHER FINANCING SOURCES/USES 0.00 0.00 0.0%

Long Beach UnifiedLos Angeles County
July 1 BudgetBuilding Fund
Expenditures by Object19 64725 0000000
Form 21
California Dept of EducationSACS Financial Reporting Software - 2016.1.0File: fund-d (Rev 02/02/2016) Page 2 Printed: 6/24/2016 3:07 PM
Description Resource Codes Object Codes2015-16
Estimated Actuals2016-17Budget
PercentDifference
E. NET INCREASE (DECREASE) IN FUND BALANCE (C + D4) (69,932,253.00) (149,724,436.00) 114.1%
F. FUND BALANCE, RESERVES 1) Beginning Fund Balance a) As of July 1 - Unaudited 9791 244,125,643.82 174,193,390.82 -28.6%
b) Audit Adjustments 9793 0.00 0.00 0.0%
c) As of July 1 - Audited (F1a + F1b) 244,125,643.82 174,193,390.82 -28.6%
d) Other Restatements 9795 0.00 0.00 0.0%
e) Adjusted Beginning Balance (F1c + F1d) 244,125,643.82 174,193,390.82 -28.6%
2) Ending Balance, June 30 (E + F1e) 174,193,390.82 24,468,954.82 -86.0% Components of Ending Fund Balance a) Nonspendable Revolving Cash 9711 0.00 0.00 0.0%
Stores 9712 0.00 0.00 0.0%
Prepaid Expenditures 9713 0.00 0.00 0.0%
All Others 9719 0.00 0.00 0.0%
b) Restricted 9740 174,193,390.82 24,468,954.82 -86.0%
c) Committed Stabilization Arrangements 9750 0.00 0.00 0.0%
Other Commitments 9760 0.00 0.00 0.0%
d) Assigned Other Assignments 9780 0.00 0.00 0.0%
e) Unassigned/Unappropriated Reserve for Economic Uncertainties 9789 0.00 0.00 0.0%
Unassigned/Unappropriated Amount 9790 0.00 0.00 0.0%
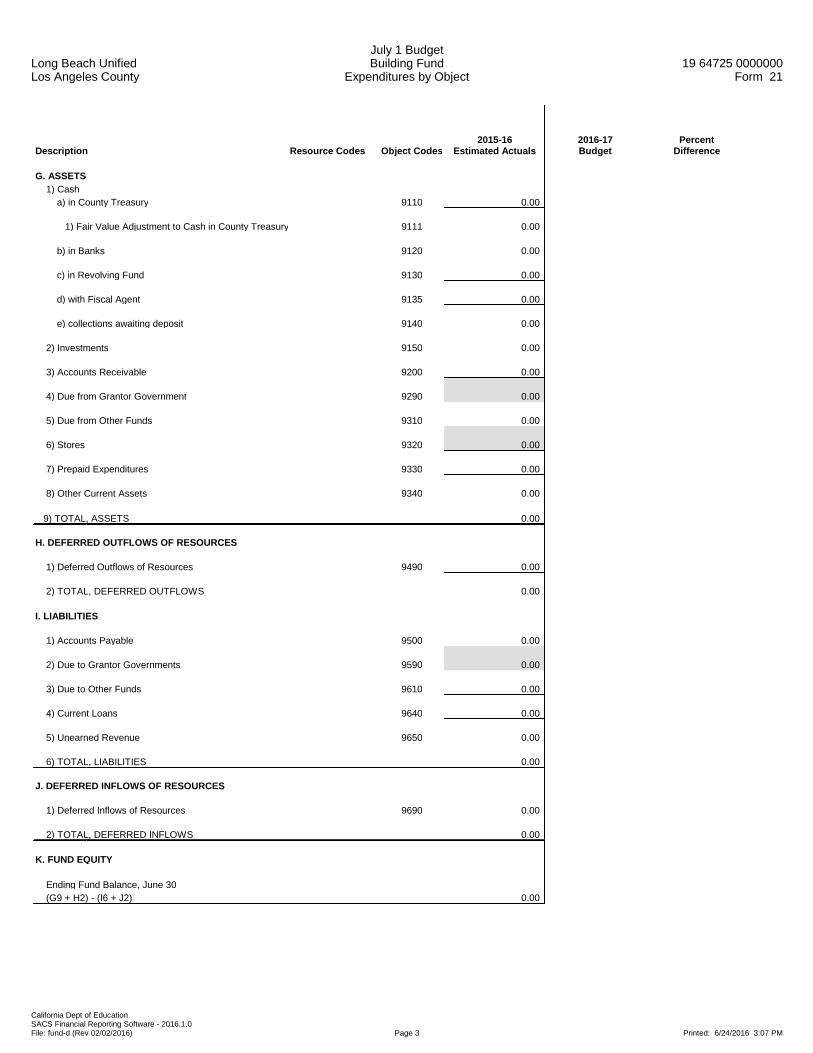
Long Beach UnifiedLos Angeles County
July 1 BudgetBuilding Fund
Expenditures by Object19 64725 0000000
Form 21
California Dept of EducationSACS Financial Reporting Software - 2016.1.0File: fund-d (Rev 02/02/2016) Page 3 Printed: 6/24/2016 3:07 PM
Description Resource Codes Object Codes2015-16
Estimated Actuals2016-17Budget
PercentDifference
G. ASSETS 1) Cash a) in County Treasury 9110 0.00
1) Fair Value Adjustment to Cash in County Treasury 9111 0.00
b) in Banks 9120 0.00
c) in Revolving Fund 9130 0.00
d) with Fiscal Agent 9135 0.00
e) collections awaiting deposit 9140 0.00
2) Investments 9150 0.00
3) Accounts Receivable 9200 0.00
4) Due from Grantor Government 9290 0.00
5) Due from Other Funds 9310 0.00
6) Stores 9320 0.00
7) Prepaid Expenditures 9330 0.00
8) Other Current Assets 9340 0.00
9) TOTAL, ASSETS 0.00
H. DEFERRED OUTFLOWS OF RESOURCES
1) Deferred Outflows of Resources 9490 0.00
2) TOTAL, DEFERRED OUTFLOWS 0.00
I. LIABILITIES
1) Accounts Payable 9500 0.00
2) Due to Grantor Governments 9590 0.00
3) Due to Other Funds 9610 0.00
4) Current Loans 9640 0.00
5) Unearned Revenue 9650 0.00
6) TOTAL, LIABILITIES 0.00
J. DEFERRED INFLOWS OF RESOURCES
1) Deferred Inflows of Resources 9690 0.00
2) TOTAL, DEFERRED INFLOWS 0.00
K. FUND EQUITY
Ending Fund Balance, June 30 (G9 + H2) - (I6 + J2) 0.00
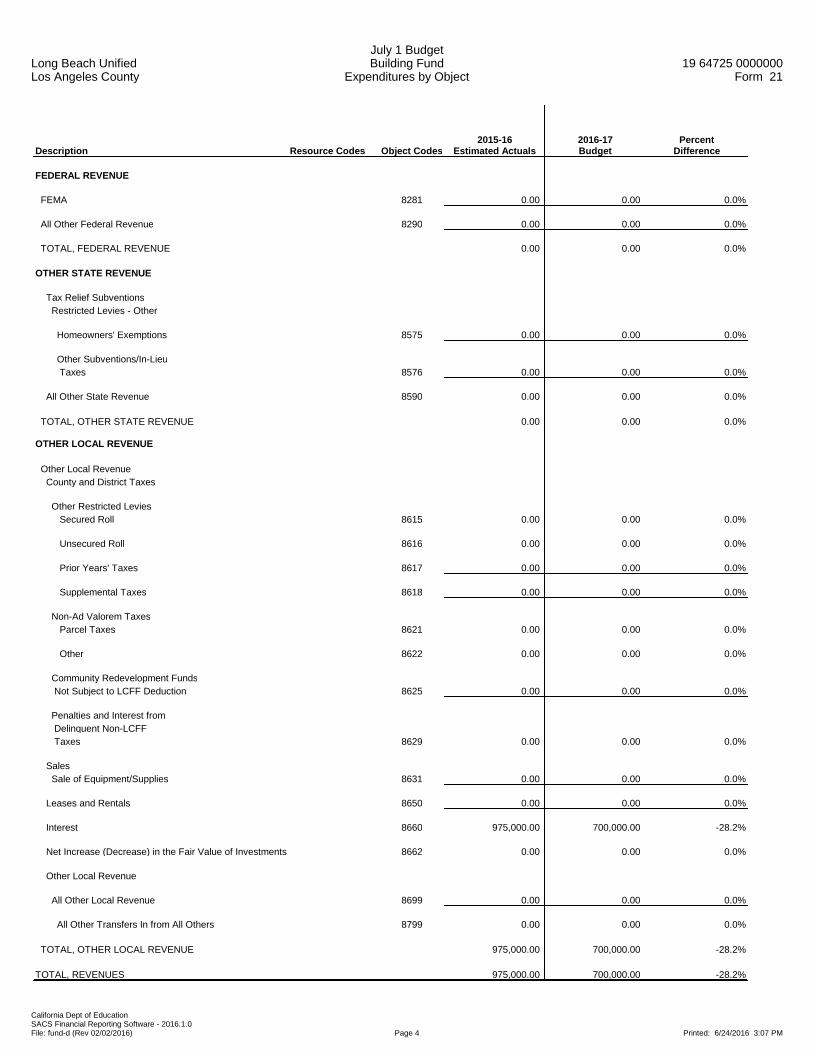
Long Beach UnifiedLos Angeles County
July 1 BudgetBuilding Fund
Expenditures by Object19 64725 0000000
Form 21
California Dept of EducationSACS Financial Reporting Software - 2016.1.0File: fund-d (Rev 02/02/2016) Page 4 Printed: 6/24/2016 3:07 PM
Description Resource Codes Object Codes2015-16
Estimated Actuals2016-17Budget
PercentDifference
FEDERAL REVENUE
FEMA 8281 0.00 0.00 0.0%
All Other Federal Revenue 8290 0.00 0.00 0.0%
TOTAL, FEDERAL REVENUE 0.00 0.00 0.0%
OTHER STATE REVENUE
Tax Relief Subventions Restricted Levies - Other
Homeowners' Exemptions 8575 0.00 0.00 0.0%
Other Subventions/In-Lieu Taxes 8576 0.00 0.00 0.0%
All Other State Revenue 8590 0.00 0.00 0.0%
TOTAL, OTHER STATE REVENUE 0.00 0.00 0.0%
OTHER LOCAL REVENUE
Other Local Revenue County and District Taxes
Other Restricted Levies Secured Roll 8615 0.00 0.00 0.0%
Unsecured Roll 8616 0.00 0.00 0.0%
Prior Years' Taxes 8617 0.00 0.00 0.0%
Supplemental Taxes 8618 0.00 0.00 0.0%
Non-Ad Valorem Taxes Parcel Taxes 8621 0.00 0.00 0.0%
Other 8622 0.00 0.00 0.0%
Community Redevelopment Funds Not Subject to LCFF Deduction 8625 0.00 0.00 0.0%
Penalties and Interest from Delinquent Non-LCFF Taxes 8629 0.00 0.00 0.0%
Sales Sale of Equipment/Supplies 8631 0.00 0.00 0.0%
Leases and Rentals 8650 0.00 0.00 0.0%
Interest 8660 975,000.00 700,000.00 -28.2%
Net Increase (Decrease) in the Fair Value of Investments 8662 0.00 0.00 0.0%
Other Local Revenue
All Other Local Revenue 8699 0.00 0.00 0.0%
All Other Transfers In from All Others 8799 0.00 0.00 0.0%
TOTAL, OTHER LOCAL REVENUE 975,000.00 700,000.00 -28.2%
TOTAL, REVENUES 975,000.00 700,000.00 -28.2%
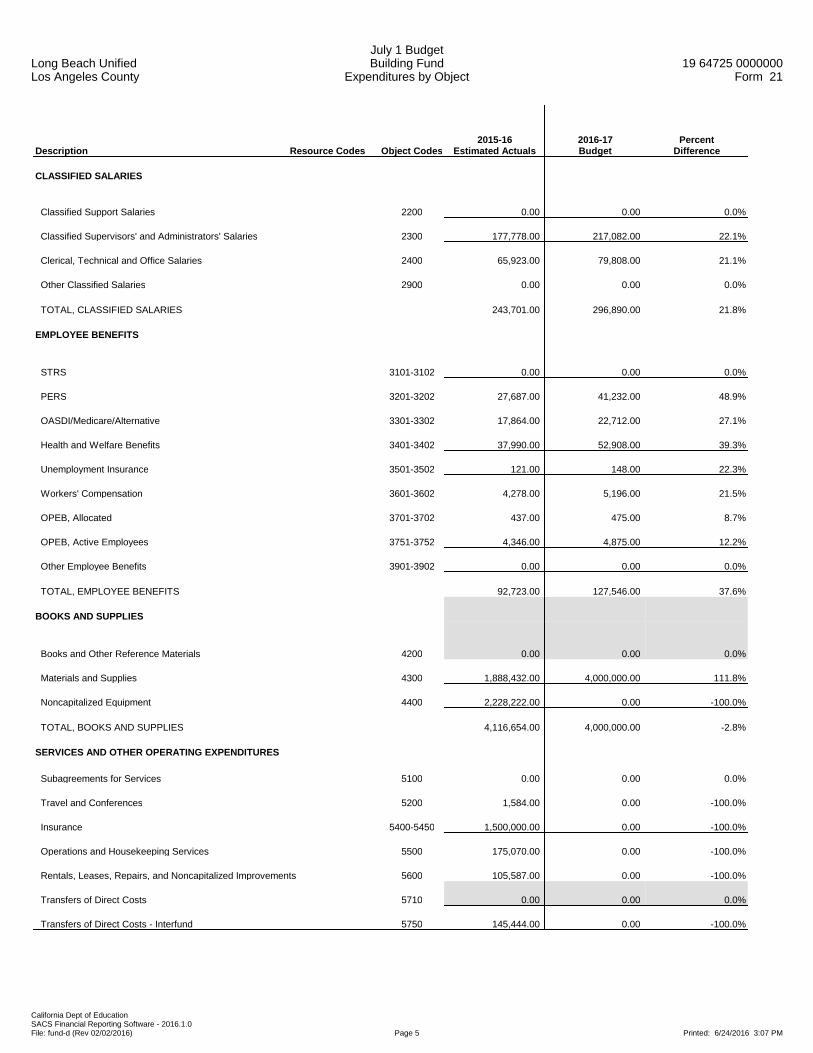
Long Beach UnifiedLos Angeles County
July 1 BudgetBuilding Fund
Expenditures by Object19 64725 0000000
Form 21
California Dept of EducationSACS Financial Reporting Software - 2016.1.0File: fund-d (Rev 02/02/2016) Page 5 Printed: 6/24/2016 3:07 PM
Description Resource Codes Object Codes2015-16
Estimated Actuals2016-17Budget
PercentDifference
CLASSIFIED SALARIES
Classified Support Salaries 2200 0.00 0.00 0.0%
Classified Supervisors' and Administrators' Salaries 2300 177,778.00 217,082.00 22.1%
Clerical, Technical and Office Salaries 2400 65,923.00 79,808.00 21.1%
Other Classified Salaries 2900 0.00 0.00 0.0%
TOTAL, CLASSIFIED SALARIES 243,701.00 296,890.00 21.8%
EMPLOYEE BENEFITS
STRS 3101-3102 0.00 0.00 0.0%
PERS 3201-3202 27,687.00 41,232.00 48.9%
OASDI/Medicare/Alternative 3301-3302 17,864.00 22,712.00 27.1%
Health and Welfare Benefits 3401-3402 37,990.00 52,908.00 39.3%
Unemployment Insurance 3501-3502 121.00 148.00 22.3%
Workers' Compensation 3601-3602 4,278.00 5,196.00 21.5%
OPEB, Allocated 3701-3702 437.00 475.00 8.7%
OPEB, Active Employees 3751-3752 4,346.00 4,875.00 12.2%
Other Employee Benefits 3901-3902 0.00 0.00 0.0%
TOTAL, EMPLOYEE BENEFITS 92,723.00 127,546.00 37.6%
BOOKS AND SUPPLIES
Books and Other Reference Materials 4200 0.00 0.00 0.0%
Materials and Supplies 4300 1,888,432.00 4,000,000.00 111.8%
Noncapitalized Equipment 4400 2,228,222.00 0.00 -100.0%
TOTAL, BOOKS AND SUPPLIES 4,116,654.00 4,000,000.00 -2.8%
SERVICES AND OTHER OPERATING EXPENDITURES
Subagreements for Services 5100 0.00 0.00 0.0%
Travel and Conferences 5200 1,584.00 0.00 -100.0%
Insurance 5400-5450 1,500,000.00 0.00 -100.0%
Operations and Housekeeping Services 5500 175,070.00 0.00 -100.0%
Rentals, Leases, Repairs, and Noncapitalized Improvements 5600 105,587.00 0.00 -100.0%
Transfers of Direct Costs 5710 0.00 0.00 0.0%
Transfers of Direct Costs - Interfund 5750 145,444.00 0.00 -100.0%
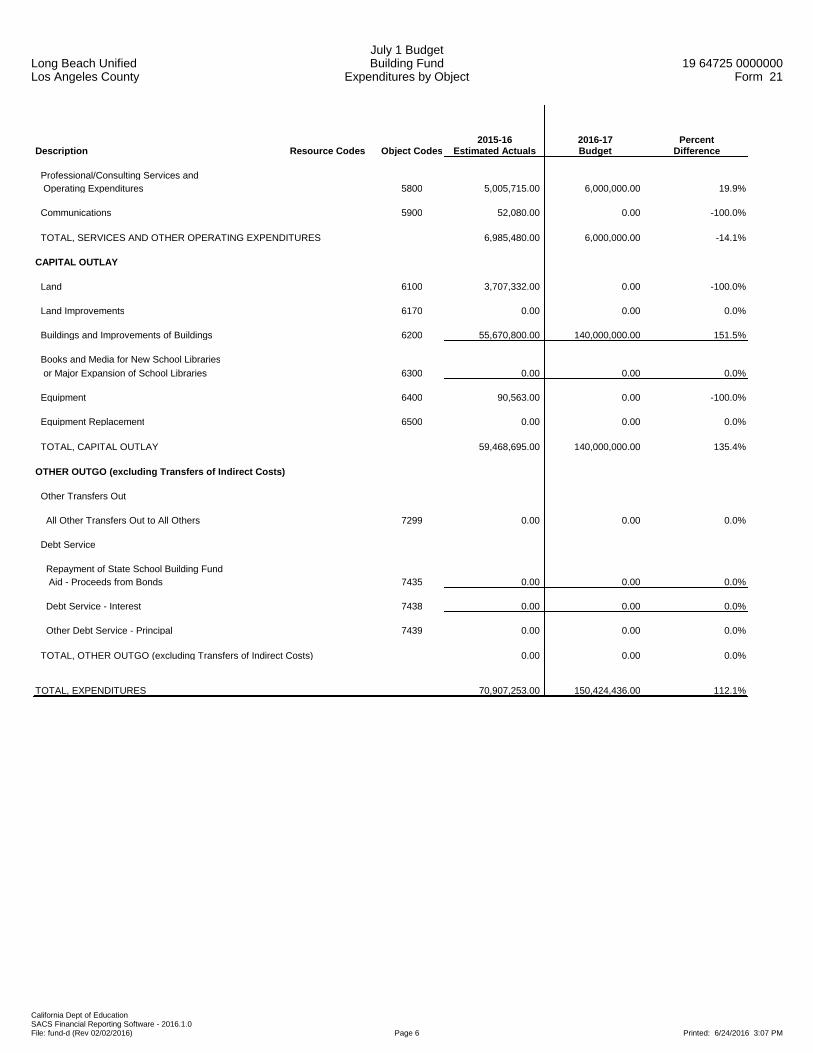
Long Beach UnifiedLos Angeles County
July 1 BudgetBuilding Fund
Expenditures by Object19 64725 0000000
Form 21
California Dept of EducationSACS Financial Reporting Software - 2016.1.0File: fund-d (Rev 02/02/2016) Page 6 Printed: 6/24/2016 3:07 PM
Description Resource Codes Object Codes2015-16
Estimated Actuals2016-17Budget
PercentDifference
Professional/Consulting Services and Operating Expenditures 5800 5,005,715.00 6,000,000.00 19.9%
Communications 5900 52,080.00 0.00 -100.0%
TOTAL, SERVICES AND OTHER OPERATING EXPENDITURES 6,985,480.00 6,000,000.00 -14.1%
CAPITAL OUTLAY
Land 6100 3,707,332.00 0.00 -100.0%
Land Improvements 6170 0.00 0.00 0.0%
Buildings and Improvements of Buildings 6200 55,670,800.00 140,000,000.00 151.5%
Books and Media for New School Libraries or Major Expansion of School Libraries 6300 0.00 0.00 0.0%
Equipment 6400 90,563.00 0.00 -100.0%
Equipment Replacement 6500 0.00 0.00 0.0%
TOTAL, CAPITAL OUTLAY 59,468,695.00 140,000,000.00 135.4%
OTHER OUTGO (excluding Transfers of Indirect Costs)
Other Transfers Out
All Other Transfers Out to All Others 7299 0.00 0.00 0.0%
Debt Service
Repayment of State School Building Fund Aid - Proceeds from Bonds 7435 0.00 0.00 0.0%
Debt Service - Interest 7438 0.00 0.00 0.0%
Other Debt Service - Principal 7439 0.00 0.00 0.0%
TOTAL, OTHER OUTGO (excluding Transfers of Indirect Costs) 0.00 0.00 0.0%
TOTAL, EXPENDITURES 70,907,253.00 150,424,436.00 112.1%

Long Beach UnifiedLos Angeles County
July 1 BudgetBuilding Fund
Expenditures by Object19 64725 0000000
Form 21
California Dept of EducationSACS Financial Reporting Software - 2016.1.0File: fund-d (Rev 02/02/2016) Page 7 Printed: 6/24/2016 3:07 PM
Description Resource Codes Object Codes2015-16
Estimated Actuals2016-17Budget
PercentDifference
INTERFUND TRANSFERS
INTERFUND TRANSFERS IN
Other Authorized Interfund Transfers In 8919 0.00 0.00 0.0%
(a) TOTAL, INTERFUND TRANSFERS IN 0.00 0.00 0.0%
INTERFUND TRANSFERS OUT
To: State School Building Fund/ County School Facilities Fund 7613 0.00 0.00 0.0%
Other Authorized Interfund Transfers Out 7619 0.00 0.00 0.0%
(b) TOTAL, INTERFUND TRANSFERS OUT 0.00 0.00 0.0%
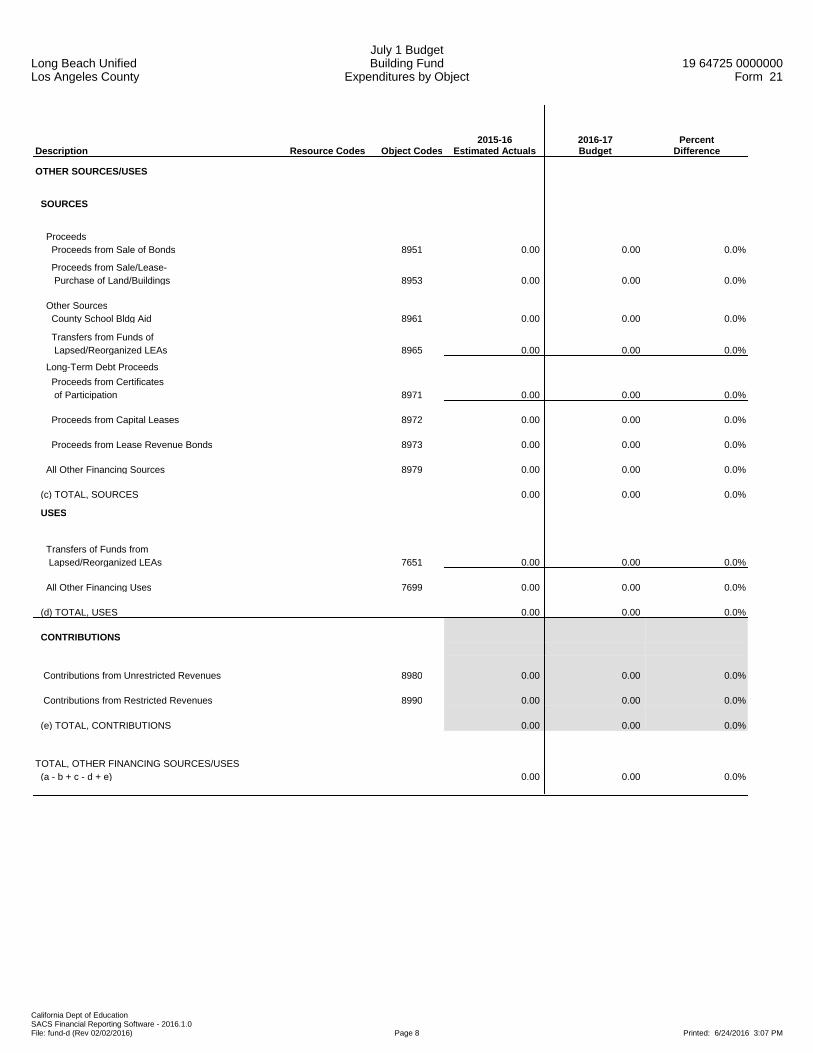
Long Beach UnifiedLos Angeles County
July 1 BudgetBuilding Fund
Expenditures by Object19 64725 0000000
Form 21
California Dept of EducationSACS Financial Reporting Software - 2016.1.0File: fund-d (Rev 02/02/2016) Page 8 Printed: 6/24/2016 3:07 PM
Description Resource Codes Object Codes2015-16
Estimated Actuals2016-17Budget
PercentDifference
OTHER SOURCES/USES
SOURCES
Proceeds Proceeds from Sale of Bonds 8951 0.00 0.00 0.0%
Proceeds from Sale/Lease- Purchase of Land/Buildings 8953 0.00 0.00 0.0%
Other Sources County School Bldg Aid 8961 0.00 0.00 0.0%
Transfers from Funds of Lapsed/Reorganized LEAs 8965 0.00 0.00 0.0%
Long-Term Debt Proceeds Proceeds from Certificates of Participation 8971 0.00 0.00 0.0%
Proceeds from Capital Leases 8972 0.00 0.00 0.0%
Proceeds from Lease Revenue Bonds 8973 0.00 0.00 0.0%
All Other Financing Sources 8979 0.00 0.00 0.0%
(c) TOTAL, SOURCES 0.00 0.00 0.0%
USES
Transfers of Funds from Lapsed/Reorganized LEAs 7651 0.00 0.00 0.0%
All Other Financing Uses 7699 0.00 0.00 0.0%
(d) TOTAL, USES 0.00 0.00 0.0%
CONTRIBUTIONS
Contributions from Unrestricted Revenues 8980 0.00 0.00 0.0%
Contributions from Restricted Revenues 8990 0.00 0.00 0.0%
(e) TOTAL, CONTRIBUTIONS 0.00 0.00 0.0%
TOTAL, OTHER FINANCING SOURCES/USES (a - b + c - d + e) 0.00 0.00 0.0%
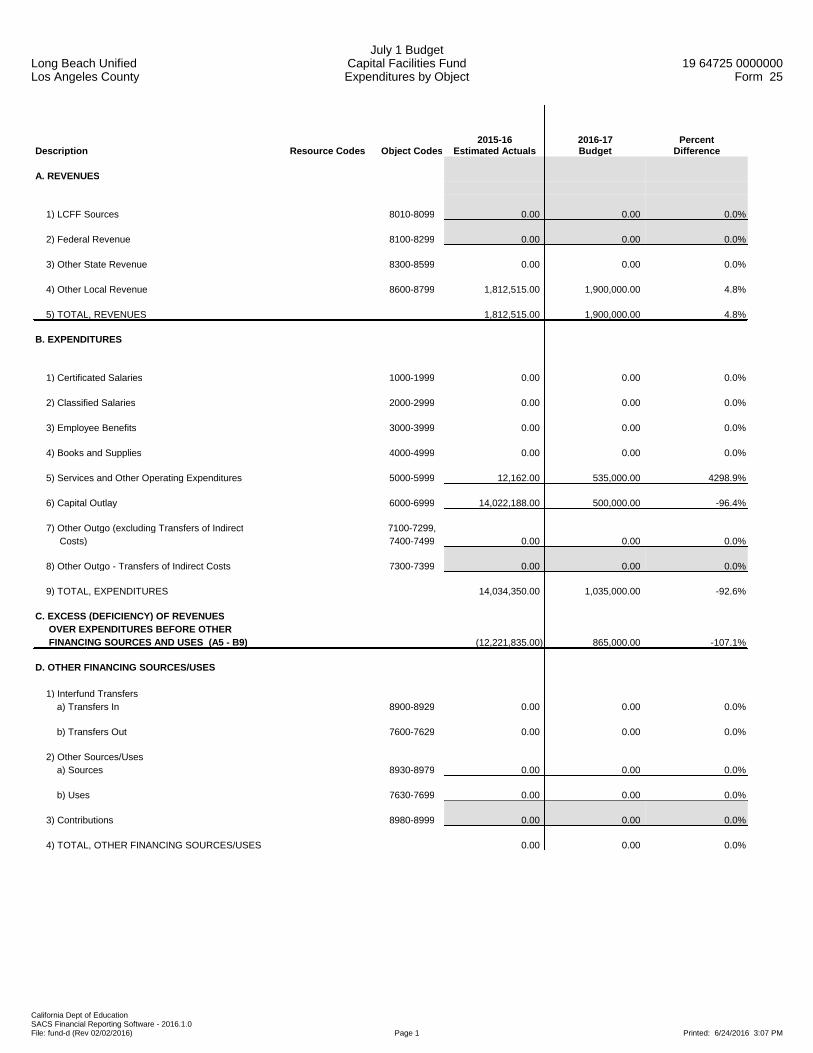
Long Beach UnifiedLos Angeles County
July 1 BudgetCapital Facilities FundExpenditures by Object
19 64725 0000000Form 25
California Dept of EducationSACS Financial Reporting Software - 2016.1.0File: fund-d (Rev 02/02/2016) Page 1 Printed: 6/24/2016 3:07 PM
Description Resource Codes Object Codes2015-16
Estimated Actuals2016-17Budget
PercentDifference
A. REVENUES
1) LCFF Sources 8010-8099 0.00 0.00 0.0%
2) Federal Revenue 8100-8299 0.00 0.00 0.0%
3) Other State Revenue 8300-8599 0.00 0.00 0.0%
4) Other Local Revenue 8600-8799 1,812,515.00 1,900,000.00 4.8%
5) TOTAL, REVENUES 1,812,515.00 1,900,000.00 4.8%
B. EXPENDITURES
1) Certificated Salaries 1000-1999 0.00 0.00 0.0%
2) Classified Salaries 2000-2999 0.00 0.00 0.0%
3) Employee Benefits 3000-3999 0.00 0.00 0.0%
4) Books and Supplies 4000-4999 0.00 0.00 0.0%
5) Services and Other Operating Expenditures 5000-5999 12,162.00 535,000.00 4298.9%
6) Capital Outlay 6000-6999 14,022,188.00 500,000.00 -96.4%
7) Other Outgo (excluding Transfers of Indirect 7100-7299, Costs) 7400-7499 0.00 0.00 0.0%
8) Other Outgo - Transfers of Indirect Costs 7300-7399 0.00 0.00 0.0%
9) TOTAL, EXPENDITURES 14,034,350.00 1,035,000.00 -92.6%
C. EXCESS (DEFICIENCY) OF REVENUES OVER EXPENDITURES BEFORE OTHER FINANCING SOURCES AND USES (A5 - B9) (12,221,835.00) 865,000.00 -107.1%
D. OTHER FINANCING SOURCES/USES 1) Interfund Transfers a) Transfers In 8900-8929 0.00 0.00 0.0%
b) Transfers Out 7600-7629 0.00 0.00 0.0%
2) Other Sources/Uses a) Sources 8930-8979 0.00 0.00 0.0%
b) Uses 7630-7699 0.00 0.00 0.0%
3) Contributions 8980-8999 0.00 0.00 0.0%
4) TOTAL, OTHER FINANCING SOURCES/USES 0.00 0.00 0.0%
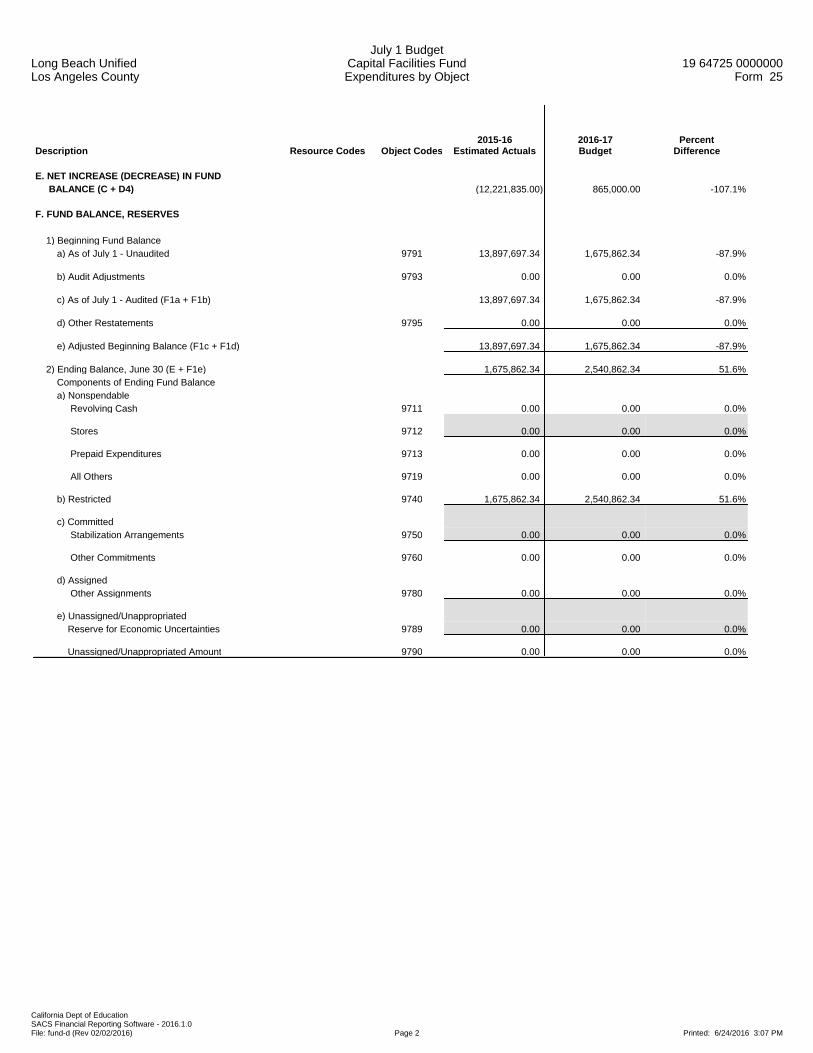
Long Beach UnifiedLos Angeles County
July 1 BudgetCapital Facilities FundExpenditures by Object
19 64725 0000000Form 25
California Dept of EducationSACS Financial Reporting Software - 2016.1.0File: fund-d (Rev 02/02/2016) Page 2 Printed: 6/24/2016 3:07 PM
Description Resource Codes Object Codes2015-16
Estimated Actuals2016-17Budget
PercentDifference
E. NET INCREASE (DECREASE) IN FUND BALANCE (C + D4) (12,221,835.00) 865,000.00 -107.1%
F. FUND BALANCE, RESERVES 1) Beginning Fund Balance a) As of July 1 - Unaudited 9791 13,897,697.34 1,675,862.34 -87.9%
b) Audit Adjustments 9793 0.00 0.00 0.0%
c) As of July 1 - Audited (F1a + F1b) 13,897,697.34 1,675,862.34 -87.9%
d) Other Restatements 9795 0.00 0.00 0.0%
e) Adjusted Beginning Balance (F1c + F1d) 13,897,697.34 1,675,862.34 -87.9%
2) Ending Balance, June 30 (E + F1e) 1,675,862.34 2,540,862.34 51.6% Components of Ending Fund Balance a) Nonspendable Revolving Cash 9711 0.00 0.00 0.0%
Stores 9712 0.00 0.00 0.0%
Prepaid Expenditures 9713 0.00 0.00 0.0%
All Others 9719 0.00 0.00 0.0%
b) Restricted 9740 1,675,862.34 2,540,862.34 51.6%
c) Committed Stabilization Arrangements 9750 0.00 0.00 0.0%
Other Commitments 9760 0.00 0.00 0.0%
d) Assigned Other Assignments 9780 0.00 0.00 0.0%
e) Unassigned/Unappropriated Reserve for Economic Uncertainties 9789 0.00 0.00 0.0%
Unassigned/Unappropriated Amount 9790 0.00 0.00 0.0%

Long Beach UnifiedLos Angeles County
July 1 BudgetCapital Facilities FundExpenditures by Object
19 64725 0000000Form 25
California Dept of EducationSACS Financial Reporting Software - 2016.1.0File: fund-d (Rev 02/02/2016) Page 3 Printed: 6/24/2016 3:07 PM
Description Resource Codes Object Codes2015-16
Estimated Actuals2016-17Budget
PercentDifference
G. ASSETS 1) Cash a) in County Treasury 9110 0.00
1) Fair Value Adjustment to Cash in County Treasury 9111 0.00
b) in Banks 9120 0.00
c) in Revolving Fund 9130 0.00
d) with Fiscal Agent 9135 0.00
e) collections awaiting deposit 9140 0.00
2) Investments 9150 0.00
3) Accounts Receivable 9200 0.00
4) Due from Grantor Government 9290 0.00
5) Due from Other Funds 9310 0.00
6) Stores 9320 0.00
7) Prepaid Expenditures 9330 0.00
8) Other Current Assets 9340 0.00
9) TOTAL, ASSETS 0.00
H. DEFERRED OUTFLOWS OF RESOURCES
1) Deferred Outflows of Resources 9490 0.00
2) TOTAL, DEFERRED OUTFLOWS 0.00
I. LIABILITIES
1) Accounts Payable 9500 0.00
2) Due to Grantor Governments 9590 0.00
3) Due to Other Funds 9610 0.00
4) Current Loans 9640 0.00
5) Unearned Revenue 9650 0.00
6) TOTAL, LIABILITIES 0.00
J. DEFERRED INFLOWS OF RESOURCES
1) Deferred Inflows of Resources 9690 0.00
2) TOTAL, DEFERRED INFLOWS 0.00
K. FUND EQUITY
Ending Fund Balance, June 30 (G9 + H2) - (I6 + J2) 0.00
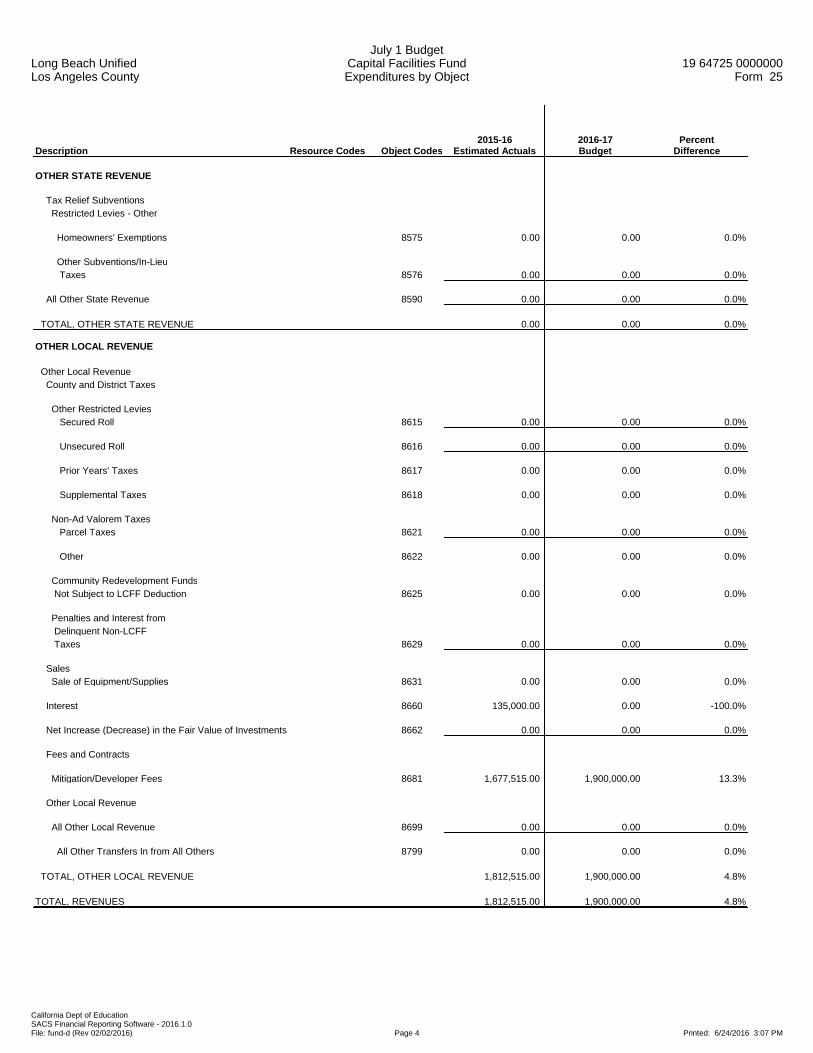
Long Beach UnifiedLos Angeles County
July 1 BudgetCapital Facilities FundExpenditures by Object
19 64725 0000000Form 25
California Dept of EducationSACS Financial Reporting Software - 2016.1.0File: fund-d (Rev 02/02/2016) Page 4 Printed: 6/24/2016 3:07 PM
Description Resource Codes Object Codes2015-16
Estimated Actuals2016-17Budget
PercentDifference
OTHER STATE REVENUE
Tax Relief Subventions Restricted Levies - Other
Homeowners' Exemptions 8575 0.00 0.00 0.0%
Other Subventions/In-Lieu Taxes 8576 0.00 0.00 0.0%
All Other State Revenue 8590 0.00 0.00 0.0%
TOTAL, OTHER STATE REVENUE 0.00 0.00 0.0%
OTHER LOCAL REVENUE
Other Local Revenue County and District Taxes
Other Restricted Levies Secured Roll 8615 0.00 0.00 0.0%
Unsecured Roll 8616 0.00 0.00 0.0%
Prior Years' Taxes 8617 0.00 0.00 0.0%
Supplemental Taxes 8618 0.00 0.00 0.0%
Non-Ad Valorem Taxes Parcel Taxes 8621 0.00 0.00 0.0%
Other 8622 0.00 0.00 0.0%
Community Redevelopment Funds Not Subject to LCFF Deduction 8625 0.00 0.00 0.0%
Penalties and Interest from Delinquent Non-LCFF Taxes 8629 0.00 0.00 0.0%
Sales Sale of Equipment/Supplies 8631 0.00 0.00 0.0%
Interest 8660 135,000.00 0.00 -100.0%
Net Increase (Decrease) in the Fair Value of Investments 8662 0.00 0.00 0.0%
Fees and Contracts
Mitigation/Developer Fees 8681 1,677,515.00 1,900,000.00 13.3%
Other Local Revenue
All Other Local Revenue 8699 0.00 0.00 0.0%
All Other Transfers In from All Others 8799 0.00 0.00 0.0%
TOTAL, OTHER LOCAL REVENUE 1,812,515.00 1,900,000.00 4.8%
TOTAL, REVENUES 1,812,515.00 1,900,000.00 4.8%

Long Beach UnifiedLos Angeles County
July 1 BudgetCapital Facilities FundExpenditures by Object
19 64725 0000000Form 25
California Dept of EducationSACS Financial Reporting Software - 2016.1.0File: fund-d (Rev 02/02/2016) Page 5 Printed: 6/24/2016 3:07 PM
Description Resource Codes Object Codes2015-16
Estimated Actuals2016-17Budget
PercentDifference
CERTIFICATED SALARIES
Other Certificated Salaries 1900 0.00 0.00 0.0%
TOTAL, CERTIFICATED SALARIES 0.00 0.00 0.0%
CLASSIFIED SALARIES
Classified Support Salaries 2200 0.00 0.00 0.0%
Classified Supervisors' and Administrators' Salaries 2300 0.00 0.00 0.0%
Clerical, Technical and Office Salaries 2400 0.00 0.00 0.0%
Other Classified Salaries 2900 0.00 0.00 0.0%
TOTAL, CLASSIFIED SALARIES 0.00 0.00 0.0%
EMPLOYEE BENEFITS
STRS 3101-3102 0.00 0.00 0.0%
PERS 3201-3202 0.00 0.00 0.0%
OASDI/Medicare/Alternative 3301-3302 0.00 0.00 0.0%
Health and Welfare Benefits 3401-3402 0.00 0.00 0.0%
Unemployment Insurance 3501-3502 0.00 0.00 0.0%
Workers' Compensation 3601-3602 0.00 0.00 0.0%
OPEB, Allocated 3701-3702 0.00 0.00 0.0%
OPEB, Active Employees 3751-3752 0.00 0.00 0.0%
Other Employee Benefits 3901-3902 0.00 0.00 0.0%
TOTAL, EMPLOYEE BENEFITS 0.00 0.00 0.0%
BOOKS AND SUPPLIES
Approved Textbooks and Core Curricula Materials 4100 0.00 0.00 0.0%
Books and Other Reference Materials 4200 0.00 0.00 0.0%
Materials and Supplies 4300 0.00 0.00 0.0%
Noncapitalized Equipment 4400 0.00 0.00 0.0%
TOTAL, BOOKS AND SUPPLIES 0.00 0.00 0.0%

Long Beach UnifiedLos Angeles County
July 1 BudgetCapital Facilities FundExpenditures by Object
19 64725 0000000Form 25
California Dept of EducationSACS Financial Reporting Software - 2016.1.0File: fund-d (Rev 02/02/2016) Page 6 Printed: 6/24/2016 3:07 PM
Description Resource Codes Object Codes2015-16
Estimated Actuals2016-17Budget
PercentDifference
SERVICES AND OTHER OPERATING EXPENDITURES
Subagreements for Services 5100 0.00 0.00 0.0%
Travel and Conferences 5200 0.00 0.00 0.0%
Insurance 5400-5450 0.00 0.00 0.0%
Operations and Housekeeping Services 5500 0.00 0.00 0.0%
Rentals, Leases, Repairs, and Noncapitalized Improvements 5600 0.00 0.00 0.0%
Transfers of Direct Costs 5710 0.00 0.00 0.0%
Transfers of Direct Costs - Interfund 5750 0.00 35,000.00 New
Professional/Consulting Services and Operating Expenditures 5800 12,162.00 500,000.00 4011.2%
Communications 5900 0.00 0.00 0.0%
TOTAL, SERVICES AND OTHER OPERATING EXPENDITURES 12,162.00 535,000.00 4298.9%
CAPITAL OUTLAY
Land 6100 0.00 0.00 0.0%
Land Improvements 6170 0.00 0.00 0.0%
Buildings and Improvements of Buildings 6200 14,022,188.00 500,000.00 -96.4%
Books and Media for New School Libraries or Major Expansion of School Libraries 6300 0.00 0.00 0.0%
Equipment 6400 0.00 0.00 0.0%
Equipment Replacement 6500 0.00 0.00 0.0%
TOTAL, CAPITAL OUTLAY 14,022,188.00 500,000.00 -96.4%
OTHER OUTGO (excluding Transfers of Indirect Costs)
Other Transfers Out
All Other Transfers Out to All Others 7299 0.00 0.00 0.0%
Debt Service
Debt Service - Interest 7438 0.00 0.00 0.0%
Other Debt Service - Principal 7439 0.00 0.00 0.0%
TOTAL, OTHER OUTGO (excluding Transfers of Indirect Costs) 0.00 0.00 0.0%
TOTAL, EXPENDITURES 14,034,350.00 1,035,000.00 -92.6%
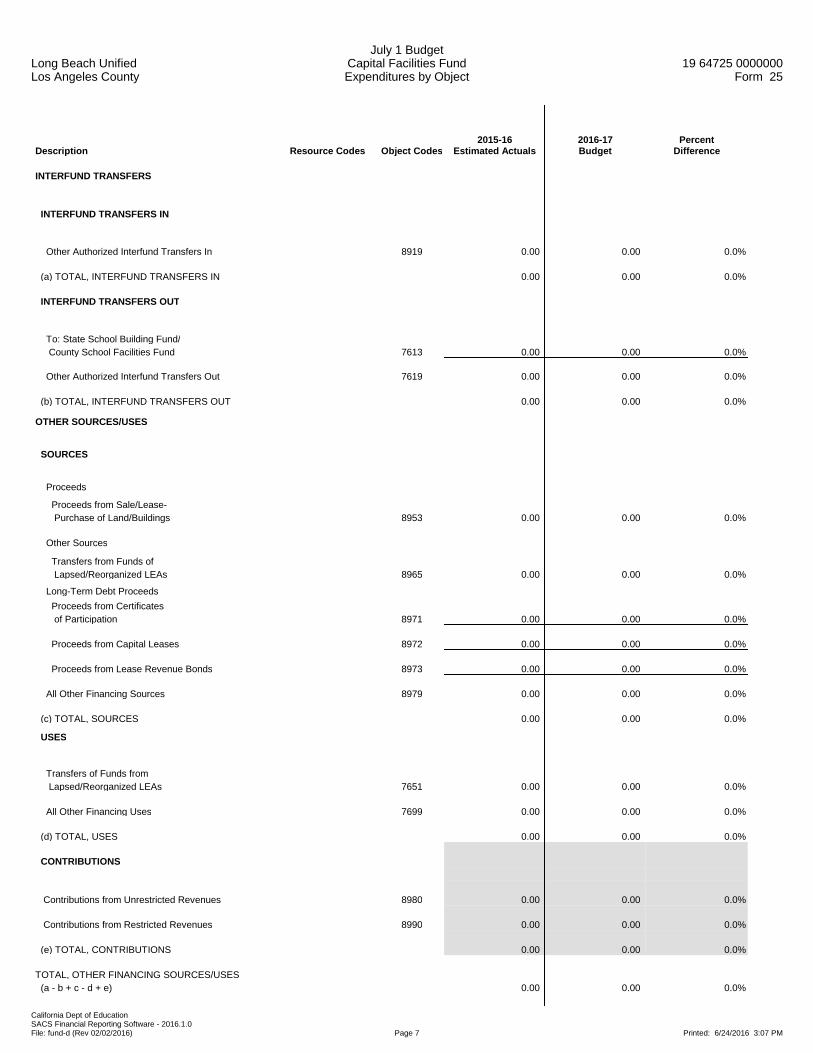
Long Beach UnifiedLos Angeles County
July 1 BudgetCapital Facilities FundExpenditures by Object
19 64725 0000000Form 25
California Dept of EducationSACS Financial Reporting Software - 2016.1.0File: fund-d (Rev 02/02/2016) Page 7 Printed: 6/24/2016 3:07 PM
Description Resource Codes Object Codes2015-16
Estimated Actuals2016-17Budget
PercentDifference
INTERFUND TRANSFERS
INTERFUND TRANSFERS IN
Other Authorized Interfund Transfers In 8919 0.00 0.00 0.0%
(a) TOTAL, INTERFUND TRANSFERS IN 0.00 0.00 0.0%
INTERFUND TRANSFERS OUT
To: State School Building Fund/ County School Facilities Fund 7613 0.00 0.00 0.0%
Other Authorized Interfund Transfers Out 7619 0.00 0.00 0.0%
(b) TOTAL, INTERFUND TRANSFERS OUT 0.00 0.00 0.0%
OTHER SOURCES/USES
SOURCES
Proceeds
Proceeds from Sale/Lease- Purchase of Land/Buildings 8953 0.00 0.00 0.0%
Other Sources
Transfers from Funds of Lapsed/Reorganized LEAs 8965 0.00 0.00 0.0%
Long-Term Debt Proceeds Proceeds from Certificates of Participation 8971 0.00 0.00 0.0%
Proceeds from Capital Leases 8972 0.00 0.00 0.0%
Proceeds from Lease Revenue Bonds 8973 0.00 0.00 0.0%
All Other Financing Sources 8979 0.00 0.00 0.0%
(c) TOTAL, SOURCES 0.00 0.00 0.0%
USES
Transfers of Funds from Lapsed/Reorganized LEAs 7651 0.00 0.00 0.0%
All Other Financing Uses 7699 0.00 0.00 0.0%
(d) TOTAL, USES 0.00 0.00 0.0%
CONTRIBUTIONS
Contributions from Unrestricted Revenues 8980 0.00 0.00 0.0%
Contributions from Restricted Revenues 8990 0.00 0.00 0.0%
(e) TOTAL, CONTRIBUTIONS 0.00 0.00 0.0%
TOTAL, OTHER FINANCING SOURCES/USES (a - b + c - d + e) 0.00 0.00 0.0%
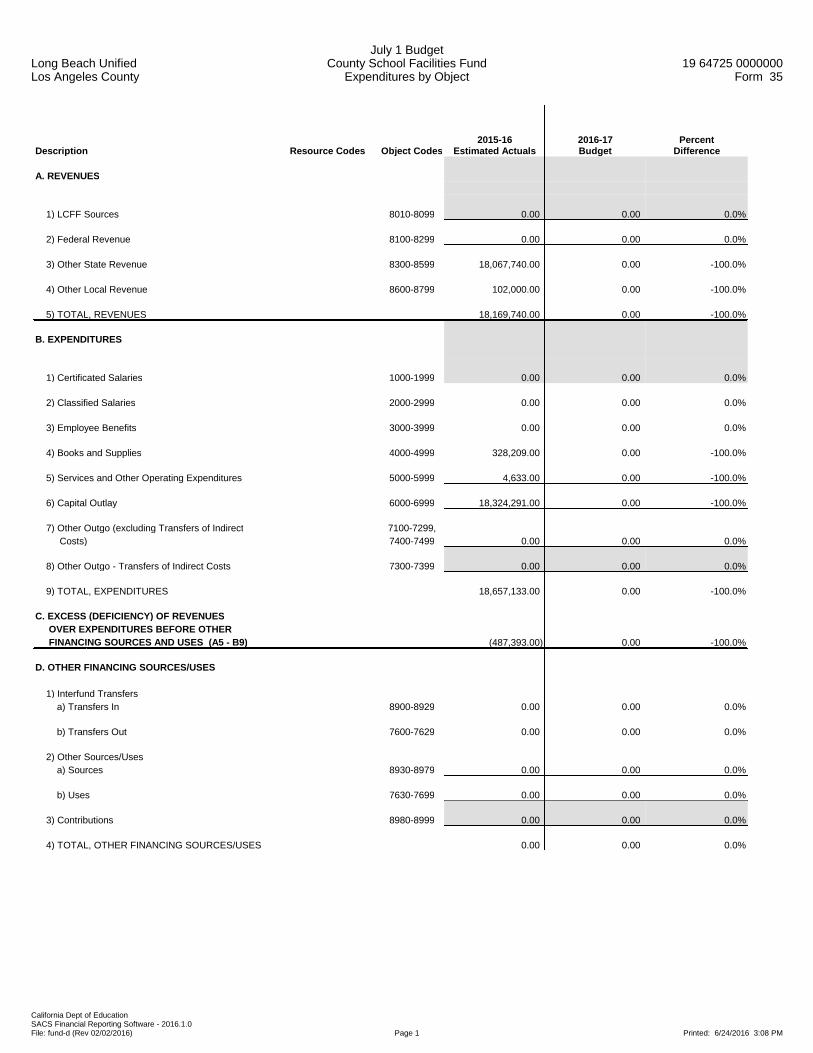
Long Beach UnifiedLos Angeles County
July 1 BudgetCounty School Facilities Fund
Expenditures by Object19 64725 0000000
Form 35
California Dept of EducationSACS Financial Reporting Software - 2016.1.0File: fund-d (Rev 02/02/2016) Page 1 Printed: 6/24/2016 3:08 PM
Description Resource Codes Object Codes2015-16
Estimated Actuals2016-17Budget
PercentDifference
A. REVENUES
1) LCFF Sources 8010-8099 0.00 0.00 0.0%
2) Federal Revenue 8100-8299 0.00 0.00 0.0%
3) Other State Revenue 8300-8599 18,067,740.00 0.00 -100.0%
4) Other Local Revenue 8600-8799 102,000.00 0.00 -100.0%
5) TOTAL, REVENUES 18,169,740.00 0.00 -100.0%
B. EXPENDITURES
1) Certificated Salaries 1000-1999 0.00 0.00 0.0%
2) Classified Salaries 2000-2999 0.00 0.00 0.0%
3) Employee Benefits 3000-3999 0.00 0.00 0.0%
4) Books and Supplies 4000-4999 328,209.00 0.00 -100.0%
5) Services and Other Operating Expenditures 5000-5999 4,633.00 0.00 -100.0%
6) Capital Outlay 6000-6999 18,324,291.00 0.00 -100.0%
7) Other Outgo (excluding Transfers of Indirect 7100-7299, Costs) 7400-7499 0.00 0.00 0.0%
8) Other Outgo - Transfers of Indirect Costs 7300-7399 0.00 0.00 0.0%
9) TOTAL, EXPENDITURES 18,657,133.00 0.00 -100.0%
C. EXCESS (DEFICIENCY) OF REVENUES OVER EXPENDITURES BEFORE OTHER FINANCING SOURCES AND USES (A5 - B9) (487,393.00) 0.00 -100.0%
D. OTHER FINANCING SOURCES/USES 1) Interfund Transfers a) Transfers In 8900-8929 0.00 0.00 0.0%
b) Transfers Out 7600-7629 0.00 0.00 0.0%
2) Other Sources/Uses a) Sources 8930-8979 0.00 0.00 0.0%
b) Uses 7630-7699 0.00 0.00 0.0%
3) Contributions 8980-8999 0.00 0.00 0.0%
4) TOTAL, OTHER FINANCING SOURCES/USES 0.00 0.00 0.0%

Long Beach UnifiedLos Angeles County
July 1 BudgetCounty School Facilities Fund
Expenditures by Object19 64725 0000000
Form 35
California Dept of EducationSACS Financial Reporting Software - 2016.1.0File: fund-d (Rev 02/02/2016) Page 2 Printed: 6/24/2016 3:08 PM
Description Resource Codes Object Codes2015-16
Estimated Actuals2016-17Budget
PercentDifference
E. NET INCREASE (DECREASE) IN FUND BALANCE (C + D4) (487,393.00) 0.00 -100.0%
F. FUND BALANCE, RESERVES 1) Beginning Fund Balance a) As of July 1 - Unaudited 9791 619,648.08 132,255.08 -78.7%
b) Audit Adjustments 9793 0.00 0.00 0.0%
c) As of July 1 - Audited (F1a + F1b) 619,648.08 132,255.08 -78.7%
d) Other Restatements 9795 0.00 0.00 0.0%
e) Adjusted Beginning Balance (F1c + F1d) 619,648.08 132,255.08 -78.7%
2) Ending Balance, June 30 (E + F1e) 132,255.08 132,255.08 0.0% Components of Ending Fund Balance a) Nonspendable Revolving Cash 9711 0.00 0.00 0.0%
Stores 9712 0.00 0.00 0.0%
Prepaid Expenditures 9713 0.00 0.00 0.0%
All Others 9719 0.00 0.00 0.0%
b) Restricted 9740 132,255.08 132,255.08 0.0%
c) Committed Stabilization Arrangements 9750 0.00 0.00 0.0%
Other Commitments 9760 0.00 0.00 0.0%
d) Assigned Other Assignments 9780 0.00 0.00 0.0%
e) Unassigned/Unappropriated Reserve for Economic Uncertainties 9789 0.00 0.00 0.0%
Unassigned/Unappropriated Amount 9790 0.00 0.00 0.0%
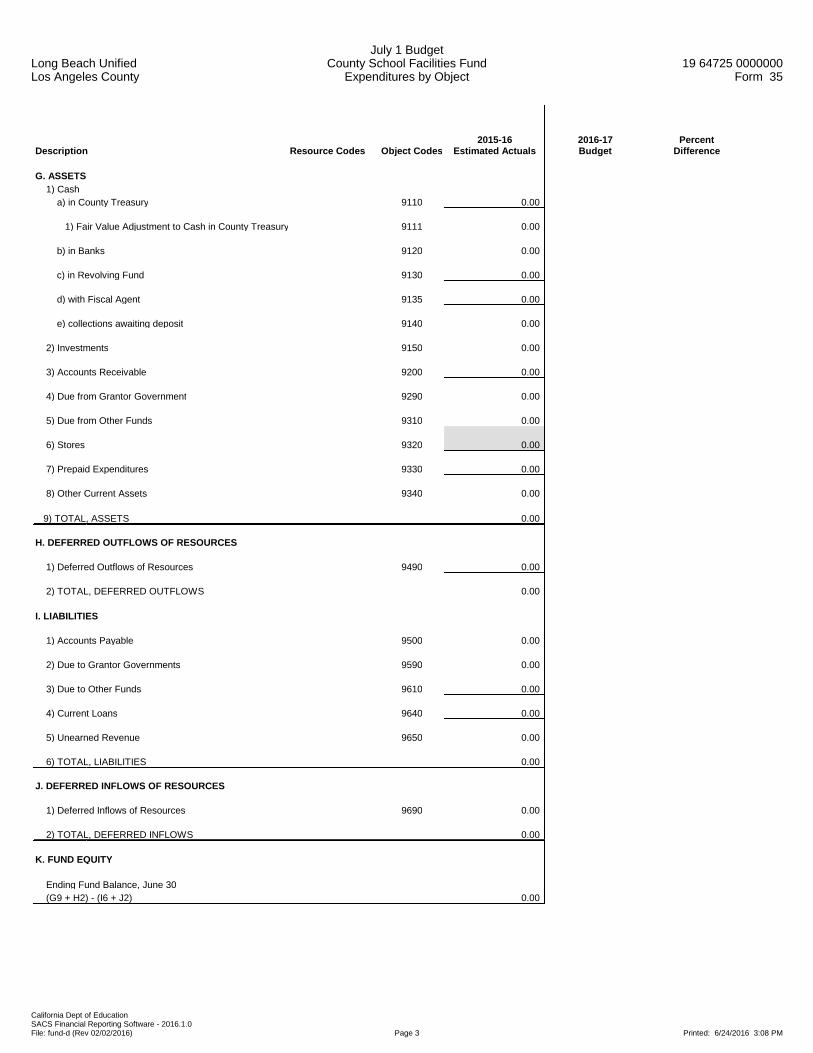
Long Beach UnifiedLos Angeles County
July 1 BudgetCounty School Facilities Fund
Expenditures by Object19 64725 0000000
Form 35
California Dept of EducationSACS Financial Reporting Software - 2016.1.0File: fund-d (Rev 02/02/2016) Page 3 Printed: 6/24/2016 3:08 PM
Description Resource Codes Object Codes2015-16
Estimated Actuals2016-17Budget
PercentDifference
G. ASSETS 1) Cash a) in County Treasury 9110 0.00
1) Fair Value Adjustment to Cash in County Treasury 9111 0.00
b) in Banks 9120 0.00
c) in Revolving Fund 9130 0.00
d) with Fiscal Agent 9135 0.00
e) collections awaiting deposit 9140 0.00
2) Investments 9150 0.00
3) Accounts Receivable 9200 0.00
4) Due from Grantor Government 9290 0.00
5) Due from Other Funds 9310 0.00
6) Stores 9320 0.00
7) Prepaid Expenditures 9330 0.00
8) Other Current Assets 9340 0.00
9) TOTAL, ASSETS 0.00
H. DEFERRED OUTFLOWS OF RESOURCES
1) Deferred Outflows of Resources 9490 0.00
2) TOTAL, DEFERRED OUTFLOWS 0.00
I. LIABILITIES
1) Accounts Payable 9500 0.00
2) Due to Grantor Governments 9590 0.00
3) Due to Other Funds 9610 0.00
4) Current Loans 9640 0.00
5) Unearned Revenue 9650 0.00
6) TOTAL, LIABILITIES 0.00
J. DEFERRED INFLOWS OF RESOURCES
1) Deferred Inflows of Resources 9690 0.00
2) TOTAL, DEFERRED INFLOWS 0.00
K. FUND EQUITY
Ending Fund Balance, June 30 (G9 + H2) - (I6 + J2) 0.00

Long Beach UnifiedLos Angeles County
July 1 BudgetCounty School Facilities Fund
Expenditures by Object19 64725 0000000
Form 35
California Dept of EducationSACS Financial Reporting Software - 2016.1.0File: fund-d (Rev 02/02/2016) Page 4 Printed: 6/24/2016 3:08 PM
Description Resource Codes Object Codes2015-16
Estimated Actuals2016-17Budget
PercentDifference
FEDERAL REVENUE
All Other Federal Revenue 8290 0.00 0.00 0.0%
TOTAL, FEDERAL REVENUE 0.00 0.00 0.0%
OTHER STATE REVENUE
School Facilities Apportionments 8545 18,067,740.00 0.00 -100.0%
Pass-Through Revenues from State Sources 8587 0.00 0.00 0.0%
All Other State Revenue 8590 0.00 0.00 0.0%
TOTAL, OTHER STATE REVENUE 18,067,740.00 0.00 -100.0%
OTHER LOCAL REVENUE
Sales Sale of Equipment/Supplies 8631 0.00 0.00 0.0%
Leases and Rentals 8650 0.00 0.00 0.0%
Interest 8660 102,000.00 0.00 -100.0%
Net Increase (Decrease) in the Fair Value of Investments 8662 0.00 0.00 0.0%
Other Local Revenue
All Other Local Revenue 8699 0.00 0.00 0.0%
All Other Transfers In from All Others 8799 0.00 0.00 0.0%
TOTAL, OTHER LOCAL REVENUE 102,000.00 0.00 -100.0%
TOTAL, REVENUES 18,169,740.00 0.00 -100.0%
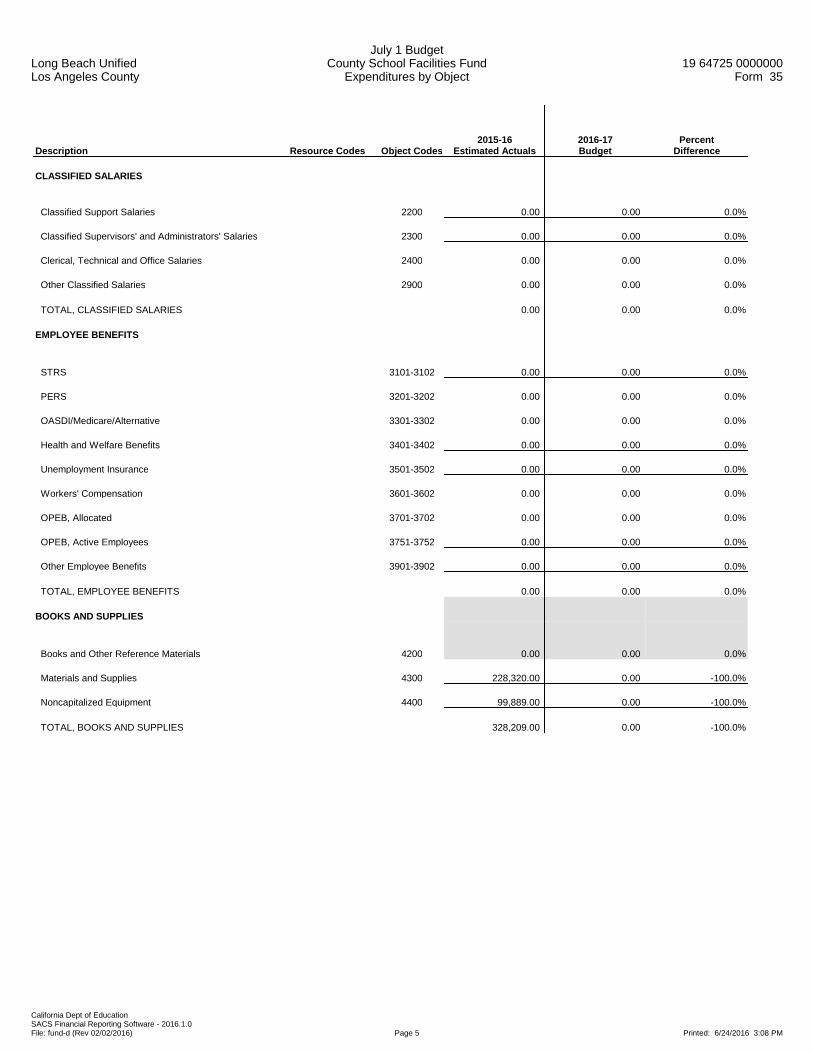
Long Beach UnifiedLos Angeles County
July 1 BudgetCounty School Facilities Fund
Expenditures by Object19 64725 0000000
Form 35
California Dept of EducationSACS Financial Reporting Software - 2016.1.0File: fund-d (Rev 02/02/2016) Page 5 Printed: 6/24/2016 3:08 PM
Description Resource Codes Object Codes2015-16
Estimated Actuals2016-17Budget
PercentDifference
CLASSIFIED SALARIES
Classified Support Salaries 2200 0.00 0.00 0.0%
Classified Supervisors' and Administrators' Salaries 2300 0.00 0.00 0.0%
Clerical, Technical and Office Salaries 2400 0.00 0.00 0.0%
Other Classified Salaries 2900 0.00 0.00 0.0%
TOTAL, CLASSIFIED SALARIES 0.00 0.00 0.0%
EMPLOYEE BENEFITS
STRS 3101-3102 0.00 0.00 0.0%
PERS 3201-3202 0.00 0.00 0.0%
OASDI/Medicare/Alternative 3301-3302 0.00 0.00 0.0%
Health and Welfare Benefits 3401-3402 0.00 0.00 0.0%
Unemployment Insurance 3501-3502 0.00 0.00 0.0%
Workers' Compensation 3601-3602 0.00 0.00 0.0%
OPEB, Allocated 3701-3702 0.00 0.00 0.0%
OPEB, Active Employees 3751-3752 0.00 0.00 0.0%
Other Employee Benefits 3901-3902 0.00 0.00 0.0%
TOTAL, EMPLOYEE BENEFITS 0.00 0.00 0.0%
BOOKS AND SUPPLIES
Books and Other Reference Materials 4200 0.00 0.00 0.0%
Materials and Supplies 4300 228,320.00 0.00 -100.0%
Noncapitalized Equipment 4400 99,889.00 0.00 -100.0%
TOTAL, BOOKS AND SUPPLIES 328,209.00 0.00 -100.0%

Long Beach UnifiedLos Angeles County
July 1 BudgetCounty School Facilities Fund
Expenditures by Object19 64725 0000000
Form 35
California Dept of EducationSACS Financial Reporting Software - 2016.1.0File: fund-d (Rev 02/02/2016) Page 6 Printed: 6/24/2016 3:08 PM
Description Resource Codes Object Codes2015-16
Estimated Actuals2016-17Budget
PercentDifference
SERVICES AND OTHER OPERATING EXPENDITURES
Subagreements for Services 5100 0.00 0.00 0.0%
Travel and Conferences 5200 0.00 0.00 0.0%
Insurance 5400-5450 0.00 0.00 0.0%
Operations and Housekeeping Services 5500 0.00 0.00 0.0%
Rentals, Leases, Repairs, and Noncapitalized Improvements 5600 0.00 0.00 0.0%
Transfers of Direct Costs 5710 0.00 0.00 0.0%
Transfers of Direct Costs - Interfund 5750 0.00 0.00 0.0%
Professional/Consulting Services and Operating Expenditures 5800 4,633.00 0.00 -100.0%
Communications 5900 0.00 0.00 0.0%
TOTAL, SERVICES AND OTHER OPERATING EXPENDITURES 4,633.00 0.00 -100.0%
CAPITAL OUTLAY
Land 6100 0.00 0.00 0.0%
Land Improvements 6170 0.00 0.00 0.0%
Buildings and Improvements of Buildings 6200 18,324,291.00 0.00 -100.0%
Books and Media for New School Libraries or Major Expansion of School Libraries 6300 0.00 0.00 0.0%
Equipment 6400 0.00 0.00 0.0%
Equipment Replacement 6500 0.00 0.00 0.0%
TOTAL, CAPITAL OUTLAY 18,324,291.00 0.00 -100.0%
OTHER OUTGO (excluding Transfers of Indirect Costs)
Other Transfers Out
Transfers of Pass-Through Revenues To Districts or Charter Schools 7211 0.00 0.00 0.0%
To County Offices 7212 0.00 0.00 0.0%
To JPAs 7213 0.00 0.00 0.0%
All Other Transfers Out to All Others 7299 0.00 0.00 0.0%
Debt Service
Debt Service - Interest 7438 0.00 0.00 0.0%
Other Debt Service - Principal 7439 0.00 0.00 0.0%
TOTAL, OTHER OUTGO (excluding Transfers of Indirect Costs) 0.00 0.00 0.0%
TOTAL, EXPENDITURES 18,657,133.00 0.00 -100.0%

Long Beach UnifiedLos Angeles County
July 1 BudgetCounty School Facilities Fund
Expenditures by Object19 64725 0000000
Form 35
California Dept of EducationSACS Financial Reporting Software - 2016.1.0File: fund-d (Rev 02/02/2016) Page 7 Printed: 6/24/2016 3:08 PM
Description Resource Codes Object Codes2015-16
Estimated Actuals2016-17Budget
PercentDifference
INTERFUND TRANSFERS
INTERFUND TRANSFERS IN
To: State School Building Fund/ County School Facilities Fund From: All Other Funds 8913 0.00 0.00 0.0%
Other Authorized Interfund Transfers In 8919 0.00 0.00 0.0%
(a) TOTAL, INTERFUND TRANSFERS IN 0.00 0.00 0.0%
INTERFUND TRANSFERS OUT
To: State School Building Fund/ County School Facilities Fund 7613 0.00 0.00 0.0%
Other Authorized Interfund Transfers Out 7619 0.00 0.00 0.0%
(b) TOTAL, INTERFUND TRANSFERS OUT 0.00 0.00 0.0%

Long Beach UnifiedLos Angeles County
July 1 BudgetCounty School Facilities Fund
Expenditures by Object19 64725 0000000
Form 35
California Dept of EducationSACS Financial Reporting Software - 2016.1.0File: fund-d (Rev 02/02/2016) Page 8 Printed: 6/24/2016 3:08 PM
Description Resource Codes Object Codes2015-16
Estimated Actuals2016-17Budget
PercentDifference
OTHER SOURCES/USES
SOURCES
Proceeds
Proceeds from Sale/Lease- Purchase of Land/Buildings 8953 0.00 0.00 0.0%
Other Sources
Transfers from Funds of Lapsed/Reorganized LEAs 8965 0.00 0.00 0.0%
Long-Term Debt Proceeds Proceeds from Certificates of Participation 8971 0.00 0.00 0.0%
Proceeds from Capital Leases 8972 0.00 0.00 0.0%
Proceeds from Lease Revenue Bonds 8973 0.00 0.00 0.0%
All Other Financing Sources 8979 0.00 0.00 0.0%
(c) TOTAL, SOURCES 0.00 0.00 0.0%
USES
Transfers of Funds from Lapsed/Reorganized LEAs 7651 0.00 0.00 0.0%
(d) TOTAL, USES 0.00 0.00 0.0%
CONTRIBUTIONS
Contributions from Unrestricted Revenues 8980 0.00 0.00 0.0%
Contributions from Restricted Revenues 8990 0.00 0.00 0.0%
(e) TOTAL, CONTRIBUTIONS 0.00 0.00 0.0%
TOTAL, OTHER FINANCING SOURCES/USES (a - b + c - d + e) 0.00 0.00 0.0%
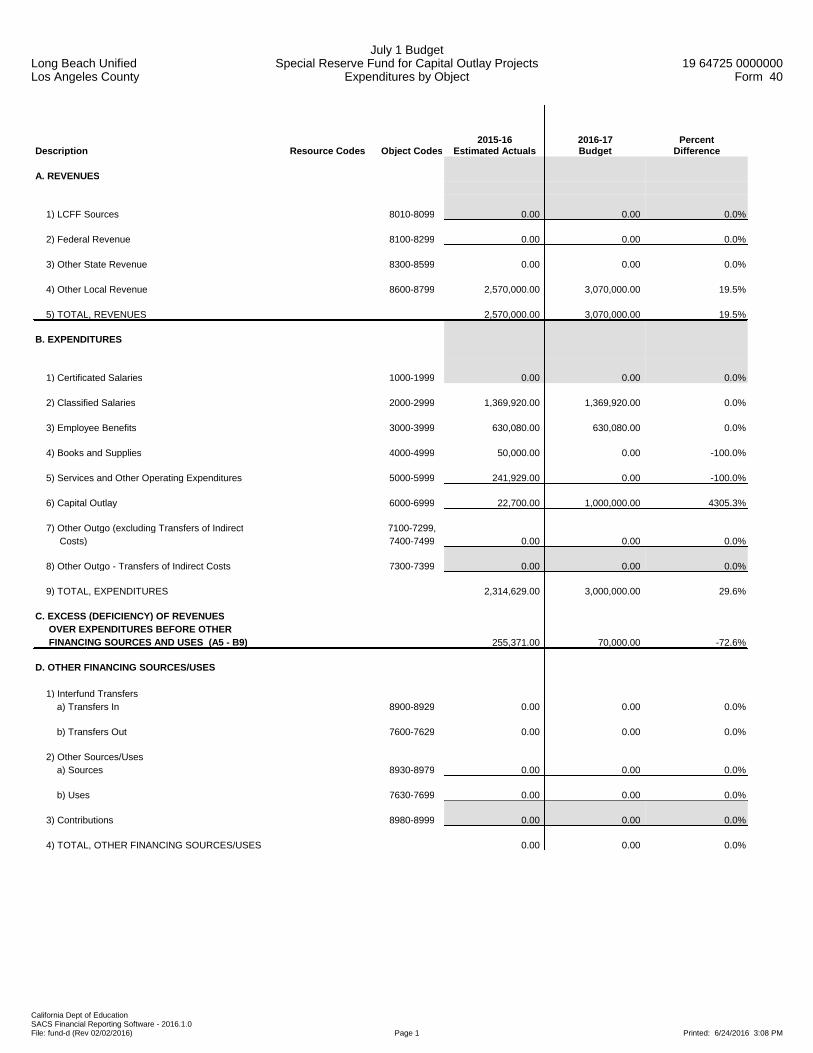
Long Beach UnifiedLos Angeles County
July 1 BudgetSpecial Reserve Fund for Capital Outlay Projects
Expenditures by Object19 64725 0000000
Form 40
California Dept of EducationSACS Financial Reporting Software - 2016.1.0File: fund-d (Rev 02/02/2016) Page 1 Printed: 6/24/2016 3:08 PM
Description Resource Codes Object Codes2015-16
Estimated Actuals2016-17Budget
PercentDifference
A. REVENUES
1) LCFF Sources 8010-8099 0.00 0.00 0.0%
2) Federal Revenue 8100-8299 0.00 0.00 0.0%
3) Other State Revenue 8300-8599 0.00 0.00 0.0%
4) Other Local Revenue 8600-8799 2,570,000.00 3,070,000.00 19.5%
5) TOTAL, REVENUES 2,570,000.00 3,070,000.00 19.5%
B. EXPENDITURES
1) Certificated Salaries 1000-1999 0.00 0.00 0.0%
2) Classified Salaries 2000-2999 1,369,920.00 1,369,920.00 0.0%
3) Employee Benefits 3000-3999 630,080.00 630,080.00 0.0%
4) Books and Supplies 4000-4999 50,000.00 0.00 -100.0%
5) Services and Other Operating Expenditures 5000-5999 241,929.00 0.00 -100.0%
6) Capital Outlay 6000-6999 22,700.00 1,000,000.00 4305.3%
7) Other Outgo (excluding Transfers of Indirect 7100-7299, Costs) 7400-7499 0.00 0.00 0.0%
8) Other Outgo - Transfers of Indirect Costs 7300-7399 0.00 0.00 0.0%
9) TOTAL, EXPENDITURES 2,314,629.00 3,000,000.00 29.6%
C. EXCESS (DEFICIENCY) OF REVENUES OVER EXPENDITURES BEFORE OTHER FINANCING SOURCES AND USES (A5 - B9) 255,371.00 70,000.00 -72.6%
D. OTHER FINANCING SOURCES/USES 1) Interfund Transfers a) Transfers In 8900-8929 0.00 0.00 0.0%
b) Transfers Out 7600-7629 0.00 0.00 0.0%
2) Other Sources/Uses a) Sources 8930-8979 0.00 0.00 0.0%
b) Uses 7630-7699 0.00 0.00 0.0%
3) Contributions 8980-8999 0.00 0.00 0.0%
4) TOTAL, OTHER FINANCING SOURCES/USES 0.00 0.00 0.0%

Long Beach UnifiedLos Angeles County
July 1 BudgetSpecial Reserve Fund for Capital Outlay Projects
Expenditures by Object19 64725 0000000
Form 40
California Dept of EducationSACS Financial Reporting Software - 2016.1.0File: fund-d (Rev 02/02/2016) Page 2 Printed: 6/24/2016 3:08 PM
Description Resource Codes Object Codes2015-16
Estimated Actuals2016-17Budget
PercentDifference
E. NET INCREASE (DECREASE) IN FUND BALANCE (C + D4) 255,371.00 70,000.00 -72.6%
F. FUND BALANCE, RESERVES 1) Beginning Fund Balance a) As of July 1 - Unaudited 9791 8,367,914.14 8,623,285.14 3.1%
b) Audit Adjustments 9793 0.00 0.00 0.0%
c) As of July 1 - Audited (F1a + F1b) 8,367,914.14 8,623,285.14 3.1%
d) Other Restatements 9795 0.00 0.00 0.0%
e) Adjusted Beginning Balance (F1c + F1d) 8,367,914.14 8,623,285.14 3.1%
2) Ending Balance, June 30 (E + F1e) 8,623,285.14 8,693,285.14 0.8% Components of Ending Fund Balance a) Nonspendable Revolving Cash 9711 0.00 0.00 0.0%
Stores 9712 0.00 0.00 0.0%
Prepaid Expenditures 9713 0.00 0.00 0.0%
All Others 9719 0.00 0.00 0.0%
b) Restricted 9740 8,623,285.14 8,693,285.14 0.8%
c) Committed Stabilization Arrangements 9750 0.00 0.00 0.0%
Other Commitments 9760 0.00 0.00 0.0%
d) Assigned Other Assignments 9780 0.00 0.00 0.0%
e) Unassigned/Unappropriated Reserve for Economic Uncertainties 9789 0.00 0.00 0.0%
Unassigned/Unappropriated Amount 9790 0.00 0.00 0.0%

Long Beach UnifiedLos Angeles County
July 1 BudgetSpecial Reserve Fund for Capital Outlay Projects
Expenditures by Object19 64725 0000000
Form 40
California Dept of EducationSACS Financial Reporting Software - 2016.1.0File: fund-d (Rev 02/02/2016) Page 3 Printed: 6/24/2016 3:08 PM
Description Resource Codes Object Codes2015-16
Estimated Actuals2016-17Budget
PercentDifference
G. ASSETS 1) Cash a) in County Treasury 9110 0.00
1) Fair Value Adjustment to Cash in County Treasury 9111 0.00
b) in Banks 9120 0.00
c) in Revolving Fund 9130 0.00
d) with Fiscal Agent 9135 0.00
e) collections awaiting deposit 9140 0.00
2) Investments 9150 0.00
3) Accounts Receivable 9200 0.00
4) Due from Grantor Government 9290 0.00
5) Due from Other Funds 9310 0.00
6) Stores 9320 0.00
7) Prepaid Expenditures 9330 0.00
8) Other Current Assets 9340 0.00
9) TOTAL, ASSETS 0.00
H. DEFERRED OUTFLOWS OF RESOURCES
1) Deferred Outflows of Resources 9490 0.00
2) TOTAL, DEFERRED OUTFLOWS 0.00
I. LIABILITIES
1) Accounts Payable 9500 0.00
2) Due to Grantor Governments 9590 0.00
3) Due to Other Funds 9610 0.00
4) Current Loans 9640 0.00
5) Unearned Revenue 9650 0.00
6) TOTAL, LIABILITIES 0.00
J. DEFERRED INFLOWS OF RESOURCES
1) Deferred Inflows of Resources 9690 0.00
2) TOTAL, DEFERRED INFLOWS 0.00
K. FUND EQUITY
Ending Fund Balance, June 30 (G9 + H2) - (I6 + J2) 0.00

Long Beach UnifiedLos Angeles County
July 1 BudgetSpecial Reserve Fund for Capital Outlay Projects
Expenditures by Object19 64725 0000000
Form 40
California Dept of EducationSACS Financial Reporting Software - 2016.1.0File: fund-d (Rev 02/02/2016) Page 4 Printed: 6/24/2016 3:08 PM
Description Resource Codes Object Codes2015-16
Estimated Actuals2016-17Budget
PercentDifference
FEDERAL REVENUE
FEMA 8281 0.00 0.00 0.0%
All Other Federal Revenue 8290 0.00 0.00 0.0%
TOTAL, FEDERAL REVENUE 0.00 0.00 0.0%
OTHER STATE REVENUE
Pass-Through Revenues from State Sources 8587 0.00 0.00 0.0%
California Clean Energy Jobs Act 6230 8590 0.00 0.00 0.0%
All Other State Revenue All Other 8590 0.00 0.00 0.0%
TOTAL, OTHER STATE REVENUE 0.00 0.00 0.0%
OTHER LOCAL REVENUE
Other Local Revenue
Community Redevelopment Funds Not Subject to LCFF Deduction 8625 2,500,000.00 3,000,000.00 20.0%
Sales Sale of Equipment/Supplies 8631 0.00 0.00 0.0%
Leases and Rentals 8650 0.00 0.00 0.0%
Interest 8660 70,000.00 70,000.00 0.0%
Net Increase (Decrease) in the Fair Value of Investments 8662 0.00 0.00 0.0%
Other Local Revenue
All Other Local Revenue 8699 0.00 0.00 0.0%
All Other Transfers In from All Others 8799 0.00 0.00 0.0%
TOTAL, OTHER LOCAL REVENUE 2,570,000.00 3,070,000.00 19.5%
TOTAL, REVENUES 2,570,000.00 3,070,000.00 19.5%
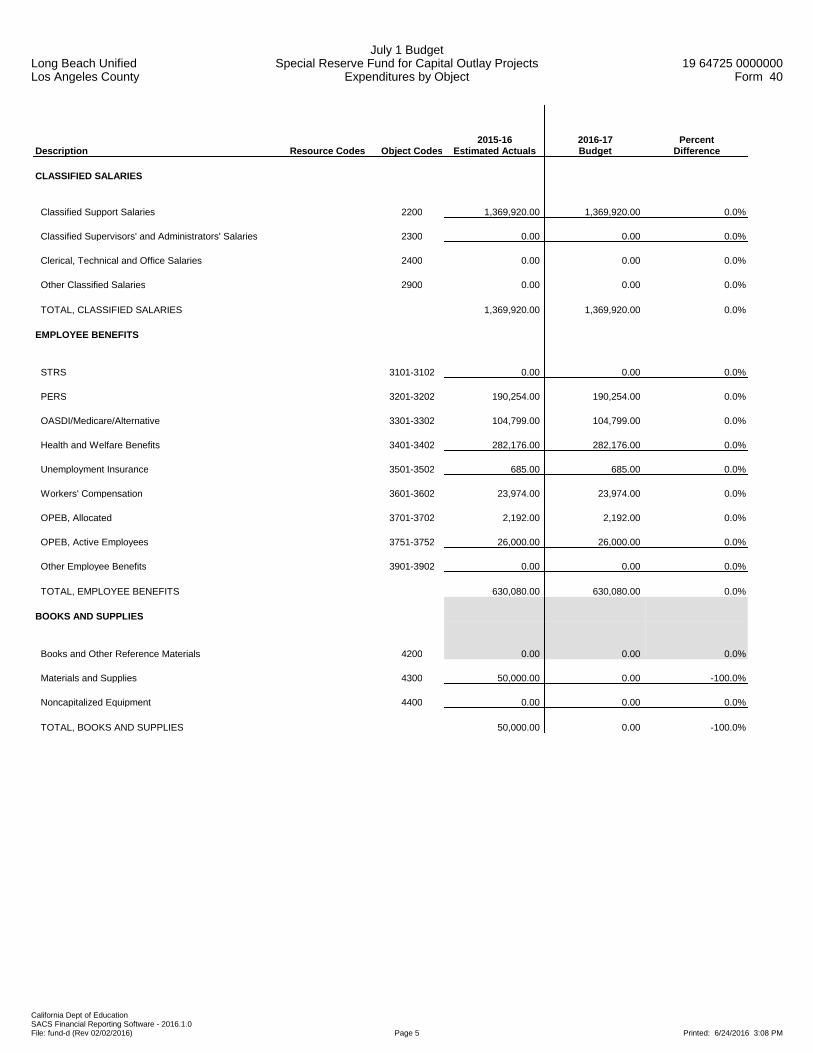
Long Beach UnifiedLos Angeles County
July 1 BudgetSpecial Reserve Fund for Capital Outlay Projects
Expenditures by Object19 64725 0000000
Form 40
California Dept of EducationSACS Financial Reporting Software - 2016.1.0File: fund-d (Rev 02/02/2016) Page 5 Printed: 6/24/2016 3:08 PM
Description Resource Codes Object Codes2015-16
Estimated Actuals2016-17Budget
PercentDifference
CLASSIFIED SALARIES
Classified Support Salaries 2200 1,369,920.00 1,369,920.00 0.0%
Classified Supervisors' and Administrators' Salaries 2300 0.00 0.00 0.0%
Clerical, Technical and Office Salaries 2400 0.00 0.00 0.0%
Other Classified Salaries 2900 0.00 0.00 0.0%
TOTAL, CLASSIFIED SALARIES 1,369,920.00 1,369,920.00 0.0%
EMPLOYEE BENEFITS
STRS 3101-3102 0.00 0.00 0.0%
PERS 3201-3202 190,254.00 190,254.00 0.0%
OASDI/Medicare/Alternative 3301-3302 104,799.00 104,799.00 0.0%
Health and Welfare Benefits 3401-3402 282,176.00 282,176.00 0.0%
Unemployment Insurance 3501-3502 685.00 685.00 0.0%
Workers' Compensation 3601-3602 23,974.00 23,974.00 0.0%
OPEB, Allocated 3701-3702 2,192.00 2,192.00 0.0%
OPEB, Active Employees 3751-3752 26,000.00 26,000.00 0.0%
Other Employee Benefits 3901-3902 0.00 0.00 0.0%
TOTAL, EMPLOYEE BENEFITS 630,080.00 630,080.00 0.0%
BOOKS AND SUPPLIES
Books and Other Reference Materials 4200 0.00 0.00 0.0%
Materials and Supplies 4300 50,000.00 0.00 -100.0%
Noncapitalized Equipment 4400 0.00 0.00 0.0%
TOTAL, BOOKS AND SUPPLIES 50,000.00 0.00 -100.0%

Long Beach UnifiedLos Angeles County
July 1 BudgetSpecial Reserve Fund for Capital Outlay Projects
Expenditures by Object19 64725 0000000
Form 40
California Dept of EducationSACS Financial Reporting Software - 2016.1.0File: fund-d (Rev 02/02/2016) Page 6 Printed: 6/24/2016 3:08 PM
Description Resource Codes Object Codes2015-16
Estimated Actuals2016-17Budget
PercentDifference
SERVICES AND OTHER OPERATING EXPENDITURES
Subagreements for Services 5100 0.00 0.00 0.0%
Travel and Conferences 5200 0.00 0.00 0.0%
Insurance 5400-5450 0.00 0.00 0.0%
Operations and Housekeeping Services 5500 0.00 0.00 0.0%
Rentals, Leases, Repairs, and Noncapitalized Improvements 5600 0.00 0.00 0.0%
Transfers of Direct Costs 5710 0.00 0.00 0.0%
Transfers of Direct Costs - Interfund 5750 5,500.00 0.00 -100.0%
Professional/Consulting Services and Operating Expenditures 5800 236,429.00 0.00 -100.0%
Communications 5900 0.00 0.00 0.0%
TOTAL, SERVICES AND OTHER OPERATING EXPENDITURES 241,929.00 0.00 -100.0%
CAPITAL OUTLAY
Land 6100 21,700.00 0.00 -100.0%
Land Improvements 6170 0.00 0.00 0.0%
Buildings and Improvements of Buildings 6200 1,000.00 1,000,000.00 99900.0%
Books and Media for New School Libraries or Major Expansion of School Libraries 6300 0.00 0.00 0.0%
Equipment 6400 0.00 0.00 0.0%
Equipment Replacement 6500 0.00 0.00 0.0%
TOTAL, CAPITAL OUTLAY 22,700.00 1,000,000.00 4305.3%
OTHER OUTGO (excluding Transfers of Indirect Costs)
Other Transfers Out
Transfers of Pass-Through Revenues To Districts or Charter Schools 7211 0.00 0.00 0.0%
To County Offices 7212 0.00 0.00 0.0%
To JPAs 7213 0.00 0.00 0.0%
All Other Transfers Out to All Others 7299 0.00 0.00 0.0%
Debt Service
Debt Service - Interest 7438 0.00 0.00 0.0%
Other Debt Service - Principal 7439 0.00 0.00 0.0%
TOTAL, OTHER OUTGO (excluding Transfers of Indirect Costs) 0.00 0.00 0.0%
TOTAL, EXPENDITURES 2,314,629.00 3,000,000.00 29.6%
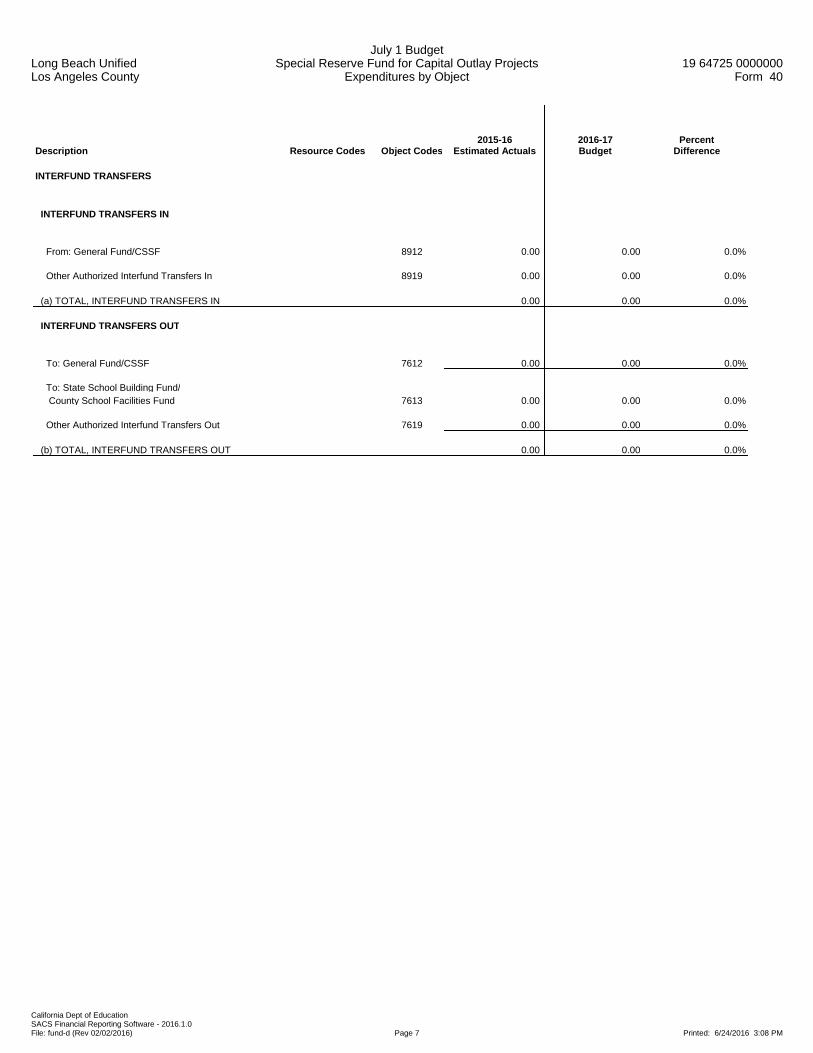
Long Beach UnifiedLos Angeles County
July 1 BudgetSpecial Reserve Fund for Capital Outlay Projects
Expenditures by Object19 64725 0000000
Form 40
California Dept of EducationSACS Financial Reporting Software - 2016.1.0File: fund-d (Rev 02/02/2016) Page 7 Printed: 6/24/2016 3:08 PM
Description Resource Codes Object Codes2015-16
Estimated Actuals2016-17Budget
PercentDifference
INTERFUND TRANSFERS
INTERFUND TRANSFERS IN
From: General Fund/CSSF 8912 0.00 0.00 0.0%
Other Authorized Interfund Transfers In 8919 0.00 0.00 0.0%
(a) TOTAL, INTERFUND TRANSFERS IN 0.00 0.00 0.0%
INTERFUND TRANSFERS OUT
To: General Fund/CSSF 7612 0.00 0.00 0.0%
To: State School Building Fund/ County School Facilities Fund 7613 0.00 0.00 0.0%
Other Authorized Interfund Transfers Out 7619 0.00 0.00 0.0%
(b) TOTAL, INTERFUND TRANSFERS OUT 0.00 0.00 0.0%
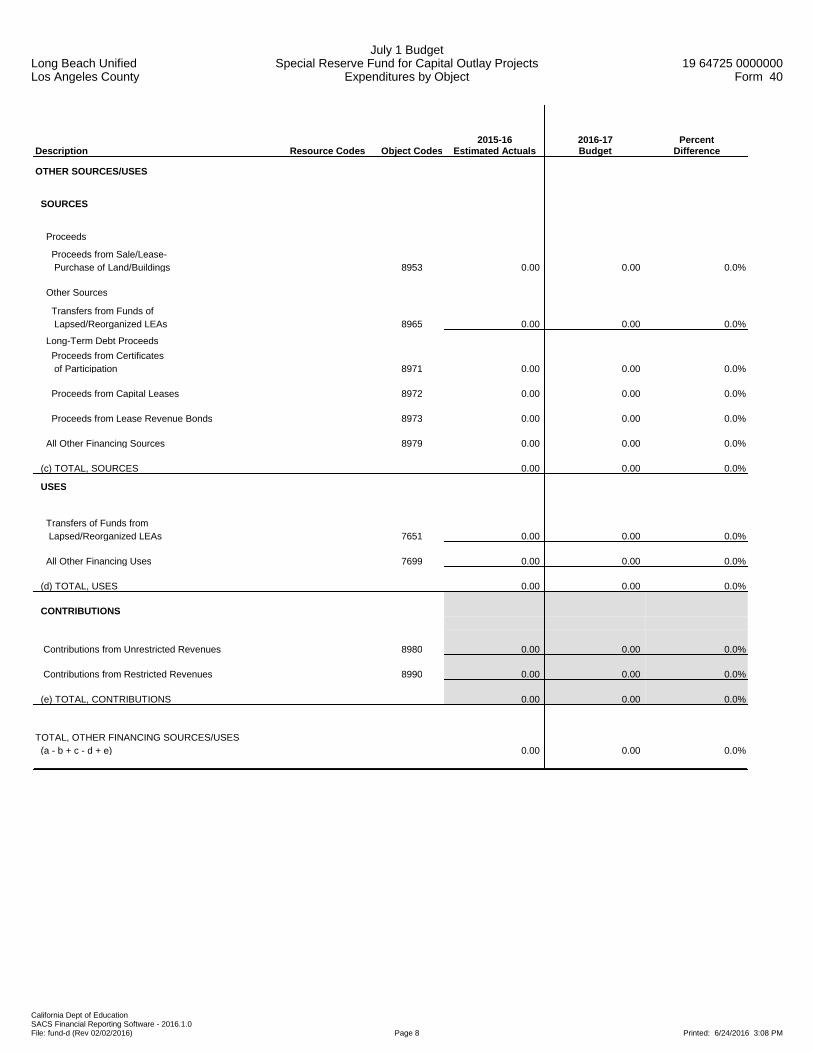
Long Beach UnifiedLos Angeles County
July 1 BudgetSpecial Reserve Fund for Capital Outlay Projects
Expenditures by Object19 64725 0000000
Form 40
California Dept of EducationSACS Financial Reporting Software - 2016.1.0File: fund-d (Rev 02/02/2016) Page 8 Printed: 6/24/2016 3:08 PM
Description Resource Codes Object Codes2015-16
Estimated Actuals2016-17Budget
PercentDifference
OTHER SOURCES/USES
SOURCES
Proceeds
Proceeds from Sale/Lease- Purchase of Land/Buildings 8953 0.00 0.00 0.0%
Other Sources
Transfers from Funds of Lapsed/Reorganized LEAs 8965 0.00 0.00 0.0%
Long-Term Debt Proceeds Proceeds from Certificates of Participation 8971 0.00 0.00 0.0%
Proceeds from Capital Leases 8972 0.00 0.00 0.0%
Proceeds from Lease Revenue Bonds 8973 0.00 0.00 0.0%
All Other Financing Sources 8979 0.00 0.00 0.0%
(c) TOTAL, SOURCES 0.00 0.00 0.0%
USES
Transfers of Funds from Lapsed/Reorganized LEAs 7651 0.00 0.00 0.0%
All Other Financing Uses 7699 0.00 0.00 0.0%
(d) TOTAL, USES 0.00 0.00 0.0%
CONTRIBUTIONS
Contributions from Unrestricted Revenues 8980 0.00 0.00 0.0%
Contributions from Restricted Revenues 8990 0.00 0.00 0.0%
(e) TOTAL, CONTRIBUTIONS 0.00 0.00 0.0%
TOTAL, OTHER FINANCING SOURCES/USES (a - b + c - d + e) 0.00 0.00 0.0%
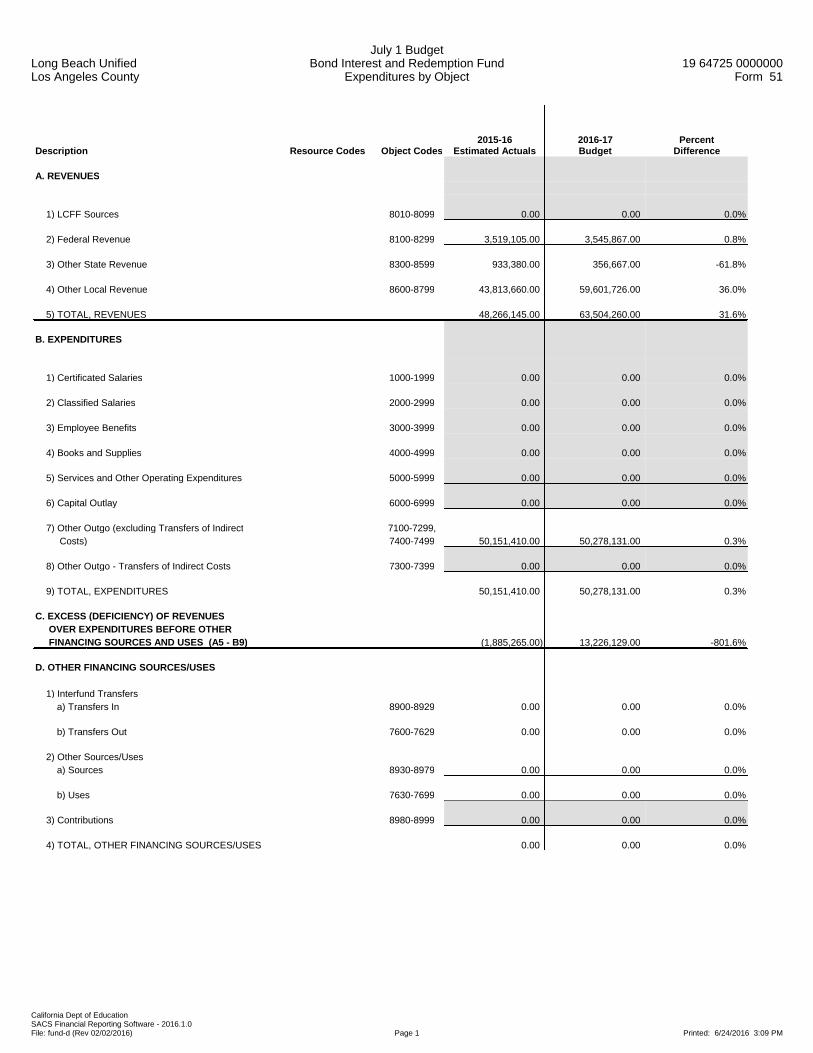
Long Beach UnifiedLos Angeles County
July 1 BudgetBond Interest and Redemption Fund
Expenditures by Object19 64725 0000000
Form 51
California Dept of EducationSACS Financial Reporting Software - 2016.1.0File: fund-d (Rev 02/02/2016) Page 1 Printed: 6/24/2016 3:09 PM
Description Resource Codes Object Codes2015-16
Estimated Actuals2016-17Budget
PercentDifference
A. REVENUES
1) LCFF Sources 8010-8099 0.00 0.00 0.0%
2) Federal Revenue 8100-8299 3,519,105.00 3,545,867.00 0.8%
3) Other State Revenue 8300-8599 933,380.00 356,667.00 -61.8%
4) Other Local Revenue 8600-8799 43,813,660.00 59,601,726.00 36.0%
5) TOTAL, REVENUES 48,266,145.00 63,504,260.00 31.6%
B. EXPENDITURES
1) Certificated Salaries 1000-1999 0.00 0.00 0.0%
2) Classified Salaries 2000-2999 0.00 0.00 0.0%
3) Employee Benefits 3000-3999 0.00 0.00 0.0%
4) Books and Supplies 4000-4999 0.00 0.00 0.0%
5) Services and Other Operating Expenditures 5000-5999 0.00 0.00 0.0%
6) Capital Outlay 6000-6999 0.00 0.00 0.0%
7) Other Outgo (excluding Transfers of Indirect 7100-7299, Costs) 7400-7499 50,151,410.00 50,278,131.00 0.3%
8) Other Outgo - Transfers of Indirect Costs 7300-7399 0.00 0.00 0.0%
9) TOTAL, EXPENDITURES 50,151,410.00 50,278,131.00 0.3%
C. EXCESS (DEFICIENCY) OF REVENUES OVER EXPENDITURES BEFORE OTHER FINANCING SOURCES AND USES (A5 - B9) (1,885,265.00) 13,226,129.00 -801.6%
D. OTHER FINANCING SOURCES/USES 1) Interfund Transfers a) Transfers In 8900-8929 0.00 0.00 0.0%
b) Transfers Out 7600-7629 0.00 0.00 0.0%
2) Other Sources/Uses a) Sources 8930-8979 0.00 0.00 0.0%
b) Uses 7630-7699 0.00 0.00 0.0%
3) Contributions 8980-8999 0.00 0.00 0.0%
4) TOTAL, OTHER FINANCING SOURCES/USES 0.00 0.00 0.0%
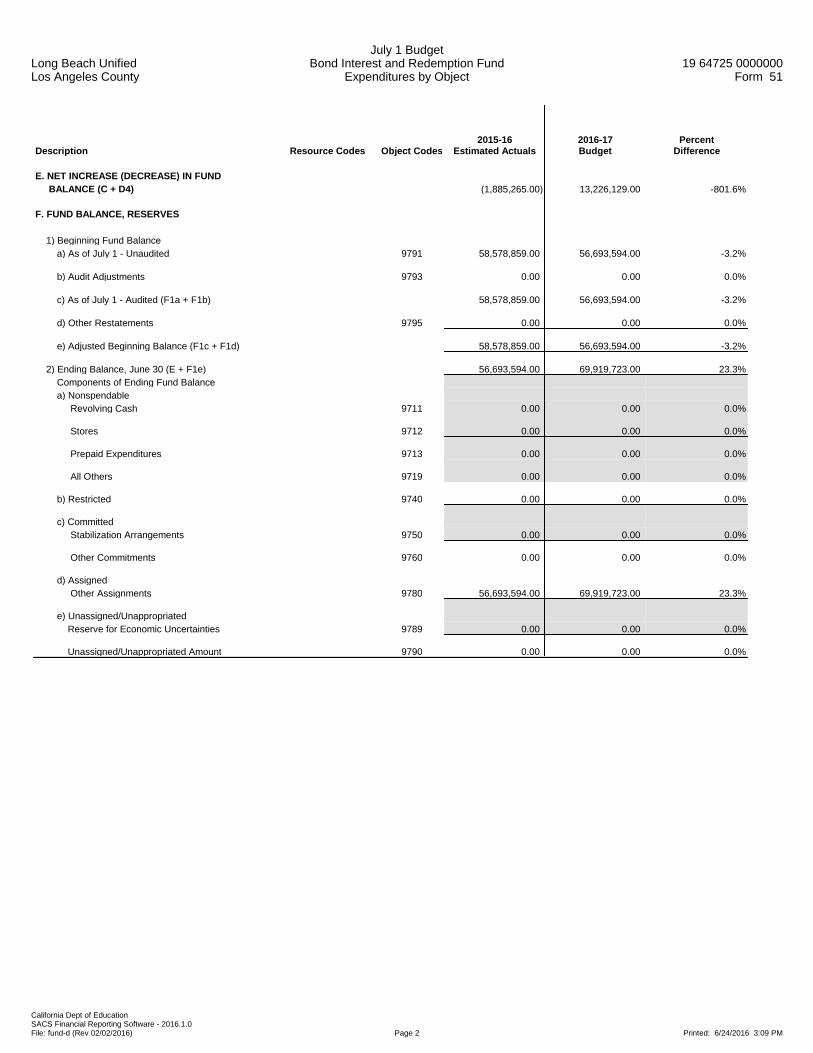
Long Beach UnifiedLos Angeles County
July 1 BudgetBond Interest and Redemption Fund
Expenditures by Object19 64725 0000000
Form 51
California Dept of EducationSACS Financial Reporting Software - 2016.1.0File: fund-d (Rev 02/02/2016) Page 2 Printed: 6/24/2016 3:09 PM
Description Resource Codes Object Codes2015-16
Estimated Actuals2016-17Budget
PercentDifference
E. NET INCREASE (DECREASE) IN FUND BALANCE (C + D4) (1,885,265.00) 13,226,129.00 -801.6%
F. FUND BALANCE, RESERVES 1) Beginning Fund Balance a) As of July 1 - Unaudited 9791 58,578,859.00 56,693,594.00 -3.2%
b) Audit Adjustments 9793 0.00 0.00 0.0%
c) As of July 1 - Audited (F1a + F1b) 58,578,859.00 56,693,594.00 -3.2%
d) Other Restatements 9795 0.00 0.00 0.0%
e) Adjusted Beginning Balance (F1c + F1d) 58,578,859.00 56,693,594.00 -3.2%
2) Ending Balance, June 30 (E + F1e) 56,693,594.00 69,919,723.00 23.3% Components of Ending Fund Balance a) Nonspendable Revolving Cash 9711 0.00 0.00 0.0%
Stores 9712 0.00 0.00 0.0%
Prepaid Expenditures 9713 0.00 0.00 0.0%
All Others 9719 0.00 0.00 0.0%
b) Restricted 9740 0.00 0.00 0.0%
c) Committed Stabilization Arrangements 9750 0.00 0.00 0.0%
Other Commitments 9760 0.00 0.00 0.0%
d) Assigned Other Assignments 9780 56,693,594.00 69,919,723.00 23.3%
e) Unassigned/Unappropriated Reserve for Economic Uncertainties 9789 0.00 0.00 0.0%
Unassigned/Unappropriated Amount 9790 0.00 0.00 0.0%

Long Beach UnifiedLos Angeles County
July 1 BudgetBond Interest and Redemption Fund
Expenditures by Object19 64725 0000000
Form 51
California Dept of EducationSACS Financial Reporting Software - 2016.1.0File: fund-d (Rev 02/02/2016) Page 3 Printed: 6/24/2016 3:09 PM
Description Resource Codes Object Codes2015-16
Estimated Actuals2016-17Budget
PercentDifference
G. ASSETS 1) Cash a) in County Treasury 9110 0.00
1) Fair Value Adjustment to Cash in County Treasury 9111 0.00
b) in Banks 9120 0.00
c) in Revolving Fund 9130 0.00
d) with Fiscal Agent 9135 0.00
e) collections awaiting deposit 9140 0.00
2) Investments 9150 0.00
3) Accounts Receivable 9200 0.00
4) Due from Grantor Government 9290 0.00
5) Due from Other Funds 9310 0.00
6) Stores 9320 0.00
7) Prepaid Expenditures 9330 0.00
8) Other Current Assets 9340 0.00
9) TOTAL, ASSETS 0.00
H. DEFERRED OUTFLOWS OF RESOURCES
1) Deferred Outflows of Resources 9490 0.00
2) TOTAL, DEFERRED OUTFLOWS 0.00
I. LIABILITIES
1) Accounts Payable 9500 0.00
2) Due to Grantor Governments 9590 0.00
3) Due to Other Funds 9610 0.00
4) Current Loans 9640 0.00
5) Unearned Revenue 9650 0.00
6) TOTAL, LIABILITIES 0.00
J. DEFERRED INFLOWS OF RESOURCES
1) Deferred Inflows of Resources 9690 0.00
2) TOTAL, DEFERRED INFLOWS 0.00
K. FUND EQUITY
Ending Fund Balance, June 30 (G9 + H2) - (I6 + J2) 0.00

Long Beach UnifiedLos Angeles County
July 1 BudgetBond Interest and Redemption Fund
Expenditures by Object19 64725 0000000
Form 51
California Dept of EducationSACS Financial Reporting Software - 2016.1.0File: fund-d (Rev 02/02/2016) Page 4 Printed: 6/24/2016 3:09 PM
Description Resource Codes Object Codes2015-16
Estimated Actuals2016-17Budget
PercentDifference
FEDERAL REVENUE
All Other Federal Revenue 8290 3,519,105.00 3,545,867.00 0.8%
TOTAL, FEDERAL REVENUE 3,519,105.00 3,545,867.00 0.8%
OTHER STATE REVENUE
Tax Relief Subventions Voted Indebtedness Levies
Homeowners' Exemptions 8571 933,380.00 356,667.00 -61.8%
Other Subventions/In-Lieu Taxes 8572 0.00 0.00 0.0%
TOTAL, OTHER STATE REVENUE 933,380.00 356,667.00 -61.8%
OTHER LOCAL REVENUE
Other Local Revenue County and District Taxes Voted Indebtedness Levies Secured Roll 8611 39,779,587.00 45,018,778.00 13.2%
Unsecured Roll 8612 2,368,145.00 2,085,909.00 -11.9%
Prior Years' Taxes 8613 443,519.00 680,591.00 53.5%
Supplemental Taxes 8614 868,839.00 810,920.00 -6.7%
Penalties and Interest from Delinquent Non-LCFF Taxes 8629 205,131.00 172,852.00 -15.7%
Interest 8660 141,104.00 174,023.00 23.3%
Net Increase (Decrease) in the Fair Value of Investments 8662 0.00 0.00 0.0%
Other Local Revenue
All Other Local Revenue 8699 7,335.00 10,658,653.00 145212.2%
All Other Transfers In from All Others 8799 0.00 0.00 0.0%
TOTAL, OTHER LOCAL REVENUE 43,813,660.00 59,601,726.00 36.0%
TOTAL, REVENUES 48,266,145.00 63,504,260.00 31.6%

Long Beach UnifiedLos Angeles County
July 1 BudgetBond Interest and Redemption Fund
Expenditures by Object19 64725 0000000
Form 51
California Dept of EducationSACS Financial Reporting Software - 2016.1.0File: fund-d (Rev 02/02/2016) Page 5 Printed: 6/24/2016 3:09 PM
Description Resource Codes Object Codes2015-16
Estimated Actuals2016-17Budget
PercentDifference
OTHER OUTGO (excluding Transfers of Indirect Costs)
Debt Service
Bond Redemptions 7433 24,735,000.00 25,140,000.00 1.6%
Bond Interest and Other Service Charges 7434 25,416,410.00 25,138,131.00 -1.1%
Debt Service - Interest 7438 0.00 0.00 0.0%
Other Debt Service - Principal 7439 0.00 0.00 0.0%
TOTAL, OTHER OUTGO (excluding Transfers of Indirect Costs) 50,151,410.00 50,278,131.00 0.3%
TOTAL, EXPENDITURES 50,151,410.00 50,278,131.00 0.3%
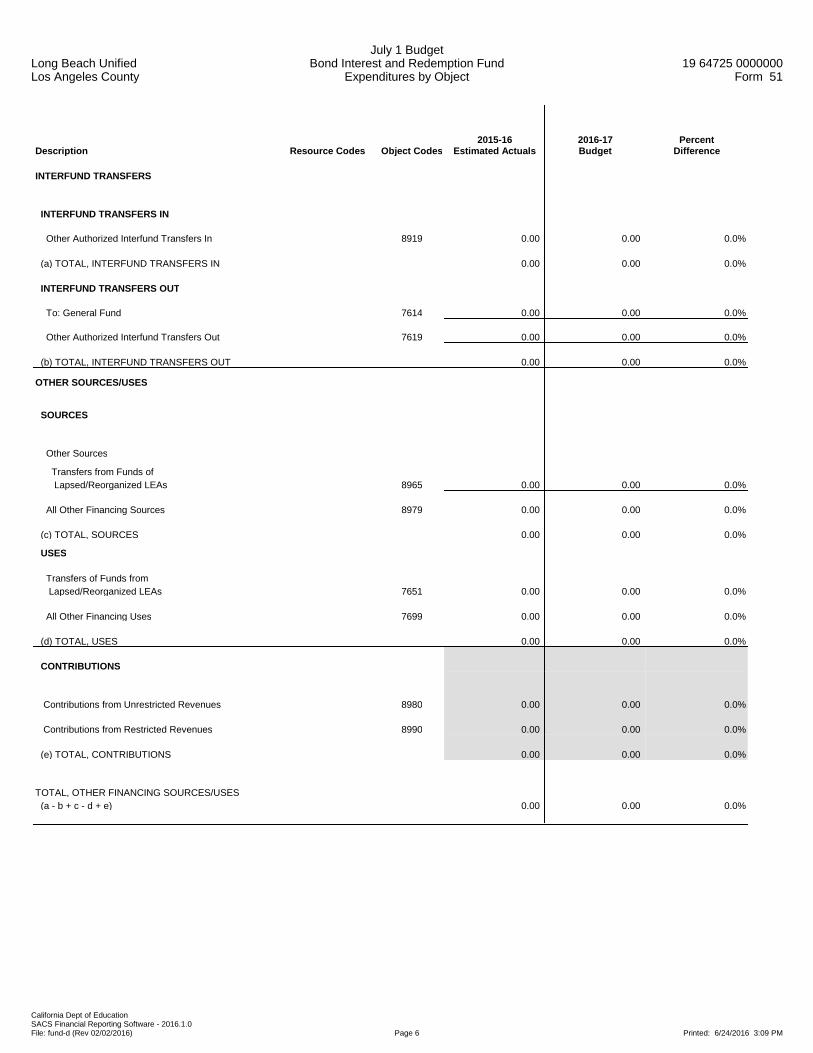
Long Beach UnifiedLos Angeles County
July 1 BudgetBond Interest and Redemption Fund
Expenditures by Object19 64725 0000000
Form 51
California Dept of EducationSACS Financial Reporting Software - 2016.1.0File: fund-d (Rev 02/02/2016) Page 6 Printed: 6/24/2016 3:09 PM
Description Resource Codes Object Codes2015-16
Estimated Actuals2016-17Budget
PercentDifference
INTERFUND TRANSFERS
INTERFUND TRANSFERS IN
Other Authorized Interfund Transfers In 8919 0.00 0.00 0.0%
(a) TOTAL, INTERFUND TRANSFERS IN 0.00 0.00 0.0%
INTERFUND TRANSFERS OUT
To: General Fund 7614 0.00 0.00 0.0%
Other Authorized Interfund Transfers Out 7619 0.00 0.00 0.0%
(b) TOTAL, INTERFUND TRANSFERS OUT 0.00 0.00 0.0%
OTHER SOURCES/USES
SOURCES
Other Sources
Transfers from Funds of Lapsed/Reorganized LEAs 8965 0.00 0.00 0.0%
All Other Financing Sources 8979 0.00 0.00 0.0%
(c) TOTAL, SOURCES 0.00 0.00 0.0%
USES
Transfers of Funds from Lapsed/Reorganized LEAs 7651 0.00 0.00 0.0%
All Other Financing Uses 7699 0.00 0.00 0.0%
(d) TOTAL, USES 0.00 0.00 0.0%
CONTRIBUTIONS
Contributions from Unrestricted Revenues 8980 0.00 0.00 0.0%
Contributions from Restricted Revenues 8990 0.00 0.00 0.0%
(e) TOTAL, CONTRIBUTIONS 0.00 0.00 0.0%
TOTAL, OTHER FINANCING SOURCES/USES (a - b + c - d + e) 0.00 0.00 0.0%

Long Beach UnifiedLos Angeles County
July 1 BudgetSelf-Insurance FundExpenses by Object
19 64725 0000000Form 67
California Dept of EducationSACS Financial Reporting Software - 2016.1.0File: fund-e (Rev 03/09/2016) Page 1 Printed: 6/24/2016 3:02 PM
Description Resource Codes Object Codes2015-16
Estimated Actuals2016-17Budget
PercentDifference
A. REVENUES
1) LCFF Sources 8010-8099 0.00 0.00 0.0%
2) Federal Revenue 8100-8299 0.00 0.00 0.0%
3) Other State Revenue 8300-8599 0.00 0.00 0.0%
4) Other Local Revenue 8600-8799 68,078,548.00 69,189,246.00 1.6%
5) TOTAL, REVENUES 68,078,548.00 69,189,246.00 1.6%
B. EXPENSES
1) Certificated Salaries 1000-1999 0.00 0.00 0.0%
2) Classified Salaries 2000-2999 239,547.00 259,498.00 8.3%
3) Employee Benefits 3000-3999 129,968.00 106,943.00 -17.7%
4) Books and Supplies 4000-4999 51,200.00 44,000.00 -14.1%
5) Services and Other Operating Expenses 5000-5999 76,299,389.00 75,976,795.00 -0.4%
6) Depreciation 6000-6999 0.00 0.00 0.0%
7) Other Outgo (excluding Transfers of Indirect 7100-7299, Costs) 7400-7499 0.00 0.00 0.0%
8) Other Outgo - Transfers of Indirect Costs 7300-7399 0.00 0.00 0.0%
9) TOTAL, EXPENSES 76,720,104.00 76,387,236.00 -0.4%
C. EXCESS (DEFICIENCY) OF REVENUES OVER EXPENSES BEFORE OTHER FINANCING SOURCES AND USES (A5 - B9) (8,641,556.00) (7,197,990.00) -16.7%
D. OTHER FINANCING SOURCES/USES 1) Interfund Transfers a) Transfers In 8900-8929 4,000,000.00 4,000,000.00 0.0%
b) Transfers Out 7600-7629 0.00 0.00 0.0%
2) Other Sources/Uses a) Sources 8930-8979 0.00 0.00 0.0%
b) Uses 7630-7699 0.00 0.00 0.0%
3) Contributions 8980-8999 0.00 0.00 0.0%
4) TOTAL, OTHER FINANCING SOURCES/USES 4,000,000.00 4,000,000.00 0.0%

Long Beach UnifiedLos Angeles County
July 1 BudgetSelf-Insurance FundExpenses by Object
19 64725 0000000Form 67
California Dept of EducationSACS Financial Reporting Software - 2016.1.0File: fund-e (Rev 03/09/2016) Page 2 Printed: 6/24/2016 3:02 PM
Description Resource Codes Object Codes2015-16
Estimated Actuals2016-17Budget
PercentDifference
E. NET INCREASE (DECREASE) IN NET POSITION (C + D4) (4,641,556.00) (3,197,990.00) -31.1%
F. NET POSITION 1) Beginning Net Position a) As of July 1 - Unaudited 9791 26,413,956.03 21,772,400.03 -17.6%
b) Audit Adjustments 9793 0.00 0.00 0.0%
c) As of July 1 - Audited (F1a + F1b) 26,413,956.03 21,772,400.03 -17.6%
d) Other Restatements 9795 0.00 0.00 0.0%
e) Adjusted Beginning Net Position (F1c + F1d) 26,413,956.03 21,772,400.03 -17.6%
2) Ending Net Position, June 30 (E + F1e) 21,772,400.03 18,574,410.03 -14.7% Components of Ending Net Position a) Net Investment in Capital Assets 9796 0.00 0.00 0.0%
b) Restricted Net Position 9797 21,772,400.03 18,574,410.03 -14.7%
c) Unrestricted Net Position 9790 0.00 0.00 0.0%

Long Beach UnifiedLos Angeles County
July 1 BudgetSelf-Insurance FundExpenses by Object
19 64725 0000000Form 67
California Dept of EducationSACS Financial Reporting Software - 2016.1.0File: fund-e (Rev 03/09/2016) Page 3 Printed: 6/24/2016 3:02 PM
Description Resource Codes Object Codes2015-16
Estimated Actuals2016-17Budget
PercentDifference
G. ASSETS 1) Cash a) in County Treasury 9110 0.00
1) Fair Value Adjustment to Cash in County Treasury 9111 0.00
b) in Banks 9120 0.00
c) in Revolving Fund 9130 0.00
d) with Fiscal Agent 9135 0.00
e) collections awaiting deposit 9140 0.00
2) Investments 9150 0.00
3) Accounts Receivable 9200 0.00
4) Due from Grantor Government 9290 0.00
5) Due from Other Funds 9310 0.00
6) Stores 9320 0.00
7) Prepaid Expenditures 9330 0.00
8) Other Current Assets 9340 0.00
9) Fixed Assets a) Land 9410 0.00
b) Land Improvements 9420 0.00
c) Accumulated Depreciation - Land Improvements 9425 0.00
d) Buildings 9430 0.00
e) Accumulated Depreciation - Buildings 9435 0.00
f) Equipment 9440 0.00
g) Accumulated Depreciation - Equipment 9445 0.00
h) Work in Progress 9450 0.00
10) TOTAL, ASSETS 0.00
H. DEFERRED OUTFLOWS OF RESOURCES
1) Deferred Outflows of Resources 9490 0.00
2) TOTAL, DEFERRED OUTFLOWS 0.00
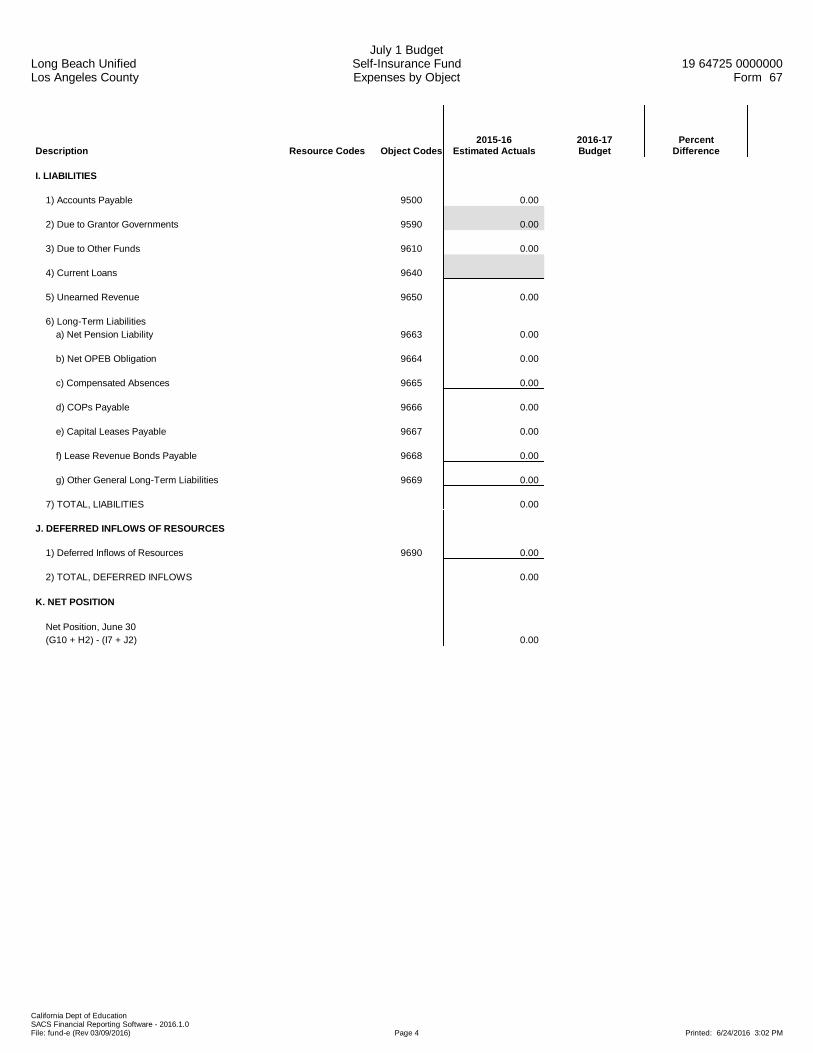
Long Beach UnifiedLos Angeles County
July 1 BudgetSelf-Insurance FundExpenses by Object
19 64725 0000000Form 67
California Dept of EducationSACS Financial Reporting Software - 2016.1.0File: fund-e (Rev 03/09/2016) Page 4 Printed: 6/24/2016 3:02 PM
Description Resource Codes Object Codes2015-16
Estimated Actuals2016-17Budget
PercentDifference
I. LIABILITIES
1) Accounts Payable 9500 0.00
2) Due to Grantor Governments 9590 0.00
3) Due to Other Funds 9610 0.00
4) Current Loans 9640
5) Unearned Revenue 9650 0.00
6) Long-Term Liabilities a) Net Pension Liability 9663 0.00
b) Net OPEB Obligation 9664 0.00
c) Compensated Absences 9665 0.00
d) COPs Payable 9666 0.00
e) Capital Leases Payable 9667 0.00
f) Lease Revenue Bonds Payable 9668 0.00
g) Other General Long-Term Liabilities 9669 0.00
7) TOTAL, LIABILITIES 0.00
J. DEFERRED INFLOWS OF RESOURCES
1) Deferred Inflows of Resources 9690 0.00
2) TOTAL, DEFERRED INFLOWS 0.00
K. NET POSITION
Net Position, June 30 (G10 + H2) - (I7 + J2) 0.00

Long Beach UnifiedLos Angeles County
July 1 BudgetSelf-Insurance FundExpenses by Object
19 64725 0000000Form 67
California Dept of EducationSACS Financial Reporting Software - 2016.1.0File: fund-e (Rev 03/09/2016) Page 5 Printed: 6/24/2016 3:02 PM
Description Resource Codes Object Codes2015-16
Estimated Actuals2016-17Budget
PercentDifference
OTHER STATE REVENUE
STRS On-Behalf Pension Contributions 7690 8590 0.00 0.00 0.0%
All Other State Revenue All Other 8590 0.00 0.00 0.0%
TOTAL, OTHER STATE REVENUE 0.00 0.00 0.0%
OTHER LOCAL REVENUE
Other Local Revenue
Sales Sale of Equipment/Supplies 8631 0.00 0.00 0.0%
Interest 8660 548,000.00 335,000.00 -38.9%
Net Increase (Decrease) in the Fair Value of Investments 8662 0.00 0.00 0.0%
Fees and Contracts
In-District Premiums/ Contributions 8674 67,430,548.00 68,779,246.00 2.0%
All Other Fees and Contracts 8689 0.00 0.00 0.0%
Other Local Revenue
All Other Local Revenue 8699 100,000.00 75,000.00 -25.0%
All Other Transfers In from All Others 8799 0.00 0.00 0.0%
TOTAL, OTHER LOCAL REVENUE 68,078,548.00 69,189,246.00 1.6%
TOTAL, REVENUES 68,078,548.00 69,189,246.00 1.6%

Long Beach UnifiedLos Angeles County
July 1 BudgetSelf-Insurance FundExpenses by Object
19 64725 0000000Form 67
California Dept of EducationSACS Financial Reporting Software - 2016.1.0File: fund-e (Rev 03/09/2016) Page 6 Printed: 6/24/2016 3:03 PM
Description Resource Codes Object Codes2015-16
Estimated Actuals2016-17Budget
PercentDifference
CERTIFICATED SALARIES
Certificated Pupil Support Salaries 1200 0.00 0.00 0.0%
Certificated Supervisors' and Administrators' Salaries 1300 0.00 0.00 0.0%
TOTAL, CERTIFICATED SALARIES 0.00 0.00 0.0%
CLASSIFIED SALARIES
Classified Support Salaries 2200 0.00 0.00 0.0%
Classified Supervisors' and Administrators' Salaries 2300 189,998.00 196,550.00 3.4%
Clerical, Technical and Office Salaries 2400 49,549.00 62,948.00 27.0%
Other Classified Salaries 2900 0.00 0.00 0.0%
TOTAL, CLASSIFIED SALARIES 239,547.00 259,498.00 8.3%
EMPLOYEE BENEFITS
STRS 3101-3102 0.00 0.00 0.0%
PERS 3201-3202 51,448.00 36,039.00 -30.0%
OASDI/Medicare/Alternative 3301-3302 18,325.00 19,852.00 8.3%
Health and Welfare Benefits 3401-3402 50,106.00 41,091.00 -18.0%
Unemployment Insurance 3501-3502 120.00 130.00 8.3%
Workers' Compensation 3601-3602 4,192.00 4,541.00 8.3%
OPEB, Allocated 3701-3702 431.00 415.00 -3.7%
OPEB, Active Employees 3751-3752 5,346.00 4,875.00 -8.8%
Other Employee Benefits 3901-3902 0.00 0.00 0.0%
TOTAL, EMPLOYEE BENEFITS 129,968.00 106,943.00 -17.7%
BOOKS AND SUPPLIES
Books and Other Reference Materials 4200 0.00 0.00 0.0%
Materials and Supplies 4300 30,200.00 23,000.00 -23.8%
Noncapitalized Equipment 4400 21,000.00 21,000.00 0.0%
TOTAL, BOOKS AND SUPPLIES 51,200.00 44,000.00 -14.1%

Long Beach UnifiedLos Angeles County
July 1 BudgetSelf-Insurance FundExpenses by Object
19 64725 0000000Form 67
California Dept of EducationSACS Financial Reporting Software - 2016.1.0File: fund-e (Rev 03/09/2016) Page 7 Printed: 6/24/2016 3:03 PM
Description Resource Codes Object Codes2015-16
Estimated Actuals2016-17Budget
PercentDifference
SERVICES AND OTHER OPERATING EXPENSES
Subagreements for Services 5100 0.00 0.00 0.0%
Travel and Conferences 5200 2,800.00 2,800.00 0.0%
Dues and Memberships 5300 200.00 100.00 -50.0%
Insurance 5400-5450 3,368,798.00 3,689,956.00 9.5%
Operations and Housekeeping Services 5500 0.00 0.00 0.0%
Rentals, Leases, Repairs, and Noncapitalized Improvements 5600 342,700.00 319,500.00 -6.8%
Transfers of Direct Costs - Interfund 5750 950.00 350.00 -63.2%
Professional/Consulting Services and Operating Expenditures 5800 72,579,991.00 71,964,089.00 -0.8%
Communications 5900 3,950.00 0.00 -100.0%
TOTAL, SERVICES AND OTHER OPERATING EXPENSES 76,299,389.00 75,976,795.00 -0.4%
DEPRECIATION
Depreciation Expense 6900 0.00 0.00 0.0%
TOTAL, DEPRECIATION 0.00 0.00 0.0%
TOTAL, EXPENSES 76,720,104.00 76,387,236.00 -0.4%
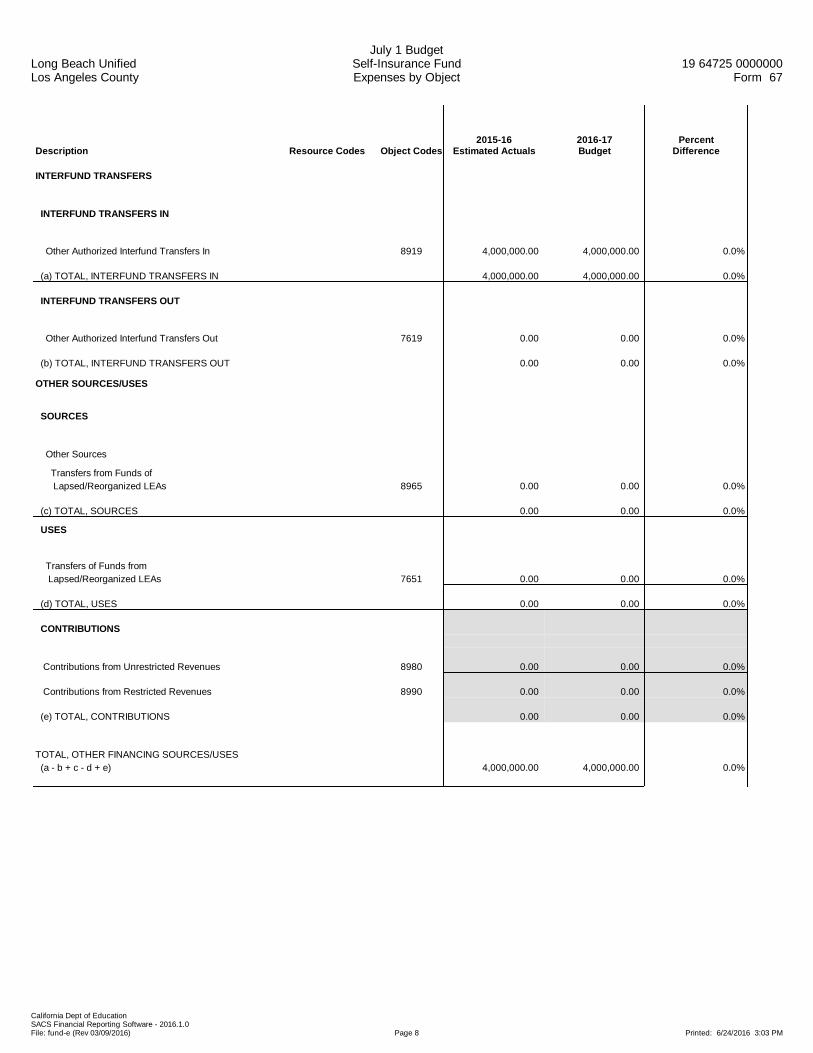
Long Beach UnifiedLos Angeles County
July 1 BudgetSelf-Insurance FundExpenses by Object
19 64725 0000000Form 67
California Dept of EducationSACS Financial Reporting Software - 2016.1.0File: fund-e (Rev 03/09/2016) Page 8 Printed: 6/24/2016 3:03 PM
Description Resource Codes Object Codes2015-16
Estimated Actuals2016-17Budget
PercentDifference
INTERFUND TRANSFERS
INTERFUND TRANSFERS IN
Other Authorized Interfund Transfers In 8919 4,000,000.00 4,000,000.00 0.0%
(a) TOTAL, INTERFUND TRANSFERS IN 4,000,000.00 4,000,000.00 0.0%
INTERFUND TRANSFERS OUT
Other Authorized Interfund Transfers Out 7619 0.00 0.00 0.0%
(b) TOTAL, INTERFUND TRANSFERS OUT 0.00 0.00 0.0%
OTHER SOURCES/USES
SOURCES
Other Sources
Transfers from Funds of Lapsed/Reorganized LEAs 8965 0.00 0.00 0.0%
(c) TOTAL, SOURCES 0.00 0.00 0.0%
USES
Transfers of Funds from Lapsed/Reorganized LEAs 7651 0.00 0.00 0.0%
(d) TOTAL, USES 0.00 0.00 0.0%
CONTRIBUTIONS
Contributions from Unrestricted Revenues 8980 0.00 0.00 0.0%
Contributions from Restricted Revenues 8990 0.00 0.00 0.0%
(e) TOTAL, CONTRIBUTIONS 0.00 0.00 0.0%
TOTAL, OTHER FINANCING SOURCES/USES (a - b + c - d + e) 4,000,000.00 4,000,000.00 0.0%

Long Beach UnifiedLos Angeles County
2016-17 July 1 BudgetAVERAGE DAILY ATTENDANCE 19 64725 0000000
Form A
California Dept of EducationSACS Financial Reporting Software - 2016.1.0File: ada (Rev 02/03/2016) Page 1 of 1 Printed: 6/24/2016 3:18 PM
2015-16 Estimated Actuals 2016-17 Budget2016-17 Budget
Description P-2 ADA Annual ADA Funded ADAEstimated P-2
ADAEstimated
Annual ADAEstimated
Funded ADA
A. DISTRICT 1. Total District Regular ADA Includes Opportunity Classes, Home & Hospital, Special Day Class, Continuation Education, Special Education NPS/LCI and Extended Year, and Community Day School (includes Necessary Small School ADA) 74,433.07 74,433.07 76,055.63 72,731.08 72,731.08 74,458.10 2. Total Basic Aid Choice/Court Ordered Voluntary Pupil Transfer Regular ADA Includes Opportunity Classes, Home & Hospital, Special Day Class, Continuation Education, Special Education NPS/LCI and Extended Year, and Community Day School (ADA not included in Line A1 above) 3. Total Basic Aid Open Enrollment Regular ADA Includes Opportunity Classes, Home & Hospital, Special Day Class, Continuation Education, Special Education NPS/LCI and Extended Year, and Community Day School (ADA not included in Line A1 above) 4. Total, District Regular ADA (Sum of Lines A1 through A3) 74,433.07 74,433.07 76,055.63 72,731.08 72,731.08 74,458.10 5. District Funded County Program ADA a. County Community Schools b. Special Education-Special Day Class c. Special Education-NPS/LCI d. Special Education Extended Year e. Other County Operated Programs: Opportunity Schools and Full Day Opportunity Classes, Specialized Secondary Schools, Technical, Agricultural, and Natural Resource Conservation Schools f. County School Tuition Fund (Out of State Tuition) [EC 2000 and 46380] g. Total, District Funded County Program ADA (Sum of Lines A5a through A5f) 0.00 0.00 0.00 0.00 0.00 0.00 6. TOTAL DISTRICT ADA (Sum of Line A4 and Line A5g) 74,433.07 74,433.07 76,055.63 72,731.08 72,731.08 74,458.10 7. Adults in Correctional Facilities 8. Charter School ADA (Enter Charter School ADA using Tab C. Charter School ADA)

Long Beach UnifiedLos Angeles County
July 1 Budget2015-16 Estimated ActualsSchedule of Capital Assets
19 64725 0000000Form ASSET
California Dept of EducationSACS Financial Reporting Software - 2016.1.0File: asset (Rev 01/27/2009) Page 1 of 1 Printed: 6/24/2016 3:50 PM
Unaudited Balance July 1
AuditAdjustments/Restatements
AuditedBalance July 1 Increases Decreases
Ending BalanceJune 30
Governmental Activities:Capital assets not being depreciated: Land 113,922,550.51 113,922,550.51 113,922,550.51 Work in Progress 110,202,442.18 110,202,442.18 110,202,442.18 Total capital assets not being depreciated 224,124,992.69 0.00 224,124,992.69 0.00 0.00 224,124,992.69Capital assets being depreciated: Land Improvements 36,467,928.70 36,467,928.70 36,467,928.70 Buildings 850,933,917.25 850,933,917.25 850,933,917.25 Equipment 89,821,499.73 89,821,499.73 89,821,499.73 Total capital assets being depreciated 977,223,345.68 0.00 977,223,345.68 0.00 0.00 977,223,345.68 Accumulated Depreciation for: Land Improvements (16,570,088.49) (16,570,088.49) (16,570,088.49) Buildings (335,731,556.90) (335,731,556.90) (335,731,556.90) Equipment (76,462,139.18) (76,462,139.18) (76,462,139.18) Total accumulated depreciation (428,763,784.57) 0.00 (428,763,784.57) 0.00 0.00 (428,763,784.57) Total capital assets being depreciated, net 548,459,561.11 0.00 548,459,561.11 0.00 0.00 548,459,561.11Governmental activity capital assets, net 772,584,553.80 0.00 772,584,553.80 0.00 0.00 772,584,553.80
Business-Type Activities:Capital assets not being depreciated: Land 0.00 0.00 Work in Progress 0.00 0.00 Total capital assets not being depreciated 0.00 0.00 0.00 0.00 0.00 0.00Capital assets being depreciated: Land Improvements 0.00 0.00 Buildings 0.00 0.00 Equipment 0.00 0.00 Total capital assets being depreciated 0.00 0.00 0.00 0.00 0.00 0.00 Accumulated Depreciation for: Land Improvements 0.00 0.00 Buildings 0.00 0.00 Equipment 0.00 0.00 Total accumulated depreciation 0.00 0.00 0.00 0.00 0.00 0.00 Total capital assets being depreciated, net 0.00 0.00 0.00 0.00 0.00 0.00Business-type activity capital assets, net 0.00 0.00 0.00 0.00 0.00 0.00

Long Beach UnifiedLos Angeles County
July 1 Budget2015-16 Estimated Actuals
GENERAL FUNDCurrent Expense Formula/Minimum Classroom Compensation
19 64725 0000000Form CEA
California Dept of EducationSACS Financial Reporting Software - 2016.1.0File: cea (Rev 03/23/2016) Page 1 of 2 Printed: 6/24/2016 3:50 PM
PART I - CURRENTEXPENSE FORMULA
Total Expensefor Year
(1)EDPNo.
Reductions(See Note 1)
(2)EDPNo.
Current Expenseof Education(Col 1 - Col 2)
(3)EDPNo.
Reductions(Extracted)
(See Note 2)(4a)
Reductions(Overrides)*(See Note 2)
(4b)EDPNo.
Current Expense-Part II
(Col 3 - Col 4)(5)
EDPNo.
1000 - CertificatedSalaries 377,180,753.00 301 0.00 303 377,180,753.00 305 7,790,615.00 307 369,390,138.00 309
2000 - Classified Salaries 115,380,459.00 311 4,471,764.00 313 110,908,695.00 315 525,560.00 317 110,383,135.00 319
3000 - Employee Benefits 204,387,040.00 321 1,182,131.00 323 203,204,909.00 325 1,436,232.00 327 201,768,677.00 3294000 - Books, SuppliesEquip Replace. (6500) 34,269,589.00 331 42,030.00 333 34,227,559.00 335 4,224,992.00 337 30,002,567.00 3395000 - Services. . . &7300 - Indirect Costs 95,216,640.00 341 265,704.00 343 94,950,936.00 345 44,195,139.00 347 50,755,797.00 349
TOTAL 820,472,852.00 365 TOTAL 762,300,314.00 369
Note 1 - In Column 2, report expenditures for the following programs: Nonagency (Goals 7100-7199), Community Services (Goal 8100), Food Services (Function 3700), Fringe Benefits for Retired Persons (Objects 3701-3702), and Facilities Acquisition & Construction (Function 8500).
Note 2 - In Column 4, report expenditures for: Transportation (Function 3600), Lottery Expenditures (Resource 1100), Special Education Students in Nonpublic Schools (Function 1180), and other federal or state categorical aid in which funds were granted for expenditures in a program not incurring any teacher salary expenditures or requiring disbursement of the funds without regard to the requirements of EC Section 41372.
* If an amount (even zero) is entered in any row of Column 4b or in Line 13b, the form uses only the values in Column 4b and Line 13b rather than the values in Column 4a and Line 13a.
PART II: MINIMUM CLASSROOM COMPENSATION (Instruction, Functions 1000-1999) ObjectEDPNo.
1. Teacher Salaries as Per EC 41011. . . . . . . . . . . . . . . . . . . . . . . . . . . . . . . . . . . . . . . . . . . . . . . . . . . . . . . . . . . . . . . . . . . . . . . . . . . 1100 307,974,379.00 3752. Salaries of Instructional Aides Per EC 41011. . . . . . . . . . . . . . . . . . . . . . . . . . . . . . . . . . . . . . . . . . . . . . . . . . . . . . . . . . . . . . . . . . . . . . . . . . . . . .2100 28,748,723.00 3803. STRS. . . . . . . . . . . . . . . . . . . . . . . . . . . . . . . . . . . . . . . . . . . . . . . . . . . . . . . . . . . . . . . . . . . . . . . . . . . . . . . . . . . . . . . . . . . . . . . . . . . . . . . . . . . .3101 & 3102 55,475,191.00 3824. PERS. . . . . . . . . . . . . . . . . . . . . . . . . . . . . . . . . . . . . . . . . . . . . . . . . . . . . . . . . . . . . . . . . . . . . . . . . . . . . . . . . . . . . . . . . . . . . . . . . . . . . . . . . . . . . . . . . . .3201 & 3202 2,524,451.00 3835. OASDI - Regular, Medicare and Alternative. . . . . . . . . . . . . . . . . . . . . . . . . . . . . . . . . . . . . . . . . . . . . . . . . . . . . . . . . . . . . . . . . . . . . . . . . . . . . . . . . . . . . . . .3301 & 3302 6,369,771.00 3846. Health & Welfare Benefits (EC 41372) (Include Health, Dental, Vision, Pharmaceutical, and Annuity Plans). . . . . . . . . . . . . . . . . . . . . . . . . . . . . . . . . . . . . . . . . . . . . . . . . . . . . . . . . . . . . . . . . . . . . . . . . . . . . . . . . . . . . . . . . . . . . . . . . . . . . . . . . . .3401 & 3402 63,402,251.00 3857. Unemployment Insurance. . . . . . . . . . . . . . . . . . . . . . . . . . . . . . . . . . . . . . . . . . . . . . . . . . . . . . . . . . . . . . . . . . . . . . . . . . . . . . . . 3501 & 3502 173,094.00 3908. Workers' Compensation Insurance. . . . . . . . . . . . . . . . . . . . . . . . . . . . . . . . . . . . . . . . . . . . . . . . . . . . . . . . . . . . . . . . . . . . . . . . . . . . .3601 & 3602 5,919,646.00 3929. OPEB, Active Employees (EC 41372). . . . . . . . . . . . . . . . . . . . . . . . . . . . . . . . . . . . . . . . . . . . . . . . . . . . . . . . . . . . . . . . . . . . . . . . . . . . .3751 & 3752 6,925,935.0010. Other Benefits (EC 22310). . . . . . . . . . . . . . . . . . . . . . . . . . . . . . . . . . . . . . . . . . . . . . . . . . . . . . . . . . . . . . . . . . . . . . . . . . . . . . . . . . . . . . . . . . . . . . . . . . . .3901 & 3902 0.00 39311. SUBTOTAL Salaries and Benefits (Sum Lines 1 - 10). . . . . . . . . . . . . . . . . . . . . . . . . . . . . . . . . . . . . . . . . . . . . . . . . . . . . . . . . . . . . . . . . . . . . . . . . . . . . . . . . . . . . . . . . . . . . . . .477,513,441.00 39512. Less: Teacher and Instructional Aide Salaries and Benefits deducted in Column 2. . . . . . . . . . . . . . . . . . . . . . . . . . . . . . . . . . . . . . . . . . . . . . . . . . . . . . . . . . . . . . . . . . . . . . . . . . . . . . . . . . . . . . . . . . . . . . . . . . . . . 83,821.0013a. Less: Teacher and Instructional Aide Salaries and Benefits (other than Lottery) deducted in Column 4a (Extracted). . . . . . . . . . . . . . . . . . . . . . . . . . . . . . . . . . . . . . . . . . . . . . . . . . . . . . . . . . . . . . . . . . . . . . . . . . . . . . . . . . . . . . . . . . . . . . . .808,908.00 396 b. Less: Teacher and Instructional Aide Salaries and Benefits (other than Lottery) deducted in Column 4b (Overrides)*. . . . . . . . . . . . . . . . . . . . . . . . . . . . . . . . . . . . . . . . . . . . . . . . . . . . . . . . . . . . . . . . . . . . . . 39614. TOTAL SALARIES AND BENEFITS. . . . . . . . . . . . . . . . . . . . . . . . . . . . . . . . . . . . . . . . . . . . . . . . . . . . . . . . . . . . . . . . . . . . . . . . . . . . . . . . . . . . . . . . . . . . . . . . . . . .476,620,712.00 39715. Percent of Current Cost of Education Expended for Classroom Compensation (EDP 397 divided by EDP 369) Line 15 must equal or exceed 60% for elementary, 55% for unified and 50% for high school districts to avoid penalty under provisions of EC 41372. . . . . . . . . . . . . . . . . . . . . . . . . . . . . . . . . . . . . . . . . . . . . . . . . . . . . . . . . . . . . . . . . . . . . . . . . 62.52%16. District is exempt from EC 41372 because it meets the provisions of EC 41374. (If exempt, enter 'X') . . . . . . . . . . . . . . . . . . . . . . . . . . . . . . . . . . . . . . . . . . . . . . . . . . . . . . . . . . . . . . . . . . . . . . . . . . . . . . . . . . . . . . . . . . . . . .
PART III: DEFICIENCY AMOUNT
A deficiency amount (Line 5) is only applicable to districts not meeting the minimum classroom compensation percentage required under EC 41372 and not exempt under theprovisions of EC 41374.A deficiency amount (Line 5) is only applicable to districts not meeting the minimum classroom compensation percentage required under EC 41372 and not exempt under theprovisions of EC 41374.1. Minimum percentage required (60% elementary, 55% unified, 50% high) . . . . . . . . . . . . . . . . . . . . . . . . . . . . . . . . . . . . . . . . . . . . . . . . . . . . . . . . . . . . . . . . . . . . . . . . . . . . . . . . . . . . . . . . . . . . . . . . . . . . . . . . . . . . . . . . . . . . . . . . . . . . . . . . . . . . . . . . . . . . . . . . . . . . . . . . . . . . . . . . . . . . . . . . . . . . . . . . . . . . . . . . . . . . . . . . . . . . . . . . . . . . . . . . . . . . . . . . . . . . . . . . . . . . . . . . . . . . . . . . . . . . . . . . . . . . . . . . . . . . . . . . . . . . . . . . . . . . . . . . . . . . . . . . . . . . . . . . . . . . . . . . . . . . . . . . . . . . . . . . . . . . . 55.00%2. Percentage spent by this district (Part II, Line 15) . . . . . . . . . . . . . . . . . . . . . . . . . . . . . . . . . . . . . . . . . . . . . . . . . . . . . . . . . . . . . . . . . . . . . . . . . . . . . . . . . . . . . . . . . . . . . . . . . . . . . . . . . . . . . . . . . . . . . . . . . 62.52%3. Percentage below the minimum (Part III, Line 1 minus Line 2) . . . . . . . . . . . . . . . . . . . . . . . . . . . . . . . . . . . . . . . . . . . . . . . . . . . . . . . . . . . . . . . . . . . . . . . . . . . . . . . . . . . . . . . . . . . . . . . . . . . . . . . . . . . . . . . . . . . . . . . . . . . . . . . . . . 0.00%4. District's Current Expense of Education after reductions in columns 4a or 4b (Part I, EDP 369). . . . . . . . . . . . . . . . . . . . . . . . . . . . . . . . . . . . . . . . . . . . . . . . . . . . . . . . . . . . . . . . . . . . . . . . . . . . . . . . . . . . . . . . . . . . . . . . . . . . . . . . . . . . . . . . . . . . . . . . . . . . . . . . . . 762,300,314.005. Deficiency Amount (Part III, Line 3 times Line 4) . . . . . . . . . . . . . . . . . . . . . . . . . . . . . . . . . . . . . . . . . . . . . . . . . . . . . . . . . . . . . . . . . . . . . . . . . . . . . . . . . . . . . . . . . . . . . . . . . . . . . . . . . . . . 0.00
PART IV: Explanation for adjustments entered in Part I, Column 4b (required)

Long Beach UnifiedLos Angeles County
July 1 Budget2015-16 Estimated Actuals
GENERAL FUNDCurrent Expense Formula/Minimum Classroom Compensation
19 64725 0000000Form CEA
California Dept of EducationSACS Financial Reporting Software - 2016.1.0File: cea (Rev 03/23/2016) Page 2 of 2 Printed: 6/24/2016 3:50 PM
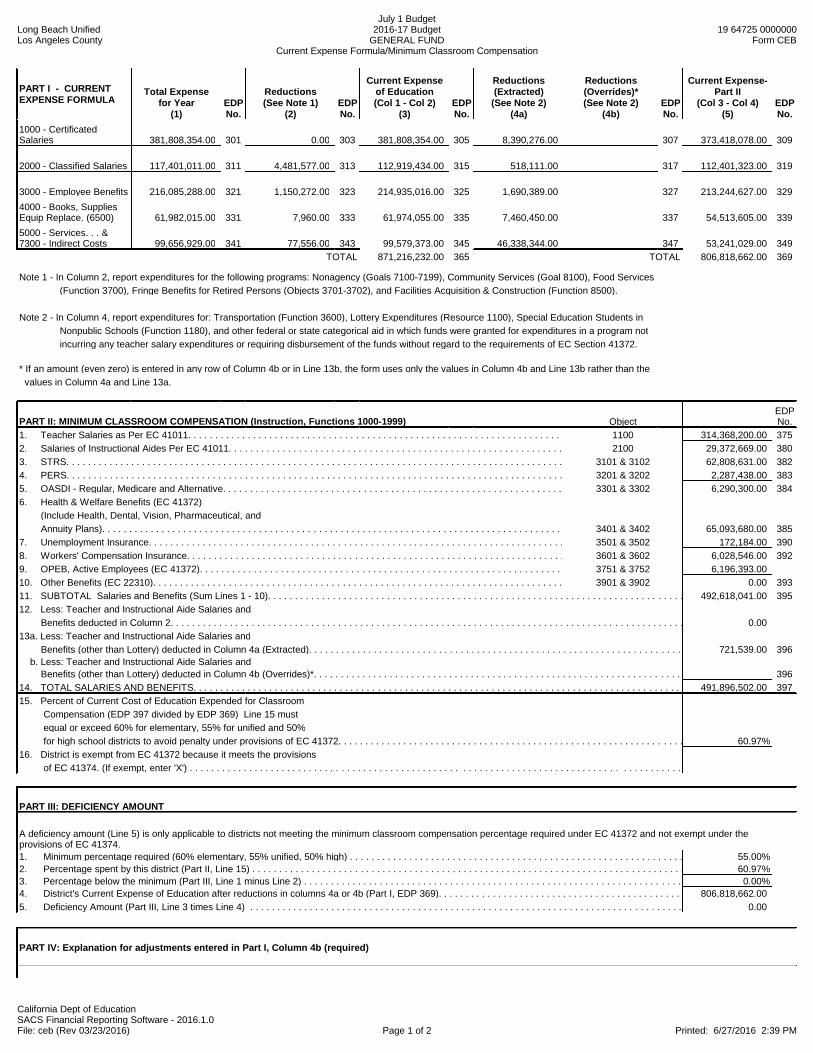
Long Beach UnifiedLos Angeles County
July 1 Budget2016-17 Budget
GENERAL FUNDCurrent Expense Formula/Minimum Classroom Compensation
19 64725 0000000Form CEB
California Dept of EducationSACS Financial Reporting Software - 2016.1.0File: ceb (Rev 03/23/2016) Page 1 of 2 Printed: 6/27/2016 2:39 PM
PART I - CURRENTEXPENSE FORMULA
Total Expensefor Year
(1)EDPNo.
Reductions(See Note 1)
(2)EDPNo.
Current Expenseof Education(Col 1 - Col 2)
(3)EDPNo.
Reductions(Extracted)
(See Note 2)(4a)
Reductions(Overrides)*(See Note 2)
(4b)EDPNo.
Current Expense-Part II
(Col 3 - Col 4)(5)
EDPNo.
1000 - CertificatedSalaries 381,808,354.00 301 0.00 303 381,808,354.00 305 8,390,276.00 307 373,418,078.00 309
2000 - Classified Salaries 117,401,011.00 311 4,481,577.00 313 112,919,434.00 315 518,111.00 317 112,401,323.00 319
3000 - Employee Benefits 216,085,288.00 321 1,150,272.00 323 214,935,016.00 325 1,690,389.00 327 213,244,627.00 3294000 - Books, SuppliesEquip Replace. (6500) 61,982,015.00 331 7,960.00 333 61,974,055.00 335 7,460,450.00 337 54,513,605.00 3395000 - Services. . . &7300 - Indirect Costs 99,656,929.00 341 77,556.00 343 99,579,373.00 345 46,338,344.00 347 53,241,029.00 349
TOTAL 871,216,232.00 365 TOTAL 806,818,662.00 369
Note 1 - In Column 2, report expenditures for the following programs: Nonagency (Goals 7100-7199), Community Services (Goal 8100), Food Services (Function 3700), Fringe Benefits for Retired Persons (Objects 3701-3702), and Facilities Acquisition & Construction (Function 8500).
Note 2 - In Column 4, report expenditures for: Transportation (Function 3600), Lottery Expenditures (Resource 1100), Special Education Students in Nonpublic Schools (Function 1180), and other federal or state categorical aid in which funds were granted for expenditures in a program not incurring any teacher salary expenditures or requiring disbursement of the funds without regard to the requirements of EC Section 41372.
* If an amount (even zero) is entered in any row of Column 4b or in Line 13b, the form uses only the values in Column 4b and Line 13b rather than the values in Column 4a and Line 13a.
PART II: MINIMUM CLASSROOM COMPENSATION (Instruction, Functions 1000-1999) ObjectEDPNo.
1. Teacher Salaries as Per EC 41011. . . . . . . . . . . . . . . . . . . . . . . . . . . . . . . . . . . . . . . . . . . . . . . . . . . . . . . . . . . . . . . . . . . . . . . . . . . 1100 314,368,200.00 3752. Salaries of Instructional Aides Per EC 41011. . . . . . . . . . . . . . . . . . . . . . . . . . . . . . . . . . . . . . . . . . . . . . . . . . . . . . . . . . . . . . . . . . . . . . . . . . . . . .2100 29,372,669.00 3803. STRS. . . . . . . . . . . . . . . . . . . . . . . . . . . . . . . . . . . . . . . . . . . . . . . . . . . . . . . . . . . . . . . . . . . . . . . . . . . . . . . . . . . . . . . . . . . . . . . . . . . . . . . . . . . .3101 & 3102 62,808,631.00 3824. PERS. . . . . . . . . . . . . . . . . . . . . . . . . . . . . . . . . . . . . . . . . . . . . . . . . . . . . . . . . . . . . . . . . . . . . . . . . . . . . . . . . . . . . . . . . . . . . . . . . . . . . . . . . . . . . . . . . . .3201 & 3202 2,287,438.00 3835. OASDI - Regular, Medicare and Alternative. . . . . . . . . . . . . . . . . . . . . . . . . . . . . . . . . . . . . . . . . . . . . . . . . . . . . . . . . . . . . . . . . . . . . . . . . . . . . . . . . . . . . . . .3301 & 3302 6,290,300.00 3846. Health & Welfare Benefits (EC 41372) (Include Health, Dental, Vision, Pharmaceutical, and Annuity Plans). . . . . . . . . . . . . . . . . . . . . . . . . . . . . . . . . . . . . . . . . . . . . . . . . . . . . . . . . . . . . . . . . . . . . . . . . . . . . . . . . . . . . . . . . . . . . . . . . . . . . . . . . . .3401 & 3402 65,093,680.00 3857. Unemployment Insurance. . . . . . . . . . . . . . . . . . . . . . . . . . . . . . . . . . . . . . . . . . . . . . . . . . . . . . . . . . . . . . . . . . . . . . . . . . . . . . . . 3501 & 3502 172,184.00 3908. Workers' Compensation Insurance. . . . . . . . . . . . . . . . . . . . . . . . . . . . . . . . . . . . . . . . . . . . . . . . . . . . . . . . . . . . . . . . . . . . . . . . . . . . .3601 & 3602 6,028,546.00 3929. OPEB, Active Employees (EC 41372). . . . . . . . . . . . . . . . . . . . . . . . . . . . . . . . . . . . . . . . . . . . . . . . . . . . . . . . . . . . . . . . . . . . . . . . . . . . .3751 & 3752 6,196,393.0010. Other Benefits (EC 22310). . . . . . . . . . . . . . . . . . . . . . . . . . . . . . . . . . . . . . . . . . . . . . . . . . . . . . . . . . . . . . . . . . . . . . . . . . . . . . . . . . . . . . . . . . . . . . . . . . . .3901 & 3902 0.00 39311. SUBTOTAL Salaries and Benefits (Sum Lines 1 - 10). . . . . . . . . . . . . . . . . . . . . . . . . . . . . . . . . . . . . . . . . . . . . . . . . . . . . . . . . . . . . . . . . . . . . . . . . . . . . . . . . . . . . . . . . . . . . . . .492,618,041.00 39512. Less: Teacher and Instructional Aide Salaries and Benefits deducted in Column 2. . . . . . . . . . . . . . . . . . . . . . . . . . . . . . . . . . . . . . . . . . . . . . . . . . . . . . . . . . . . . . . . . . . . . . . . . . . . . . . . . . . . . . . . . . . . . . . . . . . . . 0.0013a. Less: Teacher and Instructional Aide Salaries and Benefits (other than Lottery) deducted in Column 4a (Extracted). . . . . . . . . . . . . . . . . . . . . . . . . . . . . . . . . . . . . . . . . . . . . . . . . . . . . . . . . . . . . . . . . . . . . . . . . . . . . . . . . . . . . . . . . . . . . . . .721,539.00 396 b. Less: Teacher and Instructional Aide Salaries and Benefits (other than Lottery) deducted in Column 4b (Overrides)*. . . . . . . . . . . . . . . . . . . . . . . . . . . . . . . . . . . . . . . . . . . . . . . . . . . . . . . . . . . . . . . . . . . . . . 39614. TOTAL SALARIES AND BENEFITS. . . . . . . . . . . . . . . . . . . . . . . . . . . . . . . . . . . . . . . . . . . . . . . . . . . . . . . . . . . . . . . . . . . . . . . . . . . . . . . . . . . . . . . . . . . . . . . . . . . .491,896,502.00 39715. Percent of Current Cost of Education Expended for Classroom Compensation (EDP 397 divided by EDP 369) Line 15 must equal or exceed 60% for elementary, 55% for unified and 50% for high school districts to avoid penalty under provisions of EC 41372. . . . . . . . . . . . . . . . . . . . . . . . . . . . . . . . . . . . . . . . . . . . . . . . . . . . . . . . . . . . . . . . . . . . . . . . . 60.97%16. District is exempt from EC 41372 because it meets the provisions of EC 41374. (If exempt, enter 'X') . . . . . . . . . . . . . . . . . . . . . . . . . . . . . . . . . . . . . . . . . . . . . . . . . . . . . . . . . . . . . . . . . . . . . . . . . . . . . . . . . . . . . . . . . . . . . .
PART III: DEFICIENCY AMOUNT
A deficiency amount (Line 5) is only applicable to districts not meeting the minimum classroom compensation percentage required under EC 41372 and not exempt under theprovisions of EC 41374.A deficiency amount (Line 5) is only applicable to districts not meeting the minimum classroom compensation percentage required under EC 41372 and not exempt under theprovisions of EC 41374.1. Minimum percentage required (60% elementary, 55% unified, 50% high) . . . . . . . . . . . . . . . . . . . . . . . . . . . . . . . . . . . . . . . . . . . . . . . . . . . . . . . . . . . . . . . . . . . . . . . . . . . . . . . . . . . . . . . . . . . . . . . . . . . . . . . . . . . . . . . . . . . . . . . . . . . . . . . . . . . . . . . . . . . . . . . . . . . . . . . . . . . . . . . . . . . . . . . . . . . . . . . . . . . . . . . . . . . . . . . . . . . . . . . . . . . . . . . . . . . . . . . . . . . . . . . . . . . . . . . . . . . . . . . . . . . . . . . . . . . . . . . . . . . . . . . . . . . . . . . . . . . . . . . . . . . . . . . . . . . . . . . . . . . . . . . . . . . . . . . . . . . . . . . . . . . . . 55.00%2. Percentage spent by this district (Part II, Line 15) . . . . . . . . . . . . . . . . . . . . . . . . . . . . . . . . . . . . . . . . . . . . . . . . . . . . . . . . . . . . . . . . . . . . . . . . . . . . . . . . . . . . . . . . . . . . . . . . . . . . . . . . . . . . . . . . . . . . . . . . . 60.97%3. Percentage below the minimum (Part III, Line 1 minus Line 2) . . . . . . . . . . . . . . . . . . . . . . . . . . . . . . . . . . . . . . . . . . . . . . . . . . . . . . . . . . . . . . . . . . . . . . . . . . . . . . . . . . . . . . . . . . . . . . . . . . . . . . . . . . . . . . . . . . . . . . . . . . . . . . . . . . 0.00%4. District's Current Expense of Education after reductions in columns 4a or 4b (Part I, EDP 369). . . . . . . . . . . . . . . . . . . . . . . . . . . . . . . . . . . . . . . . . . . . . . . . . . . . . . . . . . . . . . . . . . . . . . . . . . . . . . . . . . . . . . . . . . . . . . . . . . . . . . . . . . . . . . . . . . . . . . . . . . . . . . . . . . 806,818,662.005. Deficiency Amount (Part III, Line 3 times Line 4) . . . . . . . . . . . . . . . . . . . . . . . . . . . . . . . . . . . . . . . . . . . . . . . . . . . . . . . . . . . . . . . . . . . . . . . . . . . . . . . . . . . . . . . . . . . . . . . . . . . . . . . . . . . . 0.00
PART IV: Explanation for adjustments entered in Part I, Column 4b (required)

Long Beach UnifiedLos Angeles County
July 1 Budget2016-17 Budget
GENERAL FUNDCurrent Expense Formula/Minimum Classroom Compensation
19 64725 0000000Form CEB
California Dept of EducationSACS Financial Reporting Software - 2016.1.0File: ceb (Rev 03/23/2016) Page 2 of 2 Printed: 6/27/2016 2:39 PM
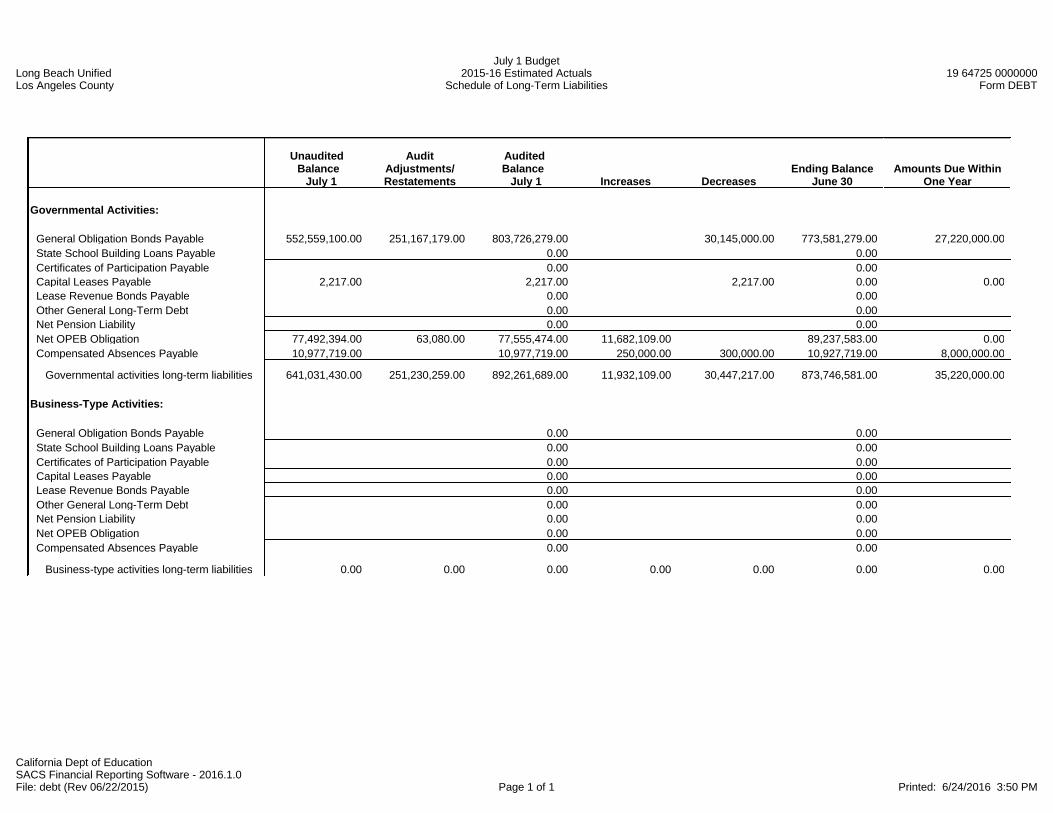
Long Beach UnifiedLos Angeles County
July 1 Budget2015-16 Estimated Actuals
Schedule of Long-Term Liabilities19 64725 0000000
Form DEBT
California Dept of EducationSACS Financial Reporting Software - 2016.1.0File: debt (Rev 06/22/2015) Page 1 of 1 Printed: 6/24/2016 3:50 PM
Unaudited Balance July 1
AuditAdjustments/Restatements
AuditedBalance July 1 Increases Decreases
Ending BalanceJune 30
Amounts Due WithinOne Year
Governmental Activities:
General Obligation Bonds Payable 552,559,100.00 251,167,179.00 803,726,279.00 30,145,000.00 773,581,279.00 27,220,000.00 State School Building Loans Payable 0.00 0.00 Certificates of Participation Payable 0.00 0.00 Capital Leases Payable 2,217.00 2,217.00 2,217.00 0.00 0.00 Lease Revenue Bonds Payable 0.00 0.00 Other General Long-Term Debt 0.00 0.00 Net Pension Liability 0.00 0.00 Net OPEB Obligation 77,492,394.00 63,080.00 77,555,474.00 11,682,109.00 89,237,583.00 0.00 Compensated Absences Payable 10,977,719.00 10,977,719.00 250,000.00 300,000.00 10,927,719.00 8,000,000.00
Governmental activities long-term liabilities 641,031,430.00 251,230,259.00 892,261,689.00 11,932,109.00 30,447,217.00 873,746,581.00 35,220,000.00
Business-Type Activities:
General Obligation Bonds Payable 0.00 0.00 State School Building Loans Payable 0.00 0.00 Certificates of Participation Payable 0.00 0.00 Capital Leases Payable 0.00 0.00 Lease Revenue Bonds Payable 0.00 0.00 Other General Long-Term Debt 0.00 0.00 Net Pension Liability 0.00 0.00 Net OPEB Obligation 0.00 0.00 Compensated Absences Payable 0.00 0.00
Business-type activities long-term liabilities 0.00 0.00 0.00 0.00 0.00 0.00 0.00
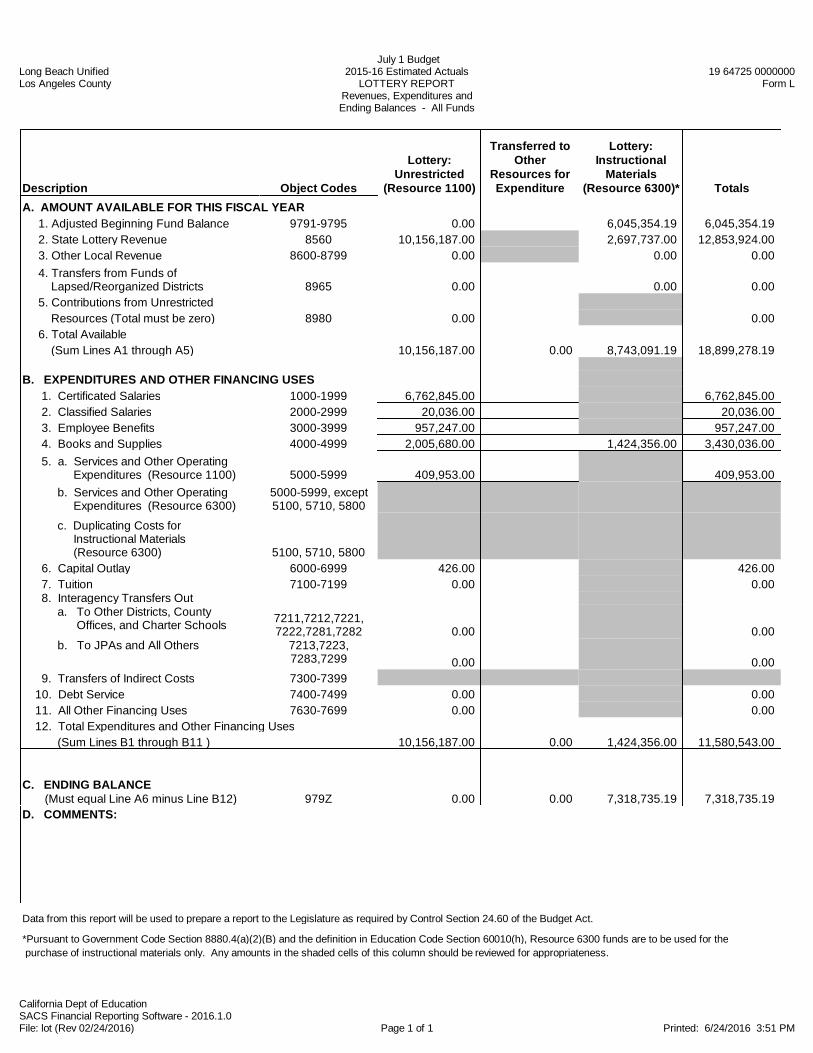
Long Beach UnifiedLos Angeles County
July 1 Budget2015-16 Estimated Actuals
LOTTERY REPORTRevenues, Expenditures andEnding Balances - All Funds
19 64725 0000000Form L
California Dept of EducationSACS Financial Reporting Software - 2016.1.0File: lot (Rev 02/24/2016) Page 1 of 1 Printed: 6/24/2016 3:51 PM
Description Object Codes
Lottery:Unrestricted
(Resource 1100)
Transferred toOther
Resources forExpenditure
Lottery:Instructional
Materials(Resource 6300)* Totals
A. AMOUNT AVAILABLE FOR THIS FISCAL YEAR 1. Adjusted Beginning Fund Balance 9791-9795 0.00 6,045,354.19 6,045,354.19 2. State Lottery Revenue 8560 10,156,187.00 2,697,737.00 12,853,924.00 3. Other Local Revenue 8600-8799 0.00 0.00 0.00 4. Transfers from Funds of Lapsed/Reorganized Districts 8965 0.00 0.00 0.00 5. Contributions from Unrestricted Resources (Total must be zero) 8980 0.00 0.00 6. Total Available (Sum Lines A1 through A5) 10,156,187.00 0.00 8,743,091.19 18,899,278.19
B. EXPENDITURES AND OTHER FINANCING USES 1. Certificated Salaries 1000-1999 6,762,845.00 6,762,845.00 2. Classified Salaries 2000-2999 20,036.00 20,036.00 3. Employee Benefits 3000-3999 957,247.00 957,247.00 4. Books and Supplies 4000-4999 2,005,680.00 1,424,356.00 3,430,036.00 5. a. Services and Other Operating Expenditures (Resource 1100) 5000-5999 409,953.00 409,953.00 b. Services and Other Operating Expenditures (Resource 6300)
5000-5999, except5100, 5710, 5800
c. Duplicating Costs for Instructional Materials (Resource 6300) 5100, 5710, 5800 6. Capital Outlay 6000-6999 426.00 426.00 7. Tuition 7100-7199 0.00 0.00 8. Interagency Transfers Out a. To Other Districts, County Offices, and Charter Schools 7211,7212,7221,
7222,7281,7282 0.00 0.00 b. To JPAs and All Others 7213,7223,
7283,7299 0.00 0.00 9. Transfers of Indirect Costs 7300-7399 10. Debt Service 7400-7499 0.00 0.00 11. All Other Financing Uses 7630-7699 0.00 0.00 12. Total Expenditures and Other Financing Uses (Sum Lines B1 through B11 ) 10,156,187.00 0.00 1,424,356.00 11,580,543.00
C. ENDING BALANCE (Must equal Line A6 minus Line B12) 979Z 0.00 0.00 7,318,735.19 7,318,735.19D. COMMENTS:
Data from this report will be used to prepare a report to the Legislature as required by Control Section 24.60 of the Budget Act.
*Pursuant to Government Code Section 8880.4(a)(2)(B) and the definition in Education Code Section 60010(h), Resource 6300 funds are to be used for the purchase of instructional materials only. Any amounts in the shaded cells of this column should be reviewed for appropriateness.
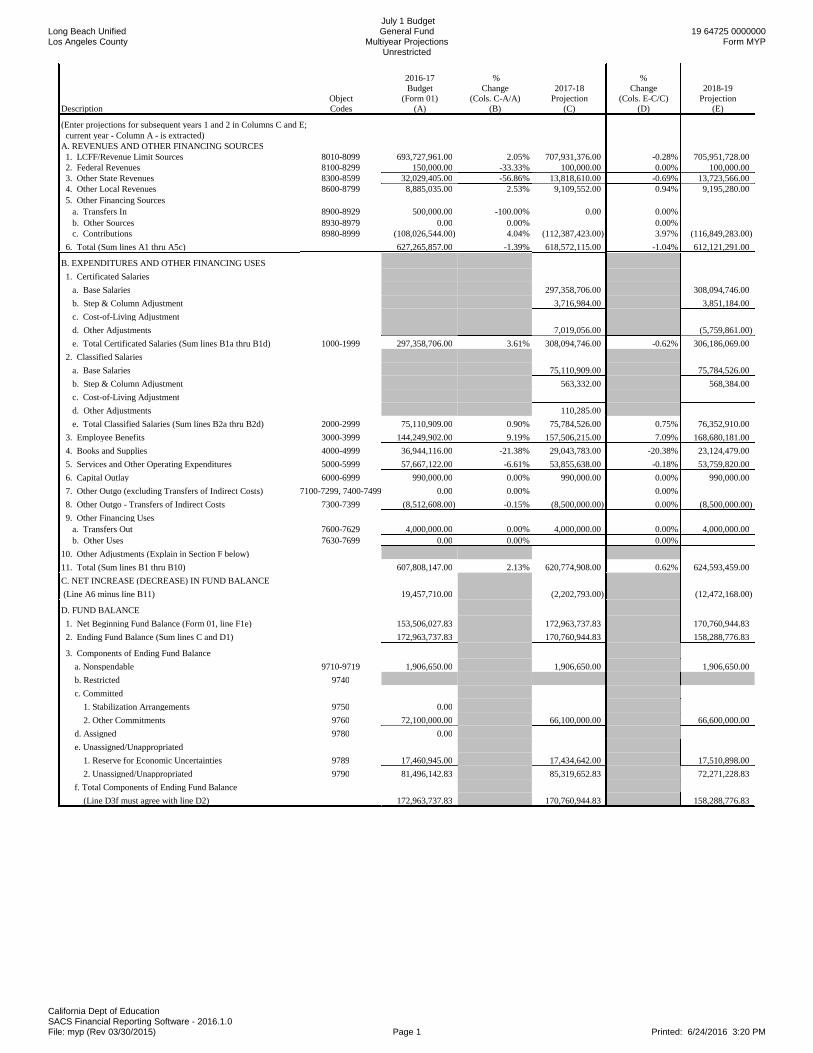
Long Beach UnifiedLos Angeles County
July 1 BudgetGeneral Fund
Multiyear ProjectionsUnrestricted
19 64725 0000000Form MYP
California Dept of EducationSACS Financial Reporting Software - 2016.1.0File: myp (Rev 03/30/2015) Page 1 Printed: 6/24/2016 3:20 PM
DescriptionObjectCodes
2016-17Budget
(Form 01)(A)
%Change
(Cols. C-A/A)(B)
2017-18Projection
(C)
%Change
(Cols. E-C/C)(D)
2018-19Projection
(E)
(Enter projections for subsequent years 1 and 2 in Columns C and E; current year - Column A - is extracted)A. REVENUES AND OTHER FINANCING SOURCES 1. LCFF/Revenue Limit Sources 8010-8099 693,727,961.00 2.05% 707,931,376.00 -0.28% 705,951,728.00 2. Federal Revenues 8100-8299 150,000.00 -33.33% 100,000.00 0.00% 100,000.00 3. Other State Revenues 8300-8599 32,029,405.00 -56.86% 13,818,610.00 -0.69% 13,723,566.00 4. Other Local Revenues 8600-8799 8,885,035.00 2.53% 9,109,552.00 0.94% 9,195,280.00 5. Other Financing Sources a. Transfers In 8900-8929 500,000.00 -100.00% 0.00 0.00% b. Other Sources 8930-8979 0.00 0.00% 0.00% c. Contributions 8980-8999 (108,026,544.00) 4.04% (112,387,423.00) 3.97% (116,849,283.00) 6. Total (Sum lines A1 thru A5c) 627,265,857.00 -1.39% 618,572,115.00 -1.04% 612,121,291.00
B. EXPENDITURES AND OTHER FINANCING USES 1. Certificated Salaries a. Base Salaries 297,358,706.00 308,094,746.00 b. Step & Column Adjustment 3,716,984.00 3,851,184.00 c. Cost-of-Living Adjustment d. Other Adjustments 7,019,056.00 (5,759,861.00) e. Total Certificated Salaries (Sum lines B1a thru B1d) 1000-1999 297,358,706.00 3.61% 308,094,746.00 -0.62% 306,186,069.00 2. Classified Salaries a. Base Salaries 75,110,909.00 75,784,526.00 b. Step & Column Adjustment 563,332.00 568,384.00 c. Cost-of-Living Adjustment d. Other Adjustments 110,285.00 e. Total Classified Salaries (Sum lines B2a thru B2d) 2000-2999 75,110,909.00 0.90% 75,784,526.00 0.75% 76,352,910.00 3. Employee Benefits 3000-3999 144,249,902.00 9.19% 157,506,215.00 7.09% 168,680,181.00 4. Books and Supplies 4000-4999 36,944,116.00 -21.38% 29,043,783.00 -20.38% 23,124,479.00 5. Services and Other Operating Expenditures 5000-5999 57,667,122.00 -6.61% 53,855,638.00 -0.18% 53,759,820.00 6. Capital Outlay 6000-6999 990,000.00 0.00% 990,000.00 0.00% 990,000.00 7. Other Outgo (excluding Transfers of Indirect Costs) 7100-7299, 7400-7499 0.00 0.00% 0.00% 8. Other Outgo - Transfers of Indirect Costs 7300-7399 (8,512,608.00) -0.15% (8,500,000.00) 0.00% (8,500,000.00) 9. Other Financing Uses a. Transfers Out 7600-7629 4,000,000.00 0.00% 4,000,000.00 0.00% 4,000,000.00 b. Other Uses 7630-7699 0.00 0.00% 0.00%10. Other Adjustments (Explain in Section F below)11. Total (Sum lines B1 thru B10) 607,808,147.00 2.13% 620,774,908.00 0.62% 624,593,459.00C. NET INCREASE (DECREASE) IN FUND BALANCE (Line A6 minus line B11) 19,457,710.00 (2,202,793.00) (12,472,168.00)
D. FUND BALANCE 1. Net Beginning Fund Balance (Form 01, line F1e) 153,506,027.83 172,963,737.83 170,760,944.83 2. Ending Fund Balance (Sum lines C and D1) 172,963,737.83 170,760,944.83 158,288,776.83
3. Components of Ending Fund Balance a. Nonspendable 9710-9719 1,906,650.00 1,906,650.00 1,906,650.00 b. Restricted 9740 c. Committed 1. Stabilization Arrangements 9750 0.00 2. Other Commitments 9760 72,100,000.00 66,100,000.00 66,600,000.00 d. Assigned 9780 0.00 e. Unassigned/Unappropriated 1. Reserve for Economic Uncertainties 9789 17,460,945.00 17,434,642.00 17,510,898.00 2. Unassigned/Unappropriated 9790 81,496,142.83 85,319,652.83 72,271,228.83 f. Total Components of Ending Fund Balance (Line D3f must agree with line D2) 172,963,737.83 170,760,944.83 158,288,776.83

Long Beach UnifiedLos Angeles County
July 1 BudgetGeneral Fund
Multiyear ProjectionsUnrestricted
19 64725 0000000Form MYP
California Dept of EducationSACS Financial Reporting Software - 2016.1.0File: myp (Rev 03/30/2015) Page 2 Printed: 6/24/2016 3:20 PM
DescriptionObjectCodes
2016-17Budget
(Form 01)(A)
%Change
(Cols. C-A/A)(B)
2017-18Projection
(C)
%Change
(Cols. E-C/C)(D)
2018-19Projection
(E)E. AVAILABLE RESERVES 1. General Fund a. Stabilization Arrangements 9750 0.00 0.00 0.00 b. Reserve for Economic Uncertainties 9789 17,460,945.00 17,434,642.00 17,510,898.00 c. Unassigned/Unappropriated 9790 81,496,142.83 85,319,652.83 72,271,228.83(Enter reserve projections for subsequent years 1 and 2 in Columns C and E; current year - Column A - is extracted.) 2. Special Reserve Fund - Noncapital Outlay (Fund 17) a. Stabilization Arrangements 9750 b. Reserve for Economic Uncertainties 9789 c. Unassigned/Unappropriated 9790 3. Total Available Reserves (Sum lines E1a thru E2c) 98,957,087.83 102,754,294.83 89,782,126.83F. ASSUMPTIONSPlease provide below or on a separate attachment, the assumptions used to determine the projections for the first and second subsequent fiscal years. Further, please include an explanation for any significant expenditure adjustments projected in lines B1d, B2d, and B10. For additional information, please refer to the Budget Assumptions section of the SACS Financial Reporting Software User Guide.
Othe adjustments include reduction of teachers for declining enrollment, one time costs associated with Year Round schools transitioning to Traditional school schedules, funded by one-timefunds.Othe adjustments include reduction of teachers for declining enrollment, one time costs associated with Year Round schools transitioning to Traditional school schedules, funded by one-timefunds.

Long Beach UnifiedLos Angeles County
July 1 BudgetGeneral Fund
Multiyear ProjectionsRestricted
19 64725 0000000Form MYP
California Dept of EducationSACS Financial Reporting Software - 2016.1.0File: myp (Rev 03/30/2015) Page 1 Printed: 6/24/2016 3:21 PM
DescriptionObjectCodes
2016-17Budget
(Form 01)(A)
%Change
(Cols. C-A/A)(B)
2017-18Projection
(C)
%Change
(Cols. E-C/C)(D)
2018-19Projection
(E)
(Enter projections for subsequent years 1 and 2 in Columns C and E; current year - Column A - is extracted)A. REVENUES AND OTHER FINANCING SOURCES 1. LCFF/Revenue Limit Sources 8010-8099 0.00 0.00% 0.00% 2. Federal Revenues 8100-8299 63,918,593.00 -22.16% 49,756,441.00 -1.44% 49,041,068.00 3. Other State Revenues 8300-8599 89,988,614.00 -4.78% 85,684,599.00 -3.72% 82,500,680.00 4. Other Local Revenues 8600-8799 7,976,174.00 -69.70% 2,416,636.00 -29.55% 1,702,479.00 5. Other Financing Sources a. Transfers In 8900-8929 0.00 0.00% 0.00% b. Other Sources 8930-8979 0.00 0.00% 0.00% c. Contributions 8980-8999 108,026,544.00 4.04% 112,387,423.00 3.97% 116,849,283.00 6. Total (Sum lines A1 thru A5c) 269,909,925.00 -7.29% 250,245,099.00 -0.06% 250,093,510.00
B. EXPENDITURES AND OTHER FINANCING USES 1. Certificated Salaries a. Base Salaries 84,449,648.00 79,209,375.00 b. Step & Column Adjustment 1,055,621.00 990,117.00 c. Cost-of-Living Adjustment d. Other Adjustments (6,295,894.00) (2,275,402.00) e. Total Certificated Salaries (Sum lines B1a thru B1d) 1000-1999 84,449,648.00 -6.21% 79,209,375.00 -1.62% 77,924,090.00 2. Classified Salaries a. Base Salaries 42,290,102.00 42,417,131.00 b. Step & Column Adjustment 317,176.00 318,128.00 c. Cost-of-Living Adjustment d. Other Adjustments (190,147.00) (137,730.00) e. Total Classified Salaries (Sum lines B2a thru B2d) 2000-2999 42,290,102.00 0.30% 42,417,131.00 0.43% 42,597,529.00 3. Employee Benefits 3000-3999 71,835,386.00 1.67% 73,034,765.00 4.41% 76,256,832.00 4. Books and Supplies 4000-4999 24,292,899.00 -58.39% 10,107,870.00 -6.13% 9,488,223.00 5. Services and Other Operating Expenditures 5000-5999 43,167,479.00 -11.43% 38,233,648.00 -3.97% 36,715,129.00 6. Capital Outlay 6000-6999 668,654.00 -38.73% 409,654.00 0.00% 409,654.00 7. Other Outgo (excluding Transfers of Indirect Costs) 7100-7299, 7400-7499 200,000.00 0.00% 200,000.00 0.00% 200,000.00 8. Other Outgo - Transfers of Indirect Costs 7300-7399 7,334,936.00 0.13% 7,344,772.00 0.21% 7,360,000.00 9. Other Financing Uses a. Transfers Out 7600-7629 0.00 0.00% 0.00% b. Other Uses 7630-7699 0.00 0.00% 0.00%10. Other Adjustments (Explain in Section F below)11. Total (Sum lines B1 thru B10) 274,239,104.00 -8.49% 250,957,215.00 0.00% 250,951,457.00C. NET INCREASE (DECREASE) IN FUND BALANCE (Line A6 minus line B11) (4,329,179.00) (712,116.00) (857,947.00)
D. FUND BALANCE 1. Net Beginning Fund Balance (Form 01, line F1e) 22,595,449.61 18,266,270.61 17,554,154.61 2. Ending Fund Balance (Sum lines C and D1) 18,266,270.61 17,554,154.61 16,696,207.61 3. Components of Ending Fund Balance a. Nonspendable 9710-9719 0.00 b. Restricted 9740 18,266,272.58 17,554,154.61 16,696,207.61 c. Committed 1. Stabilization Arrangements 9750 2. Other Commitments 9760 d. Assigned 9780 e. Unassigned/Unappropriated 1. Reserve for Economic Uncertainties 9789 2. Unassigned/Unappropriated 9790 (1.97) 0.00 0.00 f. Total Components of Ending Fund Balance (Line D3f must agree with line D2) 18,266,270.61 17,554,154.61 16,696,207.61
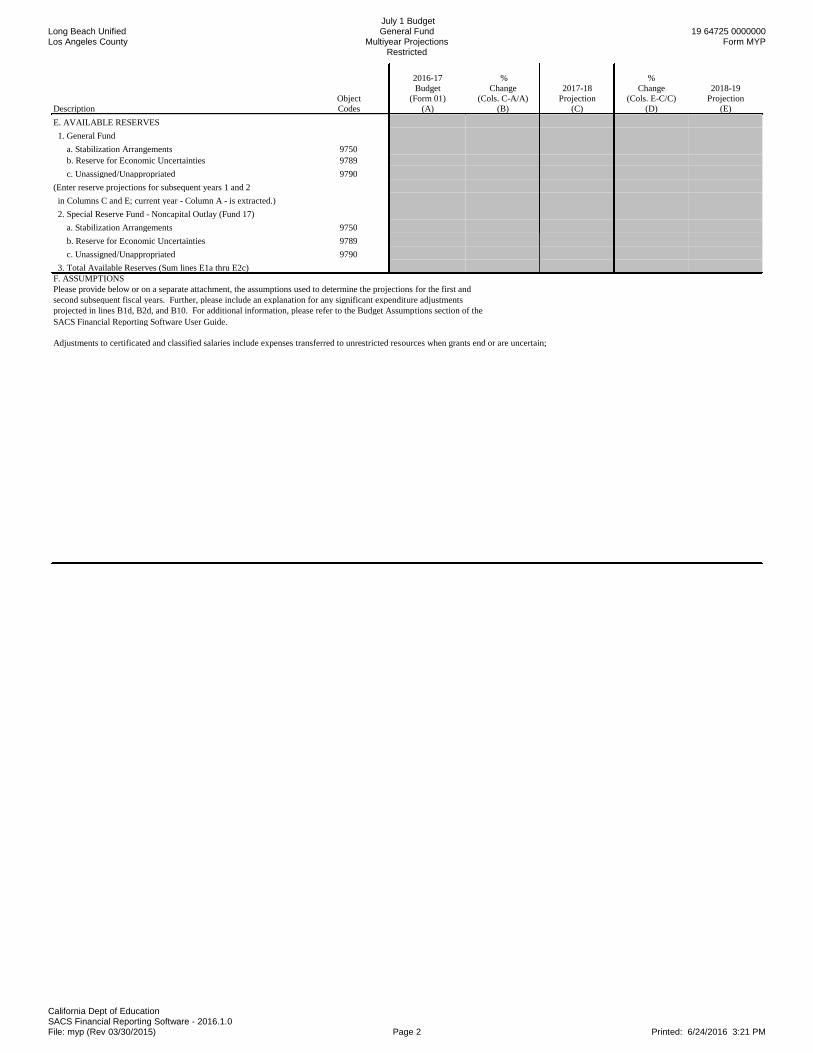
Long Beach UnifiedLos Angeles County
July 1 BudgetGeneral Fund
Multiyear ProjectionsRestricted
19 64725 0000000Form MYP
California Dept of EducationSACS Financial Reporting Software - 2016.1.0File: myp (Rev 03/30/2015) Page 2 Printed: 6/24/2016 3:21 PM
DescriptionObjectCodes
2016-17Budget
(Form 01)(A)
%Change
(Cols. C-A/A)(B)
2017-18Projection
(C)
%Change
(Cols. E-C/C)(D)
2018-19Projection
(E)E. AVAILABLE RESERVES 1. General Fund a. Stabilization Arrangements 9750 b. Reserve for Economic Uncertainties 9789 c. Unassigned/Unappropriated 9790(Enter reserve projections for subsequent years 1 and 2 in Columns C and E; current year - Column A - is extracted.) 2. Special Reserve Fund - Noncapital Outlay (Fund 17) a. Stabilization Arrangements 9750 b. Reserve for Economic Uncertainties 9789 c. Unassigned/Unappropriated 9790 3. Total Available Reserves (Sum lines E1a thru E2c)F. ASSUMPTIONSPlease provide below or on a separate attachment, the assumptions used to determine the projections for the first andsecond subsequent fiscal years. Further, please include an explanation for any significant expenditure adjustmentsprojected in lines B1d, B2d, and B10. For additional information, please refer to the Budget Assumptions section of the SACS Financial Reporting Software User Guide.
Adjustments to certificated and classified salaries include expenses transferred to unrestricted resources when grants end or are uncertain;Adjustments to certificated and classified salaries include expenses transferred to unrestricted resources when grants end or are uncertain;

Long Beach UnifiedLos Angeles County
July 1 BudgetGeneral Fund
Multiyear ProjectionsUnrestricted/Restricted
19 64725 0000000Form MYP
California Dept of EducationSACS Financial Reporting Software - 2016.1.0File: myp (Rev 03/09/2016) Page 1 Printed: 6/24/2016 3:21 PM
DescriptionObjectCodes
2016-17Budget
(Form 01)(A)
%Change
(Cols. C-A/A)(B)
2017-18Projection
(C)
%Change
(Cols. E-C/C)(D)
2018-19Projection
(E)(Enter projections for subsequent years 1 and 2 in Columns C and E; current year - Column A - is extracted)A. REVENUES AND OTHER FINANCING SOURCES 1. LCFF/Revenue Limit Sources 8010-8099 693,727,961.00 2.05% 707,931,376.00 -0.28% 705,951,728.00 2. Federal Revenues 8100-8299 64,068,593.00 -22.18% 49,856,441.00 -1.43% 49,141,068.00 3. Other State Revenues 8300-8599 122,018,019.00 -18.45% 99,503,209.00 -3.30% 96,224,246.00 4. Other Local Revenues 8600-8799 16,861,209.00 -31.64% 11,526,188.00 -5.45% 10,897,759.00 5. Other Financing Sources a. Transfers In 8900-8929 500,000.00 -100.00% 0.00 0.00% 0.00 b. Other Sources 8930-8979 0.00 0.00% 0.00 0.00% 0.00 c. Contributions 8980-8999 0.00 0.00% 0.00 0.00% 0.00 6. Total (Sum lines A1 thru A5c) 897,175,782.00 -3.16% 868,817,214.00 -0.76% 862,214,801.00B. EXPENDITURES AND OTHER FINANCING USES 1. Certificated Salaries a. Base Salaries 381,808,354.00 387,304,121.00 b. Step & Column Adjustment 4,772,605.00 4,841,301.00 c. Cost-of-Living Adjustment 0.00 0.00 d. Other Adjustments 723,162.00 (8,035,263.00) e. Total Certificated Salaries (Sum lines B1a thru B1d) 1000-1999 381,808,354.00 1.44% 387,304,121.00 -0.82% 384,110,159.00 2. Classified Salaries a. Base Salaries 117,401,011.00 118,201,657.00 b. Step & Column Adjustment 880,508.00 886,512.00 c. Cost-of-Living Adjustment 0.00 0.00 d. Other Adjustments (79,862.00) (137,730.00) e. Total Classified Salaries (Sum lines B2a thru B2d) 2000-2999 117,401,011.00 0.68% 118,201,657.00 0.63% 118,950,439.00 3. Employee Benefits 3000-3999 216,085,288.00 6.69% 230,540,980.00 6.24% 244,937,013.00 4. Books and Supplies 4000-4999 61,237,015.00 -36.07% 39,151,653.00 -16.70% 32,612,702.00 5. Services and Other Operating Expenditures 5000-5999 100,834,601.00 -8.67% 92,089,286.00 -1.75% 90,474,949.00 6. Capital Outlay 6000-6999 1,658,654.00 -15.62% 1,399,654.00 0.00% 1,399,654.00 7. Other Outgo (excluding Transfers of Indirect Costs) 7100-7299, 7400-7499 200,000.00 0.00% 200,000.00 0.00% 200,000.00 8. Other Outgo - Transfers of Indirect Costs 7300-7399 (1,177,672.00) -1.91% (1,155,228.00) -1.32% (1,140,000.00) 9. Other Financing Uses a. Transfers Out 7600-7629 4,000,000.00 0.00% 4,000,000.00 0.00% 4,000,000.00 b. Other Uses 7630-7699 0.00 0.00% 0.00 0.00% 0.0010. Other Adjustments 0.00 0.0011. Total (Sum lines B1 thru B10) 882,047,251.00 -1.17% 871,732,123.00 0.44% 875,544,916.00C. NET INCREASE (DECREASE) IN FUND BALANCE (Line A6 minus line B11) 15,128,531.00 (2,914,909.00) (13,330,115.00)D. FUND BALANCE 1. Net Beginning Fund Balance (Form 01, line F1e) 176,101,477.44 191,230,008.44 188,315,099.44 2. Ending Fund Balance (Sum lines C and D1) 191,230,008.44 188,315,099.44 174,984,984.44 3. Components of Ending Fund Balance a. Nonspendable 9710-9719 1,906,650.00 1,906,650.00 1,906,650.00 b. Restricted 9740 18,266,272.58 17,554,154.61 16,696,207.61 c. Committed 1. Stabilization Arrangements 9750 0.00 0.00 0.00 2. Other Commitments 9760 72,100,000.00 66,100,000.00 66,600,000.00 d. Assigned 9780 0.00 0.00 0.00 e. Unassigned/Unappropriated 1. Reserve for Economic Uncertainties 9789 17,460,945.00 17,434,642.00 17,510,898.00 2. Unassigned/Unappropriated 9790 81,496,140.86 85,319,652.83 72,271,228.83 f. Total Components of Ending Fund Balance (Line D3f must agree with line D2) 191,230,008.44 188,315,099.44 174,984,984.44

Long Beach UnifiedLos Angeles County
July 1 BudgetGeneral Fund
Multiyear ProjectionsUnrestricted/Restricted
19 64725 0000000Form MYP
California Dept of EducationSACS Financial Reporting Software - 2016.1.0File: myp (Rev 03/09/2016) Page 2 Printed: 6/24/2016 3:21 PM
DescriptionObjectCodes
2016-17Budget
(Form 01)(A)
%Change
(Cols. C-A/A)(B)
2017-18Projection
(C)
%Change
(Cols. E-C/C)(D)
2018-19Projection
(E)E. AVAILABLE RESERVES 1. General Fund a. Stabilization Arrangements 9750 0.00 0.00 0.00 b. Reserve for Economic Uncertainties 9789 17,460,945.00 17,434,642.00 17,510,898.00 c. Unassigned/Unappropriated 9790 81,496,142.83 85,319,652.83 72,271,228.83 d. Negative Restricted Ending Balances (Negative resources 2000-9999) 979Z (1.97) 0.00 0.00 2. Special Reserve Fund - Noncapital Outlay (Fund 17) a. Stabilization Arrangements 9750 0.00 0.00 0.00 b. Reserve for Economic Uncertainties 9789 0.00 0.00 0.00 c. Unassigned/Unappropriated 9790 0.00 0.00 0.00 3. Total Available Reserves - by Amount (Sum lines E1a thru E2c) 98,957,085.86 102,754,294.83 89,782,126.83 4. Total Available Reserves - by Percent (Line E3 divided by Line F3c) 11.22% 11.79% 10.25%F. RECOMMENDED RESERVES 1. Special Education Pass-through Exclusions For districts that serve as the administrative unit (AU) of a special education local plan area (SELPA): a. Do you choose to exclude from the reserve calculation the pass-through funds distributed to SELPA members? No b. If you are the SELPA AU and are excluding special education pass-through funds: 1. Enter the name(s) of the SELPA(s):
2. Special education pass-through funds (Column A: Fund 10, resources 3300-3499 and 6500-6540, objects 7211-7213 and 7221-7223; enter projections for subsequent years 1 and 2 in Columns C and E) 0.00 0.00 0.00 2. District ADA Used to determine the reserve standard percentage level on line F3d (Col. A: Form A, Estimated P-2 ADA column, Line A4; enter projections) 72,731.08 71,277.00 70,208.00 3. Calculating the Reserves a. Expenditures and Other Financing Uses (Line B11) 882,047,251.00 871,732,123.00 875,544,916.00 b. Plus: Special Education Pass-through Funds (Line F1b2, if Line F1a is No) 0.00 0.00 0.00 c. Total Expenditures and Other Financing Uses (Line F3a plus line F3b) 882,047,251.00 871,732,123.00 875,544,916.00 d. Reserve Standard Percentage Level (Refer to Form 01CS, Criterion 10 for calculation details) 2% 2% 2% e. Reserve Standard - By Percent (Line F3c times F3d) 17,640,945.02 17,434,642.46 17,510,898.32 f. Reserve Standard - By Amount (Refer to Form 01CS, Criterion 10 for calculation details) 0.00 0.00 0.00 g. Reserve Standard (Greater of Line F3e or F3f) 17,640,945.02 17,434,642.46 17,510,898.32 h. Available Reserves (Line E3) Meet Reserve Standard (Line F3g) YES YES YES
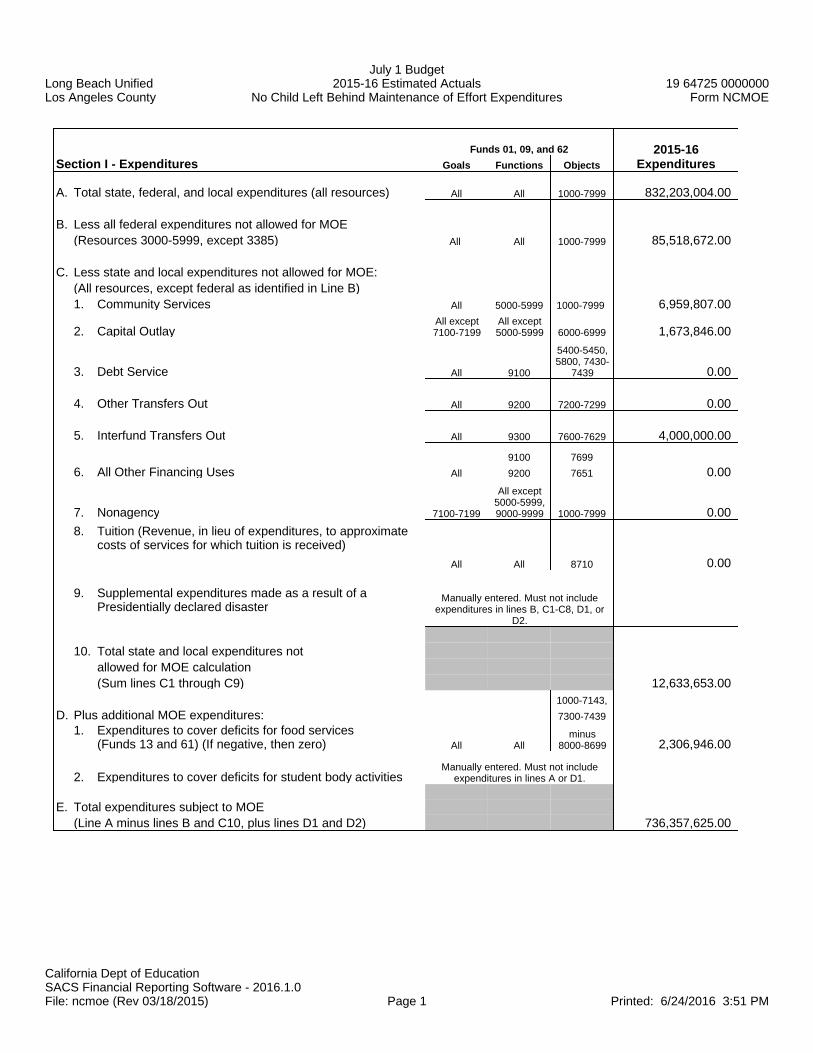
Long Beach UnifiedLos Angeles County
July 1 Budget2015-16 Estimated Actuals
No Child Left Behind Maintenance of Effort Expenditures19 64725 0000000
Form NCMOE
California Dept of EducationSACS Financial Reporting Software - 2016.1.0File: ncmoe (Rev 03/18/2015) Page 1 Printed: 6/24/2016 3:51 PM
Funds 01, 09, and 62Section I - Expenditures Goals Functions Objects
2015-16Expenditures
A. Total state, federal, and local expenditures (all resources) All All 1000-7999 832,203,004.00
B. Less all federal expenditures not allowed for MOE(Resources 3000-5999, except 3385) All All 1000-7999 85,518,672.00
C. Less state and local expenditures not allowed for MOE:(All resources, except federal as identified in Line B)1. Community Services All 5000-5999 1000-7999 6,959,807.00
2. Capital OutlayAll except7100-7199
All except5000-5999 6000-6999 1,673,846.00
3. Debt Service All 9100
5400-5450,5800, 7430-
7439 0.00
4. Other Transfers Out All 9200 7200-7299 0.00
5. Interfund Transfers Out All 9300 7600-7629 4,000,000.00
9100 76996. All Other Financing Uses All 9200 7651 0.00
7. Nonagency 7100-7199
All except5000-5999,9000-9999 1000-7999 0.00
8. Tuition (Revenue, in lieu of expenditures, to approximatecosts of services for which tuition is received)
All All 8710 0.00
9. Supplemental expenditures made as a result of aPresidentially declared disaster
Manually entered. Must not includeexpenditures in lines B, C1-C8, D1, or
D2.
10. Total state and local expenditures not allowed for MOE calculation(Sum lines C1 through C9) 12,633,653.00
1000-7143,D. Plus additional MOE expenditures: 7300-7439
1. Expenditures to cover deficits for food services(Funds 13 and 61) (If negative, then zero) All All
minus8000-8699 2,306,946.00
2. Expenditures to cover deficits for student body activitiesManually entered. Must not include
expenditures in lines A or D1.
E. Total expenditures subject to MOE(Line A minus lines B and C10, plus lines D1 and D2) 736,357,625.00

Long Beach UnifiedLos Angeles County
July 1 Budget2015-16 Estimated Actuals
No Child Left Behind Maintenance of Effort Expenditures19 64725 0000000
Form NCMOE
California Dept of EducationSACS Financial Reporting Software - 2016.1.0File: ncmoe (Rev 03/18/2015) Page 2 Printed: 6/24/2016 3:51 PM
Section II - Expenditures Per ADA
2015-16Annual ADA/
Exps. Per ADA
A. Average Daily Attendance(Form A, Annual ADA column, sum of lines A6 and C9)
74,433.07B. Expenditures per ADA (Line I.E divided by Line II.A) 9,892.88
Section III - MOE Calculation (For data collection only. Finaldetermination will be done by CDE) Total Per ADA
A. Base expenditures (Preloaded expenditures from prior year official CDEMOE calculation). (Note: If the prior year MOE was not met, CDE hasadjusted the prior year base to 90 percent of the preceding prior yearamount rather than the actual prior year expenditure amount.)
664,233,472.02 8,782.271. Adjustment to base expenditure and expenditure per ADA amounts for
LEAs failing prior year MOE calculation (From Section IV) 0.00 0.002. Total adjusted base expenditure amounts (Line A plus Line A.1) 664,233,472.02 8,782.27
B. Required effort (Line A.2 times 90%) 597,810,124.82 7,904.04
C. Current year expenditures (Line I.E and Line II.B) 736,357,625.00 9,892.88
D. MOE deficiency amount, if any (Line B minus Line C)(If negative, then zero) 0.00 0.00
E. MOE determination(If one or both of the amounts in line D are zero, the MOE requirement MOE Metis met; if both amounts are positive, the MOE requirement is not met. Ifeither column in Line A.2 or Line C equals zero, the MOE calculation isincomplete.)
F. MOE deficiency percentage, if MOE not met; otherwise, zero(Line D divided by Line B)(Funding under NCLB covered programs in FY 2017-18 maybe reduced by the lower of the two percentages) 0.00% 0.00%
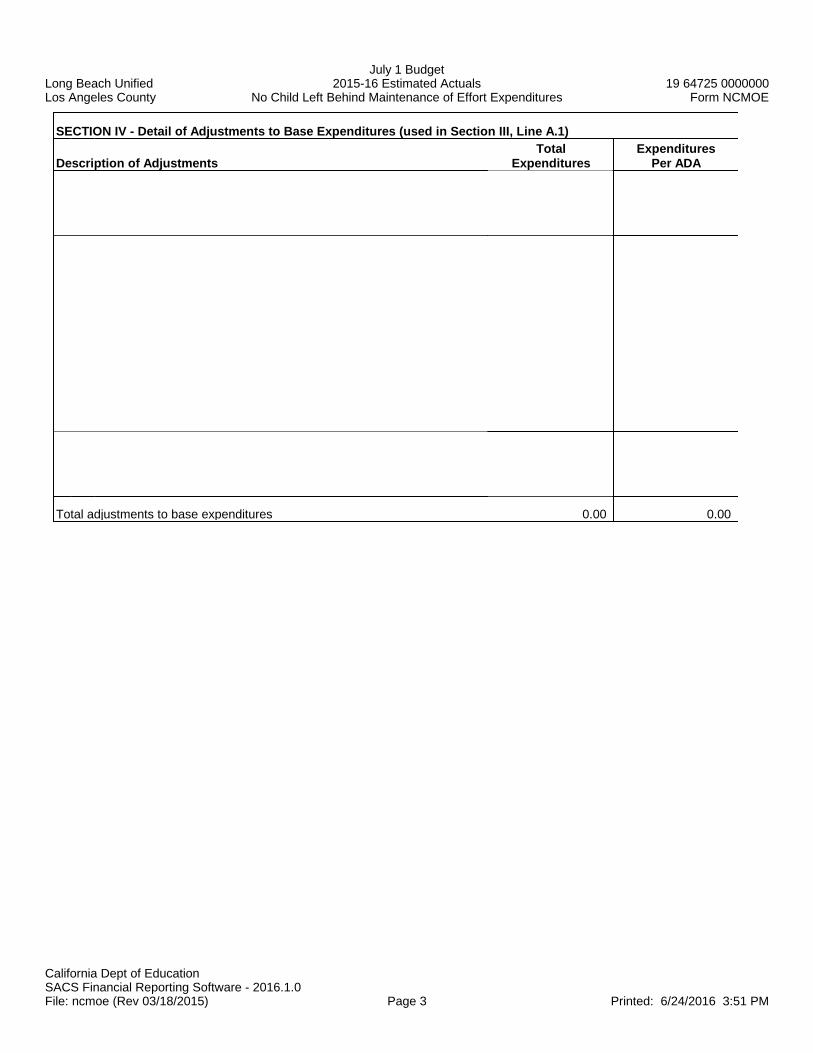
Long Beach UnifiedLos Angeles County
July 1 Budget2015-16 Estimated Actuals
No Child Left Behind Maintenance of Effort Expenditures19 64725 0000000
Form NCMOE
California Dept of EducationSACS Financial Reporting Software - 2016.1.0File: ncmoe (Rev 03/18/2015) Page 3 Printed: 6/24/2016 3:51 PM
SECTION IV - Detail of Adjustments to Base Expenditures (used in Section III, Line A.1)
Description of AdjustmentsTotal
ExpendituresExpenditures
Per ADA
Total adjustments to base expenditures 0.00 0.00

Long Beach UnifiedLos Angeles County
July 1 Budget2015-16 Estimated Actuals
SUMMARY OF INTERFUND ACTIVITIESFOR ALL FUNDS
19 64725 0000000Form SIAA
California Dept of EducationSACS Financial Reporting Software - 2016.1.0File: siaa (Rev 03/23/2016) Page 1 of 2 Printed: 6/24/2016 3:52 PM
Direct Costs - Interfund Indirect Costs - Interfund Interfund Interfund Due From Due To
DescriptionTransfers In
5750Transfers Out
5750Transfers In
7350Transfers Out
7350Transfers In8900-8929
Transfers Out7600-7629
Other Funds9310
Other Funds9610
01 GENERAL FUND Expenditure Detail 0.00 (644,060.00) 0.00 (1,417,650.00) Other Sources/Uses Detail 2,200,000.00 4,000,000.00 Fund Reconciliation 0.00 0.0009 CHARTER SCHOOLS SPECIAL REVENUE FUND Expenditure Detail 0.00 0.00 0.00 0.00 Other Sources/Uses Detail 0.00 0.00 Fund Reconciliation 0.00 0.0010 SPECIAL EDUCATION PASS-THROUGH FUND Expenditure Detail Other Sources/Uses Detail Fund Reconciliation 0.00 0.0011 ADULT EDUCATION FUND Expenditure Detail 1,500.00 0.00 0.00 0.00 Other Sources/Uses Detail 0.00 0.00 Fund Reconciliation 0.00 0.0012 CHILD DEVELOPMENT FUND Expenditure Detail 215,421.00 0.00 1,042,650.00 0.00 Other Sources/Uses Detail 0.00 0.00 Fund Reconciliation 0.00 0.0013 CAFETERIA SPECIAL REVENUE FUND Expenditure Detail 275,245.00 0.00 375,000.00 0.00 Other Sources/Uses Detail 0.00 0.00 Fund Reconciliation 0.00 0.0014 DEFERRED MAINTENANCE FUND Expenditure Detail 0.00 0.00 Other Sources/Uses Detail 0.00 0.00 Fund Reconciliation 0.00 0.0015 PUPIL TRANSPORTATION EQUIPMENT FUND Expenditure Detail 0.00 0.00 Other Sources/Uses Detail 0.00 0.00 Fund Reconciliation 0.00 0.0017 SPECIAL RESERVE FUND FOR OTHER THAN CAPITAL OUTLAY Expenditure Detail Other Sources/Uses Detail 0.00 2,200,000.00 Fund Reconciliation 0.00 0.0018 SCHOOL BUS EMISSIONS REDUCTION FUND Expenditure Detail 0.00 0.00 Other Sources/Uses Detail 0.00 0.00 Fund Reconciliation 0.00 0.0019 FOUNDATION SPECIAL REVENUE FUND Expenditure Detail 0.00 0.00 0.00 0.00 Other Sources/Uses Detail 0.00 Fund Reconciliation 0.00 0.0020 SPECIAL RESERVE FUND FOR POSTEMPLOYMENT BENEFITS Expenditure Detail Other Sources/Uses Detail 0.00 0.00 Fund Reconciliation 0.00 0.0021 BUILDING FUND Expenditure Detail 145,444.00 0.00 Other Sources/Uses Detail 0.00 0.00 Fund Reconciliation 0.00 0.0025 CAPITAL FACILITIES FUND Expenditure Detail 0.00 0.00 Other Sources/Uses Detail 0.00 0.00 Fund Reconciliation 0.00 0.0030 STATE SCHOOL BUILDING LEASE/PURCHASE FUND Expenditure Detail 0.00 0.00 Other Sources/Uses Detail 0.00 0.00 Fund Reconciliation 0.00 0.0035 COUNTY SCHOOL FACILITIES FUND Expenditure Detail 0.00 0.00 Other Sources/Uses Detail 0.00 0.00 Fund Reconciliation 0.00 0.0040 SPECIAL RESERVE FUND FOR CAPITAL OUTLAY PROJECTS Expenditure Detail 5,500.00 0.00 Other Sources/Uses Detail 0.00 0.00 Fund Reconciliation 0.00 0.0049 CAP PROJ FUND FOR BLENDED COMPONENT UNITS Expenditure Detail 0.00 0.00 Other Sources/Uses Detail 0.00 0.00 Fund Reconciliation 0.00 0.0051 BOND INTEREST AND REDEMPTION FUND Expenditure Detail Other Sources/Uses Detail 0.00 0.00 Fund Reconciliation 0.00 0.0052 DEBT SVC FUND FOR BLENDED COMPONENT UNITS Expenditure Detail Other Sources/Uses Detail 0.00 0.00 Fund Reconciliation 0.00 0.0053 TAX OVERRIDE FUND Expenditure Detail Other Sources/Uses Detail 0.00 0.00 Fund Reconciliation 0.00 0.0056 DEBT SERVICE FUND Expenditure Detail Other Sources/Uses Detail 0.00 0.00 Fund Reconciliation 0.00 0.0057 FOUNDATION PERMANENT FUND Expenditure Detail 0.00 0.00 0.00 0.00 Other Sources/Uses Detail 0.00 Fund Reconciliation 0.00 0.0061 CAFETERIA ENTERPRISE FUND Expenditure Detail 0.00 0.00 0.00 0.00 Other Sources/Uses Detail 0.00 0.00 Fund Reconciliation 0.00 0.00

Long Beach UnifiedLos Angeles County
July 1 Budget2015-16 Estimated Actuals
SUMMARY OF INTERFUND ACTIVITIESFOR ALL FUNDS
19 64725 0000000Form SIAA
California Dept of EducationSACS Financial Reporting Software - 2016.1.0File: siaa (Rev 03/23/2016) Page 2 of 2 Printed: 6/24/2016 3:52 PM
Direct Costs - Interfund Indirect Costs - Interfund Interfund Interfund Due From Due To
DescriptionTransfers In
5750Transfers Out
5750Transfers In
7350Transfers Out
7350Transfers In8900-8929
Transfers Out7600-7629
Other Funds9310
Other Funds9610
62 CHARTER SCHOOLS ENTERPRISE FUND Expenditure Detail 0.00 0.00 0.00 0.00 Other Sources/Uses Detail 0.00 0.00 Fund Reconciliation 0.00 0.0063 OTHER ENTERPRISE FUND Expenditure Detail 0.00 0.00 Other Sources/Uses Detail 0.00 0.00 Fund Reconciliation 0.00 0.0066 WAREHOUSE REVOLVING FUND Expenditure Detail 0.00 0.00 Other Sources/Uses Detail 0.00 0.00 Fund Reconciliation 0.00 0.0067 SELF-INSURANCE FUND Expenditure Detail 950.00 0.00 Other Sources/Uses Detail 4,000,000.00 0.00 Fund Reconciliation 0.00 0.0071 RETIREE BENEFIT FUND Expenditure Detail Other Sources/Uses Detail 0.00 Fund Reconciliation 0.00 0.0073 FOUNDATION PRIVATE-PURPOSE TRUST FUND Expenditure Detail 0.00 0.00 Other Sources/Uses Detail 0.00 Fund Reconciliation 0.00 0.0076 WARRANT/PASS-THROUGH FUND Expenditure Detail Other Sources/Uses Detail Fund Reconciliation 0.00 0.0095 STUDENT BODY FUND Expenditure Detail Other Sources/Uses Detail Fund Reconciliation 0.00 0.00 TOTALS 644,060.00 (644,060.00) 1,417,650.00 (1,417,650.00) 6,200,000.00 6,200,000.00 0.00 0.00
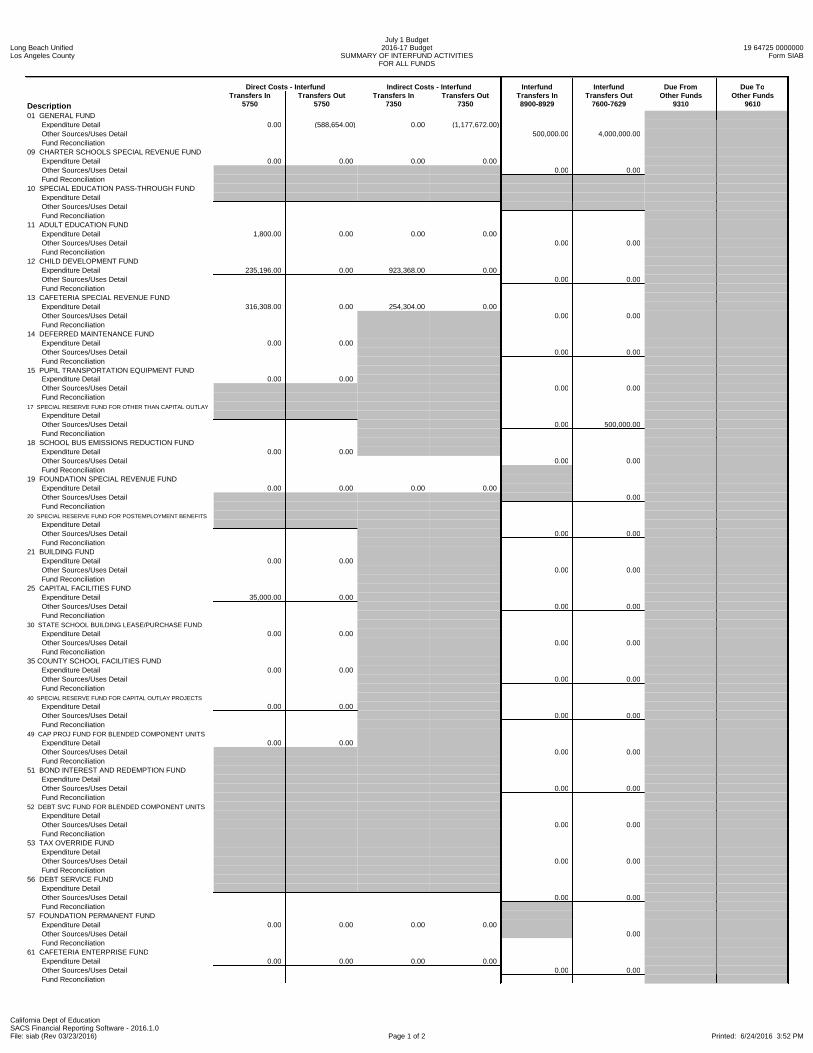
Long Beach UnifiedLos Angeles County
July 1 Budget2016-17 Budget
SUMMARY OF INTERFUND ACTIVITIESFOR ALL FUNDS
19 64725 0000000Form SIAB
California Dept of EducationSACS Financial Reporting Software - 2016.1.0File: siab (Rev 03/23/2016) Page 1 of 2 Printed: 6/24/2016 3:52 PM
Direct Costs - Interfund Indirect Costs - Interfund Interfund Interfund Due From Due To
DescriptionTransfers In
5750Transfers Out
5750Transfers In
7350Transfers Out
7350Transfers In8900-8929
Transfers Out7600-7629
Other Funds9310
Other Funds9610
01 GENERAL FUND Expenditure Detail 0.00 (588,654.00) 0.00 (1,177,672.00) Other Sources/Uses Detail 500,000.00 4,000,000.00 Fund Reconciliation09 CHARTER SCHOOLS SPECIAL REVENUE FUND Expenditure Detail 0.00 0.00 0.00 0.00 Other Sources/Uses Detail 0.00 0.00 Fund Reconciliation10 SPECIAL EDUCATION PASS-THROUGH FUND Expenditure Detail Other Sources/Uses Detail Fund Reconciliation11 ADULT EDUCATION FUND Expenditure Detail 1,800.00 0.00 0.00 0.00 Other Sources/Uses Detail 0.00 0.00 Fund Reconciliation12 CHILD DEVELOPMENT FUND Expenditure Detail 235,196.00 0.00 923,368.00 0.00 Other Sources/Uses Detail 0.00 0.00 Fund Reconciliation13 CAFETERIA SPECIAL REVENUE FUND Expenditure Detail 316,308.00 0.00 254,304.00 0.00 Other Sources/Uses Detail 0.00 0.00 Fund Reconciliation14 DEFERRED MAINTENANCE FUND Expenditure Detail 0.00 0.00 Other Sources/Uses Detail 0.00 0.00 Fund Reconciliation15 PUPIL TRANSPORTATION EQUIPMENT FUND Expenditure Detail 0.00 0.00 Other Sources/Uses Detail 0.00 0.00 Fund Reconciliation17 SPECIAL RESERVE FUND FOR OTHER THAN CAPITAL OUTLAY Expenditure Detail Other Sources/Uses Detail 0.00 500,000.00 Fund Reconciliation18 SCHOOL BUS EMISSIONS REDUCTION FUND Expenditure Detail 0.00 0.00 Other Sources/Uses Detail 0.00 0.00 Fund Reconciliation19 FOUNDATION SPECIAL REVENUE FUND Expenditure Detail 0.00 0.00 0.00 0.00 Other Sources/Uses Detail 0.00 Fund Reconciliation20 SPECIAL RESERVE FUND FOR POSTEMPLOYMENT BENEFITS Expenditure Detail Other Sources/Uses Detail 0.00 0.00 Fund Reconciliation21 BUILDING FUND Expenditure Detail 0.00 0.00 Other Sources/Uses Detail 0.00 0.00 Fund Reconciliation25 CAPITAL FACILITIES FUND Expenditure Detail 35,000.00 0.00 Other Sources/Uses Detail 0.00 0.00 Fund Reconciliation30 STATE SCHOOL BUILDING LEASE/PURCHASE FUND Expenditure Detail 0.00 0.00 Other Sources/Uses Detail 0.00 0.00 Fund Reconciliation35 COUNTY SCHOOL FACILITIES FUND Expenditure Detail 0.00 0.00 Other Sources/Uses Detail 0.00 0.00 Fund Reconciliation40 SPECIAL RESERVE FUND FOR CAPITAL OUTLAY PROJECTS Expenditure Detail 0.00 0.00 Other Sources/Uses Detail 0.00 0.00 Fund Reconciliation49 CAP PROJ FUND FOR BLENDED COMPONENT UNITS Expenditure Detail 0.00 0.00 Other Sources/Uses Detail 0.00 0.00 Fund Reconciliation51 BOND INTEREST AND REDEMPTION FUND Expenditure Detail Other Sources/Uses Detail 0.00 0.00 Fund Reconciliation52 DEBT SVC FUND FOR BLENDED COMPONENT UNITS Expenditure Detail Other Sources/Uses Detail 0.00 0.00 Fund Reconciliation53 TAX OVERRIDE FUND Expenditure Detail Other Sources/Uses Detail 0.00 0.00 Fund Reconciliation56 DEBT SERVICE FUND Expenditure Detail Other Sources/Uses Detail 0.00 0.00 Fund Reconciliation57 FOUNDATION PERMANENT FUND Expenditure Detail 0.00 0.00 0.00 0.00 Other Sources/Uses Detail 0.00 Fund Reconciliation61 CAFETERIA ENTERPRISE FUND Expenditure Detail 0.00 0.00 0.00 0.00 Other Sources/Uses Detail 0.00 0.00 Fund Reconciliation

Long Beach UnifiedLos Angeles County
July 1 Budget2016-17 Budget
SUMMARY OF INTERFUND ACTIVITIESFOR ALL FUNDS
19 64725 0000000Form SIAB
California Dept of EducationSACS Financial Reporting Software - 2016.1.0File: siab (Rev 03/23/2016) Page 2 of 2 Printed: 6/24/2016 3:52 PM
Direct Costs - Interfund Indirect Costs - Interfund Interfund Interfund Due From Due To
DescriptionTransfers In
5750Transfers Out
5750Transfers In
7350Transfers Out
7350Transfers In8900-8929
Transfers Out7600-7629
Other Funds9310
Other Funds9610
62 CHARTER SCHOOLS ENTERPRISE FUND Expenditure Detail 0.00 0.00 0.00 0.00 Other Sources/Uses Detail 0.00 0.00 Fund Reconciliation63 OTHER ENTERPRISE FUND Expenditure Detail 0.00 0.00 Other Sources/Uses Detail 0.00 0.00 Fund Reconciliation66 WAREHOUSE REVOLVING FUND Expenditure Detail 0.00 0.00 Other Sources/Uses Detail 0.00 0.00 Fund Reconciliation67 SELF-INSURANCE FUND Expenditure Detail 350.00 0.00 Other Sources/Uses Detail 4,000,000.00 0.00 Fund Reconciliation71 RETIREE BENEFIT FUND Expenditure Detail Other Sources/Uses Detail 0.00 Fund Reconciliation73 FOUNDATION PRIVATE-PURPOSE TRUST FUND Expenditure Detail 0.00 0.00 Other Sources/Uses Detail 0.00 Fund Reconciliation76 WARRANT/PASS-THROUGH FUND Expenditure Detail Other Sources/Uses Detail Fund Reconciliation95 STUDENT BODY FUND Expenditure Detail Other Sources/Uses Detail Fund Reconciliation TOTALS 588,654.00 (588,654.00) 1,177,672.00 (1,177,672.00) 4,500,000.00 4,500,000.00
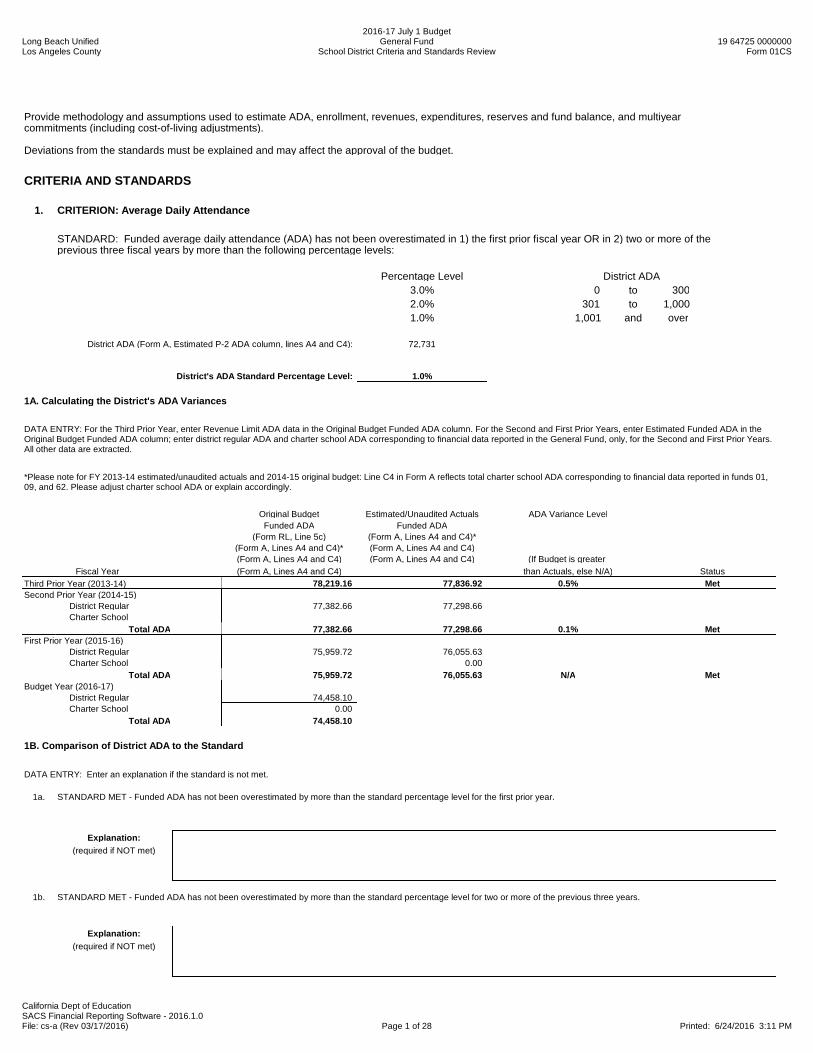
Long Beach UnifiedLos Angeles County
2016-17 July 1 BudgetGeneral Fund
School District Criteria and Standards Review19 64725 0000000
Form 01CS
California Dept of EducationSACS Financial Reporting Software - 2016.1.0File: cs-a (Rev 03/17/2016) Page 1 of 28 Printed: 6/24/2016 3:11 PM
Provide methodology and assumptions used to estimate ADA, enrollment, revenues, expenditures, reserves and fund balance, and multiyear commitments (including cost-of-living adjustments).
Deviations from the standards must be explained and may affect the approval of the budget.
CRITERIA AND STANDARDS
1. CRITERION: Average Daily Attendance
STANDARD: Funded average daily attendance (ADA) has not been overestimated in 1) the first prior fiscal year OR in 2) two or more of the previous three fiscal years by more than the following percentage levels:
Percentage Level District ADA3.0% 0 to 3002.0% 301 to 1,0001.0% 1,001 and over
District ADA (Form A, Estimated P-2 ADA column, lines A4 and C4): 72,731
District's ADA Standard Percentage Level: 1.0%
1A. Calculating the District's ADA Variances
DATA ENTRY: For the Third Prior Year, enter Revenue Limit ADA data in the Original Budget Funded ADA column. For the Second and First Prior Years, enter Estimated Funded ADA in theOriginal Budget Funded ADA column; enter district regular ADA and charter school ADA corresponding to financial data reported in the General Fund, only, for the Second and First Prior Years.All other data are extracted.
*Please note for FY 2013-14 estimated/unaudited actuals and 2014-15 original budget: Line C4 in Form A reflects total charter school ADA corresponding to financial data reported in funds 01,09, and 62. Please adjust charter school ADA or explain accordingly.
Original Budget Estimated/Unaudited Actuals ADA Variance LevelFunded ADA Funded ADA
(Form RL, Line 5c) (Form A, Lines A4 and C4)*(Form A, Lines A4 and C4)* (Form A, Lines A4 and C4)(Form A, Lines A4 and C4) (Form A, Lines A4 and C4) (If Budget is greater
Fiscal Year (Form A, Lines A4 and C4) than Actuals, else N/A) StatusThird Prior Year (2013-14) 78,219.16 77,836.92 0.5% MetSecond Prior Year (2014-15)
District Regular 77,382.66 77,298.66 Charter School
Total ADA 77,382.66 77,298.66 0.1% MetFirst Prior Year (2015-16)
District Regular 75,959.72 76,055.63 Charter School 0.00
Total ADA 75,959.72 76,055.63 N/A MetBudget Year (2016-17)
District Regular 74,458.10 Charter School 0.00
Total ADA 74,458.10
1B. Comparison of District ADA to the Standard
DATA ENTRY: Enter an explanation if the standard is not met.
1a. STANDARD MET - Funded ADA has not been overestimated by more than the standard percentage level for the first prior year.
Explanation:(required if NOT met)
1b. STANDARD MET - Funded ADA has not been overestimated by more than the standard percentage level for two or more of the previous three years.
Explanation:(required if NOT met)

Long Beach UnifiedLos Angeles County
2016-17 July 1 BudgetGeneral Fund
School District Criteria and Standards Review19 64725 0000000
Form 01CS
California Dept of EducationSACS Financial Reporting Software - 2016.1.0File: cs-a (Rev 03/17/2016) Page 2 of 28 Printed: 6/24/2016 3:11 PM

Long Beach UnifiedLos Angeles County
2016-17 July 1 BudgetGeneral Fund
School District Criteria and Standards Review19 64725 0000000
Form 01CS
California Dept of EducationSACS Financial Reporting Software - 2016.1.0File: cs-a (Rev 03/17/2016) Page 3 of 28 Printed: 6/24/2016 3:11 PM
2. CRITERION: Enrollment
STANDARD: Projected enrollment has not been overestimated in 1) the first prior fiscal year OR in 2) two or more of the previous three fiscal years by more than the following percentage levels:
Percentage Level District ADA3.0% 0 to 3002.0% 301 to 1,0001.0% 1,001 and over
District ADA (Form A, Estimated P-2 ADA column, lines A4 and C4): 72,731
District's Enrollment Standard Percentage Level: 1.0%
2A. Calculating the District's Enrollment Variances
DATA ENTRY: Enter data in the Enrollment, Budget, column for all fiscal years and in the Enrollment, CBEDS Actual column for the First Prior Year; all other data are extracted or calculated.CBEDS Actual enrollment data preloaded in the District Regular lines will include both District Regular and Charter School enrollment. Districts will need to adjust the District Regular enrollmentlines and the Charter School enrollment lines accordingly. Enter district regular enrollment and charter school enrollment corresponding to financial data reported in the General Fund, only, forthe Budget, First and Second Prior Years.
Enrollment Variance LevelEnrollment (If Budget is greater
Fiscal Year Budget CBEDS Actual than Actual, else N/A) StatusThird Prior Year (2013-14) 80,446 81,155 N/A MetSecond Prior Year (2014-15)
District Regular 80,768 79,175 Charter School
Total Enrollment 80,768 79,175 2.0% Not MetFirst Prior Year (2015-16)
District Regular 77,987 77,638 Charter School
Total Enrollment 77,987 77,638 0.4% MetBudget Year (2016-17)
District Regular 75,936 Charter School
Total Enrollment 75,936
2B. Comparison of District Enrollment to the Standard
DATA ENTRY: Enter an explanation if the standard is not met.
1a. STANDARD MET - Enrollment has not been overestimated by more than the standard percentage level for the first prior year.
Explanation:(required if NOT met)
1b. STANDARD MET - Enrollment has not been overestimated by more than the standard percentage level for two or more of the previous three years.
Explanation:(required if NOT met)
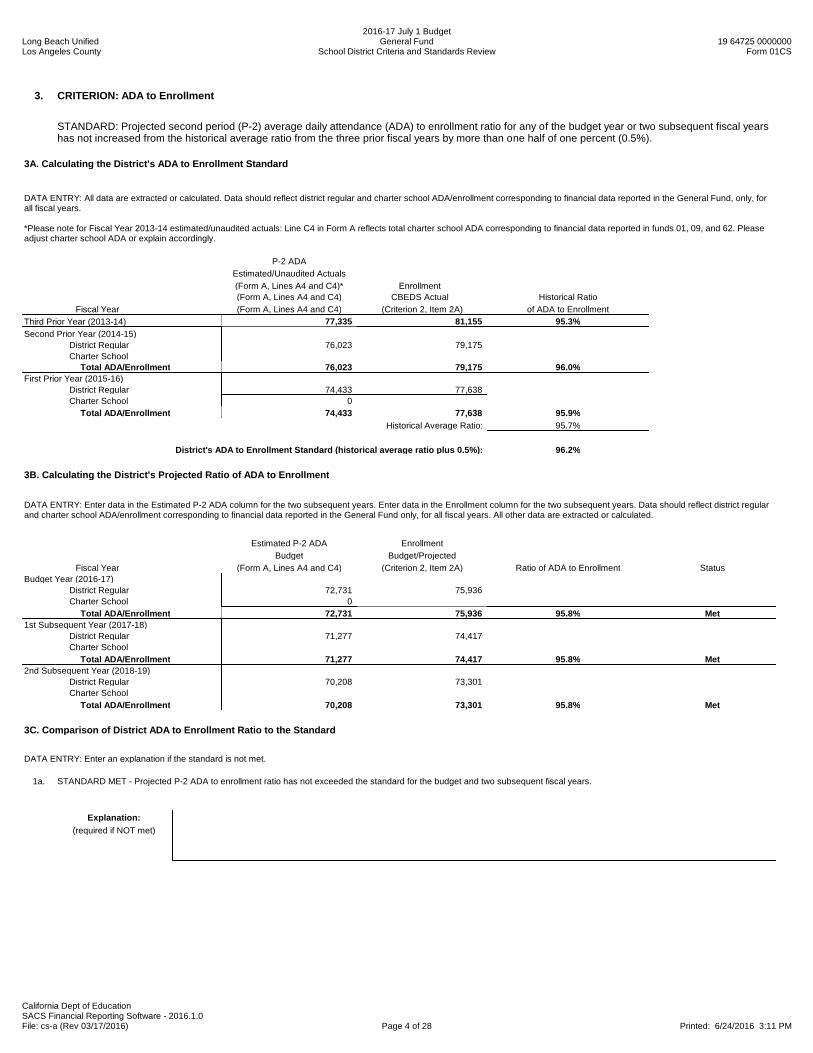
Long Beach UnifiedLos Angeles County
2016-17 July 1 BudgetGeneral Fund
School District Criteria and Standards Review19 64725 0000000
Form 01CS
California Dept of EducationSACS Financial Reporting Software - 2016.1.0File: cs-a (Rev 03/17/2016) Page 4 of 28 Printed: 6/24/2016 3:11 PM
3. CRITERION: ADA to Enrollment
STANDARD: Projected second period (P-2) average daily attendance (ADA) to enrollment ratio for any of the budget year or two subsequent fiscal yearshas not increased from the historical average ratio from the three prior fiscal years by more than one half of one percent (0.5%).
3A. Calculating the District's ADA to Enrollment Standard
DATA ENTRY: All data are extracted or calculated. Data should reflect district regular and charter school ADA/enrollment corresponding to financial data reported in the General Fund, only, forall fiscal years.
*Please note for Fiscal Year 2013-14 estimated/unaudited actuals: Line C4 in Form A reflects total charter school ADA corresponding to financial data reported in funds 01, 09, and 62. Pleaseadjust charter school ADA or explain accordingly.
P-2 ADAEstimated/Unaudited Actuals(Form A, Lines A4 and C4)* Enrollment (Form A, Lines A4 and C4) CBEDS Actual Historical Ratio
Fiscal Year (Form A, Lines A4 and C4) (Criterion 2, Item 2A) of ADA to EnrollmentThird Prior Year (2013-14) 77,335 81,155 95.3%Second Prior Year (2014-15)
District Regular 76,023 79,175 Charter School
Total ADA/Enrollment 76,023 79,175 96.0%First Prior Year (2015-16)
District Regular 74,433 77,638 Charter School 0
Total ADA/Enrollment 74,433 77,638 95.9%Historical Average Ratio: 95.7%
District's ADA to Enrollment Standard (historical average ratio plus 0.5%): 96.2%
3B. Calculating the District's Projected Ratio of ADA to Enrollment
DATA ENTRY: Enter data in the Estimated P-2 ADA column for the two subsequent years. Enter data in the Enrollment column for the two subsequent years. Data should reflect district regularand charter school ADA/enrollment corresponding to financial data reported in the General Fund only, for all fiscal years. All other data are extracted or calculated.
Estimated P-2 ADA EnrollmentBudget Budget/Projected
Fiscal Year (Form A, Lines A4 and C4) (Criterion 2, Item 2A) Ratio of ADA to Enrollment StatusBudget Year (2016-17)
District Regular 72,731 75,936 Charter School 0
Total ADA/Enrollment 72,731 75,936 95.8% Met1st Subsequent Year (2017-18)
District Regular 71,277 74,417 Charter School
Total ADA/Enrollment 71,277 74,417 95.8% Met2nd Subsequent Year (2018-19)
District Regular 70,208 73,301 Charter School
Total ADA/Enrollment 70,208 73,301 95.8% Met
3C. Comparison of District ADA to Enrollment Ratio to the Standard
DATA ENTRY: Enter an explanation if the standard is not met.
1a. STANDARD MET - Projected P-2 ADA to enrollment ratio has not exceeded the standard for the budget and two subsequent fiscal years.
Explanation:(required if NOT met)

Long Beach UnifiedLos Angeles County
2016-17 July 1 BudgetGeneral Fund
School District Criteria and Standards Review19 64725 0000000
Form 01CS
California Dept of EducationSACS Financial Reporting Software - 2016.1.0File: cs-a (Rev 03/17/2016) Page 5 of 28 Printed: 6/24/2016 3:11 PM
4. CRITERION: LCFF Revenue
STANDARD: Projected local control funding formula (LCFF) revenue for any of the budget year or two subsequent fiscal years has not changed from theprior fiscal year by more than the change in population, plus the district's gap funding or cost-of-living adjustment (COLA)¹ and its economic recoverytarget payment, plus or minus one percent.
For basic aid districts, projected LCFF revenue has not changed from the prior fiscal year by more than the percent change in property tax revenues plusor minus one percent.
For districts funded by necessary small school formulas, projected LCFF revenue has not changed from the prior fiscal year amount by more than thedistrict's gap funding or COLA¹ and its economic recovery target payment, plus or minus one percent.
¹Districts that are already at or above their LCFF target funding as described in Education Code Section 42238.03(d) receive no gap funding. These districts have a COLA applied totheir LCFF target, but their year-over-year revenue increase might be less than the statutory COLA due to certain local factors and components of the funding formula.
4A. District's LCFF Revenue Standard
Indicate which standard applies:
LCFF Revenue
Basic Aid
Necessary Small School
The District must select which LCFF revenue standard applies.LCFF Revenue Standard selected: LCFF Revenue
4A1. Calculating the District's LCFF Revenue Standard
DATA ENTRY: Enter LCFF Target amounts for the budget and two subsequent fiscal years.Enter data in Step 1a for the two subsequent fiscal years. All other data is extracted or calculated.Enter data for Steps 2a through 2d. All other data is calculated.
Projected LCFF Revenue
Has the District reached its LCFFIf Yes, then COLA amount in Line 2b2 is used in Line 2e Total calculation.If No, then Gap Funding in Line 2c is used in Line 2e Total calculation.
target funding level? No
Budget Year 1st Subsequent Year 2nd Subsequent Year(2016-17) (2017-18) (2018-19)
LCFF Target (Reference Only) 744,605,397.00 727,204,811.00 718,293,480.00
Prior Year Budget Year 1st Subsequent Year 2nd Subsequent YearStep 1 - Change in Population (2015-16) (2016-17) (2017-18) (2018-19)
a. ADA (Funded)(Form A, lines A6 and C4) 76,055.63 74,458.10 72,727.03 71,277.30
b. Prior Year ADA (Funded) 76,055.63 74,458.10 72,727.03c. Difference (Step 1a minus Step 1b) (1,597.53) (1,731.07) (1,449.73)d. Percent Change Due to Population
(Step 1c divided by Step 1b) -2.10% -2.32% -1.99%
Step 2 - Change in Funding Level a. Prior Year LCFF Funding 693,727,961.00 707,931,376.00 705,951,728.00b1. COLA percentage (if district is at target) Not Applicableb2. COLA amount (proxy for purposes of this
criterion) Not Applicable 0.00 0.00 0.00c. Gap Funding (if district is not at target) 0.55 0.74 0.41d. Economic Recovery Target Funding
(current year increment)
e. Total (Lines 2b2 or 2c, as applicable, plus Line 2d) 0.55 0.74 0.41f. Percent Change Due to Funding Level
(Step 2e divided by Step 2a) 0.00% 0.00% 0.00%
Step 3 - Total Change in Population and Funding Level(Step 1d plus Step 2f) -2.10% -2.32% -1.99%
LCFF Revenue Standard (Step 3, plus/minus 1%): -3.10% to -1.10% -3.32% to -1.32% -2.99% to -.99%
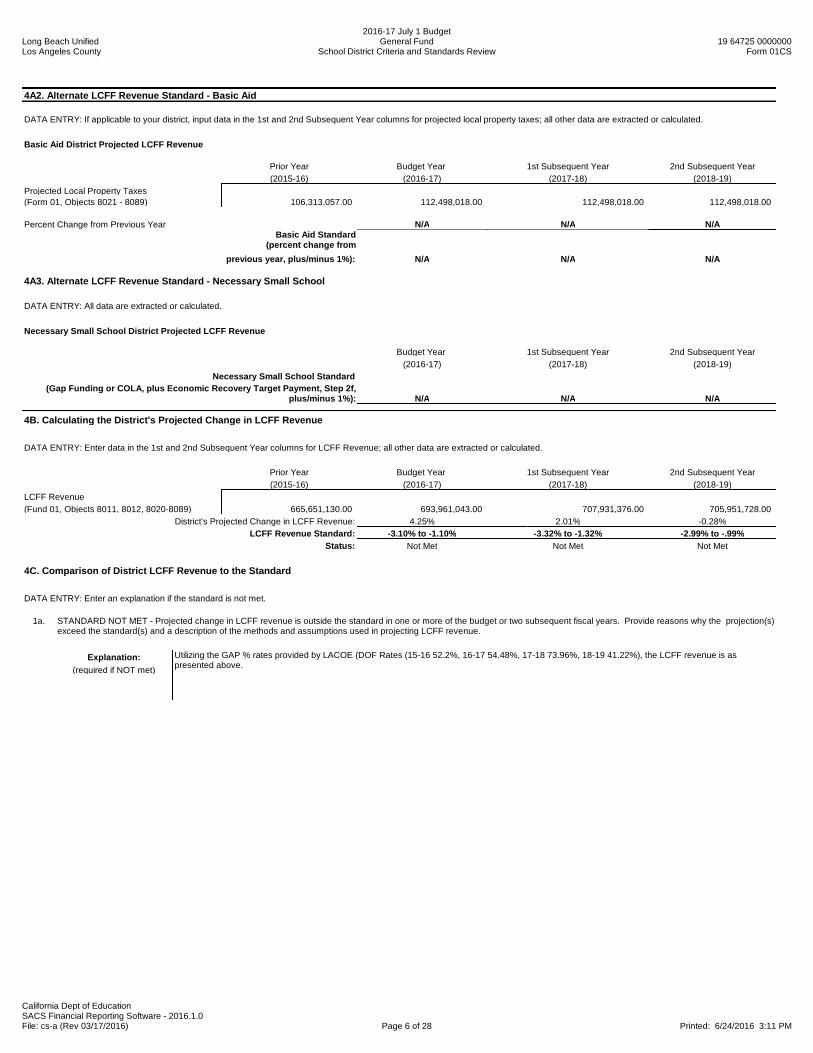
Long Beach UnifiedLos Angeles County
2016-17 July 1 BudgetGeneral Fund
School District Criteria and Standards Review19 64725 0000000
Form 01CS
California Dept of EducationSACS Financial Reporting Software - 2016.1.0File: cs-a (Rev 03/17/2016) Page 6 of 28 Printed: 6/24/2016 3:11 PM
4A2. Alternate LCFF Revenue Standard - Basic Aid
DATA ENTRY: If applicable to your district, input data in the 1st and 2nd Subsequent Year columns for projected local property taxes; all other data are extracted or calculated.
Basic Aid District Projected LCFF Revenue
Prior Year Budget Year 1st Subsequent Year 2nd Subsequent Year(2015-16) (2016-17) (2017-18) (2018-19)
Projected Local Property Taxes(Form 01, Objects 8021 - 8089) 106,313,057.00 112,498,018.00 112,498,018.00 112,498,018.00
Percent Change from Previous Year N/A N/A N/ABasic Aid Standard
(percent change fromprevious year, plus/minus 1%): N/A N/A N/A
4A3. Alternate LCFF Revenue Standard - Necessary Small School
DATA ENTRY: All data are extracted or calculated.
Necessary Small School District Projected LCFF Revenue
Budget Year 1st Subsequent Year 2nd Subsequent Year(2016-17) (2017-18) (2018-19)
Necessary Small School Standard(Gap Funding or COLA, plus Economic Recovery Target Payment, Step 2f,
plus/minus 1%): N/A N/A N/A
4B. Calculating the District's Projected Change in LCFF Revenue
DATA ENTRY: Enter data in the 1st and 2nd Subsequent Year columns for LCFF Revenue; all other data are extracted or calculated.
Prior Year Budget Year 1st Subsequent Year 2nd Subsequent Year(2015-16) (2016-17) (2017-18) (2018-19)
LCFF Revenue(Fund 01, Objects 8011, 8012, 8020-8089) 665,651,130.00 693,961,043.00 707,931,376.00 705,951,728.00
District's Projected Change in LCFF Revenue: 4.25% 2.01% -0.28%LCFF Revenue Standard: -3.10% to -1.10% -3.32% to -1.32% -2.99% to -.99%
Status: Not Met Not Met Not Met
4C. Comparison of District LCFF Revenue to the Standard
DATA ENTRY: Enter an explanation if the standard is not met.
1a. STANDARD NOT MET - Projected change in LCFF revenue is outside the standard in one or more of the budget or two subsequent fiscal years. Provide reasons why the projection(s)exceed the standard(s) and a description of the methods and assumptions used in projecting LCFF revenue.
Explanation:(required if NOT met)
Utilizing the GAP % rates provided by LACOE (DOF Rates (15-16 52.2%, 16-17 54.48%, 17-18 73.96%, 18-19 41.22%), the LCFF revenue is aspresented above.

Long Beach UnifiedLos Angeles County
2016-17 July 1 BudgetGeneral Fund
School District Criteria and Standards Review19 64725 0000000
Form 01CS
California Dept of EducationSACS Financial Reporting Software - 2016.1.0File: cs-a (Rev 03/17/2016) Page 7 of 28 Printed: 6/24/2016 3:11 PM
5. CRITERION: Salaries and Benefits
STANDARD: Projected ratio of total unrestricted salaries and benefits to total unrestricted general fund expenditures for any of the budget year or twosubsequent fiscal years has not changed from the historical average ratio from the three prior fiscal years by more than the greater of three percent or thedistrict's required reserves percentage.
It is likely that for many districts the 2014-15 and 2015-16 change from the historical average ratio will exceed the standard because certain revenues thatwere restricted prior to the LCFF are now unrestricted within the LCFF.
5A. Calculating the District's Historical Average Ratio of Unrestricted Salaries and Benefits to Total Unrestricted General Fund Expenditures
DATA ENTRY: All data are extracted or calculated.
Estimated/Unaudited Actuals - Unrestricted(Resources 0000-1999) Ratio
Salaries and Benefits Total Expenditures of Unrestricted Salaries and BenefitsFiscal Year (Form 01, Objects 1000-3999) (Form 01, Objects 1000-7499) to Total Unrestricted Expenditures
Third Prior Year (2013-14) 432,596,790.10 465,443,823.20 92.9%Second Prior Year (2014-15) 466,323,155.90 513,809,749.37 90.8%First Prior Year (2015-16) 502,508,332.00 564,792,662.00 89.0%
Historical Average Ratio: 90.9%
Budget Year 1st Subsequent Year 2nd Subsequent Year(2016-17) (2017-18) (2018-19)
District's Reserve Standard Percentage(Criterion 10B, Line 4): 2.0% 2.0% 2.0%
District's Salaries and Benefits Standard(historical average ratio, plus/minus the greater
of 3% or the district's reserve standard percentage): 87.9% to 93.9% 87.9% to 93.9% 87.9% to 93.9%
5B. Calculating the District's Projected Ratio of Unrestricted Salaries and Benefits to Total Unrestricted General Fund Expenditures
DATA ENTRY: If Form MYP exists, Unrestricted Salaries and Benefits, and Total Unrestricted Expenditures data for the 1st and 2nd Subsequent Years will be extracted; if not, enter data for the two subsequent years. All other data are extracted or calculated.
Budget - Unrestricted(Resources 0000-1999)
Salaries and Benefits Total Expenditures Ratio(Form 01, Objects 1000-3999) (Form 01, Objects 1000-7499) of Unrestricted Salaries and Benefits
Fiscal Year (Form MYP, Lines B1-B3) (Form MYP, Lines B1-B8, B10) to Total Unrestricted Expenditures StatusBudget Year (2016-17) 516,719,517.00 603,808,147.00 85.6% Not Met1st Subsequent Year (2017-18) 541,385,487.00 616,774,908.00 87.8% Not Met2nd Subsequent Year (2018-19) 551,219,160.00 620,593,459.00 88.8% Met
5C. Comparison of District Salaries and Benefits Ratio to the Standard
DATA ENTRY: Enter an explanation if the standard is not met.
1a. STANDARD NOT MET - Projected ratio(s) of unrestricted salary and benefit costs to total unrestricted expenditures are outside the standard in one or more of the budget or twosubsequent fiscal years. Provide reasons why the projection(s) exceed the standard, a description of the methods and assumptions used in projecting salaries and benefits, and whatchanges, if any, will be made to bring the projected salary and benefit costs within the standard.
Explanation:(required if NOT met)
There are undetermined additional staffing needs for 16-17 and these funds are budgeted in non-salary objects. In addition textbooks adoptions in 2016-17 are quite large causing a one time fluctuation in the total non-salary expenditures.
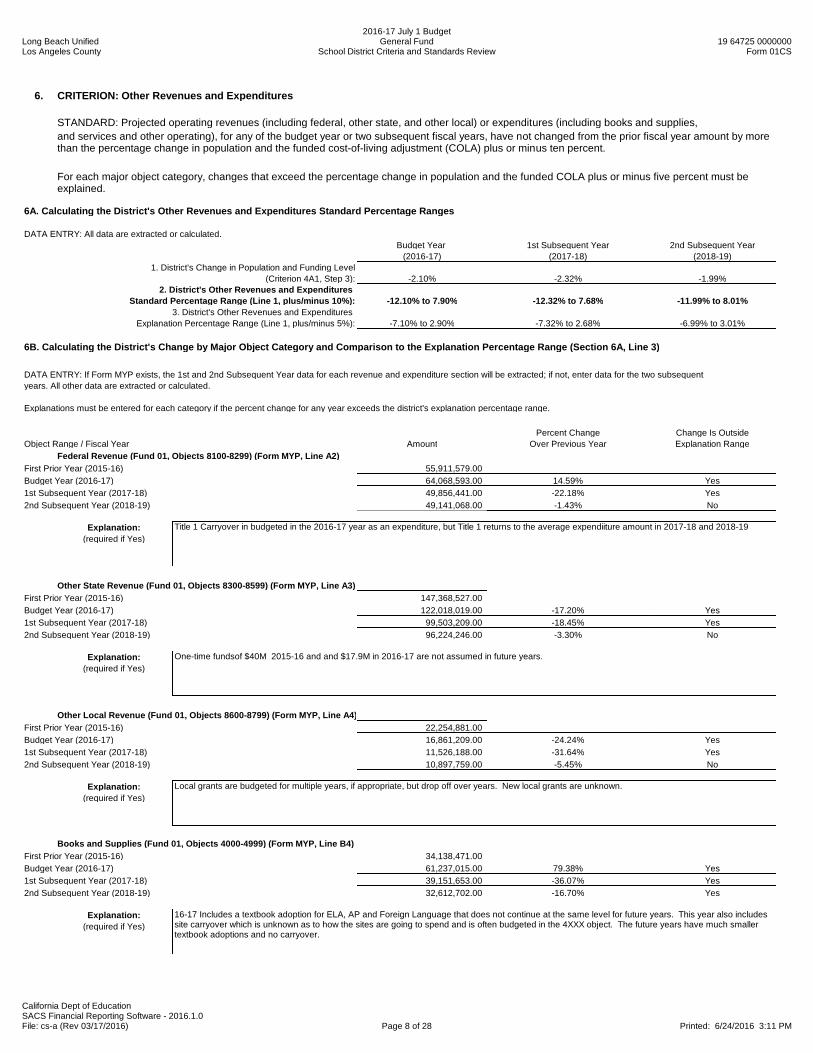
Long Beach UnifiedLos Angeles County
2016-17 July 1 BudgetGeneral Fund
School District Criteria and Standards Review19 64725 0000000
Form 01CS
California Dept of EducationSACS Financial Reporting Software - 2016.1.0File: cs-a (Rev 03/17/2016) Page 8 of 28 Printed: 6/24/2016 3:11 PM
6. CRITERION: Other Revenues and Expenditures
STANDARD: Projected operating revenues (including federal, other state, and other local) or expenditures (including books and supplies,and services and other operating), for any of the budget year or two subsequent fiscal years, have not changed from the prior fiscal year amount by morethan the percentage change in population and the funded cost-of-living adjustment (COLA) plus or minus ten percent.
For each major object category, changes that exceed the percentage change in population and the funded COLA plus or minus five percent must beexplained.
6A. Calculating the District's Other Revenues and Expenditures Standard Percentage Ranges
DATA ENTRY: All data are extracted or calculated.Budget Year 1st Subsequent Year 2nd Subsequent Year
(2016-17) (2017-18) (2018-19)1. District's Change in Population and Funding Level
(Criterion 4A1, Step 3): -2.10% -2.32% -1.99%2. District's Other Revenues and Expenditures
Standard Percentage Range (Line 1, plus/minus 10%): -12.10% to 7.90% -12.32% to 7.68% -11.99% to 8.01%3. District's Other Revenues and Expenditures
Explanation Percentage Range (Line 1, plus/minus 5%): -7.10% to 2.90% -7.32% to 2.68% -6.99% to 3.01%
6B. Calculating the District's Change by Major Object Category and Comparison to the Explanation Percentage Range (Section 6A, Line 3)
DATA ENTRY: If Form MYP exists, the 1st and 2nd Subsequent Year data for each revenue and expenditure section will be extracted; if not, enter data for the two subsequent years. All other data are extracted or calculated.
Explanations must be entered for each category if the percent change for any year exceeds the district's explanation percentage range.
Percent Change Change Is OutsideObject Range / Fiscal Year Amount Over Previous Year Explanation Range
Federal Revenue (Fund 01, Objects 8100-8299) (Form MYP, Line A2)First Prior Year (2015-16) 55,911,579.00Budget Year (2016-17) 64,068,593.00 14.59% Yes1st Subsequent Year (2017-18) 49,856,441.00 -22.18% Yes2nd Subsequent Year (2018-19) 49,141,068.00 -1.43% No
Explanation:(required if Yes)
Title 1 Carryover in budgeted in the 2016-17 year as an expenditure, but Title 1 returns to the average expendiiture amount in 2017-18 and 2018-19
Other State Revenue (Fund 01, Objects 8300-8599) (Form MYP, Line A3)First Prior Year (2015-16) 147,368,527.00Budget Year (2016-17) 122,018,019.00 -17.20% Yes1st Subsequent Year (2017-18) 99,503,209.00 -18.45% Yes2nd Subsequent Year (2018-19) 96,224,246.00 -3.30% No
Explanation:(required if Yes)
One-time fundsof $40M 2015-16 and and $17.9M in 2016-17 are not assumed in future years.
Other Local Revenue (Fund 01, Objects 8600-8799) (Form MYP, Line A4)First Prior Year (2015-16) 22,254,881.00Budget Year (2016-17) 16,861,209.00 -24.24% Yes1st Subsequent Year (2017-18) 11,526,188.00 -31.64% Yes2nd Subsequent Year (2018-19) 10,897,759.00 -5.45% No
Explanation:(required if Yes)
Local grants are budgeted for multiple years, if appropriate, but drop off over years. New local grants are unknown.
Books and Supplies (Fund 01, Objects 4000-4999) (Form MYP, Line B4)First Prior Year (2015-16) 34,138,471.00Budget Year (2016-17) 61,237,015.00 79.38% Yes1st Subsequent Year (2017-18) 39,151,653.00 -36.07% Yes2nd Subsequent Year (2018-19) 32,612,702.00 -16.70% Yes
Explanation:(required if Yes)
16-17 Includes a textbook adoption for ELA, AP and Foreign Language that does not continue at the same level for future years. This year also includessite carryover which is unknown as to how the sites are going to spend and is often budgeted in the 4XXX object. The future years have much smallertextbook adoptions and no carryover.

Long Beach UnifiedLos Angeles County
2016-17 July 1 BudgetGeneral Fund
School District Criteria and Standards Review19 64725 0000000
Form 01CS
California Dept of EducationSACS Financial Reporting Software - 2016.1.0File: cs-a (Rev 03/17/2016) Page 9 of 28 Printed: 6/24/2016 3:11 PM
Services and Other Operating Expenditures (Fund 01, Objects 5000-5999) (Form MYP, Line B5)First Prior Year (2015-16) 96,634,290.00Budget Year (2016-17) 100,834,601.00 4.35% Yes1st Subsequent Year (2017-18) 92,089,286.00 -8.67% Yes2nd Subsequent Year (2018-19) 90,474,949.00 -1.75% No
Explanation:(required if Yes)
Additional Services that are related to Supplemental and concenttration expenditures from LCAP; such as AP test fees.
6C. Calculating the District's Change in Total Operating Revenues and Expenditures (Section 6A, Line 2)
DATA ENTRY: All data are extracted or calculated.
Percent ChangeObject Range / Fiscal Year Amount Over Previous Year Status
Total Federal, Other State, and Other Local Revenue (Criterion 6B)First Prior Year (2015-16) 225,534,987.00Budget Year (2016-17) 202,947,821.00 -10.01% Met1st Subsequent Year (2017-18) 160,885,838.00 -20.73% Not Met2nd Subsequent Year (2018-19) 156,263,073.00 -2.87% Met
Total Books and Supplies, and Services and Other Operating Expenditures (Criterion 6B)First Prior Year (2015-16) 130,772,761.00Budget Year (2016-17) 162,071,616.00 23.93% Not Met1st Subsequent Year (2017-18) 131,240,939.00 -19.02% Not Met2nd Subsequent Year (2018-19) 123,087,651.00 -6.21% Met
6D. Comparison of District Total Operating Revenues and Expenditures to the Standard Percentage Range
DATA ENTRY: Explanations are linked from Section 6B if the status in Section 6C is not met; no entry is allowed below.
1a. STANDARD NOT MET - Projected total operating revenues have changed by more than the standard in one or more of the budget or two subsequent fiscal years. Reasons for theprojected change, descriptions of the methods and assumptions used in the projections, and what changes, if any, will be made to bring the projected operating revenues within thestandard must be entered in Section 6A above and will also display in the explanation box below.
Explanation:Federal Revenue(linked from 6B
if NOT met)
Title 1 Carryover in budgeted in the 2016-17 year as an expenditure, but Title 1 returns to the average expendiiture amount in 2017-18 and 2018-19
Explanation:Other State Revenue
(linked from 6B if NOT met)
One-time fundsof $40M 2015-16 and and $17.9M in 2016-17 are not assumed in future years.
Explanation:Other Local Revenue
(linked from 6B if NOT met)
Local grants are budgeted for multiple years, if appropriate, but drop off over years. New local grants are unknown.
1b. STANDARD NOT MET - Projected total operating expenditures have changed by more than the standard in one or more of the budget or two subsequent fiscal years. Reasons for theprojected change, descriptions of the methods and assumptions used in the projections, and what changes, if any, will be made to bring the projected operating expenditures within thestandard must be entered in Section 6A above and will also display in the explanation box below.
Explanation:Books and Supplies
(linked from 6B if NOT met)
16-17 Includes a textbook adoption for ELA, AP and Foreign Language that does not continue at the same level for future years. This year also includessite carryover which is unknown as to how the sites are going to spend and is often budgeted in the 4XXX object. The future years have much smallertextbook adoptions and no carryover.
Explanation:Services and Other Exps
(linked from 6B if NOT met)
Additional Services that are related to Supplemental and concenttration expenditures from LCAP; such as AP test fees.

Long Beach UnifiedLos Angeles County
2016-17 July 1 BudgetGeneral Fund
School District Criteria and Standards Review19 64725 0000000
Form 01CS
California Dept of EducationSACS Financial Reporting Software - 2016.1.0File: cs-a (Rev 03/17/2016) Page 10 of 28 Printed: 6/24/2016 3:11 PM
7. CRITERION: Facilities Maintenance
STANDARD: Confirm that the annual contribution for facilities maintenance funding is not less than the amount required pursuant to Education CodeSection 17070.75, if applicable, and that the district is providing adequately to preserve the functionality of its facilities for their normal life in accordancewith Education Code sections 52060(d)(1) and 17002(d)(1).
Determining the District's Compliance with the Contribution Requirement for EC Section 17070.75 as amended by AB 104 (Chapter 13, Statutes of 2015), effective2015-16 and 2016-17 - Ongoing and Major Maintenance/Restricted Maintenance Account (OMMA/RMA)
NOTE: AB 104 (Chapter 13, Statutes of 2015) requires the district to deposit into the account, for the 2015-16 and 2016-17 fiscal years, a minimum amount that is the lesser of 3% of the totalgeneral fund expenditures and other financing uses for that fiscal year or the amount that the district deposited into the account for the 2014-15 fiscal year.
DATA ENTRY: Click the appropriate Yes or No button for special education local plan area (SELPA) administrative units (AUs); all other data are extracted or calculated. If standard is not met,enter an X in the appropriate box and enter an explanation, if applicable.
1. a. For districts that are the AU of a SELPA, do you choose to exclude revenues that are passed through to participating members of the SELPA from the OMMA/RMA required minimum contribution calculation? No
b. Pass-through revenues and apportionments that may be excluded from the OMMA/RMA calculation per EC Section 17070.75(b)(2)(D) (Fund 10, resources 3300-3499 and 6500-6540, objects 7211-7213 and 7221-7223) 0.00
2. Ongoing and Major Maintenance/Restricted Maintenance Account
a. Budgeted Expenditures and Other Financing Uses (Form 01, objects 1000-7999) 882,047,251.00 3% of Total Current Year Requiredb. Plus: Pass-through Revenues General Fund Expenditures Minimum Contribution/ and Apportionments and Other Financing Uses Amount Deposited¹ Lesser of Current Year or (Line 1b, if line 1a is No) 0.00 (Line 2c times 3%) for 2014-15 Fiscal Year 2014-15 Fiscal Yearc. Net Budgeted Expenditures and Other Financing Uses 882,047,251.00 26,461,417.53 11,606,808.97 11,606,808.97
Budgeted Contribution ¹to the Ongoing and Major
Maintenance Account Status
d. OMMA/RMA Contribution 16,462,597.00 Met
¹ Fund 01, Resource 8150, Objects 8900-8999
If standard is not met, enter an X in the box that best describes why the minimum required contribution was not made:
Not applicable (district does not participate in the Leroy F. Greene School Facilities Act of 1998) Exempt (due to district's small size [EC Section 17070.75 (b)(2)(E)]) Other (explanation must be provided)
Explanation:(required if NOT metand Other is marked)

Long Beach UnifiedLos Angeles County
2016-17 July 1 BudgetGeneral Fund
School District Criteria and Standards Review19 64725 0000000
Form 01CS
California Dept of EducationSACS Financial Reporting Software - 2016.1.0File: cs-a (Rev 03/17/2016) Page 11 of 28 Printed: 6/24/2016 3:11 PM
8. CRITERION: Deficit Spending
STANDARD: Unrestricted deficit spending (total unrestricted expenditures and other financing uses is greater than total unrestricted revenues and otherfinancing sources) as a percentage of total unrestricted expenditures and other financing uses, has not exceeded one-third of the district's availablereserves¹ as a percentage of total expenditures and other financing uses² in two out of three prior fiscal years.
8A. Calculating the District's Deficit Spending Standard Percentage Levels
DATA ENTRY: All data are extracted or calculated.Third Prior Year Second Prior Year First Prior Year
(2013-14) (2014-15) (2015-16)1. District's Available Reserve Amounts (resources 0000-1999)
a. Reserve for Economic Uncertainties (Funds 01 and 17, Object 9789) 13,501,493.00 15,236,698.00 16,644,060.00b. Unassigned/Unappropriated (Funds 01 and 17, Object 9790) 0.00 66,653,076.80 75,225,317.83c. Negative General Fund Ending Balances in Restricted Resources (Fund 01, Object 979Z, if negative, for each of resources 2000-9999) (0.50) (0.50) (1.97)d. Available Reserves (Lines 1a through 1c) 13,501,492.50 81,889,774.30 91,869,375.86
2. Expenditures and Other Financing Usesa. District's Total Expenditures and Other Financing Uses (Fund 01, objects 1000-7999) 675,074,605.43 761,834,879.18 832,203,004.00b. Plus: Special Education Pass-through Funds (Fund 10, resources 3300-3499 and 6500-6540, objects 7211-7213 and 7221-7223) 0.00c. Total Expenditures and Other Financing Uses (Line 2a plus Line 2b) 675,074,605.43 761,834,879.18 832,203,004.00
3. District's Available Reserve Percentage(Line 1d divided by Line 2c) 2.0% 10.7% 11.0%
District's Deficit Spending Standard Percentage Levels(Line 3 times 1/3): 0.7% 3.6% 3.7%
¹Available reserves are the unrestricted amounts in the Reserve for Economic Uncertaintiesand the Unassigned/Unappropriated accounts in the General Fund and the Special ReserveFund for Other Than Capital Outlay Projects. Available reserves will be reduced by any negativeending balances in restricted resources in the General Fund.
²A school district that is the Administrative Unit of a Special Education Local Plan Area (SELPA)may exclude from its expenditures the distribution of funds to its participating members.
8B. Calculating the District's Deficit Spending Percentages
DATA ENTRY: All data are extracted or calculated.
Net Change in Total Unrestricted Expenditures Deficit Spending LevelUnrestricted Fund Balance and Other Financing Uses (If Net Change in Unrestricted Fund
Fiscal Year (Form 01, Section E) (Form 01, Objects 1000-7999) Balance is negative, else N/A) StatusThird Prior Year (2013-14) (3,346,356.54) 470,122,338.01 0.7% MetSecond Prior Year (2014-15) 13,717,199.96 520,058,546.15 N/A MetFirst Prior Year (2015-16) 63,260,949.00 568,792,662.00 N/A MetBudget Year (2016-17) (Information only) 19,457,710.00 607,808,147.00
8C. Comparison of District Deficit Spending to the Standard
DATA ENTRY: Enter an explanation if the standard is not met.
1a. STANDARD MET - Unrestricted deficit spending, if any, has not exceeded the standard percentage level in two or more of the three prior years.
Explanation:(required if NOT met)
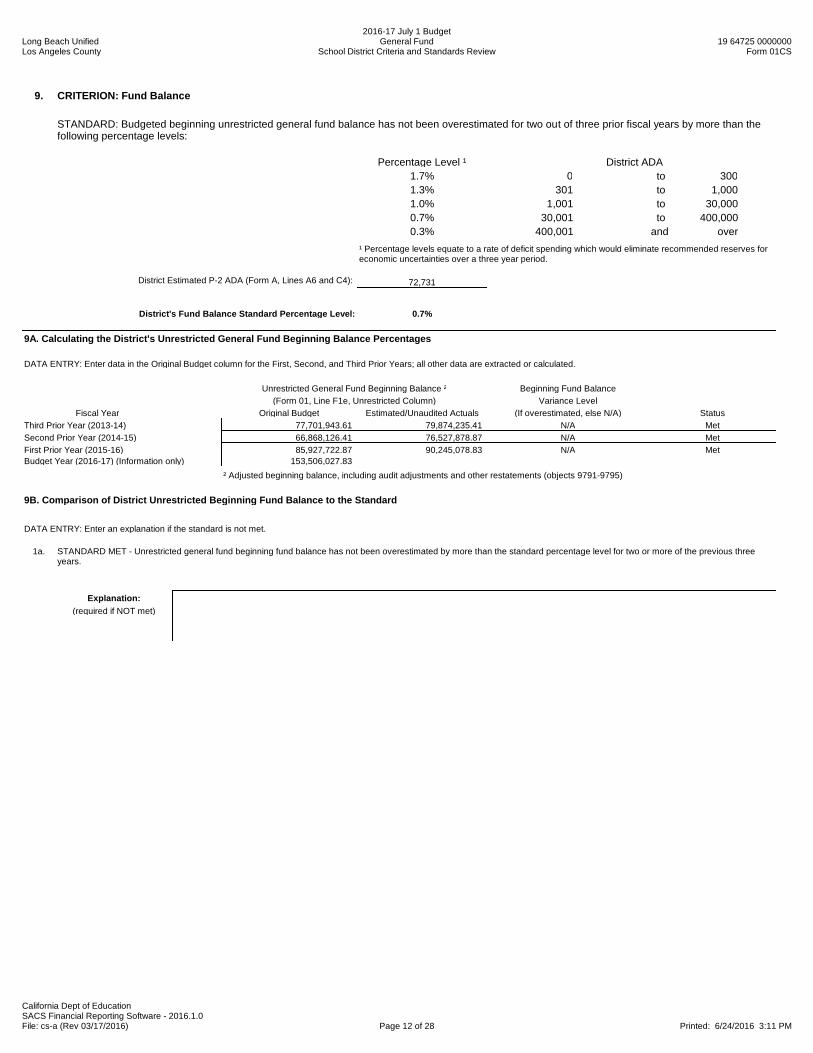
Long Beach UnifiedLos Angeles County
2016-17 July 1 BudgetGeneral Fund
School District Criteria and Standards Review19 64725 0000000
Form 01CS
California Dept of EducationSACS Financial Reporting Software - 2016.1.0File: cs-a (Rev 03/17/2016) Page 12 of 28 Printed: 6/24/2016 3:11 PM
9. CRITERION: Fund Balance
STANDARD: Budgeted beginning unrestricted general fund balance has not been overestimated for two out of three prior fiscal years by more than thefollowing percentage levels:
Percentage Level ¹ District ADA 1.7% 0 to 3001.3% 301 to 1,0001.0% 1,001 to 30,0000.7% 30,001 to 400,0000.3% 400,001 and over
¹ Percentage levels equate to a rate of deficit spending which would eliminate recommended reserves foreconomic uncertainties over a three year period.
District Estimated P-2 ADA (Form A, Lines A6 and C4): 72,731
District's Fund Balance Standard Percentage Level: 0.7%
9A. Calculating the District's Unrestricted General Fund Beginning Balance Percentages
DATA ENTRY: Enter data in the Original Budget column for the First, Second, and Third Prior Years; all other data are extracted or calculated.
Unrestricted General Fund Beginning Balance ² Beginning Fund Balance(Form 01, Line F1e, Unrestricted Column) Variance Level
Fiscal Year Original Budget Estimated/Unaudited Actuals (If overestimated, else N/A) StatusThird Prior Year (2013-14) 77,701,943.61 79,874,235.41 N/A MetSecond Prior Year (2014-15) 66,868,126.41 76,527,878.87 N/A MetFirst Prior Year (2015-16) 85,927,722.87 90,245,078.83 N/A MetBudget Year (2016-17) (Information only) 153,506,027.83
² Adjusted beginning balance, including audit adjustments and other restatements (objects 9791-9795)
9B. Comparison of District Unrestricted Beginning Fund Balance to the Standard
DATA ENTRY: Enter an explanation if the standard is not met.
1a. STANDARD MET - Unrestricted general fund beginning fund balance has not been overestimated by more than the standard percentage level for two or more of the previous threeyears.
Explanation:(required if NOT met)

Long Beach UnifiedLos Angeles County
2016-17 July 1 BudgetGeneral Fund
School District Criteria and Standards Review19 64725 0000000
Form 01CS
California Dept of EducationSACS Financial Reporting Software - 2016.1.0File: cs-a (Rev 03/17/2016) Page 13 of 28 Printed: 6/24/2016 3:11 PM
10. CRITERION: Reserves
STANDARD: Available reserves¹ for any of the budget year or two subsequent fiscal years are not less than the following percentages or amounts² asapplied to total expenditures and other financing uses³:
DATA ENTRY: Budget Year data are extracted. Enter district regular ADA corresponding to financial data reported in the General Fund, only, for the twosubsequent years.
Percentage Level District ADA 5% or $66,000 (greater of) 0 to 3004% or $66,000 (greater of) 301 to 1,000
3% 1,001 to 30,0002% 30,001 to 400,0001% 400,001 and over
¹ Available reserves are the unrestricted amounts in the Reserve for Economic Uncertainties and theUnassigned/Unappropriated accounts in the General Fund and the Special Reserve Fund for Other ThanCapital Outlay Projects. Available reserves will be reduced by any negative ending balances in restrictedresources in the General Fund.² Dollar amounts to be adjusted annually by the prior year statutory cost-of-living adjustment (EducationCode Section 42238), rounded to the nearest thousand.
³ A school district that is the Administrative Unit (AU) of a Special Education Local Plan Area (SELPA) mayexclude from its expenditures the distribution of funds to its participating members.
Budget Year 1st Subsequent Year 2nd Subsequent Year(2016-17) (2017-18) (2018-19)
District Estimated P-2 ADA (Form A, Line A4): 72,731 71,277 70,208
District's Reserve Standard Percentage Level: 2% 2% 2%
10A. Calculating the District's Special Education Pass-through Exclusions (only for districts that serve as the AU of a SELPA)
DATA ENTRY: For SELPA AUs, if Form MYP exists, all data will be extracted including the Yes/No button selection. If not, click the appropriate Yes or No button for item 1 and, if Yes, enter data for item 2a and for the two subsequent years in item 2b; Budget Year data are extracted.
For districts that serve as the AU of a SELPA (Form MYP, Lines F1a, F1b1, and F1b2):
1. Do you choose to exclude from the reserve calculation the pass-through funds distributed to SELPA members? No2. If you are the SELPA AU and are excluding special education pass-through funds:
a. Enter the name(s) of the SELPA(s):
Budget Year 1st Subsequent Year 2nd Subsequent Year(2016-17) (2017-18) (2018-19)
b. Special Education Pass-through Funds (Fund 10, resources 3300-3499 and 6500-6540, objects 7211-7213 and 7221-7223) 0.00 0.00 0.00
10B. Calculating the District's Reserve Standard
DATA ENTRY: If Form MYP exists, 1st and 2nd Subsequent Year data for lines 1 and 2 will be extracted; if not, enter data for the two subsequent years. All other data are extracted or calculated.
Budget Year 1st Subsequent Year 2nd Subsequent Year(2016-17) (2017-18) (2018-19)
1. Expenditures and Other Financing Uses(Fund 01, objects 1000-7999) (Form MYP, Line B11) 882,047,251.00 871,732,123.00 875,544,916.00
2. Plus: Special Education Pass-through(Criterion 10A, Line 2b, if Criterion 10A, Line 1 is No) 0.00 0.00 0.00
3. Total Expenditures and Other Financing Uses(Line B1 plus Line B2) 882,047,251.00 871,732,123.00 875,544,916.00
4. Reserve Standard Percentage Level 2% 2% 2%5. Reserve Standard - by Percent
(Line B3 times Line B4) 17,640,945.02 17,434,642.46 17,510,898.326. Reserve Standard - by Amount
($66,000 for districts with 0 to 1,000 ADA, else 0) 0.00 0.00 0.007. District's Reserve Standard
(Greater of Line B5 or Line B6) 17,640,945.02 17,434,642.46 17,510,898.32

Long Beach UnifiedLos Angeles County
2016-17 July 1 BudgetGeneral Fund
School District Criteria and Standards Review19 64725 0000000
Form 01CS
California Dept of EducationSACS Financial Reporting Software - 2016.1.0File: cs-a (Rev 03/17/2016) Page 14 of 28 Printed: 6/24/2016 3:11 PM
10C. Calculating the District's Budgeted Reserve Amount
DATA ENTRY: If Form MYP exists, 1st and 2nd Subsequent Year data for lines 1 through 7 will be extracted; if not, enter data for the two subsequent years. All other data are extracted or calculated.
Reserve Amounts(Unrestricted resources 0000-1999 except Line 4):
Budget Year(2016-17)
1st Subsequent Year(2017-18)
2nd Subsequent Year(2018-19)
1. General Fund - Stabilization Arrangements(Fund 01, Object 9750) (Form MYP, Line E1a) 0.00
2. General Fund - Reserve for Economic Uncertainties(Fund 01, Object 9789) (Form MYP, Line E1b) 17,460,945.00 17,434,642.00 17,510,898.00
3. General Fund - Unassigned/Unappropriated Amount(Fund 01, Object 9790) (Form MYP, Line E1c) 81,496,142.83 85,319,652.83 72,271,228.83
4. General Fund - Negative Ending Balances in Restricted Resources(Fund 01, Object 979Z, if negative, for each of resources 2000-9999)(Form MYP, Line E1d) (1.97) 0.00 0.00
5. Special Reserve Fund - Stabilization Arrangements(Fund 17, Object 9750) (Form MYP, Line E2a) 0.00
6. Special Reserve Fund - Reserve for Economic Uncertainties(Fund 17, Object 9789) (Form MYP, Line E2b) 0.00
7. Special Reserve Fund - Unassigned/Unappropriated Amount(Fund 17, Object 9790) (Form MYP, Line E2c) 0.00
8. District's Budgeted Reserve Amount(Lines C1 thru C7) 98,957,085.86 102,754,294.83 89,782,126.83
9. District's Budgeted Reserve Percentage (Information only)(Line 8 divided by Section 10B, Line 3) 11.22% 11.79% 10.25%
District's Reserve Standard (Section 10B, Line 7): 17,640,945.02 17,434,642.46 17,510,898.32
Status: Met Met Met
10D. Comparison of District Reserve Amount to the Standard
DATA ENTRY: Enter an explanation if the standard is not met.
1a. STANDARD MET - Projected available reserves have met the standard for the budget and two subsequent fiscal years.
Explanation:(required if NOT met)
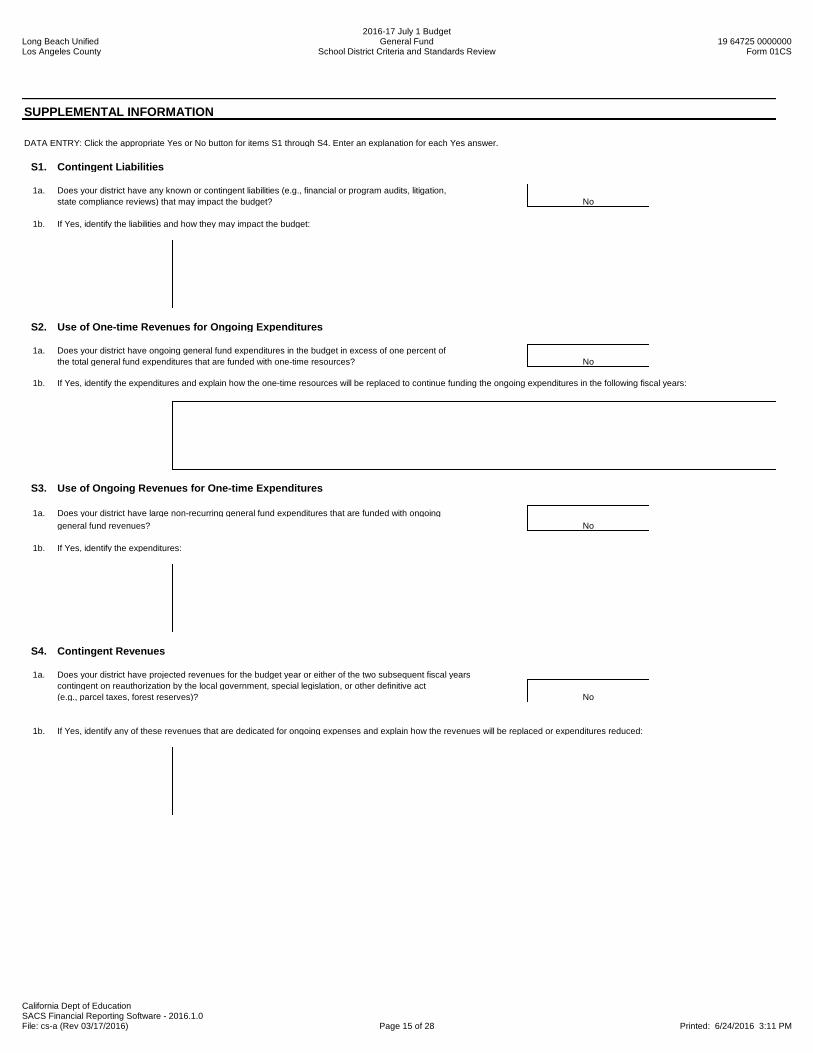
Long Beach UnifiedLos Angeles County
2016-17 July 1 BudgetGeneral Fund
School District Criteria and Standards Review19 64725 0000000
Form 01CS
California Dept of EducationSACS Financial Reporting Software - 2016.1.0File: cs-a (Rev 03/17/2016) Page 15 of 28 Printed: 6/24/2016 3:11 PM
SUPPLEMENTAL INFORMATION
DATA ENTRY: Click the appropriate Yes or No button for items S1 through S4. Enter an explanation for each Yes answer.
S1. Contingent Liabilities
1a. Does your district have any known or contingent liabilities (e.g., financial or program audits, litigation,state compliance reviews) that may impact the budget? No
1b. If Yes, identify the liabilities and how they may impact the budget:
S2. Use of One-time Revenues for Ongoing Expenditures
1a. Does your district have ongoing general fund expenditures in the budget in excess of one percent ofthe total general fund expenditures that are funded with one-time resources? No
1b. If Yes, identify the expenditures and explain how the one-time resources will be replaced to continue funding the ongoing expenditures in the following fiscal years:
S3. Use of Ongoing Revenues for One-time Expenditures
1a. Does your district have large non-recurring general fund expenditures that are funded with ongoinggeneral fund revenues? No
1b. If Yes, identify the expenditures:
S4. Contingent Revenues
1a. Does your district have projected revenues for the budget year or either of the two subsequent fiscal yearscontingent on reauthorization by the local government, special legislation, or other definitive act (e.g., parcel taxes, forest reserves)? No
1b. If Yes, identify any of these revenues that are dedicated for ongoing expenses and explain how the revenues will be replaced or expenditures reduced:

Long Beach UnifiedLos Angeles County
2016-17 July 1 BudgetGeneral Fund
School District Criteria and Standards Review19 64725 0000000
Form 01CS
California Dept of EducationSACS Financial Reporting Software - 2016.1.0File: cs-a (Rev 03/17/2016) Page 16 of 28 Printed: 6/24/2016 3:11 PM
S5. Contributions
Identify projected contributions from unrestricted resources in the general fund to restricted resources in the general fund for the budget year and two subsequent fiscal years. Providean explanation if contributions have changed from the prior fiscal year amounts by more than $20,000 and more than ten percent. Explanation should include whether contributions areongoing or one-time in nature.
Identify projected transfers to or from the general fund to cover operating deficits in either the general fund or any other fund for the budget year and two subsequent fiscal years.Provide an explanation if transfers have changed from the prior fiscal year amounts by more than $20,000 and more than ten percent. Explanation should include whether transfers areongoing or one-time in nature.
Estimate the impact of any capital projects on the general fund operational budget.
District's Contributions and Transfers Standard:-10.0% to +10.0%
or -$20,000 to +$20,000
S5A. Identification of the District's Projected Contributions, Transfers, and Capital Projects that may Impact the General Fund
DATA ENTRY: For Contributions, enter data in the Projection column for the 1st and 2nd Subsequent Years. Contributions for the First Prior Year and Budget Year will be extracted. ForTransfers In and Transfers Out, enter data in the First Prior Year. If Form MYP exists, the data will be extracted for the Budget Year, and 1st and 2nd Subsequent Years. If Form MYP does notexist, enter data in the Budget Year, 1st and 2nd subsequent Years. Click the appropriate button for item 1d; all other data will be calculated.
Description / Fiscal Year Projection Amount of Change Percent Change Status
1a. Contributions, Unrestricted General Fund (Fund 01, Resources 0000-1999, Object 8980)First Prior Year (2015-16) (100,429,481.00)Budget Year (2016-17) (108,026,544.00) 7,597,063.00 7.6% Met1st Subsequent Year (2017-18) (112,387,426.00) 4,360,882.00 4.0% Met2nd Subsequent Year (2018-19) (116,849,283.00) 4,461,857.00 4.0% Met
1b. Transfers In, General Fund *First Prior Year (2015-16) 2,200,000.00Budget Year (2016-17) 500,000.00 (1,700,000.00) -77.3% Not Met1st Subsequent Year (2017-18) 0.00 (500,000.00) -100.0% Not Met2nd Subsequent Year (2018-19) 0.00 0.00 0.0% Met
1c. Transfers Out, General Fund *First Prior Year (2015-16) 4,000,000.00Budget Year (2016-17) 4,000,000.00 0.00 0.0% Met1st Subsequent Year (2017-18) 4,000,000.00 0.00 0.0% Met2nd Subsequent Year (2018-19) 4,000,000.00 0.00 0.0% Met
1d. Impact of Capital ProjectsDo you have any capital projects that may impact the general fund operational budget? No
* Include transfers used to cover operating deficits in either the general fund or any other fund.
S5B. Status of the District's Projected Contributions, Transfers, and Capital Projects
DATA ENTRY: Enter an explanation if Not Met for items 1a-1c or if Yes for item 1d.
1a. MET - Projected contributions have not changed by more than the standard for the budget and two subsequent fiscal years.
Explanation:(required if NOT met)
1b. NOT MET - The projected transfers in to the general fund have changed by more than the standard for one or more of the budget or subsequent two fiscal years. Identify the amount(s)transferred, by fund, and whether transfers are ongoing or one-time in nature. If ongoing, explain the district's plan, with timelines, for reducing or eliminating the transfers.
Explanation:(required if NOT met)
Budgeted transfers from Fund 17 to Fund 01 are one time transfers over two years to fund the Cloud Initiative at LBUSD.
Long Beach UnifiedLos Angeles County
2016-17 July 1 BudgetGeneral Fund
School District Criteria and Standards Review19 64725 0000000
Form 01CS
California Dept of EducationSACS Financial Reporting Software - 2016.1.0File: cs-a (Rev 03/17/2016) Page 17 of 28 Printed: 6/24/2016 3:11 PM
1c. MET - Projected transfers out have not changed by more than the standard for the budget and two subsequent fiscal years.
Explanation:(required if NOT met)
1d. NO - There are no capital projects that may impact the general fund operational budget.
Project Information:(required if YES)

Long Beach UnifiedLos Angeles County
2016-17 July 1 BudgetGeneral Fund
School District Criteria and Standards Review19 64725 0000000
Form 01CS
California Dept of EducationSACS Financial Reporting Software - 2016.1.0File: cs-a (Rev 03/17/2016) Page 18 of 28 Printed: 6/24/2016 3:11 PM
S6. Long-term Commitments
Identify all existing and new multiyear commitments¹ and their annual required payments for the budget year and two subsequent fiscal years.
Explain how any increase in annual payments will be funded. Also explain how any decrease to funding sources used to pay long-term commitments will be replaced.
¹ Include multiyear commitments, multiyear debt agreements, and new programs or contracts that result in long-term obligations.
S6A. Identification of the District's Long-term Commitments
DATA ENTRY: Click the appropriate button in item 1 and enter data in all columns of item 2 for applicable long-term commitments; there are no extractions in this section.
1. Does your district have long-term (multiyear) commitments?(If No, skip item 2 and Sections S6B and S6C) Yes
2. If Yes to item 1, list all new and existing multiyear commitments and required annual debt service amounts. Do not include long-term commitments for postemployment benefits otherthan pensions (OPEB); OPEB is disclosed in item S7A.
# of Years SACS Fund and Object Codes Used For: Principal BalanceType of Commitment Remaining Funding Sources (Revenues) Debt Service (Expenditures) as of July 1, 2016
Capital LeasesCertificates of ParticipationGeneral Obligation Bonds 28 County Property Tax County Treasurer 833,136,279Supp Early Retirement ProgramState School Building LoansCompensated Absences 1 General Fund 10,977,719
Other Long-term Commitments (do not include OPEB):
TOTAL: 844,113,998
Prior Year Budget Year 1st Subsequent Year 2nd Subsequent Year(2015-16) (2016-17) (2017-18) (2018-19)
Annual Payment Annual Payment Annual Payment Annual PaymentType of Commitment (continued) (P & I) (P & I) (P & I) (P & I)
Capital Leases 2,217 0 0 0Certificates of ParticipationGeneral Obligation Bonds 27,271,073 29,410,000 27,220,000 28,165,000Supp Early Retirement ProgramState School Building LoansCompensated Absences 8,428,842 8,000,000 8,000,000 8,000,000
Other Long-term Commitments (continued):
Total Annual Payments: 35,702,132 37,410,000 35,220,000 36,165,000Has total annual payment increased over prior year (2015-16)? Yes No Yes
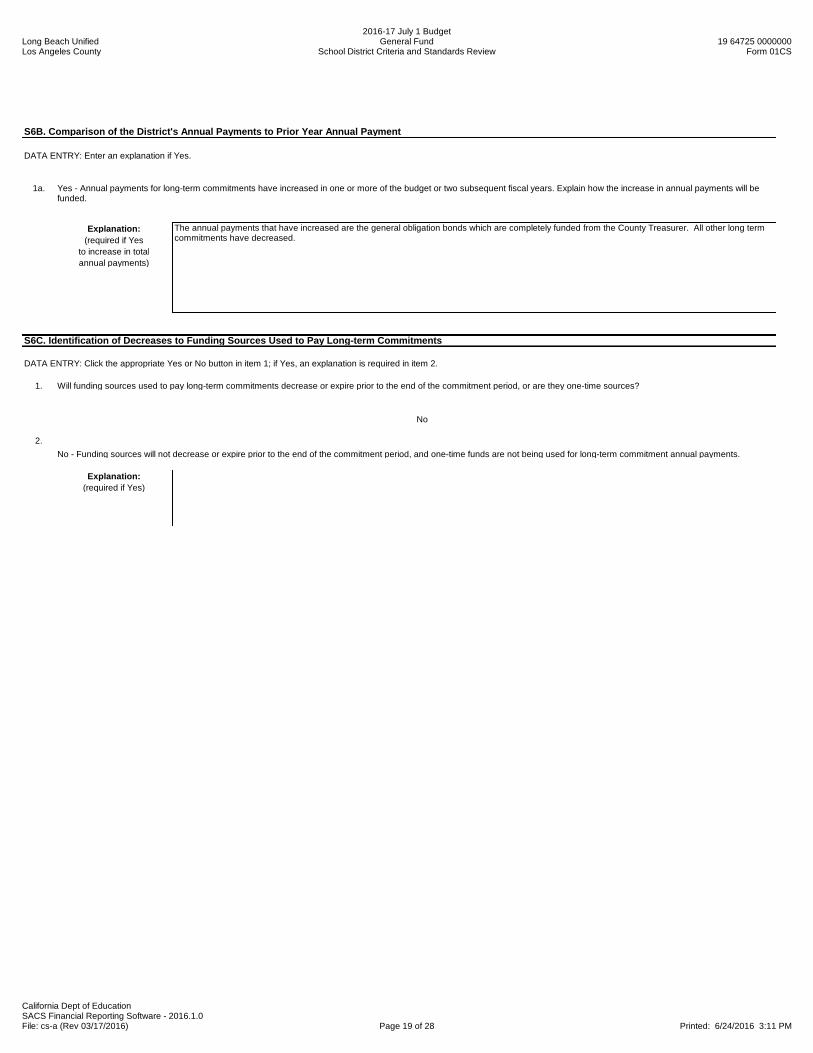
Long Beach UnifiedLos Angeles County
2016-17 July 1 BudgetGeneral Fund
School District Criteria and Standards Review19 64725 0000000
Form 01CS
California Dept of EducationSACS Financial Reporting Software - 2016.1.0File: cs-a (Rev 03/17/2016) Page 19 of 28 Printed: 6/24/2016 3:11 PM
S6B. Comparison of the District's Annual Payments to Prior Year Annual Payment
DATA ENTRY: Enter an explanation if Yes.
1a. Yes - Annual payments for long-term commitments have increased in one or more of the budget or two subsequent fiscal years. Explain how the increase in annual payments will befunded.
Explanation:(required if Yes
to increase in totalannual payments)
The annual payments that have increased are the general obligation bonds which are completely funded from the County Treasurer. All other long termcommitments have decreased.
S6C. Identification of Decreases to Funding Sources Used to Pay Long-term Commitments
DATA ENTRY: Click the appropriate Yes or No button in item 1; if Yes, an explanation is required in item 2.
1. Will funding sources used to pay long-term commitments decrease or expire prior to the end of the commitment period, or are they one-time sources?
No
2.No - Funding sources will not decrease or expire prior to the end of the commitment period, and one-time funds are not being used for long-term commitment annual payments.
Explanation:(required if Yes)

Long Beach UnifiedLos Angeles County
2016-17 July 1 BudgetGeneral Fund
School District Criteria and Standards Review19 64725 0000000
Form 01CS
California Dept of EducationSACS Financial Reporting Software - 2016.1.0File: cs-a (Rev 03/17/2016) Page 20 of 28 Printed: 6/24/2016 3:11 PM
S7. Unfunded Liabilities
Estimate the unfunded liability for postemployment benefits other than pensions (OPEB) based on an actuarial valuation, if required, or other method; identify or estimate the annualrequired contribution; and indicate how the obligation is funded (pay-as-you-go, amortized over a specific period, etc.).
Estimate the unfunded liability for self-insurance programs such as workers' compensation based on an actuarial valuation, if required, or other method; identify or estimate the requiredcontribution; and indicate how the obligation is funded (level of risk retained, funding approach, etc.).
S7A. Identification of the District's Estimated Unfunded Liability for Postemployment Benefits Other than Pensions (OPEB)
DATA ENTRY: Click the appropriate button in item 1 and enter data in all other applicable items; there are no extractions in this section except the budget year data on line 5b.
1. Does your district provide postemployment benefits otherthan pensions (OPEB)? (If No, skip items 2-5) Yes
2. For the district's OPEB:a. Are they lifetime benefits? No
b. Do benefits continue past age 65? Yes
c. Describe any other characteristics of the district's OPEB program including eligibility criteria and amounts, if any, that retirees are required to contribute toward their own benefits:
Medical benefits are offered to retirees until the age of 65 or 67 depending on classification. Eligibility also depends on the age and years of service.
3. a. Are OPEB financed on a pay-as-you-go, actuarial cost, or other method? Pay-as-you-go
b. Indicate any accumulated amounts earmarked for OPEB in a self-insurance or Self-Insurance Fund Governmental Fund governmental fund 7,495,206 0
4. OPEB Liabilitiesa. OPEB actuarial accrued liability (AAL) 327,496,000.00b. OPEB unfunded actuarial accrued liability (UAAL) 327,496,000.00c. Are AAL and UAAL based on the district's estimate or an actuarial valuation? Actuariald. If based on an actuarial valuation, indicate the date of the OPEB valuation Jul 01, 2015
Budget Year 1st Subsequent Year 2nd Subsequent Year5. OPEB Contributions (2016-17) (2017-18) (2018-19)
a. OPEB annual required contribution (ARC) per actuarial valuation or Alternative Measurement Method 25,024,000.00 25,024,000.00 25,024,000.00b. OPEB amount contributed (for this purpose, include premiums paid to a self-insurance fund) (funds 01-70, objects 3701-3752) 11,318,246.00 12,000,000.00 12,000,000.00c. Cost of OPEB benefits (equivalent of "pay-as-you-go" amount) 11,318,246.00 12,000,000.00 12,000,000.00d. Number of retirees receiving OPEB benefits 856 856 856

Long Beach UnifiedLos Angeles County
2016-17 July 1 BudgetGeneral Fund
School District Criteria and Standards Review19 64725 0000000
Form 01CS
California Dept of EducationSACS Financial Reporting Software - 2016.1.0File: cs-a (Rev 03/17/2016) Page 21 of 28 Printed: 6/24/2016 3:11 PM
S7B. Identification of the District's Unfunded Liability for Self-Insurance Programs
DATA ENTRY: Click the appropriate button in item 1 and enter data in all other applicable items; there are no extractions in this section.
1. Does your district operate any self-insurance programs such as workers' compensation,employee health and welfare, or property and liability? (Do not include OPEB, which iscovered in Section S7A) (If No, skip items 2-4)
Yes
2. Describe each self-insurance program operated by the district, including details for each such as level of risk retained, funding approach, basis for valuation (district's estimate oractuarial), and date of the valuation:
The District has self insurance programs for health and welfare, property liability and workers' compensation. Health and welfare rates are determinedthrough an actuarial study done yearly and funded through payroll system charges. Property and liability is funded from a contribution from unrestrictedgeneral fund based on an actuarial study done yearly. Workers' compensation is collected through payroll charges with the rate based on the actuarialstudy. The Self-insurance Retention (SIR) claim is $500,000and the SIR for property and liability is at $250,000.
3. Self-Insurance Liabilitiesa. Accrued liability for self-insurance programs 35,703,546.00b. Unfunded liability for self-insurance programs 0.00
Budget Year 1st Subsequent Year 2nd Subsequent Year4. Self-Insurance Contributions (2016-17) (2017-18) (2018-19)
a. Required contribution (funding) for self-insurance programs 0.00 0.00 0.00b. Amount contributed (funded) for self-insurance programs 0.00 0.00 0.00
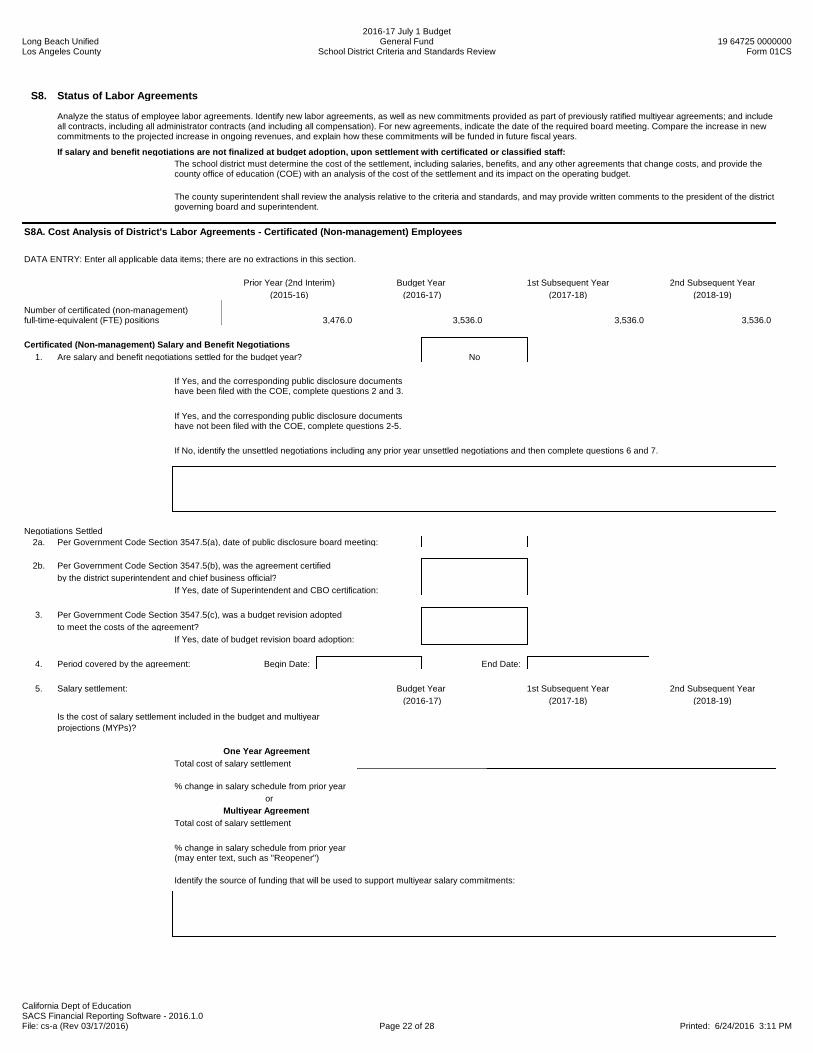
Long Beach UnifiedLos Angeles County
2016-17 July 1 BudgetGeneral Fund
School District Criteria and Standards Review19 64725 0000000
Form 01CS
California Dept of EducationSACS Financial Reporting Software - 2016.1.0File: cs-a (Rev 03/17/2016) Page 22 of 28 Printed: 6/24/2016 3:11 PM
S8. Status of Labor Agreements
Analyze the status of employee labor agreements. Identify new labor agreements, as well as new commitments provided as part of previously ratified multiyear agreements; and includeall contracts, including all administrator contracts (and including all compensation). For new agreements, indicate the date of the required board meeting. Compare the increase in newcommitments to the projected increase in ongoing revenues, and explain how these commitments will be funded in future fiscal years.
If salary and benefit negotiations are not finalized at budget adoption, upon settlement with certificated or classified staff:The school district must determine the cost of the settlement, including salaries, benefits, and any other agreements that change costs, and provide thecounty office of education (COE) with an analysis of the cost of the settlement and its impact on the operating budget.
The county superintendent shall review the analysis relative to the criteria and standards, and may provide written comments to the president of the districtgoverning board and superintendent.
S8A. Cost Analysis of District's Labor Agreements - Certificated (Non-management) Employees
DATA ENTRY: Enter all applicable data items; there are no extractions in this section.
Prior Year (2nd Interim) Budget Year 1st Subsequent Year 2nd Subsequent Year(2015-16) (2016-17) (2017-18) (2018-19)
Number of certificated (non-management)full-time-equivalent (FTE) positions 3,476.0 3,536.0 3,536.0 3,536.0
Certificated (Non-management) Salary and Benefit Negotiations1. Are salary and benefit negotiations settled for the budget year? No
If Yes, and the corresponding public disclosure documentshave been filed with the COE, complete questions 2 and 3.
If Yes, and the corresponding public disclosure documentshave not been filed with the COE, complete questions 2-5.
If No, identify the unsettled negotiations including any prior year unsettled negotiations and then complete questions 6 and 7.
Negotiations Settled2a. Per Government Code Section 3547.5(a), date of public disclosure board meeting:
2b. Per Government Code Section 3547.5(b), was the agreement certifiedby the district superintendent and chief business official?
If Yes, date of Superintendent and CBO certification:
3. Per Government Code Section 3547.5(c), was a budget revision adoptedto meet the costs of the agreement?
If Yes, date of budget revision board adoption:
4. Period covered by the agreement: Begin Date: End Date:
5. Salary settlement: Budget Year 1st Subsequent Year 2nd Subsequent Year(2016-17) (2017-18) (2018-19)
Is the cost of salary settlement included in the budget and multiyear projections (MYPs)?
One Year AgreementTotal cost of salary settlement
% change in salary schedule from prior yearor
Multiyear AgreementTotal cost of salary settlement
% change in salary schedule from prior year(may enter text, such as "Reopener")
Identify the source of funding that will be used to support multiyear salary commitments:
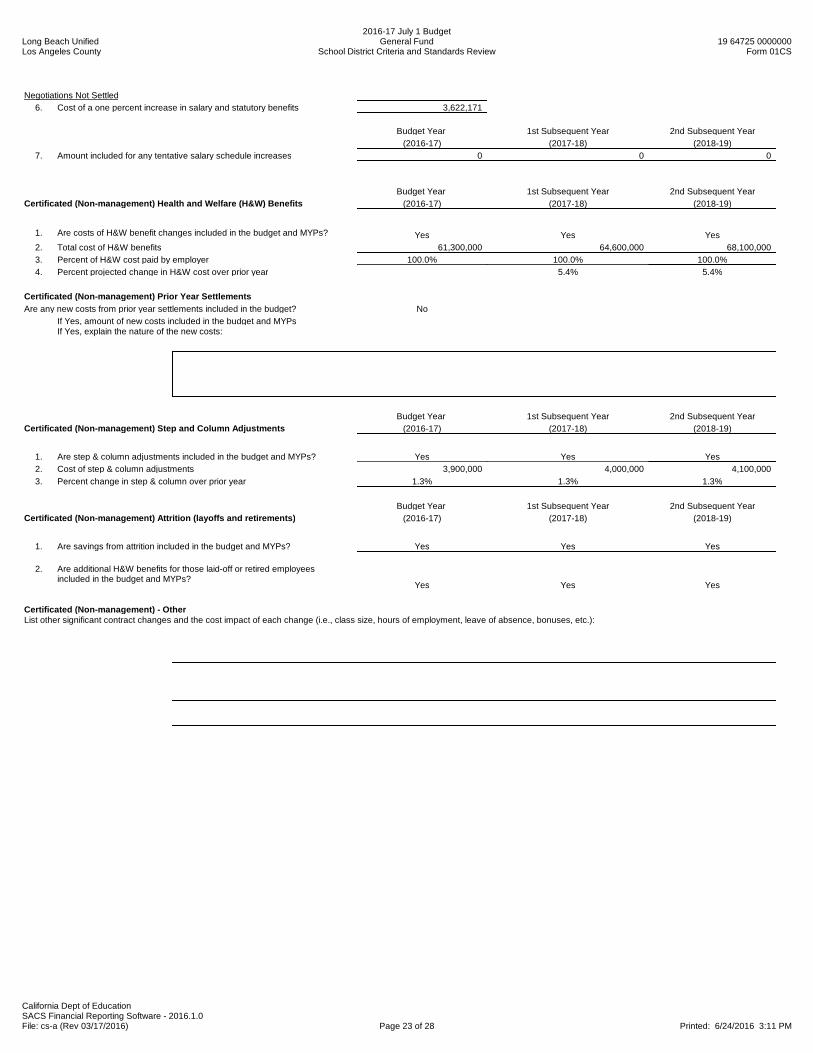
Long Beach UnifiedLos Angeles County
2016-17 July 1 BudgetGeneral Fund
School District Criteria and Standards Review19 64725 0000000
Form 01CS
California Dept of EducationSACS Financial Reporting Software - 2016.1.0File: cs-a (Rev 03/17/2016) Page 23 of 28 Printed: 6/24/2016 3:11 PM
Negotiations Not Settled6. Cost of a one percent increase in salary and statutory benefits 3,622,171
Budget Year 1st Subsequent Year 2nd Subsequent Year(2016-17) (2017-18) (2018-19)
7. Amount included for any tentative salary schedule increases 0 0 0
Budget Year 1st Subsequent Year 2nd Subsequent YearCertificated (Non-management) Health and Welfare (H&W) Benefits (2016-17) (2017-18) (2018-19)
1. Are costs of H&W benefit changes included in the budget and MYPs? Yes Yes Yes2. Total cost of H&W benefits 61,300,000 64,600,000 68,100,0003. Percent of H&W cost paid by employer 100.0% 100.0% 100.0%4. Percent projected change in H&W cost over prior year 5.4% 5.4%
Certificated (Non-management) Prior Year SettlementsAre any new costs from prior year settlements included in the budget? No
If Yes, amount of new costs included in the budget and MYPsIf Yes, explain the nature of the new costs:
Budget Year 1st Subsequent Year 2nd Subsequent YearCertificated (Non-management) Step and Column Adjustments (2016-17) (2017-18) (2018-19)
1. Are step & column adjustments included in the budget and MYPs? Yes Yes Yes2. Cost of step & column adjustments 3,900,000 4,000,000 4,100,0003. Percent change in step & column over prior year 1.3% 1.3% 1.3%
Budget Year 1st Subsequent Year 2nd Subsequent YearCertificated (Non-management) Attrition (layoffs and retirements) (2016-17) (2017-18) (2018-19)
1. Are savings from attrition included in the budget and MYPs? Yes Yes Yes
2. Are additional H&W benefits for those laid-off or retired employeesincluded in the budget and MYPs?
Yes Yes Yes
Certificated (Non-management) - OtherList other significant contract changes and the cost impact of each change (i.e., class size, hours of employment, leave of absence, bonuses, etc.):
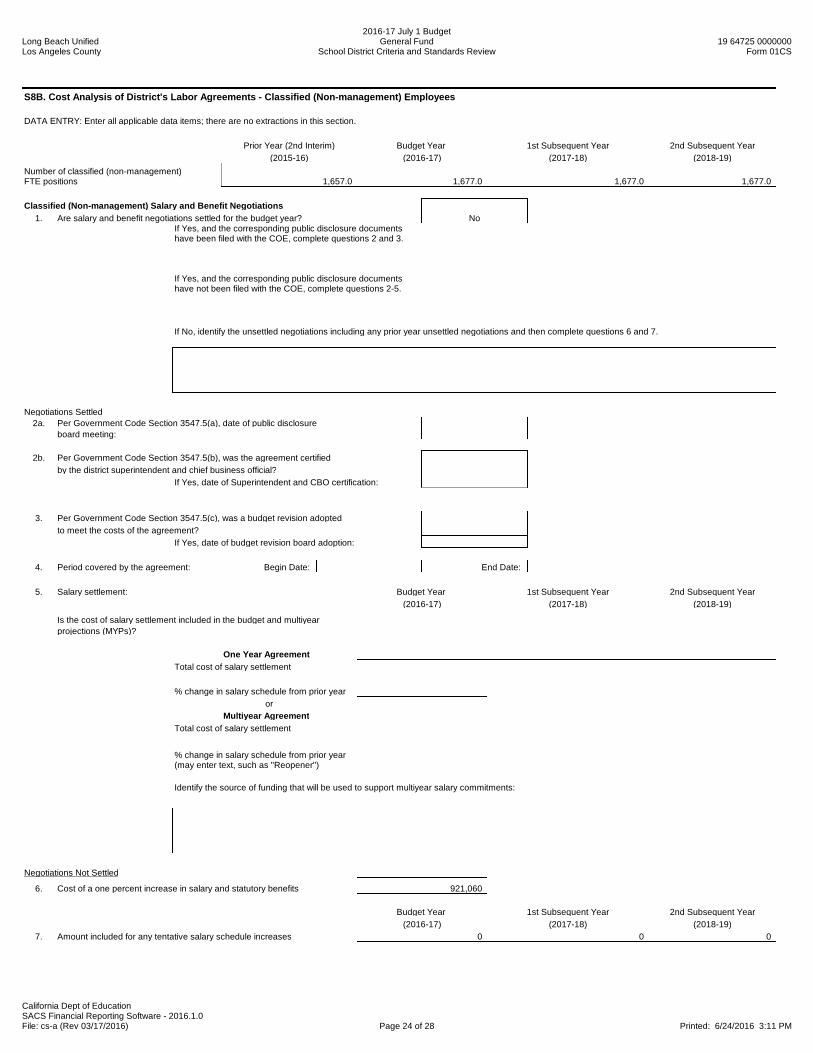
Long Beach UnifiedLos Angeles County
2016-17 July 1 BudgetGeneral Fund
School District Criteria and Standards Review19 64725 0000000
Form 01CS
California Dept of EducationSACS Financial Reporting Software - 2016.1.0File: cs-a (Rev 03/17/2016) Page 24 of 28 Printed: 6/24/2016 3:11 PM
S8B. Cost Analysis of District's Labor Agreements - Classified (Non-management) Employees
DATA ENTRY: Enter all applicable data items; there are no extractions in this section.
Prior Year (2nd Interim) Budget Year 1st Subsequent Year 2nd Subsequent Year(2015-16) (2016-17) (2017-18) (2018-19)
Number of classified (non-management)FTE positions 1,657.0 1,677.0 1,677.0 1,677.0
Classified (Non-management) Salary and Benefit Negotiations1. Are salary and benefit negotiations settled for the budget year? No
If Yes, and the corresponding public disclosure documentshave been filed with the COE, complete questions 2 and 3.
If Yes, and the corresponding public disclosure documentshave not been filed with the COE, complete questions 2-5.
If No, identify the unsettled negotiations including any prior year unsettled negotiations and then complete questions 6 and 7.
Negotiations Settled2a. Per Government Code Section 3547.5(a), date of public disclosure
board meeting:
2b. Per Government Code Section 3547.5(b), was the agreement certifiedby the district superintendent and chief business official?
If Yes, date of Superintendent and CBO certification:
3. Per Government Code Section 3547.5(c), was a budget revision adoptedto meet the costs of the agreement?
If Yes, date of budget revision board adoption:
4. Period covered by the agreement: Begin Date: End Date:
5. Salary settlement: Budget Year 1st Subsequent Year 2nd Subsequent Year(2016-17) (2017-18) (2018-19)
Is the cost of salary settlement included in the budget and multiyear projections (MYPs)?
One Year AgreementTotal cost of salary settlement
% change in salary schedule from prior yearor
Multiyear AgreementTotal cost of salary settlement
% change in salary schedule from prior year(may enter text, such as "Reopener")
Identify the source of funding that will be used to support multiyear salary commitments:
Negotiations Not Settled
6. Cost of a one percent increase in salary and statutory benefits 921,060
Budget Year 1st Subsequent Year 2nd Subsequent Year(2016-17) (2017-18) (2018-19)
7. Amount included for any tentative salary schedule increases 0 0 0

Long Beach UnifiedLos Angeles County
2016-17 July 1 BudgetGeneral Fund
School District Criteria and Standards Review19 64725 0000000
Form 01CS
California Dept of EducationSACS Financial Reporting Software - 2016.1.0File: cs-a (Rev 03/17/2016) Page 25 of 28 Printed: 6/24/2016 3:11 PM
Budget Year 1st Subsequent Year 2nd Subsequent YearClassified (Non-management) Health and Welfare (H&W) Benefits (2016-17) (2017-18) (2018-19)
1. Are costs of H&W benefit changes included in the budget and MYPs? Yes Yes Yes2. Total cost of H&W benefits 28,000,000 29,500,000 31,000,0003. Percent of H&W cost paid by employer 100.0% 100.0% 100.0%4. Percent projected change in H&W cost over prior year 5.4% 5.4%
Classified (Non-management) Prior Year SettlementsAre any new costs from prior year settlements included in the budget? No
If Yes, amount of new costs included in the budget and MYPsIf Yes, explain the nature of the new costs:
Budget Year 1st Subsequent Year 2nd Subsequent YearClassified (Non-management) Step and Column Adjustments (2016-17) (2017-18) (2018-19)
1. Are step & column adjustments included in the budget and MYPs? Yes Yes Yes2. Cost of step & column adjustments 600,000 600,000 600,0003. Percent change in step & column over prior year 0.8% 0.8%
Budget Year 1st Subsequent Year 2nd Subsequent YearClassified (Non-management) Attrition (layoffs and retirements) (2016-17) (2017-18) (2018-19)
1. Are savings from attrition included in the budget and MYPs? Yes Yes Yes
2. Are additional H&W benefits for those laid-off or retired employeesincluded in the budget and MYPs? Yes Yes Yes
Classified (Non-management) - OtherList other significant contract changes and the cost impact of each change (i.e., hours of employment, leave of absence, bonuses, etc.):
5
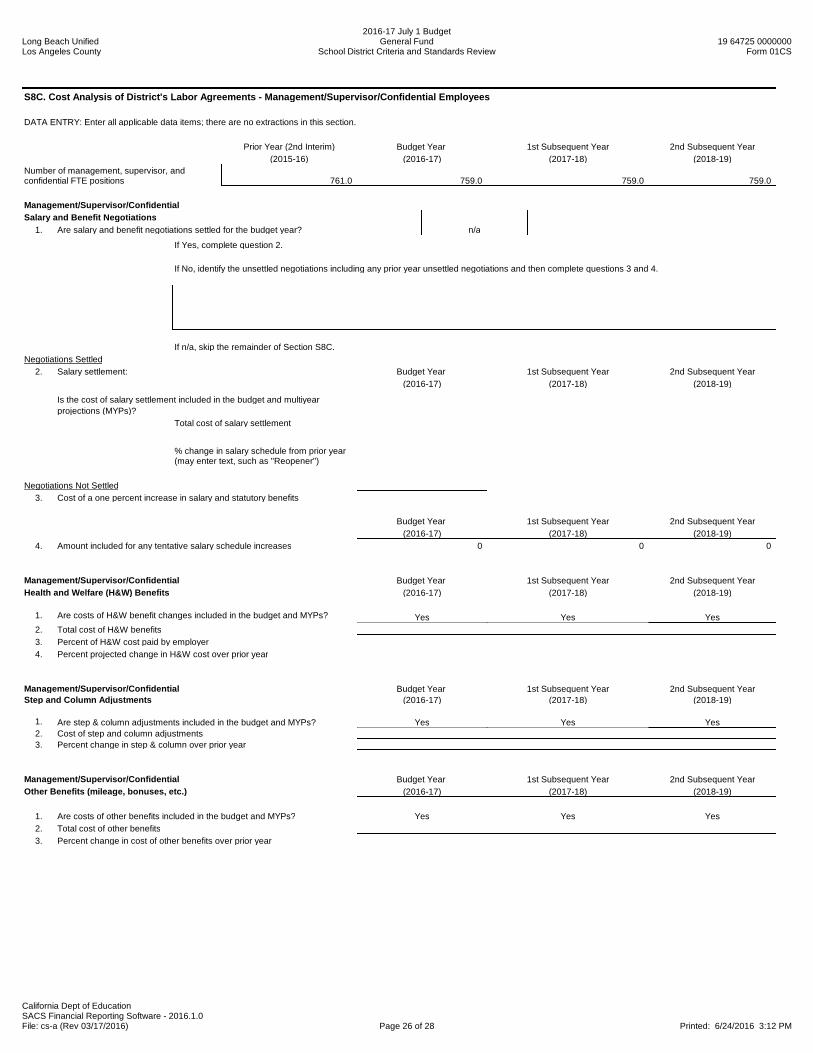
Long Beach UnifiedLos Angeles County
2016-17 July 1 BudgetGeneral Fund
School District Criteria and Standards Review19 64725 0000000
Form 01CS
California Dept of EducationSACS Financial Reporting Software - 2016.1.0File: cs-a (Rev 03/17/2016) Page 26 of 28 Printed: 6/24/2016 3:12 PM
S8C. Cost Analysis of District's Labor Agreements - Management/Supervisor/Confidential Employees
DATA ENTRY: Enter all applicable data items; there are no extractions in this section.
Prior Year (2nd Interim) Budget Year 1st Subsequent Year 2nd Subsequent Year(2015-16) (2016-17) (2017-18) (2018-19)
Number of management, supervisor, andconfidential FTE positions 761.0 759.0 759.0 759.0
Management/Supervisor/Confidential Salary and Benefit Negotiations
1. Are salary and benefit negotiations settled for the budget year? n/a
If Yes, complete question 2.
If No, identify the unsettled negotiations including any prior year unsettled negotiations and then complete questions 3 and 4.
If n/a, skip the remainder of Section S8C.Negotiations Settled
2. Salary settlement: Budget Year 1st Subsequent Year 2nd Subsequent Year(2016-17) (2017-18) (2018-19)
Is the cost of salary settlement included in the budget and multiyear projections (MYPs)?
Total cost of salary settlement
% change in salary schedule from prior year(may enter text, such as "Reopener")
Negotiations Not Settled3. Cost of a one percent increase in salary and statutory benefits
Budget Year 1st Subsequent Year 2nd Subsequent Year(2016-17) (2017-18) (2018-19)
4. Amount included for any tentative salary schedule increases 0 0 0
Management/Supervisor/Confidential Budget Year 1st Subsequent Year 2nd Subsequent YearHealth and Welfare (H&W) Benefits (2016-17) (2017-18) (2018-19)
1. Are costs of H&W benefit changes included in the budget and MYPs? Yes Yes Yes2. Total cost of H&W benefits3. Percent of H&W cost paid by employer4. Percent projected change in H&W cost over prior year
Management/Supervisor/Confidential Budget Year 1st Subsequent Year 2nd Subsequent YearStep and Column Adjustments (2016-17) (2017-18) (2018-19)
1. Are step & column adjustments included in the budget and MYPs? Yes Yes Yes2. Cost of step and column adjustments3. Percent change in step & column over prior year
Management/Supervisor/Confidential Budget Year 1st Subsequent Year 2nd Subsequent YearOther Benefits (mileage, bonuses, etc.) (2016-17) (2017-18) (2018-19)
1. Are costs of other benefits included in the budget and MYPs? Yes Yes Yes2. Total cost of other benefits3. Percent change in cost of other benefits over prior year
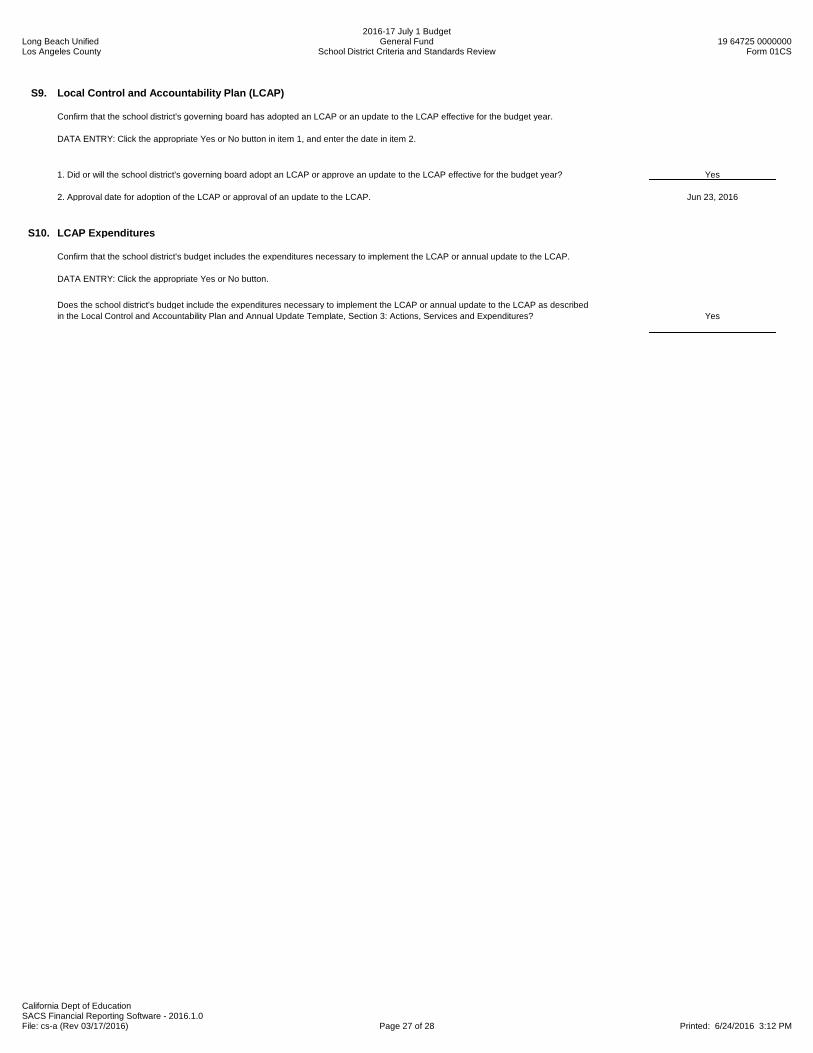
Long Beach UnifiedLos Angeles County
2016-17 July 1 BudgetGeneral Fund
School District Criteria and Standards Review19 64725 0000000
Form 01CS
California Dept of EducationSACS Financial Reporting Software - 2016.1.0File: cs-a (Rev 03/17/2016) Page 27 of 28 Printed: 6/24/2016 3:12 PM
S9. Local Control and Accountability Plan (LCAP)
Confirm that the school district's governing board has adopted an LCAP or an update to the LCAP effective for the budget year.
DATA ENTRY: Click the appropriate Yes or No button in item 1, and enter the date in item 2.
1. Did or will the school district's governing board adopt an LCAP or approve an update to the LCAP effective for the budget year? Yes
2. Approval date for adoption of the LCAP or approval of an update to the LCAP. Jun 23, 2016
S10. LCAP Expenditures
Confirm that the school district's budget includes the expenditures necessary to implement the LCAP or annual update to the LCAP.
DATA ENTRY: Click the appropriate Yes or No button.
Does the school district's budget include the expenditures necessary to implement the LCAP or annual update to the LCAP as describedin the Local Control and Accountability Plan and Annual Update Template, Section 3: Actions, Services and Expenditures? Yes

Long Beach UnifiedLos Angeles County
2016-17 July 1 BudgetGeneral Fund
School District Criteria and Standards Review19 64725 0000000
Form 01CS
California Dept of EducationSACS Financial Reporting Software - 2016.1.0File: cs-a (Rev 03/17/2016) Page 28 of 28 Printed: 6/24/2016 3:12 PM
ADDITIONAL FISCAL INDICATORS
The following fiscal indicators are designed to provide additional data for reviewing agencies. A "Yes" answer to any single indicator does not necessarily suggest a cause for concern, but mayalert the reviewing agency to the need for additional review.
DATA ENTRY: Click the appropriate Yes or No button for items A1 through A9 except item A3, which is automatically completed based on data in Criterion 2.
A1. Do cash flow projections show that the district will end the budget year with anegative cash balance in the general fund? No
A2. Is the system of personnel position control independent from the payroll system?Yes
A3. Is enrollment decreasing in both the prior fiscal year and budget year? (Data from theenrollment budget column and actual column of Criterion 2A are used to determine Yes or No) Yes
A4. Are new charter schools operating in district boundaries that impact the district'senrollment, either in the prior fiscal year or budget year? No
A5. Has the district entered into a bargaining agreement where any of the budgetor subsequent years of the agreement would result in salary increases that Noare expected to exceed the projected state funded cost-of-living adjustment?
A6. Does the district provide uncapped (100% employer paid) health benefits for current orretired employees? No
A7. Is the district's financial system independent of the county office system?Yes
A8. Does the district have any reports that indicate fiscal distress pursuant to EducationCode Section 42127.6(a)? (If Yes, provide copies to the county office of education) No
A9. Have there been personnel changes in the superintendent or chief businessofficial positions within the last 12 months? No
When providing comments for additional fiscal indicators, please include the item number applicable to each comment.
Comments:(optional)
End of School District Budget Criteria and Standards Review