57
2016 – 2017 FACT BOOK Office of Institutional Research
2016 – 2017 FACT BOOK
Office of Institutional Research


2016‐2017 FACT BOOK
OFFICE OF INSTITUTIONAL RESEARCH
Fairfield, Connecticut
PREFACE The Fairfield University FACT BOOK is dedicated to serving the needs of administrators, faculty, and alumni for accurate, consistent, and reliable data on the characteristics of Fairfield University. The online FACT BOOK is updated throughout the year and should be the user’s preferred source of current data. The online edition is available at: www.fairfield.edu/factbook The Office of Institutional Research is responsible for the production of the FACT BOOK. However, the University FACT BOOK would not be possible without the assistance from many colleagues across campus that provided us with information included within the following pages. A special thank you goes to those in Academic Affairs, Advancement, Alumni Relations, Digital Marketing, the DiMenna‐ Nyselius Library, Facilities Management, Finance, Financial Aid, Human Resources, ITS, President’s Office, Residence Life, Student Affairs, Undergraduate Admission, and the University Registrar. Amy C. Boczer Director, Office of Institutional Research Canisius 302, Ext. 3434 [email protected] Daniel Grazynski Data Analytics/Research Analyst Pamela Nicsaji IR Coordinator
2016-17 TABLE OF CONTENTS
Mission Statement of Fairfield University ........................................................................................ 1
Institution
The University Seal ............................................................................................................... 2
The University Logo .............................................................................................................. 3
Alma Matter ............................................................................................................................ 4
Web & Social Media Official Channels ................................................................................. 5
Jesuit Colleges and Universities in the United States ......................................................... 6
Accreditation .......................................................................................................................... 7
Institutional Memberships ..................................................................................................... 8
University Presidents ............................................................................................................ 9
University Administration .................................................................................................... 10
Fairfield University Organizational Chart ........................................................................... 11
Fairfield University Board of Trustees, 2016-17 ........................................................ 12-13
Honorary Degrees Awarded-Commencement ................................................................... 14
Coming Soon! ....................................................................................................................... 15
Undergraduate & Graduate Degree Offerings .................................................................... 16
Students
Fairfield University Student Association Presidents-FUSA ............................................. 18
University Fall Enrollment by School, 5 Year Trend ......................................................... 19
Fall Enrollment, Full-Time/Part-Time Head Count........................................................... 20
Fall Enrollment, Student Full-Time Equivalent (FTE) ....................................................... 21
Undergraduate Enrollment Division, Fall 2016 .................................................................. 22
Graduate Enrollment, Fall 2016 .......................................................................................... 23
Graduate Enrollment, Registered Hours, Fall 2016 ........................................................... 24
Majors of Students Enrolled in Full-Time Undergraduate Programs, Fall 2016 ............. 25
Full-Time Undergraduate Resident Status & Resident Enrollment by Level .................. 26
Undergraduate Enrollment by Race/Ethnicity .................................................................... 27
International Students .......................................................................................................... 28
First-Year Student Admission Trend & Cohort SAT Quartiles ........................................ 29
First-Year Student Profile, Class of 2020 & First-Year Students
by Race/Ethnicity and Pell Recipients ................................................................................ 30
First-Year Student Geographic Distribution ...................................................................... 31
University Geographic Distribution .................................................................................... 32
Retention and Graduation Rates .......................................................................................... 33
Freshman-to-Sophomore Retention, Original Cohort, AHANA, General Studies ............ 34
Undergraduate Transfer Admissions .................................................................................. 35
Visiting/Transfer Student Profile, Fall 2016 ...................................................................... 36
Baccalaureate Degrees Awarded ........................................................................................ 37
Master’s/Doctorate Degrees Awarded ............................................................................... 38
Degrees Awarded by School, Cumulative .......................................................................... 39
Financial Aid Data & Tuition History .................................................................................. 40
Faculty & Staff
University Personnel, Faculty, Faculty FTE, and Student: Faculty Ratio ........................ 41
Full-Time Faculty by Program, Rank, and Gender ............................................................ 42
Full-Time Faculty by Highest Degree, School, and Tenure Status, Fall 2016 ................ 43
Full-Time Avg. Salary and Comp. by Rank and AAUP IIA Comparison 2015-16 ........... 44

Endowment & Development
University Endowment Market Value & Development ...................................................... 45
DiMenna-Nyselius Library
Component Summary & Special Library Collections and Services ................................... 46
Alumni
University Alumni and Undergraduate Alumni by State & Country .................................. 47
Facilities
University Map ..................................................................................................................... 48
University Buildings ....................................................................................................... 49-50
History ............................................................................................................................................. 51

FAIRFIELD UNIVERSITY MISSION STATEMENT
Fairfield University, founded by the Society of Jesus, is a coeducational institution of higher learning whose primary objectives are to develop the creative intellectual potential of its students and to foster in them ethical and religious values and a sense of social responsibility. Jesuit Education, which began in 1547, is committed today to the service of faith, of which the promotion of justice is an absolute requirement.
Fairfield is Catholic in both tradition and spirit. It celebrates the God‐given dignity of every human person. As a Catholic university it welcomes those of all beliefs and traditions who share its concerns for scholarship, justice, truth and freedom, and it values the diversity which their membership brings to the university community.
Fairfield educates its students through a variety of scholarly and professional disciplines. All of its schools share a liberal and humanistic perspective and a commitment to excellence. Fairfield encourages a respect for all the disciplines‐their similarities, their differences, and their interrelationships. In particular, in its undergraduate schools it provides all students with a broadly based general education curriculum with a special emphasis on the traditional humanities as a complement to the more specialized preparation in disciplines and professions provided by the major programs. Fairfield is also committed to the needs of society for liberally educated professionals. It meets the needs of its students to assume positions in this society through its undergraduate and graduate professional schools and programs.
A Fairfield education is a liberal education, characterized by its breadth and depth. It offers opportunities for individual and common reflection, and it provides training in such essential human skills as analysis, synthesis, and communication. The liberally educated person is able to assimilate and organize facts, to evaluate knowledge, to identify issues, to use appropriate methods of reasoning and to convey conclusions persuasively in written and spoken word. Equally essential to liberal education is the development of the esthetic dimension of human nature, the power to imagine, to intuit, to create, and to appreciate. In its fullest sense liberal education initiates students at a mature level into their culture, its past, its present and its future.
Fairfield recognizes that learning is a life‐long process and sees the education which it provides as the foundation upon which its students may continue to build within their chosen areas of scholarly study or professional development. It also seeks to foster in its students a continuing intellectual curiosity and a desire for self‐education which will extend to the broad range of areas to which they have been introduced in their studies.
As a community of scholars, Fairfield gladly joins in the broader task of expanding human knowledge and deepening human understanding, and to this end it encourages and supports the scholarly research and artistic production of its faculty and students.
Fairfield has a further obligation to the wider community of which it is a part, to share with its neighbors its resources and its special expertise for the betterment of the community as a whole. Faculty and students are encouraged to participate in the larger community through service and academic activities. But most of all, Fairfield serves the wider community by educating its students to be socially aware and morally responsible persons.
Fairfield University values each of its students as an individual with unique abilities and potentials, and it respects the personal and academic freedom of all its members. At the same time it seeks to develop a greater sense of community within itself, a sense that all of its members belong to and are involved in the University, sharing common goals and a common commitment to truth and justice, and manifesting in their lives the common concern for others which is the obligation of all educated, mature human beings.
March 4, 1983
Office of Institutional Research Page | 1

FAIRFIELD UNIVERSITY SEAL
Fairfield’s seal combines elements of its several traditions. The gold pine cones come from the coat of arms of the family of St. Robert Bellarmine, S.J. Superimposed on the cones is the badge of the Society of Jesus – the letters IHS surmounted by the cross and surrounded by the instruments of Christ’s passion ‐ to indicate that the University is in the care of members of the same religious family.
There are three compartments in the upper portion of the shield, because "The school is dedicated and exists in the Name of the Father and of the Son, and of the Holy Spirit." The central compartment portrays a hart crossing a ford, a part of the coat of arms of the Diocese of Hartford, whose boundaries encompassed the Town of Fairfield when the University was founded.
Finally, the two outer compartments show clusters of grapes, charges taken from the town seal and symbolic of the fertility of the verdant fields of the Town and County of Fairfield.
When the University was founded in 1942, the official name of the University was "Fairfield University of St. Robert Bellarmine." Three of the original seals with this name still exist on campus ‐ in the main lobby of Alumni Hall, on the exterior of the original Barone Campus Center, and on the glass front of Regis Hall facing the Quad.
The University seal will continue in use for official documents such as diplomas, commencement programs and transcripts.
Fairfield University’s Motto "Per Fidem Ad Plenam Veritatem" translates to "Through faith to full Truth."
Office of Institutional Research Page | 2
FAIRFIELD UNIVERSITY LOGO
The logo, unveiled in April, 1997, provides a visual identity to unify the University. The key features of the logo are the name in New Baskerville type, with "Fairfield" in upper and lower case letters and "UNIVERSITY" in all caps. The graphic of a shield features a stag fording a stream and a flowing white banner with a cross, both extracted from a section of the University seal. That selection of the seal was created in tribute to the Archdiocese of Hartford which assisted in the founding of the University since the stag or hart, another name for a male deer, is crossing a ford stream.
Office of Institutional Research Page | 3

ALMA MATER
The University’s alma mater opens with the words: "Fairfield! See the stag with the cross of gold rears once more its undefeated head. Fairfield, our field, as any field of old, bids our banners, like our blood, be red." According to James Hall’s Dictionary of Subjects of Symbols, the long flowing white flag bearing a red cross is the Christian symbol of victory over death, the banner of Resurrection.
Fairfield! See the stag with cross of Gold Rears once more its undefeated head.
Fair our field, as any field of old, Bids our banners, like our blood, be red.
"Through faith, unto total truth," our cry Swells from the sea to spire and sky; Hear, Alma Mater, hear! Fairfield, hail!
Mem’ries fold away the thought of thee: Autumn roses crimson on the bough,
Bright snow breaking to the dogwood tree Keeps spring singing, then as now.
"Through faith, unto total truth," our cry Swells from the sea to spire and sky; Hear, Alma Mater, hear! Fairfield, hail!
Lyrics by Rev. John L. Bonn, S.J.
Office of Institutional Research Page | 4
WEB & SOCIAL MEDIA OFFICIAL CHANNELS
Fairfield University web and social media channels are continually evolving to ensure processes, technology, analytical insight and capabilities meet the growing demands of our University.
The official University's website is: www.fairfield.edu and currently receives over 100,000 visitors monthly.
Fairfield University also maintains a robust presence on the social media networks for the purpose of promoting events/news, building relationships, and staying connected with our community.
Official University Social Media Platforms are: 1. Facebook: facebook.com/fairfielduniversity2. Twitter: twitter.com/fairfieldu3. YouTube: www.youtube.com/user/FairfieldStags4. LinkedIn: www.linkedin.com/edu/school?id=180225. Instagram: instagram.com/fairfieldu6. Snapchat: Follow us @FairfieldU *only accessible through mobile device
Office of Institutional Research Page | 5

JESUIT COLLEGES AND UNIVERSITIES
Established Institution Location 1789 Georgetown University Washington, D.C. 1818 Saint Louis University St. Louis, Missouri 1830 Spring Hill College Mobile, Alabama 1831 Xavier University Cincinnati, Ohio 1841 Fordham University New York, New York 1843 College of the Holy Cross Worcester, Massachusetts 1851 Saint Joseph’s University Philadelphia, Pennsylvania 1851 Santa Clara University Santa Clara, California 1852 Loyola University Maryland Baltimore, Maryland 1855 University of San Francisco San Francisco, California 1863 Boston College Boston, Massachusetts 1870 Canisius College Buffalo, New York 1870 Loyola University of Chicago Chicago, Illinois 1872 Saint Peter’s College Jersey City, New Jersey 1877 Regis University Denver, Colorado 1877 University of Detroit Mercy Detroit, Michigan 1878 Creighton University Omaha, Nebraska 1881 Marquette University Milwaukee, Wisconsin 1886 John Carroll University Cleveland, Ohio 1887 Gonzaga University Spokane, Washington 1891 Seattle University Seattle, Washington 1910 Rockhurst College Kansas City, Missouri 1911 Loyola Marymount University Los Angeles, California 1912 Loyola University New Orleans, Louisiana 1923 University of Scranton Scranton, Pennsylvania 1942 Fairfield University Fairfield, Connecticut 1946 Le Moyne College Syracuse, New York 1954 Wheeling Jesuit College Wheeling, West Virginia
Office of Institutional Research Page | 6
ACCREDITATION
Fairfield University is fully accredited by the New England Association of Schools and Colleges, which accredits schools and colleges in the six New England states. Accreditation by one of the six regional accrediting associations in the United States indicates that the school or college has been carefully evaluated and found to meet standards agreed upon by qualified educators.
Additional accreditations include:
AACSB International ‐ The Association to Advance Collegiate Schools of Business (Charles F. DolanSchool of Business)
Accreditation Board for Engineering and Technology (School of Engineering)Computer Engineering program Electrical Engineering program Mechanical Engineering program Software Engineering program
American Chemical Society (College of Arts and Sciences)B.S. in Chemistry
Commission on Accreditation of Marriage and Family Therapy Education of the American Associationfor Marriage and Family Therapy (Graduate School of Education and Allied Professions, GSEAP)
Marriage and Family Therapy program
Bureau of Educator Standards & Certification, Connecticut State Department of Higher Ed (GSEAP)
Council for Accreditation of Counseling and Related Professions (GSEAP)Counselor Education programs
Commission on Collegiate Nursing Education (Marion Peckham Egan School of Nursing)Undergraduate Nursing programs Graduate Nursing programs Doctorate Nursing programs
International Association of Counseling ServicesCounseling & Psychological Services Center
National Council for Accreditation of Teacher Education (GSEAP)Academic program approvals include:
Bureau of Educator Standards & Certification, Connecticut State Department of Higher EdElementary and Secondary Teacher certification programs Graduate programs leading to certification in specialized areas of education
Connecticut Department of Public Healtho Connecticut State Board of Examiners for Nursing
Undergraduate Nursing programs
Council on Accreditation of Nurse Anesthesia Educational ProgramsCertifications include:
National Collegiate Athletic Association
Supplemental First Responder, State of Connecticut (Department of Public Safety)
Office of Institutional Research Page | 7
INSTITUTIONAL MEMBERSHIPS The University is an institutional member of these organizations:
AACSB International ‐ The Association to AdvanceCollegiate Schools of Business
America East Athletic Conference
American Association for Employment in Education
American Association of Colleges for TeacherEducation
American Association of Colleges of Nursing
American Council for Higher Education
American Council on Education
American Society for Engineering Education
APPA: Leadership in Educational Facilities
Association for Information CommunicationsTechnology Professionals in Higher Education
Association for Student Affairs at Catholic Collegesand Universities
Association for the Advancement of Sustainabilityin Higher Education
Association for University and College CounselingCenter Directors
Association of American Colleges and Universities
Association of Catholic Colleges and Universities
Association of College Unions International
Association of Governing Boards
Association of Higher Education Campus TelevisionAdministrators
Association of International EducationAdministrators
Association of Jesuit Colleges and Universities
Campus Compact
Catholic Campus Ministry Association
Connecticut Association of Colleges andUniversities for Teacher Education
Connecticut ACE Women's Network
Connecticut Conference of Independent Colleges
Connecticut Council for Higher Education
Connecticut Distance Learning Consortium
Connecticut Education Network
Connecticut Library Consortium
Council for Opportunity in Education
Council of Connecticut Academic Library Directors
Council of Independent Colleges
Eastern Collegiate Athletic Conference
EDUCAUSE
EDUCAUSE Center for Applied Research
EDUCAUSE Learning Initiative
Fairfield Chamber of Commerce
Greater Bridgeport Regional Business Council
Higher Education Data Sharing Consortium
International Association of Campus LawEnforcement Administrators
Jesuit Association of Student PersonnelAdministrators
Metro Atlantic Athletic Conference
NASPA: Student Affairs Administrators in HigherEducation
National Action Council for Minorities inEngineering
National Association for Campus Activities
National Association of College and UniversityAttorneys
National Association of College and UniversityBusiness Officers
National Association of Colleges and Employers
National Association of Collegiate Directors ofAthletics
National Association of Independent Colleges andUniversities
National Catholic Educational Association
National Collegiate Athletic Association
National Institute for Technology and LiberalEducation
National Intramural‐Recreational Sports Association
National League for Nursing
Network for Vocation in Undergraduate Education
New England Business and Economic Association
New England Library Information Network
Northeast Regional Computer Program
Online Computer Library Center
Society for College and University Planning
The College Board
The Forum on Education Abroad
Office of Institutional Research Page | 8

UNIVERSITY PRESIDENTS
1942‐1944 Rev. John J. McEleney, S.J.
1944‐1951 Rev. James H. Dolan, S.J.
1951‐1958 Rev. Joseph D. FitzGerald, S.J.
1958‐1964 Rev. James E. FitzGerald, S.J.
1964‐1973 Rev. William C. McInnes, S.J.
1973‐1979 Rev. Thomas R. Fitzgerald, S.J.
1979‐2004 Rev. Aloysius P. Kelley, S.J.
2004‐2016 Rev. Jeffrey P. von Arx, S.J.
2017‐ Lynn M. Babington, PhD, RN, Interim President
Office of Institutional Research Page | 9

2016 2017 UNIVERSITY ADMINISTRATION
Lynn M. Babington, Ph.D., R.N. Interim University PresidentCharles H. Allen, S.J., M.A. University Chaplain and Special Assistant to the PresidentGerry Blaszczak, S.J. Director, Center for Ignatian SpiritualityNancy A. Dallavalle, Ph.D. Vice President for Jesuit and Catholic Mission and Identity,
Associate Professor of Religious StudiesWally P. Halas, M.P.A. Vice President for University AdvancementThomas M. Simisky, S.J. President, Fairfield College Preparatory SchoolMichael G. Tortora, M.B.A. Executive Assistant to the President and Chief of Staff
Kevin P. Lawlor, M.S., M.B.A., C.P.A. Executive Vice President and Chief Operating OfficerJennifer L. Anderson, M.S., M.B.A. Vice President for Marketing and CommunicationsAmy C. Boczer, M.B.A. Director of Institutional ResearchJonathan M. Carroll, M.B.A. Chief Information OfficerMatthew A. Dinnan, M.S. Director, Conference and Event ManagementScott D. Esposito, M.B.A. Vice President for Human ResourcesJames D. Fitzpatrick, M.A. Assistant Vice PresidentThomas J. Fitzpatrick, S.J., M.A., Ph.L., S.T.L., Ph.D. Spiritual Director, Scholar in Residence, Chaplain to StaffDavid W. Frassinelli, M.S. Associate Vice President for Facilities ManagementKaren A. Pellegrino, M.A. Vice President for Enrollment ManagementThomas C. Pellegrino, Ph.D., J.D. Senior Vice President for Student AffairsMichael F. Trafecante, M.B.A., C.P.A. Vice President for Finance and Treasurer
Christine M. Siegel, Ph.D. Interim Provost and Senior Vice President for Academic AffairsMary Frances A.H. Malone, Ph.D. Associate Vice President for Academic AffairsBruce W. Berdanier, Ph.D. Dean, School of EngineeringDonald E. Gibson, Ph.D. Dean, Charles F. Dolan School of BusinessRobert D. Hannafin, Ph.D. Dean, Graduate School of Education & Allied ProfessionsMeredith W. Kazer, Ph.D., A.P.R.N. Dean, Marion Peckham Egan School of Nursing and Health StudiesYohuru R. Williams, Ph.D. Dean, College of Arts and SciencesBrent A. Mai, M.A., M.L.I.S., Ed.D. Dean of Libraries and University LibrarianHeather L. Petraglia, M.A. Dean of Academic and Career DevelopmentRobert C. Russo, M.A. University Registrar
Office of Institutional Research Page | 10

Board of Trustees
President
Provost, SVP for Academic Affairs
Academic and Career
Development
Academic Centers and Programs
College of Arts and Sciences
Dolan School of Business
Fairfield University Art Museum
Graduate School of Education &
Allied Professions
Library
Marion Peckham Egan School of
Nursing and Health Studies
School of Engineering
Study Abroad & International
Programs
University Registrar
Executive Vice President
Auxiliary Services
Conference & Event
Management
Enrollment Management
Facilities Management
Finance
Human Resources
Information Technology
Services
Institutional Research
Marketing & Communications
Student Affairs
VP for University
Advancement
Alumni Relations
Annual Giving
Development
Quick Center for the Arts
VP for Mission &
Identity
Fairfield Prep Athletics
Ignatian Spirituality
Center
Executive Assistant to the President &
Chief of Staff
FAIRFIELD UNIVERSITY ORGANIZATIONAL CHART 2016-2017
Office of Institutional Research Page | 11
FAIRFIELD UNIVERSITY BOARD OF TRUSTEES 2016‐2017
Nancy A. Altobello '80 Global Vice Chair, Talent Ernst & Young
Ceasar Nicholas Anquillare '78 Chairman and Chief Executive Officer Winchester Capital Partners LLC
William L. Atwell, P'08 Managing Director Atwell Partners LLC
Lynn M. Babington, PhD, RN Interim President Fairfield University
Mark J. Beckwith '80
Joseph R. Bronson '70 CEO/Principal The Bronson Group, LLC Strategic Advisor Cowen & Company
Kevin P. Cannon '80 CEO Zweig‐DiMenna Associates LLC
Carlos M. Cardoso '81 Principal CMPC Advisors
Frank J. Carroll, III '89, Chair Managing Director Oaktree Capital Management, L.P.
Rev. George E. Collins, S.J. President Cheverus High School
Timothy J. Conway '76 Chairman and Chief Executive Officer NewStar Financial, Inc.
William C. Crager '86 Co‐Founder & President Envestnet, Inc.
Sheila Kearney Davidson '83 Executive Vice President, Chief Legal Officer & General Counsel New York Life Insurance Company
Christopher C. Desmarais '93 Managing Director Gabelli Asset Management Inc.
Rev. Terrence P. Devino, S.J. Vice President and University Secretary Boston College
Patricia E. Glassford '85 Vice President and Finance Leader ‐ Cash GE
Kelly Simon Hondru '01 Director KJ Investment LLC
Brian P. Hull '80, P'13, Vice Chair Head of the Client Advisory Group, WMA Vice Chairman, Americas UBS
Paul J. Huston '82 Chairman Hudson Ferry Capital
Rev. Gregory A. Kalscheur, S.J. Dean, Morrisey College of Arts and Sciences Boston College
Robin Kanarek '96 President Kanarek Family Foundation
Susan Robinson King, M.A. '73 Dean and John Thomas Kerr Distinguished Professor School of Media and Journalism University of North Carolina, Chapel Hill
Claire M. Knopf, P'16
Office of Institutional Research Page | 12

FAIRFIELD UNIVERSITY BOARD OF TRUSTEES 2016‐2017 (continued)
Katherine N. Lapp '78 Executive Vice President Harvard University
Stephen M. Lessing '76 Managing Director Barclays
Bill McIntosh, P'92, '86
Andrew J. McMahon '89, P'19, '13 Founder Vitae Advisors, LLC
John C. Meditz '70 Managing Director, Co‐Founder, Senior Portfolio Manager Horizon Kinetics, LLC
Elner L. Morrell '81, P'03 Director, Business Architecture UnitedHealthcare IS, Medicare & Retirement
Robert J. Murphy Jr. '71 Administrative Vice President ABC News
Most Rev. George V. Murry, S.J. Bishop Diocese of Youngstown
Gavin G. O'Connor '88 Partner & COO, Investment Management Division Goldman Sachs
Biff J. O’Reilly '80, P'11 President PBS Capital
Rev. Stephen A. Privett, S.J. Chancellor & President Emeritus University of San Francisco
Katie Jacobs Robinson '89 Delaware North Companies
Marianne Dolan Weber, P'16 Manager MLC Ventures LLC
James D. Wehr '79
TRUSTEES EMERITI
E. Gerald Corrigan '63
Charles F. Dolan, P'86, '85
Roger M. Lynch '63, P'95
Rev. Aloysius P. Kelley, S.J., President Emeritus
Rev. Jeffrey P. von Arx, S.J., President Emeritus
Office of Institutional Research Page | 13
HONORARY DEGREES AWARDED ‐ COMMENCEMENT 2010 to Present
2016: Commencement, May 22 Cynthia R. Bigelow, – Doctor of Laws Maureen Fleming, SSND – Doctor of Laws Donald James Gummer – Doctor of Humane Letters Agbonkhianmeghe E. Orobator, S.J. – Doctor of Laws Julio J. Ramirez – Doctor of Science
2015: Commencement, May 17 Gregory Joseph Boyle, S.J. – Doctor of Humanities James Martin, S.J. – Doctor of Humane Letters John Charles Meditz – Doctor of Humanities Sharon Robinson – Doctor of Science Clea Newman Soderlund – Doctor of Humanities
2014: Commencement, May 18 Mary Ann Christopher, MSN, RN, FAAN ‐ Doctor of Science Elizabeth A. Johnson, CSJ ‐ Doctor of Humane Letters Sharon Mary Katherine Kugler ‐ Doctor of Humane Letters John W. Padberg, S.J. ‐ Doctor of Humane Letters John Stuart Santa ‐ Doctor of Laws
2013: Commencement, May 19 Maureen L. Clark, CSJ ‐ Doctor of Laws Patricia Farrell, OSF ‐ Doctor of Laws Rev. Michael J. Garanzini, S.J. ‐ Doctor of Laws Dr. Patrick W. Kelley ’76, P’12 ‐ Doctor of Science William Peter McDonald ’75 ‐ Doctor of Laws
2012: Commencement, May 20 Reverend Richard J. Clifford, S.J. – Doctor of Humane Letters Jane Ellen Ferreira – Doctor of Humane Letters Sister Claire Fitzgerald, S.S.N.D. – Doctor of Humane Letters Joseph P. Russoniello – Doctor of Laws Dr. Joseph G. Timpone, Jr. – Doctor of Science Suzanne Wright – Doctor of Laws Bob Wright – Doctor of Laws
2011: Commencement, May 22 Honorable Maryanne Trump Barry – Doctor of Laws Russell L. Goings – Doctor of Humane Letters Rear Admiral Brian P. Monahan – Doctor of Science Reverend John W. O’Malley, S.J. – Doctor of Humane Letters Joseph D. Sargent – Doctor of Laws
2010: Commencement, May 23 James L. Abbruzzese – Doctor of Science Reverend Daniel J. Harrington, S.J. – Doctor of Humane Letters Katherine Lapp – Doctor of Laws Dr. Mayra Luz Perez Diaz – Doctor of Laws Emily Kernan Rafferty – Doctor of Laws
Office of Institutional Research Page | 14
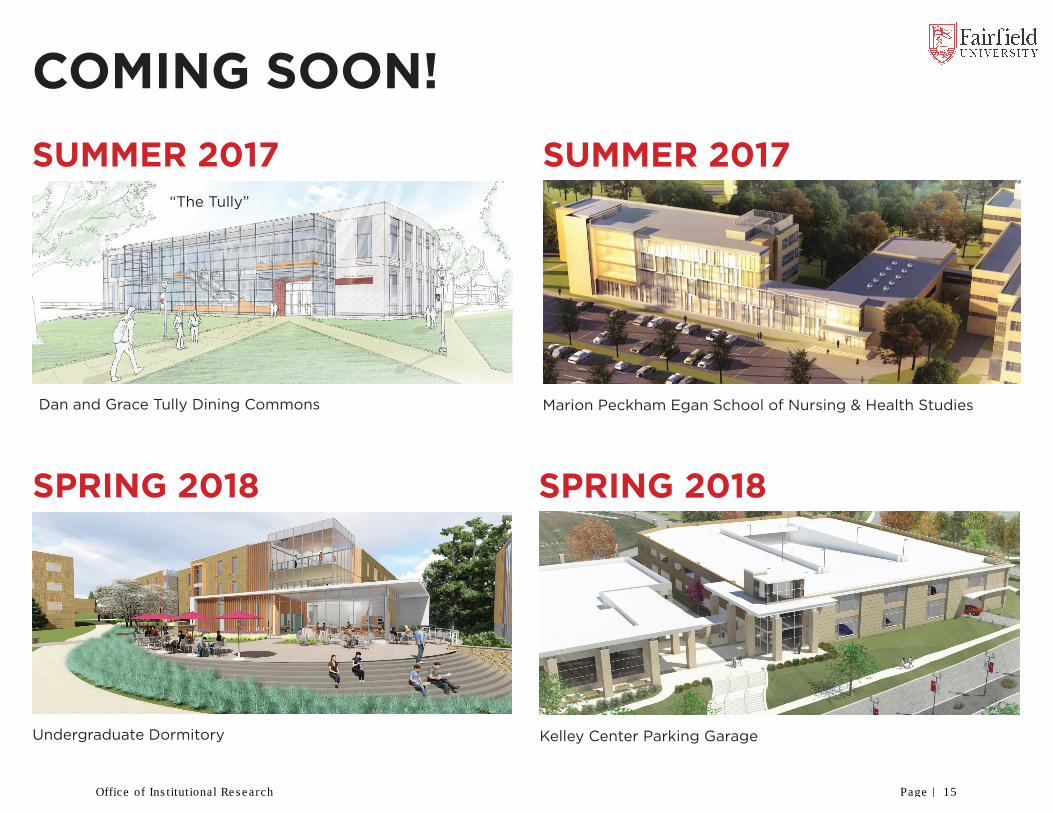
SUMMER 2017
COMING SOON!
Dan and Grace Tully Dining Commons
“The Tully”
SPRING 2018
Undergraduate Dormitory
SPRING 2018
SUMMER 2017
Kelley Center Parking Garage
Marion Peckham Egan School of Nursing & Health Studies
Office of Institutional Research Page | 15

DEGREES OFFEREDUndergraduate and Graduate
Applied Psychology‐‐Foundations of Advanced PsychologyBiochemistry
Bioengineering
Biology
Chemistry
Bachelor's Degree Master's Degree
Accounting
American Studies
Art History and Visual Culture
German
Communication
Computer Engineering
Computer Science
Digital Journalism
Economics
Electrical Engineering
English
Environmental Studies
Film, Television and Media Arts
Finance/Financial Management
French
Music
History
Individually Designed Major
Information Systems & Operations Management
International Business
International Studies
Italian
Liberal Studies
Management
Marketing
Mathematics
Mechanical Engineering
Studio Art
Nursing
Philosophy
Physics
Politics
Psychology
Public Relations
Electrical and Computer Engineering
Theatre
Accounting
Advanced Practice Nursing
American Studies
Applied Psychology‐‐Industrial and Organizational Psychology
Bilingual Education
Business Administration
Business Analytics, Hybrid
Clinical Mental Health Counseling
Clinical Nurse Leader
Religious Studies
Sociology
Sociology & Anthropology
Software Engineering
Spanish
Communication
Creative Writing
Dual Degree BS/MS in Electrical and Computer Engineering
Dual Degree BS/MS in Software Engineering
Educational Technology
Software Engineering
Elementary Education
Family Studies
Finance/Financial Management
Management of Technology
Marriage & Family Therapy
Mathematics
Mechanical Engineering
Public Administration
School Counseling
School Psychology
Secondary Education with Initial 7‐12 Certification
Special Education
Teaching and Foundation
TESOL: Teaching English as a Second Language
Doctor of Nurse Practice
Doctor's Degrees
Office of Institutional Research Page | 16

2016‐2017 FAIRFIELD UNIVERSITY DATA
OFFICE OF INSTITUTIONAL RESEARCH
Fairfield, Connecticut

FAIRFIELD UNIVERSITY STUDENT ASSOCIATION (FUSA)FUSA Presidents
FUSA President Year in Office FUSA President Year in Office
Zoë Ferranti 2016‐2017 Andrew M. McGowan 1980‐81
Anif McDonald 2015‐16 James G. Connolly 1979‐80
Alexander Cucchi 2014‐15 Vincent J. O’Brien 1978‐79
Alexander Long 2013‐14 Mark C. Dorgan 1977‐78
Robert Vogel 2011‐13* Brian Visokay 1976‐77
Charles Knights 2011‐11# Edward C. Burt Jr 1975‐76
Edwin A. Muniz 2010‐11 Anthony G. Mixcus 1974‐75
Jeffrey L. Seiser 2008‐10 Edmond J. Harrison 1973‐74
Hutchenson T. Williams 2006‐08 Richard I. Canel Jr 1972‐73
Jessica DiBuono 2005‐06 Stephen G. Dormer 1971‐72
Paul Duffy 2004‐05 Dennis Gallagher 1970‐71
Kevin M. Neubauer 2003‐04 Albert J. Mariani 1969‐70
Karen Donoghue 2002‐03 Philip S. Howe 1968‐69
Joseph Piagentini 2001‐02 Michael J. Bocchini 1967‐68
Kevin C. Hayes 2000‐01 Kevin B. McGovern 1966‐67
Luigi Sola Jr. 1999‐00 David G. Bannon 1965‐66
Michael C. Piagentini 1998‐99 Joseph A. Santagnelo 1964‐65
Christopher F. Cipriano 1997‐98 James D. Davidson 1963‐64
Michael B. Reardon 1996‐97 Gerald F. McCarthy 1962‐63
Mark C. Reed 1995‐96 Lewis C. Zowine 1961‐62
Chrisopher M. Pilkerton 1994‐95 David M. Royston 1960‐61
Mark J. Resnick 1993‐94 Ernest B. Garrity 1959‐60
Stephen C. Shannon 1992‐93 Randolph T. Harper 1958‐59
Brian M. Hayes 1991‐92 William J. Doyle 1957‐58
Christoper E. McSherry 1990‐91 Robert J. Imbro 1956‐57
Thomas C. Pellegrino 1990‐90 Daniel E. Reed 1955‐56
Warren Di Donato 1989‐90 Gerald K. Colley 1954‐55
Frank J. Carroll 1988‐89 Gerald P. Smith 1953‐54
Christoper W. Ritchie 1987‐88 Timothy F. Cronin 1952‐53
Michael S. Miller 1986‐87 Harold F. Mullen 1951‐52
James F. English 1985‐86 John J. McNamara 1950‐51
Francis Kenally 1984‐85 James P. Conklin 1949‐50
Robert M. Sullivan 1983‐84 Edward R. Glannery 1948‐49
Sean McAuliffe 1982‐83 Harold J. Savard 1947‐48
Michael Bentivegna 1981‐82
* Took over term
# Resigned
Office of Institutional Research Page | 18
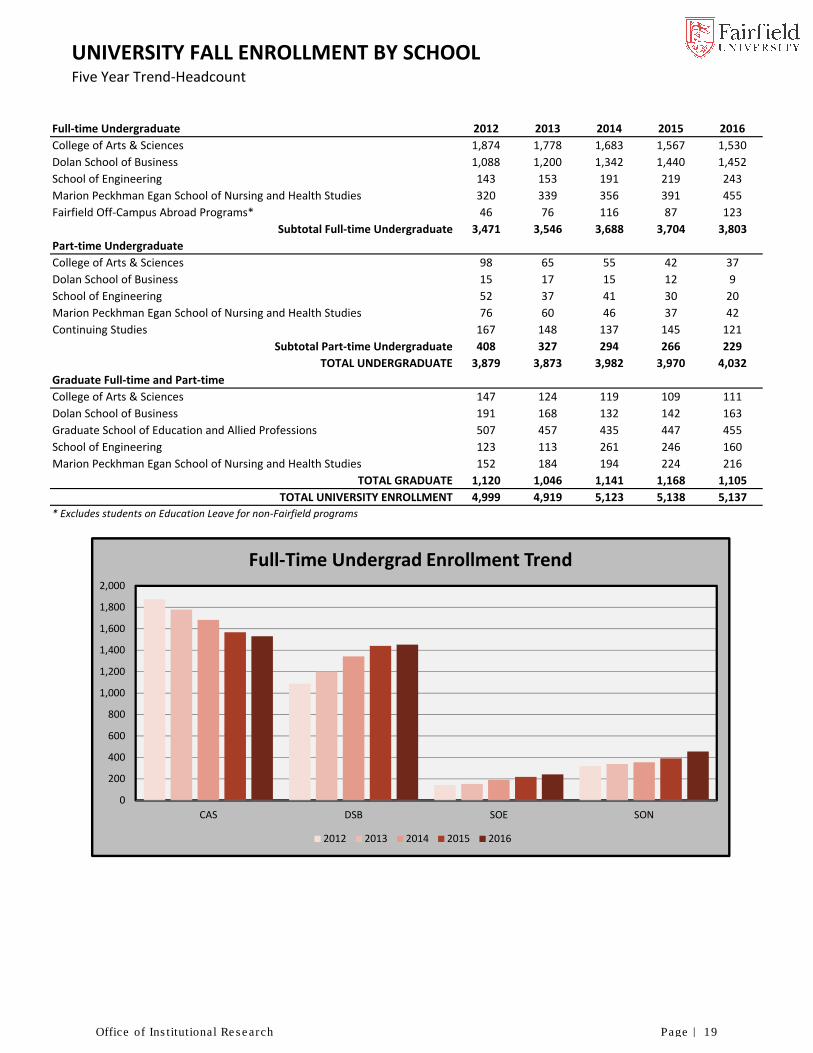
UNIVERSITY FALL ENROLLMENT BY SCHOOLFive Year Trend‐Headcount
Full‐time Undergraduate 2012 2013 2014 2015 2016
College of Arts & Sciences 1,874 1,778 1,683 1,567 1,530
Dolan School of Business 1,088 1,200 1,342 1,440 1,452
School of Engineering 143 153 191 219 243
Marion Peckhman Egan School of Nursing and Health Studies 320 339 356 391 455
Fairfield Off‐Campus Abroad Programs* 46 76 116 87 123
Subtotal Full‐time Undergraduate 3,471 3,546 3,688 3,704 3,803
Part‐time Undergraduate
College of Arts & Sciences 98 65 55 42 37
Dolan School of Business 15 17 15 12 9
School of Engineering 52 37 41 30 20
Marion Peckhman Egan School of Nursing and Health Studies 76 60 46 37 42
Continuing Studies 167 148 137 145 121
Subtotal Part‐time Undergraduate 408 327 294 266 229
TOTAL UNDERGRADUATE 3,879 3,873 3,982 3,970 4,032
Graduate Full‐time and Part‐time
College of Arts & Sciences 147 124 119 109 111
Dolan School of Business 191 168 132 142 163
Graduate School of Education and Allied Professions 507 457 435 447 455
School of Engineering 123 113 261 246 160
Marion Peckhman Egan School of Nursing and Health Studies 152 184 194 224 216
TOTAL GRADUATE 1,120 1,046 1,141 1,168 1,105
TOTAL UNIVERSITY ENROLLMENT 4,999 4,919 5,123 5,138 5,137
* Excludes students on Education Leave for non‐Fairfield programs
0
200
400
600
800
1,000
1,200
1,400
1,600
1,800
2,000
CAS DSB SOE SON
Full‐Time Undergrad Enrollment Trend
2012 2013 2014 2015 2016
Office of Institutional Research Page | 19

FALL ENROLLMENTFull‐Time/Part‐Time Head Count
Fall FT PT TOTAL FT PT TOTAL
1955 749 336
1960 1,260 592
1965 1,389 37 1,426 40 828 868
1970 2,105 8 2,113 122 1,380 1,502
1975 2,727 490 3,217 110 1,558 1,668
1980 2,961 1,130 4,091 89 882 971
1985 3,017 1,041 4,058 76 943 1,019
1990 3,017 1,027 4,044 88 689 777
1995 3,027 1,186 4,213 147 620 767
1996 3,100 1,164 4,264 146 701 847
1997 3,129 1,140 4,269 166 744 910
1998 3,224 1,057 4,281 164 763 927
1999 3,228 836 4,064 166 897 1,063
2000 3,401 772 4,173 169 846 1,015
2001 3,399 765 4,164 153 837 990
2002 3,387 686 4,073 192 849 1,041
2003 3,381 639 4,020 228 805 1,033
2004 3,305 637 3,942 232 886 1,118
2005 3,485 588 4,073 243 857 1,100
2006 3,460 548 4,008 270 813 1,083
2007 3,484 546 4,030 235 759 994
2008 3,469 615 4,084 250 794 1,044
2009 3,320 566 3,886 351 837 1,188
2010 3,388 535 3,923 389 869 1,258
2011 3,385 450 3,835 383 773 1,156
2012 3,471 408 3,879 370 750 1,120
2013 3,546 327 3,873 384 662 1,046
2014 3,688 294 3,982 513 628 1,141
2015 3,704 266 3,970 513 655 1,168
2016 3,803 229 4,032 467 638 1,105
enrolled in Fairfield University's programs abroad pre‐2008
Undergraduate* Graduate
* Includes University College and School of Engineering credit students; does not include students
3,600
3,700
3,800
3,900
4,000
4,100
4,200
4,300
2005 2010 2012 2013 2014 2015 2016
Total Fall EnrollmentUndergraduate
0
200
400
600
800
1,000
1,200
1,400
2005 2010 2012 2013 2014 2015 2016
Total Fall EnrollmentGraduate
Office of Institutional Research Page | 20

FALL ENROLLMENTFull‐Time Equivalent (FTE)*
Fall Undergraduate Graduate TOTAL
1965 1,401 316 1,717
1970 2,108 582 2,690
1975 2,890 629 3,519
1980 3,337 383 3,720
1985 3,364 390 3,754
1990 3,359 318 3,677
1995 3,422 354 3,776
1996 3,488 380 3,868
1997 3,509 414 3,923
1998 3,576 418 3,994
1999 3,507 465 3,972
2000 3,658 451 4,109
2001 3,654 432 4,086
2002 3,616 475 4,091
2003 3,594 496 4,090
2004 3,517 527 4,044
2005 3,681 529 4,210
2006 3,643 541 4,184
2007 3,577 488 4,065
2008 3,674 515 4,189
2009 3,518 644 4,162
2010 3,566 679 4,245
2011 3,535 641 4,176
2012 3,607 620 4,227
2013 3,655 605 4,260
2014 3,786 722 4,508
2015 3,793 731 4,524
2016 3,879 680 4,559
* Includes University College and School of Engineering credit students;
abroad pre‐2008
does not include students enrolled in Fairfield University's programs
3,300
3,400
3,500
3,600
3,700
3,800
3,900
4,000
2000
2001
2002
2003
2004
2005
2006
2007
2008
2009
2010
2011
2012
2013
2014
2015
2016
Fall Full‐Time Equivalent TrendUndergraduate
Undergraduate
0
100
200
300
400
500
600
700
800
2000
2001
2002
2003
2004
2005
2006
2007
2008
2009
2010
2011
2012
2013
2014
2015
2016
Fall Full‐Time Equivalent Trend Graduate
Graduate
Office of Institutional Research Page | 21
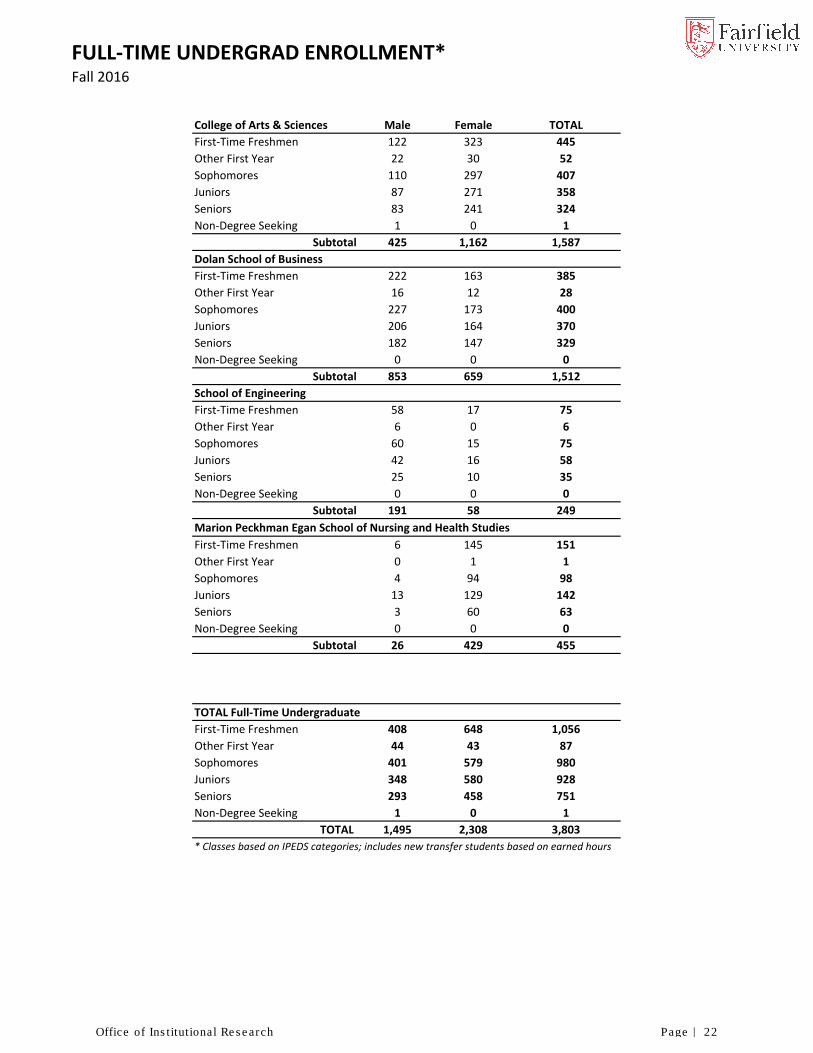
FULL‐TIME UNDERGRAD ENROLLMENT*Fall 2016
College of Arts & Sciences Male Female TOTAL
First‐Time Freshmen 122 323 445
Other First Year 22 30 52
Sophomores 110 297 407
Juniors 87 271 358
Seniors 83 241 324
Non‐Degree Seeking 1 0 1
Subtotal 425 1,162 1,587
Dolan School of Business
First‐Time Freshmen 222 163 385
Other First Year 16 12 28
Sophomores 227 173 400
Juniors 206 164 370
Seniors 182 147 329
Non‐Degree Seeking 0 0 0
Subtotal 853 659 1,512
School of Engineering
First‐Time Freshmen 58 17 75
Other First Year 6 0 6
Sophomores 60 15 75
Juniors 42 16 58
Seniors 25 10 35
Non‐Degree Seeking 0 0 0
Subtotal 191 58 249
Marion Peckhman Egan School of Nursing and Health Studies
First‐Time Freshmen 6 145 151
Other First Year 0 1 1
Sophomores 4 94 98
Juniors 13 129 142
Seniors 3 60 63
Non‐Degree Seeking 0 0 0
Subtotal 26 429 455
TOTAL Full‐Time Undergraduate
First‐Time Freshmen 408 648 1,056
Other First Year 44 43 87
Sophomores 401 579 980
Juniors 348 580 928
Seniors 293 458 751
Non‐Degree Seeking 1 0 1
TOTAL 1,495 2,308 3,803
* Classes based on IPEDS categories; includes new transfer students based on earned hours
Office of Institutional Research Page | 22

GRADUATE ENROLLMENTFall 2016
College of Arts & Sciences Male Female Male Female TOTAL
American Studies 1 0 5 7 13
Communication 1 4 6 6 17
Creative Writing (MFA) 10 30 0 0 40
Mathematics 5 2 7 5 19
Public Administration 3 4 3 10 20
Undeclared 0 0 1 0 1
Certification 0 0 1 0 1
Subtotal 20 40 23 28 111
Dolan School of Business
Accounting 21 26 0 0 47
Business Administration (MBA) 21 7 20 12 60
Business Analytics 15 6 5 7 33
Finance 8 2 6 4 20
Certification 0 0 0 3 3
Subtotal 65 41 31 26 163
Graduate School of Education and Allied Professions
Applied Psychology 5 11 3 9 28
Clinical/Mental Health Counseling 3 15 3 37 58
Educational Studies and Teacher Prep. 8 39 21 45 113
Educational Technology 0 0 2 3 5
Family Studies 0 1 0 1 2
Marriage and Family Therapy 2 30 3 38 73
School Counseling 3 11 2 18 34
School Library Media (School Media) 0 0 3 3 6
School Psychology 0 13 3 8 24
Special Education 0 4 3 18 25
Undeclared 0 0 0 3 3
Certification 0 8 7 69 84
Subtotal 21 132 50 252 455
School of Engineering
Electrical and Computer Engineering 22 13 7 3 45
Management of Technology 19 6 6 5 36
Mechanical Engineering 18 3 18 0 39
Software Engineering 14 9 10 6 39
Certification 0 0 0 1 1
Subtotal 73 31 41 15 160
Marion Peckhman Egan School of Nursing and Health Studies
Nursing 0 1 9 81 91
Doctor of Nursing 8 35 9 73 125
Subtotal 8 36 18 154 216
TOTAL GRADUATE ENROLLMENT 187 280 163 475 1,105
Full‐Time Part‐Time
Office of Institutional Research Page | 23

GRADUATE ENROLLMENT ‐ REGISTERED HOURSFall 2016
College of Arts & Sciences Full‐Time Part‐Time TOTAL
American Studies 9 51 60
Communication 45 42 87
Creative Writing (MFA) 594 0 594
Mathematics 66 42 108
Public Administration 78 60 138
Undeclared 0 3 3
Certification 0 3 3
Subtotal 792 201 993
Dolan School of Business
Accounting 561 0 561
Business Administration (MBA) 309 150 459
Business Analytics 237 60 297
Finance 99 45 144
Undeclared 0 0 0
Certification 0 12 12
Subtotal 1,206 267 1,473
Graduate School of Education and Allied Professions
Applied Psychology 147 51 198
Clinical/Mental Health Counseling 165 192 357
Educational Studies and Teacher Prep. 467 318 785
Educational Technology 0 27 27
Family Studies 9 3 12
Marriage and Family Therapy 291 220 511
School Counseling 135 108 243
School Library Media (School Media) 0 27 27
School Psychology 147 48 195
Special Education 36 108 144
Undeclared 0 9 9
Certification 73 373 446
Subtotal 1,470 1,484 2,954
School of Engineering
Electrical and Computer Engineering 331 50 381
Management of Technology 259 51 310
Mechanical Engineering 197 75 272
Software Engineering 211 75 286
Certification 0 3 3
Subtotal 998 254 1,252
Marion Peckhman Egan School of Nursing and Health Studies
Nursing 11 452 463
Doctor of Nursing 429 500 929
Subtotal 440 952 1,392
TOTAL GRADUATE REGISTERED HOURS 4,906 3,158 8,064
Registered Hours
Office of Institutional Research Page | 24

MAJORS OF STUDENTS ENROLLED IN FULL‐TIME UG PROGRAMSFall 2016
College of Arts & Sciences Freshman Sophomore Junior Senior
Educ
Leave*
Total 1st
Majors#
Total 2nd
Majors#
Bachelor of Arts
American Studies 0 0 0 1 0 1 3
Communication 36 58 65 69 14 228 22
Digital Journalism 3 12 7 2 1 24 4
Economics 4 6 8 7 2 25 3
English 20 26 49 37 9 132 8
Environmental Studies 3 8 2 3 0 16 2
History 7 2 3 8 1 20 7
Individually Designed Major 0 0 0 1 0 1 2
International Studies 4 13 17 7 5 41 7
Liberal Studies 0 0 2 5 0 7 0
Modern Languages & Literature 4 0 5 3 1 12 19
Philosophy 1 0 3 4 0 8 6
Politics 16 13 17 16 2 62 18
Psychology 59 45 60 49 11 213 5
Public Relations 2 13 8 1 0 24 5
Religious Studies 0 0 0 1 0 1 2
Sociology 6 3 9 1 0 19 5
Sociology and Anthropology 1 3 1 4 0 9 1
Visual and Performing Arts 25 25 20 16 3 86 19
Arts and Sciences Undeclared 191 102 5 0 1 298 0
TOTAL Bachelor of Arts 382 329 281 235 50 1,227 138
Bachelor of Science
Biochemistry 11 7 7 8 0 33 0
Biology 77 43 35 48 4 203 0
Chemistry 6 5 2 4 1 17 1
Economics 2 0 4 3 0 9 9
Individually Designed Major 0 0 0 1 0 1 0
Mathematics 15 17 15 19 0 66 8
Physics 2 2 2 1 0 7 0
Psychology 2 4 12 5 2 23 3
Arts and Sciences Undeclared 0 0 0 0 0 0 0
TOTAL Bachelor of Science 115 78 77 89 7 359 21
TOTAL Non‐Degree Seeking 1 0 0 0 0 1 0
TOTAL Arts and Sciences 497 407 358 324 57 1,587 159
Dolan School of Business
Accounting 46 51 93 92 11 282 17
Finance 64 57 108 93 15 322 42
Information Systems 0 3 5 6 3 14 8
International Business 17 11 18 11 4 57 10
Management 33 30 29 41 4 133 14
Management Entrepreneur 0 1 0 1 0 2 1
Management Human Resoures 0 0 1 0 0 1 0
Marketing 50 66 89 82 23 287 26
Marketing Integrated Marketing Communication 0 0 0 1 0 1 0
Business Undeclared 203 181 27 2 0 413 0
TOTAL Business 413 400 370 329 60 1,512 118
School of Engineering
Bioengineering 8 10 5 0 1 23 0
Computer Engineering 10 1 4 4 0 19 0
Computer Science 6 7 8 2 0 23 1
Electrical Engineering 3 11 4 9 1 27 0
Mechanical Engineering 30 32 29 18 4 109 0
Software Engineering 5 6 7 2 0 20 0
Engineering Undeclared 19 8 1 0 0 28 0
TOTAL Engineering 81 75 58 35 6 249 1
Marion Peckhman Egan School of Nursing and Health Studies
TOTAL Nursing 152 98 142 63 0 455 0
GRAND TOTAL 1,143 980 928 751 123 3,803 278
# Both degree and non‐degree seeking students are included in the Total 1st Majors Column and the Total 2nd Majors Column
^ Class Year Classification = number of earned hours as of 10/1
Degree‐Seeking Students^
* All Fairfield students who are on educational leave are included in the Total 1st Majors Column and the Total 2nd Majors Column
Office of Institutional Research Page | 25

FULL‐TIME UNDERGRADUATE RESIDENT STATUS*
Fall N % N % TOTAL
2000 2,614 78% 729 22% 3,343
2005 2,687 77% 798 23% 3,485^
2010 2,526 75% 862 25% 3,388^
2014 2,929 79% 759 21% 3,688
2015 2,901 78% 803 22% 3,704
2016 2,955 78% 848 22% 3,803
N % N %
Commuters 293 8% 328 9%
Off‐Campus Beach 510 14% 520 14%
On‐Campus 2,901 78% 2,955 78%
Total Enrolled 3,704 100% 3,803 100%
* Source: IR fall census
# Includes 123 Ed Leave students
ACYR 2017 ACYR 2018 ACYR 2019 ACYR 2020 Undefined TOTAL
Commuters 122 164 85 84 97 552
Off‐Campus Beach 522 0 0 0 0 522
On‐Campus# 279 821 855 998 5 2,958
Total Enrolled 923 985 940 1,082 102 4,032
% On Campus 7% 20% 21% 25% 0% 73%
* Academic Year (ACYR) = Predicted graduation year
# Includes 123 Ed Leave students
# Including Resident Hall Advisors who are full‐time students; includes students on Study Abroad
^ Includes General Studies students
On‐Campus Residents# Off‐Campus Boarders & Commuters
* Source: 2000, 2005, and 2010 counts from Residence Life Bi‐Annual Report; 2014, 2015, and 2016 counts from IR fall census
Fall 2015 Fall 2016#
2015 & 2016 Full‐Time Residential Statistics*
2016 Residential Statistics*Full‐Time and Part‐Time Students
Office of Institutional Research Page | 26
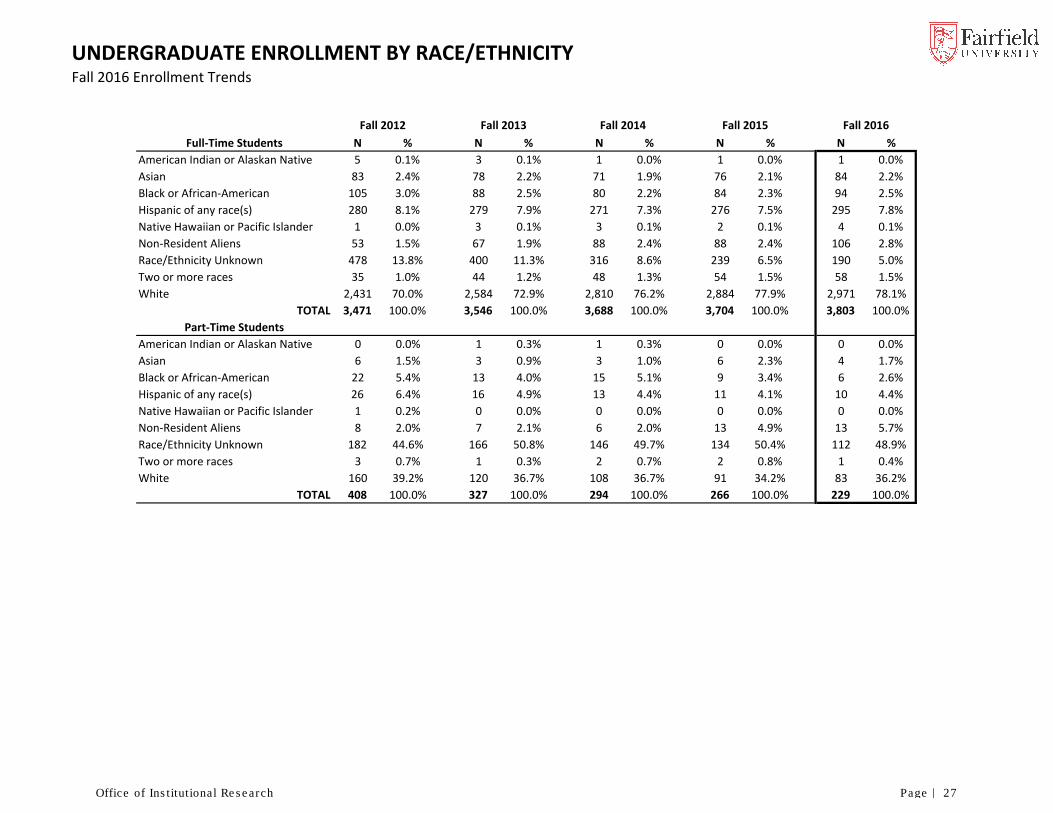
UNDERGRADUATE ENROLLMENT BY RACE/ETHNICITYFall 2016 Enrollment Trends
Full‐Time Students N % N % N % N % N %
American Indian or Alaskan Native 5 0.1% 3 0.1% 1 0.0% 1 0.0% 1 0.0%
Asian 83 2.4% 78 2.2% 71 1.9% 76 2.1% 84 2.2%
Black or African‐American 105 3.0% 88 2.5% 80 2.2% 84 2.3% 94 2.5%
Hispanic of any race(s) 280 8.1% 279 7.9% 271 7.3% 276 7.5% 295 7.8%
Native Hawaiian or Pacific Islander 1 0.0% 3 0.1% 3 0.1% 2 0.1% 4 0.1%
Non‐Resident Aliens 53 1.5% 67 1.9% 88 2.4% 88 2.4% 106 2.8%
Race/Ethnicity Unknown 478 13.8% 400 11.3% 316 8.6% 239 6.5% 190 5.0%
Two or more races 35 1.0% 44 1.2% 48 1.3% 54 1.5% 58 1.5%
White 2,431 70.0% 2,584 72.9% 2,810 76.2% 2,884 77.9% 2,971 78.1%
TOTAL 3,471 100.0% 3,546 100.0% 3,688 100.0% 3,704 100.0% 3,803 100.0%
Part‐Time Students
American Indian or Alaskan Native 0 0.0% 1 0.3% 1 0.3% 0 0.0% 0 0.0%
Asian 6 1.5% 3 0.9% 3 1.0% 6 2.3% 4 1.7%
Black or African‐American 22 5.4% 13 4.0% 15 5.1% 9 3.4% 6 2.6%
Hispanic of any race(s) 26 6.4% 16 4.9% 13 4.4% 11 4.1% 10 4.4%
Native Hawaiian or Pacific Islander 1 0.2% 0 0.0% 0 0.0% 0 0.0% 0 0.0%
Non‐Resident Aliens 8 2.0% 7 2.1% 6 2.0% 13 4.9% 13 5.7%
Race/Ethnicity Unknown 182 44.6% 166 50.8% 146 49.7% 134 50.4% 112 48.9%
Two or more races 3 0.7% 1 0.3% 2 0.7% 2 0.8% 1 0.4%
White 160 39.2% 120 36.7% 108 36.7% 91 34.2% 83 36.2%
TOTAL 408 100.0% 327 100.0% 294 100.0% 266 100.0% 229 100.0%
Fall 2015Fall 2014 Fall 2013Fall 2012 Fall 2016
Office of Institutional Research Page | 27

INTERNATIONAL STUDENTS*Fall 2016
Enrollment by Class Year
Undergraduate# Male Female TOTAL
First‐Time Freshmen 20 19 39
Other First Year 5 7 12
Sophomore 10 6 16
Junior 13 7 20
Senior 9 10 19
Non‐Degree Seeking 1 7 8
Part‐time 2 3 5
Undergraduate TOTAL 60 59 119
Enrollment by School
Undergraduate# Male Female TOTAL
College of Arts & Sciences 13 37 50
Dolan School of Business 29 15 44
School of Engineering 17 2 19
Marion Peckhman Egan School of Nursing and Health Studies 1 2 3
Certificate Programs 3 3
Undergraduate TOTAL 60 59 119
Graduate# Male Female TOTAL
College of Arts & Sciences 3 5 8
Dolan School of Business 21 18 39
Graduate School of Education and Allied Professions 0 6 6
School of Engineering 71 37 108
Marion Peckhman Egan School of Nursing and Health Studies 0 2 2
Graduate TOTAL 95 68 163
TOTAL ENROLLED INTERNATIONAL STUDENTS 155 127 282
* International student population refers to Non Resident Alien students as defined by IPEDS
# Full‐time and Part‐time
Office of Institutional Research Page | 28

FIRST‐YEAR STUDENT ADMISSION TREND*
Fall CAS DSB SOE SON TOTAL CAS DSB SOE SON TOTAL CAS DSB SOE SON GS TOTAL
1970 N/A N/A N/A N/A 2,249 N/A N/A N/A N/A 1,346 N/A N/A N/A N/A N/A 698
1975 2,341 N/A N/A 305 2,646 1,465 N/A N/A 76 1,541 717 N/A N/A 44 N/A 761
1980 2,777 1,259 N/A 348 4,384 1,307 472 N/A 122 1,901 497 205 N/A 50 N/A 752
1985 3,529 1,920 N/A 240 5,689 1,428 618 N/A 143 2,189 509 237 N/A 40 N/A 786#
1990 3,541 1,274 N/A 165 4,980 1,957 628 N/A 123 2,708 536 188 N/A 32 N/A 756#
1995 3,445 1,164 N/A 232 4,841 2,425 830 N/A 170 3,425 532 223 N/A 43 N/A 798#
2000 4,408 1,748 150 190 6,496 2,785 1,041 110 142 4,078 641 303 20 44 N/A 1,008
2001 4,718 2,016 194 199 7,127 2,392 825 144 142 3,503 541 225 29 37 N/A 832
2002 4,713 1,770 281 209 6,973 2,340 832 126 165 3,463 531 224 19 40 31 845
2003 5,065 1,994 269 327 7,655 2,558 857 153 214 3,782 509 207 21 46 33 816
2004 4,604 1,861 268 403 7,136 3,039 1,063 198 247 4,547 533 248 24 50 37 892
2005 4,411 1,803 268 413 6,895 3,349 1,274 233 274 5,130 573 278 24 62 50 987
2006 4,951 2,275 296 513 8,035 3,102 1,242 226 296 4,866 586 236 29 68 4 923
2007 5,164 2,499 330 564 8,557 2,915 1,251 249 271 4,686 485 242 31 54 30 842
2008 5,113 2,565 419 635 8,732 3,102 1,432 305 318 5,157 496 266 36 65 36 899
2009 5,000 2,278 365 672 8,315 3,267 1,487 256 318 5,328 491 243 23 67 25 849
2010 5,201 1,978 453 785 8,417 3,815 1,417 318 426 5,976 545 224 32 94 27 922
2011 4,991 2,063 533 900 8,487 3,656 1,510 362 364 5,892 490 288 41 74 16 909
2012 5,290 2,398 619 949 9,256 3,991 1,786 410 398 6,585 523 344 46 77 N/A 990
2013 5,184 2,686 646 1,066 9,582 3,783 2,035 423 501 6,742 473 350 45 95 N/A 963
2014 5,174 2,971 709 1,124 9,978 3,831 2,266 490 550 7,137 486 404 57 109 N/A 1,056
2015 5,298 3,236 917 1,316 10,767 3,514 2,219 661 601 6,995 416 352 80 118 N/A 966
2016 5,332 3,317 913 1,493 11,055 3,399 2,108 621 667 6,795 450 379 76 151 N/A 1,056
* Enrollment counts are sourced from Admissions data and are not official 10/1 figures
FIRST‐YEAR STUDENT COHORT SAT QUARTILES
CLASS OF 25% 50% 75% 25% 50% 75% 25% 50% 75% 25% 50% 75%
2001 520 560 600 520 570 610 1060 1130 1210
2002 510 560 610 530 580 620 1160 1130 1220
2003 550 570 630 550 580 640 1100 1150 1270
2004 540 580 630 550 590 630 1100 1170 1250
2005 540 580 630 550 600 640 1100 1180 1260
2006 540 590 630 570 610 650 1130 1200 1260
2007 550 590 630 560 610 650 1120 1200 1270
2008 540 590 630 560 610 650 1120 1190 1280
2009 550 590 630 560 600 640 1120 1190 1250
2010 540 580 630 550 600 640 1670 1780 1890*
2011 530 580 620 550 590 640 1660 1770 1870
2012 520 560 610 540 580 630 540 580 630 1620 1730 1850
2013 520 570 610 530 570 630 530 580 630 1610 1730 1850
2014# 530 560 620 540 580 630 540 580 630 1640 1740 1850
2015 530 570 620 540 590 630 540 590 630 1610 1750 1880
2016 530 570 620 550 600 630 540 590 640 1620 1760 1890
2017 540 570 620 550 590 630 550 590 640 1670 1770 1870
2018 540 580 620 550 600 640 560 600 640 1680 1770 1870
2019 540 580 630 560 600 640 550 590 640 1690 1770 1880
2020 550 590 630 560 610 640 550 600 640 1690 1780 1880
* Writing SAT began but not reported in Admissions data until Class of 2012
# Beginning with Class of 2014, Fairfield University became test optional
CRITICAL READING MATH WRITING COMBINED
Applications Admitted Enrolled
# Prior to 1995, non‐first‐time freshman are included in count
Office of Institutional Research Page | 29
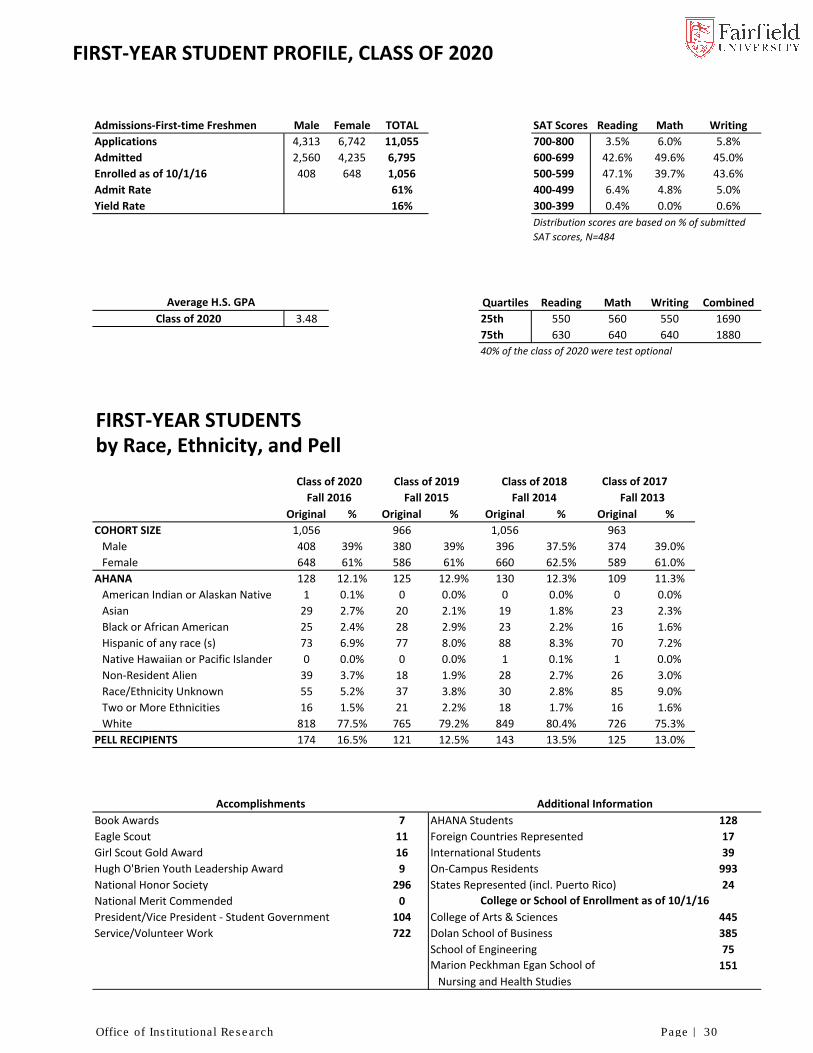
FIRST‐YEAR STUDENT PROFILE, CLASS OF 2020
Admissions‐First‐time Freshmen Male Female TOTAL SAT Scores Reading Math Writing
Applications 4,313 6,742 11,055 700‐800 3.5% 6.0% 5.8%
Admitted 2,560 4,235 6,795 600‐699 42.6% 49.6% 45.0%
Enrolled as of 10/1/16 408 648 1,056 500‐599 47.1% 39.7% 43.6%
Admit Rate 61% 400‐499 6.4% 4.8% 5.0%
Yield Rate 16% 300‐399 0.4% 0.0% 0.6%
Quartiles Reading Math Writing Combined
Class of 2020 3.48 25th 550 560 550 1690
75th 630 640 640 1880
40% of the class of 2020 were test optional
FIRST‐YEAR STUDENTSby Race, Ethnicity, and Pell
Original % Original % Original % Original %
COHORT SIZE 1,056 966 1,056 963
Male 408 39% 380 39% 396 37.5% 374 39.0%
Female 648 61% 586 61% 660 62.5% 589 61.0%
AHANA 128 12.1% 125 12.9% 130 12.3% 109 11.3%
American Indian or Alaskan Native 1 0.1% 0 0.0% 0 0.0% 0 0.0%
Asian 29 2.7% 20 2.1% 19 1.8% 23 2.3%
Black or African American 25 2.4% 28 2.9% 23 2.2% 16 1.6%
Hispanic of any race (s) 73 6.9% 77 8.0% 88 8.3% 70 7.2%
Native Hawaiian or Pacific Islander 0 0.0% 0 0.0% 1 0.1% 1 0.0%
Non‐Resident Alien 39 3.7% 18 1.9% 28 2.7% 26 3.0%
Race/Ethnicity Unknown 55 5.2% 37 3.8% 30 2.8% 85 9.0%
Two or More Ethnicities 16 1.5% 21 2.2% 18 1.7% 16 1.6%
White 818 77.5% 765 79.2% 849 80.4% 726 75.3%
PELL RECIPIENTS 174 16.5% 121 12.5% 143 13.5% 125 13.0%
Book Awards 7 AHANA Students 128
Eagle Scout 11 Foreign Countries Represented 17
Girl Scout Gold Award 16 International Students 39
Hugh O'Brien Youth Leadership Award 9 On‐Campus Residents 993
National Honor Society 296 States Represented (incl. Puerto Rico) 24
National Merit Commended 0
President/Vice President ‐ Student Government 104 College of Arts & Sciences 445
Service/Volunteer Work 722 Dolan School of Business 385
School of Engineering 75
151
Nursing and Health Studies
Marion Peckhman Egan School of
Distribution scores are based on % of submitted
SAT scores, N=484
College or School of Enrollment as of 10/1/16
Additional Information
Average H.S. GPA
Fall 2016 Fall 2015 Fall 2014 Fall 2013
Class of 2020 Class of 2019 Class of 2018 Class of 2017
Accomplishments
Office of Institutional Research Page | 30
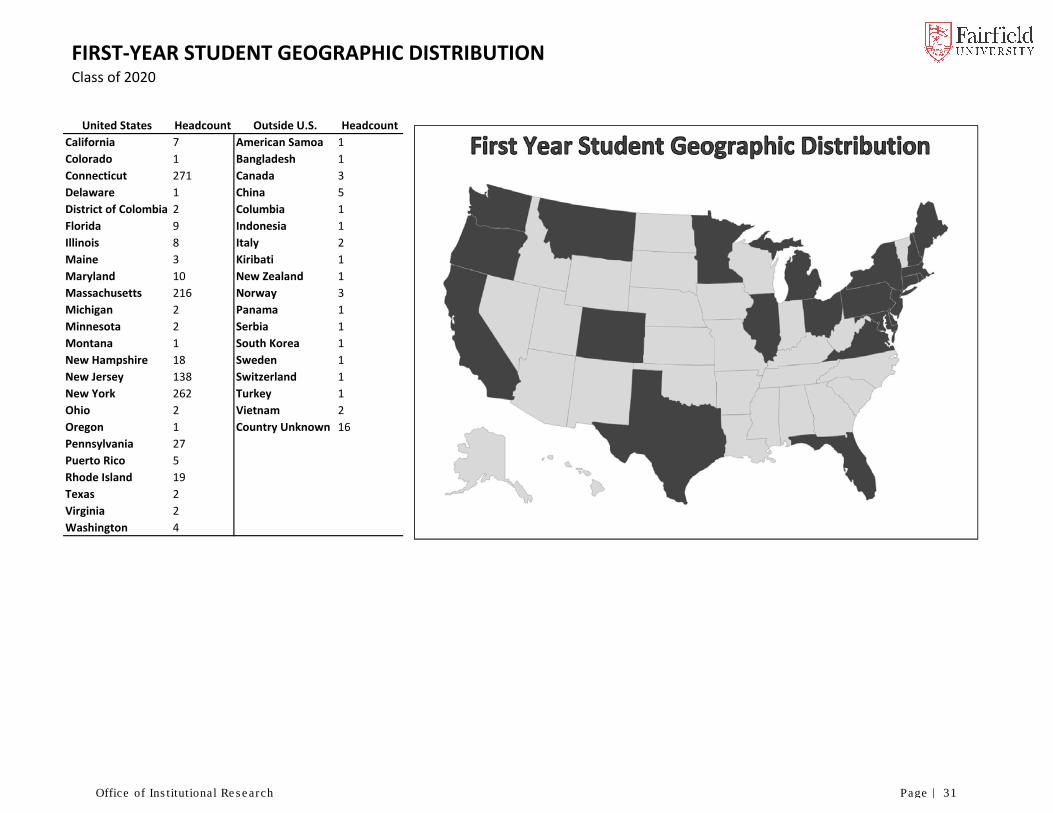
FIRST‐YEAR STUDENT GEOGRAPHIC DISTRIBUTIONClass of 2020
United States Headcount Outside U.S. Headcount
California 7 American Samoa 1
Colorado 1 Bangladesh 1
Connecticut 271 Canada 3
Delaware 1 China 5
District of Colombia 2 Columbia 1
Florida 9 Indonesia 1
Illinois 8 Italy 2
Maine 3 Kiribati 1
Maryland 10 New Zealand 1
Massachusetts 216 Norway 3
Michigan 2 Panama 1
Minnesota 2 Serbia 1
Montana 1 South Korea 1
New Hampshire 18 Sweden 1
New Jersey 138 Switzerland 1
New York 262 Turkey 1
Ohio 2 Vietnam 2
Oregon 1 Country Unknown 16
Pennsylvania 27
Puerto Rico 5
Rhode Island 19
Texas 2
Virginia 2
Washington 4
Office of Institutional Research Page | 31

UNIVERSITY GEOGRAPHIC DISTRIBUTIONFall 2016
CAS DSB SOE SON TOTAL CAS DSB GSEAP SOE SON TOTAL
New England States
Connecticut 477 319 73 122 991 27 38 122 4 38 229
Maine 7 5 1 3 16 1 0 0 0 0 1
Massachusetts 286 268 37 112 703 2 5 2 1 0 10
New Hampshire 13 21 3 7 44 1 0 1 0 0 2
Rhode Island 34 24 4 3 65 3 0 0 0 0 3
Vermont 2 4 0 2 8 0 0 0 0 0 0
Subtotal 819 641 118 249 1,827 34 43 125 5 38 245
Middle Atlantic States
Delaware 2 1 0 0 3 0 0 0 0 0 0
District of Columbia (DC) 2 0 0 0 2 0 0 0 0 0 0
Maryland 11 13 1 4 29 1 0 0 0 0 1
New Jersey 210 281 39 59 589 2 10 6 1 0 19
New York 386 418 54 116 974 5 20 13 1 5 44
Pennsylvania 41 46 8 10 105 1 2 0 0 0 3
Subtotal 652 759 102 189 1,702 9 32 19 2 5 67
Other States & U.S. Territories
Other States 67 56 9 13 145 11 0 5 1 0 17
Puerto Rico 5 9 1 0 15 0 0 0 0 0 0
Subtotal 72 65 10 13 160 11 0 5 1 0 17
Foreign Countries (63)
International Students 41 44 18 3 106 6 30 4 96 1 137
U.S. Citizens Living Abroad 3 3 1 1 8 0 1 0 0 0 1
Subtotal 44 47 19 4 114 6 31 4 96 1 138
TOTAL 1,587 1,512 249 455 3,803 60 106 153 104 44 467
Full time Undergraduate Students Full time Graduate Students
Office of Institutional Research Page | 32
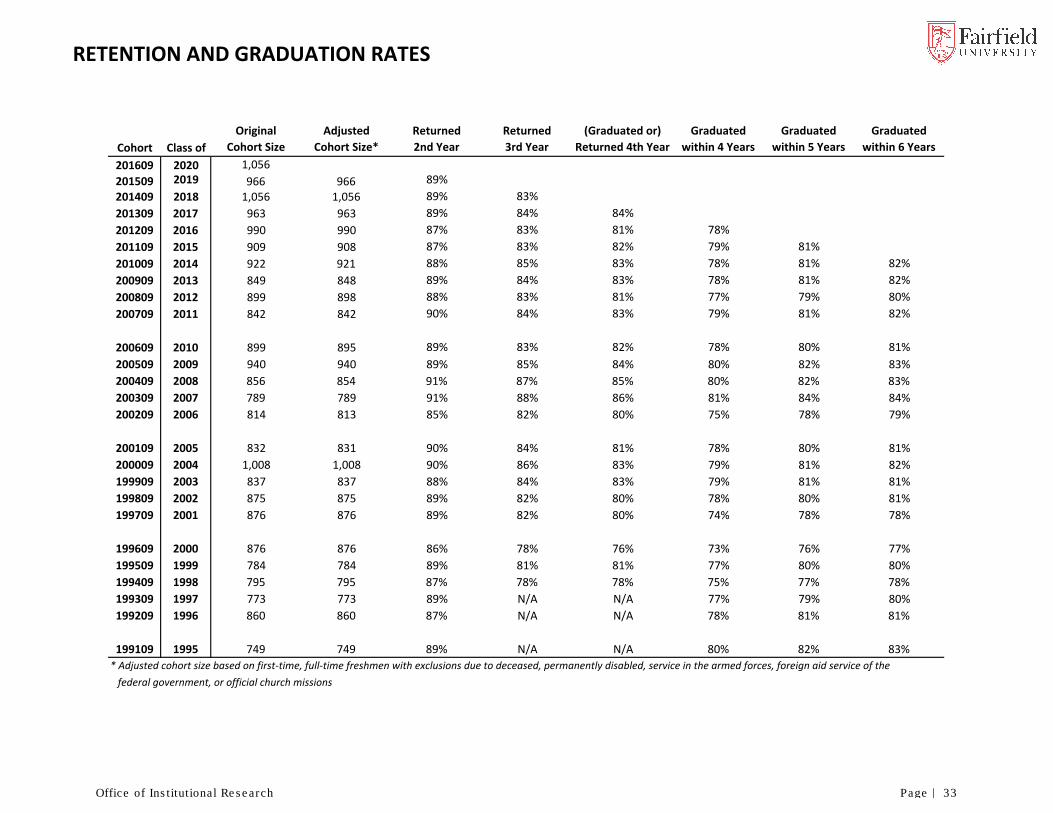
RETENTION AND GRADUATION RATES
Cohort Class of
Original
Cohort Size
Adjusted
Cohort Size*
Returned
2nd Year
Returned
3rd Year
(Graduated or)
Returned 4th Year
Graduated
within 4 Years
Graduated
within 5 Years
Graduated
within 6 Years
201609 2020 1,056
201509 2019 966 966 89%
201409 2018 1,056 1,056 89% 83%
201309 2017 963 963 89% 84% 84%
201209 2016 990 990 87% 83% 81% 78%
201109 2015 909 908 87% 83% 82% 79% 81%
201009 2014 922 921 88% 85% 83% 78% 81% 82%
200909 2013 849 848 89% 84% 83% 78% 81% 82%
200809 2012 899 898 88% 83% 81% 77% 79% 80%
200709 2011 842 842 90% 84% 83% 79% 81% 82%
200609 2010 899 895 89% 83% 82% 78% 80% 81%
200509 2009 940 940 89% 85% 84% 80% 82% 83%
200409 2008 856 854 91% 87% 85% 80% 82% 83%
200309 2007 789 789 91% 88% 86% 81% 84% 84%
200209 2006 814 813 85% 82% 80% 75% 78% 79%
200109 2005 832 831 90% 84% 81% 78% 80% 81%
200009 2004 1,008 1,008 90% 86% 83% 79% 81% 82%
199909 2003 837 837 88% 84% 83% 79% 81% 81%
199809 2002 875 875 89% 82% 80% 78% 80% 81%
199709 2001 876 876 89% 82% 80% 74% 78% 78%
199609 2000 876 876 86% 78% 76% 73% 76% 77%
199509 1999 784 784 89% 81% 81% 77% 80% 80%
199409 1998 795 795 87% 78% 78% 75% 77% 78%
199309 1997 773 773 89% N/A N/A 77% 79% 80%
199209 1996 860 860 87% N/A N/A 78% 81% 81%
199109 1995 749 749 89% N/A N/A 80% 82% 83%
* Adjusted cohort size based on first‐time, full‐time freshmen with exclusions due to deceased, permanently disabled, service in the armed forces, foreign aid service of the
federal government, or official church missions
Office of Institutional Research Page | 33
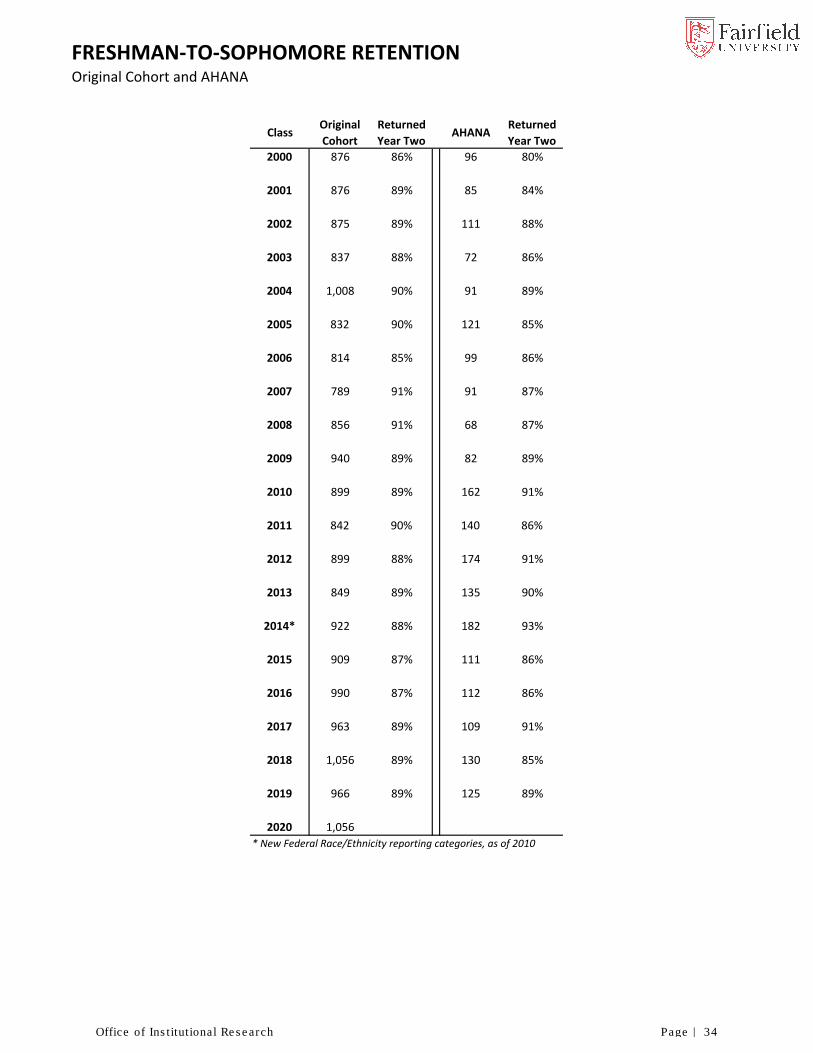
FRESHMAN‐TO‐SOPHOMORE RETENTIONOriginal Cohort and AHANA
ClassOriginal
Cohort
Returned
Year TwoAHANA
Returned
Year Two
2000 876 86% 96 80%
2001 876 89% 85 84%
2002 875 89% 111 88%
2003 837 88% 72 86%
2004 1,008 90% 91 89%
2005 832 90% 121 85%
2006 814 85% 99 86%
2007 789 91% 91 87%
2008 856 91% 68 87%
2009 940 89% 82 89%
2010 899 89% 162 91%
2011 842 90% 140 86%
2012 899 88% 174 91%
2013 849 89% 135 90%
2014* 922 88% 182 93%
2015 909 87% 111 86%
2016 990 87% 112 86%
2017 963 89% 109 91%
2018 1,056 89% 130 85%
2019 966 89% 125 89%
2020 1,056
* New Federal Race/Ethnicity reporting categories, as of 2010
Office of Institutional Research Page | 34

UNDERGRADUATE TRANSFER ADMISSIONS
Applications Acceptances Enrolled Yield
Fall 2002 230 124 65 52%
Spring 2003 86 43 24 56%
Fall 2003 242 132 70 53%
Spring 2004 75 36 15 42%
Fall 2004 199 104 58 56%
Spring 2005 77 34 16 47%
Fall 2005 195 81 41 51%
Spring 2006 39 13 9 69%
Fall 2006 207 67 35 52%
Spring 2007 56 12 6 50%
Fall 2007 249 79 54 68%
Spring 2008 68 24 15 63%
Fall 2008 293 83 59 71%
Spring 2009 66 19 10 53%
Fall 2009 273 101 38 38%
Spring 2010 79 24 10 42%
Fall 2010 225 99 43 43%
Spring 2011 85 41 17 41%
Fall 2011 233 102 28 27%
Spring 2012 99 47 20 43%
Fall 2012 262 115 38 33%
Spring 2013 93 43 20 47%
Fall 2013 256 104 41 39%
Spring 2014 91 37 18 49%
Fall 2014 268 118 47 40%
Spring 2015 118 39 25 64%
Fall 2015 285 95 35 37%
Spring 2016 105 41 27 66%
Fall 2016 342 115 52 45%
Office of Institutional Research Page | 35

UNDERGRADUATE VISITING AND TRANSFER STUDENTS
Race/Ethnicity Male Female Male Female
Non‐Resident Alien 2 2 1 5 10
Race/Ethnicity Unknown 0 0 11 10 21
White 0 0 2 1 3
TOTAL 2 2 14 16 34
College Male Female Male Female
College of Arts & Sciences 1 2 14 16 33
Dolan School of Business 1 0 0 0 1
School of Engineering 0 0 0 0 0
Marion Peckhman Egan School of Nursing and Health Studies 0 0 0 0 0
TOTAL 2 2 14 16 34
Race/Ethnicity Male Female Male Female
Asian 1 0 0 0 1
Black 2 0 0 0 2
Hispanic 1 3 0 0 4
Native Hawaiian or Pacific Islander 0 0 0 0 0
Non‐Resident Alien 2 3 0 0 5
Race/Ethnicity Unknown 1 2 0 0 3
Two or more races 0 1 0 0 1
White 14 22 0 0 36
TOTAL 21 31 0 0 52
College Male Female Male Female
College of Arts & Sciences 9 24 0 0 33
Dolan School of Business 3 5 0 0 8
School of Engineering 9 2 0 0 11
TOTAL 21 31 0 0 52
Fall 2016 Visiting Students
Fall 2016 Transfer Students
FT PT
TOTAL
FT PT
TOTAL
TOTAL
TOTAL
Office of Institutional Research Page | 36

BACCALAUREATE DEGREES AWARDEDBy Major
College of Arts & Sciences 2012‐2013 2013‐2014 2014‐2015 2015‐2016
American Studies 0 2 2 2
Biochemistry 2 7 3 8
Biology 43 45 42 44
Chemistry 7 5 4 6
Communication 91 101 82 90
Economics (BA/BS) 22 33 16 28
English 56 63 64 35
History 18 15 10 20
Individually Designed Major 9 5 2 0
International Studies (BA) 24 35 28 13
Liberal Studies 14 13 10 14
Mathematics 31 12 17 23
Modern Languages & Literatures
French 2 1 1 2
German 3 1 0 0
Italian 0 2 0 0
Spanish 7 1 1 3
Music, Teacher Certification 0 1 0 0
Philosophy 2 3 5 3
Physics 3 1 4 1
Politics 26 28 21 24
Psychology (BA/BS) 65 64 63 82
Public Relations 1
Religious Studies 2 1 1 0
Sociology 0 1 4 9
Sociology and Anthropology 26 27 20 4
Visual and Performing Arts 34 30 31 34
TOTAL Arts and Sciences 487 497 431 446
Dolan School of Business
Accounting 67 68 75 72
Finance/Financial Mgmt. 53 70 92 108
Information Systems 4 10 8 8
International Business 0 0 0 13
Management 28 21 38 35
Marketing 57 72 70 100
TOTAL Business 209 241 283 336
School of Engineering
Automated Manufacturing Engineering 3 1 0 0
Computer Engineering 0 2 3 0
Computer Science 1 2 3 3
Electrical Engineering 6 10 5 10
Mechanical Engineering 17 19 24 25
Software Engineering 5 0 1 4
3/2 Engineering 1 2 0 1
TOTAL Engineering 33 36 36 43
Marion Peckhman Egan School of Nursing and Health Studies
Nursing
TOTAL Nursing 126 125 130 114
GRAND TOTAL 855 899 880 939
Office of Institutional Research Page | 37

MASTER'S AND DOCTORATE DEGREES AWARDEDBy Program
College of Arts & Sciences 2012‐2013 2013‐2014 2014‐2015 2015‐2016
American Studies 11 7 3 7
Communication 14 12 9 6
Creative Writing (MFA) 31 28 21 24
Mathematics 8 4 11 7
Public Administration 0 0 0 9
TOTAL Arts and Sciences 64 51 44 53
Dolan School of Business
Accounting 42 50 47 51
Business Administration 47 23 29 29
Finance/Financial Mgmt. 7 41 18 10
Taxation 4 1 1 0
TOTAL Business 100 115 95 90
Graduate School of Education and Allied Professions
Administration & Supervision 3 0 0 0
Bilingual Education 2 2 1 4
Clinical Mental Health 19 9 7 6
Education Media (Technology) 10 7 7 10
Elementary Education 10 11 14 14
Family Studies 0 1 1 1
Foundations in Education 11 0 0 0
Marriage & Family Therapy 22 25 21 12
School & Applied Psychology:
Applied Psychology‐Foundations of Advanced Psych 2 1 0 1
Applied Psychology‐Human Services 1 0 0 0
Applied Psychology‐Industrial & Organizational Psych 9 3 9 14
School Psychology 11 11 10 14
School Counseling 0 17 17 12
Secondary Education w/ Initial 7‐12 Certification 17 20 23 27
Special Education 31 16 26 19
Teaching English as a Second Language 1 8 10 8
Teaching and Foundation 0 11 5 3
TOTAL GSEAP 149 142 151 145
School of Engineering
Dual Degree BS/MS in Electrical and Computer Engineering 0 0 0 2
Dual Degree BS/MS in Software Engineering 23 0 1 0
Electrical and Computer Engineering 4 5 24 69
Management of Technology 14 15 13 33
Mechanical Engineering 3 5 6 27
Software Engineering 0 13 21 42
TOTAL Engineering 44 38 65 173
Marion Peckhman Egan School of Nursing and Health Studies
Advanced Practice Nursing 30 29 11 7
Clinical Nurse Leader 0 0 1 13
Doctor of Nursing Practice 0 30 21 28
Nurse Anesthesia 9 N/A N/A N/A
TOTAL Nursing 39 59 33 48
GRAND TOTAL 396 405 388 509
Office of Institutional Research Page | 38
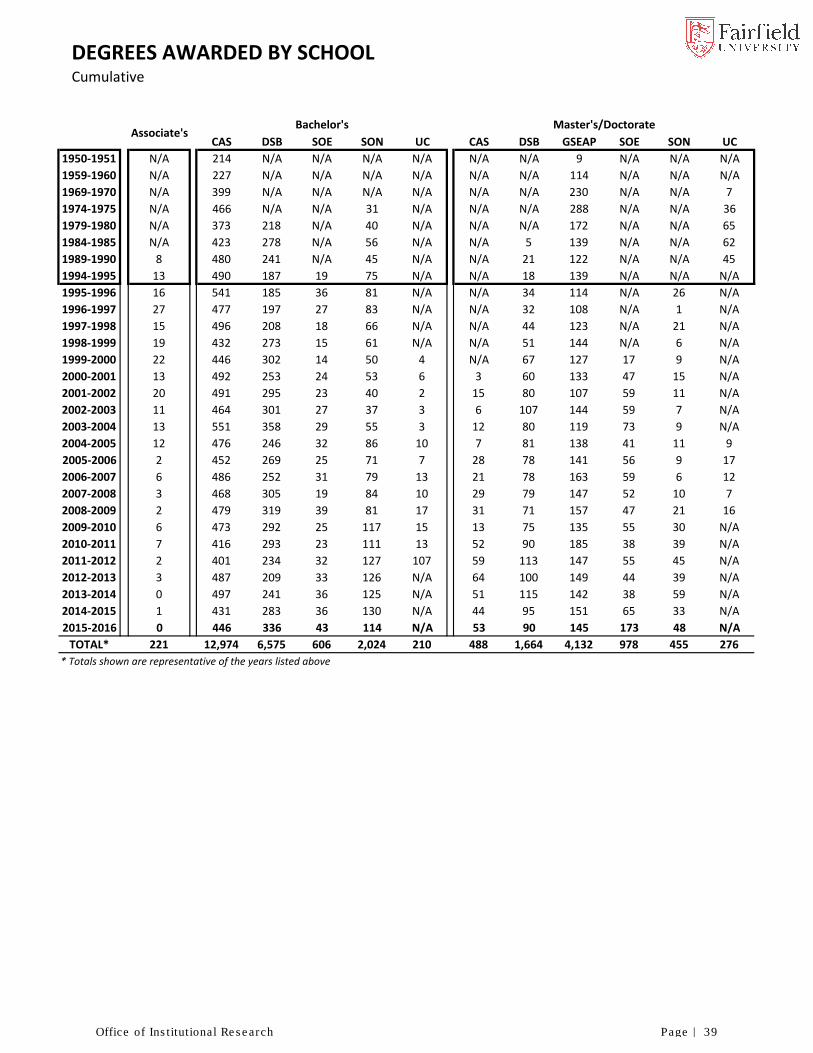
DEGREES AWARDED BY SCHOOLCumulative
CAS DSB SOE SON UC CAS DSB GSEAP SOE SON UC
1950‐1951 N/A 214 N/A N/A N/A N/A N/A N/A 9 N/A N/A N/A
1959‐1960 N/A 227 N/A N/A N/A N/A N/A N/A 114 N/A N/A N/A
1969‐1970 N/A 399 N/A N/A N/A N/A N/A N/A 230 N/A N/A 7
1974‐1975 N/A 466 N/A N/A 31 N/A N/A N/A 288 N/A N/A 36
1979‐1980 N/A 373 218 N/A 40 N/A N/A N/A 172 N/A N/A 65
1984‐1985 N/A 423 278 N/A 56 N/A N/A 5 139 N/A N/A 62
1989‐1990 8 480 241 N/A 45 N/A N/A 21 122 N/A N/A 45
1994‐1995 13 490 187 19 75 N/A N/A 18 139 N/A N/A N/A
1995‐1996 16 541 185 36 81 N/A N/A 34 114 N/A 26 N/A
1996‐1997 27 477 197 27 83 N/A N/A 32 108 N/A 1 N/A
1997‐1998 15 496 208 18 66 N/A N/A 44 123 N/A 21 N/A
1998‐1999 19 432 273 15 61 N/A N/A 51 144 N/A 6 N/A
1999‐2000 22 446 302 14 50 4 N/A 67 127 17 9 N/A
2000‐2001 13 492 253 24 53 6 3 60 133 47 15 N/A
2001‐2002 20 491 295 23 40 2 15 80 107 59 11 N/A
2002‐2003 11 464 301 27 37 3 6 107 144 59 7 N/A
2003‐2004 13 551 358 29 55 3 12 80 119 73 9 N/A
2004‐2005 12 476 246 32 86 10 7 81 138 41 11 9
2005‐2006 2 452 269 25 71 7 28 78 141 56 9 17
2006‐2007 6 486 252 31 79 13 21 78 163 59 6 12
2007‐2008 3 468 305 19 84 10 29 79 147 52 10 7
2008‐2009 2 479 319 39 81 17 31 71 157 47 21 16
2009‐2010 6 473 292 25 117 15 13 75 135 55 30 N/A
2010‐2011 7 416 293 23 111 13 52 90 185 38 39 N/A
2011‐2012 2 401 234 32 127 107 59 113 147 55 45 N/A
2012‐2013 3 487 209 33 126 N/A 64 100 149 44 39 N/A
2013‐2014 0 497 241 36 125 N/A 51 115 142 38 59 N/A
2014‐2015 1 431 283 36 130 N/A 44 95 151 65 33 N/A
2015‐2016 0 446 336 43 114 N/A 53 90 145 173 48 N/A
TOTAL* 221 12,974 6,575 606 2,024 210 488 1,664 4,132 978 455 276
* Totals shown are representative of the years listed above
Master's/DoctorateBachelor'sAssociate's
Office of Institutional Research Page | 39

FINANCIAL AID DATA
2009‐10 2010‐11 2011‐12 2012‐13 2013‐14 2014‐15 2015‐16 2016‐17
Institutional aid budget, excluding athletics $37,923,000 $40,581,000 $45,435,000 $48,526,496 $50,127,168 $54,441,829 $56,625,032 $64,424,976
Institutional aid budget, including athletics $43,285,000 $46,258,000 $51,338,000 $54,271,625 $56,015,925 $60,352,925 $62,974,921 $70,590,000
% FT undergraduates receiving any grant or
scholarship58% 63% 63% 85% 81% 76% 78% 81%
Tuition and Fees (not including Room & Board) $37,490 $39,040 $40,580 $41,690 $42,920 $43,770 $44,250 $46,000
Average total aid package ‐ First Year Students $29,123 $29,154 $26,751 $27,725 $28,251 $30,240 $30,388 $29,700
Average need‐based grant ‐ First‐Year Students $24,000 $22,916 $18,651 $15,122 $14,103 $14,847 $15,783 $14,586
Average University Grant ‐ First Year Students $22,987 $22,330 $21,474 $19,493 $20,323 $21,454 $21,515 $21,370
Average need‐based loan ‐ First‐Year Students* $4,012 $3,892 $4,034 $4,286 $3,980 $4,134 $3,826 $3,431
% Graduating seniors who borrowed# 58% 63% 63% 64% 65% 65% 68% 66%
Average cumulative debt per borrower $35,161 $37,015 $31,099 $28,507 $28,918 $27,918 $25,413 $23,704
Academic Year % Increase Cost
2008‐09 $36,075
2009‐10 3.9% $37,490
2010‐11 4.1% $39,040
2011‐12 2.4% $39,990
2012‐13 2.8% $41,090
2013‐14 3.0% $42,320
2014‐15 2.0% $43,170
2015‐16 2.5% $44,250
2016‐17 2.5% $45,350
* Excludes PLUS loans, unsubsidized loans, and private alternative loans
# Any educational loans in any year
Tuition History
$30,000
$32,000
$34,000
$36,000
$38,000
$40,000
$42,000
$44,000
$46,000
$48,000
$50,000
2008‐09 2009‐10 2010‐11 2011‐12 2012‐13 2013‐14 2014‐15 2015‐16 2016‐17
Tuition History
Office of Institutional Research Page | 40

UNIVERSITY PERSONNELFall 2016
By Classification* Full‐Time Part‐Time TOTAL FTE#
271 312 583 375
Administration/Management 214 1 215 214
158 19 177 164
114 63 177 135
27 30 57 37
8 4 12 9
27 14 41 32
819 443 1,262 967
* Source: Office of Human Resources
# Full‐time Equivalent (FTE) = full‐time + 1/3 part‐time
Full‐time Male Female TOTAL
CAS 80 83 163
DSB 29 16 45
GSEAP 3 8 11
SOE 8 3 11 FT 1/3 PT FTE
SON 0 19 19 2014 256 336 366
Subtotal 120 129 249 2015 266 312 370
2016 271 326 380
Part‐time Male Female TOTAL * FTE = FT + 1/3 PT
CAS 96 92 188
DSB 26 5 31
GSEAP 1 3 4
SOE 14 4 18
SON 1 23 24
Subtotal 138 127 265
TOTAL 258 256 514
* Counts represent faculty teaching both undergrad and graduate courses
Full‐time Male Female TOTAL
CAS 80 84 164
DSB 30 18 48
GSEAP 5 18 23
SOE 9 3 12
SON 0 24 24
Subtotal 124 147 271
Part‐time Male Female TOTAL
CAS 101 98 199
DSB 28 6 34
GSEAP 13 27 40
SOE 18 4 22
SON 4 27 31
Subtotal 164 162 326
TOTAL 288 309 597
Faculty
Professionals
Administrative Support
Service Workers
Technicians
Full‐Time Equivalent (FTE)*
ALL UNIVERSITY FACULTY Undergraduate
Student to Faculty Ratio
12:1
Faculty counts are based on IPEDS definition:
Includes faculty teaching as of 10/1 and those on
sabatical for the fall semester
Craft Workers, Laborers &
Operatives
Fall 2016
(Based on 3,879 FTE students and 337 FTE faculty)*
* FTE = FT + 1/3 PT
GRAND TOTAL
UNDERGRADUATE FACULTY*Fall 2016
Fall Faculty
Office of Institutional Research Page | 41

FULL‐TIME FACULTY*By Program, Rank, and Gender, Fall 2016
College of Arts & Sciences Male Female Male Female Male Female Male Female Male Female TOTAL
Biology 0 3 3 5 0 3 1 1 4 12 16
Chemistry 1 0 4 1 1 1 0 1 6 3 9
Communication 1 1 1 1 2 3 0 0 4 5 9
Economics 1 2 2 1 2 2 1 0 6 5 11
English 3 4 2 5 2 1 0 0 7 10 17
History 2 2 2 2 1 3 0 0 5 7 12
Math 5 2 3 2 1 1 1 0 10 5 15
Modern languages 2 1 1 2 1 3 0 2 4 8 12
Philosophy 2 1 3 1 3 2 0 0 8 4 12
Physics 1 0 1 1 2 0 0 0 4 1 5
Politics 1 2 1 2 0 2 0 0 2 6 8
Psychology 1 3 1 2 0 1 1 0 3 6 9
Religious Studies 3 1 2 0 1 1 0 0 6 2 8
Sociology & Anthropology 2 0 2 1 1 2 0 0 5 3 8
Visual & Performing Arts 2 4 1 3 3 0 0 0 6 7 13
TOTAL Arts and Sciences 27 26 29 29 20 25 4 4 80 84 164
Dolan School of Business
Accounting 1 2 3 1 1 1 1 2 6 6 12
Finance 2 0 3 2 2 1 0 1 7 4 11
Information Systems 1 0 4 0 1 0 0 0 6 0 6
Management 2 3 2 2 2 0 0 0 6 5 11
Marketing 1 0 1 3 2 0 1 0 5 3 8
TOTAL Business 7 5 13 8 8 2 2 3 30 18 48
Graduate School of Education and
Allied Professions
Counselor Education 0 3 0 0 0 1 0 0 0 4 4
Educ Studies & Teacher Prep 0 1 0 4 3 0 0 0 3 5 8
Marriage & Family Therapy 0 0 0 1 0 2 0 1 0 4 4
Psych & Special Education 0 1 1 1 1 3 0 0 2 5 7
TOTAL GSEAP 0 5 1 6 4 6 0 1 5 18 23
School of Engineering
TOTAL Engineering 5 0 0 1 4 2 0 0 9 3 12
Marion Peckhman Egan School of
Nursing and Health Studies
TOTAL Nursing 0 2 0 6 0 13 0 3 0 24 24
GRAND TOTAL 39 38 43 50 36 48 6 11 124 147 271
* Faculty counts are based on IPEDS definition: Includes faculty teaching as of 10/1 and those on sabatical for the fall semester
Professor Associate Assistant Instructor TOTAL
Office of Institutional Research Page | 42
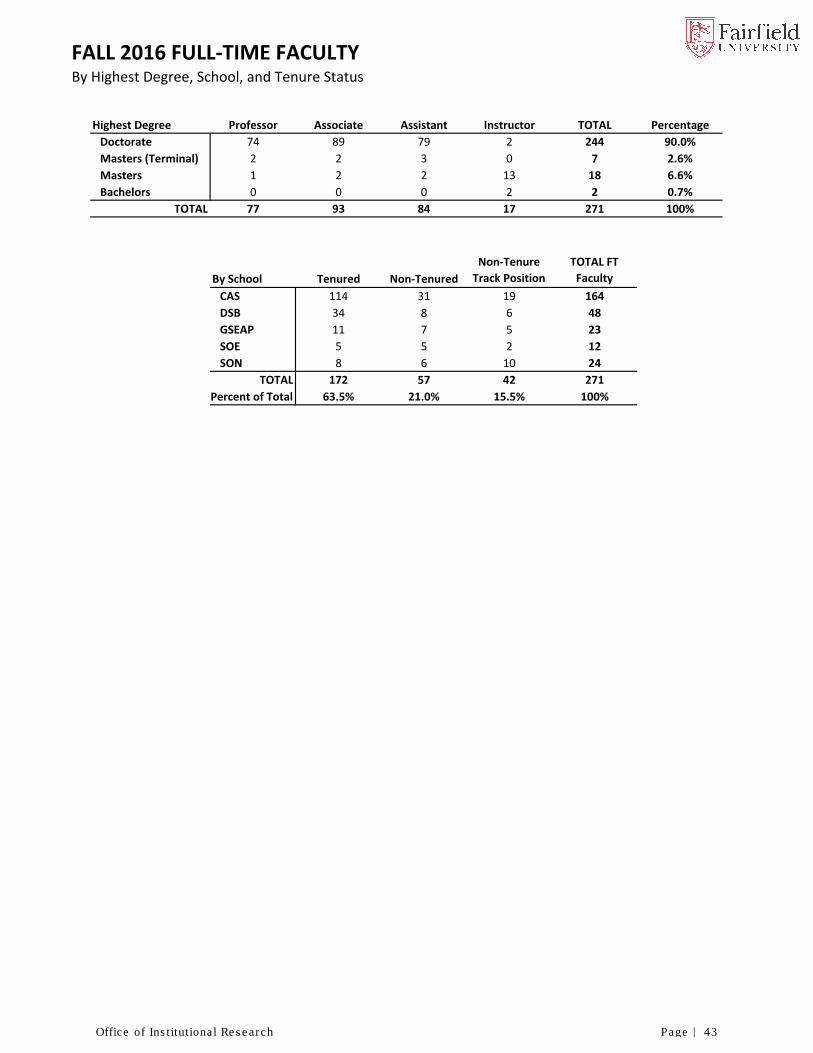
FALL 2016 FULL‐TIME FACULTYBy Highest Degree, School, and Tenure Status
Highest Degree Professor Associate Assistant Instructor TOTAL Percentage
Doctorate 74 89 79 2 244 90.0%
Masters (Terminal) 2 2 3 0 7 2.6%
Masters 1 2 2 13 18 6.6%
Bachelors 0 0 0 2 2 0.7%
TOTAL 77 93 84 17 271 100%
By School Tenured Non‐Tenured
Non‐Tenure
Track Position
TOTAL FT
Faculty
CAS 114 31 19 164
DSB 34 8 6 48
GSEAP 11 7 5 23
SOE 5 5 2 12
SON 8 6 10 24
TOTAL 172 57 42 271
Percent of Total 63.5% 21.0% 15.5% 100%
Office of Institutional Research Page | 43

FULL‐TIME FACULTY AVERAGE SALARY AND COMPENSATION*By Rank and AAUP IIA‐Comparison#
2015‐2016
Fairfield University
2014‐15~
Fairfield University
2015‐16
All Combined
Average
Church Related
Average
Independent
Average
All Combined 95th
Percentile
SALARY
Professor $121,500 $124,400 $94,385 $88,129 $96,556 $125,414
Associate $93,100 $95,200 $75,699 $71,291 $76,974 $97,061
Assistant^ $76,300 $80,800 $65,914 $62,499 $66,551 $82,131
COMPENSATION
Professor $161,400 $164,300 $122,527 $112,413 $124,535 $164,084
Associate $129,200 $132,000 $99,912 $94,110 $100,194 $130,827
Assistant $106,000 $109,000 $87,225 $82,255 $86,255 $110,889
^ Salary adjustment made to the 2015‐2016 Fairfield University Assistant level
~ Source: ACADEME: The Annual Report on the Economic Status of the Profession 2014‐2015
* Source: ACADEME: The Annual Report on the Economic Status of the Profession 2015‐2016
# IIA institutions are defined as "institutions with post baccalaureate programs but not engaging in significant doctoral level education" (ACADEME 2016)
0
20,000
40,000
60,000
80,000
100,000
120,000
140,000
Professor Associate Assistant
Fairfield Univ. Salary by Rank
2014‐15 2015‐16
0
20,000
40,000
60,000
80,000
100,000
120,000
140,000
160,000
180,000
Professor Associate Assistant
Fairfield Univ. Compensation by Rank
2014‐15 2015‐16
Office of Institutional Research Page | 44
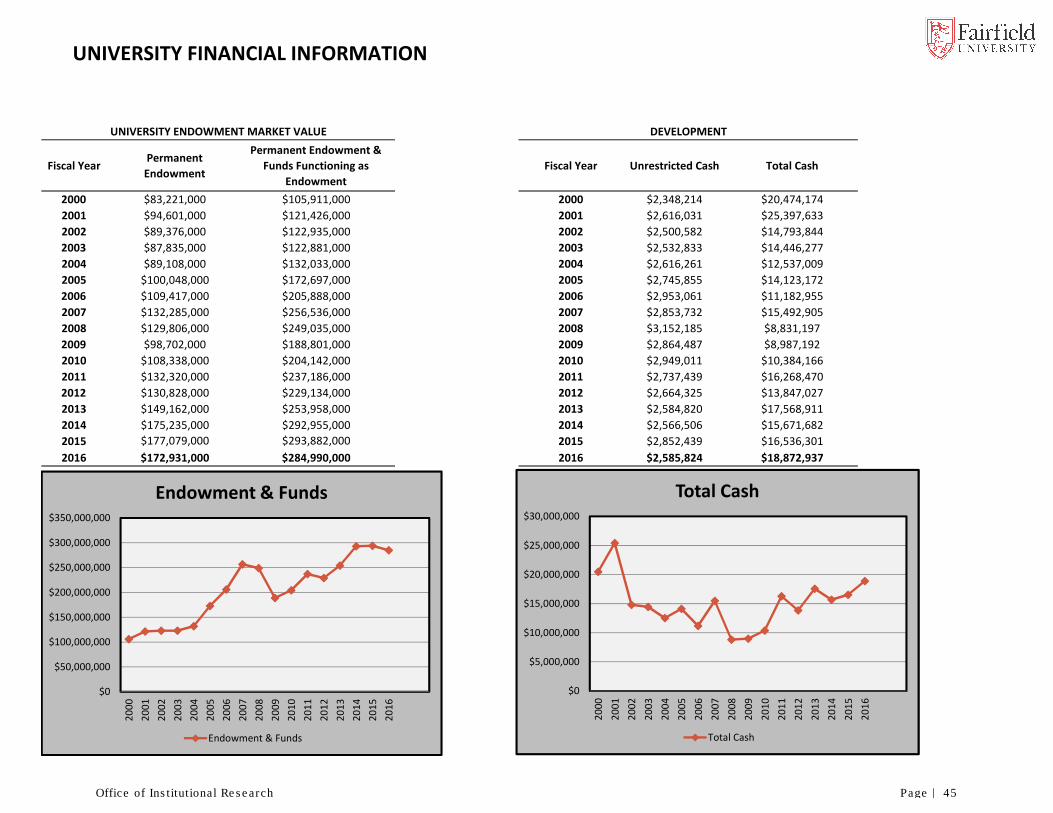
UNIVERSITY FINANCIAL INFORMATION
Fiscal YearPermanent
Endowment
Permanent Endowment &
Funds Functioning as
Endowment
Fiscal Year Unrestricted Cash Total Cash
2000 $83,221,000 $105,911,000 2000 $2,348,214 $20,474,174
2001 $94,601,000 $121,426,000 2001 $2,616,031 $25,397,633
2002 $89,376,000 $122,935,000 2002 $2,500,582 $14,793,844
2003 $87,835,000 $122,881,000 2003 $2,532,833 $14,446,277
2004 $89,108,000 $132,033,000 2004 $2,616,261 $12,537,009
2005 $100,048,000 $172,697,000 2005 $2,745,855 $14,123,172
2006 $109,417,000 $205,888,000 2006 $2,953,061 $11,182,955
2007 $132,285,000 $256,536,000 2007 $2,853,732 $15,492,905
2008 $129,806,000 $249,035,000 2008 $3,152,185 $8,831,197
2009 $98,702,000 $188,801,000 2009 $2,864,487 $8,987,192
2010 $108,338,000 $204,142,000 2010 $2,949,011 $10,384,166
2011 $132,320,000 $237,186,000 2011 $2,737,439 $16,268,470
2012 $130,828,000 $229,134,000 2012 $2,664,325 $13,847,027
2013 $149,162,000 $253,958,000 2013 $2,584,820 $17,568,911
2014 $175,235,000 $292,955,000 2014 $2,566,506 $15,671,682
2015 $177,079,000 $293,882,000 2015 $2,852,439 $16,536,301
2016 $172,931,000 $284,990,000 2016 $2,585,824 $18,872,937
UNIVERSITY ENDOWMENT MARKET VALUE DEVELOPMENT
$0
$5,000,000
$10,000,000
$15,000,000
$20,000,000
$25,000,000
$30,000,000
2000
2001
2002
2003
2004
2005
2006
2007
2008
2009
2010
2011
2012
2013
2014
2015
2016
Total Cash
Total Cash
$0
$50,000,000
$100,000,000
$150,000,000
$200,000,000
$250,000,000
$300,000,000
$350,000,000
2000
2001
2002
2003
2004
2005
2006
2007
2008
2009
2010
2011
2012
2013
2014
2015
2016
Endowment & Funds
Endowment & Funds
Office of Institutional Research Page | 45

DIMENNA‐NYSELIUS LIBRARYComponent Summary and Special Library Collections and Services
Library Collections/
Circulation
Physical
Collection
Digital/Electronic
Collection
Books 376,704 898,580
Databases 148
Media 22,725 51,745
Total Collection 399,429 950,473
Total Circulation 12,716# 48,011^
* As of January 2017
# Books only
^ E‐books only
Library Collections/
Circulation
Physical
Collection
Digital/Electronic
Collection
Books 374,586 653,473
Databases 169
Media 16,743 127,656
Total Collection 391,329 781,298
Total Circulation 29,804 90,535
Library Collections/
Circulation
Physical
Collection
Digital/Electronic
Collection
Books 375,653 545,200
Databases 185
Media 15,810 83,680
Total Collection 391,463 629,065
Total Circulation 33,913 129,071
Special Library Collections and Services
1. Over 170 databases including ABI/Inform, Academic Search Premier, Academic OneFile, ARTstor,
Communication and Mass Media Complete, Credo Reference Academic Core Online, Engineering
Source, IEEE/IET Digital Library, ERIC, Mergent Online, Morningstar, Bloomberg BNA Tax & Accounting
Center, IMF e‐Library, Project Muse, JSTOR, Literature Resource Center, America: History and Life,
Health & Wellness Resource Center, PsycINFO, PsycArticles, CINAHL, Philosophers Index, MLA
International Bibliography, NYTimes (1851‐2009) and Hartford Courant (1923‐1990), LexisNexis‐
Academic, Ovid Nursing, MathSciNet, Biography & Genealogy Master Index, Catholic Periodical and
Literature Index, Global Health, World Politics Review, Opposing Viewpoints in Context. Remote
access is available to University affiliates.
2. Media Collection that includes streaming video (Counseling and Therapy in Video, Films on Demand,
Kanopy Streaming, and JoVE Science Education), DVDs, and audio CDs.
3. Primary Source Collections
A. The archives of Fairfield University and Fairfield Preparatory School.
B. Archive of Americana Online (including America’s Historical Imprints; America’s Historical
Newspapers; American State Papers; and the U.S. Congressional Serial Set, 1817‐1994).
C. Archives of Sexuality & Gender.
D. Human Rights Studies Online (1900‐2010).
E. Women & Social Movements Collection Online (United States 1600‐2000).
F. Nation Archive, Irish Newspaper Archives, Eighteenth & Nineteenth Century Collections Online.
4. The Heritage Edition of the Saint John’s Bible and a facsimile edition of the Book of Kells.
5. 10 group study rooms including a presentation practice and video conferencing room.
6. 10 colaboratorium suites for group study and presentation preparation.
7. 24‐hour computer lab and study space.
8. Starbucks Café and vending machines.
9. Auditorium with seating for 90.
Component Summary counts are based on IPEDS reporting rules and reflect the
most recent fiscal year prior to October 1
2016‐2017*
2015‐2016
2014‐2015
Office of Institutional Research Page | 46
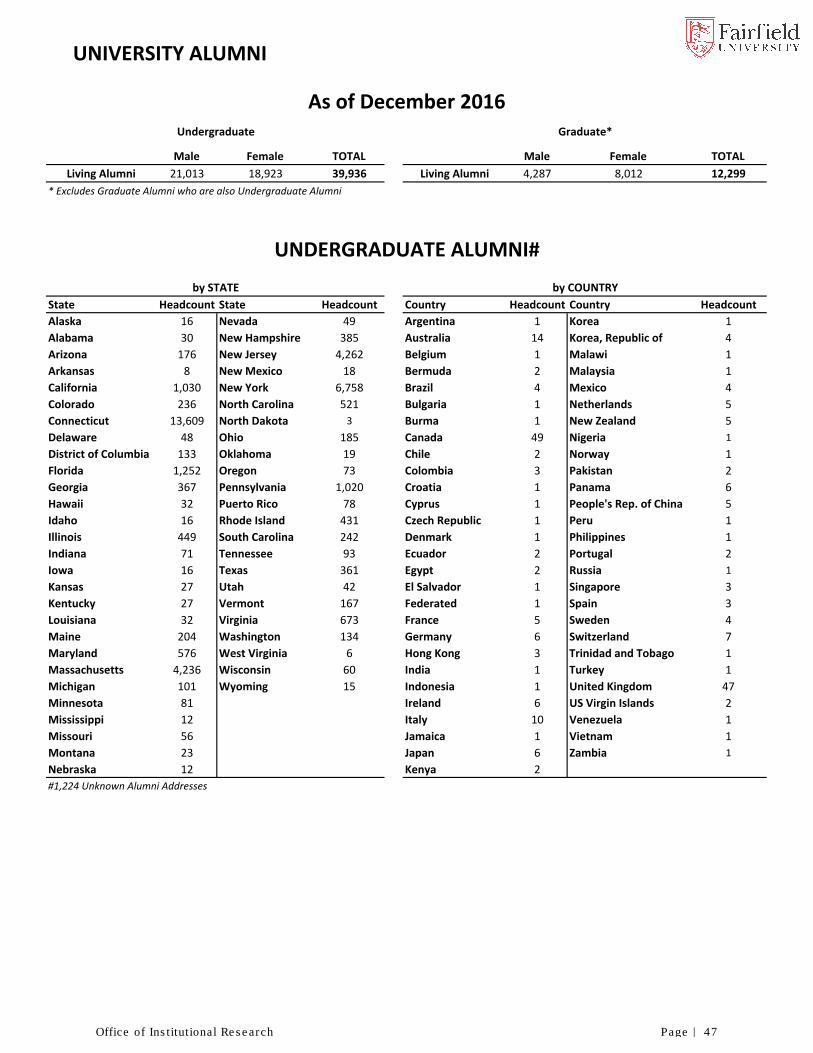
UNIVERSITY ALUMNI
Male Female TOTAL Male Female TOTAL
Living Alumni 21,013 18,923 39,936 Living Alumni 4,287 8,012 12,299
* Excludes Graduate Alumni who are also Undergraduate Alumni
State Headcount State Headcount Country Headcount Country Headcount
Alaska 16 Nevada 49 Argentina 1 Korea 1
Alabama 30 New Hampshire 385 Australia 14 Korea, Republic of 4
Arizona 176 New Jersey 4,262 Belgium 1 Malawi 1
Arkansas 8 New Mexico 18 Bermuda 2 Malaysia 1
California 1,030 New York 6,758 Brazil 4 Mexico 4
Colorado 236 North Carolina 521 Bulgaria 1 Netherlands 5
Connecticut 13,609 North Dakota 3 Burma 1 New Zealand 5
Delaware 48 Ohio 185 Canada 49 Nigeria 1
District of Columbia 133 Oklahoma 19 Chile 2 Norway 1
Florida 1,252 Oregon 73 Colombia 3 Pakistan 2
Georgia 367 Pennsylvania 1,020 Croatia 1 Panama 6
Hawaii 32 Puerto Rico 78 Cyprus 1 People's Rep. of China 5
Idaho 16 Rhode Island 431 Czech Republic 1 Peru 1
Illinois 449 South Carolina 242 Denmark 1 Philippines 1
Indiana 71 Tennessee 93 Ecuador 2 Portugal 2
Iowa 16 Texas 361 Egypt 2 Russia 1
Kansas 27 Utah 42 El Salvador 1 Singapore 3
Kentucky 27 Vermont 167 Federated 1 Spain 3
Louisiana 32 Virginia 673 France 5 Sweden 4
Maine 204 Washington 134 Germany 6 Switzerland 7
Maryland 576 West Virginia 6 Hong Kong 3 Trinidad and Tobago 1
Massachusetts 4,236 Wisconsin 60 India 1 Turkey 1
Michigan 101 Wyoming 15 Indonesia 1 United Kingdom 47
Minnesota 81 Ireland 6 US Virgin Islands 2
Mississippi 12 Italy 10 Venezuela 1
Missouri 56 Jamaica 1 Vietnam 1
Montana 23 Japan 6 Zambia 1
Nebraska 12 Kenya 2
#1,224 Unknown Alumni Addresses
As of December 2016Undergraduate Graduate*
UNDERGRADUATE ALUMNI#
by STATE by COUNTRY
Office of Institutional Research Page | 47

NORTH BENSON ROAD
BARLOW ROAD
ROUND HILL ROAD
BELLARMINE ROAD
MU
RPH
Y R
OA
D
FITZGERALD WAY
MC
CO
RM
ICK
RO
AD
MOONEY ROAD
LEEBER ROAD
LEEB
ER R
OAD
LYNCH ROAD
MA
HAN
RO
AD
MCINNES ROAD
O’NEIL WAY
COUGHLIN ROAD
WEST LANGGUTH ROAD
EAST LANGGUTH ROAD
WAL
TER’
S W
AY
PORTER ROAD
LOY
OLA
DR
IVE
47
8
42
44
46
51
40
4541
7
6
9
10
11
12
53
55
5
13
14
15
16
54
17
22
23
1
21
4
3 39
2
38 36
34
35
26 28
30
24
33
31
32
29
2527
52
A
AB
C
B
C
D
*
W
E
S
For more admission, academic, athletic
and other information, please visit
FAIRFIELD.EDU
1.16
STUDENT SERVICES AND OTHER LOCATIONSACADEMIC FACILITIES
Bannow (Rudolph F.) Science Center 11 School of EngineeringCanisius Hall 3 College of Arts and Sciences, Graduate School of Education and Allied Professions, Center for Faith & Public Life, Center for Catholic StudiesDiMenna-Nyselius Library 10 Center for Academic Excellence, ITS (Information Technology Services)Dolan School of Business 8 Center for Applied EthicsDonnarumma Hall 4 Carl & Dorothy Bennett Center for Judaic StudiesEgan (Marion Peckham) School of Nursing and Health Studies 12 (*New addition to be completed by fall 2017)
PepsiCo Theatre 40Quick (Regina A.) Center for the Arts 9 Kelley (Aloysius P.), S.J. Theatre, Walsh (Thomas J.) Gallery, Wien Theatre/Black BoxXavier Hall – Fairfield Prep 17 University Media Center
RESIDENCE HALLS
70 McCormick Road 35Campion Hall 34Dolan Campus 30 A. Dolan (John C.) Hall Faber Hall 47Gonzaga Hall 39 Stag StatueJogues Hall 36Loyola Hall 2 Public Safety, Ignatian Residential College, Lukacs GalleryRegis Hall 38Townhouse Complex 28The Village 52 A. Meditz Hall B. Kostka Hall C. Claver Hall D. #47 Mahan Road
ATHLETIC FACILITIES
Alumni Diamond 29Alumni Hall – Sports Arena 14Alumni Softball Field 33Barlow Field 44Basketball Courts 32Fr. Brissette Athletic Center – Fairfield Prep 54Grauert Field 55Lessing Field 24Quick (Leslie C.), Jr. Recreation Complex 15Rafferty Stadium 27Tennis Courts 25University Field 31Walsh (Thomas J.), Jr. Athletic Center 26(Fields and courts are green)
Alumni House 22 Alumni Relations OfficeBarone (John A.) Campus Center 13 Oak Room, Main Dining Hall, Einstein Bros., Stags on the Run convenience store, Snack Bar and Offices for FUSA, StagCard, WVOF, Residence Life, Diversity and Student AffairsBellarmine Hall 6 President & Executive Offices, Advancement, Marketing and Communications, Bellarmine MuseumBellarmine Pond 46Berchmans Hall – Fairfield Prep 16Central Utility Facility 53Early Learning Center 41 Egan Chapel of St. Ignatius Loyola 5 Pedro Arrupe, S.J. Campus Ministry CenterDolan Campus 30 A. Dolan (John C.) Hall Student Health Center
B. Dolan (David J.) House Study Abroad C. Dolan (Thomas F.) Commons Offices for ITS (Information Technology Services), Human Resources, Design & Digital Print ServicesHopkins Pond 51Jesuit Community Center (St. Ignatius Hall) 7Kelley (Aloysius P.), S.J. Center 1 Offices for Undergraduate and Graduate Admission, Financial Aid, Registrar, Academic & Career DevelopmentMaintenance Complex 45McAuliffe Hall 21 Bursar, Offices for Finance, Purchasing and Central ReceivingSouthwell Hall 42 The Kathryn P. Koslow Family Counseling CenterThe Levee 23
Office of Institutional Research Page | 48
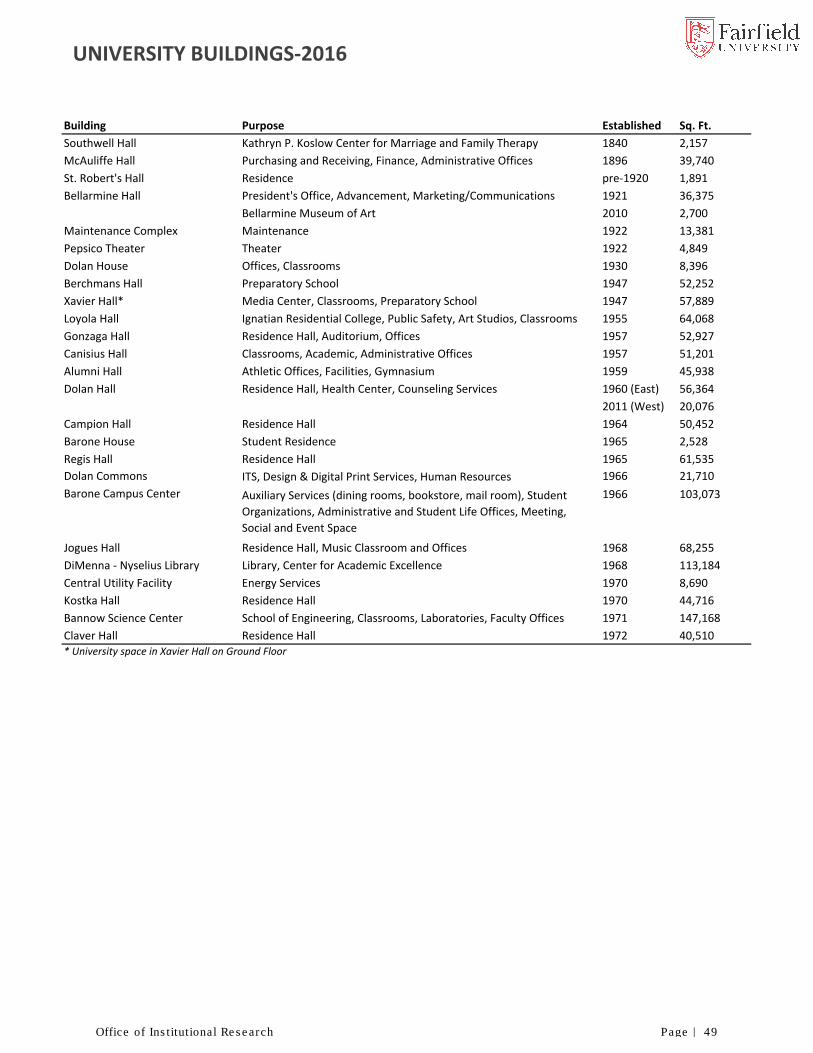
UNIVERSITY BUILDINGS‐2016
Building Purpose Established Sq. Ft.
Southwell Hall Kathryn P. Koslow Center for Marriage and Family Therapy 1840 2,157
McAuliffe Hall Purchasing and Receiving, Finance, Administrative Offices 1896 39,740
St. Robert's Hall Residence pre‐1920 1,891
Bellarmine Hall President's Office, Advancement, Marketing/Communications 1921 36,375
Bellarmine Museum of Art 2010 2,700
Maintenance Complex Maintenance 1922 13,381
Pepsico Theater Theater 1922 4,849
Dolan House Offices, Classrooms 1930 8,396
Berchmans Hall Preparatory School 1947 52,252
Xavier Hall* Media Center, Classrooms, Preparatory School 1947 57,889
Loyola Hall Ignatian Residential College, Public Safety, Art Studios, Classrooms 1955 64,068
Gonzaga Hall Residence Hall, Auditorium, Offices 1957 52,927
Canisius Hall Classrooms, Academic, Administrative Offices 1957 51,201
Alumni Hall Athletic Offices, Facilities, Gymnasium 1959 45,938
Dolan Hall Residence Hall, Health Center, Counseling Services 1960 (East) 56,364
2011 (West) 20,076
Campion Hall Residence Hall 1964 50,452
Barone House Student Residence 1965 2,528
Regis Hall Residence Hall 1965 61,535
Dolan Commons ITS, Design & Digital Print Services, Human Resources 1966 21,710
1966 103,073
Jogues Hall Residence Hall, Music Classroom and Offices 1968 68,255
DiMenna ‐ Nyselius Library Library, Center for Academic Excellence 1968 113,184
Central Utility Facility Energy Services 1970 8,690
Kostka Hall Residence Hall 1970 44,716
Bannow Science Center School of Engineering, Classrooms, Laboratories, Faculty Offices 1971 147,168
Claver Hall Residence Hall 1972 40,510* University space in Xavier Hall on Ground Floor
Auxiliary Services (dining rooms, bookstore, mail room), Student
Organizations, Administrative and Student Life Offices, Meeting,
Social and Event Space
Barone Campus Center
Office of Institutional Research Page | 49

UNIVERSITY BUILDINGS‐2016
Building Purpose Established Sq. Ft.
Nursing and Health Studies Marion Peckham Egan School of Nursing and Classrooms 2017 70,715
Faber Hall* Residence Hall 1978 47,260
1979 70,739
RecPlex Recreational Facilities, Pool 1979 61,791
2016‐remodel 85,360
Donnarumma Hall Faculty Offices, Academic, Administrative, Classrooms 1981 33,649
Townhouses (#1‐7) Student Residences 1982 62,772
Townhouses (#8‐10) Student Residences 1984 29,721
Townhouses (#11‐15) Student Residences 1987 47,339
Quick Center for the Arts Theaters, Art Gallery 1989 36,604
1990 17,504
The Levee Campus Pub, Dining, and Entertainment Venue 1995 3,500
Walsh Athletic Center 1997 37,537
Alumni House Administrative Offices, Meeting and Event Space 2000 9,483
47 Mahan Road Student Residence 2000 78,000
Fr. Brissette Athletic Center Preparatory School Gymnasium 2004 10,944
Pedro Arrupe Hall Preparatory School 2005 28,813
Aloysius P. Kelley, S.J. Center Administrative and Student Service Offices, Function Space 2006 23,707
Early Learning Center Day Care 2008 2,957
St. Ignatius Hall Fairfield Jesuit Community Center 2010 20,000
70 McCormick Road Student Residence 2011 33,700
Meditz Hall Student Residence 2011 64,663
North Benson Road, House #1036 Student Residence 2011 2,490
North Benson Road, House #1052 Student Residence 2011 2,600
North Benson Road, House #1082 Staff Residence 2011 2,220
North Benson Road, House #1102 Student Residence 2014 2,006
Rafferty Stadium Athletics 2015 12,500
* Converted from Jesuit residence to student residence hall in 2010
(Charles F.) Dolan
School of Business
Classrooms, Administrative and Faculty Offices, Meeting and Event
Space
Egan Chapel of St. Ignatius Loyola
and Arrupe Campus Ministry
Center
Division 1 Athletic Training Center, Sports Medicine, Athletic Offices
and Academic Center, Practice Gym
Chapel, Campus Ministry, Meeting Room
Office of Institutional Research Page | 50
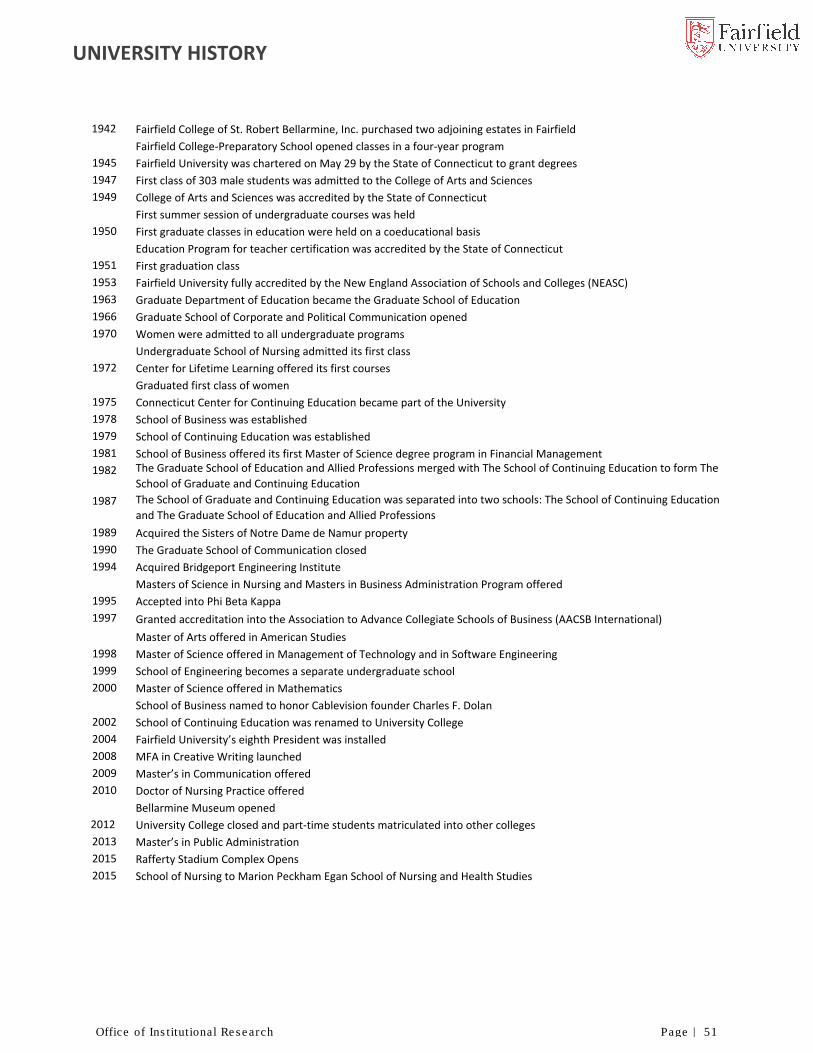
UNIVERSITY HISTORY
1942 Fairfield College of St. Robert Bellarmine, Inc. purchased two adjoining estates in Fairfield
Fairfield College‐Preparatory School opened classes in a four‐year program
1945 Fairfield University was chartered on May 29 by the State of Connecticut to grant degrees
1947 First class of 303 male students was admitted to the College of Arts and Sciences
1949 College of Arts and Sciences was accredited by the State of Connecticut
First summer session of undergraduate courses was held
1950 First graduate classes in education were held on a coeducational basis
Education Program for teacher certification was accredited by the State of Connecticut
1951 First graduation class
1953 Fairfield University fully accredited by the New England Association of Schools and Colleges (NEASC)
1963 Graduate Department of Education became the Graduate School of Education
1966 Graduate School of Corporate and Political Communication opened
1970 Women were admitted to all undergraduate programs
Undergraduate School of Nursing admitted its first class
1972 Center for Lifetime Learning offered its first courses
Graduated first class of women
1975 Connecticut Center for Continuing Education became part of the University
1978 School of Business was established
1979 School of Continuing Education was established
1981 School of Business offered its first Master of Science degree program in Financial Management
1982 The Graduate School of Education and Allied Professions merged with The School of Continuing Education to form The
School of Graduate and Continuing Education
1987 The School of Graduate and Continuing Education was separated into two schools: The School of Continuing Education
and The Graduate School of Education and Allied Professions
1989 Acquired the Sisters of Notre Dame de Namur property
1990 The Graduate School of Communication closed
1994 Acquired Bridgeport Engineering Institute
Masters of Science in Nursing and Masters in Business Administration Program offered
1995 Accepted into Phi Beta Kappa
1997 Granted accreditation into the Association to Advance Collegiate Schools of Business (AACSB International)
Master of Arts offered in American Studies
1998 Master of Science offered in Management of Technology and in Software Engineering
1999 School of Engineering becomes a separate undergraduate school
2000 Master of Science offered in Mathematics
School of Business named to honor Cablevision founder Charles F. Dolan
2002 School of Continuing Education was renamed to University College
2004 Fairfield University’s eighth President was installed
2008 MFA in Creative Writing launched
2009 Master’s in Communication offered
2010 Doctor of Nursing Practice offered
Bellarmine Museum opened
2012 University College closed and part‐time students matriculated into other colleges
2013 Master’s in Public Administration
2015 Rafferty Stadium Complex Opens
2015 School of Nursing to Marion Peckham Egan School of Nursing and Health Studies
Office of Institutional Research Page | 51


